Embed Size (px)
Citation preview

LIA RESEARCH INSTITUTE CENSUS UPDATE:
Long Island’s Changing Demographics
America’s First Suburb is a Diverse Suburb
SEPTEMBER 2017

Long Island is one of the country’s oldest suburbs. The region has changed
significantly over the last six decades. It is also growing far more diverse which
helps keep the region vibrant and economically competitive.
The collection of race data is important because it helps ensure that regions receive
their fair share of federal funding. Accurate race and Hispanic origin counts are also
crucial to certifying compliance with non-discrimination statutes and informing
larger policy decisions. Race data are used to promote equal employment
opportunities and to assess disparities in health and environmental risks.
Knowledge of the racial composition in a region is also critical for businesses,
schools, colleges, hospitals and other institutions that serve various populations.
This analysis of the United States Census Bureau’s 2016 population estimates
indicates that Long Island’s non-Hispanic white population has dropped below 65
percent of the total population for the first time since the Census started collecting
data at the county level in 1800. Since that time, non-Hispanic whites have
constituted the majority of Long Island’s population, having accounted for 97
percent of the population as late as 1930. While that number has declined slowly
over the decades, dropping 9.5 percentage points to 88.7 percent by 1980, it is in
the decades since 1990 that the non-Hispanic white population has declined and
the minority population has surged, reducing the non-Hispanic white proportion of
the total population. Between 1990 and 2000, the non-Hispanic white population
declined from 84.1 percent of the total to 76.4 percent. By 2010, the non-Hispanic
white population dropped to 68.9 percent and in the six years since has declined
further to 64.7 percent in 2016. In addition, the Asian population has been growing
significantly in Nassau County and the Hispanic population is surging in Suffolk
County.
It is important for institutions and businesses to understand the demographic
makeup of a region as they try to deliver and market goods and services to our
residents.
INTRODUCTION

I. NON-HISPANIC WHITE POPULATION

The drop in the percentage of the population comprised of non-Hispanic whites has occurred in large measure due to a decline in the absolute number of white, non-Hispanic residents. Migration to other states and natural decline (lower births in relation to deaths) has brought the number of non-Hispanic white residents on Long Island from a high of 2,422,183 in 1970 to 1,845,604 in 2016, a 23.8 percent decline.
Another important factor in the non-Hispanic white percentage decline has been the surge in minority populations, primarily Hispanics.1 Between 1980 and 2016, the Hispanic population increased four-fold, going from 101,975 to 512,320, a 423 percent increase. Hispanics were 3.9 percent of Long Island’s total population in 1980 and 18 percent by 2016.
1 It should be noted that the U.S. Census Bureau does not consider Hispanic to be a racial category. Hispanics are considered an ethnic category of people that originate from or have ancestral linkages to Spanish speaking parts of the western hemisphere, especially Latin America. Thus, Hispanics can be of any race (white, black, Asian, etc.). On Long Island in 2016, 86.9 percent of Hispanics identified themselves racially as white, 9 percent as black, 3.2 percent as Native American, 1.3 percent Asian and 0.5 percent as Hawaiian/Pacific Islander. For this analysis, Hispanics are extracted from all racial categories and enumerated as a separate group. It was not until the 1980 Census that all Americans were asked by the Census whether they were Hispanic.
Nassau-Suffolk Racial Composition and Hispanic Origin
2010 % of Total 2016 % of Total % Change
White 1,952,217 68.9 1,845,604 64.7 -5.5
Black 246,448 8.7 263,926 9.2 7.1
Hispanic 441,594 15.6 512,320 18 16
Asian 155,712 5.5 189,637 6.6 21.8
Native American 4,406 0.2 4,482 0.2 1.7
Pacific Island 647 0 756 0.0 16.8
Two or More Races 31,858 1.1 37,358 1.3 17.3
Total 2,832,882 100 2,854,083 100 0.7
Source: U.S. Census Bureau, 2010 Census, Population Estimates 2016
Note: Hispanics are broken out from other racial categories and counted as a race for purpose of analysis.
Nassau Racial Composition and Hispanic Origin
2010 % of Total 2016 % of Total % Change
White 880,528 65.7 827,674 60.8 -6
Black 143,338 10.7 156,081 11.5 8.9
Hispanic 195,355 14.6 228,388 16.8 16.9
Asia 104,318 7.8 129,915 9.5 24.5
Native American 1,453 0.1 1,566 0.1 7.8
Pacific Island 327 0 444 0 35.8
Two or More Races 14,213 1.1 17,432 1.3 22.6
Total 1,339,532 100 1,361,500 100 1.6
Source: U.S. Census Bureau, 2010 Census, Population Estimates 2016
Note: Hispanics are broken out from other racial categories and counted as a race for purpose of analysis.

II. HISPANIC POPULATION
Long Islands Hispanic population has been surging over the past two decades.
Suffolk Racial Composition and Hispanic Origin
2010 % of Total 2016 % of Total % Change
White 1,071,689 71.8 1,017,930 68.2 -5
Black 103,110 6.9 107,845 7.2 4.6
Hispanic 246,239 16.5 283,932 19.0 15.3
Asia 51,394 3.4 59,722 4.0 16.2
Native American 2,953 0.2 2,916 0.2 -1.3
Pacific Island 320 0.0 312 0.0 -2.5
Two or More Races 17,645 1.2 19,926 1.3 12.9
Total 1,493,350 100 1,492,583 100 -0.1
Source: U.S. Census Bureau, 2010 Census, Population Estimates 2016
Note: Hispanics are broken out from other racial categories and counted as a race for purpose of analysis.
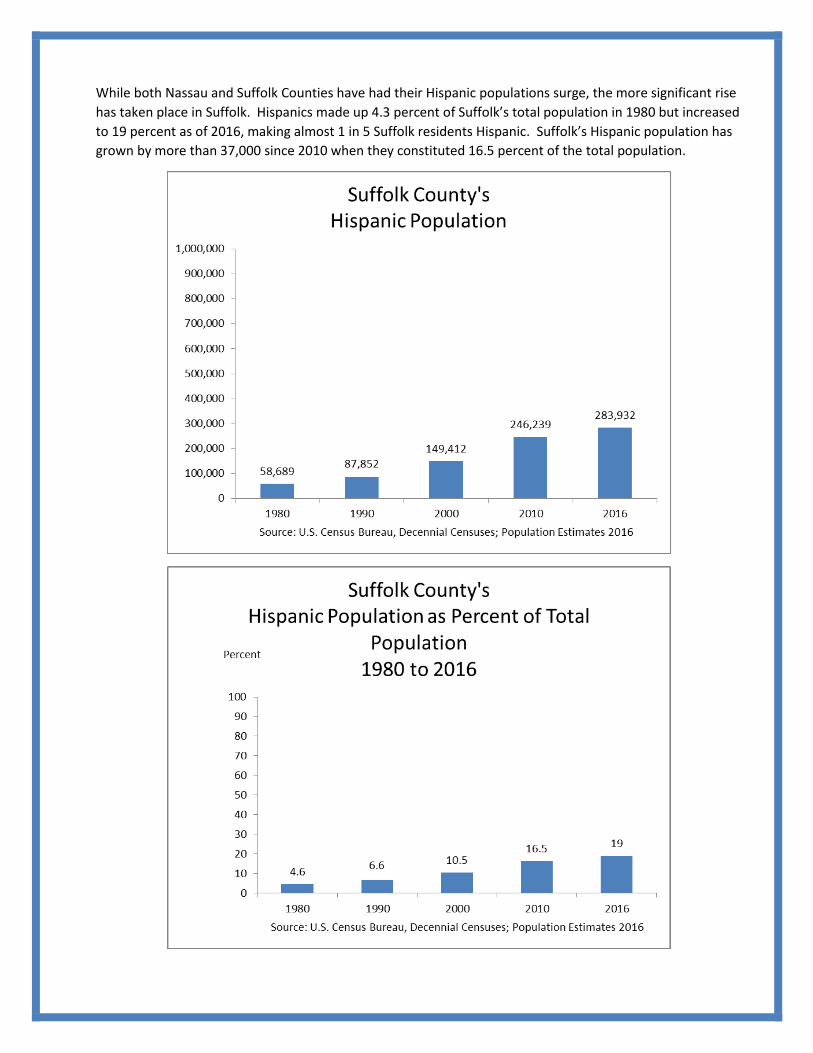
While both Nassau and Suffolk Counties have had their Hispanic populations surge, the more significant rise
has taken place in Suffolk. Hispanics made up 4.3 percent of Suffolk’s total population in 1980 but increased
to 19 percent as of 2016, making almost 1 in 5 Suffolk residents Hispanic. Suffolk’s Hispanic population has
grown by more than 37,000 since 2010 when they constituted 16.5 percent of the total population.


There are more Hispanic residents in Suffolk County than in any other county in New York State, behind only
the counties of New York, Queens, Kings and the Bronx in New York City. Nassau County has the seventh
largest population in the state.
New York State Counties Over 100K-Population-2016
County Hispanic Residents Population % Hispanic
Bronx County 815,422 1,455,720 56.0
Queens County 653,694 2,333,054 28.0
Kings County 505,183 2,629,150 19.2
New York County 427,223 1,643,734 26.0
Suffolk County 283,932 1,492,583 19.0
Westchester County 237,990 974,542 24.4
Nassau County 228,388 1,361,500 16.8
Richmond County 87,567 476,015 18.4
Orange County 76,241 379,210 20.1
Monroe County 63,794 747,727 8.5
Rockland County 57,368 326,780 17.6
Erie County 49,008 921,046 5.3
Dutchess County 35,301 294,473 12.0
Onondaga County 22,308 466,194 4.8
Ulster County 18,042 179,225 10.0
Albany County 18,015 308,846 5.8
Oneida County 12,743 231,190 5.5
Schenectady County 10,665 154,553 6.9
Chautauqua County 9,652 129,504 7.5
Jefferson County 8,166 114,006 7.2
Broome County 8,000 195,334 4.1
Rensselaer County 7,831 160,070 4.9
Saratoga County 7,034 227,053 3.1
Niagara County 5,978 211,758 2.8
Tompkins County 5,198 104,871 5.0
Ontario County 4,964 109,828 4.5
Oswego County 2,977 118,987 2.5
St. Lawrence County 2,571 110,038 2.3
Source: U.S Census Bureau, Population Estimates

III. ASIAN POPULATION
Other non-white, minority groups have grown as well on Long Island, with Asians experiencing the highest
rate of increase of all groups, though in much lower absolute numbers than Hispanics. The number of Asians
on Long Island has grown almost eight-fold since 1980, from 24,769 to 189,637 in 2016, a 666 percent
increase. As a percentage of the total population, Asians have grown from 1 percent in 1980 to 6.6 percent
in 2016. The Asian population has grown more in Nassau County than in Suffolk. Having grown from 14,472
in 1980 to 129,915 in 2016, Asians made up 9.5 percent of the total population of Nassau in 2016, up from
just 1.1 percent of the total population in 1980. Today, nearly 1 in 10 Nassau residents are Asian.2
2 The U.S. Census Bureau’s definition of Asian is “A person having origins in any of the original peoples of the Far East, Southeast Asia, or the Indian subcontinent including, for example, Cambodia, China, India, Japan, Korea, Malaysia, Pakistan, the Philippine Islands, Thailand, and Vietnam.”


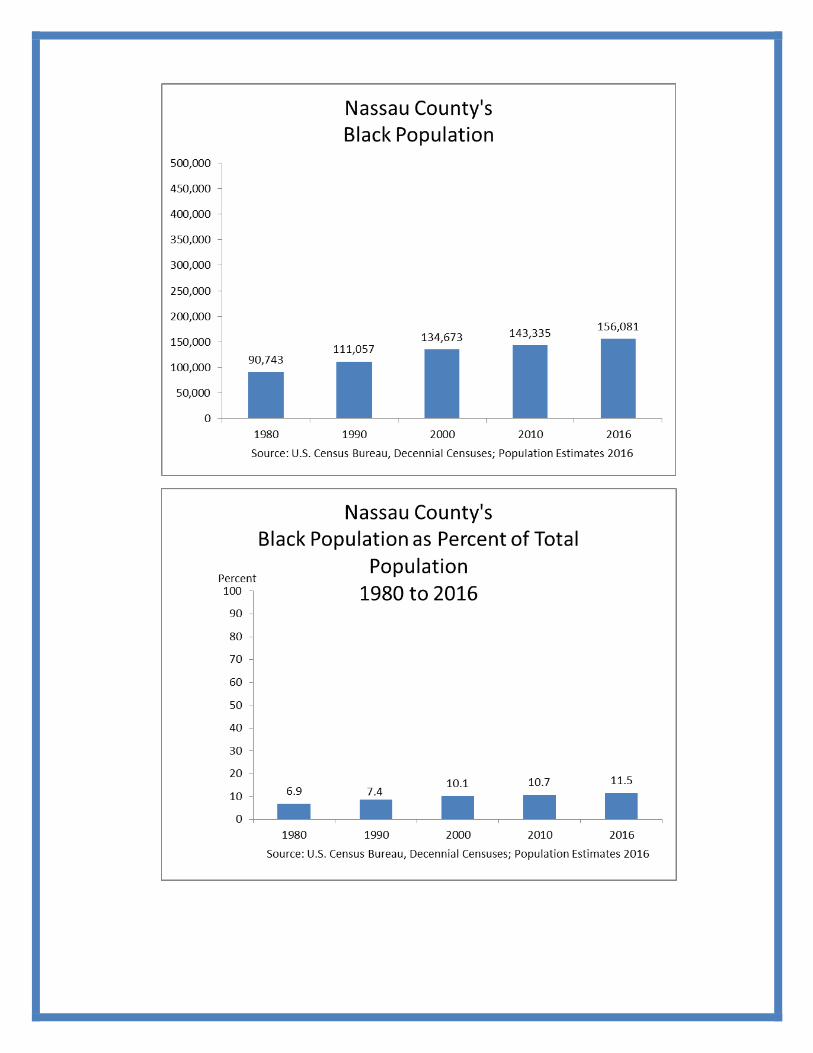
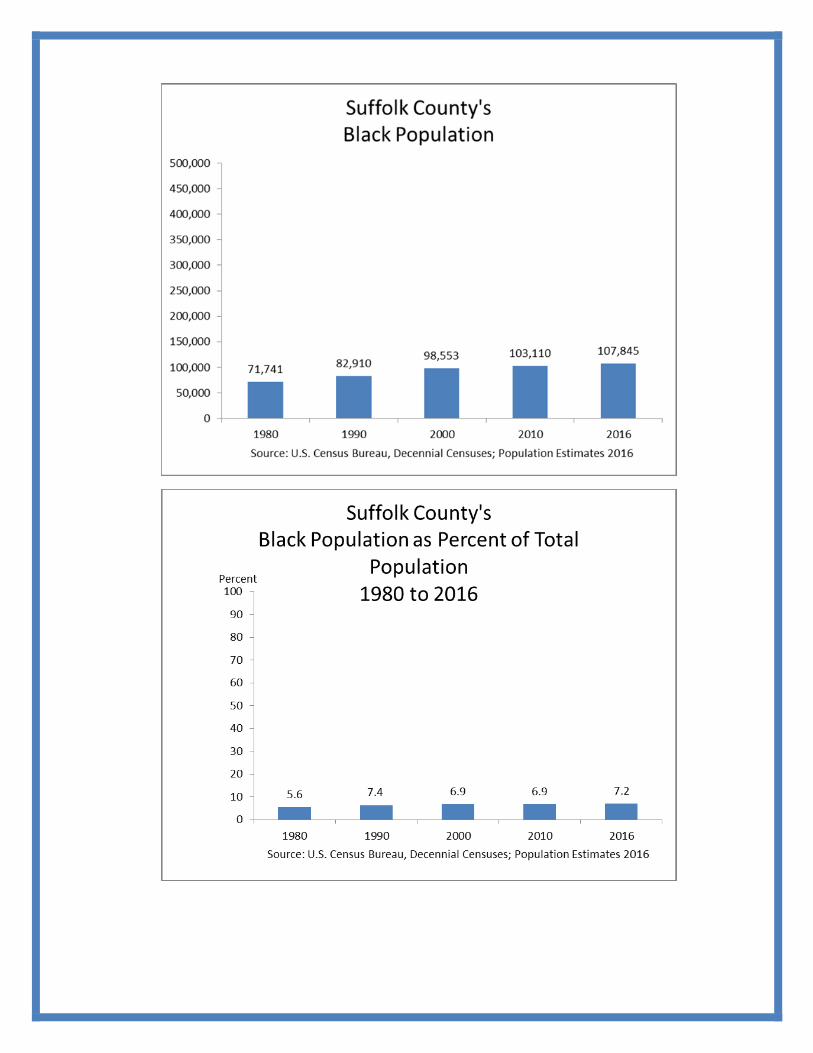
IV. BLACK POPULATION
Once the largest minority population on Long Island, blacks have increased in numbers at a lower
rate than Hispanics and Asians, however, their percentage of the total population still grew steadily.
With 162,484 blacks on Long Island constituting 6.2 percent of the total population in 1980, there
were 263,926 blacks on Long Island in 2016, making up 9.2 percent of the total population in 2016.
Blacks comprised 11.5 percent of the total population in Nassau in 2016 and 7.2 percent in Suffolk.3
3 The U.S. Census Bureau collects information on race following the guidance of the U.S. Office of Management and Budget’s (OMB) 1997 Revisions to the Standards for the Classification of Federal Data on Race and Ethnicity. According to OMB, “Black or African American” refers to a person having origins in any of the Black racial groups of Africa. The Black racial category includes people who marked the “Black, African Am., or Negro” checkbox. It also includes respondents who reported entries such as African American; Sub-Saharan African entries, such as Kenyan and Nigerian; and Afro-Caribbean entries, such as Haitian and Jamaican.

Long Island’s non-Hispanic white population is now below 65%
of the total Long Island population; a 24% decline since 1970.
The Hispanic population has surged on Long Island and
especially in Suffolk County where now almost 1 in 5 residents
are Hispanic. Long Island’s Asian population has increased
eight fold since 1980 and now almost 1 in 10 Nassau residents
are Asian. Finally, Long Island’s black population now makes
up 9.2% of the total population with more blacks in Nassau
than in Suffolk.
Long Island’s health and sustainability depends upon a culture
and workforce that recognizes and celebrates our diversity. In
a nation that remains polarized, our region’s changing
demographics can demonstrate its positive influence on our
businesses, schools and government.
CONCLUSION