Embed Size (px)
Citation preview

Open Path CO2/H2OGas Analyzer
Instruction Manual
LI-7500ALI-7500A

LI-7500A Open Path CO2/H2O Analyzer Instruction Manual
Publication No. 984-10563
LI-COR, inc. 4647 Superior Street
P.O. Box 4425 Lincoln, Nebraska 68504 USA
Telephone: (402) 467-3576
FAX: 402-467-2819 Toll-free 1-800-447-3576 (U.S. & Canada)
[email protected] [email protected]
www.licor.com

ii

iii
Lead (Pb) Mercury (Hg) Cadmium (Cd)
Chromium VI
Compounds
(Cr6+
)
Polybrominated
Biphenyls
(PBB)
Polybrominated
Diphenyl Ethers
(PBDE)
OOXOOXylbmessA daeH
Head Board Circuit Board Assembly X O O O O O
(Pb) (Hg) (Cd) (Cr6+
) (PBB) (PBDE)
X O O X O O
X O O O O O
X: this component does contain this hazardous substance above the maxiumum concentration values in homogeneous materials
specified in the SJ/T 11363-2006 Industry Standard (Company can explain the technical reasons for the "X")
Hazardous Substances or Elements
Component Name
O: this component does not contain this hazardous substance above the maxiumum concentration values in homogeneous
materials specified in the SJ/T 11363-2006 Industry Standard.
X: SJ/T 11363-2006 o ( ,
"X" o )
CO2/H2O
O: SJ/T 11363-2006 o
LI-7500A
LI-7500A

iv
NOTICE The information contained in this document is subject to change without notice. LI-COR MAKES NO WARRANTY OF ANY KIND WITH REGARD TO THIS MATERIAL, INCLUDING, BUT NOT LIMITED TO THE IMPLIED WARRANTIES OF MERCHANTABILITY AND FITNESS FOR A PARTICULAR PURPOSE. LI-COR shall not be liable for errors contained herein or for incidental or consequential damages in connection with the furnishing, performance, or use of this material. This document contains proprietary information which is protected by copyright. All rights are reserved. No part of this document may be photocopied, reproduced, or translated to another language without prior written consent of LI-COR, Inc. © Copyright 2009, LI-COR, Inc. Publication No. 984-10563 Printing History New editions of this manual will incorporate all material since the previous editions. Update packages may be used between editions which contain replacement and additional pages to be merged into the manual by the user. The manual printing date indicates its current edition. The printing date changes when a new edition is printed. (Minor corrections and updates which are incorporated at reprint do not cause the date to change). The LI-7500A is covered by German Patent # 020031-006700DE and Great Britain Patent #020031-006700GB; other patents pending. Microsoft® and Windows® are registered trademarks of Microsoft Corporation. Eurofast® is a registered trademark of Turck Inc. LI-COR, Inc. ● 4647 Superior Street ● Lincoln, Nebraska 68504 Phone: 402-467-3576 ● FAX: 402-467-2819 Toll-free: 1-800-447-3576 (U.S. & Canada) [email protected] ● www.licor.com 1st Printing - December, 2009

v
Table of Contents
Section 1. General Information
Overview of the LI-7500A...................................................................................................... 1-1 What’s What............................................................................................................................ 1-1 Getting Started Tutorial .......................................................................................................... 1-4
Section 2. Initial Setup
Installing the LI-7500A........................................................................................................... 2-1
Mounting the LI-7550 Analyzer Interface Unit ............................................................. 2-1 Mounting the Sensor Head ............................................................................................. 2-3
About the LI-7550 Analyzer Interface Unit .......................................................................... 2-4 Power On................................................................................................................................. 2-5 Cables and Cable Connections ............................................................................................. 2-5
Power Cable ..................................................................................................................... 2-7 SDM Interface Cable ........................................................................................................ 2-7 Analog Input/Output Cable ............................................................................................ 2-7 Serial RS-232 Cable ......................................................................................................... 2-9 Ethernet Cables................................................................................................................. 2-10 Sensor Head Control Cable............................................................................................. 2-11 External Temperature Thermistor..................................................................................... 2-11
Using the Auxiliary Sensor Interface ..................................................................................... 2-12 Mounting the Auxiliary Sensor Interface........................................................................ 2-12 Auxiliary Sensor Interface Terminals............................................................................... 2-13 Electrical Connections ..................................................................................................... 2-15 Connecting Sensors to the Auxiliary Sensor Interface .................................................. 2-17
Section 3. Theory of Operation
Relating Absorption to Concentration .................................................................................. 3-1 Measuring Absorptance.......................................................................................................... 3-2 Cross Sensitivity ...................................................................................................................... 3-3 Zero Drift ................................................................................................................................. 3-3

vi
Equation Summary .................................................................................................................. 3-4 H2O.................................................................................................................................... 3-4 CO2.................................................................................................................................... 3-4
LI-7500A Implementation ...................................................................................................... 3-6 A Note About Temperature and Pressure ............................................................................. 3-7 Operational Considerations ................................................................................................... 3-7
Dew................................................................................................................................... 3-7 Rain/Snow......................................................................................................................... 3-7 Dust and Pollen ............................................................................................................... 3-8 Vibrations ......................................................................................................................... 3-8
Section 4. Operation
Installing the Windows Software on Your Computer .......................................................... 4-1 Using the LI-7500A Software................................................................................................. 4-1 Connect – Establishing Communications ............................................................................. 4-1
Ethernet Tab...................................................................................................................... 4-2 Serial (RS-232) Tab........................................................................................................... 4-3 Run Disconnected ........................................................................................................... 4-4 Main Window .................................................................................................................. 4-4
Configuration Files ................................................................................................................. 4-7 Auxiliary Inputs....................................................................................................................... 4-8 Analog Outputs....................................................................................................................... 4-10
Delay Time ....................................................................................................................... 4-11 Bandwidth ........................................................................................................................ 4-11 Note About System Delay vs. Bandwidth ...................................................................... 4-12 RS-232 Output ................................................................................................................. 4-12 Note on Data Output Rates............................................................................................. 4-13 Ethernet Output ................................................................................................................ 4-14 DAC Configuration .......................................................................................................... 4-16 SDM Output ..................................................................................................................... 4-17 Diagnostic Value.............................................................................................................. 4-19
Logging Data ........................................................................................................................... 4-20 Calibration............................................................................................................................... 4-21
Changing Sensor Heads................................................................................................... 4-24 Manual Tab ...................................................................................................................... 4-24 History Tab ....................................................................................................................... 4-25
Charting ................................................................................................................................... 4-26 Settings..................................................................................................................................... 4-28
Time .................................................................................................................................. 4-28 Network Settings .............................................................................................................. 4-28

vii
Manual Tab – Sending Instrument Commands ............................................................. 4-30 Advanced Tab – Setting Chopper Housing Temperature ............................................. 4-30
Diagnostics.............................................................................................................................. 4-31
Section 5. Calibration
Introduction ............................................................................................................................ 5-1 How Stable are Zero and Span?............................................................................................. 5-1 Checking the Zero – Considerations ..................................................................................... 5-2 Checking the Span – Considerations .................................................................................... 5-2
Setting the Secondary Span – Considerations ............................................................... 5-3 What Actually Happens ......................................................................................................... 5-3 Complete Step-by-Step Calibration Instructions .................................................................. 5-5 Complete Step-by-Step Secondary Span Instructions (CO2) ................................................ 5-9 Complete Step-by-Step Secondary Span Instructions (H2O)................................................ 5-10
Section 6. Maintenance
Cleaning the Optical Path...................................................................................................... 6-1 Changing the Fuse .................................................................................................................. 6-3 Replacing the Internal Chemicals .......................................................................................... 6-3
Section 7. Troubleshooting
Power On Problems................................................................................................................ 7-1 PC Connection Problems....................................................................................................... 7-1 Bad Temperature or Pressure Readings.................................................................................. 7-3 Bad CO2 or H2O Readings ...................................................................................................... 7-3 Diagnostic Messages............................................................................................................... 7-4
General Indicators............................................................................................................ 7-5 Test Point Values ............................................................................................................. 7-6
Appendix A. Specifications
Appendix B. Pin Assignments
viii
Appendix C. Suppliers
Appendix D. Configuration Grammar
Warranty

1-1
1 General Information
Overview of the LI-7500A The LI-7500A is a high performance, non-dispersive, open path infrared CO2/H2O analyzer designed for use in eddy covariance flux measurement systems. Some of the LI-7500A's important features include: ● Simultaneous measurements of CO2 and H2O in the free atmosphere. ● High speed measurements. Internal 150 Hz measurements are digitally
filtered to provide a true 5, 10, or 20 Hz bandwidth. ● Withstands exposure to rain or snow without damage or calibration
shift. ● Versatile output options with the included LI-7550 Analyzer Interface
Unit: Ethernet, DACs, Synchronous Device for Measurement (SDM), and RS-232.
● Simple Windows® software provides for easy user calibration and configuration.
IMPORTANT NOTE! LI-COR Biosciences does not endorse the suitability of the LI-7500A for applications on moving platforms or in applications where the instrument is exposed to corrosive elements (i.e., oceanographic salt water spray). If you have questions about the suitability of the LI-7500A for your application, please contact LI-COR.
What’s What
If you have just taken delivery of your LI-7500A, check the packing list to verify that you have received everything that was ordered and that you have also received the following items: ● Standard Spare Parts Kit - (part #7500-028). This kit contains
replacement parts for your LI-7500A. Among other items, the spares kit contains the calibration accessory, tubing and sensor head mounting kit. As you become familiar with the analyzer you will learn which items to keep close at hand and which items can be stored away. The

General Information
1-2
LI-7550 Analyzer Interface Unit also has a spare parts kit (p/n 9975-023) with spares that are specific to the Interface Unit; this is where the cables (below) and Analyzer Interface Unit mounting brackets are located.
The spares kits include these commonly used items:
Description Qty. LI-COR Part No.
LI-7500A Spares Kit 1 7500-028 Bev-a-line Tubing 15’ 222-01824 Sensor Head Mounting Kit 1 9975-010 Calibration Accessory 1 9975-024 Calibration Accessory Gaskets 1 9975-014 Ambient Temperature Sensor 1 9975-026
LI-7550 Analyzer Interface Unit Spares Kit 1 9975-023 Control Unit Mounting Kit 1 9972-029 RS-232 Cable 1 392-10268 Power Cable 1 9975-030 Analog Input/Output Cable 1 392-10109 Ethernet Cable 1 392-10108 Ethernet Adapter Cable 1 392-10107 SDM Interface Cable 1 392-10093 5 Amp Fuse 2 439-04214 4GB USB Flash Drive 1 7550-210
(Optional) Auxiliary Sensor Interface Spares Kit 1 9977-019 U-Bolt, ¼ x 20 2 184-09842 Hex Nut 4 163-00138 Strain Relief 1 198-01788
Quick Connect Plug 10 300-07393
● RS-232 Cable - (part #392-10268). Used to connect the LI-7550 to a computer. This null modem cable is terminated with a 9-pin DB-9 type connector; if your computer has a 25-pin serial connector, you will need to use a 9-pin to 25-pin adapter.
● Power Cable - (part #9975-030). Used to connect the LI-7500A to a
10.5-30VDC power supply. The power cable is terminated with bare
General Information
1-3
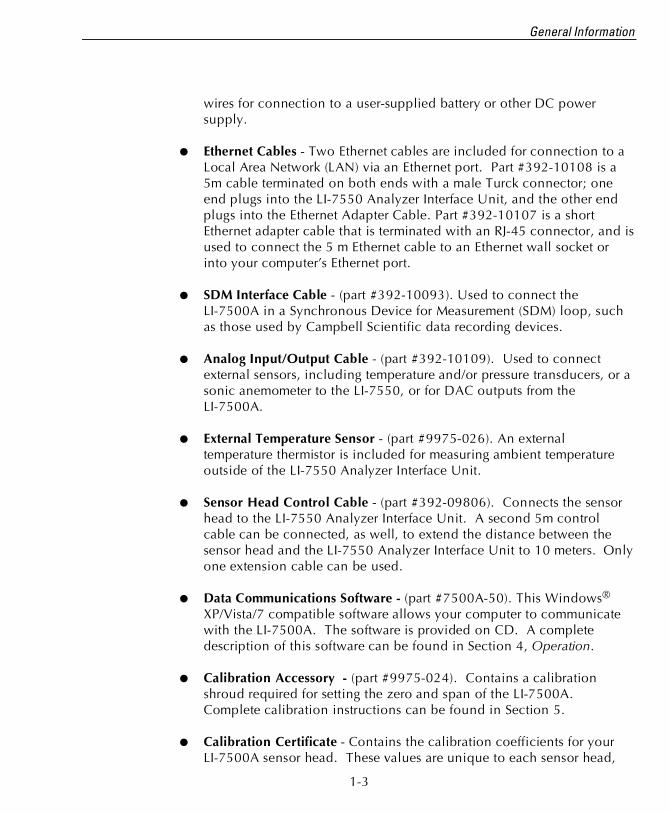
wires for connection to a user-supplied battery or other DC power supply.
● Ethernet Cables - Two Ethernet cables are included for connection to a
Local Area Network (LAN) via an Ethernet port. Part #392-10108 is a 5m cable terminated on both ends with a male Turck connector; one end plugs into the LI-7550 Analyzer Interface Unit, and the other end plugs into the Ethernet Adapter Cable. Part #392-10107 is a short Ethernet adapter cable that is terminated with an RJ-45 connector, and is used to connect the 5 m Ethernet cable to an Ethernet wall socket or into your computer’s Ethernet port.
● SDM Interface Cable - (part #392-10093). Used to connect the
LI-7500A in a Synchronous Device for Measurement (SDM) loop, such as those used by Campbell Scientific data recording devices.
● Analog Input/Output Cable - (part #392-10109). Used to connect
external sensors, including temperature and/or pressure transducers, or a sonic anemometer to the LI-7550, or for DAC outputs from the LI-7500A.
● External Temperature Sensor - (part #9975-026). An external
temperature thermistor is included for measuring ambient temperature outside of the LI-7550 Analyzer Interface Unit.
● Sensor Head Control Cable - (part #392-09806). Connects the sensor
head to the LI-7550 Analyzer Interface Unit. A second 5m control cable can be connected, as well, to extend the distance between the sensor head and the LI-7550 Analyzer Interface Unit to 10 meters. Only one extension cable can be used.
● Data Communications Software - (part #7500A-50). This Windows®
XP/Vista/7 compatible software allows your computer to communicate with the LI-7500A. The software is provided on CD. A complete description of this software can be found in Section 4, Operation.
● Calibration Accessory - (part #9975-024). Contains a calibration
shroud required for setting the zero and span of the LI-7500A. Complete calibration instructions can be found in Section 5.
● Calibration Certificate - Contains the calibration coefficients for your
LI-7500A sensor head. These values are unique to each sensor head,

General Information
1-4
and have been entered into the control box at the factory. Keep this sheet in case you need to re-enter these values.
Getting Started Tutorial
The following section briefly covers the basic steps you might follow to set up the LI-7500A to collect and record data. Many of these steps are described in greater detail elsewhere in this manual.
1 Connect the Sensor Head
The LI-7500A sensor head is connected to the control module using the 392-09806 Sensor Head Control Cable, which is a 5 m (15') shielded cable. The cable has a circular connector which is attached to the sensor head as shown in Figure 1-1. Align the cable connector and the sensor head, and push straight in. Tighten the knurled nut.
Figure 1-1. Align the connectors and tighten the knurled nut.

General Information
1-5
2 Connect the Power Supply
The power supply cable (#9975-030) has a circular connector that attaches to the LI-7550 Analyzer Interface Unit front panel at the location marked POWER. The other end has bare wire leads for connection to a 10.5-30VDC supply (2A or greater). Connect the red lead to the positive terminal of the power supply, and the black wire to the negative terminal.
3 Connect the External Temperature Sensor
An external temperature thermistor (Figure 1-2) is included for measuring ambient temperature outside of the LI-7550 Analyzer Interface Unit. The thermistor plugs into the connector labeled SENSOR on the LI-7550 front panel.
Figure 1-2. 9975-026 External temperature sensor.
4 Install the LI-7500A PC Communications Software
This software is required for communicating with a computer. Installation instructions can be found in Section 4, Installing the PC Communications Software on Your Computer.
5 Connect the RS-232 or Ethernet Cables
Connect the RS-232 cable, or the 392-10108 Ethernet cable to the LI-7550 front panel. If using the Ethernet cable, attach the Ethernet Adapter Cable (p/n 392-10107) to the the 392-10108 cable, and plug the RJ45 connector into your computer or a network jack.

General Information
1-6
6 Start the LI-7500A Communications Program
Open the LI-7500A Windows Communications program. Choose the COM (serial) port to which the RS-232 cable (Step 4) is connected to the computer, select a baud rate, and click on Connect. After a few seconds, you should see "live" numbers on the display. Alternatively, if you are connected via the Ethernet cable, you should see your instrument listed by serial number in the ‘Connect to:’ window. Select it and click Connect.
7 Verify Calibration Coefficients
Click on the Calibration icon on the toolbar, click on the Coefficients tab, and verify that the information on this page matches what is printed on the calibration sheet for the sensor head being used. (Sensor heads are interchangeable, but the calibration coefficients, as well as the zero and span parameters on the Calibration page, are unique to each sensor head).
8 Verify CO2 and H2O Response
If the sensor head is indoors, it may be reading very high values of CO2; if you exhale toward the sensor head, CO2 and H2O should show a sudden spike upward.
9 Verify Automatic Gain Control (AGC)
Click on the Diagnostics icon on the toolbar, and view the AGC value. Make a note of this value, as it represents the "clean window" baseline value (assuming your instrument is new). Typical "clean window" values are near 31%. As dirt accumulates on the windows (or anywhere in the optical path), the AGC value will increase to 90-100%. The windows should be cleaned before the AGC value reaches about 62%.

General Information
1-7
10 (Optional) Verify Calibration
If you have facilities to check zero and span, do so now (see Section 5, Calibration). This was done at the factory prior to shipping, so should not be necessary on new instruments*. Note the zero values for CO2 and H2O, if this is a new instrument. As the internal chemicals become depleted, these values will increase (when you re-zero).
* If you find the span needs re-setting, it is possible that your CO2 (or H2O) gas standards differ from LI-COR's.

2-1
2 Initial Setup
Installing the LI-7500A Mounting the LI-7550 Analyzer Interface Unit Two brackets (p/n 6575-033) are included that can be used to mount the LI-7550 using bolts or U-bolts to secure the box to a tripod or other post. There are holes in the four corners of the box, as well, that can be used to attach the box directly to a flat surface, if desired. The mounting brackets are designed to accomodate a square or circular mounting post of up to 1.25" in width (diameter). Use a 3/16" hex key to attach the mounting brackets to the Analyzer Interface Unit using 4 socket head screws (p/n 140-02654). The U-bolts can then be inserted through the holes in the mounting bracket, and tightened around the post, as shown in Figure 2-1.

Initial Setup
2-2
AnalyzerInterface
Unit
Socket Head Screws (4 ea., p/n 140-02654)
Side View
PostU-bolt
Nut
LI-7550 Analyzer Interface Unit Top View
Mounting Bracket
Figure 2-1. Attach mounting brackets to Analyzer Interface Unit, and secure to mounting post. There are some additional considerations that should be taken into account when locating the Analyzer Interface Unit, including: 1. The cable that connects to the sensor head is 5 meters in length;
determine the height at which the sensor head will be mounted, and plan to mount the Analyzer Interface Unit accordingly. A second sensor head control cable can be added, if necessary, to extend the total cable length to a maximum of 10 meters.
2. The thermal properties of the Analyzer Interface Unit are such that it is
OK to place the box in direct sun. 3. The power cord provided is 5 meters in length. Longer cables can be
purchased through distributors of Turck, Inc. (see List of Suppliers in

Initial Setup
2-3
Appendix C). Note, however, that longer cables may require a larger power source.
Mounting the Sensor Head
The LI-7500 sensor head has a mounting post that can be used to mount the analyzer. The mount is threaded to accept standard 3/8-16 tripod screws (a 1/4-20 adapter is also included, which can be threaded into the mounting post). Mounting the sensor head at a slight angle from vertical (~10-15°) may also help prevent water droplets from remaining on the windows during rainstorms.
Figure 2-2. Mount the sensor head near the sonic anemometer, at a slight vertical angle. The sensor head mounting post can also be attached to a U-rail type holder and fastened with a 3/8-16 screw (or a 1/4-20 screw, when using the adapter bushing). A vertical mounting orientation provides 360° acceptance for wind direction (neglecting the sonic anemometer location, of course), and this is

Initial Setup
2-4
the recommended orientation. However it is oriented, the sensor head should be placed as close to the sonic anemometer as possible, and at equal heights, as shown in Figure 2-2.
About the LI-7550 Analyzer Interface Unit The LI-7550 Analyzer Interface Unit is a weatherproof case that houses the electronics for data output from the LI-7500A sensor head. The front panel also has cable connections for connecting the sensor head and data input/output cables (see Figure 2-4). The inside of the LI-7550 case is shown below. Note that there is a USB connector for use with a USB flash drive. This provides an additional method of collecting data, when it is impractical to use other (cabled) methods of data collection. LI-COR recommends that you use only an industrial rated USB flash drive; non-industrial rated flash drives can fail, causing you to lose data. LI-COR includes a 4GB industrial rated drive from Delkin Devices, Inc. (Poway, CA); the List of Suppliers in Appendix C lists some other suppliers, as well. As an example, if you are logging all data variables at 10 Hz (10 samples/second), approximately 180MB of data would be generated each day; thus, the 4GB drive could collect about 20 days’ data. Note that there are three Ethernet connectors inside the LI-7550 case, two of which are connected internally to the Ethernet 1 and Ethernet 2 ports on the front panel. It does not matter to which ports these internal cables are connected (they’re connected to ports 2 and 3 in the photo below). The third port is not connected to the panel, but can be used in the field to connect an Ethernet device, if desired (e.g. to calibrate the instrument).

Initial Setup
2-5
Figure 2-3. LI-7550 indicator panel.
Power On The LI-7500A has no power switch; it is turned on when power is supplied through the power cable attached to the LI-7550 Auxiliary Interface Unit. The LI-7500A requires a constant power source of 10.5-30VDC (2 amps). When power is applied, the Power LED on the LI-7550 indicator panel will illuminate, and will stay lit as long as power is supplied. The Ready LED will turn on when the instrument (embedded) software has loaded and the instrument is ready to communicate with a computer.
Cables and Cable Connections The LI-7500A includes a variety of cables for connecting the sensor head to the LI-7550 Analyzer Interface Unit, and for connection to a user-supplied power supply, as well as to your computer or other data collection devices. All cables are 5 meters in length, and are manufactured by Turck, Inc.
Pressure transducer

Initial Setup
2-6
(Minneapolis, MN). If you need longer cable lengths, there are several options available: 1. In some cases, LI-COR can provide an extension cable. For example, a
second sensor head control cable can be added, to extend the sensor head up to 10 m from the Analyzer Interface Unit. For other cables (e.g. the Serial and/or Ethernet cables), extension cables are readily available from other suppliers.
2. Custom cable lengths can be purchased from Turck, Inc. Table 2-1
below lists both LI-COR part numbers and Turck part numbers for each cable.
Table 2-1. Turck Eurofast® cables used to connect to the LI-7550. * = cable length
LI-COR Part Number Cable Cable Connector Turck Part Number 392-10094 Power 4-pin female RK4.41T-*/S529 392-10093 SDM Interface 4-pin male RSS 4.4T-* 392-10268 Serial 6-pin female to DB-9
female RKC 6T-*-DB9F/CS12317
392-10109 Analog In/Out 12-pin male RSS 12T-* 392-10108 Ethernet 8-pin male-male RSS RSS841-*M 392-10107 Ethernet Adapter 8-pin female to RJ45 RKC RJ45 840-*M
3. Where appropriate, you can construct your own extension cable(s);
Table 2-2 lists the pin assignments and wire colors for the Power, SDM, and Analog In and Out cables. This table is reproduced on the inside front cover of the LI-7550 Analyzer Interface Unit.

Initial Setup
2-7
POWER SDM
RS-232
DACOUTPUT
AUXILIARYINPUT
IRGA
SENSOR
ACCESSORY
PRESSURE
ETHERNET 1
ETHERNET 2
Figure 2-4. LI-7550 Connector Panel. Power Cable (p/n 392-10094) The 4-pin female connector plugs into the connector labeled POWER on the LI-7550 Analyzer Interface Unit front panel. The power cable is terminated with black (VIN-) and red (VIN+) wires for connection to a user-supplied 10-30VDC power supply. SDM Interface Cable (p/n 392-10093) For connection to Campbell Scientific (Logan, UT) dataloggers for Synchronous Device for Measurement (SDM) data communications. SDM communications are enabled in the datalogger using either the SDM LI-7500 or CS7500 instructions, depending on the datalogger. For more information on using these instructions refer to SDM Output (page 4-17 in this manual) or the instruction manual for your datalogger, published by Campbell Scientific. The SDM Interface Cable connects to the connector labeled SDM on the LI-7550 Analyzer Interface Unit front panel. The pin assignments of the SDM Interface Cable are given in table 2-2. Generally the blue wire (SDM_DATA) will connect to C1 on the datalogger, the white wire (SDM_CLK) to C2, the brown wire (SDM_EN) to C3 and the black wire (ground) to ground. Analog Input/Output Cable (p/n 392-10109) The Analog Input/Output cable is for connection to user-supplied sensors (i.e., pressure, temperature, sonic anemometer). The pin assignments and wire colors are shown below in Table 2-2. There are four analog input channels available. When used with external input devices, this cable plugs into the connector labeled AUXILIARY INPUT on the LI-7550 Analyzer Interface Unit front panel.

Initial Setup
2-8
This cable is also used for data output to logging devices using the digital-to-analog converters (DACs). Six DAC channels are available; the pin assignments and wire colors are shown below in Table 2-2. The cable plugs into the connector labeled DAC OUTPUT on the LI-7550 Analyzer Interface Unit front panel. This cable can also be used to connect directly to sensors or output devices; an optional weatherproof Auxiliary Interface Box (p/n 7550-101) can be used in place of this cable. Use of the 7550-101 is described later in this section. Note that only one Analog Input/Output cable is included with the LI-7500A; if you intend to use both the Auxiliary Input and DAC Output ports on the LI-7550, you will need to purchase an additional 392-10109 cable, or the 7550-101 Auxiliary Sensor Interface.

Initial Setup
2-9
Table 2-2. Pin assignments and wire colors for Power, SDM, Auxiliary Input and DAC Output cables.
SDM
POWER
AUXILIARY INPUT DAC OUTPUT
INPUT: 10.5 - 30VDC
FUSE: 5A F 125/250V
PIN 1
PIN 2
PIN 3
PIN 4
COUPLING
BROWN
WHITE
BLUE
BLACK
BARE
SDM_EN
SDM_CLK
SDM_DATA
GND
EARTH GND
PIN 1
PIN 2
PIN 3
PIN 4
PIN 5
PIN 6
PIN 7
PIN 8
PIN 9
PIN 10
PIN 11
PIN 12
WHITE
BROWN
GREEN
YELLOW
GREY
PINK
BLUE
RED
ORANGE
TAN
BLACK
VIOLET
AUX1+
AUX1-
AUX2+
AUX2-
AUX3+
AUX3-
AUX4+
AUX4-
+5V
GND
GND
GND
PIN 1
PIN 2
PIN 3
PIN 4
PIN 5
PIN 6
PIN 7
PIN 8
PIN 9
PIN 10
PIN 11
PIN 12
WHITE
BROWN
GREEN
YELLOW
GREY
PINK
BLUE
RED
ORANGE
TAN
BLACK
VIOLET
DAC1
DAC2
DAC3
DAC4
DAC5
DAC6
READY
NC
NC
GND
GND
GND
PIN 1
PIN 2
PIN 3
PIN 4
VIN-
VIN-
VIN+
VIN+
BROWN
WHITE
BLUE
BLACK
LI-7550 Pin Assignments
BLACK
RED
Serial RS-232 Cable (p/n 392-10268) This 5m null modem cable has a 6-pin female circular connector that plugs into the connector labeled RS-232 on the LI-7550 Analyzer Interface Unit front panel. The other end has a standard DB-9 female connector for direct connection to a computer. If your computer has a 25-pin serial connector, you will need to use a 9-pin to 25-pin adapter.

Initial Setup
2-10
Figure 2-5. The RS-232 Cable is terminated with a standard DB-9 connector for connection to a 9-pin serial port on your computer. Ethernet Cables (p/n 392-10107 and 392-10108) Two Ethernet cables are included for connection to a Local Area Network (LAN) via an Ethernet port. Part #392-10108 is a 5m cable terminated on both ends with a male Turck connector; one end plugs into the LI-7550 Analyzer Interface Unit, and the other end plugs into the Ethernet Adapter Cable. Part #392-10107 is a short (0.3m) Ethernet adapter cable that is terminated with an RJ45 connector, and is used to connect the 5 m Ethernet cable to an Ethernet wall socket or into your computer’s Ethernet port.

Initial Setup
2-11
Ethernet Cablep/n 392-10108
Ethernet Cablep/n 392-10107
LI-7550
ExternalEthernet Connector
or
Figure 2-6. Two Ethernet cables are included for connection to an RJ45 connector on a computer or wall socket. Sensor Head Control Cable (p/n 392-09806) Connects the LI-7500A sensor head to the LI-7550 Analyzer Interface Unit. A second control cable can be connected to extend the distance between the sensor head and the LI-7550 to 10 meters. Note that only one extension cable can be used. The Sensor Head Control cable plugs into the connector labeled IRGA on the LI-7550. External Temperature Thermistor (p/n 9975-026) An external temperature thermistor is included for measuring ambient temperature outside of the LI-7550 Analyzer Interface Unit. The thermistor plugs into the connector labeled SENSOR on the LI-7550 front panel.

Initial Setup
2-12
Using the 7550-101 Auxiliary Sensor Interface The optional Auxiliary Sensor Interface serves as a convenient, weatherproof junction box that can be used in place of the Analog Input and/or Analog Output cables. The Sensor Interface is O-ring sealed, and has connections for up to six DAC outputs, or four general purpose analog input voltage channels. Sensors can be powered with a constant 5 VDC source (5 mA max.). Note that the Auxiliary Sensor Interface can be configured to work with the LI-COR LI-7700 Open Path CH4 Analyzer, as well. There is a small jumper located at position LK1 (far right in Figure 2-8 below); when using the Interface Box with the LI-7500A, make sure that the jumper is positioned over the 2 pins nearest the LI-7550 label (the topmost 2 pins in Figure 2-8 below). This jumper is positioned over the 2 pins nearest the LI-7700 label when used with the LI-COR LI-7700 Open Path CH4 Analyzer. Mounting the Auxiliary Sensor Interface The Auxiliary Sensor Interface has an attached mounting plate that can be used to attach the Interface to a 1-1 ½” post. Two U-bolts and hex nuts are included in the 7550-101 spare parts kit that can be used to attach the Interface, as shown below in Figure 2-7. The Auxiliary Sensor Interface can be mounted either vertically or horizontally. If you do not want to use the attached mounting plate, remove the top cover of the Interface, and remove the two screws in opposite corners of the Interface box that secure the lid to the mounting bracket. You can then secure the Interface using wire, cable ties, or other methods of your choosing.

Initial Setup
2-13
AuxiliarySensor Interface
Side View
Post
U-bolt
Nut
7550-101 Auxiliary Sensor Interface Top View
Mounting Bracket
Figure 2-7. Use the included U-bolts and hex nuts to secure the Auxiliary Sensor Interface to a post, if desired. Auxiliary Sensor Interface Terminals Loosen the four philips head screws in each corner of the Auxiliary Interface Box module and remove the top cover. The interior of the interface appears as shown in Figure 2-8 below.

Initial Setup
2-14
Figure 2-8. Schematic diagram of interior of Auxiliary Interface Box. There are 2 terminal strips, with connections as follows:
When Used for Analog Inputs
AU
X1+
AU
X1-
GN
D
AU
X2+
AU
X2-
GN
D
AU
X3+
AU
X3-
AU
X4+
GN
D
AU
X4-
GN
D
+5V
GN
D
Figure 2-9. Terminal connections for Analog Inputs.
When Used for Analog Outputs
DA
C1
DA
C2
GN
D
DA
C3
DA
C4
GN
D
DA
C5
DA
C6
RE
AD
Y
GN
D
NC
GN
D
NC
GN
D
Figure 2-10. Terminal connections for Analog Outputs.

Initial Setup
2-15
The terminal positions are numbered and configured as follows, reading left to right:
Terminal Analog Inputs1
Description Analog Outputs2
Description
1 AUX1+ Auxiliary Input 1 positive
DAC1 DAC channel 1 positive
2 AUX1- Auxiliary Input 1 negative
DAC2 DAC channel 2 positive
3 GND Ground GND Ground 4 AUX2+ Auxiliary Input
2 positive DAC3 DAC channel
3 positive 5 AUX2- Auxiliary Input
2 negative DAC4 DAC channel
4 positive 6 GND Ground GND Ground 7 AUX3+ Auxiliary Input
3 positive DAC5 DAC channel
5 positive 8 AUX3- Auxiliary Input
3 negative DAC6 DAC channel
6 positive 9 AUX4+ Auxiliary Input
4 positive READY Analyzer ready
10 GND Ground GND Ground 11 AUX4- Auxiliary Input
4 negative NC No
connection 12 GND Ground GND Ground 13 +5V +5V supply NC No
connection 14 GND Ground GND Ground
1 Analog Inputs ±5V 2 Analog Outputs 0-5V Electrical Connections All analog devices connected to the 7550-101 Auxiliary Sensor Interface must be referenced to the ground (GND) connection; some examples are shown below.

Initial Setup
2-16
Analog Out +
Analog Out -
Ground orCommon
Aux +
Aux -
Aux Ground
Analog Out +
Common
Ground
Aux +
Aux -
Aux Ground
Analog Out +
Ground orCommon
Aux +
Aux -
Aux Ground
Analog Device 7550-101 Analog Inputs
Analog Out +
Common
Ground
Aux +
Aux -
Aux GroundNC
Connection Notes: 1. All LI-7500A auxiliary analog input ground connections are internally
connected together. 2. All LI-7500A auxiliary analog output ground connections are internally
connected together. 3. Analog devices with both ground and common outputs can share these
outputs with their power supply ground. 4. LI-7550 analog inputs are electrically isolated from the LI-7550 power
input. 5. LI-7550 analog outputs are electrically isolated from the LI-7550 power
input and isolated from the analog inputs.

Initial Setup
2-17
Connecting Sensors to the Auxiliary Sensor Interface There are 5 strain relief “gland” type plugs on the Auxiliary Sensor Interface top cover, through which the sensor wires pass, after which the wires are connected to the appropriate screw terminals. To attach your sensor(s) or power supply to the Auxiliary Interface Box, follow these steps: 1. Remove the philips head screw in each of the 4 corners of the Auxiliary
Sensor Interface and remove the top cover. 2. Remove the cap from any of the 5 gland plugs by turning counter-
clockwise.
3. Pass the wires through the top of the plug cap first, and then through the gland plug. Screw the plug cap slightly, but don’t tighten yet.
4. Use a small flathead screwdriver to loosen the appropriate screw
terminal, and insert the wire leads into the terminal strip. Tighten the screw terminals. Make a note of which plug the wires are passing through (e.g. A, B, C, D, or E), and to which terminal channels the wires are connected. This information will be needed later when you enter the sensor calibration coefficients into software.

Initial Setup
2-18
5. Pull lightly on the wires to remove excess wire from inside the interface, re-attach the interface top cover, and tighten the gland plug cap.
6. When you have finished installing all of your sensors, attach the
Auxiliary Sensor Interface cable connector to the connector on the side panel of the Analyzer Interface Unit labeled ANALOG IN.
7. There are 5 EPDM type plugs inside the box that can be inserted into
unused gland plugs on the Auxiliary Interface Box; the plugs prevent water, insects, dirt, etc. from entering the interface box. Remove the top cover and insert the narrow end of the plug through the back of the gland plug(s) and tighten the plug cap(s) (gland plug A, below). The plugs should always be inserted when there are gland plugs that do not have wires inserted through them.

Initial Setup
2-19
8. Note too that there is a length of Santoprene tubing in the Auxiliary
Sensor Interface spares kit. This tubing can be cut to length and placed around small gauge wires that may not be able to be tightened sufficiently with the gland plugs. It can also be used for oddly shaped wires that can be difficult to seal with the gland plug caps.
3-1
3 Theory of Operation
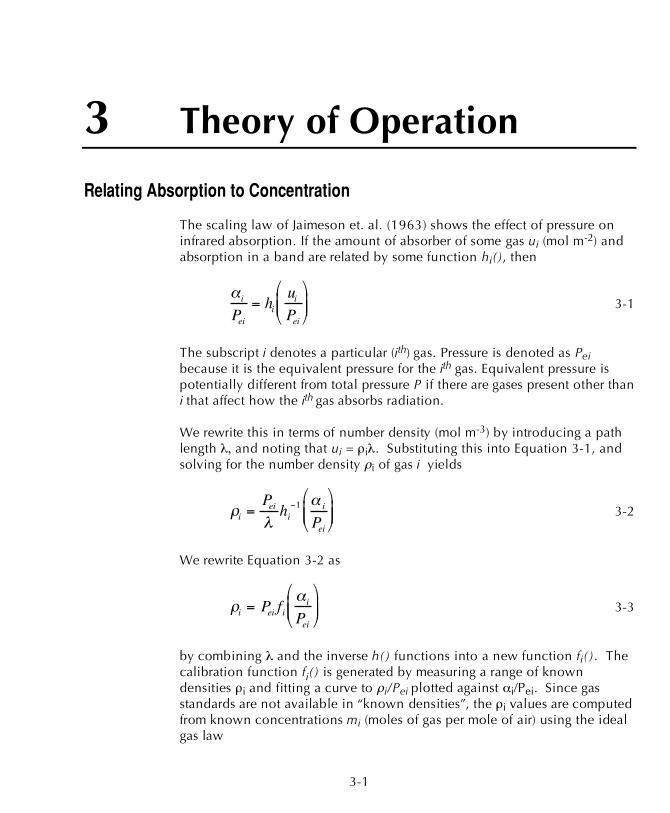
Relating Absorption to Concentration The scaling law of Jaimeson et. al. (1963) shows the effect of pressure on infrared absorption. If the amount of absorber of some gas ui (mol m-2) and absorption in a band are related by some function hi(), then
i
Pei= hi
uiPei
3-1
The subscript i denotes a particular (ith) gas. Pressure is denoted as Pei because it is the equivalent pressure for the ith gas. Equivalent pressure is potentially different from total pressure P if there are gases present other than i that affect how the ith gas absorbs radiation. We rewrite this in terms of number density (mol m-3) by introducing a path length , and noting that ui = i . Substituting this into Equation 3-1, and solving for the number density i of gas i yields
i =Pei hi
1 i
Pei
3-2
We rewrite Equation 3-2 as
i = Pei fii
Pei
3-3
by combining and the inverse h() functions into a new function fi(). The calibration function fi() is generated by measuring a range of known densities i and fitting a curve to i/Pei plotted against i/Pei. Since gas standards are not available in “known densities”, the i values are computed from known concentrations mi (moles of gas per mole of air) using the ideal gas law

Theory of Operation
3-2
i = mi
P
RT 3-4
Measuring Absorptance
Given a source with radiant power , and a detector some distance away, in the absence of reflection, absorptance by gas i can be determined from
i = 1 i = 1i
o
3-5
where i is transmittance through gas i, i is transmitted radiant power in the absorption band with some concentration of gas i present, and o is the transmitted radiant power in the absorption band with zero concentration of i present. The LI-7500A approximates absorptance by
i = 1AiAio
3-6
where Ai is the power received from the source in an absorbing wavelength for gas i, and Aio is the power received from the source in a reference wavelength that does not absorb gas i. The LI-7500A measures Ai and Aio alternately 150 times per second. If we combine Equations (3-6) and (3-3), we can write the full equation for computing molar density from absorptance.
i = Pei fi 1AiAio
zi
SiPei
3-7
Note the zeroing term zi and the span adjustment term Si in Equation (3-7). The span adjustment term is a linear function of absorptance: Si = Si0 + Si1 i 3-8

Theory of Operation
3-3
Cross Sensitivity Because the LI-7500A uses one detector for measuring Ac, Aco, Aw, and Awo, (the absorbed and non-absorbed power for CO2 and H2O, respectively), there is a slight cross-sensitivity between gases due to imperfections in the detector's frequency (time) response. This varies from detector to detector, but is measured during calibration, and is corrected in software. Equation 3-6 is written as
i = 1AiAio
+ X ji 1AjAjo
3-9
where Xji is the cross sensitivity response of gas j on gas i (determined during calibration), and Aj and Ajo are the absorbed and non-absorbed power for gas j. Equation 3-7 becomes
i = Pei fi 1AiAio
+ Xij 1Aj
Ajo
zi
SiPei
3-10
Zero Drift
Even though the detector and filters are temperature controlled in the LI-7500A, the detector is subject to slight temperature drift as ambient temperature changes. This error is directly related to the detector cooler control voltage, which is measured, and thus provides a mechanism for a software "fine tuning". The zero term zi is computed from
zi = Zio + ZiVd 3-11 where Vd is detector cooler voltage, Zi is the slope of the relationship between Vd and zi (determined during calibration), and Zio is the zero factor determined when setting the zero.

Theory of Operation
3-4
Equation Summary H2O In the atmosphere, the absorption of radiation by water vapor is not significantly influenced by any other gas, so the effective pressure for water vapor Pew is simply the total pressure P.
Pew = P 3-12 H2O absorptance w is (from Equations 3-9 and 3-11)
w = 1AwAwo
+ Xcw 1AcAco
Zwo + ZwVd( )
3-13
where Xcw is the cross sensitivity factor for CO2 on water vapor ("H2O XS" on the calibration sheet), Zw is the zero drift coefficient ("H2O Z" on the calibration sheet). H2O number density w is given by
w = PfwwSwP
3-14
The coefficients for the 3rd order polynomial fw( ) are given on the calibration sheet. CO2 The absorption of radiation by CO2 molecules is influenced by several other gases, including O2 and H2O. Since the concentration of H2O is most variable, it must be accounted for in the equivalent pressure of Pec CO2 A method of doing this (LI-COR Application Note #116) is
Pec = P (mw) 3-15 where
(mw) = 1 + (aw - 1)mw 3-16
Theory of Operation
3-5
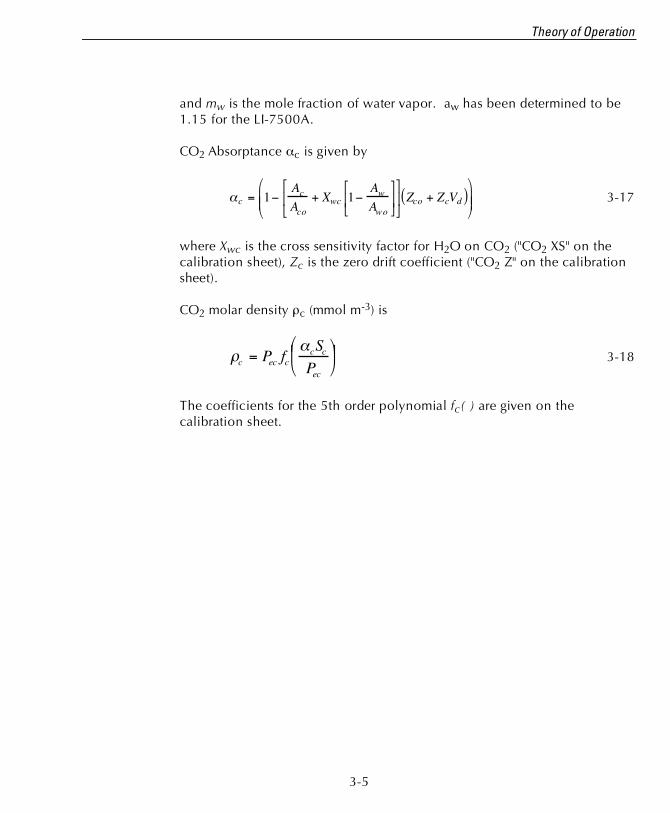
and mw is the mole fraction of water vapor. aw has been determined to be 1.15 for the LI-7500A. CO2 Absorptance c is given by
c = 1AcAco
+ Xwc 1AwAwo
Zco + ZcVd( )
3-17
where Xwc is the cross sensitivity factor for H2O on CO2 ("CO2 XS" on the calibration sheet), Zc is the zero drift coefficient ("CO2 Z" on the calibration sheet). CO2 molar density c (mmol m-3) is
c = Pec fccScPec
3-18
The coefficients for the 5th order polynomial fc( ) are given on the calibration sheet.

Theory of Operation
3-6
LI-7500A Implementation Atmospheric pressure Pg (kPa) and temperature Tg (°C) are measured by sensors in the Analyzer Interface Unit. Their values are displayed on the Calibrations page. Table 3-1. Fundamental equations used in the LI-7500A calculations.
Label Description Equation
H2O mmol/m3 H2O number density W = Pg fw
wSwPg
3-19
H2O g/m3 H2O mass density Wm =
18
1000W 3-20
H2O mmol/mol H2O mole fraction Wf =
WR(Tg + 273.15)
1000Pg 3-21
Dew Point (°C) Dew point temperature Td =
240.97x17.502 x
x = lnWf
613.65Pg
3-22
CO2 mmol/m3 CO2 number density
C = PgW f
1000
fc
cSc
PgW f
1000
3-23
CO2 mg/m3 CO2 mass density Cm = 44C 3-24
CO2 μmol/mol CO2 mole fraction Cf =
CR(Tg + 273.15)
Pg 3-25

Theory of Operation
3-7
A Note About Pressure And Temperature Since the LI-7500A is calibrated for number density, temperature is not required for the calculation, and accurate pressure measurement is not needed either (Equations 3-19 and 3-23). For example, if you introduce a 1% error in the pressure sensor on a perfectly calibrated instrument, the resulting CO2 mole density error would be about 0.25%, and the H2O mole density error about 0.5% in typical ambient conditions. When calibrating (specifically when setting spans), temperature and pressure are more important. Calibrating with a 1% pressure error will cause the resulting CO2 mole density to have a 1% error, but no error in the resulting H2O mole density (because the water span target is computed from dew point, not mole fraction). A 1% error in temperature (3 °C) will cause a 1% error in both CO2 and H2O mole density.
Operational Considerations Dew The LI-7500A can tolerate droplets on the windows to a certain extent; the Automatic Gain Control (AGC) value will increase, but the calibration is unchanged. If the droplets coalesce and get big enough, the AGC will go to 100%, and eventually the readings will become bad. This can be minimized by sensor orientation, and by coating the windows with a wax such as RainX®. Rain/Snow Flying droplets and flakes in the optical path will affect the performance of the LI-7500A, even if the total light blockage is small enough that the AGC does not reach 100%. The reason is that the objects are moving, and if a droplet or flake is in the path for a sample measurment, but out of the path for a reference measurement (or vice versa), it will influence the resulting reading. Figure 3-1 illustrates a strip chart trace made during a light snow shower. The occasional spikes are due to blockage changes between sample and reference readings. Notice that in some cases both CO2 and H2O are affected, and sometimes just one. Also, the spikes are equally likely to be up or down.

Theory of Operation
3-8
Figure 3-1. Typical strip chart trace taken during a light snow shower. The higher the bandwidth, the more pronounced this effect, since less averaging is done. Dust and Pollen The LI-7500A is quite tolerant of small particulates on the windows, as long as they are small, and spectrally neutral. Pollen is a problem because it is sticky and can accumulate, so monitor the AGC values and clean the windows as needed. Vibrations The LI-7500A is vibration sensitive to frequencies of 150 Hz ± the bandwidth. Thus, if the bandwidth is 10Hz, the frequency problem range is 140 to 160 Hz (and upper harmonics). The instrument is completely insensitive to vibrations slower than this, and very slightly sensitive at frequencies higher than this. For land-based installations, probably the most likely source of vibrational problems would be on a tower with tight guy wires. For other settings (aircraft, ships, etc.) where there may be vibrations in the problem range, you should try to minimize the problem through alternative mounting attachments.

4-1
4 Operation
Installing the Windows® Software on Your Computer The LI-7500A PC software is shipped on a CD. Your computer must have an Ethernet or RS-232 serial (COM) interface, and Windows XP/Vista/7. Insert the CD into your CD-ROM drive. If installation does not automatically start, select Run from the Windows Start menu, and select the Setup.exe file on the CD. When the software has finished the installation procedure, the ‘LI-7200 & LI-7500A’ program icon will be placed in the Programs menu, and a shortcut placed on your desktop. To remove the software, go to the Control Panel and select Add/Remove Programs. Choose LI7500A from the list of programs and click the Add/Remove button.
Using the LI-7500A Windows Application Software Data from the LI-7500A can be transferred to a computer for analysis, printing or storage using either the Ethernet or RS-232 interface. The LI-7500A RS-232 port is configured as Data Terminal Equipment (DTE) with no hardware handshaking, and is bi-directional, meaning information can be transferred both into and out of the LI-7500A. Double-click on the LI-7500A program icon to launch the application. The Connect page appears.
Connect – Establishing Communications The Connect page is the area in which you select the communication parameters for connecting the LI-7500A to your computer. The serial (COM) port or Ethernet address, baud rate (RS-232), and data acquisition frequency (in Hz) are chosen in this page.

Operation
4-2
Ethernet Tab The LI-7500A can communicate with a computer via Ethernet; if the instrument is powered on, and is connected to an Ethernet port on the same subnet as the computer, it will automatically be displayed in the ‘Connect to:’ window. By default, the instrument name (serial number) is displayed; you can rename the instrument, if desired, in the Settings Dialog Box, Network Tab (see description later in this section). Alternatively, you can manually enter the IP Address (if known) of the instrument to which you want to connect. The IP address can be obtained automatically, or assigned manually in the Settings Dialog Box. Click on the Connect button to establish communications with the LI-7500A. If something is wrong, it will time out after about 15 seconds. If this happens, make sure you've got the correct instrument selected, and

Operation
4-3
retry. Click on the Disconnect icon on the toolbar to terminate communications. Note that you can run multiple LI-7500A Windows software sessions at the same time, to communicate with different analyzers. Simply double-click on the LI-7500A program icon and open another session, and connect to a different instrument. Serial (RS232) Tab Use the arrow buttons to select the serial port on your computer to which the LI-7500A RS-232 cable is connected. Valid numbers are between 1 and 50. Use the Baud Rate pull-down menu to select the baud rate at which to communicate with the LI-7500A through the LI-7550 serial port. The rate of data transfer is also dependent upon the maximum rate available with your computer's serial port, and the update frequency (see Frequency below) to be used while the program communicates with the LI-7500A. Select from 9600, 19200, 38400, 57600, or 115200. The Update Rate is the update frequency to be used while the LI-7500A Windows program communicates with the LI-7500A. Select from 0.1, 0.2, 0.5, 1, 2, 5, 10, or 20 Hz. Note that at 9600 baud, the maximum update frequency is 2 Hz; at 19200 baud, 5 Hz; at 38400 baud, 10 Hz; at 57600 baud, 15 Hz; and at 115200 baud, 20 Hz. Click on the Connect button to establish communications with the LI-7500A. Click on the Disconnect icon on the toolbar to terminate communications.

Operation
4-4
Run Disconnected The Windows software application can be used independent of the LI-7500A by clicking on the Run Disconnected tab and choosing “Run as an LI-7500A”. This can be useful for training purposes, or for creating a configuration file that can then be saved and transferred to instruments in the field. Some of the functionality of the software is disabled in this mode (e.g. data will not appear, so charting is unavailable), but functions that do not require an active connection are fully functional. Main Window The main window of the Windows communication program contains a toolbar with icons for the various software operations, six data display windows, and a status window that displays some operational parameters of the LI-7500A, including the serial number of the instrument currently connected, the output rate chosen, and the state of USB and/or PC data logging.

Operation
4-5
To change the variable(s) displayed in the data windows, click on the data value; a pop-up Data Items window appears (below), from which you can select the variable you want to display.
Operation
4-6
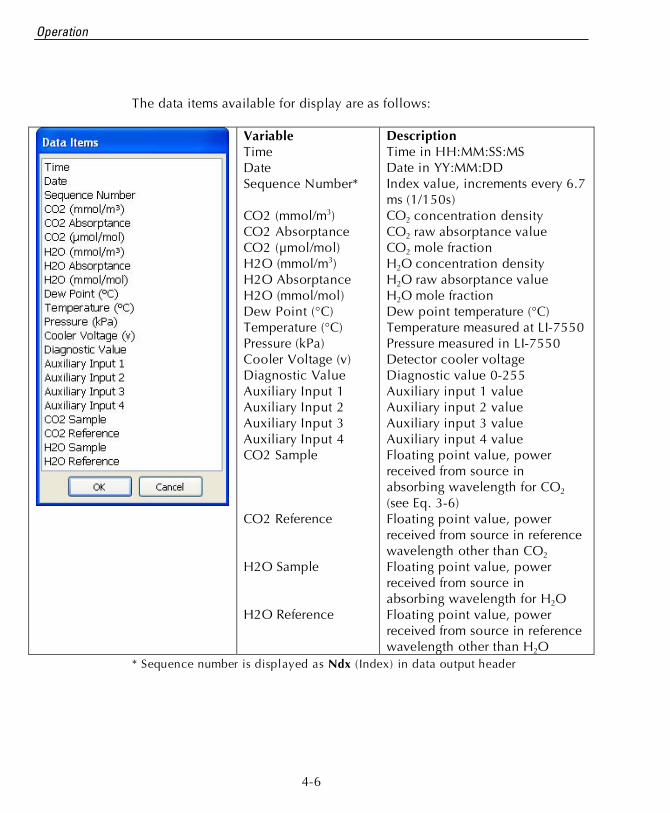
The data items available for display are as follows:
Variable Time Date Sequence Number* CO2 (mmol/m3) CO2 Absorptance CO2 (μmol/mol) H2O (mmol/m3) H2O Absorptance H2O (mmol/mol) Dew Point (°C) Temperature (°C) Pressure (kPa) Cooler Voltage (v) Diagnostic Value Auxiliary Input 1 Auxiliary Input 2 Auxiliary Input 3 Auxiliary Input 4 CO2 Sample CO2 Reference H2O Sample H2O Reference
Description Time in HH:MM:SS:MS Date in YY:MM:DD Index value, increments every 6.7 ms (1/150s) CO2 concentration density CO2 raw absorptance value CO2 mole fraction H2O concentration density H2O raw absorptance value H2O mole fraction Dew point temperature (°C) Temperature measured at LI-7550 Pressure measured in LI-7550 Detector cooler voltage Diagnostic value 0-255 Auxiliary input 1 value Auxiliary input 2 value Auxiliary input 3 value Auxiliary input 4 value Floating point value, power received from source in absorbing wavelength for CO2 (see Eq. 3-6) Floating point value, power received from source in reference wavelength other than CO2 Floating point value, power received from source in absorbing wavelength for H2O Floating point value, power received from source in reference wavelength other than H2O
* Sequence number is displayed as Ndx (Index) in data output header

Operation
4-7
Configuration Files The LI7500A Windows communication program uses configuration files to store a number of software parameters used to set up the LI-7500A for data output. These configuration files store information such as auxiliary input calibration coefficients, DAC output channels, instrument calibration coefficients and zero/span values, and the source channels that you want to log. Unique configuration files can be set up, saved, and then re-opened to easily change your setup information. When the LI-7500A program is started for the first time, a default set of parameters is loaded, which can be modified and saved as a new configuration file with a different name. The LI-7500A stores its configuration so that it will power on configured just as it was when it was powered off.
To open an existing file, click on the Config Files toolbar icon and select Open Configuration. Locate the file on your computer, and click Open. The configuration file parameters are automatically applied to the current software session. You are prompted to send the configuration to the instrument; changes are not implemented in the instrument until the configuration file is applied. To save a configuration file, click on the Config Files toolbar icon and select Save Configuration. Select the items in the Save Options dialog that you want to store in the configuration file, and click Continue.

Operation
4-8
Choose the location to which you want to save the file, enter a file name, and click Save. File names are automatically appended with a .l7x file extension to denote an LI-7500A configuration file.
Auxiliary Inputs Temperature and pressure values are required to convert CO2 and H2O density (mmol/m3) to mole fraction (μmol/mol or mmol/mol). In addition, the LI-7500A requires a pressure value to compute CO2 or H2O mole density, and a temperature value to perform the band broadening correction for H2O on CO2. The Inputs window allows you to specify where the temperature and pressure values are obtained; they can be measured with the on-board sensors, via a custom sensor measured at the Auxiliary Input port, or hand-entered. In addition, other linear ±0-5V user-supplied sensors (e.g. sonic anemometer) can be input via the Auxiliary Input port; the LI-7550 has four auxiliary input channels; if you choose to use your own temperature and/or pressure sensors, then one or two of these channels would be unavailable for use with other sensors.

Operation
4-9
Each auxiliary input channel has two fields that allow you to enter values for the multiplier (m) and offset (b). Linearized voltage inputs (0-5V) use an equation of the form
y = m*x + b where y is the sensor output, x is the voltage output of the sensor, b is the Y-axis intercept (offset), and m is the calibration multiplier, which is the slope of the line representing the sensor’s response.
y
0
b
x
Slope = m

Operation
4-10
Use the temperature and pressure radio buttons to select the method for measuring these values. If you are using an auxiliary input, enter the values for the multiplier (m) and offset (b). If you have updated a user-entered value, you need to send them to the LI-7500A for implementation using the Apply button. If you are using the on-board temperature and pressure sensors, four additional auxiliary input channels are available for use with other user-supplied sensors; enter the multiplier and offset values for these linear sensors as described above.
Analog Outputs The Outputs window allows you to configure the DAC output channels, as well as configure the instrument’s RS-232, Ethernet, or Synchronous Device for Measurement (SDM) output, for use with Campbell Scientific Inc. (Logan, UT) data loggers.

Operation
4-11
The Setup tab contains Delay Time and Bandwidth settings that affect all LI-7500A outputs (RS-232, Ethernet, DACs, and SDM). Delay Time The output signal from the LI-7500A optical bench is sampled by a high-speed A/D converter and input into a Digital Signal Processor (DSP). This signal is processed digitally and gas densities are computed from it. There is a fixed delay in this process, and an additional user-programmable delay that can be used to make the LI-7500A output occur on even sampling intervals.
The LI-7500A has a fixed throughput delay of 220 milliseconds for the DAC outputs, and 211 ms for the SDM, RS-232, and Ethernet outputs. This delay can be increased in increments of 1/150 seconds (6.667 ms), to minimize offsets between the LI-7500A and other sensors. For example, suppose you are sampling (via SDM output) the LI-7500A with a Campbell Scientific CR23X datalogger at 10 Hz (0.1 s). Setting the delay count of the LI-7500A to 13 yields a total delay of .298 seconds, which means the LI-7500A data will have a delay of 3 execution intervals (0.298 s/0.1 s), which the logger can allow for in synchronizing the data to the sonic anemometer or other analog measurements made by the datalogger. Thus, the “unaccounted for” lag is .002s. Without this extra delay, the lag time would be .211 seconds, which is 2 execution intervals (0.2 seconds) plus .011 seconds unaccounted for. Similarly, if you are sampling the LI-7500A with the DAC outputs, setting the delay count to 12 yields a total delay of .300 seconds. The lag will be eliminated. Total System Delay Examples Total System Delay (ms) = Delay Time + (Delay Step Delay Step Increment)
Delay Time (ms)
Delay Step (ms) Delay Step Increment Total Delay (ms)
220 6.667 12 300 211 6.667 13 298
Bandwidth Bandwidth (5, 10 or 20 Hz) determines the signal averaging done by the digital filter. To avoid aliasing (only a concern for co-spectra, not for fluxes), one should sample the LI-7500A at a frequency greater than or

Operation
4-12
equal to 2 times the bandwidth. Thus, if you are sampling at 10 Hz, set Bandwidth to 5 Hz.
Bandwidth is the frequency at which the indicated amplitude is 0.707 of the real amplitude (Figure 4-2).
Con
cent
ratio
n
Time
Actual concentration
Measured concentration
.707
Figure 4-2. Bandwidth = 1/oscillation period. Bandwidth is a useful indicator for characterizing real-world behavior in which there are fluctuating gas concentrations. Given a sinusoidal oscillation of concentration, the instrument's ability to measure the full oscillation amplitude diminishes as the oscillation frequency increases. Note About System Delay vs. Bandwidth The bandwidth selection has no impact on the system delay. The filters were designed so they have exactly the same delay whether a 5, 10, or 20 Hz signal bandwidth is selected. RS-232 Output The RS-232 page is used to set the LI-7500A RS-232 port configuration for unattended data collection. After configuration, click Apply; the LI-7500A will begin to send data out the RS-232 port according to these parameters after you Disconnect from the instrument.

Operation
4-13
Use the Baud Rate pull-down menu to select from 9600, 19200, 38400, 57600, or 115200 baud. Use the Update Rate pull-down menu to select from .1, .2, .5, 0, 1, 2, 5, 10, or 20 Hz. Note that at lower baud rates, you may not be able to output all data items at high frequencies. For example, at 9600 baud, the maximum update rate is 2 Hz, when outputting all 24 data items. Note on Data Output Rates When sending data via a serial connection (e.g. RS-232), note that the baud rate selected may limit the number of samples that can be output. A single line of data (all Log Values selected) consists of approximately 350 bytes (2800 bits), so the maximum output rate at the available baud rates becomes:
Baud Rate Maximum Output Rate (Samples/Second) 9600 2 19200 5 38400 10 57600 15 115200 20

Operation
4-14
Similarly, when logging to an external USB device, logging 20 samples per second (20 Hz) would result in approximately 384 MB/day data accumulation, or about 1 GB/2.5 days. Under Options, you can choose whether or not to output labels with each data record, and whether to output diagnostic text records. An example of a data record sent with and without labels is shown below. Data format with labels:
(Data (Ndx 87665) (DiagVal 757) (Date 2009-09-10) (Time 14:06:44:140) CO2Raw 0.0332911) (H2ORaw 0.19299) (CO2D 5.20672) (H2OD 755.566) (Temp 15.517) (Pres 99.4361)…
Data format without labels:
87665 757 2009-09-10 14:06:44:140 0.0332911 0.19299 5.20672… The End of Line Delimiters determine the character(s) that terminate the data records. Depending on your recording device, a line feed, carriage return, or both may be required to properly parse the data records. Under Data Output, select the data records that you want to output; click Select All to choose all, or Select None to disable all checked values. Ethernet Output The Ethernet page is used to set the LI-7500A Ethernet port configuration for unattended data collection. After configuration, click Apply; the LI-7500A will begin to send data out the Ethernet port according to these parameters after you Disconnect from the instrument. Use the Update Rate pull-down menu to select from .1, .2, .5, 0, 1, 2, 5, 10, or 20 Hz. Under Options, you can choose whether or not to output labels with each data record, and whether to output diagnostic text records. An example of a data record sent with and without labels is shown below. Data format with labels:
(Data (Ndx 87665) (DiagVal 757) (Date 2009-09-10) (Time 14:06:44:140) CO2Raw 0.0332911) (H2ORaw 0.19299) (CO2D 5.20672) (H2OD 755.566) (Temp 15.517) (Pres 99.4361)…

Operation
4-15
Data format without labels: 87665 757 2009-09-10 14:06:44:140 0.0332911 0.19299 5.20672…
The End of Line Delimiters determine the character(s) that terminate the data records. Depending on your recording device, a line feed, carriage return, or both may be required to properly parse the data records. Under Data Output, select the data records that you want to output; click Select All to choose all, or Select None to disable all checked values. The data items available for display are as follows:

Operation
4-16
Variable Time Date Sequence Number* CO2 (mmol/m3) CO2 Absorptance CO2 (μmol/mol) H2O (mmol/m3) H2O Absorptance H2O (mmol/mol) Dew Point (°C) Temperature (°C) Pressure (kPa) Cooler Voltage (v) Diagnostic Value Auxiliary Input 1 Auxiliary Input 2 Auxiliary Input 3 Auxiliary Input 4 CO2 Sample CO2 Reference H2O Sample H2O Reference
Description Time in HH:MM:SS:MS Date in YY:MM:DD Index value, increments every 6.7 ms (1/150s) CO2 concentration density CO2 raw absorptance value CO2 mole fraction H2O concentration density H2O raw absorptance value H2O mole fraction Dew point temperature (°C) Temperature measured at LI-7550 Pressure measured at sensor head Detector cooler voltage Diagnostic value 0-255 Auxiliary input 1 value Auxiliary input 2 value Auxiliary input 3 value Auxiliary input 4 value Floating point value, power received from source in absorbing wavelength for CO2 (see Eq. 3-6) Floating point value, power received from source in reference wavelength other than CO2 Floating point value, power received from source in absorbing wavelength for H2O Floating point value, power received from source in reference wavelength other than H2O
* Sequence number is displayed as Ndx (Index) in data output header DAC Configuration The LI-7550 has the capability to output up to 6 variables on DAC channels 1-6. The DACs page allows you to configure the DAC output channels by specifying the source channel (e.g. CO2 mmol/m3) that drives the analog signal, the source channel value that corresponds to zero volts, and the source channel value that corresponds to full scale voltage (5V).

Operation
4-17
For example, to configure DAC #1 to output a voltage signal proportional to CO2 mmol/m3, 20 mmol/m3 full scale, select CO2 mmol/m3 under DAC1 'Source', and set 0V = 0, and 5V = 20.
0V 0 (Xo, zero volts corresponds to 0 mmol/m3) 5V 20 (XF, full scale corresponds to 20 mmol/m3)
When a voltage range R is selected, the DAC output voltage V resulting from a CO2 molar value X is given by
V = RX XoXF Xo
where R = 5V. The DACs are linear, so in the example above, a measured voltage signal of 3 volts would correspond to a CO2 mmol/m3 value of 12. SDM Output SDM addressing allows multiple SDM-compatible peripherals to be connected to a single Campbell Scientific datalogger. Choose an address under the SDM tab between 0 and 14. SDM communications are enabled in Campbell Scientific dataloggers with one of two instructions, depending on the datalogger. For dataloggers programmed in EdLog (e.g. CR23X) SDM communications are enabled using instruction 189:SDM LI-7500. When using this instruction, parameter two (SDM Address) should be set to match the SDM address of the LI-7500A. Parameter three (Option) is used to define what variables the datalogger collects from the instrument, and can take on values from 0 to 6 (see table 4-1 for variables included in each option). Below is a programming example of instruction 189 used to collect data from an LI-7500A at SDM address 0:
1: SDM-LI7500 (P189)
1: 1 Reps
2: 0 SDM Address
3: 6 Get CO2 & H2O molar density, pressure, and
cell diagnostic value
4: 49 Loc [ LI75000 ]

Operation
4-18
For dataloggers programmed in CRBasic (e.g. CR5000) SDM communi-cations are enabled using the instruction CS7500. When using this instruction, parameter three (SDMAddress) should be set to match the SDM address of the LI-7500A. Parameter four (CS7500Cmd) is used to define what variables the datalogger collects from the instrument. Unlike instruction 189, the CS7500 instruction supports a group trigger mode, so it can take on values from 0 to 7 (see table 4-1 for variables included in each option). Below is a programming example of the CS7500 instruction used to collect data from an LI-7500A at SDM address 0: CS7500 (LI-7500(),1,0,6)
Table 4-1. Parameter 3 (EdLog) or Parameter 4 (CRBasic) value definitions.
Mode Items Sent
0 CO2 (mmol/m3) H2O (mmol/m3)
1 CO2 absorptance H2O absorptance
2 Pressure (kPa) Temperature (°C) Aux channel #1 (user units) Cooler signal (Volts)
3 Diagnostic value (see below) Bandwidth (Hz) Delay interval
4 CO2 (mmol/m3) H2O (mmol/m3) CO2 absorptance H2O absorptance Pressure (kPa) Temperature (°C) Aux channel #1 (user units) Cooler signal (Volts) Diagnostic value (see below) Bandwidth (Hz) Delay interval
5 CO2 (mmol/m3) H2O (mmol/m3) Pressure (kPa)

Operation
4-19
Mode Items Sent
6 CO2 (mmol/m3) H2O (mmol/m3) Pressure (kPa) Diagnostic Value (see below)
7 Trigger Mode CO2 (mmol/m3) H2O (mmol/m3) AGC (%) Pressure (kPa)
NOTES:
LI-7500A Mode 7 requires the Campbell datalogger to broadcast a group trigger to cause data to be registered. The registered data set is held and not updated until the next group trigger. All serial transfers on the SDM bus are bit reversed. This means that the least significant bit is sent first and the most significant bit is sent last. This includes sending the signature.
Diagnostic Value The cell diagnostic value is a 1 byte unsigned integer (value between 0 and 255) with the following bit map:
bit 7 bit 6 bit 5 bit 4 bit 3 bit 2 bit 1 bit 0 Chopper Detector PLL Sync <------------ AGC * 6.25 ----------> 1=ok 1=ok 1=ok 1=ok
Example: a value is 125 (01111101) indicates Chopper not ok, and AGC = 81% (1101 is 13, times 6.25)

Operation
4-20
Logging Data The PC Data Logging page is used to configure the data output parameters used while the LI-7500A Windows application is active. Data can be logged to a file on your computer (PC logging), or to a USB flash drive inserted into the connector inside the LI-7550 Analyzer Interface Unit (USB logging). On the Data Logging tabs, you specify the destination file, update rate, and values to be logged. Note that the Windows application does not need to be actively running to log to the USB drive; data are logged to the USB flash drive as soon as it is inserted. The USB logging tab simply configures the Update Rate and values to be logged upon insertion.
The filename will be appended with the extension .txt (although no extension is required).
Choose the rate of data output here (Hz)
You can split data files every 15, 30, or 60 minutes to create smaller files.
Comments entered here appear in the file header
Press Start to begin logging
Data can be logged at up to 20 Hz, which can result in large data files. These files can be split into smaller files, if desired, at 15, 30, or 60 minute intervals. Note that the files are split based on the system clock; thus, if you choose to split the files at 15 minute intervals, and start logging at 10:22, the file will be split at 10:30, 10:45, 11:00, etc. Files that are split are appended with a timestamp at the end of the file name; thus, a file named Logfile.txt would become Logfile-2009-09-09T150440.txt, where date and time are YMD and HHMMSS in 24-hour time (e.g. hour 15 = 3:00 p.m.).

Operation
4-21
Press Start to begin logging data. Press Stop to quit logging. The USB logging page also has a button to eject the USB flash drive; note that you can also eject the drive from inside the LI-7550 case using the Eject button. Note on Data Output Rates When sending data via a serial connection (e.g. RS-232), note that the baud rate selected may limit the number of samples that can be output. A single line of data (all Log Values selected) consists of approximately 350 bytes (2800 bits), so the maximum output rate at the available baud rates becomes:
Baud Rate Maximum Output Rate (Samples/Second) 9600 2 19200 5 38400 10 57600 15 115200 20
Similarly, when logging to an external USB device, logging 20 samples per second (20 Hz) would result in approximately 384 MB/day data accumulation, or about 1 GB/2.5 days.
Calibration The LI-7500A uses a fifth order polynomial for the CO2 calibration, and a third order polynomial for the H2O calibration. Complete instructions for calibrating the LI-7500A can be found in Section 5. The Calibration window contains buttons to set the zero and span(s) of the LI-7500A. There are entry fields to set the target values for the span gases used to set the span of the instrument; CO2 span gas target values are in ppm, and H2O span gas target values are entered in degrees C dewpoint.

Operation
4-22
The Coefficients tab displays factory-determined calibration coefficients, as well as a factor for correcting CO2 measurements for band broadening due to the presence of water vapor (A), and a zero drift correction factor (Z). The coefficient shown as XS (Cross Sensitivity) compensates for slight cross sensitivity between CO2 and H2O signals absorbed by the detector (see Cross Sensitivity and Zero Drift in Section 3).

Operation
4-23
The calibration coefficients, XS, and Z values are unique to each sensor head, and may be found on the calibration sheet shipped from the factory. The Band Broadening coefficient is 1.15 for all sensor heads. The calibration coefficients are stored in the LI-7550 Analyzer Interface Unit, not the sensor head. To change these values, edit them and then click Apply to send these values to the LI-7500A for implementation. Click Cancel to change any edited values in the window back to the state they were in before editing. The Head Serial Number displays the serial number of the LI-7500A sensor head that is associated with the coefficients.

Operation
4-24
When exchanging sensor heads, it is necessary to change calibration coefficients, and to redo the zero and span. HINT: The easiest way to get the calibration coefficients, zero, and span updated for a sensor head is to make use of “Save Configuration” and “Open Configuration”.
Changing Sensor Heads Sensor heads are freely interchangeable between LI-7550 Analyzer Interface Units. However, the Interface Unit must have the correct calibration coefficients, and current zero and span information, for the sensor head attached to it. This can be done by hand, or "automatically". By Hand 1. Attach the new sensor head. 2. Connect to the computer and establish communications. 3. Enter the calibration coefficients from the Calibration Certificate that
came with the sensor head under the Coefficients tab. 4. Zero and span the IRGA. Automatic Before removing a calibrated analyzer from its LI-7550, use "Save Configuration" to store the configuration information in a file. Then, to move this head to another LI-7550: 1. Attach the sensor head to the LI-7550. 2. Connect to the computer, and establish communications. 3. Select "Open Configuration". Choose the file saved earlier; the
coefficients will automatically be loaded. Manual Tab The Manual tab displays current values for CO2 and H2O zero and span; after performing a zero and span calibration, these values should be near 1 (zero is typically between 0.9 and 1.1, and span is typically between 0.95 and 1.05; Zwo and Zco, see Equations 3-13 and 3-17). Span 2 values will be near zero. We recommend that you track the zero values over time as you re-zero the instrument. As the internal chemicals lose their effectiveness, this value will decrease. The CO2 zero value is also somewhat temperature dependent.

Operation
4-25
In most cases you will never need to manually edit these values. If, for some reason, the instrument calibration becomes unstable (e.g. you accidentally zeroed or spanned the instrument with the wrong gas), you can manually enter a value of 1 for each of these parameters (and zero for Span 2 values), and click Apply. This will return the instrument to a more normal state, after which you can perform zero and span calibrations again. Alternatively, if you have performed at least one previous (successful) calibration, you can restore those values using the History tab (below). History Tab The History tab displays a list of previous calibration backup files, generated during a zero and/or span calibration of the instrument. You can click on any previous calibration in the list to view the details; you can also restore the values from a previous calibration by choosing a file in the list

Operation
4-26
and clicking the Restore button. Click Delete to permanently remove calibration files from the list.
Charting The Strip Chart page allows real time graphics display of one or two variables plotted against time. The Y-Axes (left and right) display the value chosen in the respective pull-down menus against time on the X-Axis.
Time on the X-Axis can be displayed over user-defined values of seconds or minutes; the X-Axis Max value defines the unit of time displayed in the window before the window starts scrolling the time value off the right edge. Choose the value for the Y-Axis Left and/or Y-Axis Right in the pull-down menu(s), and enter values for the Y-Axis maximum and minimum; choose Auto Scale if you want the chart to scale the Y-Axis automatically to keep data from scrolling off the top or bottom edges. You can also select the color of the line for both Y-Axes values. When you are finished defining the strip chart(s) parameters, click OK. A new chart window will appear. Press Pause All to temporarily stop plotting (press Pause All again to resume); press Save to save a “snapshot” of the current plot to a bitmap file; press Print to print the currently displayed chart window, or press Options to open the Chart Setup window again to make changes to the strip chart parameters.

Operation
4-27
TIPS: You can rescale both Y axes of an active strip chart “on the fly”, by right clicking the mouse button on the chart, holding, and dragging up or down. You can also have as many new chart windows as you want.

Operation
4-28
Settings Time Sets the system time and date; click in the Date or Time field and manually enter the desired date and/or time, or use the scroll arrows to increment the numbers up or down.
Network Settings By default, the instrument name that appears in the Ethernet Connect dialog is the instrument type (e.g. LI-7500A) and its associated serial number. You can change this name in the Network Settings dialog, if desired. Enter the new name and click Apply; the next time you try to connect to the instrument, this name will appear in the Connect dialog.

Operation
4-29
The Internet Protocol (IP) address is a numerical identifier that is assigned to devices participating in a computer network; in many cases this address is assigned automatically (Dynamic IP address). In other cases, your network administrator may assign a permanent address (Static IP address) that can be entered manually. If you enable the ‘Obtain an IP address automatically’ radio button, the IP address, Subnet mask, and Default Gateway fields are filled in automatically; if you choose to enter the IP address manually, the address fields are editable. The Subnet Mask is a set of 4 octets used to separate an IP address into two parts; the network address and the host address. The Gateway is a node that routes traffic to another network. Click Apply after you have entered the addressing information, to send to the LI-7500A.

Operation
4-30
Manual Tab – Sending Instrument Commands A command line field is present that allows the user to send a command to the LI-7500A for implementation. This can be useful for diagnosing problems, as a LI-COR technician can gauge the instrument’s response to given commands, and determine if the instrument is functioning properly. The complete command language instructions are given in Appendix D, Configuration Grammar.
Advanced Tab – Setting the Chopper Housing Temperature The chopper motor housing temperature can be set to a lower operating temperature (5 °C) in winter to reduce power consumption and minimize surface heating by the electronics, if desired. LI-COR recommends changing this setting only when the average ambient temperature drops below 5 °C; you can change the setting again to 30 °C when the average ambient temperature is above 5 °C. Note, however, that the instrument will still function properly when the chopper motor housing temperature is set to 30 °C, even when temperatures are below 5 °C. Do not set the chopper housing temperature to 5 °C when ambient temperatures are above 5 °C, however, as the instrument will not function properly. When changing between winter and summer settings, you will
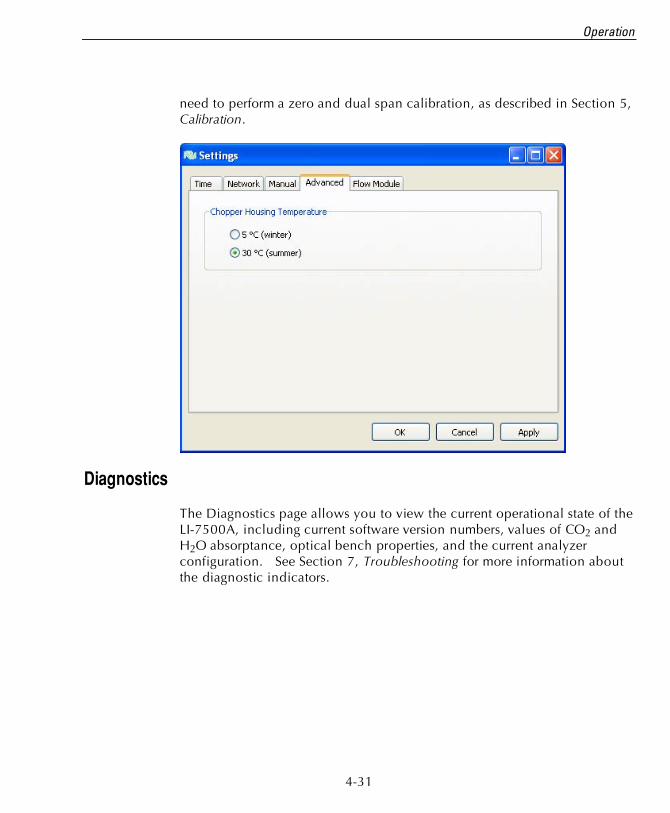
Operation
4-31
need to perform a zero and dual span calibration, as described in Section 5, Calibration.
Diagnostics The Diagnostics page allows you to view the current operational state of the LI-7500A, including current software version numbers, values of CO2 and H2O absorptance, optical bench properties, and the current analyzer configuration. See Section 7, Troubleshooting for more information about the diagnostic indicators.

Operation
4-32

5-1
5 Calibration
Introduction The LI-7500A’s measurement accuracy depends upon its calibration. There are two major components to the calibration: 1) determining the values of calibration coefficients, and 2) setting zero and span. During a factory calibration, both of these steps are performed. The values of the coefficients that are determined should be valid for several years. The zero and span adjustments are used to bring the LI-7500A's actual response into line with its previously determined factory response, at least at two points. It is the user's responsibility to do this step at regular intervals; monthly at first, and then adjust the frequency according to the stability of your instrument; see ‘How Stable are Zero and Span?’ below.
How Stable are Zero and Span? The analyzer's zero is primarily affected by temperature, and the state of the internal chemicals. The internal chemicals should be changed annually (see Section 6, Maintenance). The zero's response to temperature is relatively small (typically 0.1 or 0.2 ppm per °C for CO2, or 0.01 mmol/mol/°C for H2O). Also, this drift is measured at the factory, and subsequently compensated for in software (Equation 3-10), so the effective zero drift should be quite small. Therefore, the zero should be quite stable over a several month period, but you might want to check it after an extreme temperature change (>30 °C). The analyzer's span is affected by temperature, pressure, and the state of the internal chemicals. Temperature: A 10 °C change will typically change the H2O span by 1 to 2%. For CO2 at ambient concentrations, the span is very insensitive to temperature, however. Pressure: A large pressure change (40 kPa) will affect the CO2 and H2O spans by <1%, for ambient CO2 concentrations ( 400 ppm) and high humidities (20 mmol/mol). So, diurnal pressure variations should not be a concern. Chemicals: Reduced internal chemical effectiveness will affect the span, but the effect on the zero will be much more pronounced. In summary, span stability is mostly a concern with H2O, when there are large temperature changes.

Calibration
5-2
Checking the Zero - Considerations The zero is checked with dry CO2-free air within the optical path of the analyzer. A suitable source of air for setting the zero can be generated with chemical scrubbers (such as soda lime for removing CO2 and magnesium perchlorate or Drierite® for removing water), or obtained from a cylinder of zero grade gas. When using chemical scrubbers, it is important to make sure that the chemicals are fresh, and that air goes through the chemicals in the right order; soda lime first, desiccant last (if the desiccant is Drierite®, allow time for the CO2 to "wash out" of it). When using a cylinder, it is important to make sure that the air in the cylinder really is CO2-free since a typical cylinder of standard grade nitrogen might have as much as 20 ppm of CO2 in it. Compressed cylinders may be at pressures of several thousand pounds per square inch; before using them for calibration, they should be fitted with a regulator to reduce the pressure down to a range of around thirty pounds per square inch.
Checking the Span - Considerations For checking the CO2 span, use a cylinder of CO2 in air with a concentration that is at the higher end of the range of concentrations which may be encountered during measurements. For example, a 500 to 1000 PPM cylinder of CO2 in air, which has been verified to be accurate to within at least 1% would be a suitable choice for many applications. Be cautious, as the stated value of the calibration cylinder may be significantly different from the actual gas concentration. For the water vapor span, a convenient standard to use is a dew point generator such as the LI-COR LI-610. To avoid condensation problems choose a dew point temperature that is about 3 to 5 °C below the ambient temperature. Also, since water vapor sorbs and desorbs from surfaces, allow plenty of time for the reading to stabilize. It is important not to rush through the water vapor calibration. If it is more convenient, CO2 and water vapor zero and span calibrations can be done separately. In general, if reliable calibration standards are not available or if there is not enough time to do the job properly, it is better to leave the zero and span settings alone than to rush through the procedure and make incorrect settings. In software version 4.0 and above, span is a linear function of absorptance (Equation 3-8, page 3-2), so there is an offset term and a slope term. Both are determined at the factory, and when a (normal) span is set by the user,

Calibration
5-3
only the offset term changes. The slope term can be changed by performing a secondary span at a much different concentration than the previous (normal) span. Setting the Secondary Span – Considerations (Version 4.0 and above) If you find that after zeroing then spanning at one concentration, the instrument is not within specifications at a different concentration, a secondary span may be in order. The most common reason for doing this would be after a change in the chopper housing temperature set point (see Advanced Settings tab, Section 4). The two span concentrations used for the span and secondary span should be as far apart as possible. For example, at the factory, this is typically done for CO2 using 200 ppm and 3000 ppm. At a minimum, the pair should be at least 500 ppm apart, and bracket your intented operating range (e.g. 300 ppm and 800 ppm). For H2O, you are constrained by the temperature of the air. You would normally choose a very low dewpoint, such as 5 °C, and something close to (just below) ambient. If the air temperature is 15 °C or less, you should probably avoid doing a secondary span.
What Actually Happens In the LI-7500A, the zero and span parameters are set in software (see Section 4). What actually happens when the zero is set is that the value of Zc0 (or Zw0 for water) is determined. For example, when CO2-free air is in the optical path of the analyzer, c should be 0. From Equation 3-17,
c = 0 = 1AcAco
+ XwcAwAwo
Zco + ZcVd( )
so
Zco =1
AcAco
+ XwcAwAwo
ZcVd 5-1
Similarly,
Zwo =1
AwAwo
+ XcwAcAco
ZwVd 5-2

Calibration
5-4
When the span is set, the value of Sc0 (or Sw0 for water) is determined. For example, if there is a known CO2 density 'c in the optical path and the measured absorptance is ’c, then from Equations 3-18 and 3-8, we can write
so
5-3
We rewrite this in terms of a known mole fraction m’c instead of density.
5-4
If we assume that the CO2 span gas is dry, then Pec = P, so
5-5 Similarly, for a known H2O mole fraction m’w and resulting measured absorptance ’w,
5-6
Whenever the CO2 span is set, the instrument saves two values that are used if and when a secondary CO2 span is performed. These values are
5-7
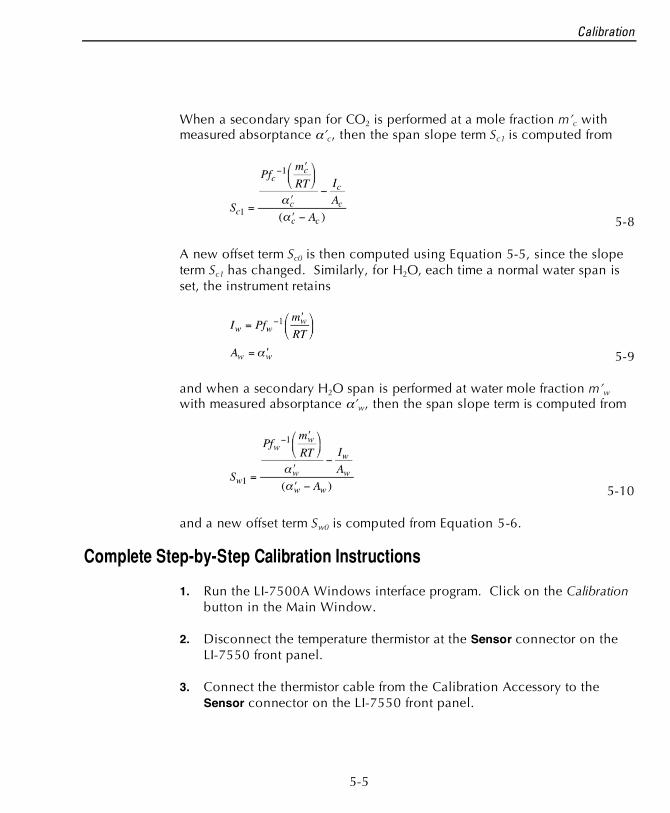
Calibration
5-5
When a secondary span for CO2 is performed at a mole fraction m’c with measured absorptance ’c, then the span slope term Sc1 is computed from
5-8 A new offset term Sc0 is then computed using Equation 5-5, since the slope term Sc1 has changed. Similarly, for H2O, each time a normal water span is set, the instrument retains
5-9 and when a secondary H2O span is performed at water mole fraction m’w with measured absorptance ’w, then the span slope term is computed from
5-10 and a new offset term Sw0 is computed from Equation 5-6.
Complete Step-by-Step Calibration Instructions 1. Run the LI-7500A Windows interface program. Click on the Calibration
button in the Main Window. 2. Disconnect the temperature thermistor at the Sensor connector on the
LI-7550 front panel. 3. Connect the thermistor cable from the Calibration Accessory to the
Sensor connector on the LI-7550 front panel.

Calibration
5-6
Figure 5-1. Flow calibration gas into either port.
Insert the top of the fixture at the widest opening in the struts, near the bottom window, slide up, and slide the bottom into place. It is very important that the fixture is centered between the source and detector windows. It can be helpful to click on the Diagnostics button in the 7500A-50 software, and view the AGC value while centering the fixture; if the AGC value increases when the fixture is in place, it indicates that one or both of the windows are partially or totally obscured. Move the fixture back and forth until the AGC value reads the same value as before the fixture was inserted. The fixture is easy to center; if it looks centered, it probably is.
NOTE: The two ports are interchangeable; it doesn’t matter which port you use as the air inlet.
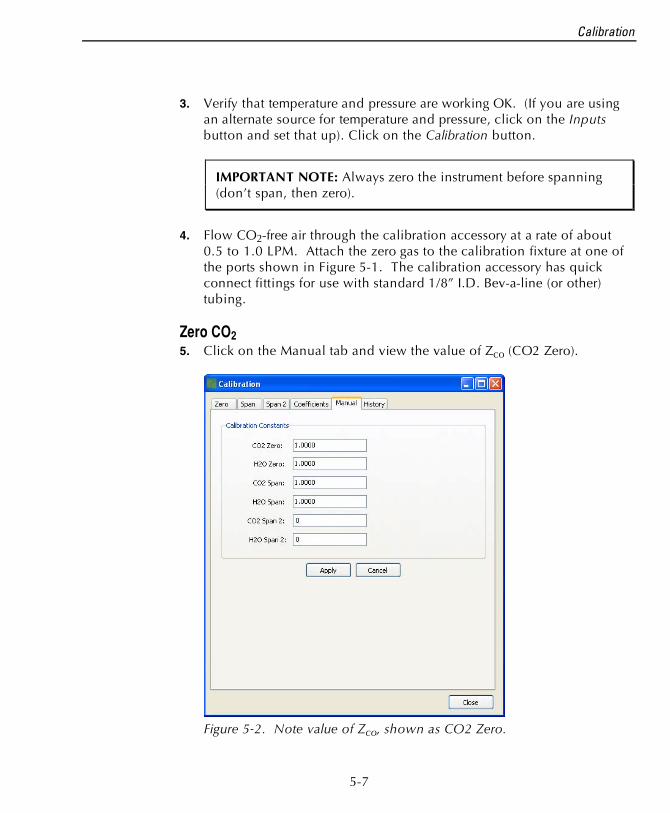
Calibration
5-7
3. Verify that temperature and pressure are working OK. (If you are using an alternate source for temperature and pressure, click on the Inputs button and set that up). Click on the Calibration button.
IMPORTANT NOTE: Always zero the instrument before spanning (don’t span, then zero).
4. Flow CO2-free air through the calibration accessory at a rate of about
0.5 to 1.0 LPM. Attach the zero gas to the calibration fixture at one of the ports shown in Figure 5-1. The calibration accessory has quick connect fittings for use with standard 1/8” I.D. Bev-a-line (or other) tubing.
Zero CO2 5. Click on the Manual tab and view the value of Zco (CO2 Zero).
Figure 5-2. Note value of Zco, shown as CO2 Zero.

Calibration
5-8
6. Click the Zero tab. When the reading has stabilized in the main window, click Zero CO2 to set the CO2 zero. After a brief delay, the displayed CO2 value should be fluctuating around zero. Check the resultant value of Zco shown on the Manual tab (Figure 5-2). It should be near 1 (typically between 0.85 and 1.1). This value will steadily increase over time (2-3 months) as the internal chemicals lose effectiveness.
Zero H2O 7. Now is a good time to check or set the H2O zero, if you have been
flowing dry, CO2-free air through the optical path. Click the Manual tab, and note the present value of Zwo (H2O Zero).
8. Wait for the H2O reading to stabilize in the main window (3 or 4
minutes). 9. Click the Zero tab, and click Zero H2O. Note the new value of Zwo
(typically between 0.65 and 0.85). Span CO2 10. Flow a CO2 span gas through the calibration tube at 0.5 to 1
liter/minute. 11. Click on the Span tab and enter the mole fraction in the ‘Span gas
concentration’ field. 12. When stable (1-2 minutes) click Span CO2. Click the Manual tab and
check the new CO2 Span value Sc (typically 0.9-1.1). Span H2O 13. To set the H2O span, flow air of known dew point through the
calibration tube at about 0.5 to 1.0 LPM. To avoid condensation, use a dew point temperature several degrees below the ambient temperature.
14. Click the Manual tab, and note the present value of the H2O Span value
Sw. Go back to the Span tab and enter the span gas dew point temperature in the ‘Dew point temperature’ field.
15. Observe the H2O dew point in the main window and wait for it to
stabilize. This may take up to 15 or 20 minutes.

Calibration
5-9
16. When the reading has stabilized, click Span H2O. Click the Manual tab again and note the new H2O Span value Sw (typically 0.9-1.1).
Complete Step-by-Step Secondary Span Instructions (CO2)
1. Zero the instrument (Steps 5 and 6 above). 2. Span the instrument at a concentration below your normal operating
range (something in the 200-300 ppm range, for example, Steps 10-12 above).
3. Flow a concentration through the calibration accessory that is at or
above your upper operating range (above 800 ppm, for example). Click on the Span2 tab, and when stable, click Span 2 CO2.
NOTE: You can reverse the concentrations if you wish. The normal span can be the high concentration, and the secondary the low concentration. Also, multiple secondary spans can follow a normal span. Simply make sure that the concentration difference between the normal span and any secondary span is large.

Calibration
5-10
Complete Step-by-Step Secondary Span Instructions (H2O) 1. Zero the instrument (Steps 7 through 9 above). 2. Span the instrument at a dew point that is just below the ambient
temperature (Steps 13-16 above). 3. Flow a very low dew point through the calibration accessory. Click on
the Span2 tab, and when stable, click Span 2 H2O. Note that it may take another 10 minutes or so to ensure equilibrium is reached when changing from one concentration to another, due to water present in the tubing, calibration shroud, etc.
NOTE: You can reverse the concentrations if you wish. The normal span can be the high dew point, and the secondary the low dew point. Also, multiple secondary spans can follow a normal span. Simply make sure that the concentration difference between the normal span and any secondary span is large.

6-1
6 Maintenance
Cleaning the Optical Path The LI-7500A optical windows should be cleaned when necessary (when the AGC value approaches 100%). If the windows become dirty it may become difficult to calibrate the analyzer. Excessive zero drift may also be observed if the optical path becomes obstructed. The windows are sapphire, and are extremely durable and resistant to scratches; clean the windows with any mild detergent or glass cleaner. Also, coating the windows with a water resistant windshield type coating (such as Rain-X®) or a high quality automobile type wax may help prevent droplets from remaining on the windows during rainstorms. Mounting the sensor head at a slight angle from vertical (~10-15°) may also help prevent water droplets from remaining on the windows during rainstorms. The sensor head shown below in Figure 6-1 is from a long term test on a roof top on a snowy day (January 2001) in Lincoln, NE. Note the small puddle of water on the sapphire window; the AGC value was at 100%.

Maintenance
6-2
Figure 6-1. Water on the sapphire windows can cause AGC values at or near 100%.

Maintenance
6-3
Changing the Fuse The LI-7500A power supply is protected by a 5A 125/250V, 5 20 mm fast-blow type fuse located on the main circuit board inside the Analyzer Interface Unit case (Figure 6-2). If the battery or other power source fails to power the LI-7500A, check to see if the fuse has blown.
Figure 6-2. LI-7500A fuse location. To check the fuse, power the unit off, disconnect the power to the unit, and open the case of the LI-7500A Analyzer Interface Unit. The fuse is located on the inside wall, opposite the connector panel, in the lower lefthand corner, as shown in Figure 6-2. Replacement fuses (part #439-04214, in the spares kit) plug into the fuse holder; no soldering is required. Use a flat blade screwdriver to push down on the fuse holder cap, and turn counterclockwise to release the cap. Check the fuse and replace if necessary. Note that sometimes the fuse breaks can occur under the metal caps; carefully check these areas, too.
Replacing the Internal Chemicals There are two small plastic bottles, each containing Ascarite II and magnesium perchlorate, inserted into the analyzer housing that keep the detectors free of CO2 and water vapor. These bottles should be recharged with fresh chemicals annually (or every 6 months in hot, humid climates). Replacement "charged" bottles are available from LI-COR in sets of two

Maintenance
6-4
under part number 7500-950. If you want to recharge the bottles yourself, see Appendix C, Suppliers, for a list of suppliers of Ascarite II and magnesium perchlorate.
NOTE: Calibration shifts will occur if CO2 or H2O are not kept out of the analyzer housing.
■ To change the sensor head soda lime/desiccant bottles:
1. The plastic bottles are located in the analyzer housing in the sensor
head. The bottles are accessed by removing the mounting bracket from the analyzer housing (Figure 6-3). Remove the two screws on the bottom of the mount; be careful not to lose the spacers and washers.
Figure 6-3. Remove the 2 screws on the base of the mounting bracket.

Maintenance
6-5
Teflon Membrane
Mg(ClO4)2
Ascarite II
2. Fill the bottles half full with Ascarite II first, followed by the magnesium perchlorate. Place the teflon membrane in the lid to keep the chemicals from spilling into the detector housing.
3. There are two bottle covers, each with an
O-ring seal, at the base of the sensor head (Figure 6-5). Remove the cover retention thumbscrew. Thread this same screw into each bottle cover and pull straight out.
Mg[C
lO4 ]2
&A
scarite
!M
g[ClO
4 ]2&
Ascarite
!
Bottle Covers (2)
Ascarite/Mg(ClO4)2
Ascarite/Mg(ClO4)2
Bottom View Side View
Remove the coverretention thumbscrew
Insert the thumbscrewhere to act as a knobfor removal
Figure 6-5. Remove the thumbscrew, thread into the bottle covers and replace the chemicals.
4. Make sure the cap has a hole in it to allow for air transfer. Insert the
recharged bottles into the analyzer housing cap first. Replace the bottle covers and the cover retention screw and reattach the mounting bracket.
5. After installing, allow at least 24 hours (with the instrument powered
on) to scrub the housing; otherwise, the instrument may still drift. This should be followed by setting the CO2 and H2O zeros. Check the zero again, if possible, after one or two days.

Maintenance
6-6
NOTE: LI-COR has written a publication that describes the use of chemical scrubbing agents with LI-COR gas analyzers. This publication, entitled "Using CO2 and H2O Scrubbers with LI-COR Gas Analyzers" is available free of charge from LI-COR. Ask for publication #IRG4-101. An electronic version is also available for download at the Technical Support section of LI-COR’s web site.

7-1
7 Troubleshooting
Power On Problems
The instrument requires between 10 and 30 VDC, at 3 Amps, to operate (a LI-COR LI-6020 battery charger, for example, will not by itself power the LI-7500A). When adequate power is first applied to the instrument, the Power LED in the Analyzer Control Unit will light up and remain on. If the Power LED blinks, the power supply is providing barely enough power for proper operation. Make sure the Turck connector on the LI-7550 front panel is inserted properly, and is tight. The LI-7500A requires about 30W at startup, and about 10W during operation. LED does not light at power on This can be due to a blown fuse, or inadequate power supply, or faulty wiring (make sure the black wire on the power cable goes to ground, and the red wire to power).
PC Connection Problems When the Connect button in the LI-7500A Windows program is pressed, the program sets a break condition on the communication line, signaling the LI-7500A to change to 9600 baud and send its current configuration. The PC then sends the desired configuration (update rate, baud rate, etc.) back to the LI-7500A. Both units then change to the desired baud rate, and operations begin. When the Disconnect button is pressed, the PC signals to the LI-7500A to change its RS-232 configuration back to what it was originally (or to that set up in the RS-232 panel). "Port in use or does not exist" when connecting This message indicates that the COM port setting on the Connect page is either incorrect, or else that COM port is already in use by some other program running on the PC. If you are sure that the COM port is correct, and there is nothing else running, try rebooting.

Troubleshooting
7-2
"Not able to connect to the LI-7500A successfully" when connecting Press Connect again. Sometimes it takes a couple of attempts. If repeated attempts fail, then make sure the COM port is in fact the one into which you are connected. Make sure the LI-7500A is in fact powered and running (press the Reset button (below) and see if the LED lights for about 5 seconds). Instrument software is unresponsive If the instrument software is not responding, the instrument can be rebooted using the Reset button on the LI-7550 control panel. Pressing the Reset button restarts the boot process; if connected via Ethernet or USB, the instrument will attempt to reconnect to the Windows software. If connected via RS-232, you may need to restart the Windows software and reconnect manually.
Location of Reset button in LI-7550.

Troubleshooting
7-3
Bad Temperature or Pressure Readings The source of the values of temperature and pressure displayed on the Calibration page are determined by the setting on the Inputs page. If the source is "Measured", the readings come from the LI-7500A's 9975-026 External Temperature Sensor (or the thermistor on the calibration tube, if that is connected), or the pressure sensor inside the LI-7550. If the source is "Aux Input", then the temperature or pressure are coming from an external sensor that you have wired and connected. This signal is modified according to the Auxiliary Coefficients that appear on that same page. If the source is "User-Entered", then whatever you enter manually in the text boxes is used for the value. Temperature is Measured, and reads -65 (or so) The External Temperature Sensor is broken, or disconnected. Pressure is Measured, and doesn't match my barometer The pressure sensor in the LI-7500A is good to about 1%. For operating purposes, it doesn't need to be very good (See "Note on Temperature and Pressure" on page 3-7). When setting the span(s) of the LI-7500A, however, it is more important. If you know the pressure better than the LI-7500A does, then use the "User-Entered" option and enter it.
Bad CO2 or H2O Readings Section 3 details what the LI-7500A measures, and how it computes. Most of the relevant parameters are available for viewing with the LI-7500A Windows software program, such as calibration coefficients, absorptances, and zero and span values. The first thing to check when tracking down bad readings is to make sure all of the coefficients on the "Cal Coeffs" page match those on the calibration sheet for the head in use. The Band Broadening coefficient should be 1.15. After that, go to the "Diagnostics" page and check the values of AGC, and also the CO2 and H2O absorptances. Are any of the diagnostics flags (PLL, etc.) set? Finally, go to the "Calibration" page and make sure the temperature and pressure make sense, and that the current values of zero and span are near 1. Absorptances make sense, densities don't If the absorptance value displayed on the Diagnostics page seem correct (rough rule of thumb: absorptance = 0 when density = 0, CO2 absorptance is about 0.1 with a mole fraction of about 400 ppm, and H2O absorptance

Troubleshooting
7-4
is about 0.1 with a mole fraction of about 20 mmol/mol), but if the displayed values of density or mole fraction are obviously bad, then the problem is in one of the following: calibration coefficients, span parameter, pressure value, and the band broadening value (CO2 only). Readings very noisy Put the calibration tube in place, just to dampen natural fluctuations. You don't necessarily need to have anything flowing through the tube. The noise in absorptance values ("Diagnostics" page, below) should be stable, with only the 4th decimal place changing once in a while. If density or mole fraction is still noisy, watch the temperature and pressure values to see if they are the source of the noise (or change to a hand entered, constant value to try this). Check the calibration coefficients and band broadening value (if the problem is with CO2) to make sure they are correct.
Diagnostic Messages The Diagnostics page allows you to view the current operational state of the LI-7500A, including current software version numbers, diagnostic flags, optical bench properties, and technician test point values.

Troubleshooting
7-5
General indicators Diagnostic indicators for the Sync Flag, PLL, Detector Temperature, and Chopper Temperature will read either ‘OK’ or ‘Service’. Head – Displays the model of the sensor head currently connected to the LI-7550 Analyzer Interface Unit (LI-7200 or LI-7500A). Automatic Gain Control (AGC) - Note this value when you first operate the LI-7500A. Typical values are around 31.2. As dirt accumulates on the sensor head windows the value of AGC will increase, so you can use this value to indicate when it is necessary to clean the windows. Data can be collected until the AGC value reads about 62. A value above 90 indicates the optics are completely blocked. Sync Flag – Not used in LI-7500A. Will always read OK.

Troubleshooting
7-6
PLL - Phase Lock Loop offset, indicates the status of the optical filter wheel for the IRGA. Common causes of a service indication are not having a sensor head connected to the LI-7550, or the 19-pin IRGA cable is attached but the connectors have not been tightened properly. Detector Temperature - If not OK, indicates the detector cooler is not maintaining the proper temperature: this will happen at temperatures above 50 °C. Note that this does not always indicate a serious problem; the cooler may simply have not yet reached the target temperature during instrument startup, or it may be out of range due to external environmental conditions. Readings may still be OK. The sensor head may not be attached to the LI-7550, or the IRGA cable may not be tight. Check cables and wiring. Chopper Temperature - If not OK, indicates the chopper temperature controller is out of range, hot or cold. As with the Detector Temperature indicator above, this may or may not indicate a serious problem. The chopper should be able to temperature control when ambient is between +50 and -25 °C. Check that the sensor head cables to the LI-7550 are tight, and make sure the chopper temperature is not set to Winter when measuring in high ambient temperatures. Test Point Values The Test Points tab displays voltages and raw counts of a variety of LI-7500A diagnostic test points. Though primarily for LI-COR technician reference, values outside of the “normal” range may give you an indication of where problems may be originating.

Troubleshooting
7-7

Troubleshooting
7-8
Test Point Description Normal range IR A/D (V) Voltage from IRGA being sent to A/D
converter 0.2 – 4.8V
Detector Temp (V) Detector temperature voltage 2.9V. Readings near +5V or 0V are normal for a few seconds after power on.
Aux Ref + 16-bit conversion of positive reference voltage used in Auxiliary Input circuit
~64830
Aux Ref - 16-bit conversion of negative reference voltage used in Auxiliary Input circuit
~600
ADC CH1 (V) DAC channel 1 output -5V to +5V. A reading near 0 is normal for an open input.
ADC CH2 (V) DAC channel 2 output -5V to +5V. A reading near 0 is normal for an open input.
ADC CH3 (V) DAC channel 3 output -5V to +5V. A reading near 0 is normal for an open input.
ADC CH4 (V) DAC channel 4 output -5V to +5V. A reading near 0 is normal for an open input.
Box Pressure (V) Absolute pressure Any value between 0 and 5 Box Temp (V) LI-7550 temperature 3.5 at room temperature Chopper Temp (V) Displays voltage of chopper housing
temperature control circuit. 2 is normal. Readings near 0V or +5V indicate that the temperature control circuit is unable to control the chopper temperature.
Short (V) Reference short in auxiliary input circuit
32768
Cooler Voltage (V) Displays voltage of detector cooler. If this value gets below 0.5V, it may be too cold; the detector may not be temperature controlling. This will typically occur at -30 °C or below.
0-5V

A-1
A Specifications
CO2 H2O
Calibration Range 0-3000 ppm 0-60 ppt
Accuracy Within 1% of reading (nominal)
Within 1% of reading (nominal)
Zero drift (per °C) ±0.1 ppm typical ±0.3 ppm max.
±0.03 ppt typical ±0.05 ppt max.
RMS Noise: 5 Hz @370 ppm CO2: 10 Hz and 10 mmol m-1 H2O: 20 Hz
0.08 ppm 0.11 ppm 0.16 ppm
0.0034 ppt 0.0047 ppt 0.0067 ppt
Gain drift (% of reading per °C) ±0.02% typical ±0.1% max. @370 ppmv
±0.15% typical ±0.30% max. @20 ppt
Direct sensitivity to H2O (mol CO2/mol H2O)
±2.00E-05 typical ±4.00E-05 max.
- -
Direct sensitivity to CO2 (mol H2O/mol CO2)
- -
±0.02 typical ±0.05 max.
Data Storage: Removable industrial grade USB flash storage. Data Communication: Ethernet, Synchronous Device for Measurement (SDM; User-selectable to 50Hz), RS-232 (115200 baud); 20 Samples/Sec. max., 6 DACs (single ended; 0-5V). Type: Absolute, open-path, non-dispersive infrared gas analyzer. Detector: Thermo-electrically cooled lead selenide. Bandwidth: 5, 10, or 20 Hz, software selectable. Path Length: 12.5 cm (4.72"). Operating Temperature Range: -25 to 50°C (-40 to 50 °C verification test available on request). Relative Humidity Range: 0-95% (non-condensing). Weatherproof Rating: Tested to IEC IP65 standard.

Specifications
A-2
User Interface: Windows® based software supports all setup, configuration and calibration functions through RS-232 or Ethernet ports. Outputs: RS-232 (20 Hz Maximum) SDM (User selectable to 50Hz) Ethernet 6 user-scalable 16 bit DACs (0-5V range, single-ended). Inputs: Ethernet, 4 analog input channels (±5V, 16 bit). Power Requirements: 10.5 to 30 volts DC. Power Consumption: 30 W during warm-up, 10 W in steady state. Dimensions: Head: Dia 6.5 cm, Length 30 cm. Designed for minimal wind flow disturbance. LI-7550 Analyzer Interface Unit: 35 cm 30 cm 15 cm (external dimensions).
IRGA cable: 5 meters (between sensor head and electronics control box). Can connect two IRGA cables together for a maximum length of 10 meters.
Power, Serial, Analog Input, Analog Output, Ethernet and SDM cables: 5 meters Weight: Head: 0.75 kg (1.65 lb.), LI-7550 and Cables: 4.8 kg (10.5 lb.)

B-1
B Pin Assignments
SDM
POWER
AUXILIARY INPUT DAC OUTPUT
INPUT: 10.5 - 30VDC
FUSE: 5A F 125/250V
PIN 1
PIN 2
PIN 3
PIN 4
COUPLING
BROWN
WHITE
BLUE
BLACK
BARE
SDM_EN
SDM_CLK
SDM_DATA
GND
EARTH GND
PIN 1
PIN 2
PIN 3
PIN 4
PIN 5
PIN 6
PIN 7
PIN 8
PIN 9
PIN 10
PIN 11
PIN 12
WHITE
BROWN
GREEN
YELLOW
GREY
PINK
BLUE
RED
ORANGE
TAN
BLACK
VIOLET
AUX1+
AUX1-
AUX2+
AUX2-
AUX3+
AUX3-
AUX4+
AUX4-
+5V
GND
GND
GND
PIN 1
PIN 2
PIN 3
PIN 4
PIN 5
PIN 6
PIN 7
PIN 8
PIN 9
PIN 10
PIN 11
PIN 12
WHITE
BROWN
GREEN
YELLOW
GREY
PINK
BLUE
RED
ORANGE
TAN
BLACK
VIOLET
DAC1
DAC2
DAC3
DAC4
DAC5
DAC6
READY
NC
NC
GND
GND
GND
PIN 1
PIN 2
PIN 3
PIN 4
VIN-
VIN-
VIN+
VIN+
BROWN
WHITE
BLUE
BLACK
LI-7550 Pin Assignments
BLACK
RED
DB-9 Connector on RS-232 Cable The LI-7550 Analyzer Interface Unit uses a round Turck connector on the front panel for RS-232 data output. A serial cable (p/n 392-10268) with a round Turck connector and a female DB-9 connector attaches to the LI-7550 RS-232 port, and to the DB-9 connector on a computer. The pin assignments on the DB-9 connector on the serial cable are given below; note that not all pins are used for communication between the LI-7550 and a computer.

Pin Assignments
B-2
1
6
2
3
8
7
4
9
5
Data (TXD)
Handshaking (DTR)
Handshaking (CTS)
Handshaking (RTS)
Signal Ground (SG)
Data (RXD)
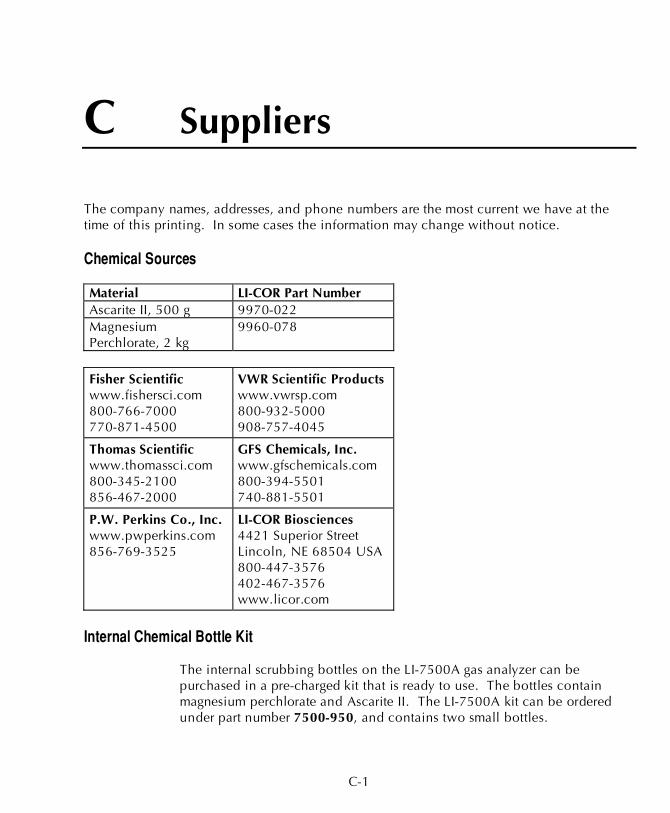
C-1
C Suppliers
The company names, addresses, and phone numbers are the most current we have at the time of this printing. In some cases the information may change without notice.
Chemical Sources
Material LI-COR Part Number Ascarite II, 500 g 9970-022 Magnesium Perchlorate, 2 kg
9960-078
Fisher Scientific www.fishersci.com 800-766-7000 770-871-4500
VWR Scientific Products www.vwrsp.com 800-932-5000 908-757-4045
Thomas Scientific www.thomassci.com 800-345-2100 856-467-2000
GFS Chemicals, Inc. www.gfschemicals.com 800-394-5501 740-881-5501
P.W. Perkins Co., Inc. www.pwperkins.com 856-769-3525
LI-COR Biosciences 4421 Superior Street Lincoln, NE 68504 USA 800-447-3576 402-467-3576 www.licor.com
Internal Chemical Bottle Kit
The internal scrubbing bottles on the LI-7500A gas analyzer can be purchased in a pre-charged kit that is ready to use. The bottles contain magnesium perchlorate and Ascarite II. The LI-7500A kit can be ordered under part number 7500-950, and contains two small bottles.

Suppliers
C-2
Turck® Cables (see Table C-1) Turck Inc. 3000 Campus Drive Minneapolis, MN 55441 Phone: 612-553-7300 FAX: 612-553-0708 www.turck.com Table C-1. Turck® cables used to connect to the LI-7500A.
LI-COR Part Number
Cable Cable Connector Turck Part Number
392-10094 Power 4-pin female RK4.41T-*/S529 392-10093 SDM Interface 4-pin male RSS 4.4T-* 392-10268 Serial 6-pin female to DB-9
female RKC 6T-*-DB9F/CS12317
392-10109 Analog In/Out 12-pin male RSS 12T-* 392-10108 Ethernet 8-pin male-male RSS RSS841-*M 392-10107 Ethernet Adapter 8-pin female to RJ45 RKC RJ45 840-*M
* = cable length

Suppliers
C-3
Industrial Rated USB Flash Drives Delkin Devices, Inc. IronKey, Inc. 13350 Kirkham Way 5150 El Camino Real, C31 Poway, CA 92064-7117 Los Altos, CA 94022-1542 USA Phone: 800-637-8087 Phone: +1 650-492-4055 www.delkin.com Fax: +1 650-967-4650 www.ironkey.com STEC Inc. 3001 Daimler Street Santa Ana, CA 92705 Phone: 949-476-1180 www.stec-inc.com

D-1
D Configuration Grammar
Introduction
This section describes the protocol used by the LI-7500A to communicate via RS-232 and Ethernet, for both configuration and data output purposes. Commands sent to the LI-7500A have a certain structure that must be followed, and data sent by the LI-7500A comes packaged in a particular way. For example, to set the Bandwidth to 10Hz, the following string
(Outputs(BW 10))
should be sent followed by a line feed character (decimal 10). Each command begins with a left parenthesis ‘(‘, and ends with a right parenthesis ‘)’. Some commands, such as (BW...) contain a single value, while other commands, such as (Outputs...), can contain one or more commands. The parentheses mark the start and stop of the command, and extra characters before or after are ignored, as well as white space (spaces and tabs) before or after the parentheses. This string would work equally as well, for example:
This is ignored ( Outputs (BW 10 )) and so is this
The LI-7500A does not try parsing a command string until a line feed is received. Since "extra" characters are ignored, commands can be terminated with carriage return and line feeds equally as well. Another example of a command string is
(Outputs(RS232(Freq 10)(Pres TRUE))(BW 5))
In this case, we are setting the RS-232 output frequency to 10Hz, requesting that Pressure be included in the output records, and that the bandwidth be 5 Hz. Notice the 2 parentheses at the end of (Pres TRUE)). This is because (Pres..) and (Freq..) are (RS232..) commands, while (BW..) is not. (BW..) and (RS232..) are both (Outputs..) commands, however,

Configuration Grammar
D-2
and the “extra” paranthesis at the end of (BW 5)) signals the end of the (Outputs..) command. An illegal command string would be
(BW 5)
because the (BW...) command is only recognized within the context of an (Outputs...) command. The LI-7500A configuration grammar is case sensitive. That is, (Outputs(BW 10)) will work, while (outputs(bw 10)) will not.
Who Sends What Not all of the commands in the LI-7500A’s grammar are really commands. Some are designed to be used by the LI-7500A to package outgoing data. The (Data..) command, or record, might look like this
(Data (CO2D 2.2083146e1)(H2OD 3.5485935e2)(Temp
2.5886261e1)(Pres 9.8157062e1))
This record is showing the latest values of CO2 and H2O mole density (mmol m-3), temperature (°C), and pressure (kPa). The fields present in a (Data..) record, and how often they are output, is determined by the (Outputs..) command. Once it has established communications with a host computer (discussed in the next section), the LI-7500A’s RS-232 communications is largely made of up of outgoing (Data..) and (Diagnostics..) records. The only other type of records it might send are (Error..) and (Ack..). The (Error..) record is sent whenever the LI-7500A receives a command it cannot parse or recognize, and the (Ack..) record acknowledges a configuration change. It is also used to pass back the new zero or span setting after a (Calibrate..) command.
Command Summary In the following sections, some abbreviations are used: {int} means an integer value, such as 0, 10, 452, etc.

Configuration Grammar
D-3
{float} means any integer or floating point value, such as 0, 3.14159, 1E-7, -3.47e-09, etc. {string} means anything (< 40 characters) contained by double quotes, such as "Hey, you!" { item1 | item2 | item3 } means you must include one of the items in the list. {bool} - { TRUE | FALSE }
The (Outputs..) Command (Outputs..) is used to configure the items pertaining to data output, including the bandwidth, delay time, DACs (digital to analog convertors), the RS-232 port, Ethernet and USB Logging. The actual RS-232 and Ethernet output uses the (Data..) record described in Table 2. Table 1: The Outputs Command
Command Subcommands Remarks (BW {5 | 10 | 20}) Sets instrument bandwidth to 5, 10, or
20 Hz. (Delay {int}) Output delay interval (0 to 32), where
each interval is 1/150 seconds. This is added to the 220 ms system delay.
(Outputs (Source {Lista}) ) The variable that drives the DACs (digital to analog converters)
(Zero {float}) ) Value that corresponds to 0 Volts output
(Dac1
(Dac2
(Dac3
(Dac4
(Dac5
(Dac6
(Full {float}) Value that corresponds to 5 Volts output
(SDM (Address {int}) ) SDM address (0 thru 14).

Configuration Grammar
D-4
Command Subcommands Remarks (Baud {9600 | 19200
| 38400 }) Baud rate for RS-232
(Freq {float}) Output frequency of (Data..) records in Hz. Usable values: 0.0 thru 20.0
(Labels {bool}) (DiagRec {bool}) (EOL {"hex code(s)"}) User defined termination
character(s) for data record in "hex" (e.g. "0D0A" would be carriage return line feed). Default is "0A" = line feed.
(Outputs
(RS232
({Listb} {bool})
)
These commands determine what is included in the (Data output record
(Freq {float}) ) (Labels {bool}) (DiagRec {bool}) (EOL {"hex code(s)"})
(ENet
({Listb} {bool})
)
(Freq {float}) (Split {30 | 60 |
90 }
(Logging
({Listb} {bool})
)
a. Auxiliary Outputs: { NONE | CO2A | CO2MMOL | H2OA | H2OMMOL | TEMPERATURE | PRESSURE | AUX |
AUX2 | AUX3 | AUX4 | CO2MF | CO2MFD | H2OMF | H2OMFD | DEWPT | SETPOINT}
b. Data Outputs: Ndx | Time | Date | CO2Raw | H2ORaw | DiagVal | CO2D | H2OD | Temp | Pres | Aux | Aux2 | Aux3 | Aux4 | Cooler | CO2MF | CO2MFd | H2OMF | H2OMFd | DewPt | H2OAW | H2OAWO | CO2AW | CO2AWO
(EOL "{hex code(s)"}) End of Line character. Enter hex value in double quotes. Example: (Outputs(RS232(EOL "0D0A”)))lf
would terminate data strings with a carriage return and a line feed.

Configuration Grammar
D-5
(Ndx {bool}) Determines whether an index value is transmitted or not. Example: (Outputs(RS232(Ndx TRUE)))lf
would cause the data stream to contain an index value. The index value is incremented approximately every 6.7 milliseconds (e.g. 150 Hz) and ranges from approximately -2.0E8 to +2.0E8. (DiagRec {bool}) Controls whether independent (Diagnostic) text records are ever sent. If TRUE, operates normally (1/second or on a change). If FALSE, never sends a Diagnostic record. Example: Transmitted: (Outputs(RS232(DiagRec TRUE)))lf Received: (Diagnostics (SYNC TRUE)(PLL TRUE)(DetOK TRUE)(Chopper TRUE)(Path 61))
(DiagVal {bool}) Controls whether or not a 1 byte diagnostic value (0-255) is output (same as SDM diagnostic value) in the (Data stream. "Diag" is used for the label when (Labels TRUE is set. Example: Transmitted: (Outputs(RS232(DiagVal TRUE)))lf Received: (Data... (Diag 249...)) NOTE: The (DiagRec and the (DiagVal are two separate outputs and are independent of one another. (Labels {bool}) This command controls whether or not data labels are transmitted with the data stream. Default is TRUE, and this means that data are transmitted in the normal (Data) format record. When (Labels FALSE), however, data output are values only and are tab-delimited. To maximize available bandwidth, when (Labels FALSE), a data record might appear as
15.1234<tab>354.123<tab>101.3<tab>249<eol>

Configuration Grammar
D-6
The following are several examples of data formatting. The command string sent to the LI-7500A is terminated with a line feed character. EXAMPLE (Labels TRUE) Data format Transmitted to LI-7500A (Outputs(RS232(Freq 1)(EOL "0D0A")(Ndx TRUE)(DiagRec
FALSE)(DiagVal TRUE)(Labels TRUE)))lf
Received from LI-7500A (Data (Ndx 1545)(DiagVal 250)(CO2Raw 1.5386712e-1)(CO2D
3.2183277e1)(H2ORaw 3.57
75542e-2)(H2OD 1.9687008e2)(Temp 2.4227569e1)(Pres
9.8640356e1)(Aux 0)(Cooler 1.5756724))
(Data (Ndx 1809)(DiagVal 250)(CO2Raw 1.5380490e-1)(CO2D
3.2162146e1)(H2ORaw 3.57
57541e-2)(H2OD 1.9677452e2)(Temp 2.4227569e1)(Pres
9.8543587e1)(Aux 0)(Cooler 1.5750400))
EXAMPLE (Labels FALSE) Data format Notice how this format is much cleaner and reduces the overhead of redundant label transmissions. The data selected for output data record is accomplished with the (Outputs(RS232(CO2Raw TRUE)...))command. Transmitted to LI-7500A (Outputs(RS232(Freq 1)(EOL "0D0A")(Ndx TRUE)(DiagRec
FALSE)(DiagVal TRUE)(Labels FALSE)))lf
Received from LI-7500A 252 250 0.15401 32.2167 0.03569 196.703 24.33 98.6 0
1.5730
511 250 0.15404 32.2174 0.03572 196.816 24.42 98.5 0
1.5683
765 250 0.15402 32.2342 0.03579 196.995 24.49 98.6 0
1.5703
1033 250 0.15400 32.2097 0.03571 196.771 24.63 98.5 0
1.5724
1288 250 0.15405 32.2341 0.03578 196.838 24.76 98.5 0
1.5734
1544 250 0.15406 32.2385 0.03575 196.782 24.72 98.5 0
1.5724

Configuration Grammar
D-7
Examples: 1. To set the LI-7500A to output only CO2 and H2O molar densities once
every 2 seconds:
(Outputs(RS232(Freq .5)(Pres FALSE)(Temp FALSE)(Aux
FALSE)(CO2Raw FALSE)(CO2D TRUE)(H2ORaw FALSE)(H2OD
TRUE)(Cooler FALSE)))
2. To configure DAC #1 to output CO2 mole density with this scaling: 0V
= 12 mmol m-3, and 5V = 15 mmol m-3.
(Outputs(Dac1(Source CO2MMOL)(Zero 12)(Full 15))) Data and Status Records
The (Data..) and (Diagnostics..) records are the vehicles with which the LI-7500A outputs data through its RS-232 port. The frequency with which it outputs (Data..) records is determined by the (Outputs(RS232(Freq..))) command, shown in Table 1. Data and status record formats are determined by the (Outputs(RS232 (boolean controlled command structure. (EOL {"hex codes"}) and (Labels {boolean}) determine the termination characters and whether or not (Data labels are output.
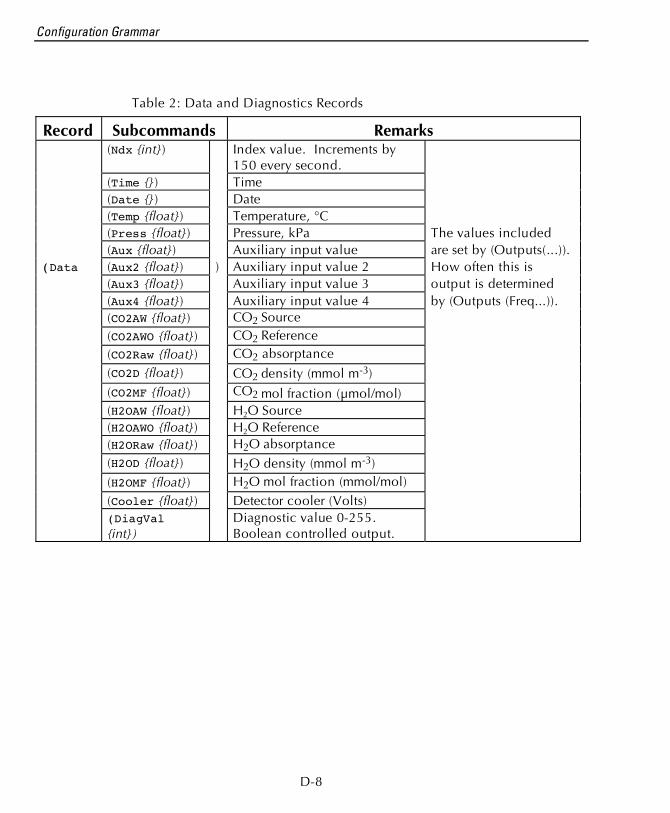
Configuration Grammar
D-8
Table 2: Data and Diagnostics Records
Record Subcommands Remarks (Ndx {int}) Index value. Increments by
150 every second.
(Time {}) Time (Date {}) Date (Temp {float}) Temperature, °C (Press {float}) Pressure, kPa The values included (Aux {float}) Auxiliary input value are set by (Outputs(...)). (Data (Aux2 {float}) ) Auxiliary input value 2 How often this is (Aux3 {float}) Auxiliary input value 3 output is determined (Aux4 {float}) Auxiliary input value 4 by (Outputs (Freq...)). (CO2AW {float}) CO2 Source (CO2AWO {float}) CO2 Reference (CO2Raw {float}) CO2 absorptance (CO2D {float}) CO2 density (mmol m-3)
(CO2MF {float}) CO2 mol fraction (μmol/mol) (H2OAW {float}) H2O Source (H2OAWO {float}) H2O Reference (H2ORaw {float}) H2O absorptance (H2OD {float}) H2O density (mmol m-3)
(H2OMF {float}) H2O mol fraction (mmol/mol) (Cooler {float}) Detector cooler (Volts) (DiagVal
{int}) Diagnostic value 0-255. Boolean controlled output.

Configuration Grammar
D-9
Record Subcommands Remarks (PLL {bool}) Phase lock loop
status
(DetOK {bool}) Detector temperature con-trol
(Diagnostics (Chopper {bool}) ) Chopper temperature con-trol
Diagnostics are always output at 1 Hz
(Path {float}) The AGC value in % (0-100)
(Ack (Received TRUE) Sent by the LI-7500A to aknowledge any incoming command.
(Val {float}) ) Only sent after zeroing and spanning commands. Contains the new, computed value of zero or span.
(Error (Received TRUE)) Sent by the LI-7500A when it cannot parse or recognize a command.
(EmbeddedSW
(Version {string}) Embedded software version
(Model {string}) ) Instrument model e.g. LI-7500A (DSP {string}) Embedded DSP software version (FPGA {string}) Embedded FPGA software version (Command {start_logging | stop_logging
| eject_usb | factory_reset
})
(Info (USB (Size {float})
(Free {float})
(State {0|1|2|3} )
0: Drive not present
1: Logging
2: Drive present, not logging
3: Error

Configuration Grammar
D-10
Examples: 1. A typical (Data..) output record, with all items present, is shown
below:
(Data (Ndx 215713)(CO2Raw 1.2831902e-1)(CO2D
2.2083146e1)(H2ORaw 5.5372476e-2)(H2OD 3.5485935e2)(Temp
2.5886261e1)(Pres 9.8157062e1)(Aux 0)(Cooler 1.0537354))
2. A typical (Diagnostics..) record is shown below:
(Diagnostics (Sync TRUE)(PLL TRUE)(DetOK TRUE)(Chopper
TRUE)(Path 63))
Data Polling (Software and Hardware) A software command using the ENQ character (0x05) is available to query the LI-7500A for a data record over RS-232. When transmitted to the LI-7500A, via RS-232, the record is built as presently defined (Labels TRUE or FALSE, etc.), and is added to the serial output queue. This software command is normally used when the update frequency is set to zero, as shown in the command below.
(Outputs (RS232 (Freq 0)(DiagRec FALSE)))lf
The LI-7500A also supports toggling of the Clear To Send (CTS) line to request a data record. This hardware polling would be normally used when the update frequency is set to 0 as described above. Since the CTS line is an input, the host software should toggle the Request To Send (RTS) line from the host computer. This method of transmitting a data record occurs when the CTS line goes from low to high. Users familiar with programming RS232 interfaces may already understand that RS-232 logic TRUE (1) is considered a low (or negative) voltage and logic FALSE (0) is considered a high (or positive) voltage. Thus, the CTS toggle sequence would look like:

Configuration Grammar
D-11
+V (logic 0)
-V (logic 1)
0V
~50 µsec Data are updated to RS-232 at 20 Hz. If the CTS line is toggled, record will be output the next time one is ready. The CTS line is pin 7 on the LI-COR RS-232 Cable, part #392-10268. The RS-232 serial pinout from a DB9 connector on an AT style computer is defined as: Pin Signal Description Function Signal at Device 1 DCD Data Carrier Detect Input 2 RD Received Data Input 3 TD Transmit Data Output 4 DTR Data Terminal Ready Output 5 SG Signal Ground 6 DSR Data Set Ready Input 7 RTS Request To Send Output 8 CTS Clear To Send Input 9 RI Ring Indicator Input A possible wiring configuration using the LI-COR RS-232 cable, part #392-10268 to a computer would be: LI-COR CABLE DB9 ON HOST COMPUTER Function PIN Function Ground PIN 5 Ground Receive Data PIN 3 Transmit Data Request To Send PIN 8 Clear To Send Transmit Data PIN 2 Receive Data Clear To Send PIN 7 Request To Send Data Terminal Ready PIN 6 Data Set Ready Note about Embedded Software RS-232 Communication Priorities The RS-232 hardware and software trigger does not tap directly into the same data stream that is output to the DAC's and the SDM. The trigger actually sends a request to the instrument to output a single data record over the RS-232 port. The processing that is incurred to do this is relatively lengthy. The RS-232 task is also a low priority, so considerable latency

Configuration Grammar
D-12
could occur. If you want output data that is tightly synchronized to an input stimulus you should use the SDM output or sample a DAC output based on your trigger; don't use RS-232.
The (Inputs..) Command The (Inputs..) command is used to scale the Auxiliary input channel, and to determine how pressure and temperature are measured by the LI-7500A. Table 3: The Inputs Command
Command Subcommands Remarks (Source { Aux | Measured | UserEntered })
How it is determined
(Pressure
(Temperature
(Val {float})
)
) Fixed value, for “UserEntered”
(Aux (A {float}) Slope
(B {float}) )
Intercept (Aux2 (A {float}) Slope (B {float})
) Intercept
(Aux3 (A {float}) Slope (B {float})
) Intercept
(Aux4 (A {float}) Slope
(Inputs
(B {float}) )
Intercept Examples: 1. To make pressure fixed at 92 kPa, send this:
(Inputs(Pressure(Source UserEntered)(Val 92)))
2. To measure temperature from a linearized thermistor connected to the Auxiliary input, where 0 volts is 0 °C, and 5 volts is 50 °C, send this:
(Inputs(Aux(A 10)(B 0))(Temperature(Source Aux)))
3. To measure pressure and temperature normally, using the built-in
sensors, send this:
(Inputs(Pressure(Source Measured))(Temperature(Source
Measured)))

Configuration Grammar
D-13
The (Calibrate..) and (Coeffs..) Commands
The (Calibrate..) and (Coeffs..) commands control zeroing, spanning, and factory calibration coefficients. The (Date subcommand must be present, and (Val must be absent to perform (ZeroH2O and (ZeroCO2. For (SpanCO2 and (SpanH2O, (Date and (TDensity must be present, and (Val must be absent to trigger a calibration. Table 4: Calibration Commands
Command Subcommands Remark (Val {float}) For setting the zero directly.
If not present will trigger a calibration.
(ZeroH2O
(ZeroCO2 (Date {quoted string})
) The date field triggers the LI-7500A to do a zero immedi-ately. The new value will be returned in an (Ack..) record.
(Calibrate (Val {float}) For setting the span directly. If not present will trigger a calibration.
(SpanCO2
(Span2CO2
(SpanH2O
(Span2H2O
(Target {float}) ) Target value in ppm for CO2, or °C for H2O (for reference purposes).
(TDensity {float}) ) Target value in mmol m-3. (For computational purposes).
(Date {quoted string})

Configuration Grammar
D-14
Command Subcommands Remark (SerialNo {quoted string}) The 75H-xxxx head
number. (Band (A {float})) The band broadening
coefficient (1.15 for the LI-7500A).
(A {float}) (B {float}) (C {float}) (CO2 (D {float}) ) (Coeffs (Current (E {float}) ) These values are found
on the LI-7500A’s (XS {float}) calibration sheet. (Z {float}) (A {float}) (B {float}) (H2O (C {float}) ) (XS {float}) (Z {float}) (Pressure (A0 {float}) (A1
{float})
Examples: 1. To set the CO2 zero right now (with the calibration tube in place and
CO2-free gas flowing though it, of course), send this:
(Calibrate(ZeroCO2(Date “11 Aug 1999 at 2:15”)))
Note 1: The data value can be any string, so “My Birthday” is equally valid. Note 2: The new value of zero will be sent in the next (Ack(Val..)) record. (See Table 2).
2. To force the H2O channel to use the value 0.96 for its zero, send this:
(Calibrate(ZeroH2O(Val 0.96)))

Configuration Grammar
D-15
3. To make the LI-7500A set its CO2 span right now, with 400 μmol mol-1
flowing through the calibration tube, first compute the target density using Equation 2-24 (solved for C). If the temperature is 23°C, and the pressure 98kPa, then the mode density is 15.92 mmol CO2 m-3. Then
send the following:
(Calibrate(SpanCO2(Target 400)(TDensity 15.92)(Date “3 June
2000”)))
The Program Reset Command
(Program(Reset TRUE)) is the equivalent of pressing the reset button on the main board. It is generally only used to access lower level software for updating the embedded program, or when the instrument is not responding normally. Table 5: Synchronization Commands
Command Remarks
(Program (Reset TRUE)) Sending this will force the software to reset. This is equivalent to pressing the reset button on the LI-7550 inside panel.
The Network Command
Table 6: Network Commands
Command Subcommands Remarks (Name {{string}) Hostname
(Type {dhcp | static} Address
type:
dhcp |
static
(Address {xxx.xxx.xxx.xxx})
(Netmask {xxx.xxx.xxx.xxx})
(Gateway {xxx.xxx.xxx.xxx})
(Network (IP
(MAC {xx:xx:xx:xx:xx:xx})
) )

Configuration Grammar
D-16
The Query Command The Query (?) command is used to query the LI-7500A for any configuration parameter individually, as well as any node in the configuration tree. Table 7: Query Commands
Command Remarks
(Outputs ?)
(Calibrate ?)
(Coef ?)
(Outputs ?)
(Data ?)
(Diagnostics ?)
(EmbeddedSW ?)
(Inputs ?)
(Info ?)
(Network ?)
The query for individual parameters works only for configuration parameters and not data or diagnostic information. All commands are followed by a line feed (lf).
Examples: The query (Outputs(RS232(Freq ?)))lf would respond:
(Outputs (RS232 (Freq 5))) whereas the query (Calibrate ?)lf causes a Calibrate record to be put in the output queue. Example Response: (Calibrate (ZeroCO2 (Val 0.8945)(Date 26 08 2009
10:37))(SpanCO2 (Val 1.0068)(Target 597.2)(Tdensity
23.154)(Date 26 08 2009 11:00))(Span2CO2 (Val 0.0)(Target
)(Tdensity )(ic 0.106207)(act 0.105489)(Date 4Cal))(ZeroH2O
(Val 0.791075)(Date 26 08 2009 11:20))(SpanH2O (Val
1.00585)(Target 12.00)(Tdensity 447.421)(Date 26 08 2009
11:37))(Span2H2O (Val 0.0)(Target )(Tdensity )(iw 0.059434)(awt
0.0590885)(Date 4Cal)))
(Coef ?)lf causes a Coefficients record to be put in the output queue. Example Response:

Configuration Grammar
D-17
(Coef (Current (SerialNo 75H-Beta6)(Band (A 1.15))(CO2 (A
1.56704E+2)(B 2.15457E+4)(C 4.33894E+7)(D -1.24699E+10)(E
1.75102E+12)(XS 0.0023)(Z 0.0002)
)(H2O (A 5.24232E+3)(B 3.91896E+6)(C -2.33026E+8)(XS -0.0009)(Z
0.0185))(Pressure (A0 56.129)(A1 15.250))(DPressure (A0 1.0)(A1
0.0))))
(Outputs ?)lf causes a Outputs record to be put in the output queue. Example Response: (Outputs (BW 10)(Delay 0)(SDM (Address 7))(Dac1 (Source
NONE)(Zero -5e-2)(Full 4
e-1))(Dac2 (Source PRESSURE)(Zero -1e-1)(Full 4e-1))(RS232
(Baud 38400)(Freq 0)(
Pres TRUE)(Temp TRUE)(Aux TRUE)(Cooler TRUE)(CO2Raw TRUE)(CO2D
TRUE)(H2ORaw TRUE
)(H2OD TRUE)(Ndx TRUE)(DiagVal TRUE)(DiagRec FALSE)(Labels
FALSE)(EOL "0D0A")))
(Data ?)lf causes a Data record to be put in the output queue. (Note that an ENQ (0x05) will do the same thing...) Example Response: (Data (Ndx 2471)(DiagVal 250)(CO2Raw 1.6319131e-1)(CO2D
3.5119712e1)(H2ORaw 3.16
72954e-2)(H2OD 1.7067077e2)(Temp 2.3874512e1)(Pres
9.8735609e1)(Aux 0)(Cooler 1.
5630015))
(Diagnostics ?)lf causes a Diagnostics record to be put in the output queue. Example Response: (Diagnostics (SYNC TRUE)(PLL TRUE)(DetOK TRUE)(Chopper
TRUE)(Path 65))
(EmbeddedSW ?)lf causes an EmbeddedSW record to be put in the output queue. Example Response: (EmbeddedSW (Version 0.0.54a)(Model LI-7500A Open Path CO2/H2O
Analyzer)(DSP 0.8.0)(FPGA 0.1.2)) (Inputs ?)lf causes an Inputs record to be put in the output queue.

Configuration Grammar
D-18
Example Response: (Inputs (Pressure (Source Measured)(UserVal
9.8000002e1))(Temperature (Source Measured)(UserVal
2.5000000e1))(Aux (A 1)(B 0)))
The Connection Protocol Introduction The purpose of this section is to describe the protocol used to establish communications with the LI-7500A when it is operating in an “unknown” mode. That is, when the baud rate is not known, nor are any other details about the instrument’s configuration. Note: For simple data collection, the LI-7500A can be configured with the LI-7500A Windows software program, and you will not have to deal with this protocol at all. If you wish to write your own interface program or driver for the LI-7500A, and you wish to get the LI-7500A to send its configuration to you, then this protocol must be used. Establishing Communications: Step by Step 1. Set a break condition on the RS-232 line. 500 ms should be sufficient. 2. The LI-7500A will cease normal activity, change its baud rate to 9600
baud, and begin to send ascii ENQ characters (decimal 05) at a rate of 2 Hz for up to 10 seconds. Before 10 seconds are up, the host should:
3. Send an ascii ACK character (decimal 06) to the LI-7500A. 4. Upon receipt of an ACK, the LI-7500A will output its current
configuration, terminated with a line feed (decimal 10). A sample configuration is shown below. After this is sent, the LI-7500A will resume its normal operation, except it will remain at 9600 baud.
5. The host can then send the desired configuration changes, if any, to the
LI-7500A. If the configuration change involves a baud rate change, the LI-7500A will send its (Ack..) record before changing baud rates.

Warranty
Each LI-COR, inc. instrument is warranted by LI-COR, inc. to be free from defects in material and workmanship; however, LI-COR, inc.'s sole obligation under this warranty shall be to repair or replace any part of the instrument which LI-COR, inc.'s examination discloses to have been defective in material or workmanship without charge and only under the following conditions, which are:
1. The defects are called to the attention of LI-COR, inc. in Lincoln, Nebraska, in writing within one year after the shipping date of the instrument. 2. The instrument has not been maintained, repaired, or altered by anyone who was not approved by LI-COR, inc. 3. The instrument was used in the normal, proper, and ordinary manner and has not been abused, altered, misused, neglected, involved in an accident or damaged by act of God or other casualty. 4. The purchaser, whether it is a DISTRIBUTOR or direct customer of LI-COR or a DISTRIBUTOR'S customer, packs and ships or delivers the instrument to LI-COR, inc. at LI-COR inc.'s factory in Lincoln, Nebraska, U.S.A. within 30 days after LI-COR, inc. has received written notice of the defect. Unless other arrangements have been made in writing, transportation to LI-COR, inc. (by air unless otherwise authorized by LI-COR, inc.) is at customer expense. 5. No-charge repair parts may be sent at LI-COR, inc.'s sole discretion to the purchaser for installation by purchaser. 6. LI-COR, inc.'s liability is limited to repair or replace any part of the instrument without charge if LI-COR, inc.'s examination disclosed that part to have been defective in material or workmanship.
There are no warranties, express or implied, including but not limited to any implied warranty of merchantability or fitness for a particular purpose on underwater cables or on expendables such as batteries, lamps, thermocouples and calibrations.
Other than the obligation of LI-COR, inc. expressly set forth herein, LI-COR, inc. disclaims all warranties of merchantability or fitness for a particular purpose. The foregoing constitutes LI-COR, inc.'s sole obligation and liability with respect to damages resulting from the use or performance of the instrument and in no event shall LI-COR, inc. or its representatives be liable for damages beyond the price paid for the instrument, or for direct, incidental or consequential damages.
The laws of some locations may not allow the exclusion or limitation on implied warranties or on incidental or consequential damages, so the limitations herein may not apply directly. This

warranty gives you specific legal rights, and you may already have other rights which vary from location to location. All warranties that apply, whether included by this contract or by law, are limited to the time period of this warranty which is a twelve-month period commencing from the date the instrument is shipped to a user who is a customer or eighteen months from the date of shipment to LI-COR, inc.'s authorized distributor, whichever is earlier.
This warranty supersedes all warranties for products purchased prior to June 1, 1984, unless this warranty is later superseded.
DISTRIBUTOR or the DISTRIBUTOR'S customers may ship the instruments directly to LI-COR if they are unable to repair the instrument themselves even though the DISTRIBUTOR has been approved for making such repairs and has agreed with the customer to make such repairs as covered by this limited warranty.
Further information concerning this warranty may be obtained by writing or telephoning Warranty manager at LI-COR, inc.
IMPORTANT: Please return the User Registration Card enclosed with your shipment so that we have an accurate record of your address. Thank you.

Measuring Change in a Changing World™
984-10563
LI-COR inc. ● 4421 Superior Street ● Lincoln, NE 68504 USA402-467-3576 ● 1-800-447-3576 (U.S. & Canada) ● FAX: 402-467-2819www.licor.com ● [email protected] ● [email protected]


![High Frequency Transformer Linked Converters For Photovoltaic Applications Q Li [Thesis]](https://img.pdfslide.us/doc/110x75/613c669ff237e1331c515435/high-frequency-transformer-linked-converters-for-photovoltaic-applications-q-li.jpg)