Embed Size (px)
Citation preview
Alaska Hawaii
AAAAAAAAAAAA
0.0
0.1
0.2
0.3 - 0.6
0.7 - 4.6
No SS Couples with African-American Partner 1
No Households with African-American Partner 1
AAAAAA
Same-sex Couples with an African-American Householder per 1,000 Households
by county (adjusted)
SOURCE: U.S. Census 2010 data (adjusted, see Data and Methodology section)
1
No Couples w/ African-American HouseholderNo SS Couples w/ African-American Householder
Key Findings Overall, how African-American same-sex couples fare compared to their di!erent-sex counterparts varies signi"cantly depending on the gender of the couple and whether the couple is raising children.
34% of African-American same-sex couples are raising children. African-American same-sex couples raising children report household median incomes $15,000 lower than comparable African-American di!erent-sex couples ($47,300 vs. $63,020).
African-American female same-sex couples report household median incomes $20,000 less than African-American male same-sex couples ($51,000 vs. $72,000).
LGBT African-Americans have higher rates of unemployment compared to non-LGBT African-Americans (15% vs. 12%).
23% of LGBT African-Americans have completed a college degree or more, compared to 26% of non-LGBT African-Americans.
African-American same-sex couples are less likely than their di!erent-sex counterparts to have health insurance coverage for both partners (63% vs. 79%).
Notably, 58% of African-American same-sex couples are female.
Female African-American individuals in same-sex couples are three times more likely to report veteran status than those in di!erent-sex couples (9% vs. 3%). About 1 in 7 male African-American individuals in same-sex couples have served in the military compared to 1 in 4 male African-American individuals in di!erent-sex couples (13% vs. 25%).
OverviewThis report uses the best available data to provide a population estimate of LGBT African-Americans and African-American same-sex (SS) couples in the United States, along with a general overview of their socioeconomic and demographic characteristics.
33.9%of African-American Same-sex
Couples Raising Children
Geographic DistributionAfrican-American individuals in same-sex couples tend to live in areas where there are higher proportions of African-Americans, as opposed to areas with higher proportions of the broader LGB population. More than 1/4 of African-American same-sex couples live in Georgia, New York, Maryland and North Carolina.
The county-level maps use U.S. Census 2010 data measuring same-sex couples. The Census data describe both di!erent-sex (DS) and same-sex (SS) couples by the race or ethnicity of the “householder,” who was Person 1 on the Census form. Person 1 is usually the person in whose name the home is either owned or rented. Appendix A contains a detailed description of who is included in each section of this snapshot report, along with additional information on how to understand the map key.
84,000African-American Individuals in
Same-sex Couples in the U.S.
3.7%of African-American Adults
Identify as LGBT
1,018,700Estimated LGBT African-American
Adults in the U.S.
Alaska Hawaii
<1%
1%
2%
3% - 4%
5% - 9%
No Households with African-American Partner 1
No SS Couples with African-American Partner 1
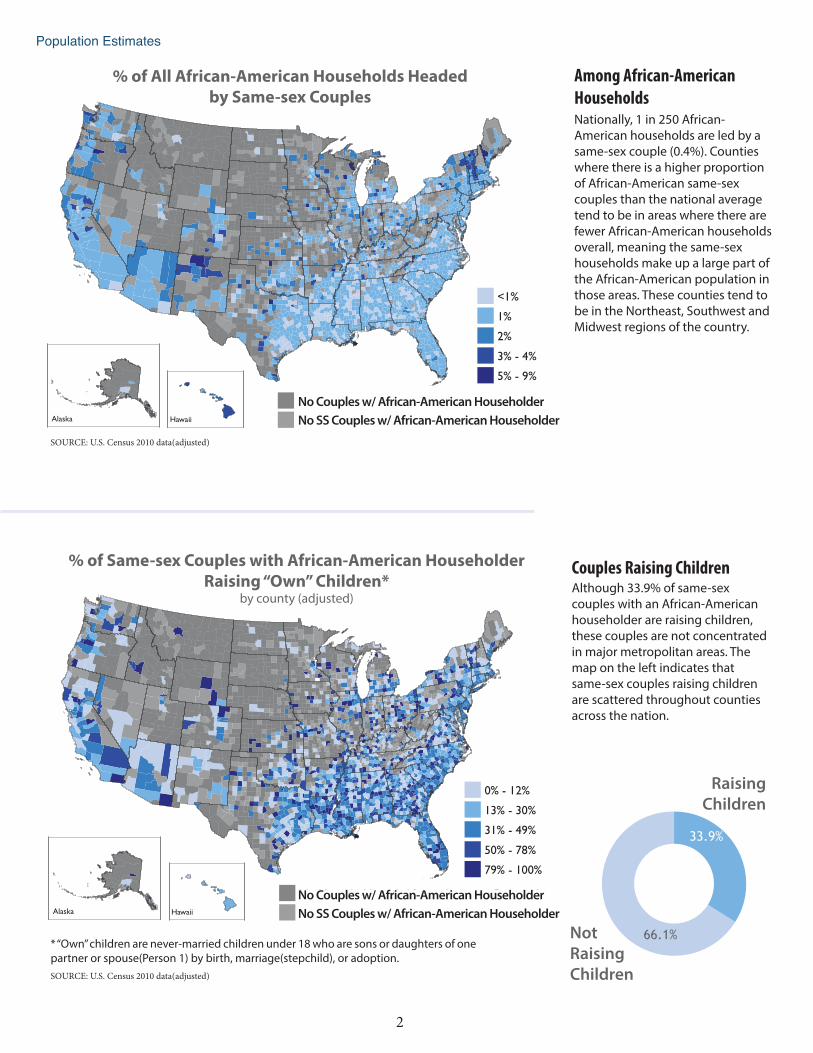
% of All African-American Households Headed by Same-sex Couples
SOURCE: U.S. Census 2010 data(adjusted)
Alaska Hawaii
0% - 12%
13% - 30%
31% - 49%
50% - 78%
79% - 100%
No Households with African-American Partner 1
No SS Couples with African-American Partner 1
* “Own” children are never-married children under 18 who are sons or daughters of one partner or spouse(Person 1) by birth, marriage(stepchild), or adoption.
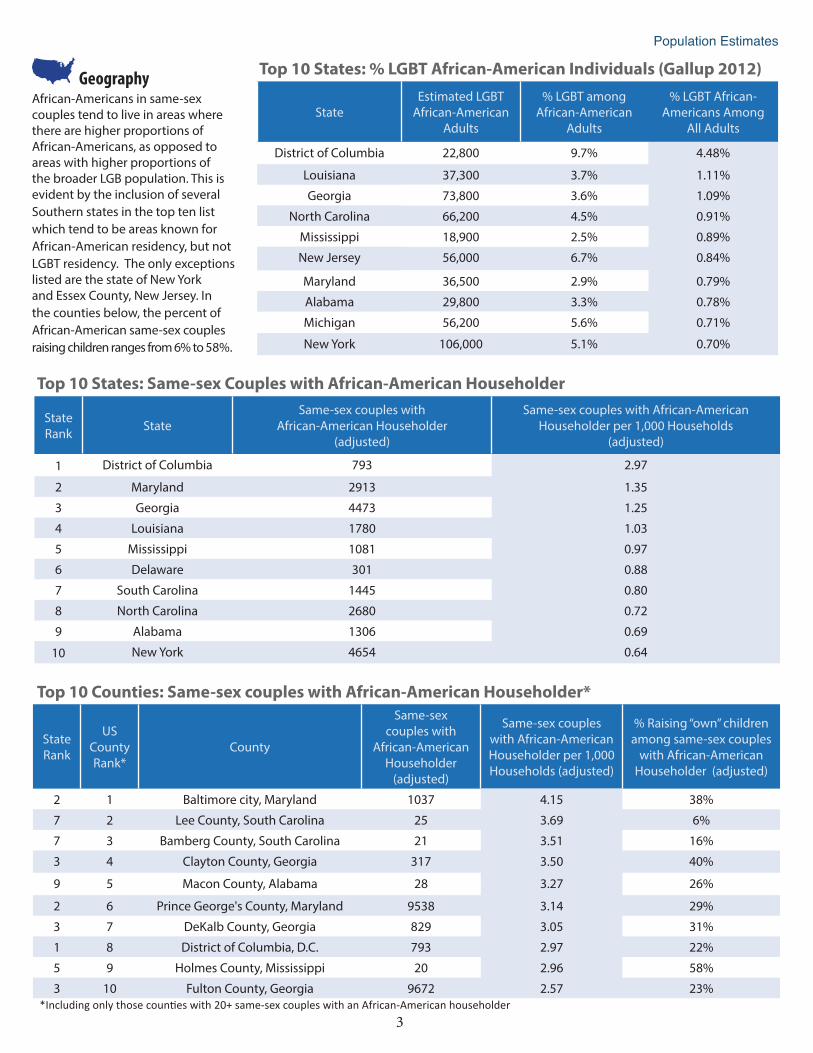
% of Same-sex Couples with African-American Householder Raising “Own” Children*
by county (adjusted)
SOURCE: U.S. Census 2010 data(adjusted)
2
No Couples w/ African-American HouseholderNo SS Couples w/ African-American Householder
No Couples w/ African-American HouseholderNo SS Couples w/ African-American Householder
Couples Raising Children Although 33.9% of same-sex couples with an African-American householder are raising children, these couples are not concentrated in major metropolitan areas. The map on the left indicates that same-sex couples raising children are scattered throughout counties across the nation.
Among African-American Households Nationally, 1 in 250 African-American households are led by a same-sex couple (0.4%). Counties where there is a higher proportion of African-American same-sex couples than the national average tend to be in areas where there are fewer African-American households overall, meaning the same-sex households make up a large part of the African-American population in those areas. These counties tend to be in the Northeast, Southwest and Midwest regions of the country.
Population Estimates
33.9%
66.1%
Raising Children
Not Raising Children
Top 10 Counties: Same-sex couples with African-American Householder*
3
Top 10 States: % LGBT African-American Individuals (Gallup 2012)
StateEstimated LGBT
African-American Adults
% LGBT among African-American
Adults
% LGBT African-Americans Among
All Adults
District of Columbia 22,800 9.7% 4.48%
Louisiana 37,300 3.7% 1.11%Georgia 73,800 3.6% 1.09%
North Carolina 66,200 4.5% 0.91%Mississippi 18,900 2.5% 0.89%New Jersey 56,000 6.7% 0.84%
Maryland 36,500 2.9% 0.79%Alabama 29,800 3.3% 0.78%Michigan 56,200 5.6% 0.71%
New York 106,000 5.1% 0.70%
GeographyAfrican-Americans in same-sex couples tend to live in areas where there are higher proportions of African-Americans, as opposed to areas with higher proportions of the broader LGB population. This is evident by the inclusion of several Southern states in the top ten list which tend to be areas known for African-American residency, but not LGBT residency. The only exceptions listed are the state of New York and Essex County, New Jersey. In the counties below, the percent of African-American same-sex couples raising children ranges from 6% to 58%.
Top 10 States: Same-sex Couples with African-American Householder
State Rank State
Same-sex couples with African-American Householder
(adjusted)
Same-sex couples with African-American Householder per 1,000 Households
(adjusted)
1 District of Columbia 793 2.97
2 Maryland 2913 1.353 Georgia 4473 1.254 Louisiana 1780 1.035 Mississippi 1081 0.976 Delaware 301 0.887 South Carolina 1445 0.808 North Carolina 2680 0.729 Alabama 1306 0.69
10 New York 4654 0.64
State Rank
US County Rank*
County
Same-sex couples with
African-American Householder
(adjusted)
Same-sex couples with African-American Householder per 1,000 Households (adjusted)
% Raising “own” children among same-sex couples
with African-American Householder (adjusted)
2 1 Baltimore city, Maryland 1037 4.15 38%7 2 Lee County, South Carolina 25 3.69 6%7 3 Bamberg County, South Carolina 21 3.51 16%3 4 Clayton County, Georgia 317 3.50 40%
9 5 Macon County, Alabama 28 3.27 26%
2 6 Prince George's County, Maryland 9538 3.14 29%3 7 DeKalb County, Georgia 829 3.05 31%1 8 District of Columbia, D.C. 793 2.97 22%5 9 Holmes County, Mississippi 20 2.96 58%3 10 Fulton County, Georgia 9672 2.57 23%
Population Estimates
Characteristics of African-American Individuals
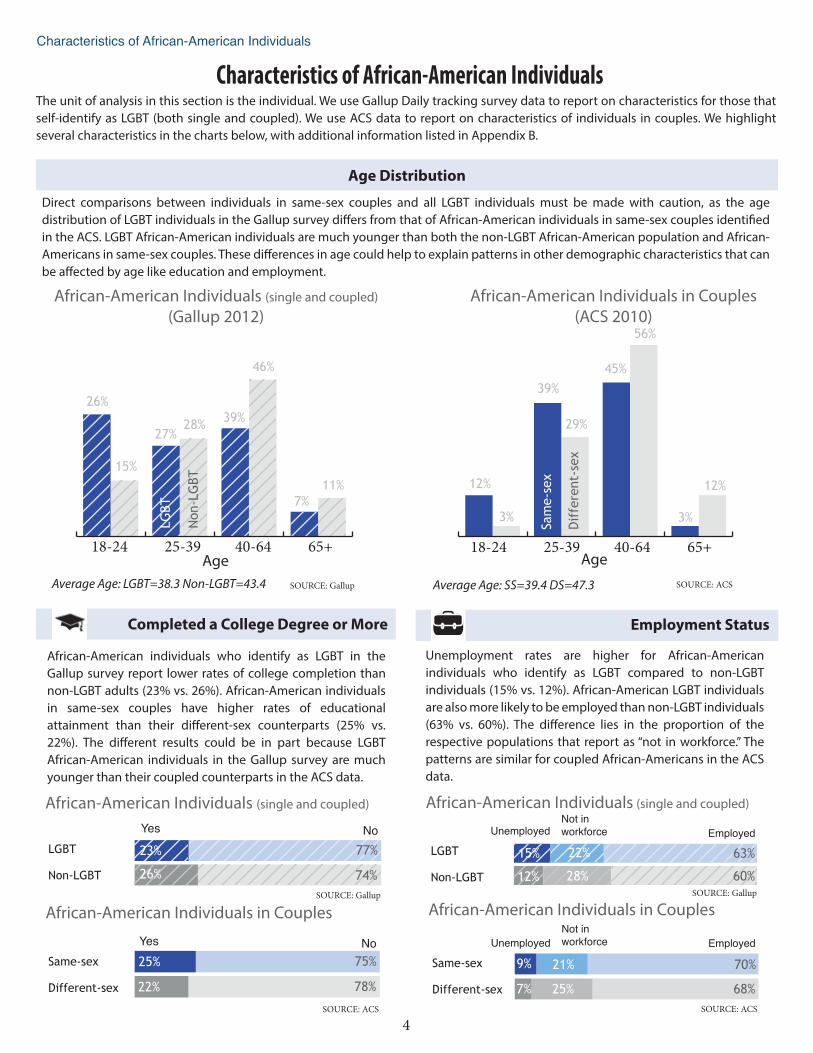
Age DistributionDirect comparisons between individuals in same-sex couples and all LGBT individuals must be made with caution, as the age distribution of LGBT individuals in the Gallup survey di!ers from that of African-American individuals in same-sex couples identi"ed in the ACS. LGBT African-American individuals are much younger than both the non-LGBT African-American population and African-Americans in same-sex couples. These di!erences in age could help to explain patterns in other demographic characteristics that can be a!ected by age like education and employment.
African-American individuals who identify as LGBT in the Gallup survey report lower rates of college completion than non-LGBT adults (23% vs. 26%). African-American individuals in same-sex couples have higher rates of educational attainment than their di!erent-sex counterparts (25% vs. 22%). The di!erent results could be in part because LGBT African-American individuals in the Gallup survey are much younger than their coupled counterparts in the ACS data.
Completed a College Degree or More
4
Characteristics of African-American Individuals
Employment Status
Unemployment rates are higher for African-American individuals who identify as LGBT compared to non-LGBT individuals (15% vs. 12%). African-American LGBT individuals are also more likely to be employed than non-LGBT individuals (63% vs. 60%). The di!erence lies in the proportion of the respective populations that report as “not in workforce.” The patterns are similar for coupled African-Americans in the ACS data.
SOURCE: ACS
Same-sex
Different-sex
9% 21% 70%
7% 25% 68%
African-American Individuals in Couples
The unit of analysis in this section is the individual. We use Gallup Daily tracking survey data to report on characteristics for those that self-identify as LGBT (both single and coupled). We use ACS data to report on characteristics of individuals in couples. We highlight several characteristics in the charts below, with additional information listed in Appendix B.
Same-sex
Different-sex
25% 75%
22% 78%
African-American Individuals in Couples
SOURCE: ACS
Yes No
LGBT
Non-LGBT
African-American Individuals (single and coupled)
23% 77%
74%26%
SOURCE: Gallup
Yes No
Not in workforce EmployedUnemployed
African-American Individuals in Couples (ACS 2010)
18-24 25-39 40-64 65+
Average Age: SS=39.4 DS=47.3 SOURCE: ACS
Age
12%
3%
39%
29%
45%
56%
3%
12%
African-American Individuals (single and coupled)(Gallup 2012)
18-24 25-39 40-64 65+
Average Age: LGBT=38.3 Non-LGBT=43.4 SOURCE: Gallup
Age
27%28%
39%
46%
7%
11%
26%
15%
African-American Individuals (single and coupled)
LGBT
Non-LGBT
54% 31%
78% 13%
SOURCE: Gallup
15% 22% 63%
12% 28% 60%
Not in workforce EmployedUnemployed
LG
BT
Non-L
GBT
Sam
e-s
ex
Dif
ferent-s
ex
Median Individual Income
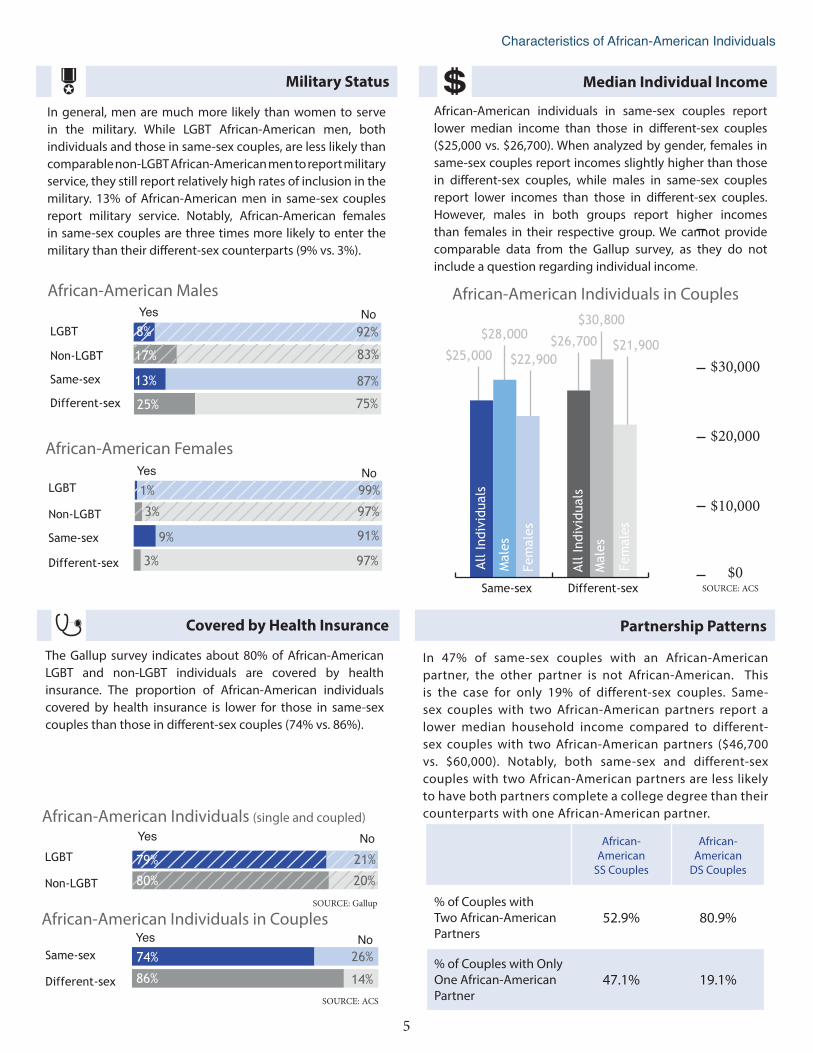
African-American individuals in same-sex couples report lower median income than those in di!erent-sex couples ($25,000 vs. $26,700). When analyzed by gender, females in same-sex couples report incomes slightly higher than those in di!erent-sex couples, while males in same-sex couples report lower incomes than those in di!erent-sex couples. However, males in both groups report higher incomes than females in their respective group. We cannot provide comparable data from the Gallup survey, as they do not include a question regarding individual income.
$40,000
$30,000
$20,000
$10,000
$0
African-American Individuals in Couples
SOURCE: ACS
$28,000
$25,000 $22,900
$30,800
$26,700 $21,900
Partnership Patterns
In 47% of same-sex couples with an African-American partner, the other partner is not African-American. This is the case for only 19% of different-sex couples. Same-sex couples with two African-American partners report a lower median household income compared to different-sex couples with two African-American partners ($46,700 vs. $60,000). Notably, both same-sex and different-sex couples with two African-American partners are less likely to have both partners complete a college degree than their counterparts with one African-American partner.
African-American
SS Couples
African-American
DS Couples
% of Couples with Two African-American Partners
52.9% 80.9%
% of Couples with Only One African-American Partner
47.1% 19.1%
In general, men are much more likely than women to serve in the military. While LGBT African-American men, both individuals and those in same-sex couples, are less likely than comparable non-LGBT African-American men to report military service, they still report relatively high rates of inclusion in the military. 13% of African-American men in same-sex couples report military service. Notably, African-American females in same-sex couples are three times more likely to enter the military than their di!erent-sex counterparts (9% vs. 3%).
Military Status
Same-sex Different-sex
5
LGBT
Non-LGBT
Same-sex
Different-sex
8% 92%
17% 83%
African-American MalesYes No
13% 87%
25% 75%
LGBT
Non-LGBT
Same-sex
Different-sex
African-American Females
9% 91%
Yes No
97%3%
91%9%
97%3%
99%1%
Male
s
Characteristics of African-American Individuals
SOURCE: ACS
Same-sex
Different-sex
74% 26%
86% 14%
Covered by Health Insurance
African-American Individuals in Couples
The Gallup survey indicates about 80% of African-American LGBT and non-LGBT individuals are covered by health insurance. The proportion of African-American individuals covered by health insurance is lower for those in same-sex couples than those in di!erent-sex couples (74% vs. 86%).
Yes No
All Indiv
iduals
Fem
ale
s
All Indiv
iduals
Male
s
Fem
ale
s
LGBT
Non-LGBT
African-American Individuals (single and coupled)
79% 21%
20%80%
SOURCE: Gallup
Yes No
ConclusionOverall, how African-American same-sex couples fare compared to their di!erent-sex counterparts varies signi"cantly depending on the gender of the couple and whether the couple is raising children. Female couples and couples raising children are struggling economically, with couples raising children also reporting lower rates of social characteristics that may ultimately a!ect their families, such as insurance coverage for both partners. While overall higher unemployment rates and lower rates of insurance coverage are cause for concern, there are areas where African-American same-sex couples are faring better than their di!erent-sex counterparts. African-American same-sex couples report higher rates of educational attainment and higher rates of employment.
6
Characteristics of African-American Couples
Characteristics of African-American Couples
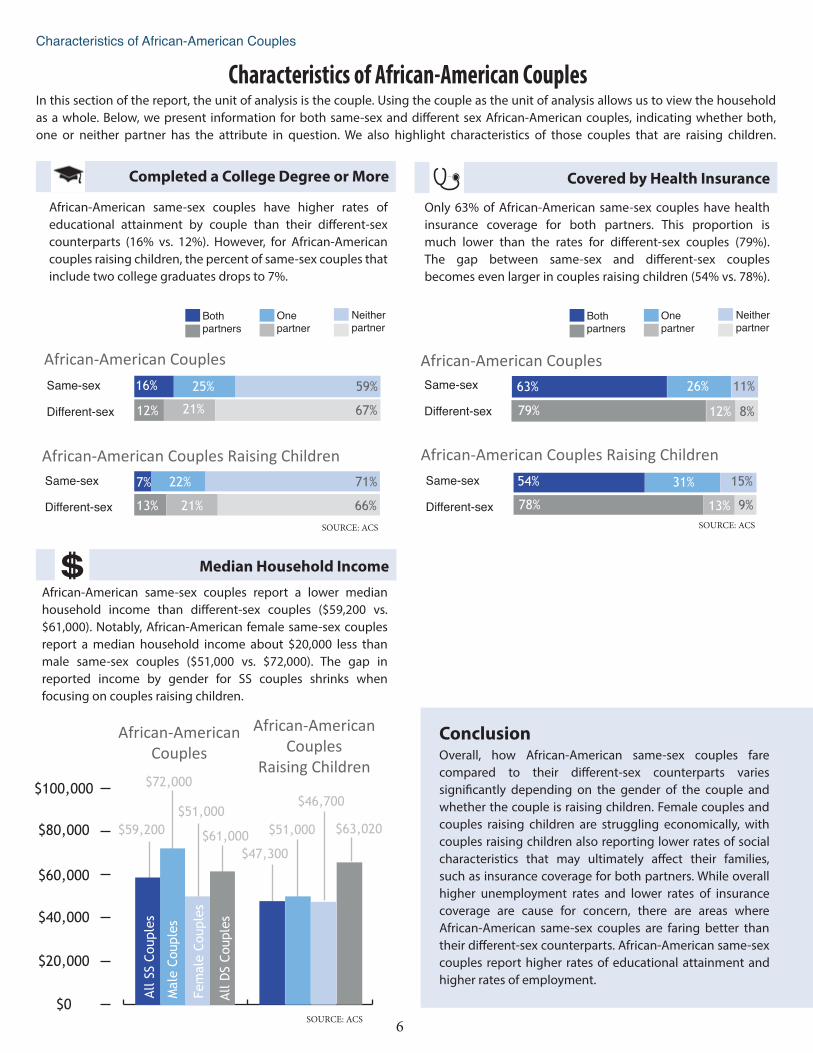
African-American same-sex couples have higher rates of educational attainment by couple than their di!erent-sex counterparts (16% vs. 12%). However, for African-American couples raising children, the percent of same-sex couples that include two college graduates drops to 7%.
SOURCE: ACS
Completed a College Degree or More
Same-sex
Different-sex
16% 25% 59%
12% 21% 67%
Same-sex
Different-sex
7% 22% 71%
66%21%13%
SOURCE: ACS
Same-sex
Different-sex
63% 26% 11%
79% 12% 8%
Covered by Health Insurance
Only 63% of African-American same-sex couples have health insurance coverage for both partners. This proportion is much lower than the rates for di!erent-sex couples (79%). The gap between same-sex and di!erent-sex couples becomes even larger in couples raising children (54% vs. 78%).
Same-sex
Different-sex
54% 31%
78% 13%
15%
9%
Median Household IncomeAfrican-American same-sex couples report a lower median household income than di!erent-sex couples ($59,200 vs. $61,000). Notably, African-American female same-sex couples report a median household income about $20,000 less than male same-sex couples ($51,000 vs. $72,000). The gap in reported income by gender for SS couples shrinks when focusing on couples raising children.
All S
S C
ouple
s
Male
Couple
s
Fem
ale
Couple
s
All D
S C
ouple
s
$100,000
$80,000
$60,000
$40,000
$20,000
$0SOURCE: ACS
In this section of the report, the unit of analysis is the couple. Using the couple as the unit of analysis allows us to view the household as a whole. Below, we present information for both same-sex and di!erent sex African-American couples, indicating whether both, one or neither partner has the attribute in question. We also highlight characteristics of those couples that are raising children.
Bothpartners
One partner
Neitherpartner
Bothpartners
One partner
Neitherpartner
$51,000
$72,000
$59,200$61,000
$46,700
$51,000
$47,300
$63,020
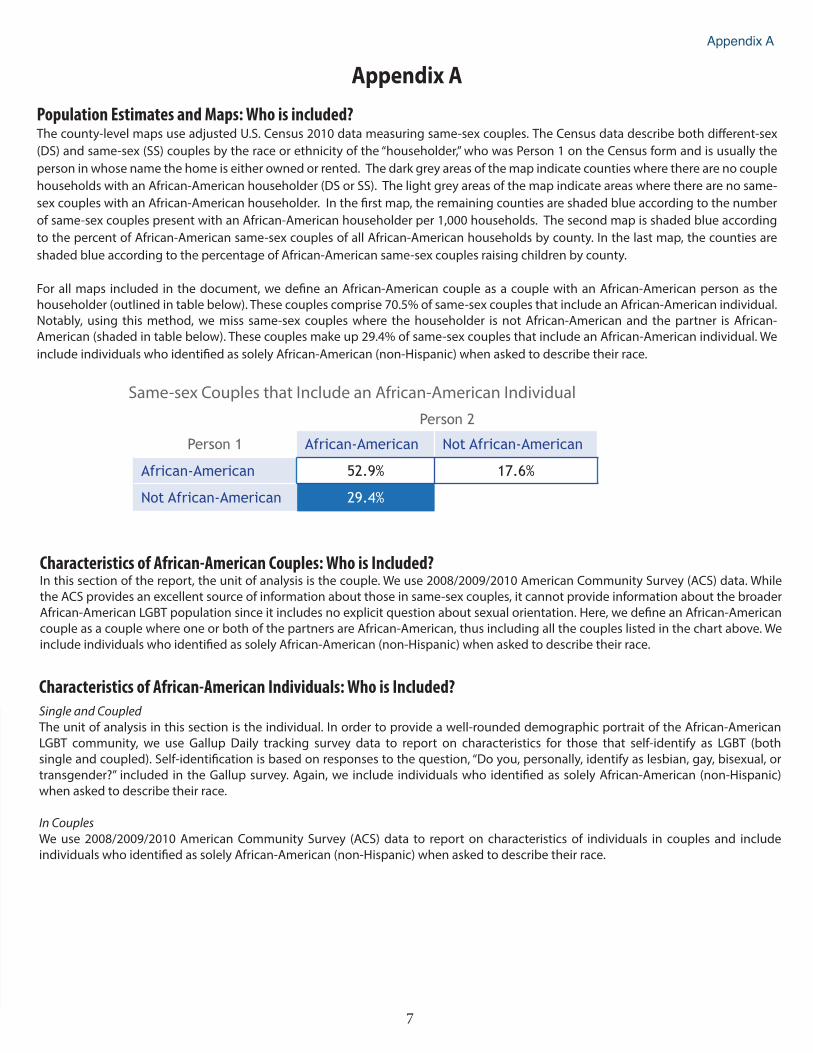
Characteristics of African-American Couples: Who is Included?In this section of the report, the unit of analysis is the couple. We use 2008/2009/2010 American Community Survey (ACS) data. While the ACS provides an excellent source of information about those in same-sex couples, it cannot provide information about the broader African-American LGBT population since it includes no explicit question about sexual orientation. Here, we de"ne an African-American couple as a couple where one or both of the partners are African-American, thus including all the couples listed in the chart above. We include individuals who identi"ed as solely African-American (non-Hispanic) when asked to describe their race.
Characteristics of African-American Individuals: Who is Included?Single and CoupledThe unit of analysis in this section is the individual. In order to provide a well-rounded demographic portrait of the African-American LGBT community, we use Gallup Daily tracking survey data to report on characteristics for those that self-identify as LGBT (both single and coupled). Self-identi"cation is based on responses to the question, “Do you, personally, identify as lesbian, gay, bisexual, or transgender?” included in the Gallup survey. Again, we include individuals who identi"ed as solely African-American (non-Hispanic) when asked to describe their race.
In CouplesWe use 2008/2009/2010 American Community Survey (ACS) data to report on characteristics of individuals in couples and include individuals who identi"ed as solely African-American (non-Hispanic) when asked to describe their race.
Same-sex Couples that Include an African-American Individual
7
Population Estimates and Maps: Who is included? The county-level maps use adjusted U.S. Census 2010 data measuring same-sex couples. The Census data describe both di!erent-sex (DS) and same-sex (SS) couples by the race or ethnicity of the “householder,” who was Person 1 on the Census form and is usually the person in whose name the home is either owned or rented. The dark grey areas of the map indicate counties where there are no couple households with an African-American householder (DS or SS). The light grey areas of the map indicate areas where there are no same-sex couples with an African-American householder. In the "rst map, the remaining counties are shaded blue according to the number of same-sex couples present with an African-American householder per 1,000 households. The second map is shaded blue according to the percent of African-American same-sex couples of all African-American households by county. In the last map, the counties are shaded blue according to the percentage of African-American same-sex couples raising children by county.
For all maps included in the document, we de"ne an African-American couple as a couple with an African-American person as the householder (outlined in table below). These couples comprise 70.5% of same-sex couples that include an African-American individual. Notably, using this method, we miss same-sex couples where the householder is not African-American and the partner is African-American (shaded in table below). These couples make up 29.4% of same-sex couples that include an African-American individual. We include individuals who identi"ed as solely African-American (non-Hispanic) when asked to describe their race.
Appendix A
Appendix A
Person 2
Person 1 African-American Not African-American
African-American 52.9% 17.6%
Not African-American 29.4%
American Community
Survey(ACS)
Gallup Poll
Same-sex Different-sex LGBT Non-
LGBT
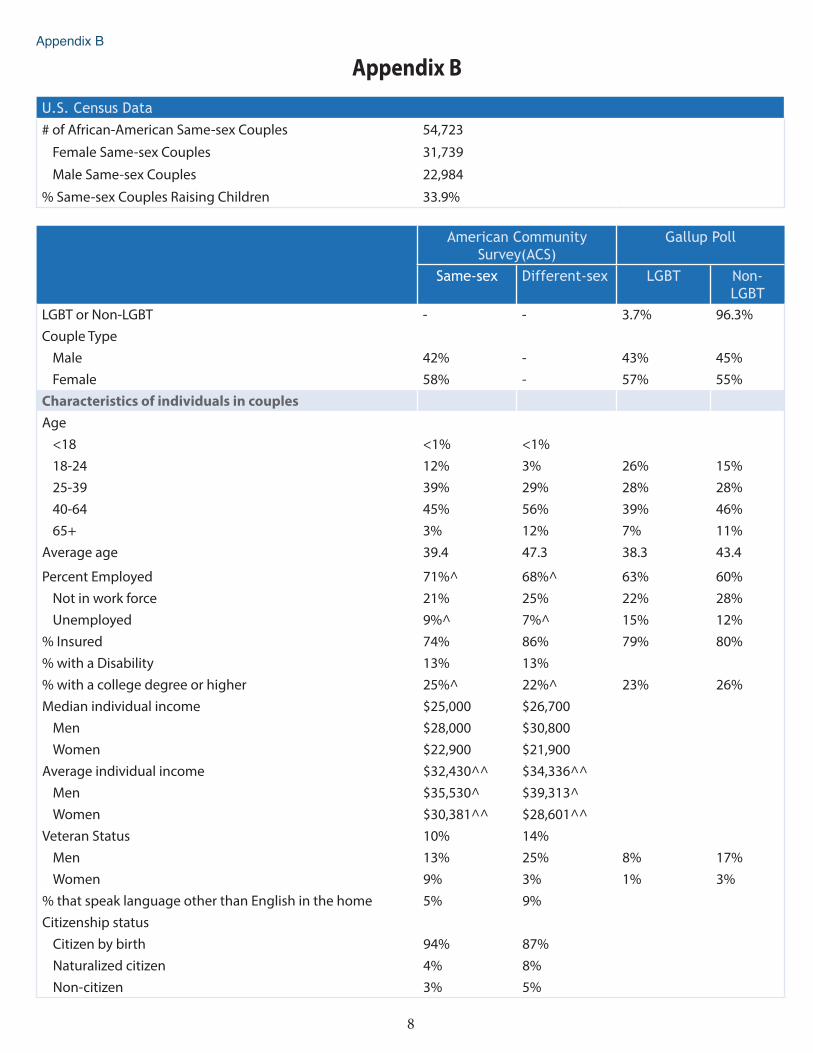
LGBT or Non-LGBT - - 3.7% 96.3%Couple Type
Male 42% - 43% 45%Female 58% - 57% 55%
Characteristics of individuals in couplesAge
<18 <1% <1%18-24 12% 3% 26% 15%25-39 39% 29% 28% 28%40-64 45% 56% 39% 46%65+ 3% 12% 7% 11%
Average age 39.4 47.3 38.3 43.4
Percent Employed 71%^ 68%^ 63% 60%Not in work force 21% 25% 22% 28%Unemployed 9%^ 7%^ 15% 12%
% Insured 74% 86% 79% 80%% with a Disability 13% 13%% with a college degree or higher 25%^ 22%^ 23% 26%Median individual income $25,000 $26,700
Men $28,000 $30,800Women $22,900 $21,900
Average individual income $32,430^^ $34,336^^Men $35,530^ $39,313^Women $30,381^^ $28,601^^
Veteran Status 10% 14%Men 13% 25% 8% 17%Women 9% 3% 1% 3%
% that speak language other than English in the home 5% 9%Citizenship status
Citizen by birth 94% 87%Naturalized citizen 4% 8%Non-citizen 3% 5%
U.S. Census Data
# of African-American Same-sex Couples 54,723Female Same-sex Couples 31,739Male Same-sex Couples 22,984
% Same-sex Couples Raising Children 33.9%
8
Appendix B
Appendix B
American Community
Survey(ACS)
Gallup Poll
Same-sex Different-sex LGBT Non-
LGBT
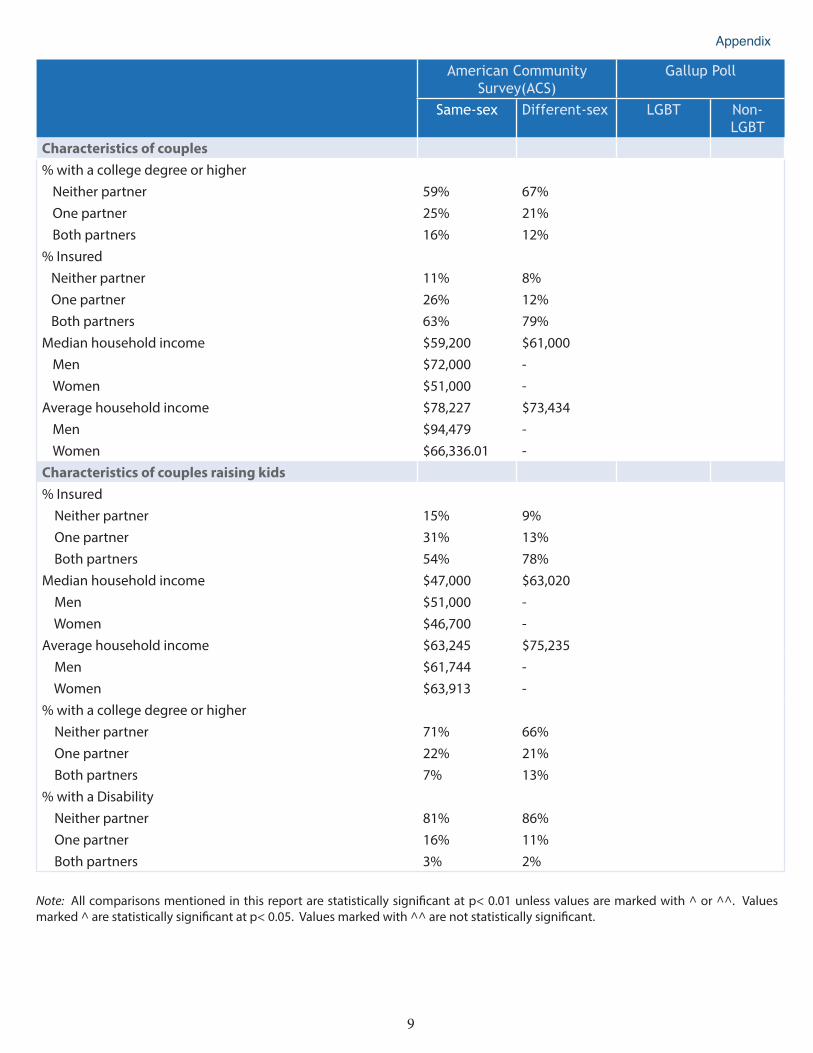
Characteristics of couples% with a college degree or higher
Neither partner 59% 67%One partner 25% 21%Both partners 16% 12%
% Insured Neither partner 11% 8% One partner 26% 12% Both partners 63% 79%Median household income $59,200 $61,000
Men $72,000 -Women $51,000 -
Average household income $78,227 $73,434Men $94,479 -Women $66,336.01 -
Characteristics of couples raising kids% Insured Neither partner 15% 9% One partner 31% 13% Both partners 54% 78%Median household income $47,000 $63,020 Men $51,000 - Women $46,700 -Average household income $63,245 $75,235 Men $61,744 - Women $63,913 -% with a college degree or higher Neither partner 71% 66% One partner 22% 21% Both partners 7% 13%% with a Disability Neither partner 81% 86% One partner 16% 11% Both partners 3% 2%
Note: All comparisons mentioned in this report are statistically signi"cant at p< 0.01 unless values are marked with ^ or ^^. Values marked ^ are statistically signi"cant at p< 0.05. Values marked with ^^ are not statistically signi"cant.
9
Appendix
For more informationThe Williams Institute, UCLA School of Law
Box 951476Los Angeles, CA 90095-1476
(310)[email protected] http://williamsinstitute.law.ucla.edu
About the authorsAngeliki Kastanis is a Public Policy Research Fellow at the Williams Institute, UCLA School of Law. She received her Master in Public Policy from the Irving B. Harris School of Public Policy at the University of Chicago.
Gary J. Gates is the Williams Distinguished Scholar at the Williams Institute, UCLA School of Law.
Data and MethodologyGallup Daily tracking survey: Results are based on telephone interviews conducted Jun. 1-Dec. 1, 2012 with a random sample of 206,186 adults, aged 18 and older, living in all 50 U.S. states and the District of Columbia. Interviews are conducted with respondents on landline and cellular phones, with interviews conducted in Spanish for respondents who are primarily Spanish-speaking. For more details on Gallup’s polling methodology, visit www.gallup.com.
2008-2010 American Community Survey (ACS): The analyses use the 3-year Public Use Microdata Samples (PUMS) from the American Community Survey, 2008-2010.
Adjustments to Census 2010 same-sex couple data: Data are compiled using the US Census 2010 preferred estimates for same-sex couples by race and ethnicity and the presence of children. Same-sex couples are identi"ed in households where Person 1 describes his or her relationship with another adult of the same sex as either a “husband/wife” or “unmarried partner.” The Census Bureau preferred estimates adjust original same-sex couple tabulations reported in the Census 2010 SF-2 data (PCT19) to account for the likelihood that a small portion of di!erent-sex couples miscode the sex of a spouse or partner and are incorrectly counted as a same-sex couple. Di!erent-sex couple data presented in the report are all derived from the SF-2, PCT19 table.
The Census Bureau only released preferred estimates for same-sex couples by race and ethnicity at the national level. State and county data used in this report are adjusted by the authors and do not represent o#cial Census Bureau tabulations. Like the Census Bureau preferred estimates, the adjustment procedure accounts for the likelihood that a small portion of di!erent-sex couples miscode the sex of a spouse or partner and are incorrectly counted as a same-sex couple. Note that the adjusted "gures do not take into account the possibility that some same-sex couples may not be counted in Census tabulations due to concerns about con"dentiality or because neither partner was Person 1 in the household.
10
Appendix B

![Round I Track C - d3oxih60gx1ls6.cloudfront.net...§ Women’s Development (Egypt, Middle East, US) § African American, Hispanic, Asian American, and LGBT Mentoring Programs § [Millennial]](https://img.pdfslide.us/doc/110x75/5f0891277e708231d422a5e6/round-i-track-c-womenas-development-egypt-middle-east-us-african.jpg)