Embed Size (px)
Citation preview


December 2015 Technical Report: Proposed Design Changes to the Central
Terminal Building Redevelopment Program at LaGuardia Airport
Prepared for U.S. Department of Transportation
Federal Aviation Administration
Sponsored by The Port Authority of NY & NJ
December 2015

LaGuardia Airport Technical Report CTB Redevelopment Program
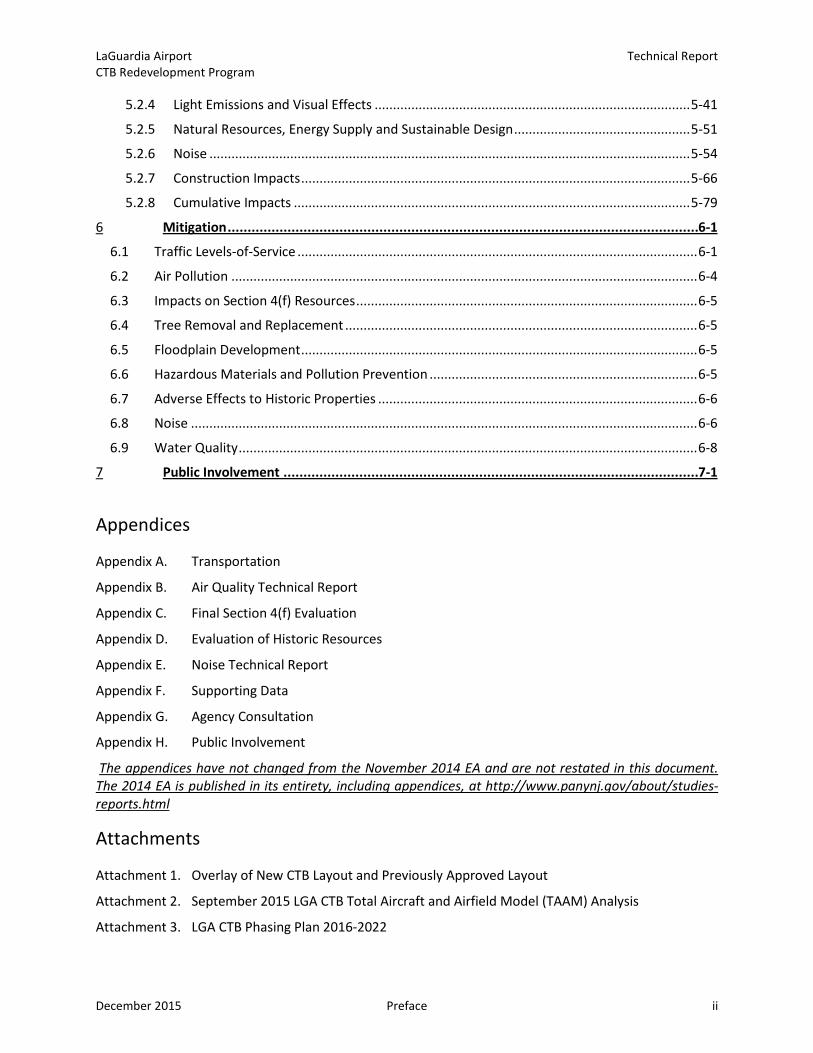
Table of Contents i. Preface ............................................................................................................................ iv
1 Introduction ...................................................................................................................1-1
1.1 Need for Action .......................................................................................................................... 1-2
1.2 NEPA Requirement .................................................................................................................... 1-3
1.3 Proposed design changes ........................................................................................................... 1-3
1.3.1 Terminal Building .................................................................................................................. 1-6
1.3.2 Airside Apron and Parking Area .......................................................................................... 1-11
1.3.3 Landside Roadways and Parking ......................................................................................... 1-14
1.3.4 Support Projects ................................................................................................................. 1-18
1.3.5 Construction Phasing .......................................................................................................... 1-22
1.4 Summary .................................................................................................................................. 1-28
2 Purpose and Need ..........................................................................................................2-1
3 Alternatives ...................................................................................................................3-1
4 Affected Environment ....................................................................................................4-1
4.1 Project Location and Setting ...................................................................................................... 4-1
4.2 Resources Potentially Affected .................................................................................................. 4-2
4.2.1 Traffic and Transportation .................................................................................................... 4-2
4.2.2 Air Quality ............................................................................................................................. 4-7
4.2.3 Coastal Resources ................................................................................................................. 4-7
4.2.4 Compatible Land Use ............................................................................................................ 4-7
4.2.5 U.S. DOT Act, Section 4(f) Resources .................................................................................... 4-8
4.2.6 Fish, Wildlife and Plants ........................................................................................................ 4-8
4.2.7 Floodplains ............................................................................................................................ 4-9
4.2.8 Historic and Archaeological Resources ............................................................................... 4-10
4.2.9 Noise ................................................................................................................................... 4-10
4.2.10 Water Resources ................................................................................................................. 4-11
5 Environmental Consequences .........................................................................................5-1
5.1 Environmental Categories Where No Changes Occur ................................................................ 5-1
5.2 Environmental Categories Where a Change in Impacts May Occur .......................................... 5-2
5.2.1 Traffic and Transportation .................................................................................................... 5-2
5.2.2 Air Quality ........................................................................................................................... 5-24
5.2.3 Floodplains .......................................................................................................................... 5-34
December 2015 Preface i
LaGuardia Airport Technical Report CTB Redevelopment Program
5.2.4 Light Emissions and Visual Effects ...................................................................................... 5-41
5.2.5 Natural Resources, Energy Supply and Sustainable Design ................................................ 5-51
5.2.6 Noise ................................................................................................................................... 5-54
5.2.7 Construction Impacts .......................................................................................................... 5-66
5.2.8 Cumulative Impacts ............................................................................................................ 5-79
6 Mitigation ......................................................................................................................6-1
6.1 Traffic Levels-of-Service ............................................................................................................. 6-1
6.2 Air Pollution ............................................................................................................................... 6-4
6.3 Impacts on Section 4(f) Resources ............................................................................................. 6-5
6.4 Tree Removal and Replacement ................................................................................................ 6-5
6.5 Floodplain Development ............................................................................................................ 6-5
6.6 Hazardous Materials and Pollution Prevention ......................................................................... 6-5
6.7 Adverse Effects to Historic Properties ....................................................................................... 6-6
6.8 Noise .......................................................................................................................................... 6-6
6.9 Water Quality ............................................................................................................................. 6-8
7 Public Involvement ........................................................................................................7-1
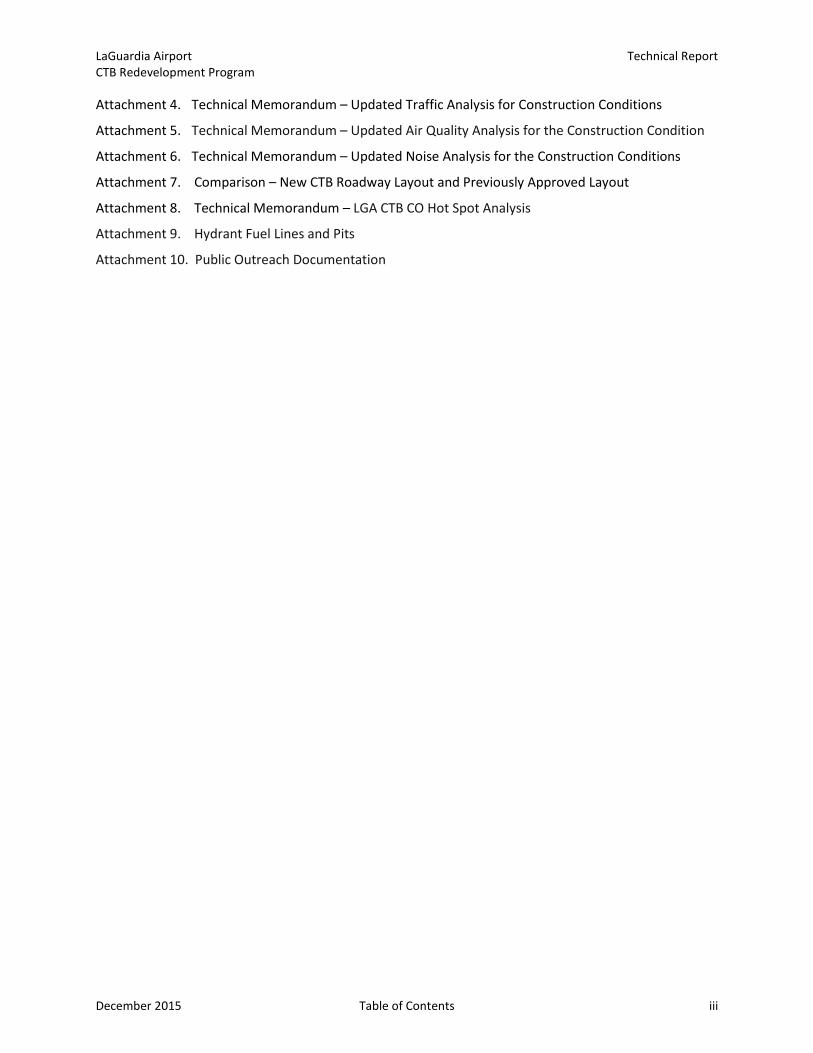
Appendices
Appendix A. Transportation
Appendix B. Air Quality Technical Report
Appendix C. Final Section 4(f) Evaluation
Appendix D. Evaluation of Historic Resources
Appendix E. Noise Technical Report
Appendix F. Supporting Data
Appendix G. Agency Consultation
Appendix H. Public Involvement
The appendices have not changed from the November 2014 EA and are not restated in this document. The 2014 EA is published in its entirety, including appendices, at http://www.panynj.gov/about/studies-reports.html
Attachments
Attachment 1. Overlay of New CTB Layout and Previously Approved Layout
Attachment 2. September 2015 LGA CTB Total Aircraft and Airfield Model (TAAM) Analysis
Attachment 3. LGA CTB Phasing Plan 2016-2022
December 2015 Preface ii
LaGuardia Airport Technical Report CTB Redevelopment Program
Attachment 4. Technical Memorandum – Updated Traffic Analysis for Construction Conditions
Attachment 5. Technical Memorandum – Updated Air Quality Analysis for the Construction Condition
Attachment 6. Technical Memorandum – Updated Noise Analysis for the Construction Conditions
Attachment 7. Comparison – New CTB Roadway Layout and Previously Approved Layout
Attachment 8. Technical Memorandum – LGA CTB CO Hot Spot Analysis
Attachment 9. Hydrant Fuel Lines and Pits
Attachment 10. Public Outreach Documentation
December 2015 Table of Contents iii
LaGuardia Airport Technical Report CTB Redevelopment Program
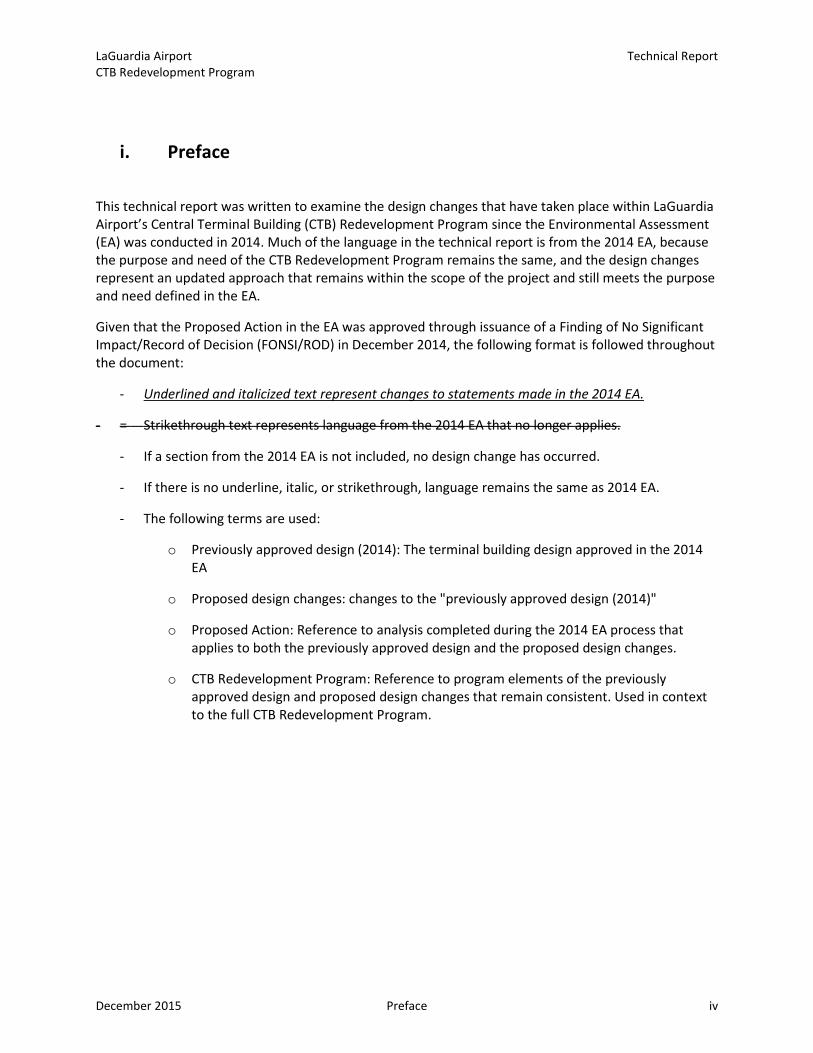
i. Preface
This technical report was written to examine the design changes that have taken place within LaGuardia Airport’s Central Terminal Building (CTB) Redevelopment Program since the Environmental Assessment (EA) was conducted in 2014. Much of the language in the technical report is from the 2014 EA, because the purpose and need of the CTB Redevelopment Program remains the same, and the design changes represent an updated approach that remains within the scope of the project and still meets the purpose and need defined in the EA.
Given that the Proposed Action in the EA was approved through issuance of a Finding of No Significant Impact/Record of Decision (FONSI/ROD) in December 2014, the following format is followed throughout the document:
- Underlined and italicized text represent changes to statements made in the 2014 EA.
- = Strikethrough text represents language from the 2014 EA that no longer applies.
- If a section from the 2014 EA is not included, no design change has occurred.
- If there is no underline, italic, or strikethrough, language remains the same as 2014 EA.
- The following terms are used:
o Previously approved design (2014): The terminal building design approved in the 2014EA
o Proposed design changes: changes to the "previously approved design (2014)"
o Proposed Action: Reference to analysis completed during the 2014 EA process thatapplies to both the previously approved design and the proposed design changes.
o CTB Redevelopment Program: Reference to program elements of the previouslyapproved design and proposed design changes that remain consistent. Used in contextto the full CTB Redevelopment Program.
December 2015 Preface iv
LaGuardia Airport Technical Report CTB Redevelopment Program
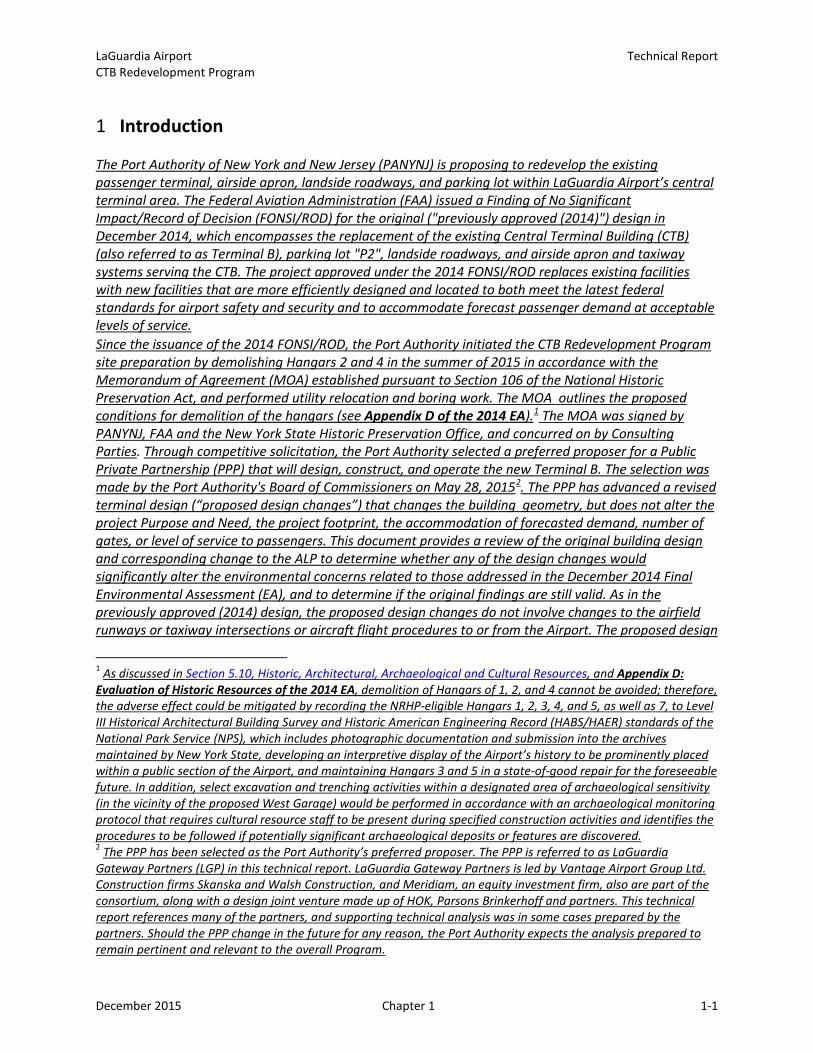
1 Introduction
The Port Authority of New York and New Jersey (PANYNJ) is proposing to redevelop the existing passenger terminal, airside apron, landside roadways, and parking lot within LaGuardia Airport’s central terminal area. The Federal Aviation Administration (FAA) issued a Finding of No Significant Impact/Record of Decision (FONSI/ROD) for the original ("previously approved (2014)") design in December 2014, which encompasses the replacement of the existing Central Terminal Building (CTB) (also referred to as Terminal B), parking lot "P2", landside roadways, and airside apron and taxiway systems serving the CTB. The project approved under the 2014 FONSI/ROD replaces existing facilities with new facilities that are more efficiently designed and located to both meet the latest federal standards for airport safety and security and to accommodate forecast passenger demand at acceptable levels of service. Since the issuance of the 2014 FONSI/ROD, the Port Authority initiated the CTB Redevelopment Program site preparation by demolishing Hangars 2 and 4 in the summer of 2015 in accordance with the Memorandum of Agreement (MOA) established pursuant to Section 106 of the National Historic Preservation Act, and performed utility relocation and boring work. The MOA outlines the proposed conditions for demolition of the hangars (see Appendix D of the 2014 EA).1 The MOA was signed by PANYNJ, FAA and the New York State Historic Preservation Office, and concurred on by Consulting Parties. Through competitive solicitation, the Port Authority selected a preferred proposer for a Public Private Partnership (PPP) that will design, construct, and operate the new Terminal B. The selection was made by the Port Authority's Board of Commissioners on May 28, 20152. The PPP has advanced a revised terminal design (“proposed design changes”) that changes the building geometry, but does not alter the project Purpose and Need, the project footprint, the accommodation of forecasted demand, number of gates, or level of service to passengers. This document provides a review of the original building design and corresponding change to the ALP to determine whether any of the design changes would significantly alter the environmental concerns related to those addressed in the December 2014 Final Environmental Assessment (EA), and to determine if the original findings are still valid. As in the previously approved (2014) design, the proposed design changes do not involve changes to the airfield runways or taxiway intersections or aircraft flight procedures to or from the Airport. The proposed design
1 As discussed in Section 5.10, Historic, Architectural, Archaeological and Cultural Resources, and Appendix D: Evaluation of Historic Resources of the 2014 EA, demolition of Hangars of 1, 2, and 4 cannot be avoided; therefore, the adverse effect could be mitigated by recording the NRHP-eligible Hangars 1, 2, 3, 4, and 5, as well as 7, to Level III Historical Architectural Building Survey and Historic American Engineering Record (HABS/HAER) standards of the National Park Service (NPS), which includes photographic documentation and submission into the archives maintained by New York State, developing an interpretive display of the Airport’s history to be prominently placed within a public section of the Airport, and maintaining Hangars 3 and 5 in a state-of-good repair for the foreseeable future. In addition, select excavation and trenching activities within a designated area of archaeological sensitivity (in the vicinity of the proposed West Garage) would be performed in accordance with an archaeological monitoring protocol that requires cultural resource staff to be present during specified construction activities and identifies the procedures to be followed if potentially significant archaeological deposits or features are discovered. 2 The PPP has been selected as the Port Authority’s preferred proposer. The PPP is referred to as LaGuardia Gateway Partners (LGP) in this technical report. LaGuardia Gateway Partners is led by Vantage Airport Group Ltd. Construction firms Skanska and Walsh Construction, and Meridiam, an equity investment firm, also are part of the consortium, along with a design joint venture made up of HOK, Parsons Brinkerhoff and partners. This technical report references many of the partners, and supporting technical analysis was in some cases prepared by the partners. Should the PPP change in the future for any reason, the Port Authority expects the analysis prepared to remain pertinent and relevant to the overall Program.
December 2015 Chapter 1 1-1
LaGuardia Airport Technical Report CTB Redevelopment Program
changes incorporate mitigation measures originally identified in the 2014 FONSI/ROD, along with additional mitigation measures for construction traffic impacts and nighttime construction.
The PPP advanced the proposed design changes in order to present a project that offered lower overall costs than the previously approved (2014) design from the 2014 EA and allowed for quicker construction phasing and project delivery. To these points, the overall construction schedule has decreased by seven months, and cost savings of approximately $250 million versus the previously approved (2014) design. It is also important to note that while the construction schedule of the whole program has decreased by seven months from start to finish, the start date for the program is later than originally contemplated in the 2014 EA. Therefore, the substantive completion date of late 2021 remains substantially similar to the completion date in the 2014 EA, with demobilization activities continuing into early 2022. The schedule reduction is due to simplified phasing, the ability to wholly locate the new CTB headhouse within the footprint of existing Parking Garage 2, and the ability for limited demolition work to take place during overnight (10PM-6AM) hours for approximately 5.5 months centered around the 2nd quarter of 2017. Nighttime demolition activities will include demolishing airside apron and utility infrastructure. There will be no construction activity during these overnight hours, such as paving or pile driving.3 Only demolition and material removal will happen during these overnight hours. Nighttime demolition work is required to maintain consistency with overall project phasing as well as to avoid conflicts with aircraft operations during daytime operating hours. As the airport operator, the Port Authority verified that the operational and environmental benefits of the previously approved (2014) design were preserved in the proposed design changes, and that the terminal was capable of fulfilling the original purpose and need. The analysis supporting these conclusions is provided in this document.
The public announcement of the Port Authority's selection of a preferred proposer for the CTB redevelopment project coincided with New York State Governor Andrew M. Cuomo’s announcement of his goal for a transformational redesign of LaGuardia Airport, which would include replacement of Terminals C and D, as well as the potential construction of an AirTrain, hotel, and other support facilities on airport, as recommended by the Governor's airport design panel. While preliminary planning efforts are underway to consider the other components of the transformational redesign, the CTB Redevelopment component represents a concrete specified design, a project that received approval from the Port Authority's board on May 28, 2015 and will shortly be presented to the Board for final approval. The other components of the new design are still pending consideration in the capital plans of the PANYNJ and other entities, and have not yet been the subject of sufficiently specific planning work to enable accurate and relevant NEPA analysis. Therefore, the nature, the extent, and the design of these other components are not determinable or reasonably foreseeable at the present time. In the event that these projects do become ripe for decision, they will be subject to their own appropriate NEPA analyses and those analyses will be required to look back on the CTB Redevelopment Program as a past project and to consider it in future project analysis of cumulative impacts.
1.1 Need for Action
It is imperative that the replacement of the CTB proceed in an expeditious manner. The FAA was originally notified of the intent to replace the CTB in a 2005 Passenger Facility Charge (PFC) application for a feasibility study to replace the facility. The proposed design changes reduce the CTB construction
3 For the purposes of this document, demolition work includes dismantling existing facilities and removing material from the airport. Construction work includes any development of new facilities, transportation of material into the airport, and activities to support the development of new facilities such as pile driving.
December 2015 Chapter 1 1-2
LaGuardia Airport Technical Report CTB Redevelopment Program
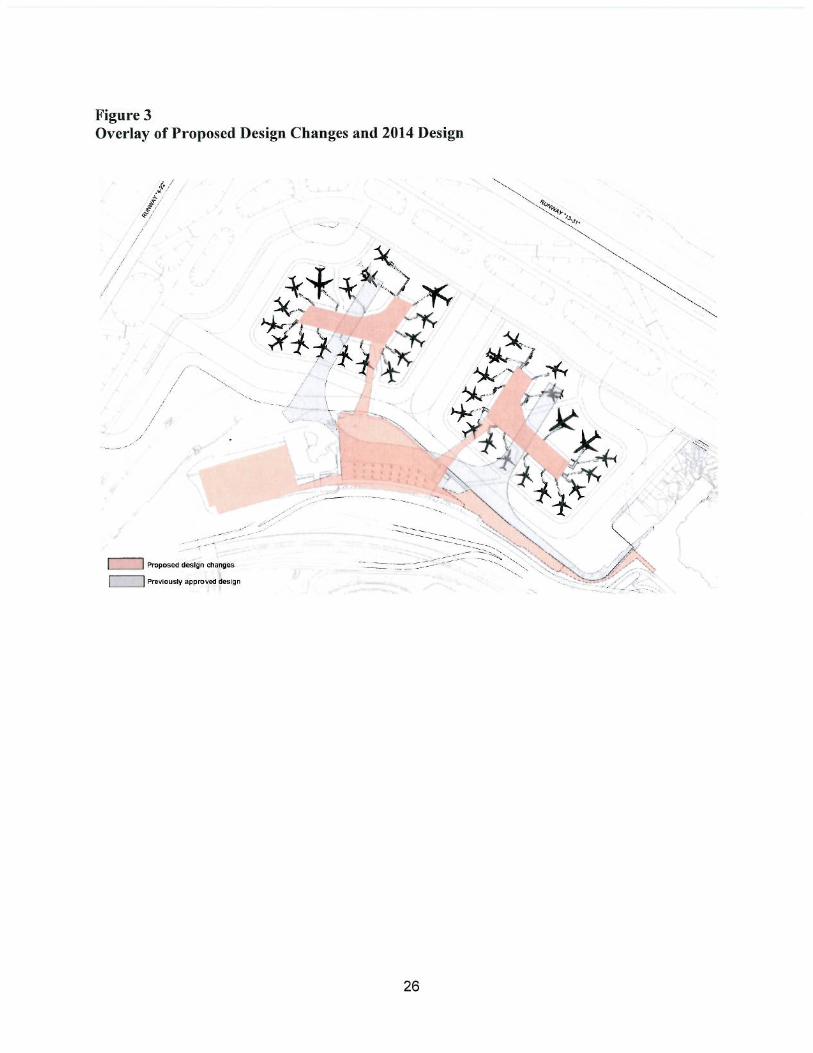
schedule by seven months and require airlines and their employees and passengers to move only once. The PPP accomplishes this through more efficient construction phasing. The proposed design changes maintain the same or higher levels of passenger service and operational efficiency as the previously approved (2014) design. PANYNJ has revisited the 2014 EA and analyzed changes to environmental impact categories and project design, which are described in this technical report. The proposed design changes consist of a reconfigured headhouse and two midfield concourses. The concourses are connected back to the headhouse by means of pedestrian bridges over one of the leasehold area dual taxi lanes. The gross floor area is 1,457,657 square feet, representing a 9.51% increase from the previously approved (2014) design4. The design is overlaid on the previously approved (2014) design in Attachment 1. The building height is comparable (within two feet of the previously approved (2014) design). The benefits of the proposed design changes include:
• The ability to meet the original purpose and need of the project while realizing savings of approximately $250 million and 7 months of construction time compared to the previously approved (2014) design.
• A staging plan that requires only one move per airline, rather than several moves. This is a result of the headhouse being constructed all at once, while the original headhouse remains in service. This is accomplished by limiting the headhouse footprint to be wholly within the footprint of existing Parking Garage 2, which was not originally contemplated. The schedule reduction is due to simplified phasing, the ability to wholly locate the new CTB headhouse within the footprint of existing Parking Garage 2, and the ability for limited demolition work to take place during overnight (10PM-6AM) hours for approximately 5.5 months.
1.2 NEPA Requirement The Federal Actions described in the November 2014 EA were:
• FAA approval of revisions to the ALP and the implementation of changes to the originally approved design as depicted in Figure 1-1;
• FAA approval for PANYNJ to establish eligibility to participate in the funding through the use of PFCs for eligible airport development, assuming the independent requirements of the PFC program are met.
These federal actions are reviewed within this technical report. Additional federal actions, such as relocation of FAA Navigational Aids (Navaids), may be required as part of this project. Subject to FAA’s decision on this technical report and ALP approval, construction is expected to begin on the proposed design changes in the second quarter of 2016. Construction is ongoing on parts of the project that are part of the previously approved design (2014). 1.3 Proposed design changes
4 The November 2014 EA stated that the previously approved design of the CTB would be “approximately 1.3 million square feet of total space” (Section 1.4, Page 1-10 of the November 2014 EA). This estimate was refined to 1,331,060 square feet as the previously approved design progressed. The total square footage of the proposed design changes is 1,457,657 square feet, a 9.51% increase.
December 2015 Chapter 1 1-3
LaGuardia Airport Technical Report CTB Redevelopment Program
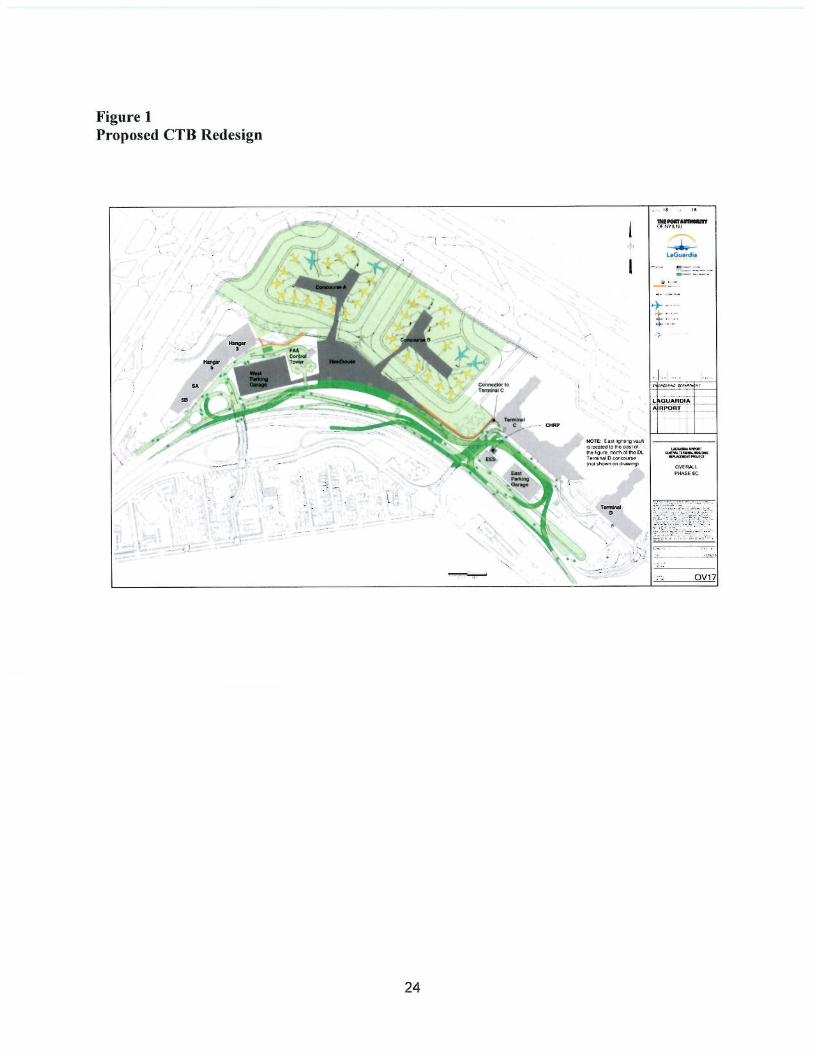
In its December 2014 FONSI/ROD, the FAA approved the CTB Redevelopment Program at LGA. The PPP selected to design, build and operate the new terminal has advanced the design and refined elements of the project that resulted in changes to the previously approved (2014) design. As with the previously approved (2014) design, the updated design does not involve the airfield runways or taxiways, or other terminals or facilities at LaGuardia Airport. The proposed design changes that are the subject of this technical report are as follows: Overall Building Design The proposed design changes redefine the overall configuration of the terminal elements and consists of a reconfigured headhouse and two midfield concourses, rather than a headhouse directly connected to pier concourses. The concourses are connected back to the headhouse by means of pedestrian bridges over one of the leasehold area taxi lanes. The gross floor area is 1,457,697 square feet, representing a 9.51% increase from the previously approved (2014) design. The design is overlaid on the previously approved (2014) design in Attachment 1. The benefits of the proposed design changes include:
• The ability to meet the original purpose and need of the project while realizing savings of approximately $250 million and 7 months of construction time compared to the previously approved (2014) design.
• A staging plan that requires only one move per airline, rather than several moves. This is a result of the headhouse being constructed all at once, while the original headhouse remains in service. This is accomplished by limiting the headhouse footprint to be wholly within the footprint of existing Parking Garage 2, which was not originally contemplated.
• A passenger connection to Terminals C and D that integrates public and sterile corridors for seamless connections between airlines and terminals.
Concourses The proposed design changes include double-sided concourses that are approximately 20’ wider than the previously approved (2014) design to provide ultimate flexibility in seating type and configuration over time, as well as the ability to absorb delayed passengers. Water and Energy Savings The proposed design changes include innovative water management strategies. Rainwater will be collected and stored in underground tanks below the headhouse. The tanks have been sized for 75,000 gallon capacity. The harvested water will be used for irrigation of the site at the headhouse. In addition to water efficient plumbing, there will be solar water collectors at the headhouse and concourses to provide hot water to the restrooms. These design elements lend to a more fully integrated sustainability strategy than the previously approved (2014) design. Roadways Accommodation of dual airside taxilanes and the new headhouse configuration have caused the frontages to shift 30' south. Attachment 7 illustrates the differences between the two. Overall, the
December 2015 Chapter 1 1-4
LaGuardia Airport Technical Report CTB Redevelopment Program
roadway changes are minimal and the analysis shows that the changes do not affect vehicle circulation on-airport.
The following differences have been identified:
1. CTB frontages (HOV, Arrivals, & Departures levels) shifted approximately 30' south to supportconnection to Terminal C and reconfigured headhouse.
2. Roadway changed to support the shifting of the CTB frontages to accommodate dual taxilanes infront of Concourse A.
3. CTB Arrivals and Departures exit ramp alignment changed to accommodate dual taxilanes infront of Concourse A.
4. Access to West Parking Garage and intersection changed.5. Access to FAA Air Traffic Control Tower (ATCT) changed.6. Access to shipping/receiving facility changed.
Airside
The revised CTB layout has two individual ‘L’ shaped islands joined to a single headhouse via bridges. The island on the western portion of the CTB apron is Concourse A and the one on the eastern portion is Concourse B. The proposed layout offers the same number of gates as the previously approved (2014) design (35): (a) 17 Gates on Concourse A; and (b) 18 Gates on Concourse B. Of these 35 gates, four gates will be dedicated to handle B767-400ERs (ADG Group IV) and 31 will be dedicated to handle B737-900s (ADG Group III) independently. This represents the same fleet mix accommodated in the previously approved (2014) design. The proposed design changes provide independent full-length dual Group III taxilanes between Concourses A and B and partial dual Group IIIA taxilanes in the area south-west of Concourse A. A single Group IIIa taxilane will serve gates on the east and south sides of Concourse B. Also included on the apron are 20 independent remote parking positions for Group III aircraft. Please see Attachment 2-September 2015 LGA CTB Total Aircraft and Airfield Model (TAAM) Analysis report as well as Figure 1-1b for airside diagrams.
Construction Phasing
The overall project schedule from initiation to full completion is 68 months and is portrayed fully in Attachment 3. This represents a decrease of seven months of construction activities from the previously approved (2014) design (75 months) analyzed in the 2014 EA. The schedule reduction is due to simplified phasing, the ability to wholly locate the new CTB headhouse within the footprint of existing Parking Garage 2, and the ability for limited demolition work to take place during overnight (10PM-6AM) hours for approximately 5.5 months. Assuming construction initiation in 2Q 2016, the terminal would be open by the end of 2021. The headhouse would open in Mid-2019 (37 months). These timeframes represent the balance of construction that has not already started as part of the previously approved (2014) design. Activities consistent with the November 2014 EA, such as the demolition of Hangars 2 and 4 and other site work, began in 2014 and is continuing apace. Hangars 2 and 4 were demolished during the summer of 2015 in accordance with the Memorandum of Agreement (MOA), in place to mitigate adverse effects to the Hangars, which are considered historic resources. The Port Authority analysis demonstrates no adverse environmental impacts from a compressed construction schedule for the following reasons: (1) cumulative impacts from originally anticipated concurrent projects, including the runway deck Runway Safety Area (RSA) improvements and the east garage and east end substation will not exist, due to change in schedule; (2) the phasing results in fewer moves and temporary passenger
December 2015 Chapter 1 1-5
LaGuardia Airport Technical Report CTB Redevelopment Program
accommodations, streamlining the construction activity. The public announcement of the Port Authority's selection of a preferred proposer for the CTB redevelopment project coincided with New York State Governor Andrew M. Cuomo’s announcement of his goal for a transformational redesign of LaGuardia Airport, which would include replacement of Terminals C and D, as well as the potential construction of an AirTrain, hotel, and other support facilities on airport, as recommended by the Governor's airport design panel. While preliminary planning efforts are underway to consider the other components of the transformational redesign, the CTB Redevelopment component represents a concrete specified design, a project that received approval from the Port Authority's board on May 28, 2015 and will shortly be presented to the Board for final approval. The other components of the new design are still pending consideration in the capital plans of the PANYNJ and other entities, and have not yet been the subject of sufficiently specific planning work to enable accurate and relevant NEPA analysis. Therefore, the nature, the extent, and the design of these other components are not determinable or reasonably foreseeable at the present time. In the event that these projects do become ripe for decision, they will be subject to their own appropriate NEPA analyses and those analyses will be required to look back on the CTB Redevelopment Program as a past project and to consider it in future project analysis of cumulative impacts.
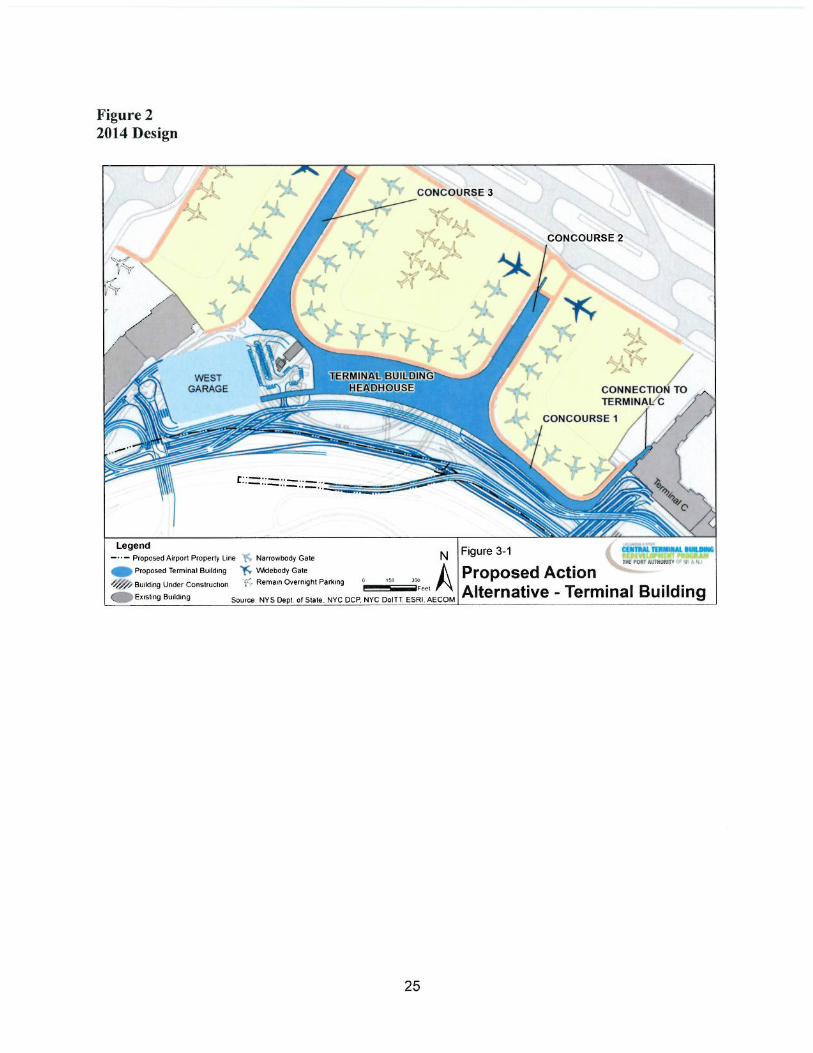
1.3.1 Terminal Building Under the Previously approved (2014) design, the existing CTB would be demolished and replaced with a new terminal building designed and constructed to meet the latest Federal standards for airport safety and security, to accommodate forecast passenger demand, and to do so at acceptable levels of service (see Figure 3-1). The new terminal would be both functional and flexible with a building layout and environment that supports the highest level of passenger service and facilities within the available budget for a building of this size. The new terminal would be certified under the Leadership in Energy and Environmental Design (LEED) program, striving towards a Gold rating, with a minimum acceptable rating of Silver.5 The headhouse would have three levels, with Departures/Ticketing on upper Level 3, Arrivals/Baggage Claim on middle Level 2, and Ground Transportation and airport/airline operations on ground Level 1. On the airside, concourses would interface with the preferred concept for the terminal airside apron; on the landside, all three building levels would interface with the preferred concept for landside roadways and parking. The CTB Redevelopment Program includes the following terminal building projects:
Change: Figure 3-1b depicts the modified terminal building, taxiways, RON positions, and landside roadways consistent with the proposed design changes. The Headhouse has four levels, with Concessions on the upper Level 4, Departures/Ticketing and passenger screening on Level 3, Arrivals/Baggage Claim and in-line baggage screening on Level 2, and airline baggage makeup and high occupancy Ground Transportation on ground Level 1. On the airside there are two island concourses separated by a dual taxi-lane and connected by overhead pedestrian bridges across the taxilanes to the Headhouse. On the
5 LEED is a green building certification program that recognizes best-in-class building strategies. It is a nationally accepted benchmark for the design, construction and operation of high performance green buildings. A point system is used to rate projects that satisfy requirements based on the following categories: sustainability, water efficiency, energy and atmosphere, materials and resources used, indoor environmental quality, innovation in design and regional priority. The rating system and their corresponding point levels are: Certified (40-49 points), Silver (50-59 points), Gold (60-79 points) and Platinum (80 points and above). Projects receiving a higher rating level are deemed more environmentally responsible. http://www.usgbc.org/Docs/Archive/General/Docs3330.pdf
December 2015 Chapter 1 1-6
LaGuardia Airport Technical Report CTB Redevelopment Program
landside the HOV, Arrivals, and Departures building levels would interface with the preferred concept for landside roadways and parking.
The CTB Redevelopment Program includes the following terminal building projects:
• Headhouse and Concourses. The Program would provide for a compact bar-shaped headhousewith double-sided concourses and a smaller single-sided concourse to the east. The facilities areplanned in the context of the Airport-wide demand of 34 MAP and the new terminal is designedto accommodate over half that demand—17.5 MAP—at LOS C. The proposed building wouldtotal approximately 1.3 million square feet, including the concourses and a connector to theadjacent Terminal C. There would be space for over 200 passenger check-in positions, 22 TSAscreening lines, nine (9) baggage claim devices, and allowances for concessions, airline clubs,airport/airlines offices, with sufficient space for the building’s support systems.
Change: The proposed design changes would provide for a reconfigured Headhouse wholly located within the footprint of existing Parking Lot 2, and two concourses connected to the headhouse by overhead pedestrian bridges. The headhouse would centralize ticketing, baggage pickup and drop off, and security functions. All gates would be located on the island concourses. The proposed building would total approximately 1,457,697 square feet, including the concourses and a connector to adjacent Terminal C. Passenger check in positions, TSA screening lines, baggage claim devices, and allowances for ancillary space do not change.
o Level 4. The upper level would house the primary concessions mall. The maximum height ofthis fourth level would remain below the maximum height of the three level originallyapproved design. The concessions level would be reached from the post security side of thepassenger security screening checkpoint via escalators and elevators and would serve as thetransition to the Concourses via the overhead pedestrian bridges. A post security connectorto Terminal C would originate at this level of the Headhouse.
o Level 3. The upper level would house the Check-In Hall and Passenger Security ScreeningCheckpoints. It would be served by a high elevated level (departures level) roadway and a30-foot wide sidewalk for departures drop off. The Passenger Security ScreeningCheckpoints would match the layout of the concourses. After checking-in, passengers wouldproceed down to Level 2 by way of escalators, elevators or stairs.
Change: Level 3 would house the Check-In Hall and Passenger Security Screening Checkpoints. It would be served by an elevated level (departures level) roadway and a 40-foot wide sidewalk for departures drop off. The central Passenger Security Screening Checkpoint is situated in a location where it will serve both Concourses, providing for greater flexibility for the TSA. Airline ticket offices would be located on this level. After checking-in and passing through the security checkpoint, passengers would proceed up to Level 4 by way of escalators, elevators or stairs.
o Level 2. On the middle level, departing passengers would follow signage to their departuregate. Some gates would be located on the north side of the terminal headhouse. Mostgates, however, would be located on one of the concourses. Level 2 would provide access tothe airline lounges and concessions—a mix of retail and food and beverage offerings.Arriving passengers would follow signage to the Baggage Claim Hall. The area of bag claim
December 2015 Chapter 1 1-7
LaGuardia Airport Technical Report CTB Redevelopment Program
carousels would be flanked by restrooms, concessions and airline service offices. Multiple vestibules would provide access to the elevated Arrivals Roadway and Curb, with taxi stands located at each end of the curb.
Change: Arriving passengers would transition from the Level 4 Pedestrian Bridges through the Concessions mall to escalators and elevators down to the Baggage Claim Hall located on Level 2. The bag claim hall carousels would be flanked by restrooms, concessions and airline service offices. Multiple vestibules would provide access to the elevated Arrivals Roadway and Curb, with taxi stands located at each end of the curb. The outbound baggage in-line screening rooms (Checked Baggage Inspection Rooms/Checked Baggage Reconciliation Areas) are located on this level directly behind the baggage claim hall. The outbound baggage enters the screening area from the ticket counter and curbside conveyors above, and once cleared is transported to the baggage sortation and makeup area directly below the screening area. Major mechanical and electrical equipment (MEP) rooms are located on this level.
o Level 1. The ground level of the new terminal would house the in-line baggage screeningdevices, major mechanical, electrical and plumbing (MEP) spaces, and the GroundTransportation lobby and curb in front.
Change: The ground level of the new terminal Headhouse would house the baggagesortation and makeup devices, the baggage claim stripping conveyors, the loading dock andstorage facilities, employee screening devices, airline and building offices, and the GroundTransportation lobby and curb in front.
o All concourses would have two principal levels and a partial third level where they meet theterminal headhouse. The main passenger level of each concourse would house the gateholdrooms and central circulation corridors. The lower level would house the baggage makeup areas, utilities, as well as airline and ground handling support services.
Change: The two island concourses included in the proposed design changes consist of twoprimary levels, the Apron level housing airline ramp level operations and ground handlingsupport areas, and the Departures Level with gate holdrooms, concessions, and centralcirculation spaces. Directly above the Departures Level is a partial mezzanine housing AirlineClubs and Mechanical, Electrical, and Plumbing (MEP) rooms. Passengers access theConcourse mezzanine level club rooms and departures level holdrooms via escalators andelevator banks from the overhead pedestrian bridges connecting the Concourses to theHeadhouse.
December 2015 Chapter 1 1-8
LaGuardia Airport Technical Report CTB Redevelopment Program
Figure 3-1b: Depiction of Proposed Design Changes
December 2015 1-9
LaGuardia Airport Technical Report CTB Redevelopment Program
Figure 3-1. Proposed Action Alternative – Terminal Build
December 2015 1-10
LaGuardia Airport Technical Report CTB Redevelopment Program
1.3.2 Airside Apron and Parking Area
The terminal apron and taxilanes would be reconfigured to maximize airside efficiency and operational safety, and to enable the airlines to provide cost-effective and acceptable levels of service. As shown in Figure 3-2, the proposed layout would provide 35 contact gate positions (the same number as the current terminal) associated with the preferred terminal concept including dual parallel taxilanes for maintaining unimpeded taxi flow both to and from the aircraft gates. There would be adequate separation between the taxilanes to accommodate the appropriate design airplane based on the aviation demand forecast. The remaining airside components would also be designed using current FAA guidelines for the design aircraft. The use of these planning guidelines would provide for adequate wingtip and obstacle clearance, thereby resolving numerous deficiencies associated with the current configuration. The CTB Redevelopment Program includes the following airside elements:
Change: The requirement for dual taxilanes was included in the 2014 EA as a way to reduce airside delay. The benefit of the dual taxilane design in the previously approved (2014) design was substantiated through TAAM modeling. TAAM modeling completed for the proposed design changes demonstrates that the design changes perform as well or better as the airside design in the 2014 EA under VFR conditions. Therefore, the Visual Flight Rules (VFR) TAAM performance in the previously approved (2014) design was selected as the performance benchmark against which any deviation from the performance criteria would be measured. This criteria was chosen because a VFR TAAM model had been completed for the previously approved (2014) design, and therefore a direct “apples to apples” comparison was possible. The performance criteria ensures that any design change to the terminal would preserve the airside design benefits of the dual taxilanes provided under the previously approved (2014) design. Under the proposed design changes, dual taxilanes cannot be incorporated around the entirety of each concourse due to the geometry of the island concourses and the need to (1) remove the existing Modification of Standard (MOS) between the Restricted Vehicle Service Road (RVSR) and Taxiway “A” and allow for adequate wingtip separation between each jetbridge.
• 35-Gate Layout Plan. The Program would provide 31 contact gate positions for narrow-bodyaircraft with wingspans up to and including the B737-900W, plus four contact positions forwidebody aircraft with wingspans up to and including the B767-400. To accommodate a widerange of aircraft types, powered passenger boarding bridges would be provided at each gate,and each bridge would be equipped with a ground power unit, a preconditioned air unit, and apotable water cabinet. Each gate would also be equipped with a visual guidance docking system(VGDS) to assist pilots attempting to maneuver an aircraft into its parking position. To supportthe airlines’ use of electric ground service equipment (eGSE), including baggage tugs, beltloaders, and pushback tractors, recharging stations would be located at approximately everyother gate position along the face of the building.
Change: None
• Dual Parallel Taxilane Configuration. The Program would provide dual taxilanes or entry/exitpoints to the taxiways for each ramp area. The taxilane system would be designed to providethe most advantageous layout for each of the terminal areas. The west side configuration wouldinclude one taxilane for B757-200W aircraft, provide two points of entry/exit, and support eightgates. The central area configuration would include three parallel taxilanes for B757-200Waircraft, provide three points of entry/exit, and support 17 gates. The east side taxilane
December 2015 Chapter 1 1-11
LaGuardia Airport Technical Report CTB Redevelopment Program
configuration would include two taxilanes for B757-200W aircraft, provide two points of entry/exit, and support ten gates. The full extent of apron construction would be to the edge of Taxiway A to permit the construction of new taxiway entry/exit points. This layout plan complies with FAA Advisory Circular 150/5300-13A: Airport Design, including all applicable clearance standard dimensions for aircraft as well as ground service vehicles and equipment. There are no proposed modifications of airport design standards associated with this plan and, importantly, one existing Modification of Standard (MOS) would be eliminated.
Change: The proposed design changes would provide dual taxilanes between Concourse A and Concourse B, with an additional dual taxilane between the to the south of Concourse A opening onto Taxiway B adjacent to Runway 4/22. The taxilane system would be designed to provide the most advantageous layout for each of the terminal areas. Each gate area will have dual entry/exit points, and two out of three gate areas retain a dual taxilane. One gate area (Concourse B) is restricted to a single taxilane but maintains dual entry/exit points. TAAM analysis shows an average improvement of 0.1 minute per operation, and performance criteria is met. The performance criteria set required achievement of identical level of average VFR delay per operation to the previously approved (2014) design, as modeled in TAAM. The full extent of apron construction would be to the edge of Taxiway A to permit the construction of new taxiway entry/exit points.
• Remain Overnight (RON) Aircraft Parking. The Program would provide 20 RON positions forparking aircraft within or close to the terminal ramp. Almost all RON positions would operateindependently and maintain 25-foot wingtip clearances for B737-900W aircraft. Adequatecapacity for RON parking improves airline flight scheduling and efficiency by allowing aircraft tobe parked overnight at the same airport where they are needed for their first flight in themorning.
Change: The proposed design changes include 19 RON positions that accommodate B737-900Waircraft with 25 foot wingtip separation, and 1 additional RON position accommodating a E175aircraft, which meets the RON requirements of the 2030 design day schedule.
• Low Level Windshear Alert System (LLWAS). The existing LLWAS, a FAA weather facility, ismounted on a tower in parking lot 3. Parking lot 3 will be removed as part of the proposeddesign revisions and its footprint will accommodate a taxilane serving future Concourse B as wellas a blast fence and portions of the connection to terminal C and frontage roadways. For thisreason, the LLWAS will need to be moved on the airport. This topic was discussed at a November30, 2015 technical coordination meeting between FAA and LaGuardia Gateway Partners. Staffrepresenting FAA Engineering, FAA NY Metro Area Planning, and FAA ATCT Staff were present. Areplacement location will be determined in close consultation with FAA, LaGuardia GatewayPartners, and Port Authority staff. The current location being considered is in the vicinity of thenew East Parking Garage (P4), likely on the eastern edge of the garage.
• Ramp Control Tower. The Program would provide a replacement airline-operated ramp controltower for monitoring and controlling aircraft entering and exiting the terminal apron area and
December 2015 Chapter 1 1-12
LaGuardia Airport Technical Report CTB Redevelopment Program
gate parking positions.6 The 70-foot high tower would be centrally-located atop the west concourse and would have two operating levels totaling 3,400 square feet of floor space. Providing a ramp control tower improves airline efficiency and operational safety by enhancing controller line-of-sight of aircraft, vehicles, and ground service equipment maneuvering around the airside terminal apron area. Change: The ramp control operations center will be located on the third level of the headhouse to provide sight lines under the passenger bridges connecting to the concourses. There will be real-time camera systems to provide sightlines to the gates on the far side of the concourses.
• Underground Hydrant Lines and Hydrant Pits. The Program would provide the portion of the underground hydrant fuel system that lies beneath the reconstructed apron, including hydrant fuel pits (manholes) at each gate position and hydrant fuel lines leading to each pit. No action would be taken to complete the hydrant fuel system, which involves installing a buried fuel transfer line somewhere between the fuel storage tanks and the terminal apron.7 The location of hydrant fuel pits, and the hydrant fuel lines leading to each pit, is fixed by function and construction would be straightforward. The future location of the fuel transfer line has not been determined because the fuel storage tanks are located on the west side of the Airport and alternative routings must either cross under or go around Runway 4-22. There are numerous buried utilities associated with Runway 4-22 including conduits for electric power and control cables used for navigational aids and airfield lighting. The identification and evaluation of feasible alternatives is not expected to be complete for several years. There are no known environmental resources in the vicinity that would be affected by the installation of a fuel transfer line; therefore, no long-term or permanent environmental impacts are anticipated. During construction, there would be short-term increases in air, noise, and water pollution. These impacts would be temporary and minor, and the effects would diminish as the project nears completion. Change: none. Attachment 9-Hydrant Lines and Hydrant Pits layout provides an overview of the layout of the lines and pits around the gate areas in the proposed design changes.
• Deicing Containment System. The Program would provide a deicing containment system within the apron storm drainage that would allow for isolation of spent aircraft deicing fluid and pumping out of the fluid so that it may be properly disposed of in accordance with the Airport’s State Pollutant Discharge Elimination System (SPDES) permit.
6 A ramp control tower is different from the FAA’s Airport Traffic Control Tower, which is operated by FAA personnel responsible for directing aircraft through controlled airspace to and from the airport and for directing aircraft maneuvering on runways, taxiways, and designated airside apron areas. When a ramp control tower is in use, responsibility for controlling aircraft on the ground would transition at a line of demarcation between the terminal apron and the nearest active taxiway. The proposed Ramp Control Tower would be designed with input from the FAA and in accordance with appropriate line-of-sight requirements, height restrictions, clearance standard dimensions, and other applicable siting criteria.
7 This Final EA focuses on the near-term portion of the project that is “ripe for decision” and excludes from consideration the long-term portion of the project that could take years to develop into a proposal. If and when there is a proposal to fund and install the fuel transfer line needed to complete the underground hydrant fuel system, PANYNJ would prepare and submit the appropriate NEPA document for FAA environmental consideration including an assessment of the potential cumulative effects of both phases of the project.
December 2015 Chapter 1 1-13
LaGuardia Airport Technical Report CTB Redevelopment Program
Change: None
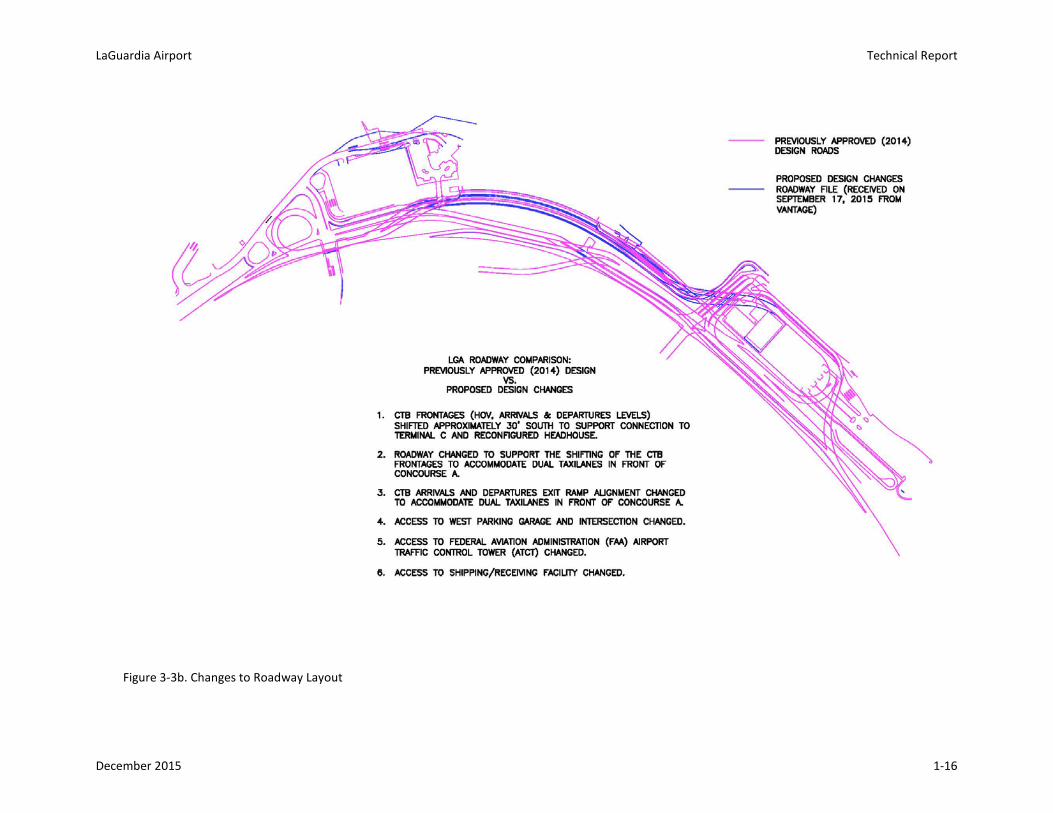
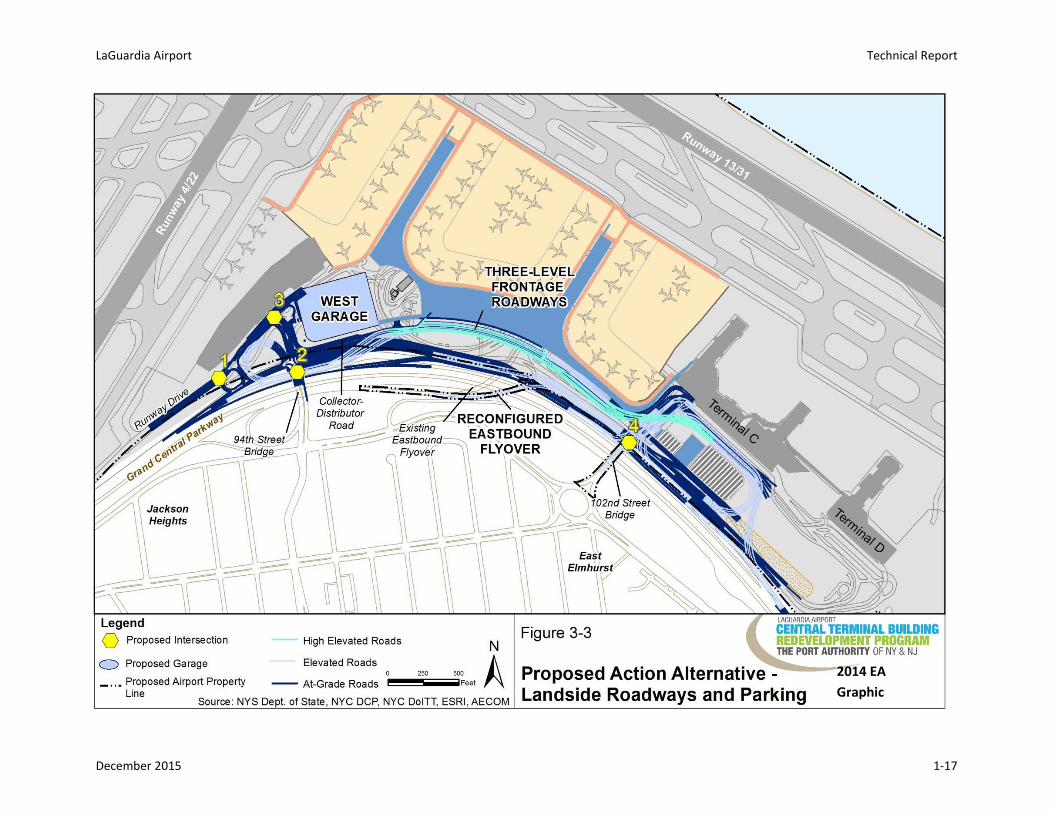
1.3.3 Landside Roadways and Parking The terminal area roadways would be reconfigured to accommodate free flowing traffic movements through the entire terminal area complex, including the new terminal and existing Terminals C and D, for up to 34 MAP, while minimizing impacts on the Grand Central Parkway to the extent practicable. Generally, the roadway improvements include: at-grade frontage roadways and ramps; elevated and high-elevated frontage roadways and ramps; connecting roadways to the West Garage; connecting roadways to the Grand Central Parkway (East and West); reconstruction of portions of the 94th Street and 102nd Street bridges to the Airport; four signalized intersections; and roadway signage (see Figure 3-3b. Changes to Roadway LayoutChange: Figure 3-3b highlights the minor changes that have taken place to the roadway network versus Figure 3-3 (previously approved design). The revisions are as follows:
1. CTB frontages (HOV, Arrivals, & Departures levels) shifted approximately 30' south to supportconnection to Terminal C and reconfigured headhouse.
2. Roadway changed to support the shifting of the CTB frontages to accommodate dual taxilanes infront of Concourse A.
3. CTB Arrivals and Departures exit ramp alignment changed to accommodate dual taxilanes infront of Concourse A.
4. Access to West Parking Garage and intersection changed.5. Access to FAA Air Traffic Control Tower (ATCT) changed.6. Access to shipping/receiving facility changed.
The CTB Redevelopment Program includes the following landside projects:
• Frontage Roadway Layout Plan. Generally, the proposed roadways are categorized by elevation.At the new terminal, a high-elevated roadway would serve Level 3 (Departures); an elevatedroadway would serve Level 2 (Arrivals); and an at-grade frontage roadway would serve Level 1(Ground Transportation). At Terminals C and D, an elevated roadway would serve Level 2(Departures) and an at-grade road would serve Level 1 (Arrivals). At all three terminals, theArrivals and Departures frontage roadways would consist of four traffic lanes – one drop-off/pick-up lane, one maneuvering lane and two bypass lanes. At the new terminal, the groundlevel frontage roadway would consist of one drop-off/pick-up lane, two bypass lanes, a striped3-foot median and one high occupancy vehicle (HOV) bypass lane. Amenities would includecanopies, curb-side check-in facilities, taxi booths, bus stops, and access to at-grade parking andthe East and West Garages.
Change: None
• Connecting Bridges and Roadways. Two bridges and a flyover ramp to the Airport would bemodified in order to connect existing public roadways to the new roadway configuration. Thenorth side of the 94th Street bridge would be connected to a new at-grade intersection near theWest Garage; the north side of the 102nd Street bridge would be connected to elevatedroadways near Terminal C; and the Grand Central Parkway eastbound flyover entrance to theAirport would be realigned to direct traffic into the newly constructed terminal frontageroadways.
December 2015 Chapter 1 1-14
LaGuardia Airport Technical Report CTB Redevelopment Program
There would be no new points of access or egress to the Parkway—only a modification to the existing flyover ramp from the Grand Central Parkway.
Change: None
• Intersections. There are four signalized intersections in the new terminal roadway network—one intersection on Runway Drive, two intersections on 94th Street, and one intersection on102nd Street (see Figure 3-3).o Intersection 1 would be located at Runway Drive and Recirculation Road. This would be a
means for accessing Runway Drive Westbound to the Marine Air Terminal and the west sideof the Airport, as well as Runway Drive Eastbound towards the West Garage.
o Intersection 2 would be at 94th Street and the Collector-Distributor (C-D) Road. This wouldbe the key Airport access/egress point on 94th Street.
o Intersection 3 would be at 94th Street and Runway Drive/Parking Garage. This intersectionwould connect 94th Street to Runway Drive and to the West Garage access roadway.
o Intersection 4 would be located on the north side of the 102nd Street bridge at theWestbound Recirculation Road and Outbound Terminal C Arrivals. This intersection wouldserve as a key node to accommodate outbound traffic from Terminals C and D Arrivals to102nd Street Southbound/Grand Central Parkway Eastbound and East End Terminalrecirculation, as well as HOVs from Terminals C and D to the proposed terminal.
Change: None
• Signage. New signs for roadways and pedestrian wayfinding through the proposed terminal areafacilities would be implemented in accordance with PANYNJ’s Airport Signing Standards Manualwhich provides for uniform and consistent application of wayfinding best practices and designcriteria. This includes the following areas: on-Airport roadways, parking, curbside/groundtransportation, and within the terminal building, including concourses/gates, ticketing/check-in,security checkpoints and baggage claim.
• Curb Frontage. A three-level curbside roadway would provide approximately 2,700 linear feet ofterminal curb in front of the new terminal—900 feet on each terminal level (i.e., arrivals,departures, and ground transportation) where vehicles can stop to drop-off or pick-up airlinepassengers and their baggage. Adding a separate roadway and curb for ground transportation(taxis, buses, shuttle and other HOVs) would improve roadway operations by increasing the totallength of curb frontage available and by allocating the curb frontage more efficiently.
Change: None
December 2015 Chapter 1 1-15
LaGuardia Airport Technical Report
Figure 3-3b. Changes to Roadway Layout
December 2015 1-16
LaGuardia Airport Technical Report
Figure 3-3. Proposed Action Alternative – Landside Roadways and Parking
2014 EA Graphic
December 2015 1-17
LaGuardia Airport Technical Report CTB Redevelopment Program
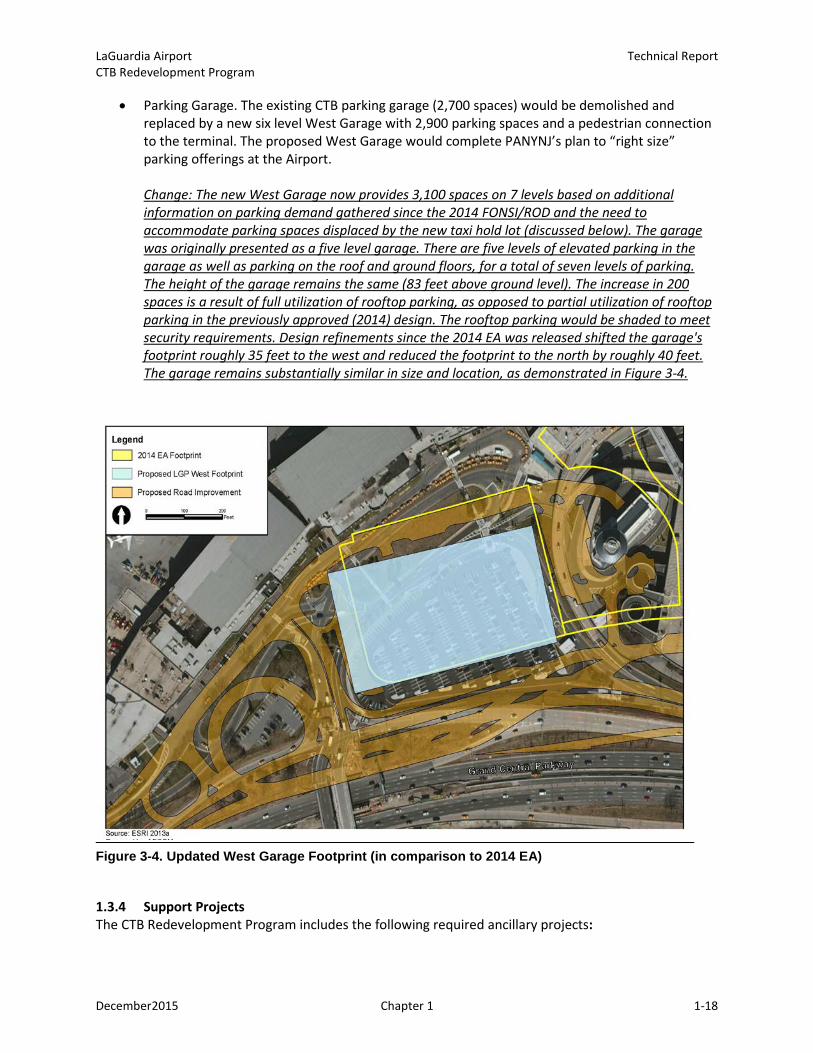
• Parking Garage. The existing CTB parking garage (2,700 spaces) would be demolished and replaced by a new six level West Garage with 2,900 parking spaces and a pedestrian connection to the terminal. The proposed West Garage would complete PANYNJ’s plan to “right size” parking offerings at the Airport. Change: The new West Garage now provides 3,100 spaces on 7 levels based on additional information on parking demand gathered since the 2014 FONSI/ROD and the need to accommodate parking spaces displaced by the new taxi hold lot (discussed below). The garage was originally presented as a five level garage. There are five levels of elevated parking in the garage as well as parking on the roof and ground floors, for a total of seven levels of parking. The height of the garage remains the same (83 feet above ground level). The increase in 200 spaces is a result of full utilization of rooftop parking, as opposed to partial utilization of rooftop parking in the previously approved (2014) design. The rooftop parking would be shaded to meet security requirements. Design refinements since the 2014 EA was released shifted the garage's footprint roughly 35 feet to the west and reduced the footprint to the north by roughly 40 feet. The garage remains substantially similar in size and location, as demonstrated in Figure 3-4.
Figure 3-4. Updated West Garage Footprint (in comparison to 2014 EA)
1.3.4 Support Projects The CTB Redevelopment Program includes the following required ancillary projects:
December2015 Chapter 1 1-18
LaGuardia Airport Technical Report CTB Redevelopment Program
• Demolish Hangars 1, 2, and 4 Three large but outmoded aircraft maintenance hangars would be removed to make way for constructing the proposed terminal. All three buildings, which have not been used for aircraft maintenance in many years, are leased to various tenants for offices, operations, shop space, baggage sorting and storage areas. The buildings—antiquated and obsolete—are eligible for listing on the National Register of Historic Places but have exceeded their useful life and are in need of extensive repairs, which are not planned. PANYNJ is working with the existing tenants to relocate the building functions so they can be removed in the near future. Pursuant to Section 106 of the National Historic Preservation Act, a Memorandum of Agreement (MOA) has been prepared that outlines the proposed conditions for demolition of the hangars (see Appendix D of the 2014 EA). The MOA was signed by PANYNJ, FAA and the New York State Historic Preservation Office, and concurred on by Consulting Parties. Change: None
• Relocate the Central Heating and Refrigeration Plant (CHRP) The existing CHRP, located within the existing CTB, has reached the end of its useful life and would be demolished and the equipment removed, and a new CHRP would be constructed. Designed and constructed specifically for the new terminal, the proposed CHRP would include four cooling towers as part of the overall plant facility. As with the new terminal, the proposed CHRP would be certified under LEED, striving towards a Gold rating, with a minimum acceptable rating of Silver. The CHRP is required to be located near the new terminal to minimize heating/cooling losses that would occur over longer distances, but away from the airport traffic control tower (ATCT) to avoid any potential for steam plumes from the cooling towers to interfere with site lines from the ATCT. The proposed location is currently being used temporarily as open space for contractor parking and material lay down for construction of the East End Substation (EES) and the East Garage.8 The CHRP is an occupied building (24 hours per day/7 days per week), therefore provisions including offices, circulation, access/egress, storage and support space, as well as visitor and staff parking, would be provided. Adequate space would also be provided for truck maneuvering in order to allow maintenance workers to service large equipment including the chillers and boilers. The CHRP would be connected to existing utilities, including natural gas and electric service lines that run immediately adjacent to the project site. No new or additional utilities or services are needed to support the proposed CHRP. For emergency power, the project includes a diesel generator that would be placed above the base flood elevation and two 35,000-gallon tanks to store backup (diesel) fuel. Design would include flood-proofing measures to the degree practicable, with special emphasis on critical equipment. Change: None
• Relocate the East Field Lighting Vault
8 Finding of No Significant Impacts (FONSI) for East End Substation and East Garage at LaGuardia Airport signed by FAA on February 5, 2013.
December2015 Chapter 1 1-19
LaGuardia Airport Technical Report CTB Redevelopment Program
The existing East Lighting Vault, located in Concourse D of the existing CTB near the base of the old ATCT, would also be demolished and the equipment removed; the preferred location for its replacement is on the east side of the Airport near Terminal D. The East Lighting Vault services the Runway 13-31 lighting systems, associated taxiways, and signage. It also powers two FAA 4160-Volt feeders serving FAA Navigational Aids and Visual Aids on the Airport. The lighting vault is essential for safe airport operations. The proposed scenario is to construct a new East Field Lighting Vault within vacant airside space near Parking Lot 5; no existing facilities would be removed or relocated to accommodate the proposed vault. Design would include flood-proofing measures to the degree practicable, with special emphasis on critical equipment. The proposed East Field Lighting Vault project would include constructing a one-story building (approximately 2,650 square feet), constructing and wiring new ductbanks and manholes to existing manholes, and reconnecting new wiring from the new vault. The standalone building and all electrical equipment would be new. Existing field lighting circuits currently supplied by the existing vault would be transferred to the new vault; no new circuits would be added or transferred from other facilities. PANYNJ has been coordinating with the local utility (Consolidated Edison) to ensure ample power supply is available (see letter dated August 21, 2013 in Appendix G of the 2014 EA). Once the new vault is commissioned, the existing vault can be decommissioned and removed without impacting airport operations or phased development of the proposed terminal. Change: None
• Relocate the Taxi Hold Lot The existing CTB taxi hold areas would also be displaced by construction of the new terminal. The various taxi hold areas around the CTB have a combined capacity of approximately 220 vehicles. The relocated, consolidated taxi hold area would be located on the southeast side of Parking Lot 4 and achieve the required goals of the Program by reducing re-circulating traffic volumes and vehicle emissions associated with the current configuration. The access road to the proposed taxi hold area would be a dedicated road reached from the main access road via a slip ramp that would bring taxis directly into the taxi hold area without requiring the vehicles to circulate through the east end of the Airport, alleviating substantial traffic volume from those roadways. Access from the taxi hold area to the proposed arrivals frontage roadway would also be a direct route. Taxis would come out of the hold area at grade and climb a short ramp to the terminal frontage road. The ramp is designed with two lanes, providing a holding pocket with direct access to the terminal frontage roads without using the terminal frontage itself by allowing taxis to queue on the ramp while maintaining bypass capability. The proposed Taxi Hold Lot would accommodate 300 vehicles, representing an increase of 80 spaces as compared to the existing conditions. The other taxi hold area, situated between and serving Terminals C and D, would not be affected. Public parking spaces currently located in Parking Lot 4 and displaced by the proposed Taxi Hold Lot would be accommodated by other on-Airport parking. Change: None, although the accommodation of spaces displaced by the taxi hold lot will be accommodated in the new West Garage, necessitating the increase in size of the West Garage from 2,900 to 3,100 spaces. Change: The new West Garage now provides 3,100 spaces on 7 levels based on additional information on parking demand gathered since the 2014 FONSI/ROD and the need to accommodate parking spaces displaced by the new taxi hold lot. The garage was originally presented as a five level garage. There are five levels of elevated parking in the garage as well as
December2015 Chapter 1 1-20
LaGuardia Airport Technical Report CTB Redevelopment Program
parking on the roof and ground floors, for a total of seven levels of parking. The height of the garage remains the same (83 feet above ground level). The increase in 200 spaces is a result of full utilization of rooftop parking, as opposed to partial utilization of rooftop parking in the previously approved (2014) design. The rooftop parking would be covered by a shading structure to meet security requirements. Design refinements since the 2014 EA was released shifted the garage's footprint roughly 35 feet to the west and reduced the footprint to the north by roughly 40 feet. The garage remains substantially similar in size and location, as demonstrated in Figure 3-4.
• Provide for New In-Ground Utilities
All the utilities needed to implement the CTB Redevelopment Program are available within theAirport and are included in the Program; no off-Airport improvements, other than thoseplanned under separate actions, are proposed. There are provisions for electricity, natural gas,sanitary sewer, potable water, storm drainage, and communications. Existing systems would beused to the greatest extent practicable; where it is not practicable, existing systems would bemodified and new equipment installed as needed to meet the requirements of the Program,including all applicable permits, certifications, and approvals.
o Electricity. Any high or medium voltage lines that are within or adjacent to new constructionwould be relocated or replaced as needed to provide electric service to the proposedterminal building and ancillary facilities. The electrical load demand would be provided bythe existing West End Substation (WES) and the new EES, which is now under construction.9
Concrete encased duct banks would be used to enclose cables emanating from the WES andthe EES. The existing Central Electric Substation (CES) will be decommissioned as part of theEES project, upon completion of the EES and connection to electric service.
o Natural Gas. High pressure gas lines including valves, meters, and regulators, would beinstalled to provide natural gas to the proposed terminal building and ancillary facilities.Each gas line would be designed for the total load of the building(s) and all undergroundcoated steel gas piping would use a cathodically protected system to prevent corrosion.
o Sanitary Sewer. Sanitary waste would flow through a force main system consisting ofsanitary sewers, cross-connections and booster pumps, with provisions for sewerageejectors and sump pumps, as needed to meet the requirements of the Program (see Section5.16 for detailed discussion). The sanitary sewers for the proposed terminal would connectto the on-Airport system. The on-Airport system connects to a NYC box culvert, which is notbeing replaced. The new system would be reviewed and approved by New York CityDepartment of Environmental Protection (NYCDEP) once design has progressed. Theproposed layout would be along the landside perimeter of the site parallel to the GrandCentral Parkway with a connection to the existing force main located near Hangars 3 and 5.The location of trenches for sanitary sewers in relationship to trenches for potable watermains would adhere to applicable requirements for separation.
o Water. Domestic water supply is available to meet projected demands, including lowpressure and high pressure water for building systems ranging from basic plumbing to firesuppression, respectively. Layout of new water mains would be along the landside
9 Finding of No Significant Impacts (FONSI) for East End Substation and East Garage at LaGuardia Airport signed by FAA on February 5, 2013. Note that since the 2014 FONSI/ROD, construction on the new EES is substantially complete.
December2015 Chapter 1 1-21
LaGuardia Airport Technical Report CTB Redevelopment Program
perimeter of the site, within the Airport boundaries, parallel to the Grand Central Parkway with connections to existing low and high pressure water mains near Hangars 3 and 5.
o Storm Drainage. The existing drainage system would be retained to the degree practicable. Existing storm drainage pipes would only be removed to accommodate construction of the terminal building or other permanent airside or landside facilities. New, relocated, or modified storm drainage systems would be designed to accommodate a 10-year storm, new and existing storm trunk lines would be interconnected to relieve overloaded conditions, and all storm drain pipes would be checked to verify they can handle existing and proposed peak discharges. Added measures would be taken to minimize risks associated with flooding. Roof drainage from the new terminal would be collected into a proposed closed drainage system to reclaim water for non-potable uses such as toilet flushing. Change: None
• Improve Key Intersections in the Vicinity of the Airport In order to ensure no significant traffic impacts would occur as a result of the construction or operations of the CTB Redevelopment Program, minor improvements would be implemented at several local intersections near the Airport. During construction, improvements such as signal timing adjustments, widening and restriping of lanes, curbside parking prohibitions, installation of a traffic signal, a traffic signal controller upgrade, and use of construction flaggers may be required. Those improvements would be temporary, to reduce delays at those intersections during periods of peak construction activity. Permanent reallocations of green time at three local intersections—coupled with lane restriping, curbside prohibitions and minor reallocations of green time at a fourth intersection—may be required to maintain the intersection levels-of-service under the projected passenger demand. All transportation improvements on local roadways are subject to review and approval by NYCDOT. See Section 5.1 and Appendix A of the 2014 EA for a more detailed description of the improvements. Change: Attachment 4 details new analysis and revised mitigation measures during construction. Note that these changes are not precipitated by the design, which produces minimal roadway changes from the previously approved (2014) design, but later than anticipated project initiation drove the need to work from a new baseline traffic condition. The original baseline conditions modeled were for 2012 traffic, whereas the updated construction conditions traffic analysis considers a 2014 baseline. Traffic conditions have changed in and around the airport since 2012 as there has been general growth in vehicle traffic off airport, as well as an increase in passenger activity at the airport.
1.3.5 Construction Phasing Construction activities would be expected to begin in the third quarter of 2014 (pending environmental approvals) and continue through the year 2021. As shown in Figure 3-5, the CTB Redevelopment Program is divided into multiple major construction phases during which time existing facilities would be demolished and replaced with new facilities. The Airport would remain open during construction; therefore, each phase must be sequenced to maximize passenger levels of service while minimizing potential impacts on airline operations. In general, the roadways and bridges must be relocated to interface with the new terminal building and parking garage. The West Garage would be constructed early in the process. The demolition of Hangars
December2015 Chapter 1 1-22
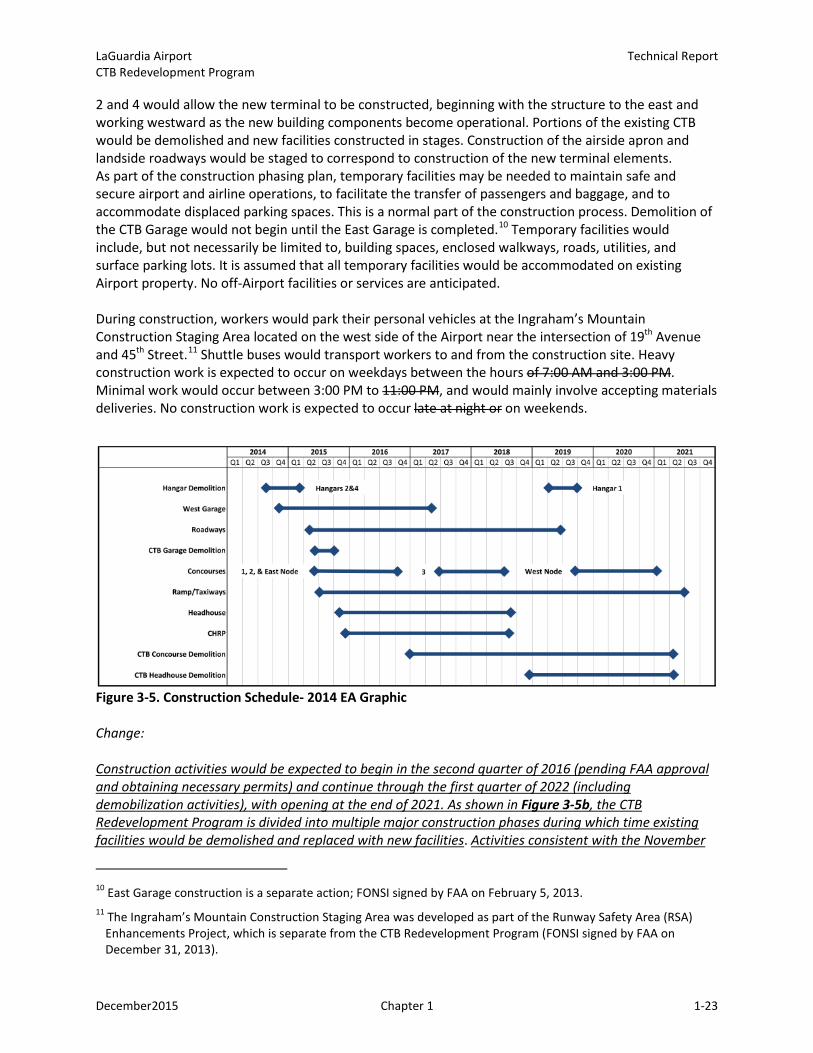
LaGuardia Airport Technical Report CTB Redevelopment Program
2 and 4 would allow the new terminal to be constructed, beginning with the structure to the east and working westward as the new building components become operational. Portions of the existing CTB would be demolished and new facilities constructed in stages. Construction of the airside apron and landside roadways would be staged to correspond to construction of the new terminal elements. As part of the construction phasing plan, temporary facilities may be needed to maintain safe and secure airport and airline operations, to facilitate the transfer of passengers and baggage, and to accommodate displaced parking spaces. This is a normal part of the construction process. Demolition of the CTB Garage would not begin until the East Garage is completed.10 Temporary facilities would include, but not necessarily be limited to, building spaces, enclosed walkways, roads, utilities, and surface parking lots. It is assumed that all temporary facilities would be accommodated on existing Airport property. No off-Airport facilities or services are anticipated. During construction, workers would park their personal vehicles at the Ingraham’s Mountain Construction Staging Area located on the west side of the Airport near the intersection of 19th Avenue and 45th Street.11 Shuttle buses would transport workers to and from the construction site. Heavy construction work is expected to occur on weekdays between the hours of 7:00 AM and 3:00 PM. Minimal work would occur between 3:00 PM to 11:00 PM, and would mainly involve accepting materials deliveries. No construction work is expected to occur late at night or on weekends.
Figure 3-5. Construction Schedule- 2014 EA Graphic Change: Construction activities would be expected to begin in the second quarter of 2016 (pending FAA approval and obtaining necessary permits) and continue through the first quarter of 2022 (including demobilization activities), with opening at the end of 2021. As shown in Figure 3-5b, the CTB Redevelopment Program is divided into multiple major construction phases during which time existing facilities would be demolished and replaced with new facilities. Activities consistent with the November
10 East Garage construction is a separate action; FONSI signed by FAA on February 5, 2013. 11 The Ingraham’s Mountain Construction Staging Area was developed as part of the Runway Safety Area (RSA)
Enhancements Project, which is separate from the CTB Redevelopment Program (FONSI signed by FAA on December 31, 2013).
December2015 Chapter 1 1-23
LaGuardia Airport Technical Report CTB Redevelopment Program
2014 EA, such as the demolition of Hangars 2 and 4 and other site work, began in 2014 and is continuing apace. Hangars 2 and 4 were demolished during the summer of 2015 in accordance with the MOA.
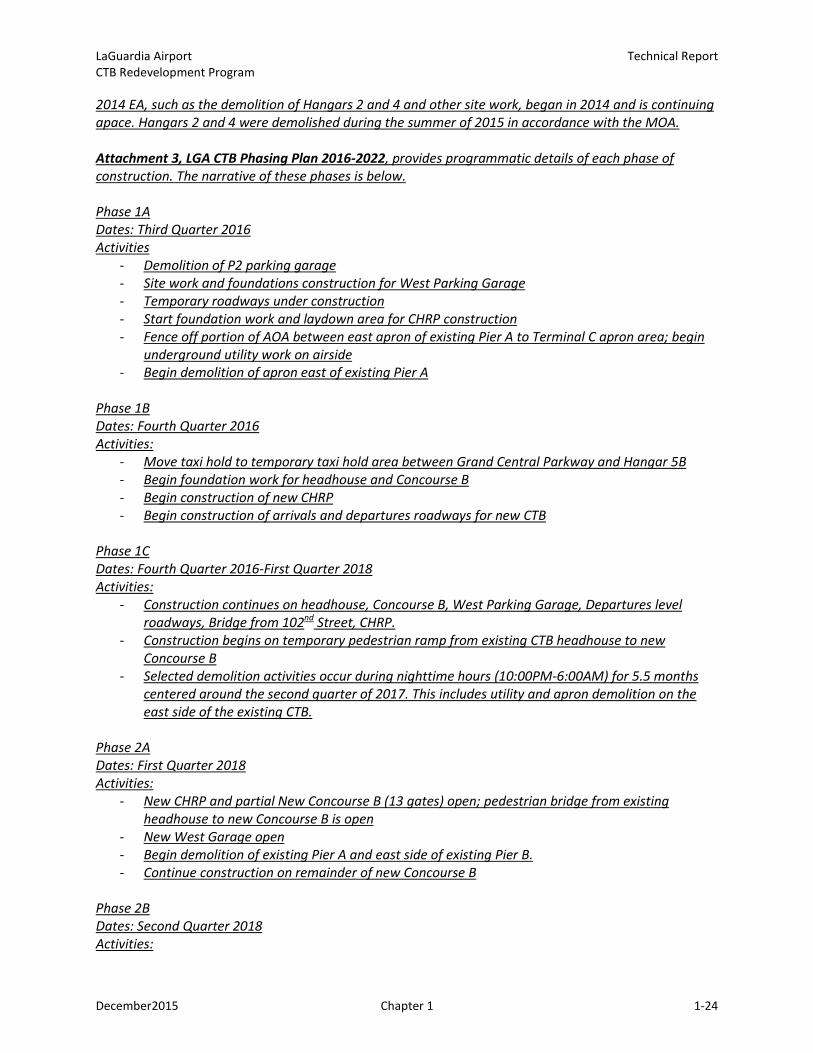
Attachment 3, LGA CTB Phasing Plan 2016-2022, provides programmatic details of each phase of construction. The narrative of these phases is below.
Phase 1A Dates: Third Quarter 2016 Activities
- Demolition of P2 parking garage - Site work and foundations construction for West Parking Garage - Temporary roadways under construction - Start foundation work and laydown area for CHRP construction - Fence off portion of AOA between east apron of existing Pier A to Terminal C apron area; begin
underground utility work on airside - Begin demolition of apron east of existing Pier A
Phase 1B Dates: Fourth Quarter 2016 Activities:
- Move taxi hold to temporary taxi hold area between Grand Central Parkway and Hangar 5B - Begin foundation work for headhouse and Concourse B - Begin construction of new CHRP - Begin construction of arrivals and departures roadways for new CTB
Phase 1C Dates: Fourth Quarter 2016-First Quarter 2018 Activities:
- Construction continues on headhouse, Concourse B, West Parking Garage, Departures level roadways, Bridge from 102nd Street, CHRP.
- Construction begins on temporary pedestrian ramp from existing CTB headhouse to new Concourse B
- Selected demolition activities occur during nighttime hours (10:00PM-6:00AM) for 5.5 months centered around the second quarter of 2017. This includes utility and apron demolition on the east side of the existing CTB.
Phase 2A Dates: First Quarter 2018 Activities:
- New CHRP and partial New Concourse B (13 gates) open; pedestrian bridge from existing headhouse to new Concourse B is open
- New West Garage open - Begin demolition of existing Pier A and east side of existing Pier B. - Continue construction on remainder of new Concourse B
Phase 2B Dates: Second Quarter 2018 Activities:
December2015 Chapter 1 1-24
LaGuardia Airport Technical Report CTB Redevelopment Program
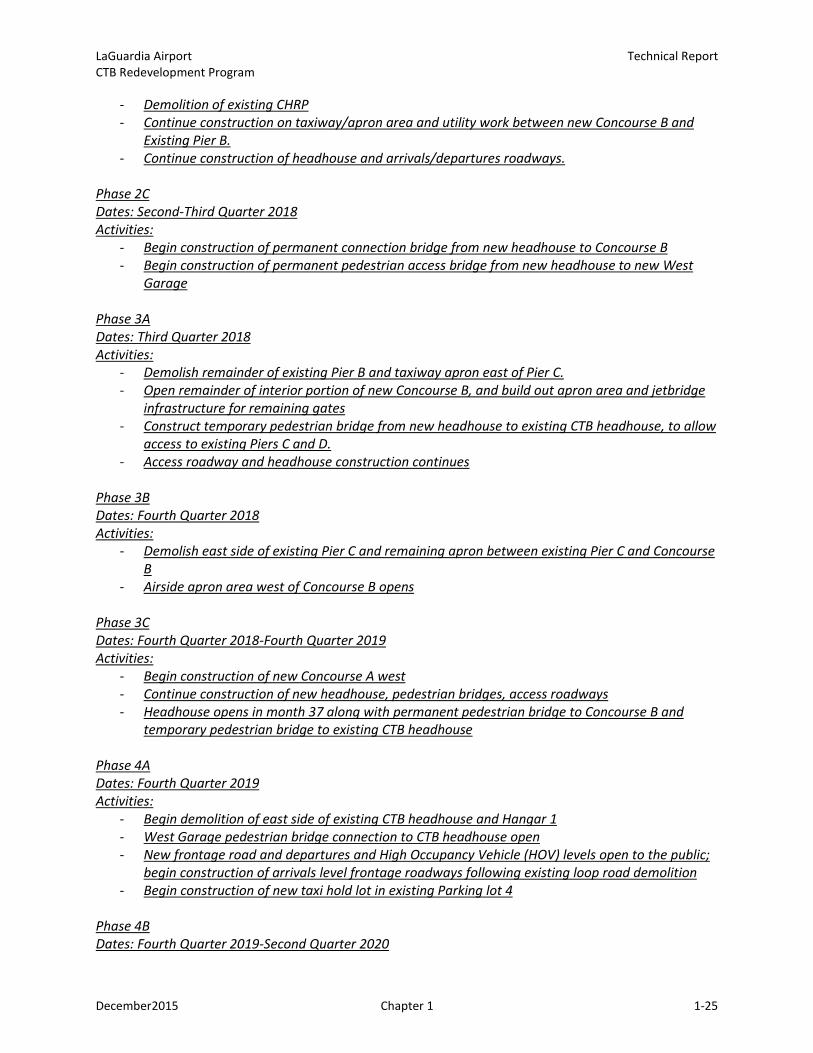
- Demolition of existing CHRP - Continue construction on taxiway/apron area and utility work between new Concourse B and
Existing Pier B. - Continue construction of headhouse and arrivals/departures roadways.
Phase 2C Dates: Second-Third Quarter 2018 Activities:
- Begin construction of permanent connection bridge from new headhouse to Concourse B - Begin construction of permanent pedestrian access bridge from new headhouse to new West
Garage Phase 3A Dates: Third Quarter 2018 Activities:
- Demolish remainder of existing Pier B and taxiway apron east of Pier C. - Open remainder of interior portion of new Concourse B, and build out apron area and jetbridge
infrastructure for remaining gates - Construct temporary pedestrian bridge from new headhouse to existing CTB headhouse, to allow
access to existing Piers C and D. - Access roadway and headhouse construction continues
Phase 3B Dates: Fourth Quarter 2018 Activities:
- Demolish east side of existing Pier C and remaining apron between existing Pier C and Concourse B
- Airside apron area west of Concourse B opens Phase 3C Dates: Fourth Quarter 2018-Fourth Quarter 2019 Activities:
- Begin construction of new Concourse A west - Continue construction of new headhouse, pedestrian bridges, access roadways - Headhouse opens in month 37 along with permanent pedestrian bridge to Concourse B and
temporary pedestrian bridge to existing CTB headhouse Phase 4A Dates: Fourth Quarter 2019 Activities:
- Begin demolition of east side of existing CTB headhouse and Hangar 1 - West Garage pedestrian bridge connection to CTB headhouse open - New frontage road and departures and High Occupancy Vehicle (HOV) levels open to the public;
begin construction of arrivals level frontage roadways following existing loop road demolition - Begin construction of new taxi hold lot in existing Parking lot 4
Phase 4B Dates: Fourth Quarter 2019-Second Quarter 2020
December2015 Chapter 1 1-25
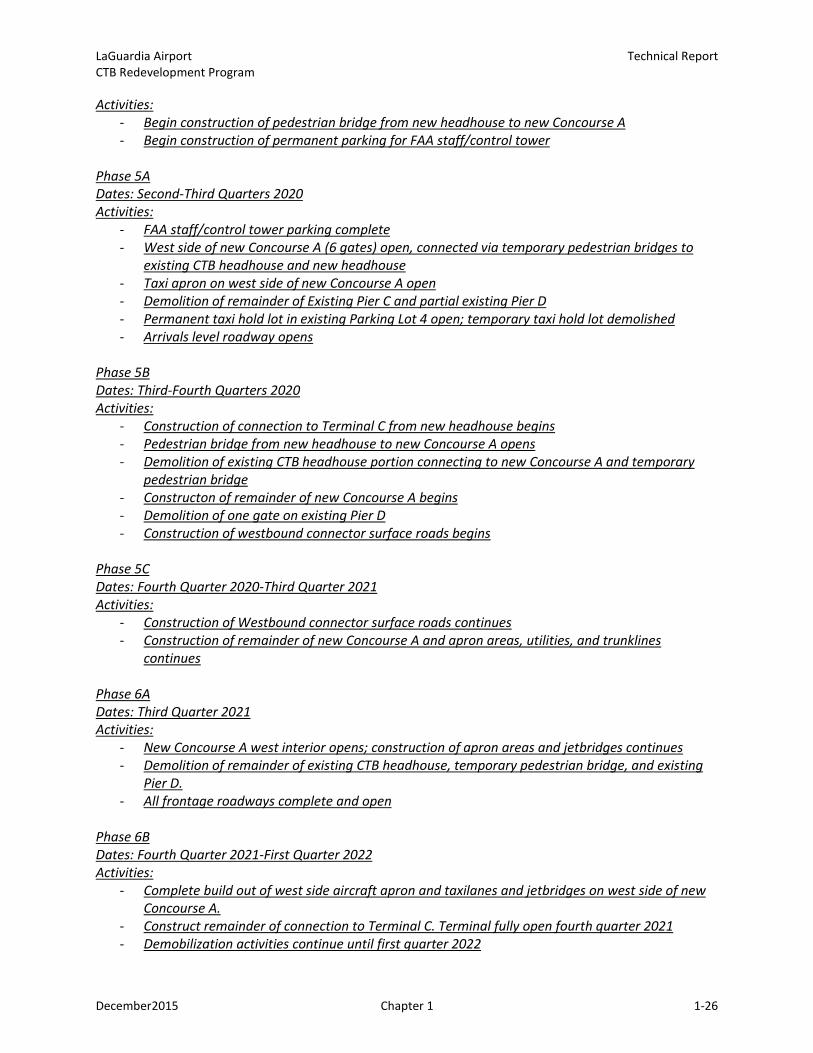
LaGuardia Airport Technical Report CTB Redevelopment Program
Activities: - Begin construction of pedestrian bridge from new headhouse to new Concourse A - Begin construction of permanent parking for FAA staff/control tower
Phase 5A Dates: Second-Third Quarters 2020 Activities:
- FAA staff/control tower parking complete - West side of new Concourse A (6 gates) open, connected via temporary pedestrian bridges to
existing CTB headhouse and new headhouse - Taxi apron on west side of new Concourse A open - Demolition of remainder of Existing Pier C and partial existing Pier D - Permanent taxi hold lot in existing Parking Lot 4 open; temporary taxi hold lot demolished - Arrivals level roadway opens
Phase 5B Dates: Third-Fourth Quarters 2020 Activities:
- Construction of connection to Terminal C from new headhouse begins - Pedestrian bridge from new headhouse to new Concourse A opens - Demolition of existing CTB headhouse portion connecting to new Concourse A and temporary
pedestrian bridge - Constructon of remainder of new Concourse A begins - Demolition of one gate on existing Pier D - Construction of westbound connector surface roads begins
Phase 5C Dates: Fourth Quarter 2020-Third Quarter 2021 Activities:
- Construction of Westbound connector surface roads continues - Construction of remainder of new Concourse A and apron areas, utilities, and trunklines
continues
Phase 6A Dates: Third Quarter 2021 Activities:
- New Concourse A west interior opens; construction of apron areas and jetbridges continues - Demolition of remainder of existing CTB headhouse, temporary pedestrian bridge, and existing
Pier D. - All frontage roadways complete and open
Phase 6B Dates: Fourth Quarter 2021-First Quarter 2022 Activities:
- Complete build out of west side aircraft apron and taxilanes and jetbridges on west side of new Concourse A.
- Construct remainder of connection to Terminal C. Terminal fully open fourth quarter 2021 - Demobilization activities continue until first quarter 2022
December2015 Chapter 1 1-26
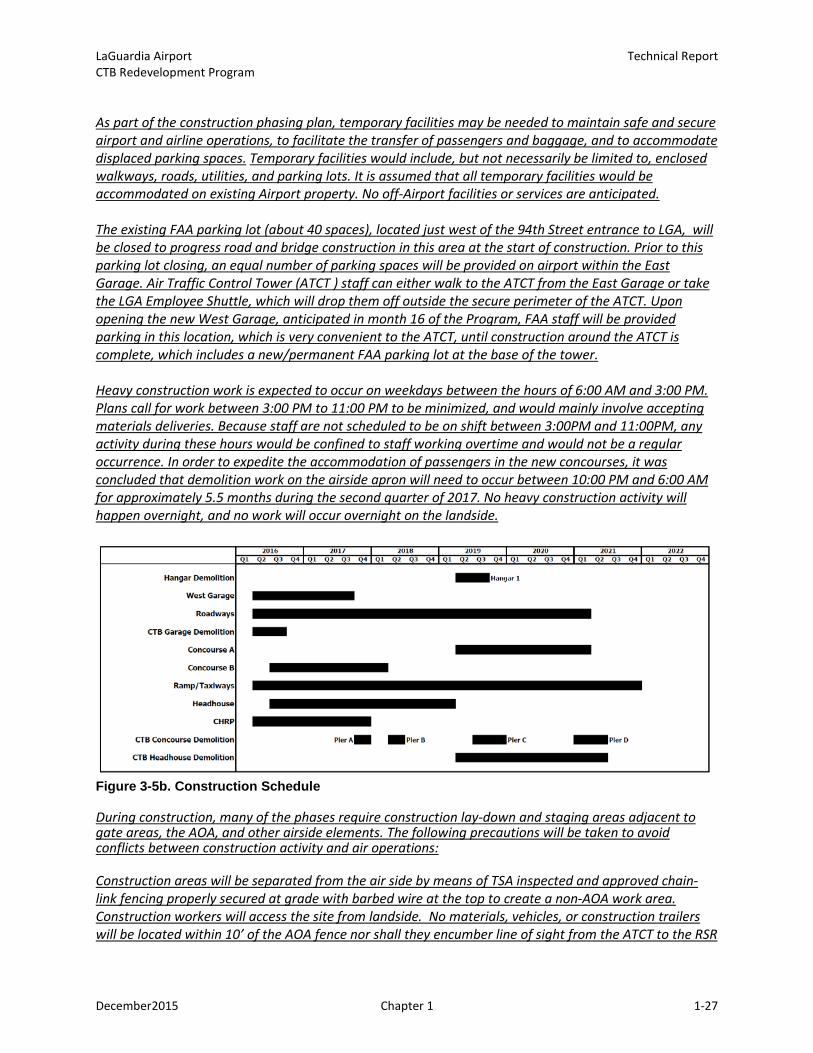
LaGuardia Airport Technical Report CTB Redevelopment Program
As part of the construction phasing plan, temporary facilities may be needed to maintain safe and secure airport and airline operations, to facilitate the transfer of passengers and baggage, and to accommodate displaced parking spaces. Temporary facilities would include, but not necessarily be limited to, enclosed walkways, roads, utilities, and parking lots. It is assumed that all temporary facilities would be accommodated on existing Airport property. No off-Airport facilities or services are anticipated. The existing FAA parking lot (about 40 spaces), located just west of the 94th Street entrance to LGA, will be closed to progress road and bridge construction in this area at the start of construction. Prior to this parking lot closing, an equal number of parking spaces will be provided on airport within the East Garage. Air Traffic Control Tower (ATCT ) staff can either walk to the ATCT from the East Garage or take the LGA Employee Shuttle, which will drop them off outside the secure perimeter of the ATCT. Upon opening the new West Garage, anticipated in month 16 of the Program, FAA staff will be provided parking in this location, which is very convenient to the ATCT, until construction around the ATCT is complete, which includes a new/permanent FAA parking lot at the base of the tower. Heavy construction work is expected to occur on weekdays between the hours of 6:00 AM and 3:00 PM. Plans call for work between 3:00 PM to 11:00 PM to be minimized, and would mainly involve accepting materials deliveries. Because staff are not scheduled to be on shift between 3:00PM and 11:00PM, any activity during these hours would be confined to staff working overtime and would not be a regular occurrence. In order to expedite the accommodation of passengers in the new concourses, it was concluded that demolition work on the airside apron will need to occur between 10:00 PM and 6:00 AM for approximately 5.5 months during the second quarter of 2017. No heavy construction activity will happen overnight, and no work will occur overnight on the landside.
Figure 3-5b. Construction Schedule
During construction, many of the phases require construction lay-down and staging areas adjacent to gate areas, the AOA, and other airside elements. The following precautions will be taken to avoid conflicts between construction activity and air operations:
Construction areas will be separated from the air side by means of TSA inspected and approved chain-link fencing properly secured at grade with barbed wire at the top to create a non-AOA work area. Construction workers will access the site from landside. No materials, vehicles, or construction trailers will be located within 10’ of the AOA fence nor shall they encumber line of sight from the ATCT to the RSR
December2015 Chapter 1 1-27
LaGuardia Airport Technical Report CTB Redevelopment Program
road, taxilanes, or aircraft parking apron. Gates from the non-AOA work area onto the AOA will be staffed with approved security personal. All deliveries to or from the work sites that enter the AOA (after airfield operating hours) using the RSR will be inspected and escorted using approved escort personnel and properly signed and identified vehicles. In addition, 7460 Crane permits will be submitted for each crane type, height, location, and phase.
LGP will develop a project specific FOD Management Program per the guidelines identified in U.S. Department of Transportation/Federal Aviation Administrant Advisory Circular No. 150/2510-24 and any subsequent revisions thereof. LGP will review the current PA FOD Program for LGA and incorporate current PA requirements and develop our program around the following elements:
• Prevention• Detection• Removal• Evaluation
The FOD Management Program will be administered jointly by the LGP Operations Team and the Skanska Walsh Joint Venture on-site safety team.
Dust will be continuously monitored and controlled using water sprayed during demolition of apron, taxilanes, and buildings. Subsurface utility and foundation work will be closely monitored to ensure that dust generated is controlled. Skanska Walsh will maintain a fleet of water trucks, sprayers, and sweeper trucks throughout the construction phase and the Skanska Walsh site superintendent will maintain direct communications with the PA and FAA to ensure that dust control is maintained at all times.
Site access phase by phase is envisioned from both landside (during airfield operating hours) and via the AOA from Gate 1 using the RSR roadway (during no-airfield operating hours). Truck access and egress for material and equipment deliveries and removal of debris will be scheduled to limit impact on passenger traffic during peak operating hours and coordinated with the PA Airport Operations staff. Site access during non-operating hours will be coordinated and cleared through a predetermined process approved by the FAA. All trucks used to remove demolition and other debris from the site will be covered. See Attachment 10-Logistics Site Plan
Construction fencing to create non-airside work areas will be identified in the phase by phase logistic plans submitted for approval by the JHA. These plans will identify fence locations and detail designs, and locate construction trailers and other fixed equipment in locations that do not impact line of site from the ATCT to the RSR. As stated above, 7460 Crane Permit documentation will establish crane location zones.
1.4 Summary
Chapters 2-7 detail specific changes to design criteria between the originally approved design and the proposed design changes. The technical report organized according to the Chapter Format of the November 2014 EA.
December2015 Chapter 1 1-28

LaGuardia Airport Technical Report CTB Redevelopment Program
2 Purpose and Need The LGA CTB EA Purpose and Need chapter provided a statement of purpose and need for the CTB Redevelopment Program. PANYNJ has reviewed the proposed design changes to ensure that they continue to meet the purpose and need defined in the EA. There is no change in the purpose and need as part of this Technical Report.
Statement of Purpose and Need
The CTB Redevelopment Program is needed because:
• The existing CTB and ancillary facilities are already severely constrained and unable toadequately handle current air service or future passenger demand.
• Faced with higher air passenger demand and the need to switch to larger aircraft to meet thosedemands, the CTB would incur substantially worsened levels of delay throughout the day whilebeing unable to meet the projected changes in aircraft and their large passenger loads.
The purpose of the Redevelopment Program is to efficiently enable the CTB to safely and effectively accommodate forecasted increases in aircraft size and passenger demand at acceptable levels of service by:
• Improving airline efficiency and operational safety on the airside apron in order to handle thetransition to larger aircraft;
• Improving passenger throughput capacity and convenience throughout the terminal;• Improving parking operations and traffic circulation and flow along the terminal’s landside
roadways.
Implementation of the Redevelopment Program would serve the public interest by meeting the air transportation needs of the FAA, Transportation Security Administration (TSA), PANYNJ, LaGuardia Airport, the airlines, and passengers.
Change: There is no change to the purpose and need of the project.
December 2015 Chapter 2 – Purpose and Need 2-1

LaGuardia Airport Technical Report CTB Redevelopment Program
This page intentionally left blank.
December 2015 Chapter 2 – Purpose and Need 2-2
LaGuardia Airport Technical Report CTB Redevelopment Program
3 Alternatives The 2014 CTB EA identified and evaluated all potential adverse impacts on the human and natural environments that are expected to result from the implementation of the CTB Redevelopment Program and No-Build/No-Action Alternatives. Numerous other alternatives were considered during the planning phases of the project, but were eliminated from further detailed environmental review. One of the alternatives that was considered and rejected in the November 2014 EA was the “island” concept (“Concept B”). While not identical it is a similar concept to the proposed design changes. The reasons for rejecting Concept B included perceived difficulties in construction phasing and higher overall project cost. The proposed design changes have addressed these deficiencies as detailed in this section. The proposed design changes utilize dual islands, rather than the single island envisioned in Concept B, and provide for a headhouse that can be built wholly within the footprint of existing Parking Garage 2. Compared to Concept B, the proposed design changes allow for more efficient phasing and substantial cost savings as compared to the preferred alternative from the 2014 EA as well as Concept B. The November 2014 EA stated “for early phase planning and evaluation purposes, because Concepts A, B, and C occur within a given project site where the same basic facility requirements are met with each concept and virtually no natural resources exist within the almost entirely developed project site, it was assumed that the potential for long-term development impacts on the affected resources would be essentially the same regardless of the concept selected. However, temporary air, noise, and traffic impacts would vary based on the duration of construction phase activities.” For this reason, impacts on air, noise, and traffic are fully examined in Chapter 5, given the change in duration of construction phase activities. Deficiencies identified in the original alternative analysis are examined in Table 3-2. The original alternatives section from the previously approved (2014) design is included below for reference.
December 2015 Chapter 3 – Alternatives 3-1
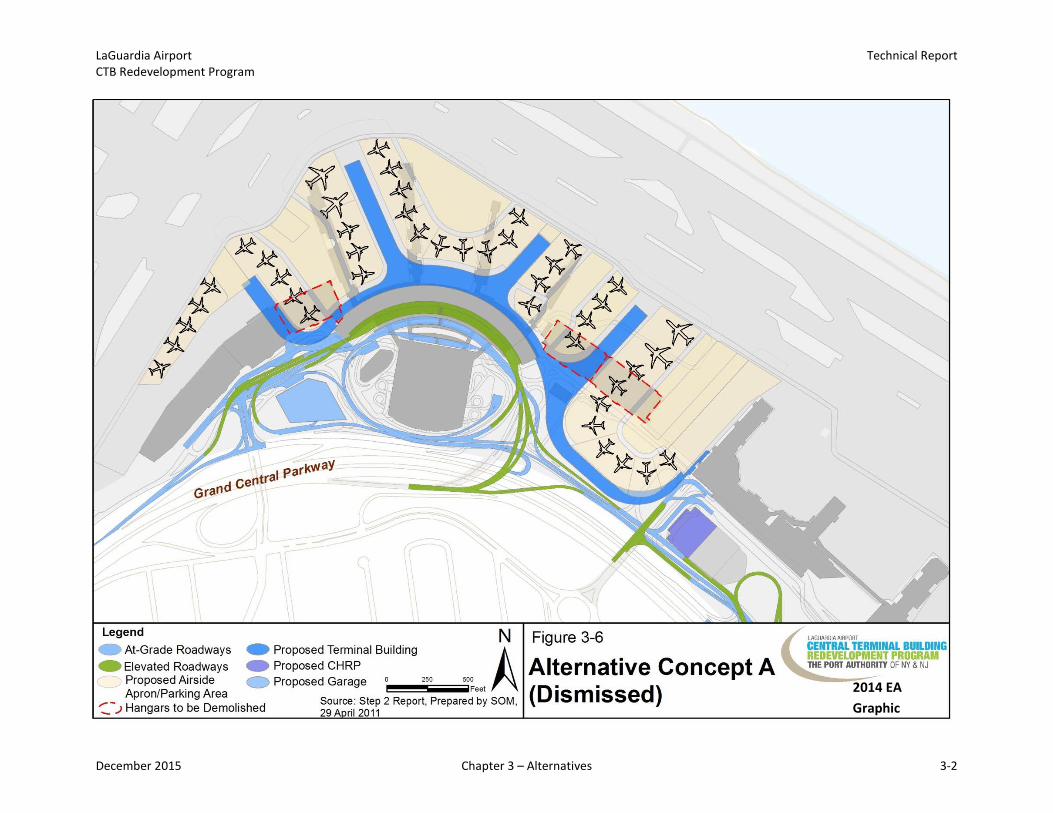
LaGuardia Airport Technical Report CTB Redevelopment Program
Figure 3-6. Alternative Concept A (Dismissed)
2014 EA Graphic
December 2015 Chapter 3 – Alternatives 3-2
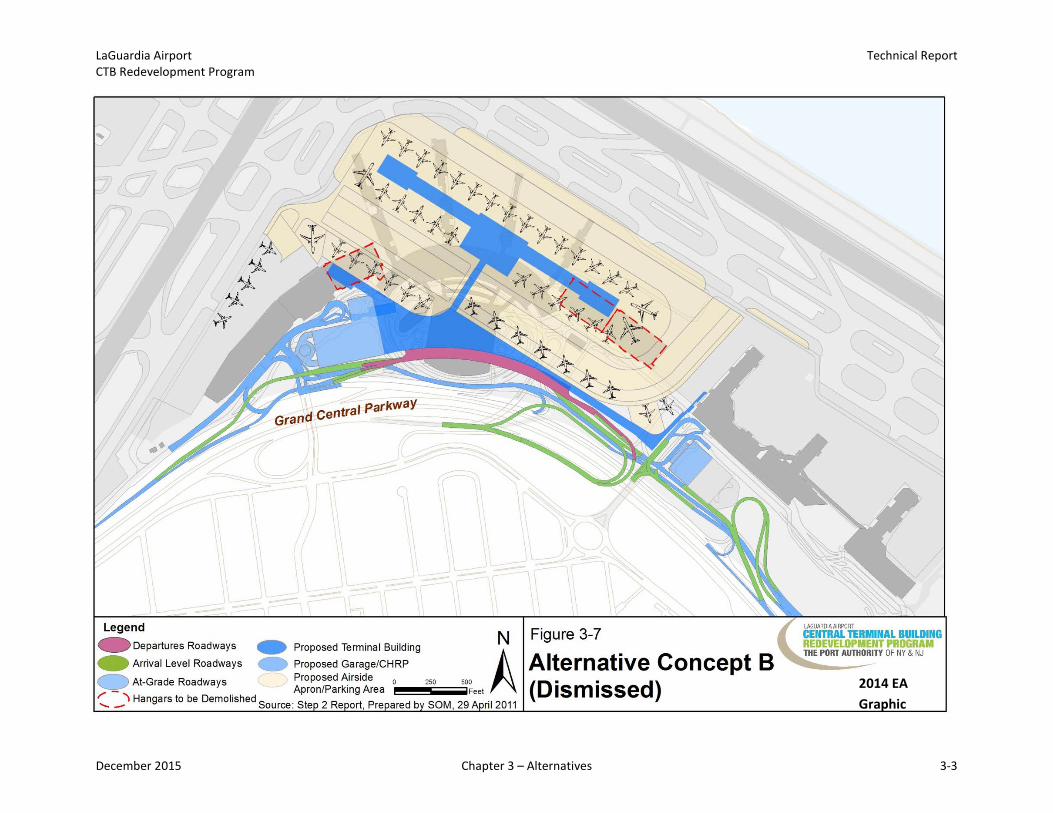
LaGuardia Airport Technical Report CTB Redevelopment Program
Figure 3-7. Alternative Concept B (Dismissed)
2014 EA Graphic
December 2015 Chapter 3 – Alternatives 3-3
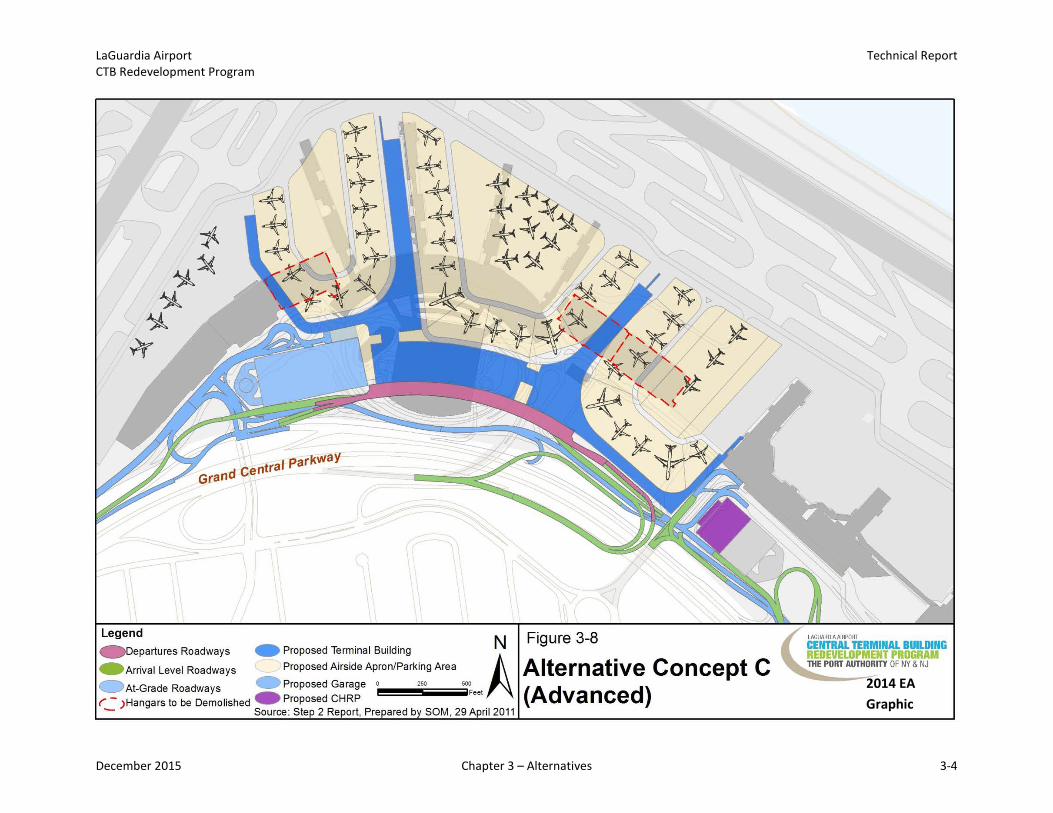
LaGuardia Airport Technical Report CTB Redevelopment Program
Figure 3-8. Alternative Concept C (Advanced)
2014 EA Graphic
December 2015 Chapter 3 – Alternatives 3-4
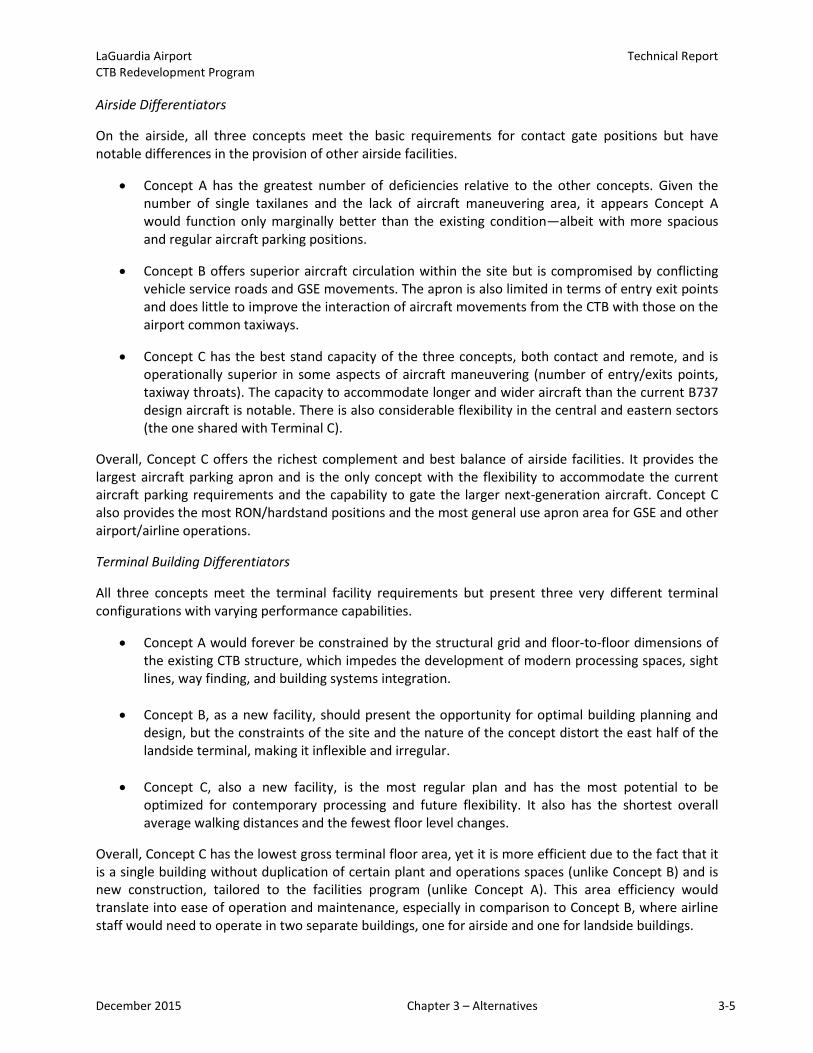
LaGuardia Airport Technical Report CTB Redevelopment Program
Airside Differentiators
On the airside, all three concepts meet the basic requirements for contact gate positions but have notable differences in the provision of other airside facilities.
• Concept A has the greatest number of deficiencies relative to the other concepts. Given the number of single taxilanes and the lack of aircraft maneuvering area, it appears Concept A would function only marginally better than the existing condition—albeit with more spacious and regular aircraft parking positions.
• Concept B offers superior aircraft circulation within the site but is compromised by conflicting vehicle service roads and GSE movements. The apron is also limited in terms of entry exit points and does little to improve the interaction of aircraft movements from the CTB with those on the airport common taxiways.
• Concept C has the best stand capacity of the three concepts, both contact and remote, and is operationally superior in some aspects of aircraft maneuvering (number of entry/exits points, taxiway throats). The capacity to accommodate longer and wider aircraft than the current B737 design aircraft is notable. There is also considerable flexibility in the central and eastern sectors (the one shared with Terminal C).
Overall, Concept C offers the richest complement and best balance of airside facilities. It provides the largest aircraft parking apron and is the only concept with the flexibility to accommodate the current aircraft parking requirements and the capability to gate the larger next-generation aircraft. Concept C also provides the most RON/hardstand positions and the most general use apron area for GSE and other airport/airline operations.
Terminal Building Differentiators
All three concepts meet the terminal facility requirements but present three very different terminal configurations with varying performance capabilities.
• Concept A would forever be constrained by the structural grid and floor-to-floor dimensions of the existing CTB structure, which impedes the development of modern processing spaces, sight lines, way finding, and building systems integration.
• Concept B, as a new facility, should present the opportunity for optimal building planning and design, but the constraints of the site and the nature of the concept distort the east half of the landside terminal, making it inflexible and irregular.
• Concept C, also a new facility, is the most regular plan and has the most potential to be optimized for contemporary processing and future flexibility. It also has the shortest overall average walking distances and the fewest floor level changes.
Overall, Concept C has the lowest gross terminal floor area, yet it is more efficient due to the fact that it is a single building without duplication of certain plant and operations spaces (unlike Concept B) and is new construction, tailored to the facilities program (unlike Concept A). This area efficiency would translate into ease of operation and maintenance, especially in comparison to Concept B, where airline staff would need to operate in two separate buildings, one for airside and one for landside buildings.
December 2015 Chapter 3 – Alternatives 3-5
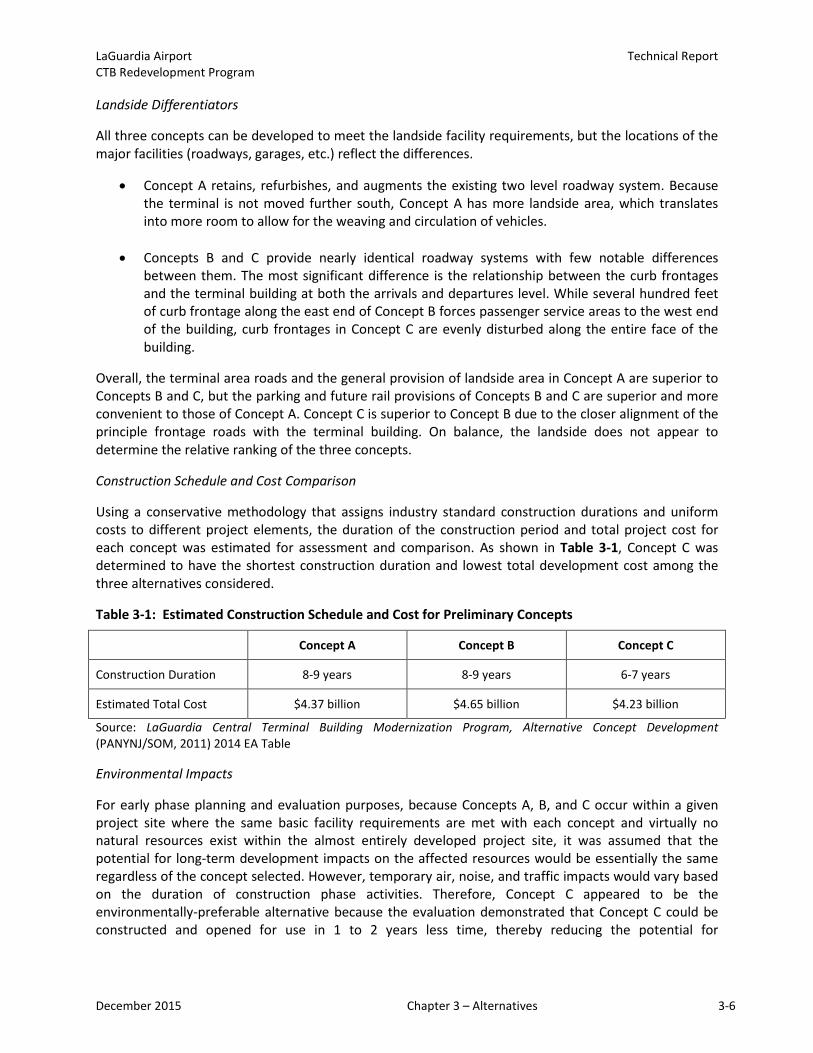
LaGuardia Airport Technical Report CTB Redevelopment Program
Landside Differentiators
All three concepts can be developed to meet the landside facility requirements, but the locations of the major facilities (roadways, garages, etc.) reflect the differences.
• Concept A retains, refurbishes, and augments the existing two level roadway system. Becausethe terminal is not moved further south, Concept A has more landside area, which translatesinto more room to allow for the weaving and circulation of vehicles.
• Concepts B and C provide nearly identical roadway systems with few notable differencesbetween them. The most significant difference is the relationship between the curb frontagesand the terminal building at both the arrivals and departures level. While several hundred feetof curb frontage along the east end of Concept B forces passenger service areas to the west endof the building, curb frontages in Concept C are evenly disturbed along the entire face of thebuilding.
Overall, the terminal area roads and the general provision of landside area in Concept A are superior to Concepts B and C, but the parking and future rail provisions of Concepts B and C are superior and more convenient to those of Concept A. Concept C is superior to Concept B due to the closer alignment of the principle frontage roads with the terminal building. On balance, the landside does not appear to determine the relative ranking of the three concepts.
Construction Schedule and Cost Comparison
Using a conservative methodology that assigns industry standard construction durations and uniform costs to different project elements, the duration of the construction period and total project cost for each concept was estimated for assessment and comparison. As shown in Table 3-1, Concept C was determined to have the shortest construction duration and lowest total development cost among the three alternatives considered.
Table 3-1: Estimated Construction Schedule and Cost for Preliminary Concepts
Concept A Concept B Concept C
Construction Duration 8-9 years 8-9 years 6-7 years
Estimated Total Cost $4.37 billion $4.65 billion $4.23 billion
Source: LaGuardia Central Terminal Building Modernization Program, Alternative Concept Development (PANYNJ/SOM, 2011) 2014 EA Table
Environmental Impacts
For early phase planning and evaluation purposes, because Concepts A, B, and C occur within a given project site where the same basic facility requirements are met with each concept and virtually no natural resources exist within the almost entirely developed project site, it was assumed that the potential for long-term development impacts on the affected resources would be essentially the same regardless of the concept selected. However, temporary air, noise, and traffic impacts would vary based on the duration of construction phase activities. Therefore, Concept C appeared to be the environmentally-preferable alternative because the evaluation demonstrated that Concept C could be constructed and opened for use in 1 to 2 years less time, thereby reducing the potential for
December 2015 Chapter 3 – Alternatives 3-6
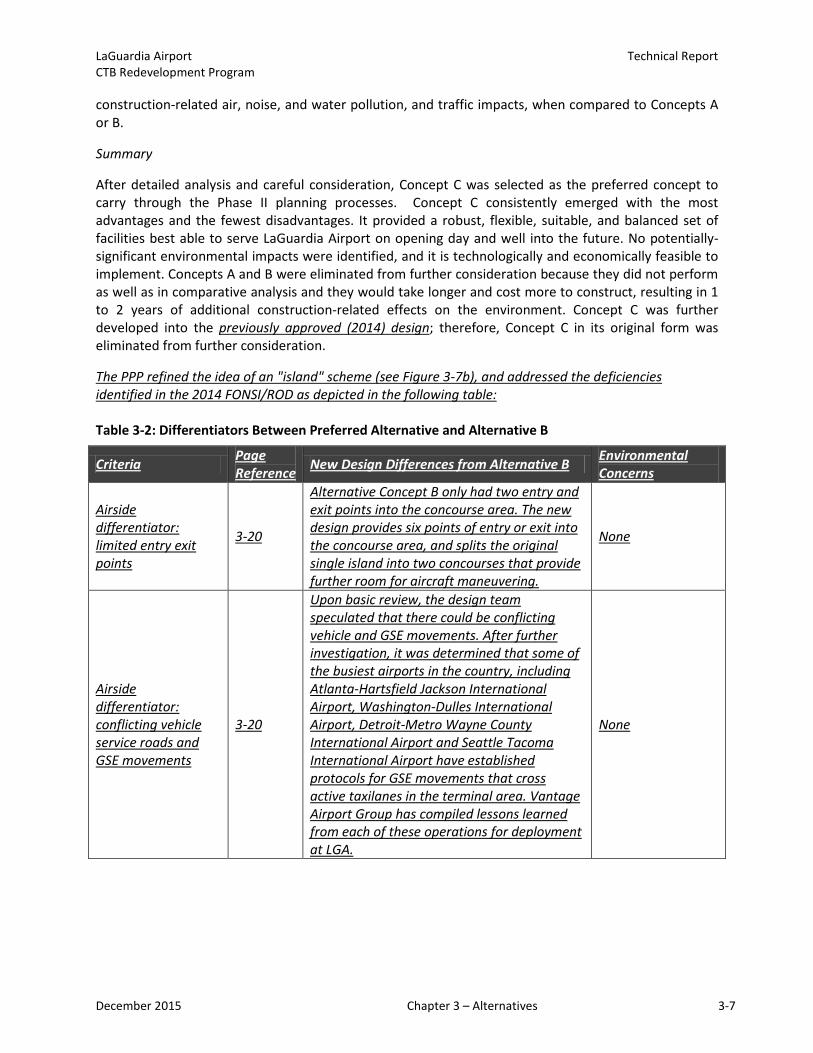
LaGuardia Airport Technical Report CTB Redevelopment Program
construction-related air, noise, and water pollution, and traffic impacts, when compared to Concepts A or B.
Summary
After detailed analysis and careful consideration, Concept C was selected as the preferred concept to carry through the Phase II planning processes. Concept C consistently emerged with the most advantages and the fewest disadvantages. It provided a robust, flexible, suitable, and balanced set of facilities best able to serve LaGuardia Airport on opening day and well into the future. No potentially-significant environmental impacts were identified, and it is technologically and economically feasible to implement. Concepts A and B were eliminated from further consideration because they did not perform as well as in comparative analysis and they would take longer and cost more to construct, resulting in 1 to 2 years of additional construction-related effects on the environment. Concept C was further developed into the previously approved (2014) design; therefore, Concept C in its original form was eliminated from further consideration.
The PPP refined the idea of an "island" scheme (see Figure 3-7b), and addressed the deficiencies identified in the 2014 FONSI/ROD as depicted in the following table:
Table 3-2: Differentiators Between Preferred Alternative and Alternative B
Criteria Page Reference New Design Differences from Alternative B Environmental
Concerns
Airside differentiator: limited entry exit points
3-20
Alternative Concept B only had two entry and exit points into the concourse area. The new design provides six points of entry or exit into the concourse area, and splits the original single island into two concourses that provide further room for aircraft maneuvering.
None
Airside differentiator: conflicting vehicle service roads and GSE movements
3-20
Upon basic review, the design team speculated that there could be conflicting vehicle and GSE movements. After further investigation, it was determined that some of the busiest airports in the country, including Atlanta-Hartsfield Jackson International Airport, Washington-Dulles International Airport, Detroit-Metro Wayne County International Airport and Seattle Tacoma International Airport have established protocols for GSE movements that cross active taxilanes in the terminal area. Vantage Airport Group has compiled lessons learned from each of these operations for deployment at LGA.
None
December 2015 Chapter 3 – Alternatives 3-7
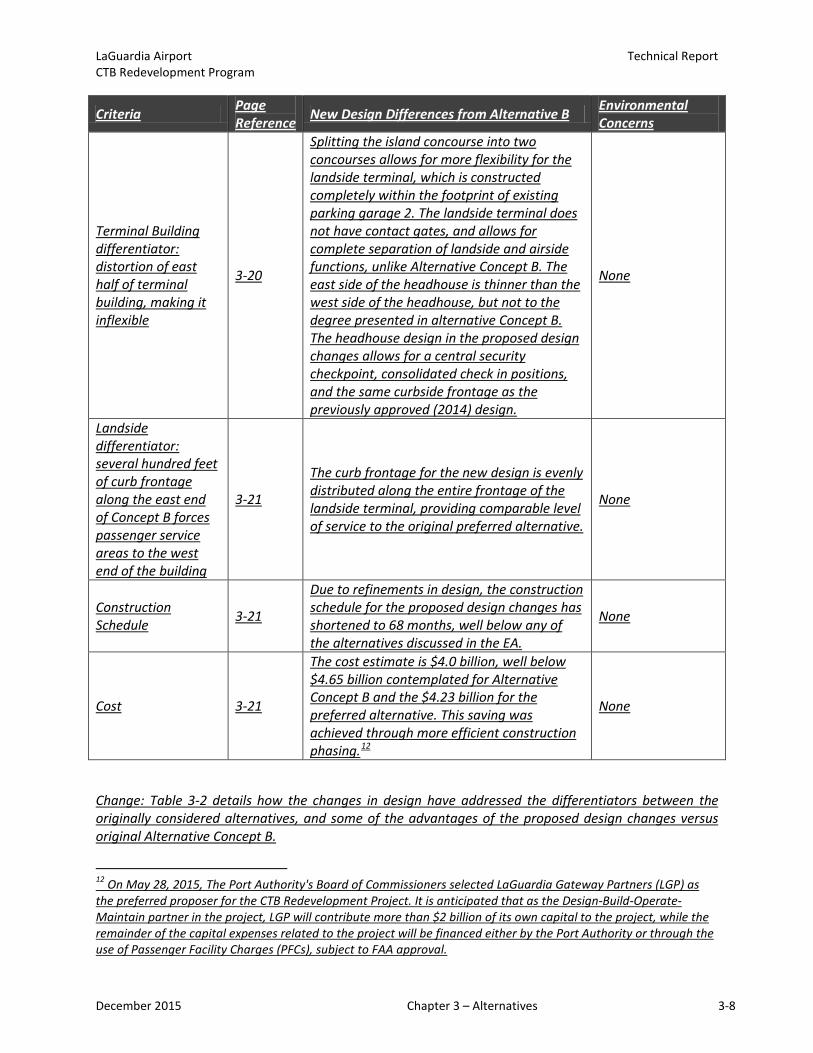
LaGuardia Airport Technical Report CTB Redevelopment Program
Criteria Page Reference New Design Differences from Alternative B Environmental
Concerns
Terminal Building differentiator: distortion of east half of terminal building, making it inflexible
3-20
Splitting the island concourse into two concourses allows for more flexibility for the landside terminal, which is constructed completely within the footprint of existing parking garage 2. The landside terminal does not have contact gates, and allows for complete separation of landside and airside functions, unlike Alternative Concept B. The east side of the headhouse is thinner than the west side of the headhouse, but not to the degree presented in alternative Concept B. The headhouse design in the proposed design changes allows for a central security checkpoint, consolidated check in positions, and the same curbside frontage as the previously approved (2014) design.
None
Landside differentiator: several hundred feet of curb frontage along the east end of Concept B forces passenger service areas to the west end of the building
3-21
The curb frontage for the new design is evenly distributed along the entire frontage of the landside terminal, providing comparable level of service to the original preferred alternative.
None
Construction Schedule 3-21
Due to refinements in design, the construction schedule for the proposed design changes has shortened to 68 months, well below any of the alternatives discussed in the EA.
None
Cost 3-21
The cost estimate is $4.0 billion, well below $4.65 billion contemplated for Alternative Concept B and the $4.23 billion for the preferred alternative. This saving was achieved through more efficient construction phasing.12
None
Change: Table 3-2 details how the changes in design have addressed the differentiators between the originally considered alternatives, and some of the advantages of the proposed design changes versus original Alternative Concept B.
12 On May 28, 2015, The Port Authority's Board of Commissioners selected LaGuardia Gateway Partners (LGP) as the preferred proposer for the CTB Redevelopment Project. It is anticipated that as the Design-Build-Operate-Maintain partner in the project, LGP will contribute more than $2 billion of its own capital to the project, while the remainder of the capital expenses related to the project will be financed either by the Port Authority or through the use of Passenger Facility Charges (PFCs), subject to FAA approval.
December 2015 Chapter 3 – Alternatives 3-8

LaGuardia Airport Technical Report CTB Redevelopment Program
Overall building efficiency and concerns about duplication of staff and functional areas presented by an island concept are discussed below.
The proposed design changes create significant opportunities for the airlines to manage customer service issues with reduced management staff by:
• For passengers, the distance between the furthest aircraft gates and the ticket lobby in the proposed design changes is 100 feet shorter than the distance from the furthest gate to the ticket lobby in the originally approved (2014) design.
• Staffing of gates for aircraft departures and arrivals are the same for both concepts. However, the concourse layout in the proposed design changes provides improved passenger level of service by creating spacious holdrooms (average holdroom size for the originally approved (2014) design is 2,178 SF and the average holdroom size for the proposed design changes is 2,429 SF), while at the same time providing direct visual contact between gate podium clusters of between 4 and 7 gates each. This significantly improves airline customer service supervision of the boarding and deplaning process.
• The Airlines will provide breakroom and support space at both the concourse (aircraft enplaning and deplaning) and the headhouse (ticketing/baggage service) for “above the wing” under both the originally approved (2014) design (Concept C) and the proposed design changes. There is no additional space requirement or excess duplication of space and function.
• Below the wing support space including break rooms, locker rooms, and ready rooms will be located on the apron level of the concourses in both concepts with no duplication of facilities.
• The single combined baggage makeup room designed in the proposed design changes provides a number of significant improvements from an operations and maintenance and airline utilization perspective over the multiple baggage makeup rooms identified in the originally approved (2014) design (Concept C) including:
o The compact nature (stacked within the headhouse) of the proposed design revision Baggage Handling System (BHS) significantly reduces the response time to clear faults and jams within the system should they occur.
o The overall number of drive units required for the proposed design changes is 60% of the number required for the split baggage makeup room identified in the originally approved (2014) design. This factor alone significantly reduces O&M costs for the BHS.
o The modeled baggage delivery time from the makeup device to the tail of the aircraft is similar in both concepts. The average delivery times from the CBIS to the aircraft based on the following assumptions: baggage handler time to move the bag from the makeup device to the bag cart
is assumed to be similar in all cases in the originally approved (2014) design, assume that a bag is directed from the
west screening area to one of two west baggage makeup room and from the east screening area to one of two east baggage makeup room
High speed delivery conveyors are used from the screening area to the baggage makeup sortation loops in the originally approved (2014) design due to the extended distances and are not necessary in the proposed design changes
Based on the above parameters the delivery time to the average gate in the originally approved (2014) design is 5.05 minutes and in the proposed design changes the time to deliver is 5.16 minutes.
o The central bag room in the proposed design changes provides significantly more utilization flexibility in the common use scenario than split baggage makeup rooms as
December 2015 Chapter 3 – Alternatives 3-9
LaGuardia Airport Technical Report CTB Redevelopment Program
there is not a scenario where a single airline may operate from time to time from two separate baggage makeup rooms due to capacity constraints.
o The island concept does not impact airline baggage handling staff requirements.• From an airside perspective, the ability to have start up positions at each gate reduces ground
crew resources required, due to eliminating the need for aircraft to start up on active taxilanes.• The airside efficiency gains as demonstrated in Attachment 2 reduce delay for passengers and
provide an enhanced experience.
The benefits to the Transportation Security Administration (TSA) provided by the proposed design changes are significant. The TSA Federal Security Director (FSD), Daniel Ronan, at a meeting with the TSA and LaGuardia Gateway Partners on November 4, 2015, stated that the TSA much prefers the single Security Screening Checkpoint (SSCP) in the proposed design changes over the previously approved (2014) design. The preference was based on the single SSCP providing access from the headhouse to both Concourses as compared to the split SSCP found in the previously approved (2014) design (Concept C). There will be a reduction in the supervision required to staff the single checkpoint to access both concourses. The location of the in-line screening rooms (CBIS/CBRA) and the location of the On-Screen Resolution (OSR) directly below the SSCP provide the ability to transfer TSA staff between the SSCP and checked baggage inspection areas quickly and efficiently.
From a passenger perspective, the proposed design changes enhance the way-finding with fewer and simpler decision points. A departing passenger will encounter only two left-right decision points: at the bridge level and at the concourse. Arriving passengers do not have to make a directional decision until at the baggage claim hall. The proposed design changes also provide shorter walking distances as the average walking distance from curb to gate is reduced versus the previously approved (2014) design configuration, it eliminates the need for moving walks in the Concourses, provides full accessibility to common functions, and the flexibility to change the layout over time.
December 2015 Chapter 3 – Alternatives 3-10
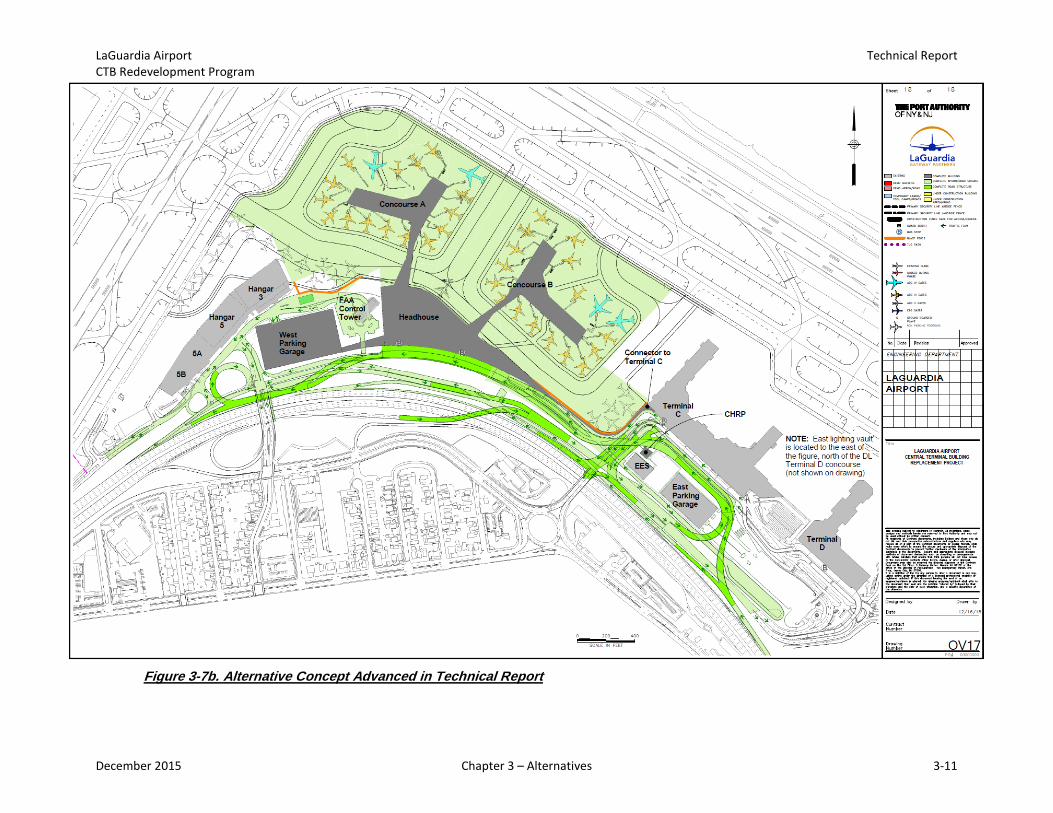
LaGuardia Airport Technical Report CTB Redevelopment Program
Figure 3-7b. Alternative Concept Advanced in Technical Report
December 2015 Chapter 3 – Alternatives 3-11
LaGuardia Airport Technical Report CTB Redevelopment Program
4 Affected Environment Change: The LGA CTB EA Affected Environment chapter provided a description of the existing environmental conditions in and around the vicinity of LGA. PANYNJ has determined the data collected for the EA baseline are still relevant and reasonably representative of existing conditions at the time of this Technical Report because conditions have not changed substantially in and around the vicinity of LGA, other than for the traffic analysis as discussed in Section 4.2.1.
This section briefly describes the project’s location and setting beginning with New York City and ending with the project site. This is followed by discussions of the resources potentially impacted by the CTB Redevelopment Program. The following resources are introduced in this section:
• Traffic and Transportation • Air Quality • Coastal Resources • Compatible Land Use • U.S. DOT Act, Section 4(f) Resources • Fish, Wildlife and Plants • Floodplains • Historic and Archaeological Resources • Noise • Water Resources
The other resource categories typically considered in a NEPA EA are not discussed in this section; however, Chapter 5, Environmental Consequences includes a discussion about all of the resource categories, whether there are impacts in those categories or not.
4.1 Project Location and Setting New York City is located in downstate New York and consists of five boroughs connected by an expansive network of roadways, bridges, tunnels, and ferries used to cross a series of inland and coastal waterways that make up one of the largest natural harbors in the world. The five boroughs—The Bronx, Brooklyn, Manhattan, Queens, and Staten Island—were consolidated into a single city in 1898. With more than 8 million residents living within 300 square miles, New York is the most populous city in the United States and the most densely populated. A global power city, New York exerts a significant impact upon commerce, finance, media, art, fashion, research, technology, education, and entertainment. For this reason, people from across the U.S. and around the world travel to New York City and most use one of its three major airports.
LaGuardia Airport is located in the northern portion of the Borough of Queens, eight miles east of midtown Manhattan, and is New York City’s primary airport for domestic travelers. Queens is the easternmost of the five boroughs, the largest in land area, and the second largest in population. With 2.2 million residents, approximately half of which are foreign born, Queens is one of the most culturally diverse urban areas in the world. Known for tight-knit ethnic communities influenced primarily by Asian and Hispanic cultures, there are residents from over 100 foreign countries speaking over 138 different languages.13 With the second largest economy of the five boroughs, the diversity of Queens’s population is reflected in its employment sectors, which is spread evenly across health care, retail trade,
13 http://www.newyork.com/ny/nyc/queens/ (retrieved November 3, 2014)
December 2015 Chapter 4 – Affected Environment 4-1
LaGuardia Airport Technical Report CTB Redevelopment Program
manufacturing, construction, transportation, and film and television production. Queens is well served by all modes of transportation including two of New York City’s three major airports—JFK and LaGuardia—for which citywide public transit for arriving and departing passengers is offered.
LaGuardia Airport consists of 680 acres bordered by Flushing Bay and Bowery Bay to the north and the Grand Central Parkway to the south. North and east of the Airport, the Riker’s Island correctional facility is located across Riker’s Island Channel and the College Point neighborhood is across Flushing Bay. South and west of the Airport are the neighborhoods of Astoria (Steinway), Jackson Heights, and East Elmhurst. Surrounding land uses are densely developed with commercial strips and light industrial complexes situated along arterial roadways that pass through established communities and residential areas. Figure 4-1 is an aerial photograph of LaGuardia Airport and the surrounding area.
The Airport’s property is almost entirely built out. Approximately 95 percent of the property is covered by the airfield, buildings, roadways, and parking lots. Vegetation is limited to landscaped and vacant areas consisting of trees, foundation plantings, and turf grasses. Two undeveloped parcels are located on Airport property west of the terminal area—Ingraham’s Mountain is vegetated and the Elmjack Little League ball fields are covered with grass and a parking lot. Tidal wetlands are present where some bay areas border the Airport, but there are no wetlands or other water resources located inland.
The project site, bounded by the airfield to the north and the Grand Central Parkway to the south, is similarly developed and covered with buildings and pavement interspersed with landscaped areas consisting of trees, shrubs, and grasses that offer little or no habitat value for any species of concern (see Figure 4-2).
4.2 Resources Potentially Affected FAA Order 5050.4B states that the affected environment section of an EA should succinctly describe only those environmental resources the CTB Redevelopment Program and its reasonable alternatives are likely to affect. The amount of information on a potentially affected resource should be based on the extent of the expected impact and be commensurate with the importance of the impact. The resources introduced below include traffic and transportation, air quality, coastal resources, compatible land use, Section 4(f) resources, fish, wildlife and plants, floodplains, historic and archaeological resources, noise, and water resources.
4.2.1 Traffic and Transportation
The CTB Redevelopment Program has the potential to reduce the level of service (LOS) on local roads serving LaGuardia Airport and the surrounding community, more so during the construction phase and less so during the operational phase. On-Airport roadways would be substantially altered, including ramp configurations and connections to the Grand Central Parkway. There would be no permanent changes to off-Airport roadways or local transportation patterns as a result of the project. The assessment of impacts on traffic and transportation is discussed in Section 5.1 and detailed results are provided in Appendix A of the 2014 EA.
Change: Revised traffic analysis as presented in Attachment 4: Technical Memorandum – Updated Traffic Analysis for Construction Conditions and in Chapter 5 was conducted using updated baseline conditions due to the change in project schedule. The original baseline conditions modeled were for 2012 traffic, whereas the updated construction conditions traffic analysis considers a 2014 baseline. Traffic conditions have changed in and around the airport since 2012 as there has been general growth in vehicle traffic off airport, as well as an increase in passenger activity at the airport. Due to the change in
December 2015 Chapter 4 – Affected Environment 4-2
LaGuardia Airport Technical Report CTB Redevelopment Program
project schedule, it was considered prudent to include the best available data as related to traffic impacts, given the change in activity between 2012 and 2014.
On-Airport Roadways
The Airport’s internal roadway network includes several one-way loop roads that connect the terminals and parking facilities. Frontage roads to the arrivals and departures levels of the CTB and Terminals C and D allow for passenger drop-off and pick-up. LaGuardia Access Road runs parallel to the Grand Central Parkway to the north and provides access to the Parkway and local roads. Runway Drive curves around the Runway 4 end to connect the main terminals with the Airport facilities on the west side of the property, including the Marine Air Terminal (Terminal A serving the Delta Shuttle).
Grand Central Parkway
The Grand Central Parkway is an eight-lane roadway that handles approximately 180,000 vehicles per day through western Queens.14 The Parkway runs along the northern part of western Queens, past the southern border of LaGuardia Airport, before turning south to central Queens and intersecting with I-495 (Long Island Expressway). It connects to I-278 (Brooklyn-Queens Expressway) to the west of the Airport and I-678 (Van Wyck Expressway and Whitestone Expressway) to the east via Northern Boulevard.
Eastbound entry to the Airport from the Grand Central Parkway is available via two exit ramps (94th Street and the “flyover”), and there is one exit from the Airport via the loop ramp from the 94th Street bridge (see Figure 4-3). Westbound entry to the Airport from the Parkway is available via the LaGuardia Access Road and two ramp connections (near Terminals C/D and the CTB). Airport exits are provided via two on-ramps from the frontage road (near the 94th Street Interchange).
Analysis of the existing conditions on the Parkway near the Airport using the Freeway Evaluation (FREEVAL) model indicate that the eastbound flows are satisfactory during the weekday morning and evening peak periods (LOS C or D), but westbound flows are at a failing LOS at those times (i.e., oversaturated).15 Eastbound movements reflect recent improvements by NYSDOT to the weaving sections and ramps near 94th Street.
14 http://www.nycroads.com/roads/grand-central/ 15 FREEVAL is a deterministic traffic model that is the official computational engine for the analysis of freeway
facilities in accordance with the procedures of the 2010 Highway Capacity Manual (HCM). FREEVAL is supported and maintained by the Transportation Research Board’s (TRB) Highway Capacity and Quality of Service (HCQS) Committee.
December 2015 Chapter 4 – Affected Environment 4-3
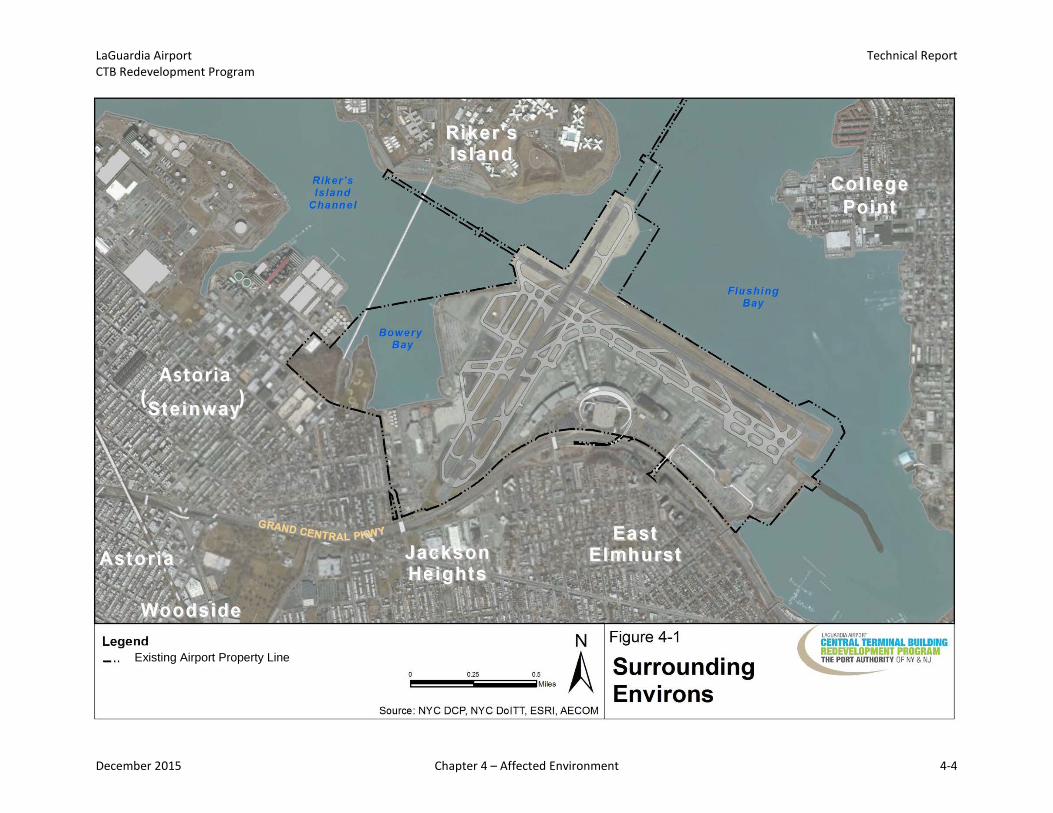
LaGuardia Airport Technical Report CTB Redevelopment Program
Figure 4-1. Surrounding Environs
Astoria ( )
Existing Airport Property Line
December 2015 Chapter 4 – Affected Environment 4-4
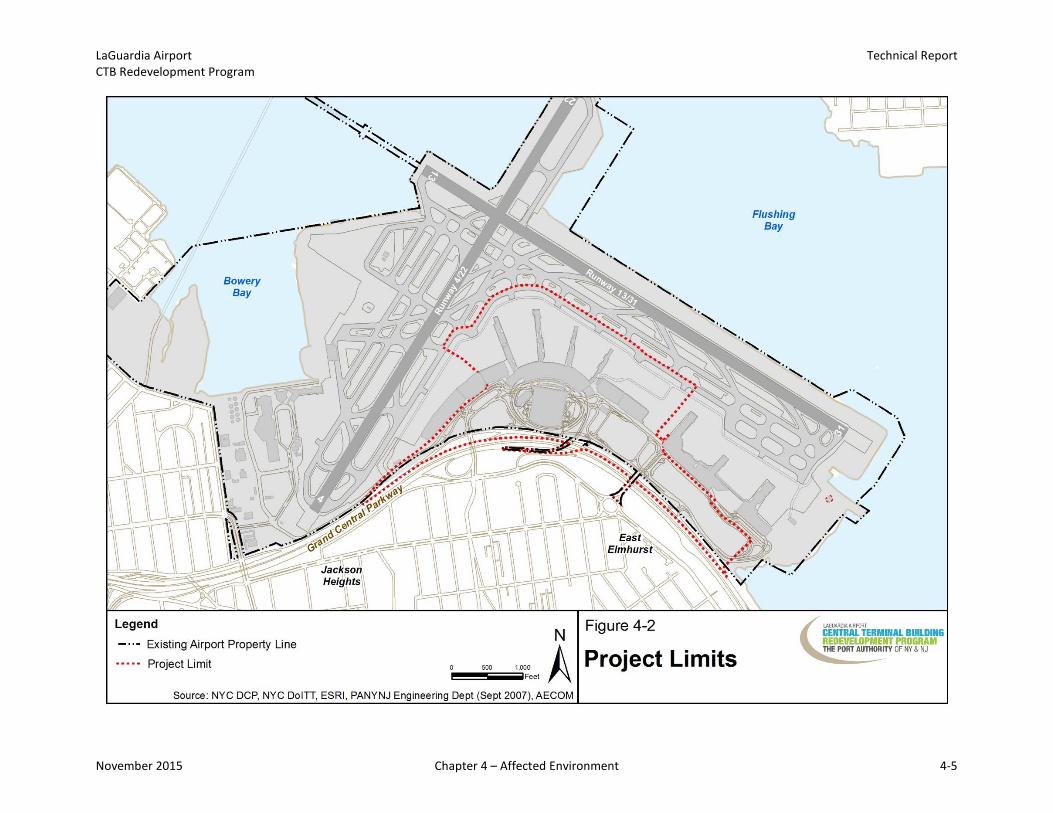
LaGuardia Airport Technical Report CTB Redevelopment Program
Figure 4-2. Project Limits
November 2015 Chapter 4 – Affected Environment 4-5
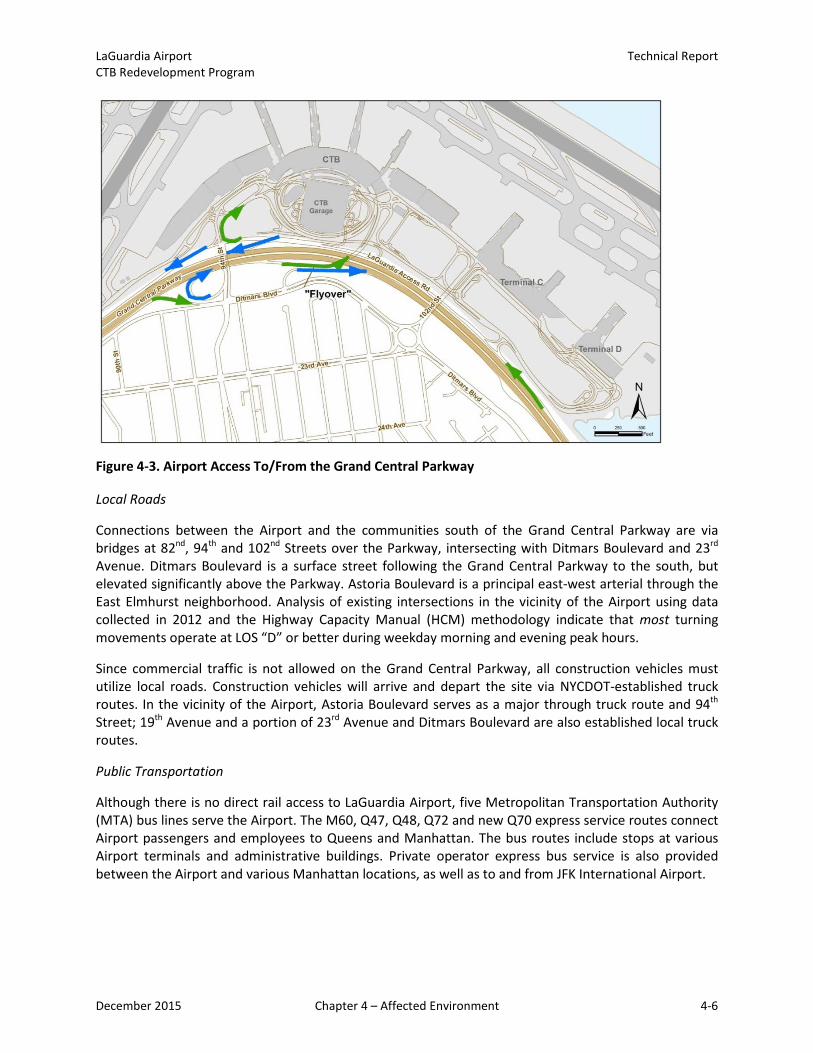
LaGuardia Airport Technical Report CTB Redevelopment Program
Figure 4-3. Airport Access To/From the Grand Central Parkway
Local Roads
Connections between the Airport and the communities south of the Grand Central Parkway are via bridges at 82nd, 94th and 102nd Streets over the Parkway, intersecting with Ditmars Boulevard and 23rd Avenue. Ditmars Boulevard is a surface street following the Grand Central Parkway to the south, but elevated significantly above the Parkway. Astoria Boulevard is a principal east-west arterial through the East Elmhurst neighborhood. Analysis of existing intersections in the vicinity of the Airport using data collected in 2012 and the Highway Capacity Manual (HCM) methodology indicate that most turning movements operate at LOS “D” or better during weekday morning and evening peak hours.
Since commercial traffic is not allowed on the Grand Central Parkway, all construction vehicles must utilize local roads. Construction vehicles will arrive and depart the site via NYCDOT-established truck routes. In the vicinity of the Airport, Astoria Boulevard serves as a major through truck route and 94th Street; 19th Avenue and a portion of 23rd Avenue and Ditmars Boulevard are also established local truck routes.
Public Transportation
Although there is no direct rail access to LaGuardia Airport, five Metropolitan Transportation Authority (MTA) bus lines serve the Airport. The M60, Q47, Q48, Q72 and new Q70 express service routes connect Airport passengers and employees to Queens and Manhattan. The bus routes include stops at various Airport terminals and administrative buildings. Private operator express bus service is also provided between the Airport and various Manhattan locations, as well as to and from JFK International Airport.
December 2015 Chapter 4 – Affected Environment 4-6
LaGuardia Airport Technical Report CTB Redevelopment Program
4.2.2 Air Quality
Air quality in the New York City metropolitan area only exceeds National Ambient Air Quality Standards (NAAQS) a few days of the year. Areas of the country where air pollution concentrations persistently exceed NAAQS are designated “nonattainment.” Areas that had a history of nonattainment but are now meeting NAAQS are designated as “maintenance.” According to the Environmental Protection Agency’s (EPA) Green Book, Queens County in New York is a designated nonattainment area for two criteria pollutants—ozone and fine particulates—and a designated maintenance area for carbon monoxide.16 LaGuardia Airport is located in Queens County, which means project-related air emissions would occur within an EPA-designated nonattainment or maintenance area. These emissions and pollution concentrations are subject to review under the federal Clean Air Act and its amendments, and under the jurisdiction of EPA regulations. The assessment of impacts on the air environment is discussed in Section 5.2 and Appendix B of the 2014 EA.
4.2.3 Coastal Resources
LaGuardia Airport and much of the surrounding area is located within the Coastal Zone Boundary of New York. Under the Coastal Zone Management Act of 1972, all federal actions within the coastal zone must comply with the “enforceable policies” of the New York Coastal Management Program. The New York State Department of State (NYSDOS) administers the program and the process by which the State decides whether a project or action meets its enforceable policies is called a consistency review. In addition, New York City has established a coastal zone under the Local Waterfront Revitalization Program (LWRP). Administered by the NYC Department of City Planning (NYCDCP), the LWRP establishes the City's policies for the development and use of the waterfront and provides the framework for evaluating the consistency of all discretionary actions in the coastal zone.
The CTB Redevelopment Program involves redeveloping existing built land within the coastal zone. As such, a coastal zone consistency determination is required from the NYSDOS and NYCDCP. The assessment of impacts on the coastal zone is discussed in Section 5.3.
There are no coastal barriers or any areas subject to the Coastal Barriers Resources Act of 1982 or the Coastal Barriers Improvement Act of 1990 in the vicinity of LaGuardia Airport.
4.2.4 Compatible Land Use
The Grand Central Parkway is an eight-lane divided highway separating the Airport from the East Elmhurst and Jackson Heights neighborhoods. Land uses south of the Grand Central Parkway are densely developed and consist mostly of residential areas with retail stores, commercial buildings, and office space concentrated along Ditmars Boulevard, 23rd Avenue, and Astoria Boulevard. Other notable land uses in the vicinity of the project site include Vaughn College of Aeronautics and Technology and Overlook Park.
Airport property is zoned for Manufacturing, Light Industrial (M1-1). Zoning around the Airport is primarily residential and mixed-used development (General Residence, R3-2, and Regional Commercial Center, C4-2). The assessment of impacts on surrounding land uses is discussed in Section 5.4.
16 EPA list of currently designated nonattainment and maintenance areas for all criteria pollutants as of March 30, 2012.
December 2015 Chapter 4 – Affected Environment 4-7

LaGuardia Airport Technical Report CTB Redevelopment Program
4.2.5 U.S. DOT Act, Section 4(f) Resources
The U.S. Department of Transportation Act (U.S. DOT Act) of 1966 included a special provision, Section 4(f), which protects the use of land from publicly-owned parks, recreation areas, wildlife and waterfowl refuge areas of national, state or local significance, and public and private historical sites. The CTB Redevelopment Program has the potential to directly and/or indirectly affect NYC Parks and Public Lands, as well as historic resources that are eligible for listing on the National Register of Historic Places (NRHP).
NYC Parks and Public Lands near LaGuardia Airport include Overlook Park, located on the south side of the Grand Central Parkway along Ditmars Boulevard between 97th and 100th Streets; Planeview Park, located at 23rd Avenue between 85th Street and Ditmars Boulevard; LaGuardia Landing Lights, which is a park situated in several lots that follow the flight path leading to Runway 4, stretching from 78th Street and 25th Avenue to the Grand Central Parkway; World’s Fair Marina, a public boat dock located east of the Airport on the north side of the Parkway; and the Grand Central Parkway Extension, a promenade along the waterfront between World’s Fair Marina and the Airport.17 The CTB Redevelopment Program avoids the use of land from any of these parks.
Section 4(f) also applies to historic resources of national, state, or local significance. In consultation with the New York State Historic Preservation Office (SHPO), the FAA has determined that five airplane hangars (circa 1940) that are eligible for listing on the NRHP would be adversely affected by the CTB Redevelopment Program. Hangars 1, 2, and 4 would be directly affected by removal of the buildings, while Hangars 3 and 5 would be indirectly affected by the removal of adjoining Hangar 1 and obstruction of views from the Grand Central Parkway as a result of construction of the West Garage. Terminal A (the NHRP-listed Marine Air Terminal, circa 1940) is located on the west side of the Airport and is beyond the area of potential effect.
The assessment of impacts on Section 4(f) resources is discussed in Section 5.5 and Appendix C of the 2014 EA.
4.2.6 Fish, Wildlife and Plants
Biotic communities directly affected by the CTB Redevelopment Program would be limited to urban landscaping located along roadway medians and shoulders that lie between LaGuardia Airport and the Grand Central Parkway. Typical of a busy highway corridor, the landscaped features consists of grass-covered verges interspersed with shrub patches and trees. The grass is mowed regularly and the trees and shrubs are actively managed in order to maintain a safe roadway operating environment and discourage birds. Low habitat value is indicated due to small size, active management, a high degree of fragmentation, close proximity to busy roads, and barrier effects of the roads on wildlife migration.
The landscaped area affected by the CTB Redevelopment Program is located within the Coastal Zone Boundary of New York, and most of the area is also located within the 100-year (tidal) floodplain. However, the limits of the project site consist only of upland vegetation; there are no wetlands, water
17 The unpaved portion of the Grand Central Parkway right-of-way along the southern boundary of the Airport is under the jurisdiction of the New York City Department of Parks and Recreation (NYCDPR); however, it is not designated nor intended for public access or recreation. The City of New York has reviewed the Proposed Action and has determined that the affected area was originally acquired for “park and parkway purposes,” which is distinct from a designation of the area as parkland. The access improvements to and from the Parkway are a legislatively authorized use of the land. See Section 5.5.2 for additional discussion.
December 2015 Chapter 4 – Affected Environment 4-8
LaGuardia Airport Technical Report CTB Redevelopment Program resources, or aquatic habitat within the landscaped area. No federal- or state-listed species, or habitat for federal- or state-listed species, would be affected.
The assessment of impacts on fish, wildlife and plants is discussed in Section 5.7 of the 2014 EA, which cross-references other sections as needed to address the presence/absence of biotic communities associated with land uses and cover types related to other resources affected by the CTB Redevelopment Program, such as coastal resources.
4.2.7 Floodplains
LaGuardia Airport is located on the waterfront of Flushing Bay and Bowery Bay. According to the current Federal Emergency Management Agency (FEMA) Flood Insurance Rate Map (FIRM) and the recently released Preliminary FIRM, the majority of LaGuardia Airport lies within a tidal floodplain, some portions of which are designated a coastal flood zone with velocity hazard (see Figure 5-6).18 Tidal floodplains consist of areas subject to coastal or tidal flooding by high tides, hurricanes, tropical storms, and steady on-shore winds. Coastal high hazard areas consist of coastal shorelines subject to high velocity wind and wave action in addition to tidal flooding. The 100-year tidal floodplain extends to the southern edge of LaGuardia Road and in some areas south of the Grand Central Parkway. The coastal flood zone generally follows the shoreline, except where it extends within Parking Lot 5 at the eastern side of the Airport.
Pursuant to Executive Order 11988, Floodplain Management, all Federal agencies are required to avoid impacts on floodplains to the degree practicable and minimize impacts that cannot be avoided. The CTB Redevelopment Program involves redeveloping land within the FEMA 100-year floodplain. Because the vast majority of the Airport’s property lies within the floodplain, measures to minimize harm will be included in the project (see Section 2a of EO 11988, Floodplain Management, dated May 24, 2977; 42 FR 26951). Therefore, the layout of the proposed project would be designed to minimize impacts on the floodplain, and the risks associated with flooding, to the greatest extent practicable. The assessment of impacts on floodplains is discussed in Section 5.8.
On January 30, 2015, the President issued EO 13690 that amends EO 11988, and established the Federal Flood Risk Management Standard (“FFRMS”) and a process for public input prior to implementation of the FFRMS. EO 13690 at §1. However, in Guidelines issued on October 8, 2015, federal agencies were directed not to apply the new requirements until after the agencies adopt new or revised regulations governing the proper implementation of EO 13690 and the FFRMS. EO 13690 at §3; Guidelines for Implementing Executive Order 11988, Floodplain Management, and Executive Order 13690, Establishing a Federal Risk Management Standard and a Process for Further Soliciting and Considering Stakeholder Input, October 8, 2015 (“Guidelines”). The Guidelines state that agencies will continue to comply with the requirements of the 1977 version of E.O. 11988 until they update their regulations and procedures to incorporate the amendments from E.O. 13690. These regulations and procedures will describe an agency’s schedule for applying any new requirements as well as how it will apply the new requirements. Id. at 5, 18. The new requirements of EO 11988 will not be applied retroactively. Id. at 18. The DOT has not issued implementing orders to date.
18 Preliminary FIRMs have been developed by FEMA for certain communities in New York and New Jersey affected by Superstorm Sandy.
December 2015 Chapter 4 – Affected Environment 4-9

LaGuardia Airport Technical Report CTB Redevelopment Program
4.2.8 Historic and Archaeological Resources
Historical and cultural resources affected by the CTB Redevelopment Program are federally-regulated under the National Historic Preservation Act (NHPA), the Archaeological Resources Protection Act (ARPA), and other applicable laws and regulations intended to protect historic properties. Section 106 of the NHPA requires Federal agencies to take into account the effects of their actions on historic properties, to afford the Advisory Council on Historic Preservation a reasonable opportunity to comment, and include an opportunity for consultation with all interested parties. Historic properties include any prehistoric or historic district or site that is listed or eligible for listing in the National Register of Historic Places. In addition, NYC’s Landmarks Preservation Commission (LPC) may designate properties as NYC Landmarks.
Prior to undertaking any airport project or action, the PANYNJ, in consultation with the FAA, must determine if the CTB Redevelopment Program has the potential to affect historic properties. As the lead federal agency, the FAA is responsible for consulting with the SHPO—in this case, the New York State Office of Parks, Recreation and Historic Preservation (OPRHP)—and for making a determination about the effects of the project on historic properties. The process by which the FAA decides whether a project or action affects historic properties is called a Section 106 review per NHPA.
Two NRHP-listed sites have been identified in the vicinity of the project. The nearest NRHP-listed historic site is Terminal A (the Marine Air Terminal) located approximately one-half mile west of the project site. The property is also an interior and exterior landmark designated by LPC. The other is the Lent Homestead and Cemetery located between 19th Road and 19th Street in East Elmhurst. Both sites are located west of the CTB Redevelopment Program and beyond the designated area of potential effect (APE). In addition, the LPC-eligible Malcolm X House is located south of the Airport, outside of the APE.
The FAA has determined that five historic airplane hangars (circa 1940) would be adversely affected by the CTB Redevelopment Program. Hangars 1, 2, and 4 would be directly affected by removal of the buildings, while Hangars 3 and 5 would be indirectly affected by the removal of adjoining Hangar 1 and construction of the West Garage, blocking views from the Grand Central Parkway. These hangars are part of the original Airport and have remained relatively unaltered; therefore, the buildings are eligible for listing in the NRHP. The existing CTB (circa 1964) has been significantly altered over the years and, as a result, the SHPO has determined that the terminal building is not eligible for listing. In addition, according to the New York State Preservation Historical Information Network Exchange (SPHINX) system mapping tool, the western portion of the project site falls within an area of archaeological sensitivity. Supplemental analysis indicates that construction activities would have the potential to disturb intact soil horizons located beneath existing roads in the vicinity of the existing Parking Lot 1.
The assessment of impacts on historic resources is discussed in Section 5.10 and Appendix D of the 2014 EA. Because the CTB Redevelopment Program would adversely affect NRHP-eligible properties, a Section 4(f) Evaluation must also be prepared. The assessment of impacts on Section 4(f) resources is discussed in Section 5.5 and Appendix C of the 2014 EA.
4.2.9 Noise
Before moving forward with the CTB Redevelopment Program, analysis must determine if the construction and operation of the project has the potential to cause or contribute to increased noise levels in the vicinity of the Airport. Construction activities could generate noise levels in excess of those typically found in the project environs. Noise levels at a construction site vary relative to the particular activities in progress, and the potential effects depend in large part on the distance between the source
December 2015 Chapter 4 – Affected Environment 4-10
LaGuardia Airport Technical Report CTB Redevelopment Program of the noise and a sensitive receptor, such as a church, school, hospital, or residence (see Section 5.13.1.1 and Appendix E of the 2014 EA). After construction, project-induced changes in ambient noise levels may occur due to a) increasing vehicular traffic volumes, and b) the airlines’ transition into newer, larger, more efficient, and higher capacity aircraft. Full detailed noise analysis showing that there is no significant impact from aircraft as a result of the CTB Redevelopment Program can be found in Section 5.13.1.2 and Appendix E of the 2014 EA.
The FAA must adhere to federal regulations for evaluating the compatibility of aircraft noise with land uses surrounding airports. In addition, NYC-specific rules for evaluating the effects of construction noise as well as noise from traffic operations were evaluated. The assessment of project-related noise impacts on the affected environment is discussed in Section 5.13 and Appendix E of the 2014 EA.
4.2.10 Water Resources
The project study area includes surface and groundwater resources. There is also a network of drainage basins, conveyances, and control mechanisms in place to help reduce the risk of flooding while minimizing the effects of airport activities on the quality and quantity of storm runoff. The following paragraphs identify the water resources and management systems affected by the CTB Redevelopment Program. The assessment of impacts on water resources is discussed in Section 5.16.
Surface Water
LaGuardia Airport is surrounded on three sides by surface waters, including Flushing Bay to the east/northeast, Riker’s Island Channel to the north/northwest, and Bowery Bay to the west.19 These surface water features are adjacent bay areas located off of the main stem of the East River as it flows north of the Airport, eventually discharging into Long Island Sound. Importantly, no surface waters are present within the interior of the Airport or within the project limits.
Flushing Bay is surrounded by a heavily urbanized region containing a very high population density (Borough of Queens) and is fed by Flushing Creek, which defines a heavily urbanized watershed. Flushing Bay is a saline surface water classified in New York State Department of Conservation (NYSDEC) Regulations as a Class I water suitable for secondary contact recreation and fishing.20 Class I waters are suitable for fish propagation and survival but are the next to last level of classification for saline surface waters, indicative of water quality impairment.
The water quality of Flushing Bay in the vicinity of the Airport is reported by the NYCDEP to be somewhat impaired, although water quality has improved over the last decade or so. The Flushing Bay ecosystem has been degraded as a result of fill activities, bulk-heading, dredging, landfills, sewage discharges and combined sewer overflow (CSO) discharges. In highly modified and developed watersheds such as Flushing Bay, it is presumed that water quality and aquatic habitat characteristics will always be less than optimal due to irreversible changes to the watershed, as suggested by its
19 Flushing Bay generally includes the sub-waters Riker’s Island Channel and Bowery Bay; therefore, the identified classification and description included herein considers these waters as a single, combined resource, as the exact boundaries of these waters relative to each other are somewhat ambiguous.
20 New York Codes, Rules and Regulations (NYCRR), Chapter X – Division of Water, Subchapter A: General, Article 2: Classes and Standards of Quality and Purity, Part 701: Classifications-Surface Waters and Groundwaters (6 NYCRR § 701.13)
December 2015 Chapter 4 – Affected Environment 4-11
LaGuardia Airport Technical Report CTB Redevelopment Program classification as a Class I waterway. Flushing Bay is not designated as a Protected Water under the Protection of Waters Program administered by NYSDEC.21
New York State has been delegated by the EPA to implement the federal National Pollutant Discharge Elimination System (NPDES) program through the State Pollutant Discharge Elimination System (SPDES) program administered by NYSDEC. LaGuardia Airport holds a New York SPDES permit for the discharge of stormwater (Permit No. NY 0008133). In addition to regulating stormwater discharges, the SPDES permit requires the Airport to track and report any noncompliance with the permit, such as planned releases and unanticipated releases (spills and leaks).
Groundwater
Groundwater resources in the project study area are part of the Brooklyn-Queens Aquifer System, which is part of the Long Island aquifer system underlying all of Nassau, Suffolk, Kings and Queens Counties, and is listed by the EPA as a Sole Source Aquifer.22 The upper glacial aquifer is the uppermost hydrogeological unit on Long Island and is found in nearly all of Kings and Queens Counties.23 Ranging in thickness from 0 to 300 feet below the surface, this aquifer consists mainly of till deposits (clay, silt, sand, gravel, and boulders) along the north shore and outwash deposits (mostly sand, gravel and clay) to the south. The local water table is within the upper glacial aquifer throughout most of Kings and Queens Counties and, according to the U.S. Geological Survey (USGS), the average water-level measurement ranges from 9 to 19 feet below sea level.24
The water table beneath LaGuardia Airport is generally near the surface. Soil and ground water data developed for the CTB Redevelopment Program indicates that the depth to water ranges from 3.79 to 10.42 feet below the surface of the project site.25 Groundwater is not withdrawn or otherwise used for any airport purposes. NYC drinking water is delivered from large upstate reservoirs—some more than 125 miles from the City. There are no public water supply wells or drinking water resources in the vicinity of the Airport. The nearest groundwater supply system is located in southwestern Queens, most of which has not operated in more than 10 years.
21Article 15 pursuant to Chapter V – Resource Management Services, Subchapter D: Water Regulation, Part 608: Use and Protection of Waters (6 NYCRR § 608).
22Although the Brooklyn-Queens aquifer is not utilized as the sole source of drinking water for the area, the counties are the recharge zone for the aquifers underlying the southeastern portion of Queens County and the streamflow source zone for aquifers underlying parts of Nassau County. Since Nassau County is under sole source protection, the sole source aquifer designation extends to encompass the Boroughs of Brooklyn and Queens (EPA, Region 2 Water, Brooklyn-Queens Aquifer System Support Document, December 1983).
23For the purpose of this EA, the affected environment does not extend to the lower aquifer units (i.e., Jameco, Mogathy, Lloyd Aquifers) because groundwater below the water table would not be affected by the Proposed Action.
24Water-Table Altitude in Kings and Queens Counties, New York in March 1997. Fact Sheet FS 134-97 prepared by USGS.
25 PANYNJ, Interim Environmental Conditions Report, LaGuardia Airport, Central Terminal Replacement Project, March 4, 2013.
December 2015 Chapter 4 – Affected Environment 4-12
LaGuardia Airport Technical Report CTB Redevelopment Program
Stormwater
Runways, taxiways, buildings, aprons, roadways, and parking lots, cover approximately 95 percent of the Airport property. These man-made impervious surfaces generate storm runoff, which is managed by the Airport’s drainage system. The drainage system consists of nine drainage basins with two inflow and 17 outfall locations. All outfalls drain into Flushing Bay, Riker’s Island Channel, or Bowery Bay. Runoff is collected in seven of the drainage basins and conveyed via underground pipes to outfall locations. No collection system is identified with the two smallest basins, where the northern end of each runway is supported by piers that extend into the Riker’s Island Channel.
Water quality best management practices are in place to reduce or prevent pollution of surface and groundwater resources. In compliance with the requirements of the SPDES program, the LaGuardia Airport Best Management Practices Plan (BMPP, July 2009) is used by PANYNJ and its tenants and contractors to provide consistent and effective management of stormwater runoff quality.26 The BMPP describes the drainage system, discusses airport activities and potential pollutant sources, identifies existing stormwater management controls and best management practices (BMPs), and addresses how BMPs are used to reduce or eliminate pollutants from entering the surrounding surface waters.
26 www.panynj.gov/airports/pdf/LGA-BMPP-2011.pdf
December 2015 Chapter 4 – Affected Environment 4-13
LaGuardia Airport Technical Report CTB Redevelopment Program
5 Environmental Consequences The environmental consequences of the proposed design changes have been reviewed to determine if the data and the analysis in the 2014 FONSI/ROD are still substantially valid and to determine whether there are any new significant circumstances or information requiring additional NEPA analysis. The 2014 FONSI/ROD was prepared in accordance with FAA Order 1050.1E, Environmental Impacts: Policies and Procedures. In July 2015, FAA issued Order 1050.1F. This technical report of environmental consequences maintained the organization from Order 1050.1E but considered the significance thresholds from the updated Order 1050.1F.
5.1 Environmental Categories Where No Changes Occur The study area and the limits of disturbance are the same as in the 2014 FONSI/ROD and the types of construction and development are similar in type and character to those for the previously approved (2014) design. Based on this review, there is no change in environmental impacts associated with the proposed design changes for the following resource categories:
• Coastal Resources • Compatible Land Use • Department of Transportation, Section 4(f) • Farmlands • Fish, Wildlife and Plants • Hazardous Materials, Pollution Prevention and Solid Waste • Historical, Architectural, Archaeological, and Cultural Resources • Secondary (Induced) Impacts • Socioeconomic Impacts, Environmental Justice, and Children’s Environmental Health and Safety
Risks • Water Quality • Wetlands • Wild and Scenic Rivers • Climate
Coastal Resources – Although the layout of the terminal and airside facilities within a coastal zone would change as a result of the proposed design changes, the level of impact to coastal resources would not change. Consultation with New York City Department of City Planning and New York State Department of State is underway to demonstrate that the proposed design changes remain consistent with the approved state and local coastal zone management programs. Copies of correspondence with each agency are included in Attachment 10.
DOT, Section 4(f) and Historical, Architecture, Archaeological and Cultural Resources – The terminal design and apron/taxilane layout was not a point of discussion for the consulting parties when evaluating the adverse effects on the historic resources as part of the original CTB Redevelopment Program. The requirements in the Memorandum of Agreement that the consulting parties concurred with (see Appendix D of the 2014 EA) will still be met under the proposed design changes. There were no scenarios examined as part of the original alternatives analysis or the 4(f) analysis where adverse effects to historic resources did not occur. All scenarios examined required the demolition of Hangars 1, 2, and 4. Under the proposed design changes, the location of the West Garage will shift slightly and the headhouse design for the terminal has changed. The impacts of these changes on the viewshed are expected to be minimal and are discussed further in Section 5.2.4.2-Visual Impacts.
December 2015 Chapter 5 – Environmental Consequences 5-1
LaGuardia Airport Technical Report CTB Redevelopment Program
5.2 Environmental Categories Where a Change in Impacts May Occur The resource categories where environmental consequences could potentially differ from those disclosed in the 2014 FONSI/ROD are addressed in the following sections.
5.2.1 Traffic and Transportation
Traffic impacts on local surface transportation facilities are typically addressed in the Socioeconomic Impacts section (see Section 5.15). However, because this is such an important technical area in this Technical report, it is presented first in a stand-alone section. This summary describes the assumptions, findings, and recommendations related to traffic on surface transportation facilities. For the detailed analysis of the previously approved design (2014) see Appendix A: Transportation of the 2014 EA.
This summary describes the assumptions, findings, and recommendations related to traffic on surface transportation facilities. For the detailed analysis for the proposed design changes see Attachment 4: Technical Memorandum – Updated Traffic Analysis for Construction Conditions. The analysis focused on the changes in construction traffic as a result of the changes to the construction schedule, phasing, and worker shifts under the proposed design changes.
The assessment required the development of an estimation of construction trip generation and assignments. The average daily number of construction workers and construction trucks were calculated for each calendar quarter during construction of the proposed design changes. Trucks were converted to passenger car equivalents (PCEs) and the total of workers and truck PCEs were used to identify the peak construction quarter as Q2 of 2017. In order to estimate peak hour construction-related vehicle trips, transportation planning factors such as personnel shifts and truck delivery schedule were established. For the proposed design changes, it is assumed that there would be three personnel shifts and trucks would arrive/depart the site throughout the entire day with slightly higher deliveries during the day time. Table 3 of Attachment 4 presents the estimated peak hour construction trip generation characteristics during the peak construction quarter. The construction trip distribution patterns for trucks assumes that staging and queuing areas would be at Ingraham’s Mountain, Marina East Gate 14, and the NY Times Facility, with an average queue time of 20 to 30 minutes. Truck routes would be based on the NYCDOT “local” and “through” truck routes including Astoria Boulevard and 94th Street-Junction Boulevard. Construction trips generated during the peak construction conditions for each of the 21 analyzed intersections are presented in Table 5 of Attachment 4.
The operational analysis first established the existing conditions each of the 21 intersections. As 2014 traffic data are available for some of the intersections as part of the LGA 2014 Data Collection Program, the base year was revised from the 2014 FONSI/ROD, which assumed a base year of 2012. For locations without 2014 traffic data, the 2012 traffic volumes from the 2014 FONSI/ROD were utilized after applying a compound background growth rate of 1.0 percent. A capacity analysis of existing conditions was performed during the peak morning and afternoon hours at each intersection (v/c, delay and level of service; see Table 7 of Attachment 4).
A compounded total growth rate of 1.51 percent was applied to the existing traffic volumes to establish the Future Without Construction traffic volumes in 2017 (see Table 8 of Attachment 4). Volumes did not include construction traffic from the Runway Safety Area Enhancements project since construction is expected to be completed at the end of 2016.
Next, construction trips generated during the peak construction period were added to the 2017 Future Without Construction Condition to develop traffic volumes under the proposed design changes condition.
December 2015 Chapter 5 – Environmental Consequences 5-2
LaGuardia Airport Technical Report CTB Redevelopment Program In accordance with CEQR Technical Manual criteria, the results of the Future Without Construction and proposed design changes conditions were compared in order to identify any critical changes in the projected traffic operations, as well as any transportation improvements that would be required to ensure acceptable traffic operations. Transportation improvements were recommended for 11 of the 21 analyzed intersections (see Table 9 of Attachment 4). Some of the improvements were adjusted or eliminated from the list of those proposed in the 2014 FONSI/ROD. A comparison of the weekday morning and afternoon peak hour intersection capacity analysis for the Future Without Construction and proposed design changes with the recommended improvements (see Table 10 of Attachment 4) shows that there would be no significant traffic impacts projected as a result of the construction of the proposed design changes.
5.2.1.1 As documented in the 2014 FONSI/ROD, a traffic monitoring program, in coordination with NYCDOT, will be implemented annually or at an agreed-upon frequency throughout the duration of the construction period.Transportation Planning Assumptions
As part of the CTB Redevelopment Program, a variety of improvements and modifications are planned to the vehicular access and internal traffic circulation within LaGuardia Airport. These include the reconfiguration of ramps to and from the Grand Central Parkway and significant modifications to the Airport’s roadway system to improve internal traffic circulation and reduce queuing, double-parking, and congestion on Airport premises.
Future increases in Airport passenger traffic are expected to occur over time, regardless of the CTB Redevelopment Program, due to general demand for air travel into New York City. PANYNJ estimates that without the CTB Redevelopment Program projected passenger travel at LaGuardia Airport will increase from 23.6 million annual passengers (MAP) in 2010 to 30.1 MAP—an increase of 6.5 MAP—by 2030.
The CTB Redevelopment Program is projected to result in an additional increase in Airport passenger traffic beyond the 30.1 MAP. PANYNJ estimates that the CTB Redevelopment Program would accommodate an increase in passenger travel at LaGuardia Airport from 30.1 MAP to 34.0 MAP—a change of 3.9 MAP—by 2030. The CTB Redevelopment Program is not projected to result in any net increase in airport employment. Although some increase in employees is expected to result from enhanced facilities (e.g., increased concession space) at the new terminal, this increase is expected to be offset by new technologies and associated operational efficiencies that reduce existing labor requirements.
Throughout the preparation of the 2014 EA, the project team coordinated closely with representatives from both the New York State Department of Transportation (NYSDOT; see Appendix G of the 2014 EA for letter from the Region 11 Director dated April 4, 2014) and the New York City Department of Transportation (NYCDOT; see Section A.8 of Appendix A of the 2014 EA) to ensure that the analyses conducted met the technical and procedural expectations of both agencies. The analyses were also conducted in accordance with the guidance in the New York City Environmental Quality Review (CEQR) Technical Manual.
The baseline year for the traffic analysis is 2012. As such, the existing conditions analyses were based on data collected in the field in 2012. This data includes peak hour and daily (24-hour) traffic volumes, roadway and intersection lane configurations and geometric parameters, traffic control devices, traffic signal timing parameters, and other data. In selected instances where no 2012 data were available, supplemental traffic volume data were provided by the PANYNJ for the year 2010 and were increased by the appropriate growth factors in the CEQR Technical Manual to estimate year 2012 traffic volumes.
December 2015 Chapter 5 – Environmental Consequences 5-3

LaGuardia Airport Technical Report CTB Redevelopment Program
Change: The baseline year for the traffic analysis conducted for the proposed design changes is 2014. As such, the existing conditions analyses were based on data collected in the field as part of the LGA 2014 Data Collection Program. For locations without 2014 traffic data, the 2012 traffic volumes from the 2014 FONSI/ROD were utilized and a compound background growth rate of 1.0 percent (0.5 percent per year) was applied to establish the 2014 baseline conditions. It was important to update the baseline with 2014 data because conditions have changed in and around the airport since 2012, with higher levels of passenger traffic and vehicular traffic. Due to the change in project schedule, it was considered prudent to include the best available data as related to traffic impacts, given the change in activity between 2012 and 2014.
The proposed CTB Redevelopment Program is expected to be completed and fully operational by the end of 2021. However, the future analysis year for full operation of the new terminal is 2030, because it is projected to take approximately nine years following the opening of the terminal to fully realize all of the associated forecast passenger growth. The future analysis period for construction conditions was the fourth quarter of 2015, the period of anticipated peak construction traffic activity.
Change: The construction phasing plan for the proposed design changes keeps the completion date of the CTB at the end of 2021; therefore the future analysis year for full operation of the new terminal remains 2030. The future analysis period for construction conditions was the second quarter of 2017, the revised period of anticipated peak construction traffic activity. It is also important to note that while the construction schedule of the whole program has decreased by seven months from start to finish, the start date for the program is later than originally contemplated in the 2014 EA. Therefore, the substantive completion date of late 2021 remains similar to the completion date in the 2014 EA. Demobilization activities continue into early 2022.
A comprehensive and detailed discussion of the range of transportation analyses conducted as part of the 2014 EA is provided in Appendix A: Transportation of the 2014 EA. In short, the primary quantitative analyses include the following:
• Construction conditions – The construction conditions analyses examined the operationaleffects of traffic associated with construction-related vehicles traveling to and from the Airportduring the peak period of construction (i.e., the fourth quarter of 2015) at key intersections inthe vicinity of the Airport. Construction-related vehicles include both construction personneltraveling to and from the designated contractor parking site via passenger vehicles and shuttlebuses, as well as trucks hauling material and equipment to and from the project site viaestablished New York City truck routes. The construction conditions analyses examined trafficconditions during the weekday morning and afternoon peak hours of construction. Based on theanticipated construction shift times, the peak hours for worker-generated vehicle trips (6:00 to7:00 AM and 3:00 to 4:00 PM) would not overlap with the weekday morning and afternoon peakhours for traffic on the local street network (i.e., 7:30 to 8:30 AM and 4:00 to 5:00 PM), andwould overlap by 15 minutes with the weekday morning peak hour of the Airport (i.e., 6:45 to7:45 AM). The construction analyses include year 2012 existing conditions, year 2015 No-ActionConditions, and year 2015 Proposed Action Conditions.
Change: The peak period of construction would be the second quarter of 2017 with the proposeddesign changes. The construction analyses include year 2014 existing conditions, year 2017 No-Action Conditions, and year 2017 Proposed Action Conditions.
• Operation conditions – The operation conditions analyses examined the operational effects ofadditional traffic generated by the normal operation of LaGuardia Airport in the year 2030,
December 2015 Chapter 5 – Environmental Consequences 5-4
LaGuardia Airport Technical Report CTB Redevelopment Program
when passenger forecasts associated with the CTB Redevelopment Program are expected to be fully realized. Traffic conditions on both surface streets and on the Grand Central Parkway are analyzed for the weekday morning and afternoon peak hours. The analyses include year 2012 existing conditions, year 2030 No-Action Conditions (without the CTB Redevelopment Program) and year 2030 Proposed Action Conditions (with the CTB Redevelopment Program).
5.2.1.2 Proposed Action- CTB Redevelopment Program
5.2.1.2.1 Construction
Redevelopment of the CTB is assumed to take place over an eight-year period, beginning in 2014 and continuing through 2021. Construction traffic associated with the CTB Redevelopment Program would consist of passenger vehicles generated by construction personnel (including laborers, managers, and administrative staff), as well as construction trucks associated with the movement of materials and equipment traveling directly to the CTB construction site via established New York City truck routes.
Change: Redevelopment of the CTB would take place over a period of under six years (68 months), beginning in the second quarter of 2016 and continuing through the end of 2021 (followed by 4 months of demobilization activities).
It is anticipated that daily parking for construction personnel would be accommodated at the Ingraham’s Mountain site, a PANYNJ-owned parcel located in the northeast quadrant of the 19th Avenue/45th Street intersection. A portion of the top of Ingraham’s Mountain site will be cleared as part of the Runway Safety Area (RSA) Enhancements project, a separate project preceding the redevelopment of the CTB. In order to minimize construction traffic on City streets, all construction personnel parking at Ingraham’s Mountain would be transported by a private shuttle bus operator to and from work at the construction site. The shuttle buses would utilize off-Airport roadways (e.g., 45th Street and 19th Avenue), as well as on-Airport roadways (e.g., Bowery Bay Boulevard, Marine Terminal Road, and Runway Drive/LaGuardia Road), to travel between Ingraham’s Mountain and the construction site (see Figure 5-1).
Change: In addition to the Ingraham’s Mountain site, Marina East Gate 14 and the NY Times Facility, located east of the CTB, would be used for truck staging and queuing. Figure 5-1 has been updated to reflect the additional staging sites (see Figure 5-1b).
For each month of the construction schedule, the total number of daily construction personnel and daily construction trucks were forecast using industry standards for the building sizes, material quantities, man-power rates, and other factors. These calculated numbers of workers and trucks were then aggregated to estimate the average daily number of construction workers and trucks projected to travel to the site in each calendar quarter. The proposed construction schedule assumes construction-related vehicle trips would peak in the fourth quarter of 2015. During this quarter, an average of approximately 704 construction personnel vehicles, approximately 40 shuttle buses, and approximately 128 trucks would travel to and from the Ingraham’s Mountain and construction sites, respectively, on a daily basis. For construction personnel, travel by means other than single-occupant vehicle will be encouraged and supported by the PANYNJ through specific contract arrangements with contractors. LaGuardia Airport is served by the M60, Q47, Q48, Q72, and the new Q70 express service bus lines which also provide connections to subway stations in Manhattan and Queens and can accommodate travel for construction personnel.
Change: The revised construction schedule assumes construction-related vehicle trips would peak in the second quarter of 2017. During this quarter, an average of approximately 817 construction personnel vehicles, approximately 20 shuttle buses, and approximately 192 trucks would travel to and from the Ingraham’s Mountain, Marina East Gate 14, NY Times Facility and construction sites on a daily basis.
December 2015 Chapter 5 – Environmental Consequences 5-5
LaGuardia Airport Technical Report CTB Redevelopment Program
Transportation planning factors presented in Table A.7-2 of the 2014 EA were used to estimate peak hour construction related vehicle trips with the exception of shifts of construction personnel and hourly construction truck trip distribution. Same as the 2014 EA, an average auto occupancy rate of 1.50 and an auto mode share of 75 percent were assumed for construction personnel. The same passenger car equivalent (PCE) assumptions of 1.0 PCE per auto, 1.5 PCEs per shuttle bus, and 2.0 PCES per truck were also used for the Revised Design.
All construction activities are expected to take place during two construction shifts. The first shift would occur from approximately 7:00 AM to approximately 3:00 PM and comprise approximately 90 percent of the total construction personnel workforce. The second shift would occur from approximately 3:00 PM to approximately 11:00 PM and comprise approximately 10 percent of the total construction personnel workforce. Given these construction hours, worker trips would largely be concentrated during off-peak hours and would not represent a substantial increment during peak travel periods in the vicinity of the Airport.
Change: For a 5.5 month period centered around the peak quarter (second quarter of 2017), all construction activities are expected to take place during three construction shifts. The first shift would occur from approximately 6:00 AM to approximately 2:00 PM and comprise approximately 40 percent of the total construction personnel workforce. The second shift would occur from approximately 7:00 AM to approximately 3:00 PM and comprise approximately 40 percent of the total construction personnel workforce. The third shift would occur from approximately 10:00 PM to approximately 6:00 AM and comprise approximately 20 percent of the total construction personnel workforce.
The PANYNJ will coordinate with contractors to establish a daily schedule of goods deliveries that ensures on-time deliveries by minimizing truck travel during peak traffic periods, which can result in delays in transporting materials to and from the site. Construction truck trips to and from the site would generally be made between the hours of 4:00 AM and 10:00 PM. Truck arrivals are expected to be generally uniform throughout this time period with slightly higher numbers of trips during the late morning and midday hours (8:00 AM to 1:00 PM) when on-site work activities are expected to peak. Some truck deliveries would also be made early in the morning, during off-peak times, to ensure that materials are on-site prior to the start of the first shift. Trucks would typically remain on-site for relatively short durations (one hour or less). All trucks would be required to use NYCDOT-established truck routes (see Figure 5-1).
Change: Truck arrivals and departures are expected to be throughout the 24-hour day with slightly higher numbers from 4:00AM to 5:00PM. An average of ten inbound and ten outbound truck trips per hour would occur from 4:00AM to 5:00PM in the peak quarter, and an average of six inbound and six outbound truck trips would occur between 5:00PM and 4:00AM during this period. Outside of the 5.5 months where airside demolition work will occur from 10:00PM-6:00AM, there will be much less overnight traffic due to the removal of the overnight construction shift.
The construction traffic analysis examined the potential operational effects of additional construction-related vehicle trips generated at key intersections in the vicinity of the Airport during the peak calendar quarter of the entire construction duration (i.e., the fourth quarter of 2015). Figure 5-1 illustrates the study intersections analyzed for construction conditions. All traffic impact analyses were conducted in accordance with the guidance published in the CEQR Technical Manual, including the determination of potential significant traffic impacts for each intersection.
Change: The peak quarter of the entire construction duration would be the second quarter of 2017.
December 2015 Chapter 5 – Environmental Consequences 5-6
LaGuardia Airport Technical Report CTB Redevelopment Program
The following is a list of the recommended transportation improvements for construction conditions. Because the peak construction period is a temporary condition, these improvements are recommended as temporary measures to reduce delays at these intersections and ensure the most efficient traffic signal operations during periods of peak construction activity. The signal timing adjustments noted below are subject to review and approval by the NYCDOT. The locations are highlighted in Figure 5-1 (Figure 5-1b reflects the recommended improvements for the proposed design changes).
• Northern Boulevard/Junction Boulevard – During the weekday morning peak hour, reallocateone (1) second of green time from the east-west phase to the north-south phase. During theweekday afternoon peak hour, reallocate two (2) seconds of green time from the east-westphase to the north-south phase.
Change: Mitigation no longer needed.
• Astoria Boulevard North Service Road/79th Street/23rd Avenue – During the weekday morningpeak hour, reallocate five (5) seconds of green time from the northwest-bound phase (i.e.,Astoria Boulevard North Service Road) to the northeast-bound phase (i.e., 23rd Avenue).
Change: Additional six (6) seconds of green time adjustment.
• Astoria Boulevard/Astoria Boulevard North Service Road – During the weekday afternoon peakhour, reallocate seven (7) seconds of green time from the northwest-bound phase to thewestbound phase. No change
December 2015 Chapter 5 – Environmental Consequences 5-7
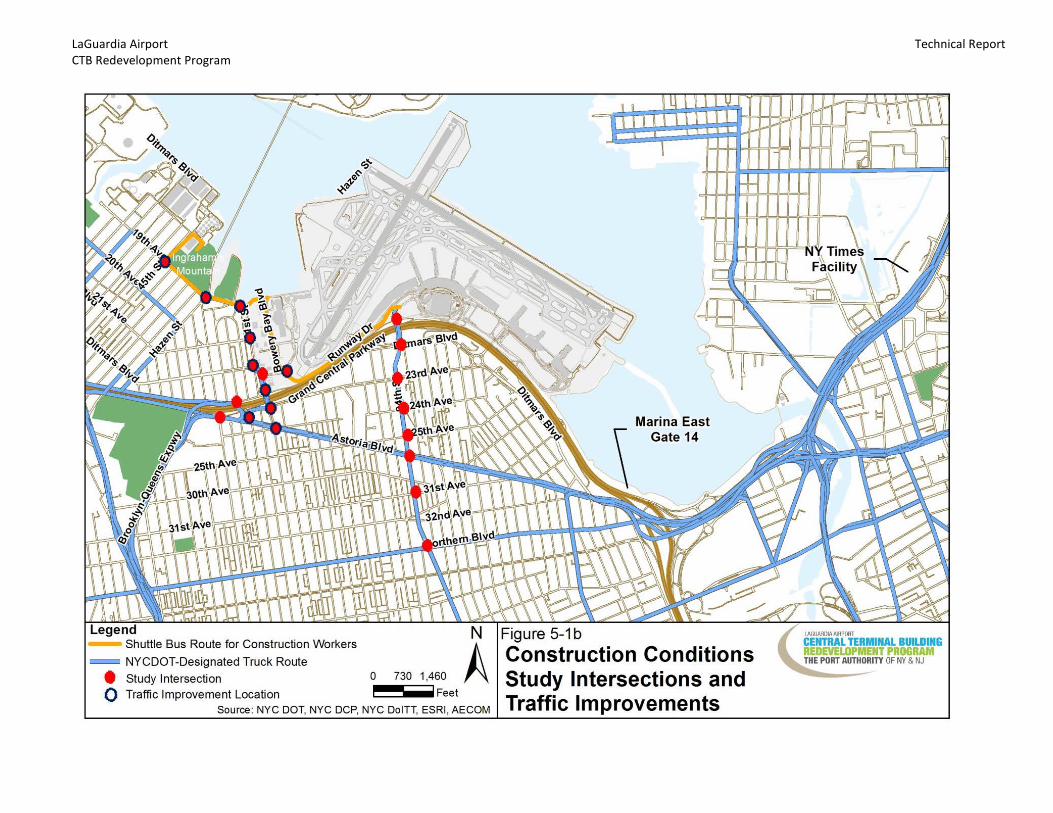
LaGuardia Airport Technical Report CTB Redevelopment Program
• Figure 5-1b Study Intersections and Traffic Improvements (Proposed design changes)
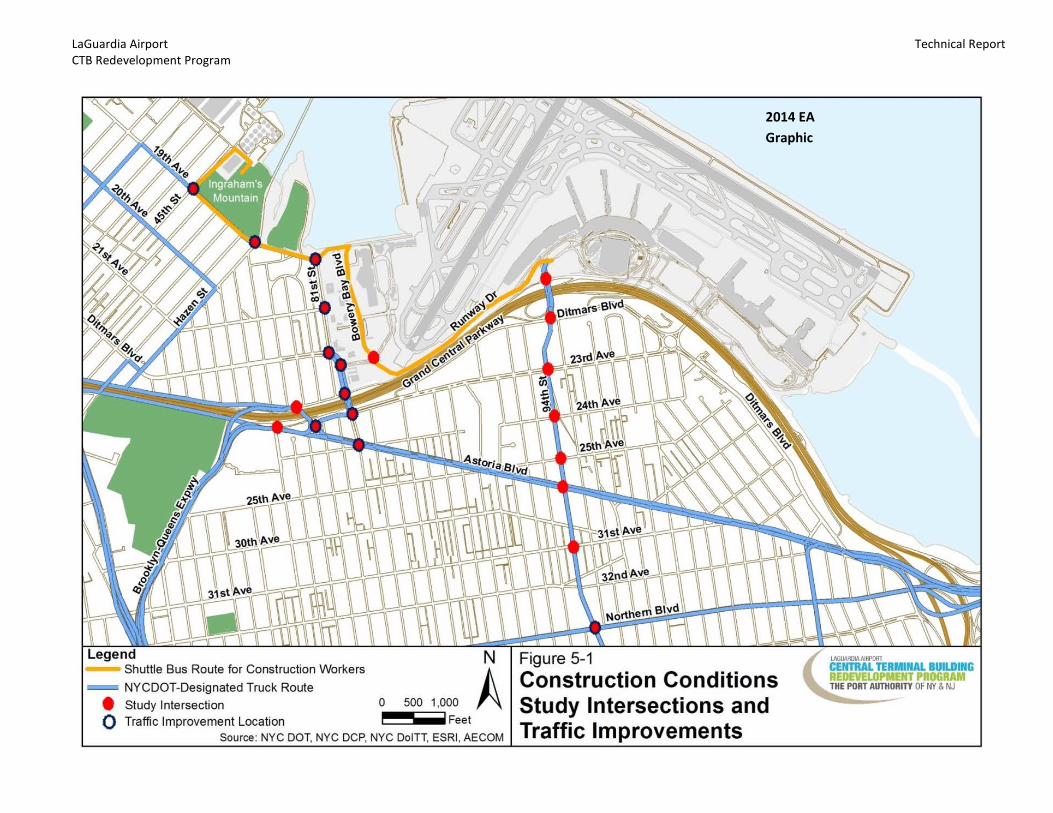
LaGuardia Airport Technical Report CTB Redevelopment Program
Figure 5-1a. Construction Conditions Study Intersections and Traffic Improvements (2014 FONSI/ROD) 2014 EA Graphic
LaGuardia Airport Technical Report CTB Redevelopment Program
• Astoria Boulevard North/Grand Central Parkway westbound off-ramp/82nd Street/Ditmars Boulevard – Restripe the westbound approach to create two exclusive right-turn lanes and one shared through/left-turn lane, and install corresponding advance lane use signs. During the weekday afternoon peak hour, reallocate four (4) seconds of green time from the westbound phase to the north-south phase.
Change: No geometry changes needed. During the weekday morning peak hour, reallocate four (4) seconds of green time from the north-south phase to the westbound phase. During the weekday afternoon peak hour, reallocate three (3) seconds of green time from the westbound phase to the north-south phase.
• 23rd Avenue/82nd Street – During the weekday morning peak hour, reallocate nine (9) seconds of green time from the north-south phase, plus one (1) second from the southbound phase, to the east-west phase (i.e., a total of 10 seconds).
Change: None
• Astoria Boulevard/82nd Street/24th Avenue – During the weekday afternoon peak hour, reallocate one (1) second of green time from the east-west phase to the southbound phase.
Change: None
• Ditmars Boulevard/Marine Terminal Drive – During the weekday morning peak hour, reallocate one (1) second of green time from the westbound phase to the north-south phase.
Change: Mitigation no longer needed.
• Ditmars Boulevard/81st Street – Restripe the westbound approach to accommodate two exclusive right-turn lanes and one shared through/left-turn lane and install corresponding advance lane use signs. During the weekday afternoon peak hour, reallocate eight (8) seconds of green time from the east-west phase to the southbound phase.
Change: None
• 21st Avenue/81st Street – During the weekday morning peak hour, reallocate eight (8) seconds of green time from the eastbound phase to the north-south phase.
Change: None
• 19th Avenue/Hazen Street – Install a new traffic signal controller in accordance with NYCDOT design guidance. Eliminate the “48 Hour Parking, Detached Trailers” parking regulation on the north side of 19th Avenue for a distance of approximately 200 feet west of Hazen Street, and restripe a 14-foot exclusive right-turn lane and a 12-foot shared through/left-turn lane on the eastbound approach.27 During the weekday morning peak hour, reallocate four (4) seconds of green time from the southbound leading phase to the east-west phase. During the weekday afternoon peak hour, reallocate seven (7) seconds of green time from the southbound leading phase and five (5) seconds from the north-south phase to the east-west phase.
27 This regulation change would eliminate curbside parking spaces for approximately four detached trailers. Field observations of existing trailer parking utilization along this curbside revealed approximately one to two trailers present on weekdays. The north curb along 19th Avenue between Hazen Street and 45th Street is largely under-utilized for trailer parking, and sufficient curbside space exists to accommodate the displaced trailers.
December 2015 Chapter 5 – Environmental Consequences 5-10
LaGuardia Airport Technical Report CTB Redevelopment Program
Change: None
• 19th Avenue/45th Street – Install a traffic signal at the intersection, remove the “48 HourParking, Detached Trailers” parking regulation on the east side of 45th Street, and extend the“No Standing Anytime” parking regulation on both sides of 45th Street for approximately 275feet north of 19th Avenue, to accommodate two lanes on the southbound approach, as well asone northbound receiving lane. In addition, prohibit standing with a “No Standing Anytime”parking regulation on the west side of 45th Street for approximately 80 feet south of 19th
Avenue, to allow for transition to the southbound through lane on 45th Street and on the southside of 19th Avenue for approximately 25 feet east of 45th Street, to accommodate the turningpaths for shuttle buses turning from 45th Street southbound to 19th Avenue eastbound.28,29
Change: Reallocate 10 seconds green time from Eastbound/Westbound toNorthbound/Southbound compared to above.
• Construction-only access driveway at 19th Avenue/81st Street30 – Continue to coordinate withNYCDOT staff concerning the proposed driveway (curb cut) that is currently being designed aspart of the RSA Enhancements project. The improvements proposed at this intersection include:
o Modify the channelization striping along 19th Avenue, west of the proposed driveway, toaccommodate an exclusive left-turn lane in the eastbound direction.
o Prohibit southbound “left-turn out” movements from the driveway onto 81st Streetsouthbound via striping and posted “No Left Turn” signs.
o Restrict entry into the driveway to authorized construction traffic only via posted“Authorized Vehicles Only: No Public Access” signs, or similar signs as approved byNYCDOT.
o Institute the use of a construction flagger to accommodate turning movements byconstruction vehicles during all times that the gate is open.31 When not in use forconstruction purposes, the driveway would be gated and the eastbound left-turnmovement prohibited using construction barrels or a related device as approved byNYCDOT.
28 Weekday field observations revealed no (zero) vehicles parked in any of the three locations requiring parking prohibitions. This intersection is located in a low-density industrial area with little on-street parking demand. On-street parking spaces are widely available elsewhere along 45th Street and 19th Avenue, as well as on other City streets in the vicinity.
29 Traffic signal warrants from the Manual on Uniform Traffic Control Devices (MUTCD) were analyzed at a planning-level at this intersection. This analysis indicated that Warrant #3 (Peak Hour Warrant) would be met based on the high volume of projected future traffic on the southbound approach (i.e., 45th Street) during the weekday afternoon construction peak hour and the corresponding high delays that would otherwise be incurred by vehicles under its current stop-controlled configuration.
30 It should be noted that this driveway will provide for ingress and egress to and from the Airport for construction-related traffic only. It will not provide access to the Airport for the general public.
31 This intersection was analyzed as a traffic signal-controlled location for capacity analysis purposes, to approximate the operations of a flagger during peak periods.
December 2015 Chapter 5 – Environmental Consequences 5-11
LaGuardia Airport Technical Report CTB Redevelopment Program
Change: Marine Terminal Road/Bowery Bay Boulevard – During the weekday morning peak hour, reallocate four (4) seconds of green time from the westbound phase to the northbound/southbound phase.
With these improvements in place, subject to review and approval by NYCDOT, no significant traffic impacts are projected to occur in accordance with the CEQR Technical Manual criteria. In addition, PANYNJ would implement a traffic monitoring program in coordination with NYCDOT throughout the duration of the construction period. This monitoring program would quantify the volume of construction workers’ vehicles parked at the Ingraham’s Mountain site and the need for and timing of implementation of the identified improvements. These monitoring efforts should be conducted annually, or at an agreed-upon frequency to be determined as part of on-going coordination efforts between PANYNJ and NYCDOT during the construction period.
Of the 21 study intersections, the overall level-of-service (LOS) under the Previously approved (2014) design conditions would remain the same or improve upon the Future No-Action Condition for 15 intersections. There would be a minor, temporary decrease in LOS at the following six intersections:
• Astoria Boulevard/94th Street – During the weekday morning peak hour, the overall averagedelay is projected to increase by 1.7 seconds/vehicle, from 34.7 seconds/vehicle (LOS “C”) underFuture No-Action Conditions to 36.4 seconds/vehicle (LOS “D”) under Previously approved(2014) design conditions. The LOS “C”/”D” threshold for signalized intersections is 35.0seconds/vehicle.
• Ditmars Boulevard/Marine Terminal Road – During the weekday afternoon peak hour, theoverall average delay is projected to increase by 4.2 seconds/vehicle, from 17.9 seconds/vehicle(LOS “B”) under Future No-Action Conditions to 22.1 seconds/vehicle (LOS “C”) under Previouslyapproved (2014) design conditions. The LOS “B”/”C” threshold for signalized intersections is 20.0seconds/vehicle.
• 21st Avenue/81st Street – During the weekday morning peak hour, the overall average delay isprojected to increase by 18.2 seconds/vehicle, from 22.1 seconds/vehicle (LOS “C”) underFuture No-Action Conditions to 40.3 seconds/vehicle (LOS “D”) under Previously approved(2014) design conditions. The LOS “C”/”D” threshold for signalized intersections is 35.0seconds/vehicle.
• 19th Avenue/Hazen Street – During the weekday afternoon peak hour, the overall average delayis projected to increase by 17.7 seconds/vehicle, from 34.4 seconds/vehicle (LOS “C”) underFuture No-Action Conditions to 52.1 seconds/vehicle (LOS “D”) under Previously approved(2014) design conditions. The LOS “C”/”D” threshold for signalized intersections is 35.0seconds/vehicle.
• Construction-only access driveway at 19th Avenue/81st Street – During the weekday morningpeak hour, the average delay for westbound movements (81st Street to 19th Avenue) is projectedto increase by 34.6 seconds/vehicle, from 5.2 seconds/vehicle (LOS “A”) under Future No-ActionConditions to 39.8 seconds/vehicle (LOS “D”) under Previously approved (2014) designconditions.
• 19th Avenue/45th Street – During the weekday morning peak hour, the average delay forwestbound movements is projected to increase by 35.7 seconds/vehicle, from 7.5seconds/vehicle (LOS “A”) under Future No-Action Conditions to 43.2 seconds/vehicle (LOS “D”)under Previously approved (2014) design conditions. During the weekday afternoon peak hour:
December 2015 Chapter 5 – Environmental Consequences 5-12
LaGuardia Airport Technical Report CTB Redevelopment Program
o The average delay for eastbound movements is projected to increase by 33.5seconds/vehicle, from 8.2 seconds/vehicle (LOS “A”) under Future No-Action Conditionsto 41.7 seconds/vehicle (LOS “D”) under Previously approved (2014) design conditions.
o The average delay for westbound movements is projected to increase by 35.4seconds/vehicle, from 8.2 seconds/vehicle (LOS “A”) under Future No-Action Conditionsto 43.6 seconds/vehicle (LOS “D”) under Previously approved (2014) design conditions.
o The average delay for southbound left-turn movements is projected to increase by 19.0seconds/vehicle, from 24.5 seconds/vehicle (LOS “C”) under Future No-ActionConditions to 43.5 seconds/vehicle (LOS “D”) under Previously approved (2014) designconditions.
Change: The overall LOS under the peak construction period under the proposed design changes would remain the same or improve for all 21 study intersections. When compared with the 2014 FONSI/ROD, the LOS under the proposed design changes would remain the same or improve for 18 intersections. During the peak construction period, there would be a minor, temporary decrease in LOS at the following three intersections:
• Astoria Boulevard North Service Road/79th Street/23rd Avenue- During the weekday morningpeak hour, the overall average delay is projected to increase by 5.2 seconds/vehicle, from 19.5seconds/vehicle (LOS “B”) under the proposed design changes in the 2014 EA to 24.7seconds/vehicle (LOS “C”) under the proposed design changes. During the weekday afternoonpeak hour, the overall average delay is projected to increase by 11.4 seconds/vehicle, from 14.9seconds/vehicle (LOS “B”) under the Proposed design changes in the 2014 EA to 26.3seconds/vehicle (LOS “C”) under the proposed design changes. The LOS “B”/”C” threshold forsignalized intersections is 20.0 seconds/vehicle.
• Astoria Boulevard North/Grand Central Parkway Westbound Off-Ramp/82nd Street/DitmarsBoulevard – During the weekday morning peak hour, the overall average delay is projected toincrease by 14.0 seconds/vehicle, from 28.4 seconds/vehicle (LOS “C”) under the proposed designchanges in the 2014 EA to 42.4 seconds/vehicle (LOS “D”) under the proposed design changes.The LOS “C”/”D” threshold is 35.0 seconds/vehicle.
• Bowery Bay Boulevard/Runway Drive//Marine Terminal Road – During the weekday morningpeak hour, the overall average delay is projected to increase by 7.8 seconds/vehicle, from 34.4seconds/vehicle (LOS “C”) under the proposed design changes in the 2014 EA to 42.2seconds/vehicle (LOS “D”) under the proposed design changes. The LOS “C”/”D” threshold is 35.0seconds/vehicle.
Incorporating the minor changes to the recommended transportation improvements that were described above, the LOS at these intersections would remain at LOS D or above, which is considered an acceptable level of congestion. No significant traffic impacts are projected to occur in accordance with the CEQR Technical Manual criteria.
5.2.1.2.2 Operations
The analysis of future traffic operations included conditions on local surface streets surrounding the Airport, as well as on the Grand Central Parkway. In addition, a brief evaluation of impacts to parking, transit, pedestrians and safety was performed.
Since there would be no significant changes to the roadway layout or trip generation as a result of the proposed design changes, no additional analysis is required for the operational traffic conditions.
December 2015 Chapter 5 – Environmental Consequences 5-13
LaGuardia Airport Technical Report CTB Redevelopment Program
Surface Street Intersections
The analysis of surface street intersections for both construction and operations conditions was performed in consultation with NYCDOT staff (see correspondence in Section A.8 of Appendix A: Transportation of the 2014 EA). This analysis includes year 2012 existing conditions, year 2030 Future No-Action Conditions (without the CTB Redevelopment Program) and year 2030 Proposed Action Conditions (with the CTB Redevelopment Program) at the intersections shown in Figure 5-2.
Existing Conditions
The year 2012 existing conditions analysis forms the basis for all future conditions analyses and was based on observed traffic counts conducted in the field at key intersections in the vicinity of the Airport that are expected to be most affected by additional traffic generated by the CTB Redevelopment Program. The weekday morning and afternoon peak hours for traffic on the roadway network in the study area were determined to be 7:30 to 8:30 AM and 4:00 to 5:00 PM, respectively.32
Future No-Action Conditions
The Future No-Action Condition includes anticipated future increases in traffic volumes unrelated to the CTB Redevelopment Program, including regional background traffic growth, projected growth associated with the 6.5 MAP at LaGuardia Airport by 2030 (unrelated to the CTB Redevelopment Program), and traffic volumes associated with the proposed Willets Point Development District.33
In addition, the Future No-Action and Proposed Action traffic analyses include:
• A series of improvements undertaken by NYSDOT involving: a) reconfiguration of the eastboundramps to and from the Grand Central Parkway in the vicinity of the 94th Street interchange, b)signalization of the Ditmars Boulevard/Grand Central Parkway eastbound on-ramp intersection,
32 These peak hours are for street traffic outside LaGuardia Airport and partially overlap with the identified peak hours for traffic within the Airport (i.e., 6:45 to 7:45 am and 4:45 to 5:45 pm). The 7:30 to 8:30 am and 4:00 to 5:00 pm peak hours represent reasonable worst-case conditions for the off-Airport street system during weekday morning and evening periods.
33 The Willets Point Development District is a redevelopment effort led by the City of New York that will transform a 23-acre site adjacent to CitiField, currently occupied by auto parts shops, into a mixed used retail, entertainment and housing complex. A school, hotel and open space are also contemplated. The project completed a NEPA Environmental Impact Statement (EIS) in August 2013. However, the project has been enjoined by the Supreme Court, Appellate Division First Department. A full accounting is below:
On February 10, 2014, State Senator Tony Avella, among other petitioners, sought declaratory and injunctive relief from the City Council’s approval of Queens’ Development Group’s planned 10-story, 200 room hotel, and 30,000 square foot mall complex on Willets Point West, the former location of Shea Stadium. This site was once the north end of Flushing Meadow Park until the state legislation approved the stadium’s construction in 1961. While the site had been used as parking for Shea Stadium it was still classified as parkland. Avella sought a declaration that the City in approving the development violated the public trust doctrine. The Supreme Court in Manhattan found that the development fell within the state legislation authorizing Shea Stadium and use of the parkland. Petitioners filed an appeal with the First Department.
On July 2, 2015, the Supreme Court, Appellate Division First Department issued a decision and order overturning the lower court’s decision and enjoined progress of the development. Justice Mazzarelli, writing for the panel, found the enumerated purposes in the state legislation permitted use of the parkland for Shea stadium including improvement of trade and commerce were intended to be considered in conjunction with operating a stadium and did not include the proposed development.
December 2015 Chapter 5 – Environmental Consequences 5-14
LaGuardia Airport Technical Report CTB Redevelopment Program
c) modification of the lane configurations on the eastbound, westbound, and southboundapproaches to the Ditmars Boulevard/94th Street intersection, and d) widening of the 82nd Street westbound off-ramp from the Grand Central Parkway from two to three lanes at its approach to 82nd Street-Ditmars Boulevard. As of August 2014, these improvements have been completed. Improvements anticipated to be made to the Bowery Bay Boulevard/Runway Drive/Marine Terminal Road intersection as part of the RSA Enhancements project at LaGuardia Airport to be implemented prior to the peak time period for construction (i.e., the fourth quarter of 2015).34
Traffic Conditions under the CTB Redevelopment Program
The CTB Redevelopment Program Condition traffic analysis includes the projected future annual passenger increase of 3.9 MAP associated with the proposed CTB Redevelopment Program. The CTB Redevelopment Program is projected to generate approximately 322 additional vehicle trips (160 inbound trips and 162 outbound trips) during the weekday morning peak hour and approximately 383 additional vehicle trips (190 inbound trips and 193 outbound trips) during the weekday afternoon peak hour.
To reduce intersection delays and ensure the most efficient traffic signal operations under the CTB Redevelopment Program, minor reallocations of the green time displays allocated to particular phases at traffic signals in the area may be required at the following intersections, illustrated in Figure 5-2:35
• Bowery Bay Boulevard/Runway Drive/Marine Terminal Road
• Ditmars Boulevard/Marine Terminal Road
• Astoria Boulevard North-Grand Central Parkway westbound off-ramp/82nd Street-DitmarsBoulevard
• Astoria Boulevard/82nd Street-24th Avenue
In addition, at the Astoria Boulevard/82nd Street-24th Avenue intersection, the following geometric improvements would be required:
• Restriping of the northbound (24th Avenue) approach to accommodate one 12-foot exclusiveleft-turn lane and one 12-foot shared through/right-turn lane.
• Changing the “No Parking Anytime” parking regulation to a “No Standing Anytime” parkingregulation on the north side of 24th Avenue.
• Implementing a “No Standing Anytime” regulation for 100 feet (i.e., approximately fourpassenger car lengths) on the south side of 24th Avenue, south of Astoria Boulevard.36
• Implementing a “No Standing Anytime” parking regulation on the east side of 82nd Street forapproximately 50 feet south of Astoria Boulevard.37
34 See Section 5.11 (starting page 5-45) and Appendix D of the LaGuardia Airport Runway Safety Area Enhancements Final Environmental Assessment dated December 2013 (FONSI signed by FAA on 12/31/2013).
35 All traffic impact analyses were conducted in accordance with the guidance published in the CEQR Technical Manual, including the determination of potential significant traffic impacts for each intersection.
36 Field observations of parking utilization levels in the vicinity of this intersection indicate sufficient available parking on the local streets south of Astoria Boulevard to accommodate up to four displaced passenger cars.
37 This section of the street largely overlaps with an existing driveway serving a gas station (i.e., no on-street parking is allowed) so there is effectively no change in parking capacity or utilization as a result of this regulation change.
December 2015 Chapter 5 – Environmental Consequences 5-15
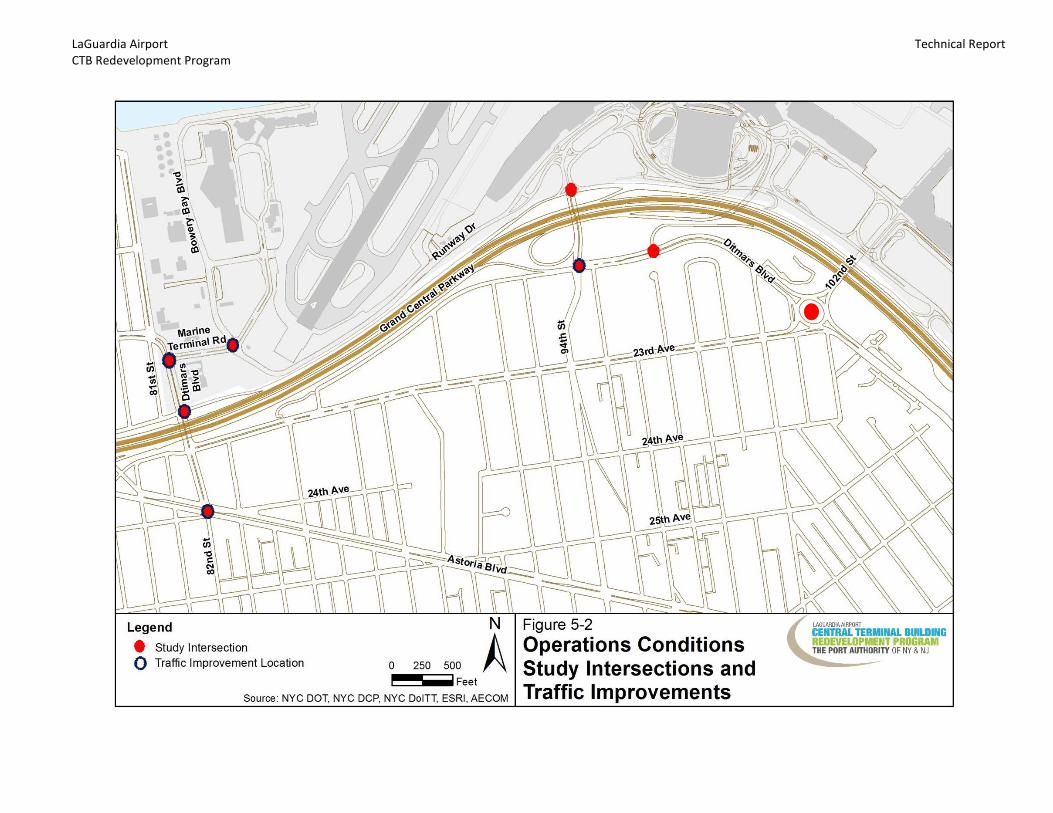
LaGuardia Airport Technical Report CTB Redevelopment Program
Figure 5-2. Operation Conditions Study Intersections and Traffic Improvements
LaGuardia Airport Technical Report CTB Redevelopment Program
With these improvements in place, no significant traffic impacts are projected to occur in accordance with the CEQR Technical Manual criteria. Furthermore, the overall intersection levels-of-service that are projected under the Future No-Action Condition are projected to remain the same—or improve—under the CTB Redevelopment Program.
The improvements noted above are subject to review and approval by the NYCDOT. Following the opening of the new terminal in 2021, PANYNJ would continue the traffic monitoring program initiated during construction, in coordination with NYCDOT. This monitoring program would involve the collection and evaluation of traffic data at locations where improvements were recommended to determine the need for and timing of implementation of the identified improvements. In addition, the westbound Grand Central Parkway between the 94th Street entrance ramp and the 82nd Street exit ramp would be included among the locations to be monitored. These monitoring efforts would be conducted at least annually, or at a frequency and duration to be determined as part of future coordination efforts between PANYNJ and NYCDOT.
Grand Central Parkway
The analysis of the Grand Central Parkway mainline for the future operating conditions was performed in consultation with NYCDOT and NYSDOT staff (see correspondence in Section A.8 of Appendix A: Transportation of the 2014 EA). Traffic operations analysis was conducted for both directions of the Parkway mainline and associated ramps under year 2012 existing conditions, year 2030 Future No-Action Conditions, and year 2030 Proposed Action Conditions, during both the weekday morning and afternoon peak periods. The traffic operations analysis of the Parkway mainline and associated ramps in both the eastbound and westbound directions was conducted using FREEVAL-2010 (version 2).38 The analysis was conducted for the peak three hours of a typical weekday morning peak period (5:45 to 8:45 am) and the peak three hours of a typical weekday afternoon peak period (3:45 to 6:45 pm). The existing conditions traffic volumes used in the analysis were year 2012 hourly volumes that were projected from 2010 hourly traffic volumes provided by the PANYNJ and increased by the applicable CEQR Technical Manual growth factor to estimate 2012 conditions.
The proposed design of the future roadway geometry under the Future With-Action Condition (see Figure 5-3) aims to address existing operational deficiencies on the westbound Parkway, as well as address significant existing and projected on-Airport circulation and traffic operations deficiencies. With respect to the westbound Parkway, the proposed design would generally retain the same basic ramp arrangement on the westbound Parkway: one exit ramp (Exit 7) followed by two consecutive entrance ramps from the reconfigured collector-distributor road and from 94th Street, followed by the exit ramp to 82nd Street. Under the CTB Redevelopment Program, the spacing between the two entrance ramps would be increased by approximately 210 feet.
Change: There would be minor changes to the on-airport roadway layout as a result of the proposed design changes (see Figure 5-3b).:
- Terminal B frontages (HOV, Arrivals, & Departures levels) shifted approximately 30' south to support connection to Terminal C and reconfigured headhouse.
38 FREEVAL is a deterministic traffic model supported and maintained by the Transportation Research Board’s (TRB) Highway Capacity and Quality of Service (HCQS) Subcommittee and is the official computational engine that implements procedures in the 2010 HCM.
December 2015 Chapter 5 – Environmental Consequences 5-17
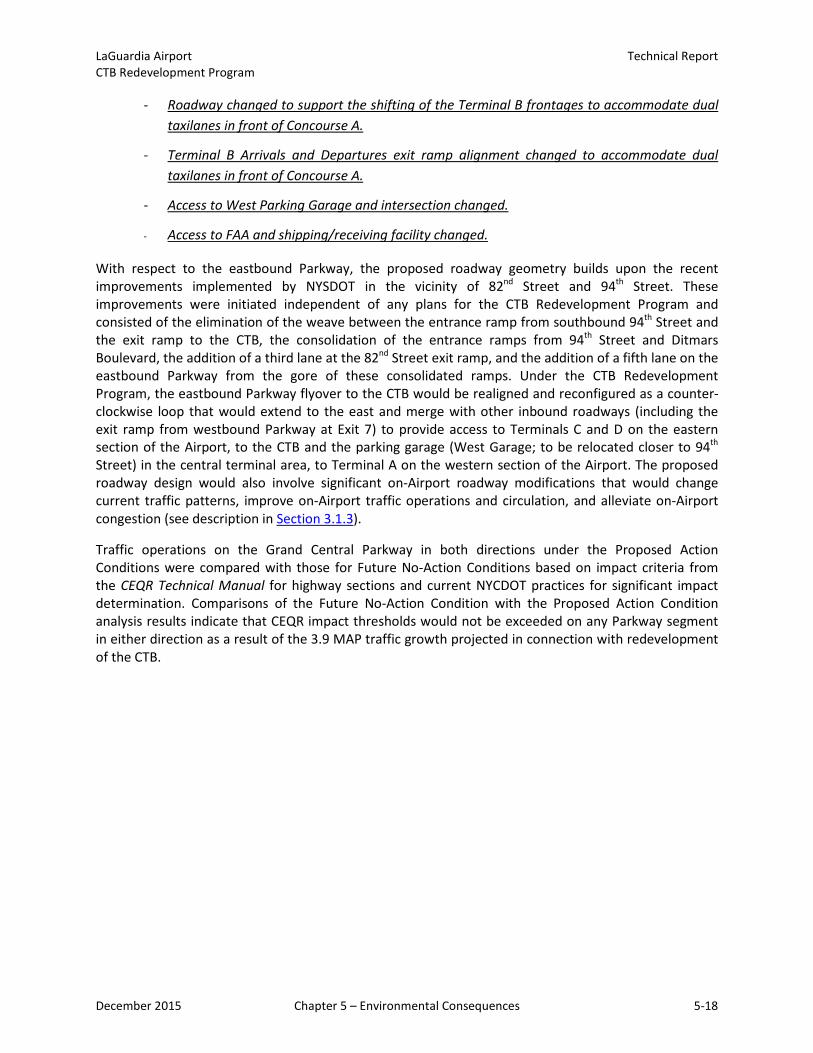
LaGuardia Airport Technical Report CTB Redevelopment Program
- Roadway changed to support the shifting of the Terminal B frontages to accommodate dual taxilanes in front of Concourse A.
- Terminal B Arrivals and Departures exit ramp alignment changed to accommodate dual taxilanes in front of Concourse A.
- Access to West Parking Garage and intersection changed.
- Access to FAA and shipping/receiving facility changed.
With respect to the eastbound Parkway, the proposed roadway geometry builds upon the recent improvements implemented by NYSDOT in the vicinity of 82nd Street and 94th Street. These improvements were initiated independent of any plans for the CTB Redevelopment Program and consisted of the elimination of the weave between the entrance ramp from southbound 94th Street and the exit ramp to the CTB, the consolidation of the entrance ramps from 94th Street and Ditmars Boulevard, the addition of a third lane at the 82nd Street exit ramp, and the addition of a fifth lane on the eastbound Parkway from the gore of these consolidated ramps. Under the CTB Redevelopment Program, the eastbound Parkway flyover to the CTB would be realigned and reconfigured as a counter-clockwise loop that would extend to the east and merge with other inbound roadways (including the exit ramp from westbound Parkway at Exit 7) to provide access to Terminals C and D on the eastern section of the Airport, to the CTB and the parking garage (West Garage; to be relocated closer to 94th Street) in the central terminal area, to Terminal A on the western section of the Airport. The proposed roadway design would also involve significant on-Airport roadway modifications that would change current traffic patterns, improve on-Airport traffic operations and circulation, and alleviate on-Airport congestion (see description in Section 3.1.3).
Traffic operations on the Grand Central Parkway in both directions under the Proposed Action Conditions were compared with those for Future No-Action Conditions based on impact criteria from the CEQR Technical Manual for highway sections and current NYCDOT practices for significant impact determination. Comparisons of the Future No-Action Condition with the Proposed Action Condition analysis results indicate that CEQR impact thresholds would not be exceeded on any Parkway segment in either direction as a result of the 3.9 MAP traffic growth projected in connection with redevelopment of the CTB.
December 2015 Chapter 5 – Environmental Consequences 5-18
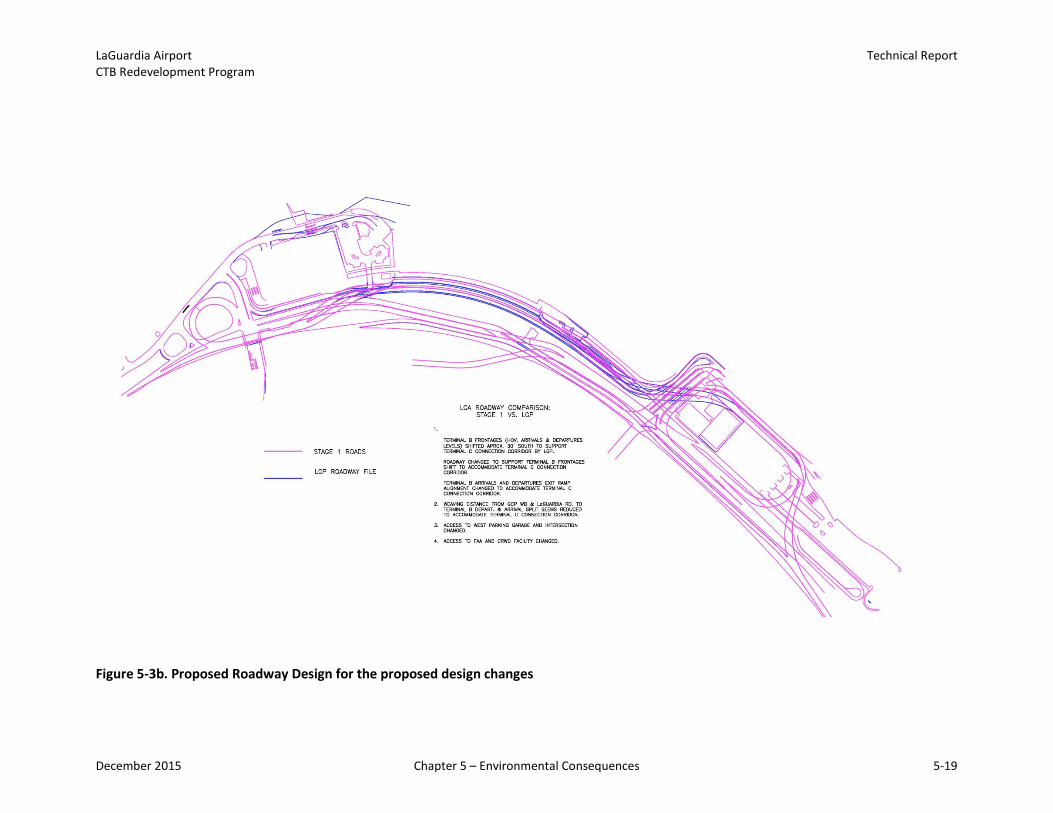
LaGuardia Airport Technical Report CTB Redevelopment Program
Figure 5-3b. Proposed Roadway Design for the proposed design changes
December 2015 Chapter 5 – Environmental Consequences 5-19
LaGuardia Airport Technical Report CTB Redevelopment Program
Figure 5-3a. Proposed Roadway Design
2014 EA Graphic
December 2015 Chapter 5 – Environmental Consequences 5-20
LaGuardia Airport Technical Report CTB Redevelopment Program
Parking
There are currently six surface parking lots and a parking garage that serve passengers at LaGuardia Airport and a new parking garage is under construction. The CTB Redevelopment Program will rationalize the proposed parking supply with projected future parking demands within the Airport through a reallocation of parking facilities throughout the Airport. An objective of this rationalization process is to ensure that vehicles generated under the CTB Redevelopment Program are entirely accommodated on-site in new and/or reconfigured parking facilities at the Airport. Therefore, no off-site demand for parking is expected to occur on city streets in the vicinity of the Airport. Because all parking demand is projected to be accommodated on-site, a parking assessment is not warranted for the CTB Redevelopment Program.
Change: Under the proposed design changes, the capacity of the proposed West Garage would increase from 2,900 to 3,100 spaces. The garage was originally presented as a five level garage. There are five levels of elevated parking in the garage as well as parking on the roof and ground floors, for a total of seven levels of parking. The increase in parking is a result of full utilization of rooftop parking, as opposed to partial utilization of rooftop parking in the previously approved (2014) design. The height of the garage (83 feet above ground level) remains the same. The rooftop parking would be covered by a shading structure to meet security requirements. Design refinements since the 2014 EA was released shifted the garage's footprint roughly 35 feet to the west and reduced the footprint to the north by roughly 40 feet. The garage remains substantially similar in size and location, as demonstrated in Figure 3-4 (page 1-19).
Transit
LaGuardia Airport is not directly accessible via subway, and no modifications to subway service are proposed under the CTB Redevelopment Program; however, the terminal and roadway design does not preclude subway access in the future. Several MTA bus lines serve the Airport. Based on the estimated trip generation, the CTB Redevelopment Program is not projected to increase public bus ridership by more than 200 new person-trips during any one peak hour. Therefore, detailed subway and bus analyses are not warranted for the CTB Redevelopment Program, as per the CEQR Technical Manual, Chapter 16, Section 300, Assessment Methods. It is expected that private bus carriers would continue to serve the Airport under the CTB Redevelopment Program and provide more frequent service as needed to accommodate the projected increase in passenger demand under both the future No-Action and Proposed Action conditions. These projected increases in private bus traffic are reflected in the vehicle trip generation estimates for the Proposed Action Condition traffic analysis.
Pedestrians
Although an increase in on-site (within the Airport) pedestrian activity is expected, the CTB Redevelopment Program is not projected to generate more than 200 external pedestrian trips at any off-site locations (outside the Airport). Therefore, a pedestrian assessment is not warranted for the CTB Redevelopment Program as per the CEQR Technical Manual, Chapter 16, Section 300, Assessment Methods.
Safety Assessment
Crash data compiled by the NYCDOT for the most recent available three-year period (i.e., 2010 to 2012) was reviewed to identify the crash history at the study intersections. The total numbers of crashes at each study intersection were found to be well below the 48-crash per 12-month period CEQR threshold for a “high-crash location.” Also, none of the study intersections meet the “high-crash location” CEQR
December 2015 Chapter 5 – Environmental Consequences 5-21
LaGuardia Airport Technical Report CTB Redevelopment Program
threshold of five or more pedestrian/bicyclist crashes during any 12-month period. The NYCDOT data also indicates that there were no fatal crashes at the study intersections during the three-year period. Therefore, none of the study intersections are classified as “high-crash locations” as defined in the CEQR Technical Manual.
5.2.1.3 No-Action Alternative
The Future No-Action Condition traffic analysis identifies how the study area’s transportation system is projected to operate in the future horizon year without the CTB Redevelopment Program. The Future No-Action Condition traffic analysis includes anticipated future increases in background traffic volumes, but does not include the traffic generated by—nor the transportation improvements proposed by—the CTB Redevelopment Program.
Without the proposed redevelopment of the CTB, passenger travel at LaGuardia Airport is still projected to continue to increase over time. The PANYNJ estimates that without the CTB Redevelopment Program projected passenger travel at LaGuardia Airport will increase by 6.5 MAP by the year 2030. In addition, without the project there would be no further change to the geometry of the Grand Central Parkway mainline or the associated ramps, nor would there be any improvements made to the on-Airport roadway infrastructure. Therefore, the existing on-Airport roadway network—along with its associated traffic operations and circulation issues—would remain into the future.
Relative to year 2012 existing conditions, the following intersections would experience worsening overall levels-of-service due to increased overall delays under year 2030 Future No-Action Conditions:
• Astoria Boulevard North/Grand Central Parkway westbound off-ramp/82nd Street/Ditmars Boulevard – During the weekday afternoon peak hour, the overall average delay is projected to increase by 11.0 seconds/vehicle, from 32.7 seconds/vehicle (LOS “C”) under existing conditions to 43.7 seconds/vehicle (LOS “D”) under Future No-Action Conditions.
• Astoria Boulevard/82nd Street/24th Avenue – During the weekday morning peak hour, the overall average delay is projected to increase by 12.6 seconds/vehicle, from 31.4 seconds/vehicle (LOS “C”) under existing conditions to 44.0 seconds/vehicle (LOS “D”) under Future No-Action Conditions. During the weekday afternoon peak hour, the overall average delay is projected to increase by 37.3 seconds/vehicle, from 45.3 seconds/vehicle (LOS “D”) under existing conditions to 82.6 seconds/vehicle (LOS “F”) under Future No-Action Conditions.
• LaGuardia Access Road/94th Street – During the weekday morning peak hour, the overall average delay is projected to increase by 49.0 seconds/vehicle, from 27.8 seconds/vehicle (LOS “C”) under existing conditions to 76.8 seconds/vehicle (LOS “E”) under Future No-Action Conditions. During the weekday afternoon peak hour, the overall average delay is projected to increase by 52.2 seconds/vehicle, from 32.5 seconds/vehicle (LOS “C”) under existing conditions to 84.7 seconds/vehicle (LOS “F”) under Future No-Action Conditions.
• Ditmars Boulevard/23rd Avenue/LaGuardia Airport access road (unsignalized rotary intersection) – During the weekday morning peak hour, the average delay for the southbound through movement leaving the Airport is projected to increase by 13.2 seconds/vehicle, from 34.3 seconds/vehicle (LOS “D”) under existing conditions to 47.5 seconds/vehicle (LOS “E”) under Future No-Action Conditions. During the weekday afternoon peak hour, the average delay for this same movement is projected to increase by 5.1 seconds/vehicle, from 20.9
December 2015 Chapter 5 – Environmental Consequences 5-22
LaGuardia Airport Technical Report CTB Redevelopment Program
seconds/vehicle (LOS “C”) under existing conditions to 26.0 seconds/vehicle (LOS “D”) under Future No-Action Conditions.
• Ditmars Boulevard/Marine Terminal Road – During the weekday afternoon peak hour, theoverall average delay is projected to increase by 8.0 seconds/vehicle, from 17.7 seconds/vehicle(LOS “B”) under existing conditions to 25.7 seconds/vehicle (LOS “C”) under Future No-ActionConditions.
• Ditmars Boulevard/94th Street – During the weekday morning peak hour, the overall averagedelay is projected to increase by 8.1 seconds/vehicle, from 14.2 seconds/vehicle (LOS “B”) underexisting conditions to 22.3 seconds/vehicle (LOS “C”) under Future No-Action Conditions. Duringthe weekday afternoon peak hour, the overall average delay is projected to increase by 10.1seconds/vehicle, from 17.2 seconds/vehicle (LOS “B”) under existing conditions to 27.3seconds/vehicle (LOS “C”) under Future No-Action Conditions.
• Bowery Bay Boulevard/Runway Drive/Marine Terminal Road – During the weekday morningpeak hour, the overall average delay is projected to increase by 24.8 seconds/vehicle, from 36.3seconds/vehicle (LOS “D”) under existing conditions to 61.1 seconds/vehicle (LOS “E”) underFuture No-Action Conditions.
5.2.1.4 Summary of Impacts
A variety of temporary improvements—including a traffic signal installation, a traffic signal controller upgrade, signal timing adjustments, curbside parking prohibitions, lane widening/restriping, and the use of construction flaggers—would be required at a total of 12 intersections to accommodate the increased traffic volumes occurring during construction of the CTB Redevelopment Program (see Section 5.1.2.1). Those improvements were based on analysis of projected traffic patterns during the peak hours of the peak quarter of construction (the fourth quarter of 2015). Decisions concerning the extent to which these temporary improvements will be implemented, the timing of implementation, and the duration that the improvements will be retained during non-peak periods of construction, fall under the purview of the NYCDOT and will be determined in coordination with NYCDOT’s Office of Construction Management and Coordination (OCMC).
Change: A variety of temporary improvements—including a traffic signal installation, a traffic signal controller upgrade, signal timing adjustments, curbside parking prohibitions, lane widening/restriping, and the use of construction flaggers—would be required at a total of 11 intersections to accommodate the increased traffic volumes occurring during construction of the proposed design changes (see Section 5.2.1.2.1). Those improvements were based on analysis of projected traffic patterns during the peak hours of the peak quarter of construction (the second quarter of 2017).
With these improvements, the overall intersection levels-of-service that are projected under the Future No-Action Conditions would remain the same—or improve—under the Proposed Action Conditions, with the exception of six intersections (Astoria Boulevard/94th Street, Ditmars Boulevard/Marine Terminal Road, 21st Avenue/81st Street, 19th Avenue/Hazen Street, the construction access driveway/19th Avenue/81st Street, and 19th Avenue/45th Street) where the change does not constitute significant adverse traffic impacts according to CEQR Technical Manual criteria.
Change: With these improvements, the overall intersection LOS that are projected under the Future No-Action Conditions would remain the same—or improve—with the proposed design changes versus conditions contemplated in the 2014 EA, with the exception of three intersections where a minor,
December 2015 Chapter 5 – Environmental Consequences 5-23
LaGuardia Airport Technical Report CTB Redevelopment Program
temporary decrease in LOS would occur, as detailed on page 5-13. The change does not constitute significant adverse traffic impacts according to CEQR Technical Manual criteria.
In the year 2030, with fully realized passenger demand, improvements at four signalized intersections may be required to accommodate the traffic volumes associated with the 3.9 MAP increase. These improvements include minor reallocations of green time at all four intersections, plus lane restriping and curbside parking prohibitions at one of the four intersections. With these improvements in place, no significant traffic impacts are projected to occur in accordance with the CEQR Technical Manual criteria. Furthermore, the overall intersections LOS that are projected under the Future No-Action Condition would remain the same—or improve—under the Proposed Action Condition.
Decisions concerning the implementation of any traffic improvements fall under the purview of the NYCDOT. Coordination with the pertinent divisions within NYCDOT (Traffic Planning, Highway Design, Signals, etc.) is on-going and will continue as the project advances to construction. PANYNJ would implement a traffic monitoring program in coordination with NYCDOT throughout the duration of the construction period and continuing after the construction of the new terminal in 2021, as needed. The monitoring program would determine the need for and timing of implementation of the identified improvements.
Change: The construction schedule for the proposed design changes anticipates completion of the new terminal in late 2021.
No significant adverse impacts are projected with respect to off-Airport parking availability, transit facilities, or pedestrian facilities. None of the study intersections are classified as “high-crash locations” as defined in the CEQR Technical Manual.
Without the proposed redevelopment of the CTB, passenger travel at LaGuardia Airport is still projected to increase up to 30.1 MAP. Without the Redevelopment Program, there would be no additional change to the geometry of the Grand Central Parkway mainline or the associated ramps, nor would there be any improvements made to the on-Airport roadway infrastructure. Therefore, the existing on-Airport roadway network—along with its associated traffic operations and circulation issues—would remain into the future. Relative to year 2012 existing conditions, seven intersections would experience worsening overall levels-of-service under year 2030 Future No-Action Conditions.
5.2.2 Air Quality
The Clean Air Act and its amendments (CAAA) is the comprehensive federal law that regulates air emissions from mobile and stationary sources. This law authorizes the Environmental Protection Agency (EPA) to establish National Ambient Air Quality Standards (NAAQS) to protect public health and public welfare and to regulate emissions of hazardous air pollutants (HAP). Areas of the country where air pollution levels persistently exceed the NAAQS are designated “nonattainment areas.” Areas that have a history of nonattainment but are now meeting NAAQS are designated “maintenance areas.” According to the EPA’s Green Book39, Queens County in New York is a designated nonattainment area for two criteria pollutants—ozone and fine particulates–and a designated maintenance area for carbon monoxide.
39The Green Book Nonattainment Areas for Criteria Pollutants (as of July 31, 2013) is available online at http://www.epa.gov/oaqps001/greenbk/.
December 2015 Chapter 5 – Environmental Consequences 5-24
LaGuardia Airport Technical Report CTB Redevelopment Program
LaGuardia Airport is located in Queens County, which means project-related air emissions would occur within EPA-designated nonattainment and maintenance areas. The CTB Redevelopment Program is not exempt from the Clean Air Act nor is the project presumed to conform40 to the State Implementation Plan (SIP).41 Therefore, the EPA’s General Conformity Rule (40 CFR Part 93, §93.153)42 applies to the project and an air quality analysis must be prepared. The purpose of the General Conformity Rule is to ensure that federal activities do not cause or contribute to new violations of the NAAQS, increase the frequency or worsen existing violations of the NAAQS, or delay attainment of the NAAQS.
This report section, supplemented by the analysis and discussion contained in Appendix B: Air Quality Technical Report of the 2014 EA, provides the information, materials, and evidence needed to demonstrate compliance pursuant to the CAAA, EPA regulations, and NEPA.
Attachment 5: Technical Memorandum – Updated Air Quality Analysis for the Construction Condition and Attachment 8: LGA CTB CO Hot Spot Analysis provide supplemental analysis and discussion on the air quality impacts from the proposed design changes. The changes do not trigger any general conformity or CEQR Technical Handbook significance levels and therefore do not raise additional environmental concerns as related to the previously approved design.
Construction emissions associated with the proposed design changes were calculated using the same methodology used for the 2014 FONSI/ROD, with modifications to the inputs based on the changes to the construction schedule, updated construction equipment usage data (diesel- and gas-powered demolition and construction equipment), and revised construction traffic analysis (trucks transporting construction materials and concrete, construction worker vehicles) (see Attachment 4: Technical Memorandum – Updated Traffic Analysis for Construction Conditions).
Construction equipment emissions for the proposed design changes were estimated using the NONROAD model for activity during each construction year. Construction equipment data (equipment type, horsepower, and load factor) for the proposed design changes are presented in Attachment 5. As with the 2014 FONSI/ROD, the non-road category for all equipment was conservatively assumed to meet Tier 2 emissions standards, even though the industry is transitioning to cleaner Tier 4 standards and upgrading fleets. Tier 2 emissions standards refer to the 40 Code of Federal Regulations (CFR) Part 89 Subpart E, Tier 2 Vehicle and Gasoline Sulfur Program; and Tier 4 emissions standards refer to 40 CFR Part 1039-Tier 4 Emissions Standards and Certification Requirements. The estimated hours of operation for each type of equipment were calculated for each year of construction (2016 to 2021). The NONROAD model estimated operational emissions for VOC, NOx, CO, PM10, PM2.5, SO2, and CO2 resulting from construction equipment for each year of construction of the proposed design changes (see Table B.4-3B in Attachment 5).
40 The FAA has designated a list of actions whose emissions are typically below EPA’s thresholds of significance (de minimis) for the various criteria pollutants. These actions, known as “presumed to conform actions” typically do not require air emissions analysis. For more information, see Federal Register/Vol. 72, No. 145 [FR Doc. 07-3695 Filed 7-25-07].
41 Under the Clean Air Act, states must develop SIPs that outline how they will control air pollution in designated nonattainment and maintenance areas. A SIP is a collection of regulations, programs, and policies an individual state will use to attain and maintain the NAAQS.
42 Under the Clean Air Act (§176(c)(4)) General Conformity Rule, federal agencies must work with state, tribal and local governments in a nonattainment or maintenance area to ensure that federal actions conform to the air quality plans established in the applicable state or tribal implementation plan.
December 2015 Chapter 5 – Environmental Consequences 5-25
LaGuardia Airport Technical Report CTB Redevelopment Program
Using trip forecasts for on-road construction vehicles (concrete trucks, material delivery and haul trucks), worker’s personal commuting vehicles, and shuttle bus operations, on-road construction emissions were calculated. MOVES emission factor model-predicted emissions factors were applied to the cumulative annual vehicle miles traveled by the on-road vehicles to determine annual vehicular emissions for each construction year (see Table B.4-4B in Attachment 5).
Under General Conformity requirements, total annual emissions resulting from the proposed project must be compared to the applicable de minimis levels. The sum of emissions from construction equipment and on-road vehicles for each year of construction are presented in Table B.4-5B in Attachment 5. The results indicate that 2017 would be the worst-case construction year for the proposed design changes, resulting in the maximum annual construction emissions. Those maximum emissions are significantly below the de minimis levels for each pollutant; therefore, the proposed design changes have minimal air quality impact and are determined to conform to the State Implementation Plan (SIP).
As described in Attachment 8, a hot spot dispersion impact analysis of the peak year construction condition was performed for carbon monoxide (CO) at the same five off-Airport intersections that were analyzed in the 2014 FONSI/ROD. USEPA’s MOVES program was used to predict vehicle CO emission factors using NYSDOT-provided model inputs and a free flow travel speed of five miles per hour (mph) was conservatively assumed. Geometric models of the roadway network within a 1,000-foot radius of each of the selected five intersections were developed (same models used in the 2014 FONSI/ROD). Dispersion modeling was performed using USEPA’s CAL3QHC computer model, with various modeling parameters recommended in the CEQR Technical Manual for Queens County and traffic parameters for each intersection, such as signal timing data and turning volumes, from Attachment 4. Receptors were placed along sidewalks around each intersection, representing the worst-case locations given their close proximity to the center of each congested intersection where vehicles would idle.
The predicted worst-case CO concentration levels (1-hour and 8-hour) at the selected five worst-case intersections are summarized in Attachment 8. Although CO concentration levels under the proposed design changes would be higher than the concentrations predicted for the Future Proposed Action condition in the 2014 FONSI/ROD, the levels are still well below the CO NAAQS of 35 ppm for a 1-hour average and 9 ppm for an 8-hour average. Concentrations are higher due to the compressed construction schedule and nighttime work that occurs during the peak construction period associated with the proposed design changes. Additionally, the baseline year changed from 2012 to 2014 and therefore baseline CO levels are higher than in the 2014 EA. Concentrations range between 4.3 and 5.4 ppm for a 1-hour CO average and between 2.6 and 3.2 ppm for a 8-hour CO average. Therefore, the mobile source CO impacts during construction would not be significant.
5.2.2.1 General Conformity Review
According to the General Conformity Rule, if the total direct and indirect emissions from the CTB Redevelopment Program do not exceed established screening criteria emission rates known as de minimis thresholds, a General Conformity Determination43 is not required. “Direct emissions” occur at the same time and place as the project, such as construction site emissions. “Indirect emissions” are reasonably foreseeable emissions that may occur later in time and/or are farther removed from the project, such as emissions from aircraft operations and vehicular traffic. Per federal guidelines, other
43 A Conformity Determination is the formal process and documentation required when the emissions from the proposed project or action in a non-attainment or maintenance area are at or above de minimis levels and are not otherwise exempt or presumed to conform.
December 2015 Chapter 5 – Environmental Consequences 5-26
LaGuardia Airport Technical Report CTB Redevelopment Program
emissions at the airport that are not associated with the project are part of the background emissions and are not included in the analysis.
Using forecast airport activity information and appropriate emission factors, emissions inventories were prepared for the previously approved (2014) design and No-Action Alternative (see Appendix B of the 2014 EA). An “emissions inventory” is a database that lists, by source, the amount of air pollutants discharged into the atmosphere of a community during a specified period of time (e.g., tons per year). In evaluating “project-related emissions,” the net emissions are determined by subtracting future emissions without the project (the No-Action Alternative) from the future emissions with the project (the previously approved (2014) design). If project-related emissions are estimated to exceed the EPA’s de minimis threshold levels, then a Conformity Determination must be prepared.
5.2.2.1.1 Emission Reduction Strategies
In accordance with PANYNJ’s Sustainable Infrastructure Guidelines, the CTB Redevelopment Program would incorporate a series of measures to reduce project-related emissions during and after construction. This is a normal part of the design process; therefore, these emissions reductions are included in the net emissions for the total direct and indirect emissions for the CTB Redevelopment Program. For example, during construction, contractors would be required to use ultra-low sulfur diesel (ULSD) fuel; all off-road equipment would be required to be retrofitted with emission control devices using Best Available Technology (BAT); and use of diesel-powered generators would be limited to situations where commercial electric power may not readily be available.
After construction, the CTB Redevelopment Program also includes component projects designed to reduce emissions from aircraft and ground support equipment (GSE). For example, a 400Hz power unit would be installed at each gate to deliver standby power for aircraft operating systems and pre-conditioned air (PCAir) devices would be installed to provide heated/cooled air as needed to maintain a comfortable cabin temperature between flights. Using 400Hz power and PCAir devices reduces the amount of time aircraft are otherwise required to operate their auxiliary power units (APUs), which burn aircraft fuel and generate exhaust emissions while the aircraft is parked at the gate. In addition, all tenant airlines using the new terminal would be required to use electric bag tractors, belt loaders, and pushback tractors that run on batteries, which require periodic recharging. Unlike conventional GSE which burn gasoline and diesel fuel, it is anticipated that the electric GSE would generate no on-site emissions as they are electrically-powered vehicles.
5.2.2.1.2 Construction Phase (Direct Emissions)
Construction-related air emissions would be generated by on-road vehicles and non-road equipment. On-road sources of emissions include private automobiles used by construction workers commuting to and from work each day, shuttle buses used to transfer workers between the parking lot and the project site, and contractor vehicles certified to operate on local roadways, such as tractor trailers, cement mixers, etc. Non-road sources consist of contractor vehicles and equipment used on-site and would include a wide variety of engine types ranging from portable generators to heavy-duty pieces of equipment such as cranes, excavators, asphalt pavers, etc.
Engineering estimates of vehicle traffic and equipment operations were prepared for each component of the construction process in the previously approved design (2014)(see Appendix A: Transportation and Appendix F: Supporting Data of the 2014 EA). Assuming an eight-year construction schedule beginning in 2014 and ending in 2021, EPA-approved simulation software and modeling techniques were used to prepare emissions inventories for each calendar year (see Appendix B of the 2014 EA). The
December 2015 Chapter 5 – Environmental Consequences 5-27
LaGuardia Airport Technical Report CTB Redevelopment Program
results of the air quality analysis are presented in Table 5-1: Annual Emissions Inventory—Construction Phase. As shown, the peak emissions year for all criteria pollutants is Year 2, or 2015, which is consistent with the activities proposed in the construction schedule. As shown in Table 5-1, the construction emissions are less than half of the applicable de minimis threshold levels; therefore, federal guidelines indicate that no significant air quality impact would occur during the construction period. As discussed in Section 5.20.3, the cumulative air emissions for the previously approved design (2014) and other Airport projects anticipated to be underway at the same time, would also be under the de minimis threshold levels.
Change: Engineering estimates of vehicle traffic and equipment operations were updated for each component of the construction process based on the revised construction phasing and schedule (see Attachment 4 and Attachment 5). Assuming a five and three-quarter-year construction schedule beginning in 2016 and ending in 2021, the NONROAD model and MOVES simulation software were used to prepare emissions inventories for each calendar year (see Attachment 5). The results of the air quality analysis are presented in Table 5-1b. As shown, the peak emissions year for all criteria pollutants is Year 2, or 2017, which is consistent with the activities proposed in the construction schedule. As shown in Table 5-1b, the construction emissions are less than half of the applicable de minimis threshold levels; therefore, federal guidelines indicate that no significant air quality impact would occur during the construction period. Other major Airport projects assumed to be underway at the same time as the CTB Redevelopment Program in the 2014 FONSI/ROD would be completed by the peak year of construction and would not result in cumulative air emissions.
5.2.2.1.3 Operations Phase (Indirect Emissions)
After construction, day-to-day airport and airline operations would continue to generate emissions of criteria pollutants. “Mobile source” air pollution is emitted from aircraft, vehicles, and equipment that can be moved from one location to another. Mobile source emissions from airside operations include aircraft engines, aircraft APUs and GSE. On the landside, mobile source emissions are generated by ground access vehicles on the roadways and in parking lots, including personal automobiles and commercial vehicles such as taxis, limousines, shuttle buses, delivery trucks, etc. A “stationary source” of air pollution refers to an emissions source that does not move, also known as a point source. The Airport’s central heating and refrigeration plant (CHRP) is a stationary source of emissions that result from heating and cooling the central terminal building.
Emissions inventories for the future year 2030 were prepared for mobile and stationary sources with and without the project (see Appendix B of the 2014 EA). The assessment demonstrates that the emissions resulting from the CTB Redevelopment Program would be only marginally different, and in most instances less, than the emissions from the No-Action Alternative. This is a reasonable conclusion because, under the CTB Redevelopment Program, the existing terminal building, airside apron, landside roadways, and parking facilities would be removed and replaced with new facilities that are designed to accommodate forecast passenger activity and vehicular traffic volumes at higher levels of efficiency than would otherwise be achieved if no action is taken. For example:
• The CTB Redevelopment Program would be designed to accommodate larger aircraft while, atthe same time, reducing aircraft congestion and gate-wait delays in and around the aircraftparking apron. Although aircraft emissions would potentially increase due to the use of largeraircraft, in this case, the emissions increase would be offset or minimized by a correspondingdecrease in emissions due to the reduction in aircraft taxi time-in-mode.
December 2015 Chapter 5 – Environmental Consequences 5-28
LaGuardia Airport Technical Report CTB Redevelopment Program
Change: The aircraft parking apron design was changed by the proposed design changes. A Total Airport and Airspace Modeler (TAAM) simulation of the 2012 baseline airfield conditions show an average annual taxi time-in-mode of 26.1 minutes per operation. The Proposed Action conditions in the 2014 FONSI/ROD generated a reduction in taxi time of 4.9 minutes for an average taxi time of 21.2 minutes per operation. The revised apron layout using the same design day schedule that was developed for the approved project demonstrated that the average taxi time-in-mode would be 21.1 minutes per operation, a decrease of 0.1 minutes compared to the approved design (see Attachment 2). It is assumed that this would further reduce aircraft emissions.
• The CTB Redevelopment Program would also be designed to accommodate additional trafficvolumes while, at the same time, reducing traffic congestion and delay on the terminal arearoadways. As a result, up to 1.1 million additional round trips would be accommodated annuallywith no appreciable increase in tailpipe emissions.
Change: Under the proposed design changes, the changes to the roadway configuration are sominor that there would be no impact to LOS for arriving or departing vehicles and tailpipeemissions would not increase.
PANYNJ has evaluated the airside and landside operations with and without the project and identified the benefits of the CTB Redevelopment Program. These benefits include reduced aircraft congestion and delay on the terminal airside apron, reduced traffic congestion and delay on the terminal area roadways, and reduced use of aircraft APUs and conventional GSE; which, for the purpose of this discussion, translate into reduced fuel consumption and, by extension, fewer air emissions.
Since there would be only minor changes to operational conditions at the Airport as a result of the proposed design changes, no additional analysis of future air emissions was performed. The minor changes include overall aircraft taxi time decrease of 0.1 minute, discussed in Attachment 2-September 2015 LGA CTB Total Aircraft and Airfield (TAAM) Analysis. The operational air emissions analyses in the 2014 FONSI/ROD are still valid.
Table 5-2 shows that the difference between CTB Redevelopment Program and No-Action (net) emissions would be below the applicable de minimis thresholds (see Appendix B of the 2014 EA). In fact, the CTB Redevelopment Program would result in a net decrease in emissions of volatile organic compounds (VOCs), carbon monoxide (CO), fine particulate matter (PM10 and PM2.5) and sulfur dioxide (SO2), while limiting the net increase of nitrogen oxides (NOX) emissions (25.17 tons per year) to a level that is well below the NAAQS threshold (100 tons per year). Because the CTB Redevelopment Program (both construction and operations) would not result in emissions above the applicable de minimis thresholds, no further analysis is required under the General Conformity Rule. Appendix B of the 2014 EA provides more detail on the approach, methodology, input data, and results for the emissions inventory analysis.
5.2.2.2 Traffic Intersection “Hot Spot” Analysis
A dispersion analysis was conducted to determine whether carbon monoxide and particulate matter emissions due to future traffic volumes would result in unacceptably high concentration levels in public areas. The project-level “hot-spot” analysis found that the previously approved design (2014) would not create a new violation of any NAAQS, delay the attainment of any NAAQS, nor increase the frequency or severity of any existing violations of the NAAQS. Similarly, analysis shows no exceedances of the CEQR
December 2015 Chapter 5 – Environmental Consequences 5-29
LaGuardia Airport Technical Report CTB Redevelopment Program
Technical Manual criteria would occur in the vicinity of congested intersections. Appendix B of the 2014 EA provides more detail on the methodology, input data, and results, for the hot spot analysis.
Change: Attachment 8, Memorandum – LGA CTB CO Hot Spot Analysis, presents results from the carbon monoxide hot spot analysis associated with off-site mobile source activities during the worst-case year for construction under the revised construction phasing and schedule. All predicted levels are well below the NAAQS; therefore, the mobile source CO impacts from the proposed design changes would not be significant. Note that, as described in Appendix B of the 2014 EA, a screening of the intersections indicated that no additional analysis for PM2.5 would be required.
5.2.2.3 Greenhouse Gas Emissions
Currently, there are no federal standards for reporting greenhouse gas (GHG) emissions from aviation sources, as well as no significance thresholds. As directed by the Draft NEPA Guidance on Consideration of the Effects of Climate Change and Greenhouse Gas (CEQ, February 2010), the focus of this GHG analysis was to only disclose emissions from the CTB Redevelopment Program.
Most of the EPA tools that are widely used for NEPA study purposes (e.g., NONROAD emission factor model) do not provide emission factors for equivalent emissions of carbon dioxide (CO2e). The recent EPA inventory report demonstrates that the GHG contribution from methane and nitrous oxide is less than one percent of the total CO2e for fossil fuel combustion sources.44 Given such small contributions from other GHG equivalents compared to carbon dioxide, for the purposes of the 2014 EA, CO2e levels were predicted in terms of carbon dioxide levels only.
A quantitative analysis of carbon dioxide emissions was conducted for operations under the No Action and Proposed Action Alternatives, focusing on the contributions from aircraft, on-road vehicles, and the CHRP. The greenhouse gas assessment presented in Table 5-3 demonstrates that implementation of the CTB Redevelopment Program would not cause an increase in GHG emissions when compared to the No-Action Alternative. In fact, cumulative GHG emissions are predicted to decrease over three percent. Pursuant to FAA Order 1050.1E, Guidance Memo #345 and CEQR Technical Manual criteria, no further analysis of GHGs is necessary.
Since there would be only minor changes to operational conditions at the Airport as a result of the proposed design changes, no additional analysis of future carbon dioxide emissions was performed. The minor changes include overall aircraft taxi time decrease of 0.1 minute, discussed in Attachment 2-Stepmber 2015 LGA CTB Total Aircraft and Airfield (TAAM) Analysis. The greenhouse gas emissions described in the 2014 FONSI/ROD are still valid.
FAA Order 1050.1F (July 2015) established Climate as a new Environmental Impact Category. While no significance thresholds have been determined for Climate, the Order requires an evaluation of climate impacts from Proposed Actions. LGA has a long history of proactively initiating projects that reduce GHG emissions from aircraft, buildings, and vehicles, including, comprehensive energy efficiency retrofit programs in its buildings, use of biodiesel in Port Authority vehicles, among many other actions. This
44 EPA, Inventory of U.S. Greenhouse Gas Emissions and Sinks: 1990-2007, April 15, 2009. 45 FAA Order 1050.1E, Change 1, Guidance Memo #3. To: FAA Lines of Business and Managers with NEPA
Responsibilities. From: Julie Marks, Manager, Environmental Policy and Operations, AEE-400. Subject: Considering Greenhouse Gases and Climate Under the National Environmental Policy Act (NEPA): Interim Guidance (January 12, 2012).
December 2015 Chapter 5 – Environmental Consequences 5-30
LaGuardia Airport Technical Report CTB Redevelopment Program
project will minimize its individual impact on climate through efficient building design, aircraft apron and taxiway design, and commitment to meeting LEED Silver or higher standards for construction. In addition, the Port Authority's Sustainable Building Guidelines require projects to achieve energy cost decreases of 30% over ASHRAE 90.1-1999. Finally, the use of electric baggage tugs, belt loaders, and push back tugs along with the deployment of 400hz gate power and pre-conditioned air at every gate will reduce greenhouse gas emissions from aircraft support activities.
Air Quality Analysis completed in this section was also analyzed for Carbon Dioxide (CO2) emissions impacts, which are expressed in terms of CO2 and CO2e in Attachment 5 and Tables 5-1 through 5-3 of this technical report. Overall greenhouse gas impacts are expressed in terms of CO2 equivalence, or CO2e, which adds the greenhouse gas effects of methane, nitrous oxide, and other pollutants that contribute to global warming, expressed in CO2 equivalence relative to their global warming potential.
5.2.2.4 Summary of Impacts
Implementation of the CTB Redevelopment Program would result in no emissions increase or an emissions increase that is clearly de minimis. The air quality assessment (Appendix B of the 2014 EA) demonstrates that the CTB Redevelopment Program conforms to the New York SIP and the Clean Air Act because the CTB Redevelopment Program would not exceed the de minimis thresholds established by the EPA for the criteria pollutants. In addition, the hot spot analysis found that the CTB Redevelopment Program would not contribute to new violations of the NAAQS, increase the frequency or severity of existing violations of the NAAQS, or delay attainment of the NAAQS. Consequently, no adverse impact on local or regional air quality is expected to occur as a result of the CTB Redevelopment Program. No further analysis or reporting is required under the Clean Air Act or NEPA.
December 2015 Chapter 5 – Environmental Consequences 5-31
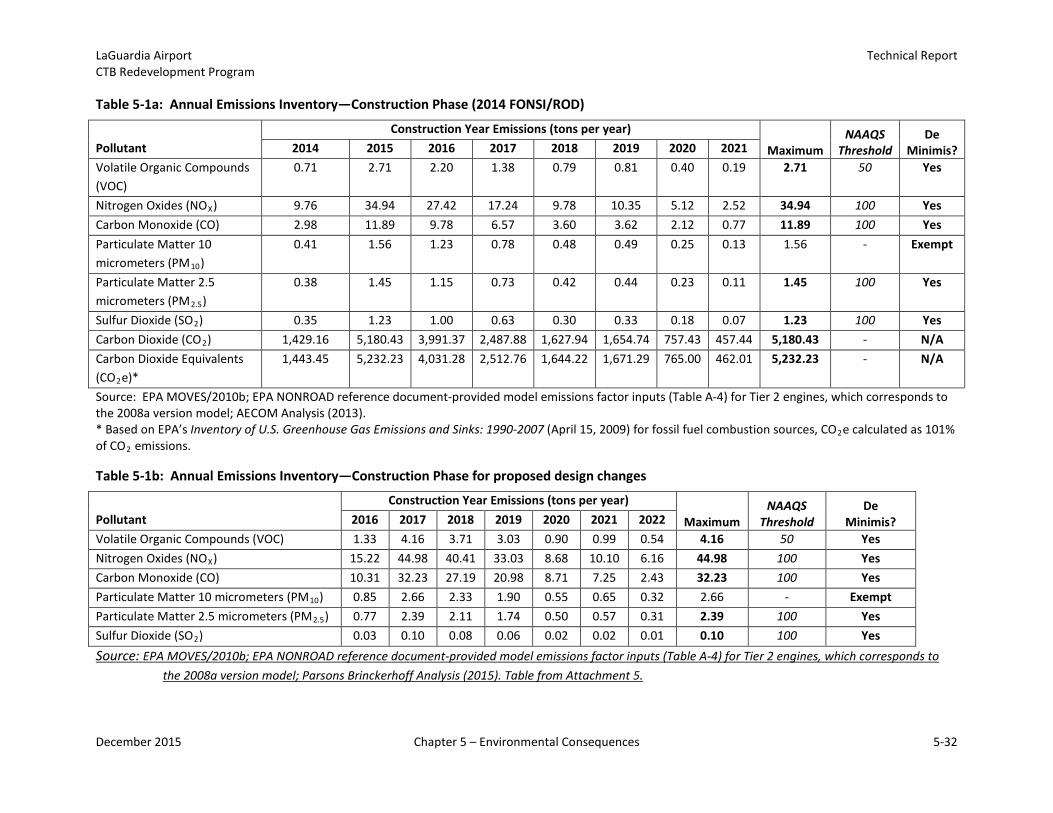
LaGuardia Airport Technical Report CTB Redevelopment Program
Table 5-1a: Annual Emissions Inventory—Construction Phase (2014 FONSI/ROD)
Pollutant Construction Year Emissions (tons per year)
Maximum NAAQS
Threshold De
Minimis? 2014 2015 2016 2017 2018 2019 2020 2021 Volatile Organic Compounds (VOC)
0.71 2.71 2.20 1.38 0.79 0.81 0.40 0.19 2.71 50 Yes
Nitrogen Oxides (NOX) 9.76 34.94 27.42 17.24 9.78 10.35 5.12 2.52 34.94 100 Yes Carbon Monoxide (CO) 2.98 11.89 9.78 6.57 3.60 3.62 2.12 0.77 11.89 100 Yes Particulate Matter 10 micrometers (PM10)
0.41 1.56 1.23 0.78 0.48 0.49 0.25 0.13 1.56 - Exempt
Particulate Matter 2.5 micrometers (PM2.5)
0.38 1.45 1.15 0.73 0.42 0.44 0.23 0.11 1.45 100 Yes
Sulfur Dioxide (SO2) 0.35 1.23 1.00 0.63 0.30 0.33 0.18 0.07 1.23 100 Yes Carbon Dioxide (CO2) 1,429.16 5,180.43 3,991.37 2,487.88 1,627.94 1,654.74 757.43 457.44 5,180.43 - N/A Carbon Dioxide Equivalents (CO2e)*
1,443.45 5,232.23 4,031.28 2,512.76 1,644.22 1,671.29 765.00 462.01 5,232.23 - N/A
Source: EPA MOVES/2010b; EPA NONROAD reference document-provided model emissions factor inputs (Table A-4) for Tier 2 engines, which corresponds to the 2008a version model; AECOM Analysis (2013). * Based on EPA’s Inventory of U.S. Greenhouse Gas Emissions and Sinks: 1990-2007 (April 15, 2009) for fossil fuel combustion sources, CO2e calculated as 101% of CO2 emissions.
Table 5-1b: Annual Emissions Inventory—Construction Phase for proposed design changes
Pollutant Construction Year Emissions (tons per year)
Maximum NAAQS
Threshold De
Minimis? 2016 2017 2018 2019 2020 2021 2022 Volatile Organic Compounds (VOC) 1.33 4.16 3.71 3.03 0.90 0.99 0.54 4.16 50 Yes Nitrogen Oxides (NOX) 15.22 44.98 40.41 33.03 8.68 10.10 6.16 44.98 100 Yes Carbon Monoxide (CO) 10.31 32.23 27.19 20.98 8.71 7.25 2.43 32.23 100 Yes Particulate Matter 10 micrometers (PM10) 0.85 2.66 2.33 1.90 0.55 0.65 0.32 2.66 - Exempt Particulate Matter 2.5 micrometers (PM2.5) 0.77 2.39 2.11 1.74 0.50 0.57 0.31 2.39 100 Yes Sulfur Dioxide (SO2) 0.03 0.10 0.08 0.06 0.02 0.02 0.01 0.10 100 Yes Source: EPA MOVES/2010b; EPA NONROAD reference document-provided model emissions factor inputs (Table A-4) for Tier 2 engines, which corresponds to
the 2008a version model; Parsons Brinckerhoff Analysis (2015). Table from Attachment 5.
December 2015 Chapter 5 – Environmental Consequences 5-32
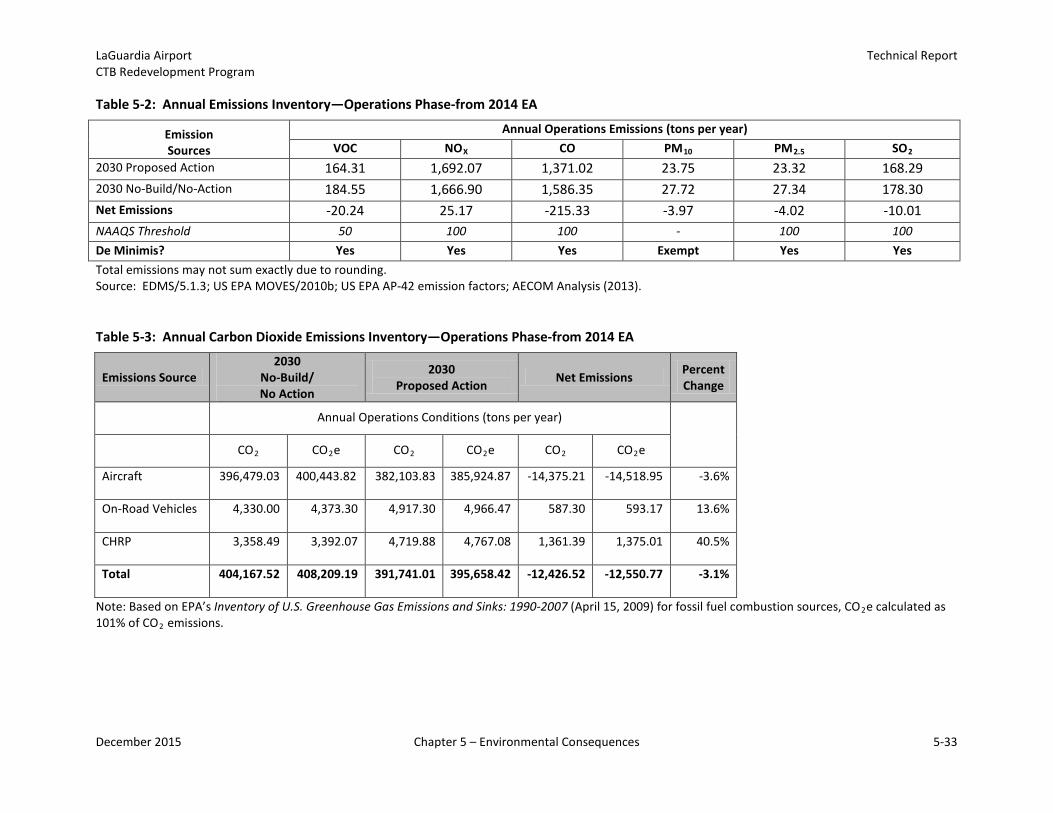
LaGuardia Airport Technical Report CTB Redevelopment Program
Table 5-2: Annual Emissions Inventory—Operations Phase-from 2014 EA
Emission Sources
Annual Operations Emissions (tons per year) VOC NOX CO PM10 PM2.5 SO2
2030 Proposed Action 164.31 1,692.07 1,371.02 23.75 23.32 168.29 2030 No-Build/No-Action 184.55 1,666.90 1,586.35 27.72 27.34 178.30 Net Emissions -20.24 25.17 -215.33 -3.97 -4.02 -10.01 NAAQS Threshold 50 100 100 - 100 100 De Minimis? Yes Yes Yes Exempt Yes Yes Total emissions may not sum exactly due to rounding. Source: EDMS/5.1.3; US EPA MOVES/2010b; US EPA AP-42 emission factors; AECOM Analysis (2013).
Table 5-3: Annual Carbon Dioxide Emissions Inventory—Operations Phase-from 2014 EA
Emissions Source 2030
No-Build/ No Action
2030 Proposed Action Net Emissions Percent
Change
Annual Operations Conditions (tons per year)
CO2 CO2e CO2 CO2e CO2 CO2e
Aircraft 396,479.03 400,443.82 382,103.83 385,924.87 -14,375.21 -14,518.95 -3.6%
On-Road Vehicles 4,330.00 4,373.30 4,917.30 4,966.47 587.30 593.17 13.6%
CHRP 3,358.49 3,392.07 4,719.88 4,767.08 1,361.39 1,375.01 40.5%
Total 404,167.52 408,209.19 391,741.01 395,658.42 -12,426.52 -12,550.77 -3.1%
Note: Based on EPA’s Inventory of U.S. Greenhouse Gas Emissions and Sinks: 1990-2007 (April 15, 2009) for fossil fuel combustion sources, CO2e calculated as 101% of CO2 emissions.
December 2015 Chapter 5 – Environmental Consequences 5-33
LaGuardia Airport Technical Report CTB Redevelopment Program
5.2.3 Floodplains
Floodplains are defined in Executive Order 11988, Floodplain Management, as “the lowland and relatively flat areas adjoining inland and coastal waters including flood prone areas of offshore islands, including at a minimum, that area subject to a one percent or greater chance of flooding on any given year” as depicted on approved flood maps prepared by the Federal Emergency Management Agency (FEMA). The term commonly used for this low lying area subject to a one percent chance of flooding is the “100-year floodplain.” Pursuant to Executive Order 11988, all Federal agencies are required to avoid impacts on floodplains to the degree practicable and to minimize impacts that cannot be avoided. When it is not practicable to avoid developing within a floodplain, the USDOT Order 5650.2, Floodplain Management and Protection, prescribes policies and procedures to implement Executive Order 1198846.
Both the CTB Redevelopment Program and the No-Action alternatives would result in major construction activities within a FEMA-designated floodplain. NEPA regulations that address floodplains are discussed in FAA Order 5050.4B, NEPA Implementing Instructions for Airport Actions, and FAA Order 1050.1E, Change 1, Appendix A.9.
No Practicable Alternative
According to the recently released Preliminary Flood Insurance Rate Maps (FIRMs) for LaGuardia Airport and the surrounding area, 85 percent of the Airport property, and 88 percent of the project site, are located within the limits of the coastal (tidal) floodplain (see Figure 5-6).47 PANYNJ examined alternatives that would locate the CTB Redevelopment Program outside the floodplain and determined that no practicable alternative exists. As discussed in Section 3.3, Alternatives Eliminated from Further Consideration, there is no vacant space or other suitable property located within or adjacent to the Airport to accommodate the CTB Redevelopment Program, and there is no practicable alternative that would locate the project elsewhere. The CTB Redevelopment Program and No-Action alternatives are the only viable options, and both alternatives affect the same flood-prone area of the Airport. For the proposed design changes, 88 percent of the project site is still located within the limits of the coastal (tidal) floodplain (see Figure 5-6b), consequently, the proposed design changes would similarly affect the same flood-prone area of the Airport.
46 EO 11988 was originally issued on May 24, 1977, and established a national policy requiring federal agencies to avoid, to the extent possible, the long and short term adverse impacts associated with the occupancy and modification of floodplains. On January 30, 2015, the President issued EO 13690 that amends EO 11988, and established the Federal Flood Risk Management Standard (“FFRMS”) and a process for public input prior to implementation of the FFRMS. EO 13690 at §1. However, in Guidelines issued on October 8, 2015, federal agencies were directed not to apply the new requirements until after the agencies adopt new or revised regulations governing the proper implementation of EO 13690 and the FFRMS. EO 13690 at §3; Guidelines for Implementing Executive Order 11988, Floodplain Management, and Executive Order 13690, Establishing a Federal Risk Management Standard and a Process for Further Soliciting and Considering Stakeholder Input, October 8, 2015 (“Guidelines”). The Guidelines state that agencies will continue to comply with the requirements of the 1977 version of E.O. 11988 until they update their regulations and procedures to incorporate the amendments from E.O. 13690. These regulations and procedures will describe an agency’s schedule for applying any new requirements as well as how it will apply the new requirements. Id. at 5, 18. The new requirements of EO 11988 will not be applied retroactively. Id. at 18. 47 Preliminary FIRMs dated December 5, 2013.
December 2015 Chapter 5 – Environmental Consequences 5-34
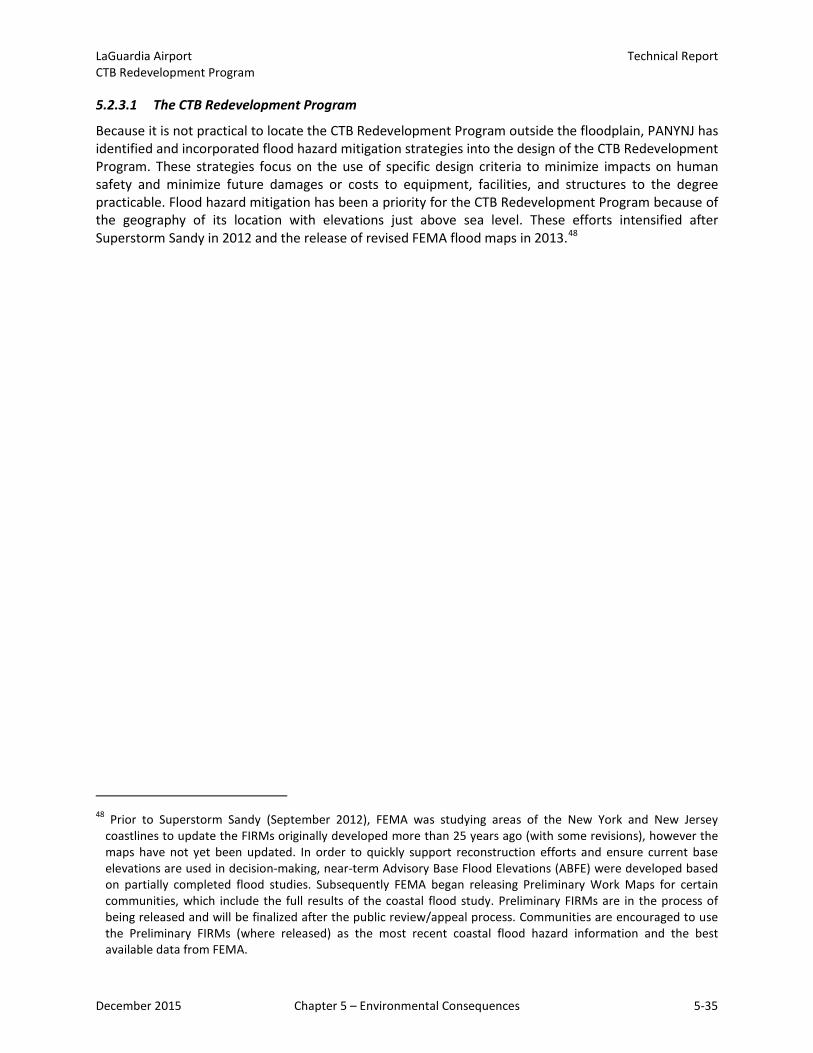
LaGuardia Airport Technical Report CTB Redevelopment Program
5.2.3.1 The CTB Redevelopment Program
Because it is not practical to locate the CTB Redevelopment Program outside the floodplain, PANYNJ has identified and incorporated flood hazard mitigation strategies into the design of the CTB Redevelopment Program. These strategies focus on the use of specific design criteria to minimize impacts on human safety and minimize future damages or costs to equipment, facilities, and structures to the degree practicable. Flood hazard mitigation has been a priority for the CTB Redevelopment Program because of the geography of its location with elevations just above sea level. These efforts intensified after Superstorm Sandy in 2012 and the release of revised FEMA flood maps in 2013.48
48 Prior to Superstorm Sandy (September 2012), FEMA was studying areas of the New York and New Jersey coastlines to update the FIRMs originally developed more than 25 years ago (with some revisions), however the maps have not yet been updated. In order to quickly support reconstruction efforts and ensure current base elevations are used in decision-making, near-term Advisory Base Flood Elevations (ABFE) were developed based on partially completed flood studies. Subsequently FEMA began releasing Preliminary Work Maps for certain communities, which include the full results of the coastal flood study. Preliminary FIRMs are in the process of being released and will be finalized after the public review/appeal process. Communities are encouraged to use the Preliminary FIRMs (where released) as the most recent coastal flood hazard information and the best available data from FEMA.
December 2015 Chapter 5 – Environmental Consequences 5-35
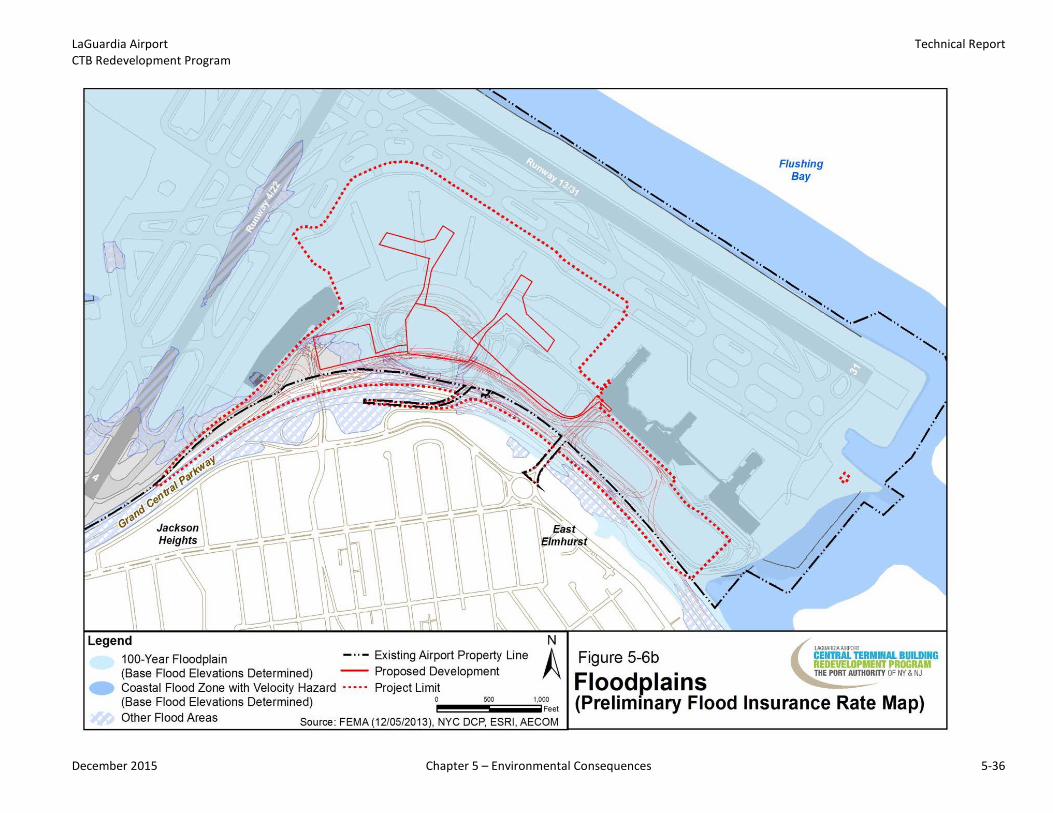
LaGuardia Airport Technical Report CTB Redevelopment Program
Figure 5-6b. Floodplains (Proposed design changes)
December 2015 Chapter 5 – Environmental Consequences 5-36
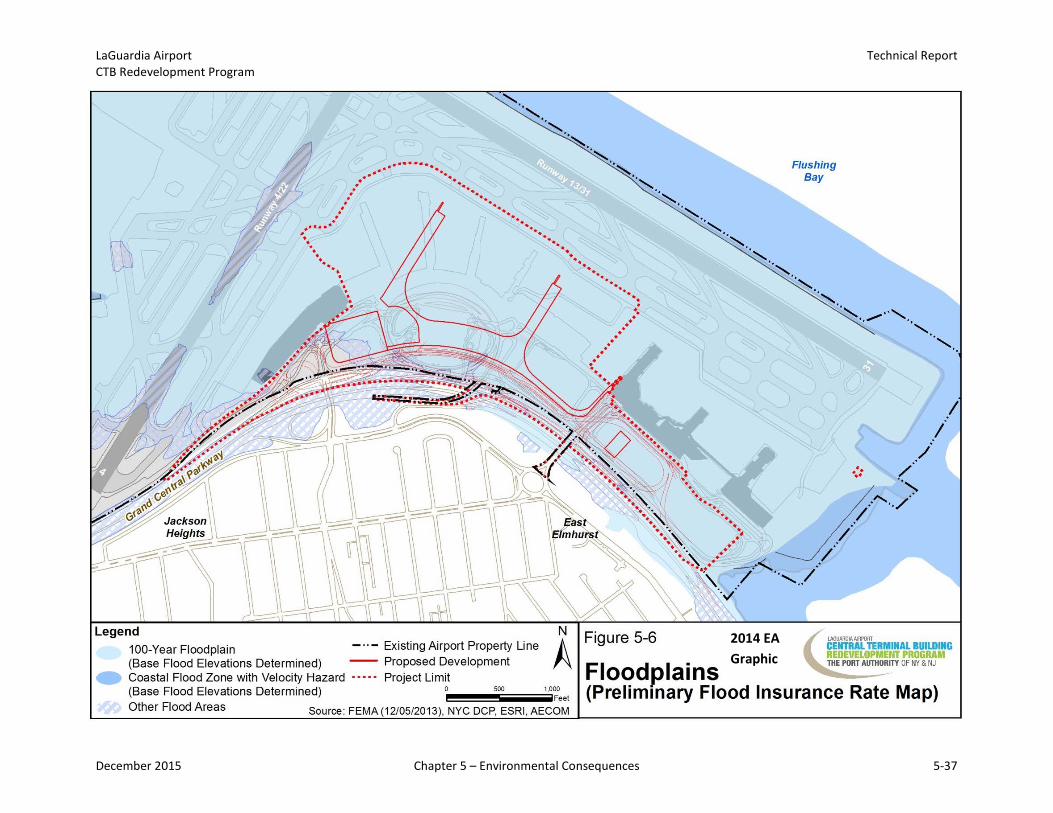
LaGuardia Airport Technical Report CTB Redevelopment Program
Figure 5-6a. Floodplains (2014 FONSI/ROD)
2014 EA Graphic
December 2015 Chapter 5 – Environmental Consequences 5-37
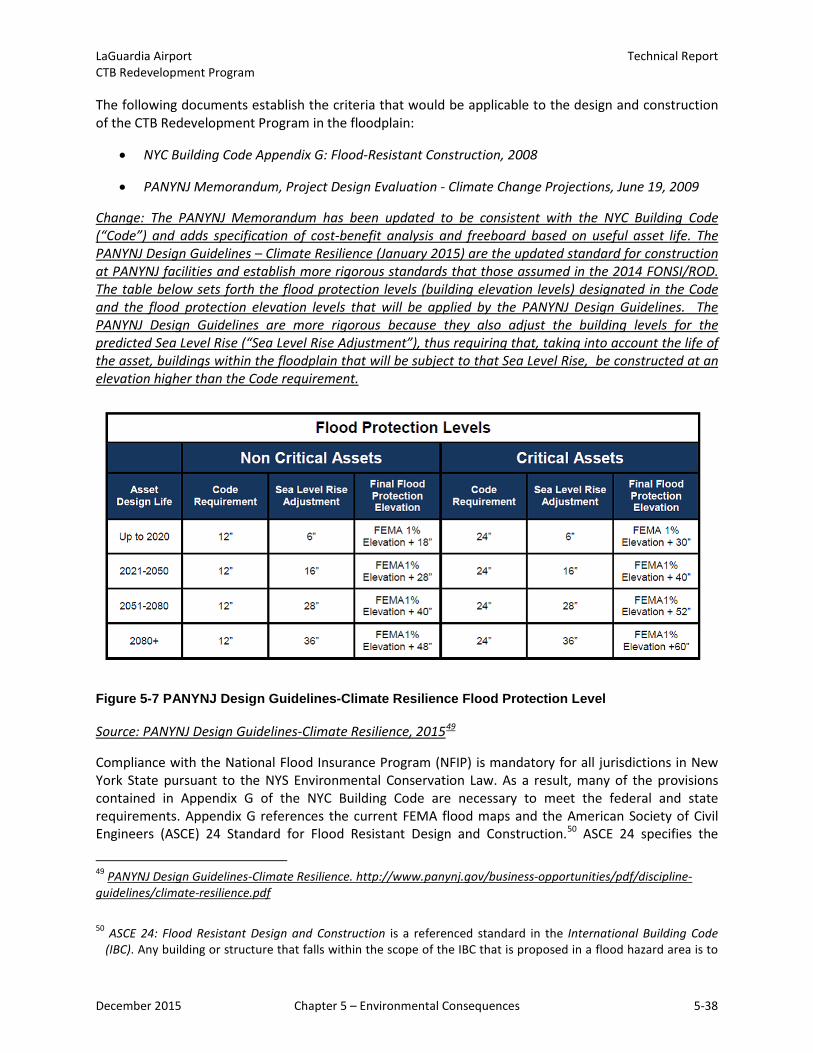
LaGuardia Airport Technical Report CTB Redevelopment Program
The following documents establish the criteria that would be applicable to the design and construction of the CTB Redevelopment Program in the floodplain:
• NYC Building Code Appendix G: Flood-Resistant Construction, 2008
• PANYNJ Memorandum, Project Design Evaluation - Climate Change Projections, June 19, 2009
Change: The PANYNJ Memorandum has been updated to be consistent with the NYC Building Code (“Code”) and adds specification of cost-benefit analysis and freeboard based on useful asset life. The PANYNJ Design Guidelines – Climate Resilience (January 2015) are the updated standard for construction at PANYNJ facilities and establish more rigorous standards that those assumed in the 2014 FONSI/ROD. The table below sets forth the flood protection levels (building elevation levels) designated in the Code and the flood protection elevation levels that will be applied by the PANYNJ Design Guidelines. The PANYNJ Design Guidelines are more rigorous because they also adjust the building levels for the predicted Sea Level Rise (“Sea Level Rise Adjustment”), thus requiring that, taking into account the life of the asset, buildings within the floodplain that will be subject to that Sea Level Rise, be constructed at an elevation higher than the Code requirement.
Figure 5-7 PANYNJ Design Guidelines-Climate Resilience Flood Protection Level
Source: PANYNJ Design Guidelines-Climate Resilience, 201549
Compliance with the National Flood Insurance Program (NFIP) is mandatory for all jurisdictions in New York State pursuant to the NYS Environmental Conservation Law. As a result, many of the provisions contained in Appendix G of the NYC Building Code are necessary to meet the federal and state requirements. Appendix G references the current FEMA flood maps and the American Society of Civil Engineers (ASCE) 24 Standard for Flood Resistant Design and Construction.50 ASCE 24 specifies the
49 PANYNJ Design Guidelines-Climate Resilience. http://www.panynj.gov/business-opportunities/pdf/discipline-guidelines/climate-resilience.pdf
50 ASCE 24: Flood Resistant Design and Construction is a referenced standard in the International Building Code (IBC). Any building or structure that falls within the scope of the IBC that is proposed in a flood hazard area is to
December 2015 Chapter 5 – Environmental Consequences 5-38
LaGuardia Airport Technical Report CTB Redevelopment Program
minimum requirements and expected performance for the design and construction of buildings and structures in FEMA-designated flood hazard areas. For example, ASCE 24 provides for “dry flood-proofing” critical areas, i.e., those for which a disruption of service would result in significant impacts to facility operations. A dry flood-proofed structure is made watertight below the level that needs flood protection to prevent floodwaters from entering. ASCE 24 also adds a 1-foot “freeboard” to the design flood elevation. Freeboarding is elevating a building’s lowest floor above predicted flood elevations to compensate for unknown variables that could contribute to flood levels greater than predicted, such as high velocity wave action from coastal storm events.
In addition, climate change projections provided to the City of New York by the Columbia Center for Climate Change Systems Research predict that by the 2080’s the mean sea level (MSL) elevation is anticipated to increase 18 inches over the current mean high water (MHW) conditions. As an added measure of protection against future coastal flooding, PANYNJ issued a Climate Change Projections Memo in 2009 establishing a policy that all new construction (and major rehabilitation projects) be evaluated based on the predicted MSL elevation. Accordingly, PANYNJ stipulates a design elevation that is 18 inches over and above the current 1-foot freeboard elevation required by ASCE 24 (i.e., current FEMA 100-year flood level plus 2.5 feet) for all project elements. Where prohibiting factors preclude the application of these design criteria to all project elements, focus should be centered on critical project elements.
Using the design criteria as described above, a comprehensive flood hazard mitigation plan with freeboard elevations and flood-proofing measures would be implemented to the degree practicable, with special emphasis on critical equipment associated with the terminal building, the Central Heating and Refrigeration Plant (CHRP), the West Garage, and the East Field Lighting Vault.51 The same measures have already been applied to other projects at LaGuardia Airport, including the East End Substation (EES) and the East Garage. As discussed in Section 5.3, Coastal Resources, the New York State Department of State (NYSDOS) has concurred with PANYNJ’s coastal zone consistency determination, which considers potential impacts to the coastal floodplain.
Probable impacts on the floodplain would be limited to the redevelopment of existing facilities and built land; no secondary or induced development has been identified that would cause or contribute to indirect or cumulative effects on the floodplain. Approximately 88 percent of the project site would be located within the 100-year tidal floodplain as delineated in the Preliminary FIRMs released by FEMA in December 2013. Only the extreme eastern portion of the project limits encroaches upon the coastal high hazard area (see Figure 5-6) where taxis and passenger vehicles would normally be parked within Parking Lot #5 (and would not normally be parked in the event of a 100-year storm). Some of the proposed roadway reconfiguration and a portion of the West Garage would be located along the southern fringe or outside of the 100-year floodplain.
be designed in accordance with ASCE 24. Buildings designed according to ASCE 24 are better able to resist flood loads and flood damage.
51 Functional constraints of the existing landside and airside facilities limited the feasibility of constructing the new terminal at levels above the required elevation established by design criteria. Existing elevations of the runways and taxiways are established and code requirements prohibit sloping towards the terminal above a maximum grade. Similarly, the roadways on the Grand Central Parkway and in front of Terminals C and D are at a fixed elevation and the proposed connecting roadways must meet design criteria for slopes, curves and vertical clearance.
December 2015 Chapter 5 – Environmental Consequences 5-39
LaGuardia Airport Technical Report CTB Redevelopment Program
Land use cover types associated with the CTB Redevelopment Program were compared to the Existing/No-Build condition. Under the CTB Redevelopment Program, impervious cover within the 100-year floodplain would increase by approximately four acres and the area displaced by buildings would decrease by approximately four acres. Regardless, the 100-year floodplain surrounding LaGuardia Airport is controlled by coastal storm surges and tidal flooding; therefore, the CTB Redevelopment Program would have no effect on the FEMA designated 100-year flood elevation.
Significant Impact Threshold
When it is not practicable to avoid the floodplain, DOT Order 5650.2 establishes the criteria used to determine if a “significant encroachment” would occur. Based on DOT’s policy, a significant encroachment on the floodplain would not occur for the following reasons:
• The probability of the loss of human life is low. There are no residences within the floodplainboundary; therefore, the human population would be limited to building occupancy consistingof passengers, visitors, and employees. As previously discussed, all new buildings and facilitieswould comply with NYC Building Code and life safety requirements, including general provisionsfor flood hazard design and construction. In addition, coastal storms are predictable, andPANYNJ has the authority to cease operations and to evacuate the Airport in the event of acoastal storm; in which case, access to and egress from the Airport is by roadways locatedoutside the floodplain. In addition, the proposed terminal access roadways would be elevated,so emergency evacuation or recovery efforts would not be impeded.
• The CTB Redevelopment Program would be designed to avoid or minimize future extensivedamage or costs, including damage that would interrupt Airport service. As previously discussed,NYC Building Code and PANYNJ policy prioritize setting the floor elevations and criticalequipment higher than the design flood elevation and to dry flood-proof critical areas if it isimpracticable to meet the design criteria. The existing airfield and navigational aids are notaffected by the CTB Redevelopment Program, except for the East Field Lighting Vault, whichwould be constructed at-grade and contained in a dry flood-proofed room because it would beimpracticable to elevate the structure or to locate the facility outside the floodplain.
• There would be no notable adverse impacts on the floodplain’s natural and beneficial values.Project-related impacts on the floodplain would be limited to the redevelopment of existingfacilities and built land. As discussed in other applicable sections of the 2014 EA, the CTBRedevelopment Program would have no adverse impacts on biotic communities, coastalresources, water quality, or wetlands.
Change: The proposed design changes would comply with the updated PANYNJ Memorandum that is consistent with the NYC Building Code (“Code”) (which references the current FEMA Flood Insurance Rate Maps and the American Society of Civil Engineers (ASCE) 24 Standard for Flood Resistant Design and Construction) and adds specification of cost-benefit analysis and more rigorous freeboard (building elevation levels) based on useful asset life. The PANYNJ Design Guidelines – Climate Resilience are the updated standard for construction and establish more rigorous standards that those assumed in the 2014 FONSI/ROD. (See explanation and Table above) The Draft EA was advertised for public comment, referencing Executive Order 11988. During the public hearing in May 2014, there were no public comments received relating to the encroachment on the floodplain, nor were any written comments received. Applying the PANYNJ Design Guidelines and the Code, the proposed design changes do not
December 2015 Chapter 5 – Environmental Consequences 5-40
LaGuardia Airport Technical Report CTB Redevelopment Program
alter the previously approved (2014) encroachment on the floodplain. The conclusion in the EA does not change – a significant encroachment on the floodplain will not occur.
Buildings located in FEMA designated floodplains must comply with the National Flood Insurance Program, the International Building Code, the American Society of Civil Engineers national reference standards, and with the NYC City Building Code. The CTB Redevelopment Program includes a flood hazard mitigation plan developed in compliance with applicable federal, state, and local laws and regulations for the protection of floodplains and with the referenced standards for flood resistant design and construction. Compliance with these requirements provides adequate assurance that project-related impacts on the floodplain would be less than significant. No additional mitigation measures are proposed.
5.2.3.2 No-Action Alternative
The No-Action Alternative would not avoid undertaking major improvements within the floodplain. As discussed in Section 3.2, No-Build/No-Action Alternative, if the CTB Redevelopment Program is not implemented, PANYNJ would have to renovate the existing CTB, investing up to $3 billion to modernize the entire facility. Because a major renovation would occur within the 100-year floodplain, the same flood-resistant design criteria that apply to the CTB Redevelopment Program would also apply to the No-Action Alternative.
However, unlike the CTB Redevelopment Program, which provides new facilities based on mitigation measures for flood hazard design and construction, under the No-Action Alternative the existing facilities would need to be modified or retrofitted to meet the same requirements and it may not be practicable to do so. For example, without new construction, it would not be possible to raise the lowest floor elevation of the terminal building or practical to relocate critical areas to a higher level. This would result in a greater need for dry flood-proofing critical areas to meet the design criteria.
The No-Action Alternative would not result in a significant encroachment on the floodplain. The probability of the loss of human life would still be low; the newly renovated facilities would be designed to avoid or minimize future extensive damage or costs to the degree practicable; and, there would be no notable adverse effects on the affected floodplain’s natural and beneficial values. Because the 100-year floodplain surrounding LaGuardia Airport is controlled by tidal flooding, the No-Action alternative would have no effect on the 100-year flood elevation.
5.2.4 Light Emissions and Visual Effects
This section provides an overview of the analysis of impacts from light emissions and visual effects from the components of the CTB Redevelopment Program. FAA requirements for addressing light emissions and visual impacts under NEPA are addressed in FAA Order 5050.4B, NEPA Implementing Instructions for Airport Actions, and FAA Order 1050.1E, Change 1, Appendix A.12.
5.2.4.1 Light Emissions
Different types of lighting systems are associated with the airside, terminal, and landside areas of the Program. This section describes the location of light systems, provides information pertaining to their purpose, and considers the extent to which any lighting associated with the CTB Redevelopment Program would be recognizable to people in the vicinity or whether such lighting might potentially interfere with their normal activities.
Airside Lighting
December 2015 Chapter 5 – Environmental Consequences 5-41
LaGuardia Airport Technical Report CTB Redevelopment Program
On the airside, high-mast flood lighting of the aircraft parking apron would increase proportionately with the added size of the apron area, but these emissions would be shielded from the Grand Central Parkway and the community south of the Airport by the replacement terminal building. In-pavement and edge lighting within and around the aircraft parking apron would be replaced-in-kind and the emissions would not be expected to change appreciably. All airfield lighting and signage would comply with FAA standards and specifications for design, installation, and maintenance. No runway lighting would be involved, and there would be no change to lights associated with visual or electronic navigational aids.
Terminal Lighting
All exterior building lighting would be designed to comply with NYC Building Code, applicable industry standards, and PANYNJ Sustainable Building Guidelines. Narrow-beam, façade-grazing uplighting would illuminate architectural features of the proposed terminal building. Similar lighting would be integrated with the exterior screens of the proposed West Garage and the Central Heating and Refrigeration Plant (CHRP). The same lighting is already part of the design for unrelated projects under construction in the central terminal area, including the East End Substation (EES) and the East Garage. It is intended that the control of the exterior lighting of all buildings facing the Grand Central Parkway be linked to provide for a unified nighttime appearance, dimmed during late night hours to conserve energy, and complemented by a roadway lighting system using a similar source color.
Landside Lighting
Roadway lighting and other public lighting including surface parking areas, curbs, and sidewalks would be designed to produce quick, accurate, and comfortable seeing at night that would safeguard and facilitate vehicular and pedestrian traffic. All roadway lighting and associated signage would be designed to comply with applicable codes, DOT regulations, and standards, which specify the use of industrial high mast area lamps pointed downward to illuminate only the surfaces below. Although the terminal area roadways would be reconfigured within the project site, there would be no changes to roadways or other public areas beyond the project site. Therefore, the lighting required for roadways and parking would be replaced in-kind and the emissions would not be expected to change.
Relationship to the Community
LaGuardia Airport is located within a densely developed urban area and the Grand Central Parkway provides a wide buffer between the project site and the nearest neighborhoods. The Parkway is an eight-lane divided highway and is illuminated in the area of the Airport, as is the eastbound flyover ramp and the bridges located at 94th Street and 102nd Street. Given the nature and extent of existing development within this area, including existing lighting, it is highly unlikely that airport-related light emissions would affect nearby homes or businesses.
Summary of Impacts
Light emissions from the construction and operation of the CTB Redevelopment Program would not be expected to cause or contribute to off-site annoyance or present a possible danger to persons living or driving in the vicinity of Airport. No nighttime construction is planned; however, if nighttime construction were to occur, the light emissions would be temporary. In addition, there are means and methods available to reduce or minimize potential lighting impacts such as shielding or angular adjustment of lights, or alternative placement of lighting sources consistent with operational requirements.
December 2015 Chapter 5 – Environmental Consequences 5-42
LaGuardia Airport Technical Report CTB Redevelopment Program
Change: Under the proposed design changes, there would be nighttime demolition activity for a 5.5 month period centered around the second quarter of 2017. The activities would be limited to demolition on the Airport and would not be visible to the neighborhoods across the Grand Central Parkway. No heavy construction activities such as paving or pile driving will occur. The only additional lighting that would be needed for this airside demolition work will be temporary low mast (max height 15’) lights on wheels. The lights would be submitted for FAA tower approval prior to use to ensure no glare impeding vision from the tower.
After construction, ambient light emissions associated with the operation of the CTB Redevelopment Program would not be expected to be appreciably different than existing conditions. The CTB Redevelopment Program would reconfigure the terminal building, airside apron, landside roadways, and parking garage within the project site, while the No-Action Alternative involves rehabilitating and renovating existing facilities without moving their location. In either scenario, the types of lighting systems required for safe and efficient evening and nighttime airport operations and the light emissions they generate would be essentially the same.
The CTB Redevelopment Program and No-Action Alternative would not be expected to create an annoyance to residents or businesses in the vicinity of the Airport or interfere with their normal activities. No new light emissions would be introduced into a previously unaffected area. Compliance with applicable building codes and highway design standards provides adequate assurance that any potential short-term or long-term impacts associated with project-related lighting would be less than significant. No mitigation measures are proposed.
5.2.4.2 Visual Impacts
This section examines the visual relationship between the CTB Redevelopment Program and specific elements of its surroundings, the degree of contrast likely to occur, and whether jurisdictional agencies or the public consider the contrast to be objectionable.
Under the CTB Redevelopment Program, the existing central terminal building, airside apron, landside roadways, and parking garage, would be reconfigured within the project site. Three existing airline maintenance hangars would be removed and the CHRP would be relocated. The terminal area roadways and connections to the Grand Central Parkway would be reconfigured but no off-site roadways would be affected. The CTB Redevelopment Program would occur within existing land use and zoning envelopes and would not result in physical changes in urban design beyond the project site. Therefore, assessment of visual impacts is limited to the viewshed from key vantage points located along the south side of the Airport.
The construction and operation of the CTB Redevelopment Program would be seen by people driving east and west along the Grand Central Parkway, by drivers and pedestrians looking north from Ditmar’s Boulevard, and by employees and guests of the LaGuardia Airport Marriott hotel, which is located on north side of Ditmar’s Boulevard near the 102nd Street entrance to the Airport. With the exception of Overlook Park along 22nd Drive, and views from multi-story buildings in the vicinity, there are few if any vantage points of the project site from businesses and residences south of Ditmar’s Boulevard west of 94th Street or east of 102nd Street.
Visually distinct landscape units within the viewshed include roadways and ramps associated with the Grand Central Parkway and existing Airport buildings located within the central terminal area. During the construction period, many of these features would change. People in the vicinity would see the existing parking garage and Hangars 1, 2, and 4 being removed to make space for the new three-level
December 2015 Chapter 5 – Environmental Consequences 5-43
LaGuardia Airport Technical Report CTB Redevelopment Program
terminal building, which would replace the garage as the closest and most prominent Airport feature adjacent to the Grand Central Parkway. There would be no major changes to the Parkway’s main line roadways, although the eastbound flyover ramp to the Airport would be realigned to feed into the reconfigured terminal area roadway system. Construction activities would be temporary and the visual impacts during construction would diminish as the project nears completion.
Degree of Contrast
Assessing the degree of contrast using before-and-after images of the project site is highly subjective and would be determined in large part by the community’s perception of the project. The current image is a row of aging and obsolete airport buildings separated from the Grand Central Parkway by a large parking garage and several surface parking lots. The proposed image is a row of modern airport buildings with complementary architecture that unifies and organizes the entire Airport campus. The new terminal building would be designed to have a strong civic presence along the Grand Central Parkway and to be in clear line of sight for customers approaching from either direction. The position and placement of the new terminal would permit views to the New York City skyline, underscoring the terminal’s role as the principle air gateway to the City and the region. At a Public Open House on December 12, 2012 and Public Information Session and Public Hearing on May 8, 2014, renderings of the proposed terminal were presented and discussed with the public.
Change: The layout of the terminal building has been revised under the proposed design changes; however the assumptions in the 2014 FONSI/ROD (modern buildings with complementary architecture, strong civic presence along the Grand Central Parkway, views to the New York City skyline) will still be applicable.
The visual impact of the CTB Redevelopment Program on the viewshed would be determined in large part by the height of the proposed terminal building as well as its relationship to the Grand Central Parkway and the nearby community. Under the No-Action Alternative, the roof elevation would not change, remaining at 72 feet above ground level. Under the CTB Redevelopment Program, the roof elevation of the new terminal would be the same or higher. The proposed roof elevation depends on the ultimate vertical clearance between the upper-level, departures/ticketing roadway and the canopy over the road. Vertical clearance could range from 20 feet up to 50 feet. Therefore, depending on final design, the height of the proposed terminal would be approximately 70 to 100 feet above ground level.
Change: The total height of the terminal building in the proposed design changes would be 112 feet above ground level. Although this would be higher than assumed in the 2014 FONSI/ROD, the increased height would not significantly alter the viewshed.
PANYNJ conducted two comprehensive visual impact assessments of the proposed terminal building—one examines the terminal from the community located on the south side of the Grand Central Parkway, while the other looks at the presence of the terminal from the Parkway. Figure 5-8, Community Viewshed Impacts, illustrates the proposed height and setback of the new terminal building in relation to the Grand Central Parkway and the community. As shown, the proposed terminal would be setback 200 feet farther from the Parkway than the existing parking garage. Also, as shown, the proposed terminal and the adjacent West Garage would have a minimal impact on the view from the community when compared to the No-Action Alternative. Using a rendering of the proposed terminal, Figure 5-9 further demonstrates that the view of the Airport from the community would not be appreciably different with the CTB Redevelopment Program.
December 2015 Chapter 5 – Environmental Consequences 5-44
LaGuardia Airport Technical Report CTB Redevelopment Program
Change: The revised Figure 5-8b, Community Viewshed Impacts, illustrates the proposed height and setback of the new terminal building in relation to the Grand Central Parkway and the community (based on the proposed design changes). As shown, the proposed terminal would be setback 170 feet further from the Parkway than the existing parking garage. A change of 30 feet versus the previously approved (2014) design (which was set back 200 feet from the Parkway versus the existing parking garage) would not be appreciably noticeable to pedestrians or drivers on the Grand Central Parkway and the terminal would still be setback further than the existing garage. Using a rendering of the proposed terminal, Figure 5-9b further demonstrates that the view of the Airport from the community would not be appreciably different with the proposed design changes.
The second study assessed the presence of the proposed terminal from the Grand Central Parkway. Using the architect’s rendition of the proposed terminal and West Garage, Figure 5-10 illustrates a driver’s perspective view of the proposed development from an eastbound lane, exiting the Parkway to the Airport, and Figure 5-11 illustrates a westbound view of the proposed buildings. As shown, visually distinct units within the viewshed would change, but the CTB Redevelopment Program would have a minimal impact on a driver’s view when compared to the No-Action Alternative.
City Environmental Quality Review (CEQR) Screening
According to the CEQR Technical Manual, an urban design assessment is needed when the project may have effects on one or more of the elements (arrangement, appearance, and functionality of the built environment) that contribute to the pedestrian experience. Further analysis is needed when the project partially or totally blocks a view corridor or a natural or built visual resource and that resource is rare in the area or considered a defining feature of the neighborhood; or when the project changes urban design features so that the context of a natural or built visual resource is altered.
The CTB Redevelopment Program would change the look of the Airport, views of which can be observed by pedestrians from the streets south of the Grand Central Parkway. A Community Impact Study analyzed photographs of the existing views from those streets, overlaid with the expected rooflines of the proposed buildings. The CTB Redevelopment Program would not partially or totally block a view corridor or a natural or built visual resource that is rare in the area or considered a defining feature of the neighborhood (i.e., Flushing Bay), nor would it change urban design features so that the context of a natural or built visual resource is altered. Therefore, further analysis of visual resources would not be required under CEQR.
In addition, a preliminary shadow analysis was performed on the proposed structures (Terminal and West Garage), in accordance with the CEQR Technical Manual and found that there would be no incremental shadows cast on sunlight-sensitive resources as a result of the CTB Redevelopment Program.
December 2015 Chapter 5 – Environmental Consequences 5-45
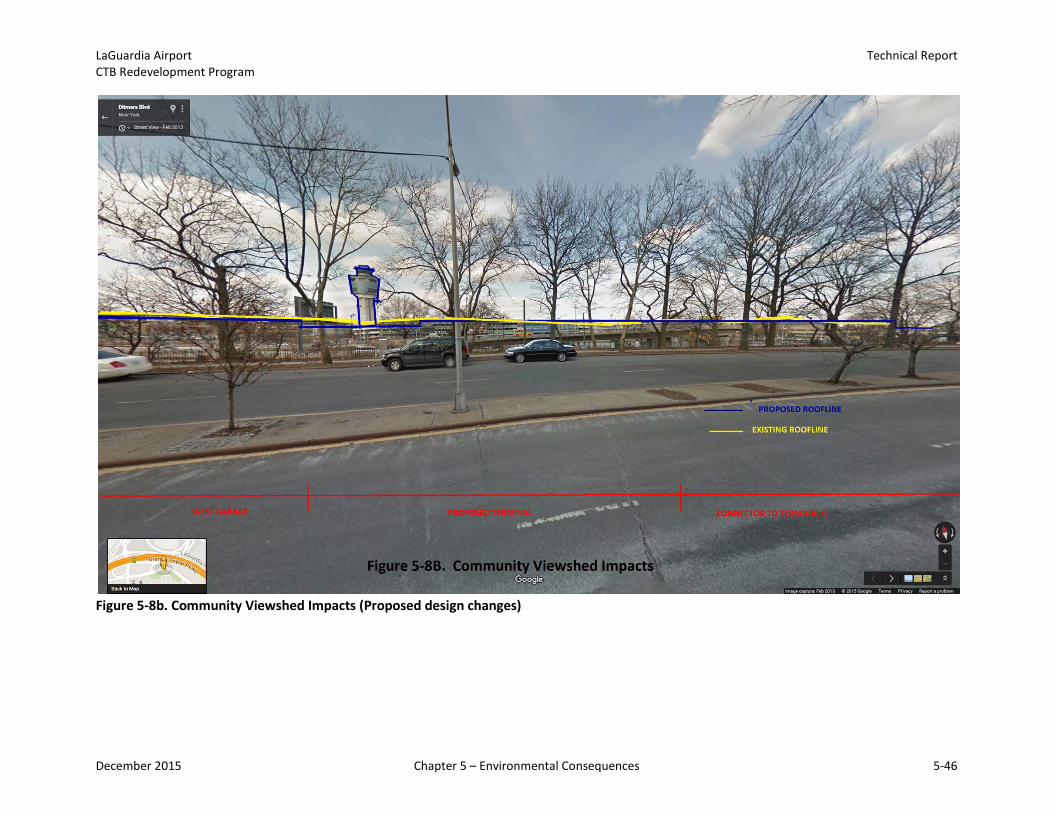
LaGuardia Airport Technical Report CTB Redevelopment Program
Figure 5-8b. Community Viewshed Impacts (Proposed design changes)
December 2015 Chapter 5 – Environmental Consequences 5-46
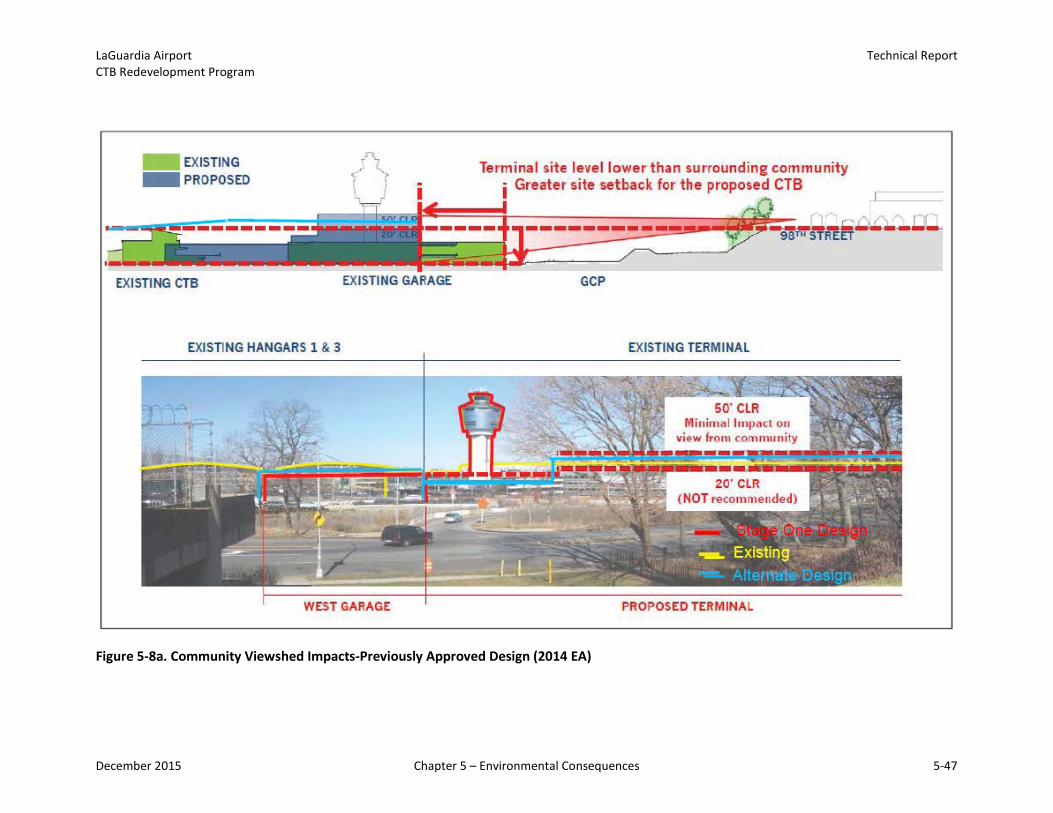
LaGuardia Airport Technical Report CTB Redevelopment Program
Figure 5-8a. Community Viewshed Impacts-Previously Approved Design (2014 EA)
PROPOSED WEST GARAGE
December 2015 Chapter 5 – Environmental Consequences 5-47
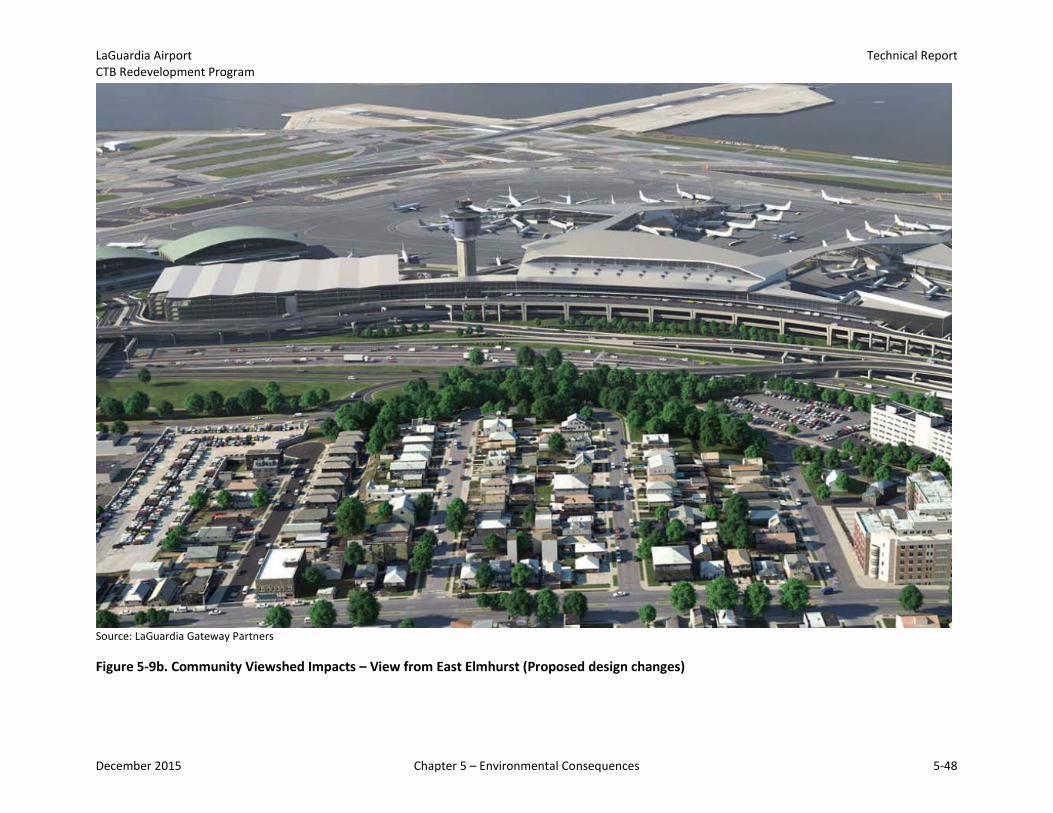
LaGuardia Airport Technical Report CTB Redevelopment Program
Source: LaGuardia Gateway Partners
Figure 5-9b. Community Viewshed Impacts – View from East Elmhurst (Proposed design changes)
December 2015 Chapter 5 – Environmental Consequences 5-48
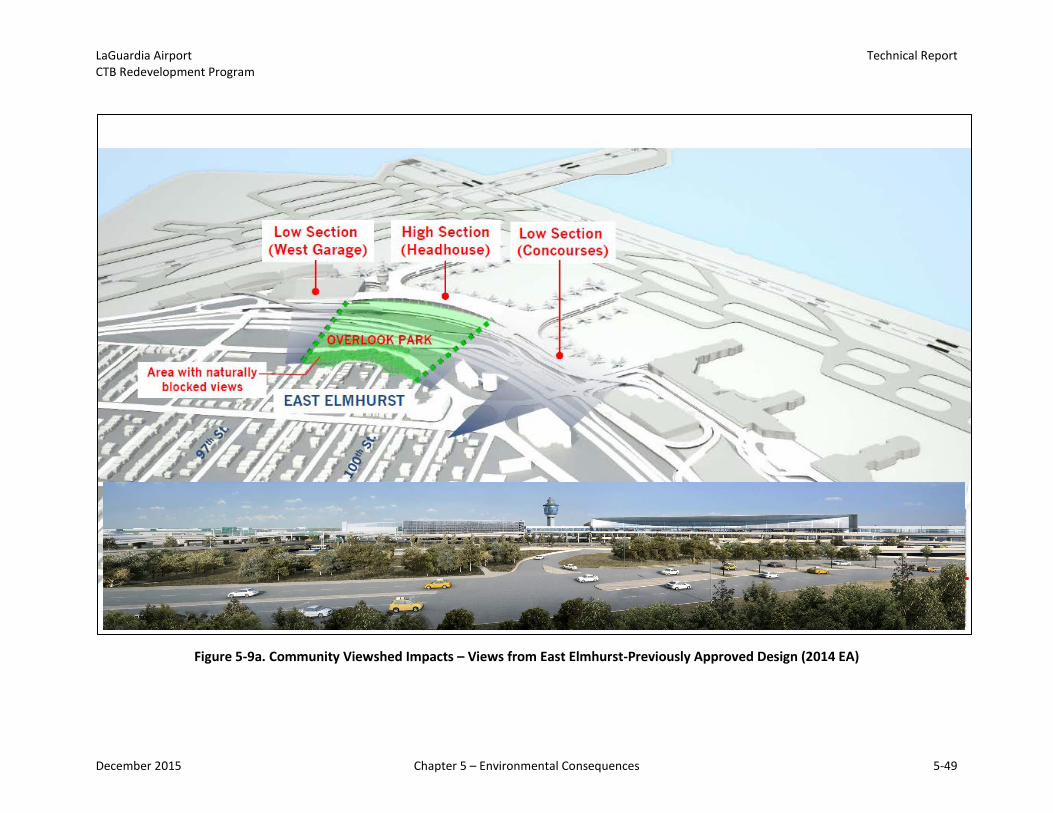
LaGuardia Airport Technical Report CTB Redevelopment Program
Figure 5-9a. Community Viewshed Impacts – Views from East Elmhurst-Previously Approved Design (2014 EA)
December 2015 Chapter 5 – Environmental Consequences 5-49
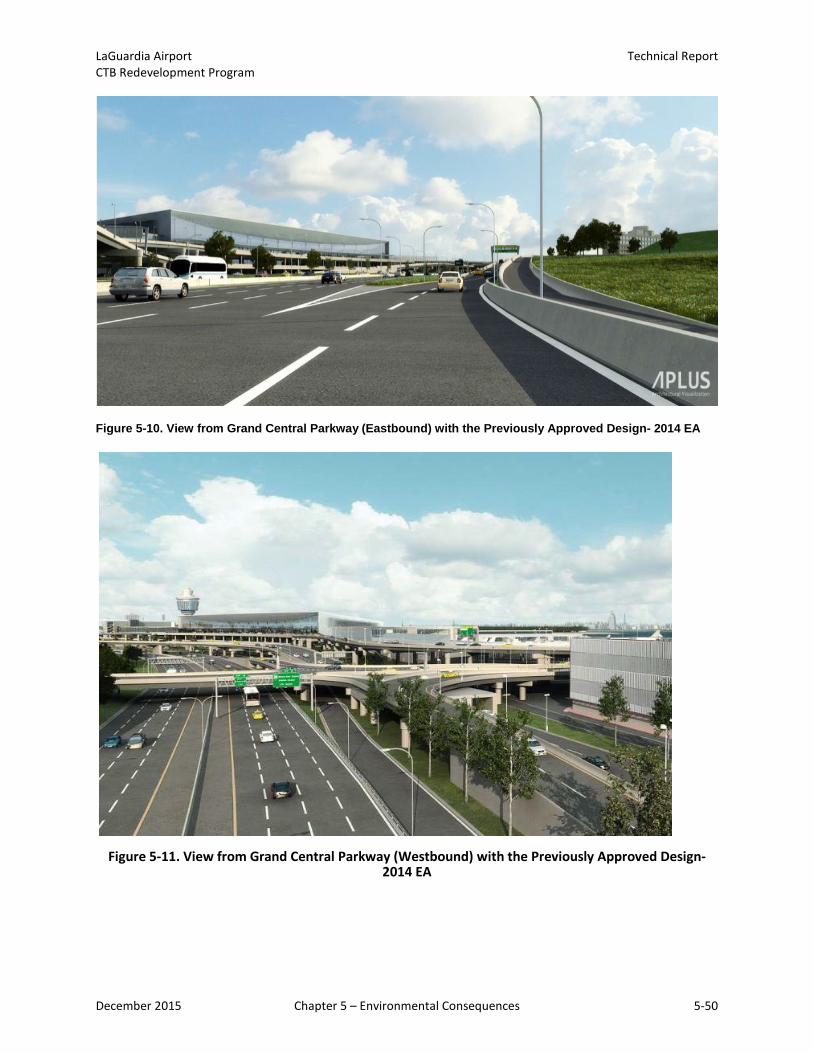
LaGuardia Airport Technical Report CTB Redevelopment Program
Figure 5-10. View from Grand Central Parkway (Eastbound) with the Previously Approved Design- 2014 EA
Figure 5-11. View from Grand Central Parkway (Westbound) with the Previously Approved Design- 2014 EA
December 2015 Chapter 5 – Environmental Consequences 5-50
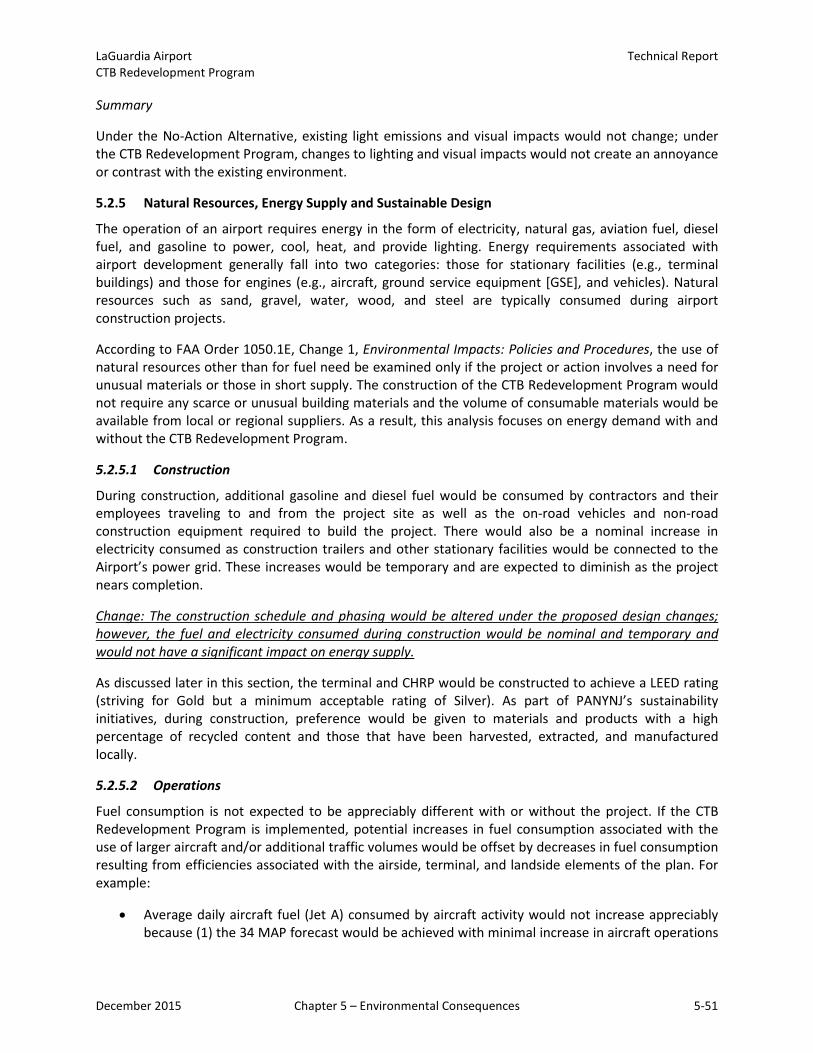
LaGuardia Airport Technical Report CTB Redevelopment Program
Summary
Under the No-Action Alternative, existing light emissions and visual impacts would not change; under the CTB Redevelopment Program, changes to lighting and visual impacts would not create an annoyance or contrast with the existing environment.
5.2.5 Natural Resources, Energy Supply and Sustainable Design
The operation of an airport requires energy in the form of electricity, natural gas, aviation fuel, diesel fuel, and gasoline to power, cool, heat, and provide lighting. Energy requirements associated with airport development generally fall into two categories: those for stationary facilities (e.g., terminal buildings) and those for engines (e.g., aircraft, ground service equipment [GSE], and vehicles). Natural resources such as sand, gravel, water, wood, and steel are typically consumed during airport construction projects.
According to FAA Order 1050.1E, Change 1, Environmental Impacts: Policies and Procedures, the use of natural resources other than for fuel need be examined only if the project or action involves a need for unusual materials or those in short supply. The construction of the CTB Redevelopment Program would not require any scarce or unusual building materials and the volume of consumable materials would be available from local or regional suppliers. As a result, this analysis focuses on energy demand with and without the CTB Redevelopment Program.
5.2.5.1 Construction
During construction, additional gasoline and diesel fuel would be consumed by contractors and their employees traveling to and from the project site as well as the on-road vehicles and non-road construction equipment required to build the project. There would also be a nominal increase in electricity consumed as construction trailers and other stationary facilities would be connected to the Airport’s power grid. These increases would be temporary and are expected to diminish as the project nears completion.
Change: The construction schedule and phasing would be altered under the proposed design changes; however, the fuel and electricity consumed during construction would be nominal and temporary and would not have a significant impact on energy supply.
As discussed later in this section, the terminal and CHRP would be constructed to achieve a LEED rating (striving for Gold but a minimum acceptable rating of Silver). As part of PANYNJ’s sustainability initiatives, during construction, preference would be given to materials and products with a high percentage of recycled content and those that have been harvested, extracted, and manufactured locally.
5.2.5.2 Operations
Fuel consumption is not expected to be appreciably different with or without the project. If the CTB Redevelopment Program is implemented, potential increases in fuel consumption associated with the use of larger aircraft and/or additional traffic volumes would be offset by decreases in fuel consumption resulting from efficiencies associated with the airside, terminal, and landside elements of the plan. For example:
• Average daily aircraft fuel (Jet A) consumed by aircraft activity would not increase appreciablybecause (1) the 34 MAP forecast would be achieved with minimal increase in aircraft operations
December 2015 Chapter 5 – Environmental Consequences 5-51
LaGuardia Airport Technical Report CTB Redevelopment Program
(takeoffs and landings); (2) the 35-gate plan with dual (two-way) taxilanes reduces aircraft taxi times; and (3) equipping each gate with 400 Hz ground power and pre-conditioned air (PCAir) reduces the use of the aircraft’s auxiliary power units (APUs), which also consume aircraft fuel.52
Change: Under the proposed design changes, two out of three gates areas would retain a dual taxilane. One gate area (concourse A) is restricted to a single taxilane but would maintain dual entry/exit points. However, TAAM analysis demonstrated a decrease of 0.1 minute per operation compared to the previously approved design (2014); therefore, the benefits to aircraft fuel consumption would remain. As discussed in Section 5.2, Air Quality, there would either be no emissions increase or an emissions increase that is clearly de minimis.
• Average daily gasoline and diesel fuel consumed by conventional bag tractors, belt loaders, and push-back tractors would be reduced by approximately half because comparable electric ground support equipment (eGSE) would be used exclusively at the new terminal building, which accounts for half the aircraft parking positions (gates) serviced by these types of equipment.
• Average daily gasoline and diesel fuel consumed by arriving and departing vehicles would not change appreciably due to improved levels of service on the terminal area roadways.
The benefits of the CTB Redevelopment Program in terms of fuel efficiency are demonstrated in the results of the air quality analysis. As discussed in Section 5.2, Air Quality, there would be no emissions increase or an increase that is clearly de minimis. Assuming that engine emissions correspond to fuel consumption, it is reasonable to conclude that any project-related increase/decrease in average daily fuel consumed would be modest when compared to the No-Action Alternative.
The CTB Redevelopment Program would not cause or contribute to a significant increase in the demand for electricity or natural gas. Consolidated Edison (ConEdison) provides electricity to the Airport using high voltage (feeder) lines leading to two separate substations owned and operated by PANYNJ – the Central Electrical Substation (CES) and the West End Substation (WES). A new East End Substation (EES) is currently under construction (as a separate action) and will replace the aging CES whether or not the CTB Redevelopment Program is implemented. Capacity of the WES is 12 Megavolt Ampere (MVA) and capacity of the new EES is 24 MVA. The total capacity (36 MVA) is capable of meeting the projected overall Airport load of 32 MVA, which PANYNJ has calculated based on existing Airport loading analysis, anticipated load expansion, and a reasonable allowance for an unanticipated peak load increase. PANYNJ has coordinated with ConEdison and determined that there is ample supply and sufficient infrastructure to deliver the energy required to meet the foreseeable needs of the project (see letter dated August 21, 2013 in Appendix G of the 2014 EA). No upstream/off-Airport infrastructure improvements would be required to accommodate the CTB Redevelopment Program.
Sustainability
With regard to sustainable design, White House Executive Order 13123, Greening the Government Through Efficient Energy Management, encourages each federal agency to expand the use of renewable energy in its facilities and for its actions.53 Further, FAA policy directs a review of a federal action to discern the conservation of resources, use of pollution prevention measures, minimization of aesthetic effects, and address public (both local and traveling) sensitivity to these concerns.
52 Aircraft size would increase as result of upgauging, requiring some additional fuel. 53 64 FR 30851 (June 8, 1999) available online at http://www.gpo.gov/fdsys/pkg/FR-1999-06-08/pdf/99-14633.pdf.
December 2015 Chapter 5 – Environmental Consequences 5-52
LaGuardia Airport Technical Report CTB Redevelopment Program
PANYNJ is committed to developing a design for the CTB Redevelopment Program that results in the construction and operation of the Airport in a sustainable manner through conservation of natural resources and protection of the environment. To this end, a Sustainability Design Plan has been prepared and would be implemented, as shown in Table 5-4. In addition, the requirements of Executive Order No. 111 on energy use and goals of the New York State Climate Action Plan on greenhouse gas reduction and mitigation of environmental impacts have been acknowledged and identified as project goals.
PANYNJ would pursue LEED certification through the U.S. Green Building Council’s (USGBC) Application Guide for Multiple Buildings and On-Campus Projects. The proposed terminal and CHRP would be registered separately under LEED for New Construction54 and strive towards a Gold Rating (a Silver Rating must be achieved). The remaining sub-projects, including the West Garage, roadways, and utilities, are not appropriate for LEED certification, but their design and construction would still comply with PANYNJ’s Policy on Sustainable Design and implementing strategies outlined in PANYNJ Sustainable Design Project Manual or PANYNJ Sustainable Infrastructure Guidelines. To achieve LEED certification, and to comply with PANYNJ sustainable guidelines as applicable, key design strategies for the CTB Redevelopment Program include, but are not necessarily limited to, the following:
• Optimized building envelope components, high performance HVAC systems, and building automation and control systems partnered to meet a 30 percent reduction in energy cost as compared to baseline conditions;55
• Purchase of green power through Renewable Energy Certificates to meet the LEED goal of providing 35 percent of the project’s electricity from renewable sources;
• Water efficient plumbing fixtures, stormwater harvesting, and gray water reuse to reduce potable water for sewage conveyance by 50 percent and potable water use in the building by more than 40 percent;
Change: In addition to water efficient plumbing, solar water collectors at the headhouse and concourses would be installed to provide hot water to the restrooms. Rainwater harvesting, stored in underground tanks below the headhouse, will be used for irrigation at the site
• Replacement of the existing non-pervious salt splash pavers with pervious pavement to enhance percolation rates as well as protect the vegetation and lawn areas.
As per PANYNJ policy and guidelines, the CTB Redevelopment Program would be designed to comply with established environmental goals for emissions reductions, energy and water efficiency, and waste reduction. These environmental goals have targets to be met by 2050 and beyond. In addition, the design and construction of the proposed terminal would be targeted for LEED Gold certification for New Construction. Thus, the CTB Redevelopment Program would meet PANYNJ’s and FAA’s goals for promoting sustainable design. Under the No-Action Alternative, the existing CTB and ancillary facilities would be renovated in their existing locations and in compliance PANYNJ sustainability guidelines to the
54 Version 3.0 / 2009 55 American Society of Heating, Refrigerating and Air-Conditioning Engineers (ASHRAE) 90.1-2007 Baseline;
http://www.ashrae.org/standards-research--technology/standards-interpretations/interpretation-for-standard-90-1-2007 ; Change: ASHRAE 90.1-2010 will be used as the baseline.
December 2015 Chapter 5 – Environmental Consequences 5-53
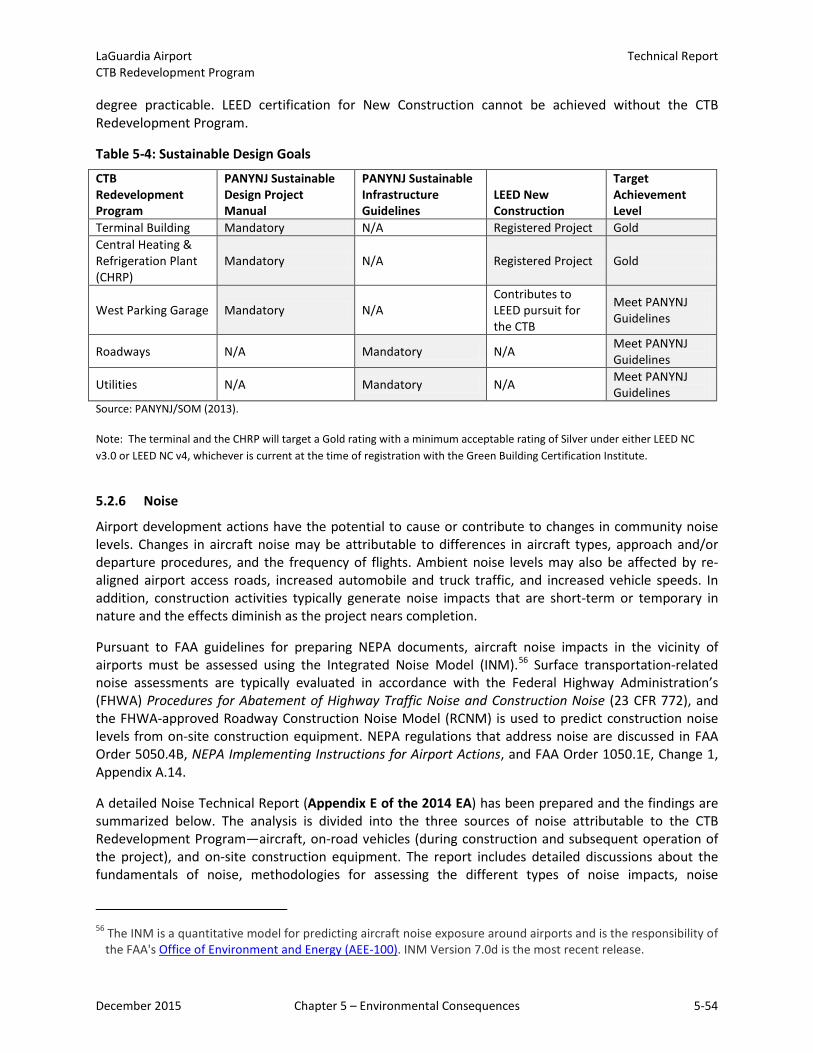
LaGuardia Airport Technical Report CTB Redevelopment Program
degree practicable. LEED certification for New Construction cannot be achieved without the CTB Redevelopment Program.
Table 5-4: Sustainable Design Goals
CTB Redevelopment Program
PANYNJ Sustainable Design Project Manual
PANYNJ Sustainable Infrastructure Guidelines
LEED New Construction
Target Achievement Level
Terminal Building Mandatory N/A Registered Project Gold Central Heating & Refrigeration Plant (CHRP)
Mandatory N/A Registered Project Gold
West Parking Garage Mandatory N/A Contributes to LEED pursuit for the CTB
Meet PANYNJ Guidelines
Roadways N/A Mandatory N/A Meet PANYNJ Guidelines
Utilities N/A Mandatory N/A Meet PANYNJ Guidelines
Source: PANYNJ/SOM (2013).
Note: The terminal and the CHRP will target a Gold rating with a minimum acceptable rating of Silver under either LEED NC v3.0 or LEED NC v4, whichever is current at the time of registration with the Green Building Certification Institute.
5.2.6 Noise
Airport development actions have the potential to cause or contribute to changes in community noise levels. Changes in aircraft noise may be attributable to differences in aircraft types, approach and/or departure procedures, and the frequency of flights. Ambient noise levels may also be affected by re-aligned airport access roads, increased automobile and truck traffic, and increased vehicle speeds. In addition, construction activities typically generate noise impacts that are short-term or temporary in nature and the effects diminish as the project nears completion.
Pursuant to FAA guidelines for preparing NEPA documents, aircraft noise impacts in the vicinity of airports must be assessed using the Integrated Noise Model (INM).56 Surface transportation-related noise assessments are typically evaluated in accordance with the Federal Highway Administration’s (FHWA) Procedures for Abatement of Highway Traffic Noise and Construction Noise (23 CFR 772), and the FHWA-approved Roadway Construction Noise Model (RCNM) is used to predict construction noise levels from on-site construction equipment. NEPA regulations that address noise are discussed in FAA Order 5050.4B, NEPA Implementing Instructions for Airport Actions, and FAA Order 1050.1E, Change 1, Appendix A.14.
A detailed Noise Technical Report (Appendix E of the 2014 EA) has been prepared and the findings are summarized below. The analysis is divided into the three sources of noise attributable to the CTB Redevelopment Program—aircraft, on-road vehicles (during construction and subsequent operation of the project), and on-site construction equipment. The report includes detailed discussions about the fundamentals of noise, methodologies for assessing the different types of noise impacts, noise
56 The INM is a quantitative model for predicting aircraft noise exposure around airports and is the responsibility of the FAA's Office of Environment and Energy (AEE-100). INM Version 7.0d is the most recent release.
December 2015 Chapter 5 – Environmental Consequences 5-54
LaGuardia Airport Technical Report CTB Redevelopment Program
monitoring for determining baseline conditions, the impact analysis and assessment, and mitigation measures to reduce the effects of noise on the surrounding environment.
Aircraft noise received special attention during the preparation of the 2014 EA. PANYNJ commissioned a stand-alone aircraft noise analysis and assessment of effects that is included as Attachment 1 to Appendix E of the 2014 EA. In addition, on October 27, 2014, PANYNJ announced the award of a contract to conduct formal Airport Noise Compatibility Planning through a Part 150 study for LaGuardia Airport. Since April 2014, PANYNJ has also been collaborating with stakeholders to formulate a formal Aviation Roundtable for airport noise issues in communities surrounding the Airport.
5.2.6.1 CTB Redevelopment Program
The noise impact analysis considers the potential changes in noise levels that would be expected to occur as a result of the construction and operation of the CTB Redevelopment Program. An updated noise analysis (Attachment 6, Technical Memorandum – Updated Noise Analysis for the Construction Conditions) has been prepared and the findings are summarized below. The analysis focuses only on the noise attributable to construction of the proposed design changes – from on-road vehicles and on-site construction equipment.
Construction Equipment Noise
An updated construction schedule and construction equipment inventory was developed for the proposed design changes, itemizing the various construction equipment that would be utilized during both demolition and construction activities. According to this schedule, 2017 would be the worst-case construction year, resulting in the maximum number of construction activities and equipment on site.
Baseline conditions established in the 2014 EA were used for comparison with the construction noise from the proposed design changes. Four noise-sensitive sites were selected for typical weekday 24-hour noise monitoring, implemented in January 2013 (M1, M2, M3 and M5). The FHWA-approved Roadway Construction Noise Model (RCNM) was used to predict construction noise levels from the on-site construction equipment at each of the four off-site monitoring locations. The analysis conservatively assumed that all equipment would be operated at the same time at the construction project site. Since the selected monitoring sites are the closest receptor locations to the proposed construction activities, the predicted noise impacts are expected to be representative of the worst-case conditions. RCNM-predicted peak daytime noise levels were calculated for each year of construction and projected noise exposure during the nighttime hours (7 PM to 6 AM) was calculated for the peak construction year (2017).
Construction equipment noise was compared with existing background levels at four noise sensitive sites (see Table 5-6b). The proposed design changes would likely result in noticeable noise increases that range from 5 to 8 dBA above existing daytime background levels at two of the four monitoring sites—M2 and M3. The relatively high noise increases would occur during early construction stages (between 2016 and 2018). The highest noise level exposure is projected to occur in 2016, because the greatest pile driving activities would be clustered in 2016. The construction equipment noise levels are predicted to be well below the 85 dBA criterion established by NYSDOT in all cases. At site M1, the incremental noise from construction activities would not be noticeable given the high background noise primarily caused by the adjacent Grand Central Parkway traffic. At site M5, construction activity would have negligible noise impacts given the distance between the sources and receptors. Noise levels from construction at night may contribute several decibels to the background level for up to a period of six months at sites M2 and M3. However, these increases in noise levels are well below the NYSDOT 85 dBA criteria. Additionally,
December 2015 Chapter 5 – Environmental Consequences 5-55
LaGuardia Airport Technical Report CTB Redevelopment Program
interior noise levels inside residential properties represented by sites M2 and M3 would not be affected by construction noise.
Construction Traffic
The methodology for predicting future on-road traffic noise levels assumes that existing noise levels are dominated by, and are a function of, existing traffic volumes. Since different types of vehicles (cars, trucks, buses, etc.) generate different noise levels, the CEQR Technical Manual recommends using Passenger Car Equivalents (PCE) to create a common unit of measurement to conservatively estimate noise from traffic. According to the CEQR Technical Manual, a significant impact during daytime hours is an exceedance of 65 dBA; therefore, a 3 dBA increase over the future No Action condition is considered an indicator of noise impact when the noise level is at or above 62 dBA.
The mid-block PCE volumes along the roadway immediately adjacent to the noise sensitive receptors were calculated for each of the peak traffic periods (morning and afternoon) during the peak year of construction (2017), under both the No Action and proposed design change conditions. The project-generated vehicle mix during the peak construction period was used to calculate the incremental traffic-related PCEs under the proposed design changes condition. For the No Action condition, the vehicle mix data for corresponding roadway types was used to calculate the future PCE volumes (based on information provided by NYSDOT). If the proposed design changes would double PCE volumes at a given intersection, it is assumed that noise levels would increase by 3 dBA and thereby exceed the CEQR threshold for significant noise impact (for both nighttime and daytime periods for which the No Action levels exceed 62 dBA). The maximum incremental noise predicted for each roadway link within the project-related traffic network was calculated. There would be no incremental increase of 3 dBA; therefore, traffic noise impacts of the construction of the proposed design changes would not be significant and no further analysis is required.
5.2.6.1.1 Construction
Construction-related noise would be generated by on-site equipment and by increased traffic (from trucks and construction worker vehicles) using local streets in the vicinity of the Airport.
Construction Equipment
A wide range of construction equipment would be required for demolition and construction phase activities. In order to assess the construction noise impacts from on-site equipment operations, the loudest projected hourly noise level in any given month was predicted by assuming that all likely equipment would be operating within the same hour.57 These cumulative noise levels were then adjusted based on applicable usage factors. RCNM was used to predict construction noise levels from the on-site construction equipment. Based on the equipment type, the distance between the work zone, and the selected receptor, the RCNM computes the maximum noise (Lmax) and/or equivalent sound level (Leq)58 at each receptor location. The RCNM does not account for excess ground attenuation or the rate of atmospheric absorption that would help shield the sound made by the construction noise, so the resulting predicted noise levels are higher than would actually be perceived.
57 Estimates of construction equipment usage were generated for the CTB Redevelopment Program using preliminary designs and assumptions based on standard industry practices (see Appendix F).
58 Leq is used to describe the sound energy for fluctuating noise heard over a specific time period by averaging these values and representing them as a steady, unchanging sound over that time period.
December 2015 Chapter 5 – Environmental Consequences 5-56
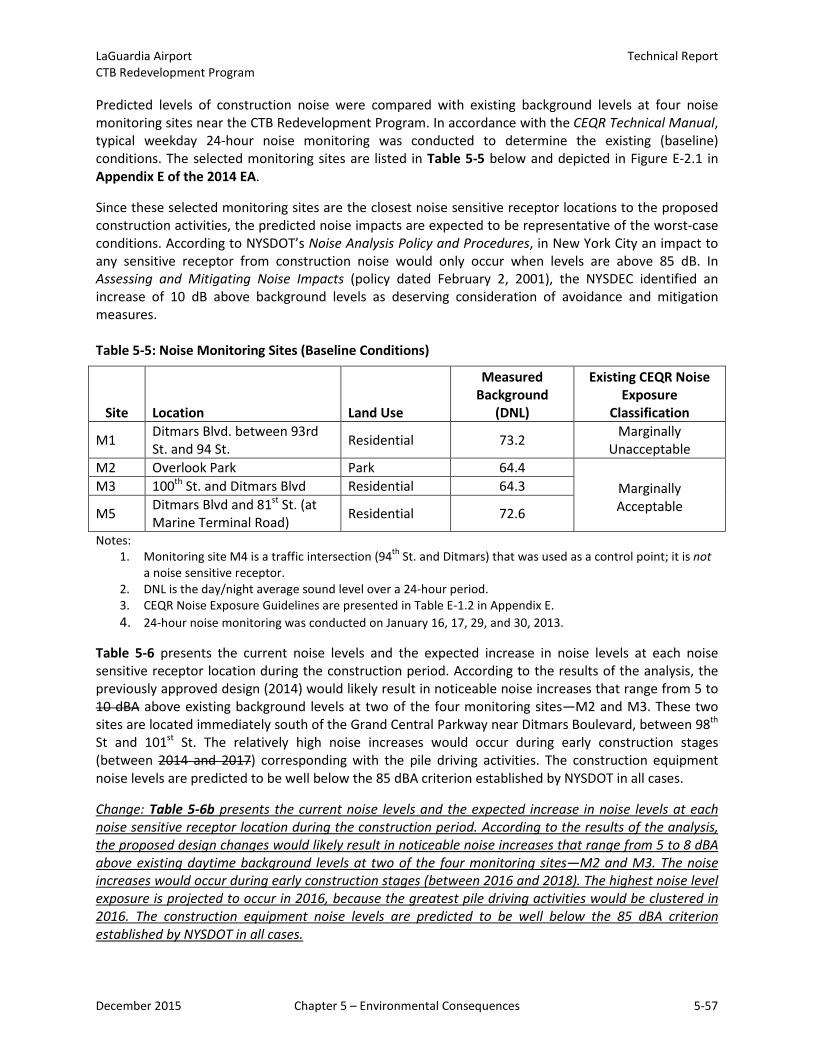
LaGuardia Airport Technical Report CTB Redevelopment Program
Predicted levels of construction noise were compared with existing background levels at four noise monitoring sites near the CTB Redevelopment Program. In accordance with the CEQR Technical Manual, typical weekday 24-hour noise monitoring was conducted to determine the existing (baseline) conditions. The selected monitoring sites are listed in Table 5-5 below and depicted in Figure E-2.1 in Appendix E of the 2014 EA.
Since these selected monitoring sites are the closest noise sensitive receptor locations to the proposed construction activities, the predicted noise impacts are expected to be representative of the worst-case conditions. According to NYSDOT’s Noise Analysis Policy and Procedures, in New York City an impact to any sensitive receptor from construction noise would only occur when levels are above 85 dB. In Assessing and Mitigating Noise Impacts (policy dated February 2, 2001), the NYSDEC identified an increase of 10 dB above background levels as deserving consideration of avoidance and mitigation measures. Table 5-5: Noise Monitoring Sites (Baseline Conditions)
Site Location Land Use
Measured Background
(DNL)
Existing CEQR Noise Exposure
Classification
M1 Ditmars Blvd. between 93rd St. and 94 St. Residential 73.2 Marginally
Unacceptable M2 Overlook Park Park 64.4
Marginally Acceptable
M3 100th St. and Ditmars Blvd Residential 64.3
M5 Ditmars Blvd and 81st St. (at Marine Terminal Road) Residential 72.6
Notes: 1. Monitoring site M4 is a traffic intersection (94th St. and Ditmars) that was used as a control point; it is not
a noise sensitive receptor. 2. DNL is the day/night average sound level over a 24-hour period. 3. CEQR Noise Exposure Guidelines are presented in Table E-1.2 in Appendix E. 4. 24-hour noise monitoring was conducted on January 16, 17, 29, and 30, 2013.
Table 5-6 presents the current noise levels and the expected increase in noise levels at each noise sensitive receptor location during the construction period. According to the results of the analysis, the previously approved design (2014) would likely result in noticeable noise increases that range from 5 to 10 dBA above existing background levels at two of the four monitoring sites—M2 and M3. These two sites are located immediately south of the Grand Central Parkway near Ditmars Boulevard, between 98th St and 101st St. The relatively high noise increases would occur during early construction stages (between 2014 and 2017) corresponding with the pile driving activities. The construction equipment noise levels are predicted to be well below the 85 dBA criterion established by NYSDOT in all cases.
Change: Table 5-6b presents the current noise levels and the expected increase in noise levels at each noise sensitive receptor location during the construction period. According to the results of the analysis, the proposed design changes would likely result in noticeable noise increases that range from 5 to 8 dBA above existing daytime background levels at two of the four monitoring sites—M2 and M3. The noise increases would occur during early construction stages (between 2016 and 2018). The highest noise level exposure is projected to occur in 2016, because the greatest pile driving activities would be clustered in 2016. The construction equipment noise levels are predicted to be well below the 85 dBA criterion established by NYSDOT in all cases.
December 2015 Chapter 5 – Environmental Consequences 5-57
LaGuardia Airport Technical Report CTB Redevelopment Program
Table 5-6b also provides a summary of projected noise exposure during the nighttime hours (7:00 PM to 6:00 AM) during 2017 when the major demolition activities are scheduled to occur. Noise levels from construction at night may contribute several decibels to the background level for up to a period of six months at sites M2 and M3. However, these increases in noise levels are well below the NYSDOT 85 dBA criteria. Additionally, interior noise levels inside residential properties represented by sites M2 and M3 would not be affected by construction noise.
December 2015 Chapter 5 – Environmental Consequences 5-58
LaGuardia Airport Technical Report CTB Redevelopment Program
Table 5-6b: Predicted RCNM Leq(1) Noise Levels at Select Monitoring Sites (Proposed design changes)
Site Weekday Peak Hour
Leq Noise Level (dBA)
Measured Background Leq
Daytime Night-time
2016 2017 2018 2019 2020 2021 2022 2017
M1 - Ditmars Blvd. between 93rd St. and 94th St.
AM 73
68 66 66 62 65 64 59 58 Mid Day 73
PM 72
M2 - Overlook Park
AM 65
72 70 69 64 69 68 61 63 Mid Day 64
PM 65
M3 - 100th St. and Ditmars Blvd.
AM 64
71 69 69 65 68 67 61 61 Mid Day 66
PM 66
M5 - Ditmars Blvd. and 81st St. at Marine Terminal Rd.
AM 67
60 59 58 55 57 57 51 50 Mid Day 67
PM 64
December 2015 Chapter 5 – Environmental Consequences 5-59
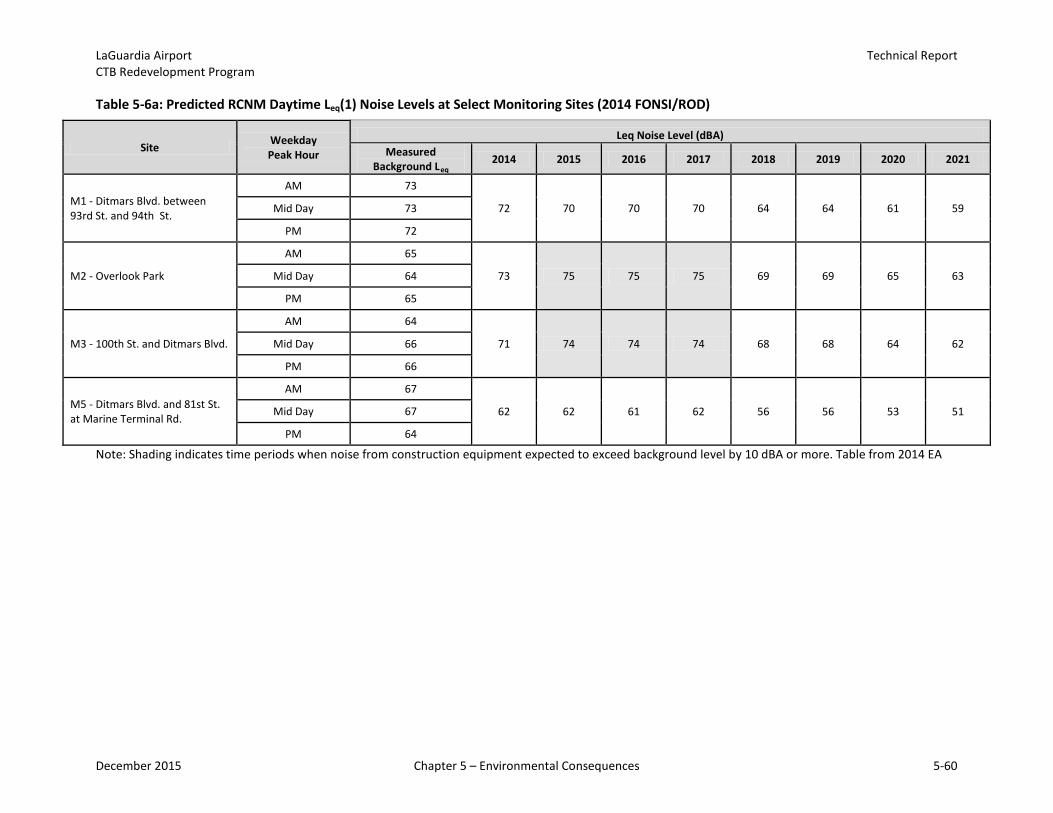
LaGuardia Airport Technical Report CTB Redevelopment Program
Table 5-6a: Predicted RCNM Daytime Leq(1) Noise Levels at Select Monitoring Sites (2014 FONSI/ROD)
Site Weekday Peak Hour
Leq Noise Level (dBA) Measured
Background Leq 2014 2015 2016 2017 2018 2019 2020 2021
M1 - Ditmars Blvd. between 93rd St. and 94th St.
AM 73
72 70 70 70 64 64 61 59 Mid Day 73
PM 72
M2 - Overlook Park
AM 65
73 75 75 75 69 69 65 63 Mid Day 64
PM 65
M3 - 100th St. and Ditmars Blvd.
AM 64
71 74 74 74 68 68 64 62 Mid Day 66
PM 66
M5 - Ditmars Blvd. and 81st St. at Marine Terminal Rd.
AM 67
62 62 61 62 56 56 53 51 Mid Day 67
PM 64
Note: Shading indicates time periods when noise from construction equipment expected to exceed background level by 10 dBA or more. Table from 2014 EA
December 2015 Chapter 5 – Environmental Consequences 5-60
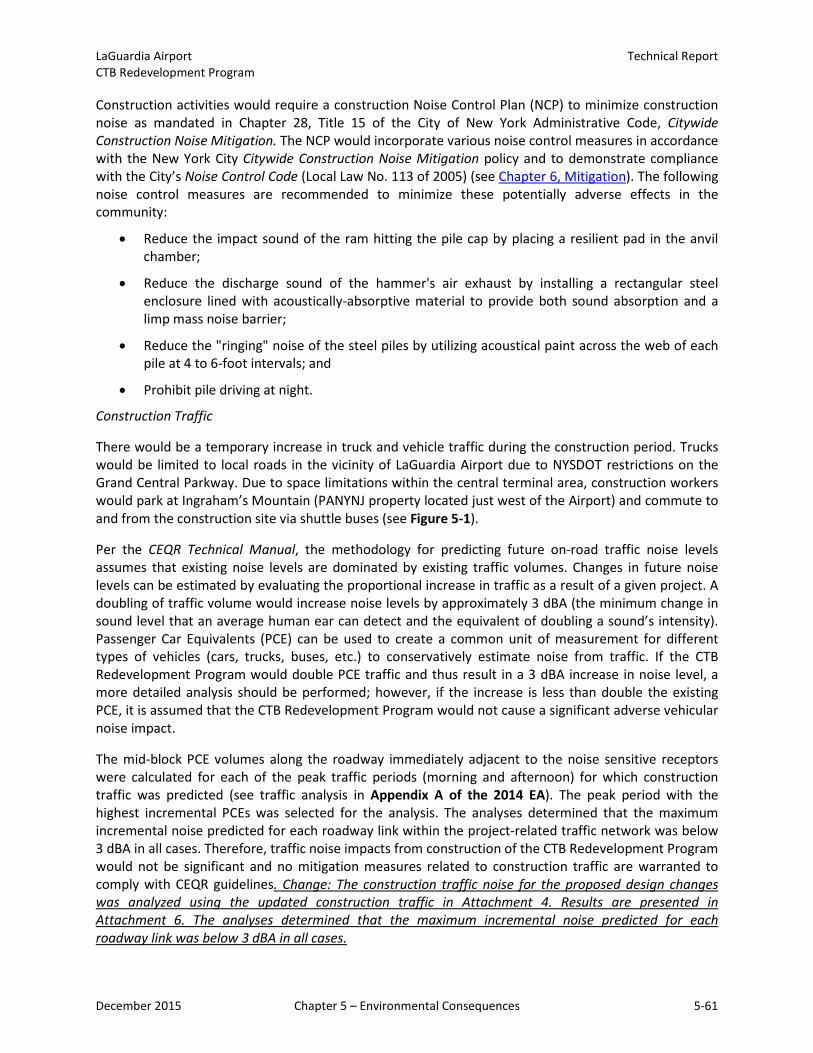
LaGuardia Airport Technical Report CTB Redevelopment Program
Construction activities would require a construction Noise Control Plan (NCP) to minimize construction noise as mandated in Chapter 28, Title 15 of the City of New York Administrative Code, Citywide Construction Noise Mitigation. The NCP would incorporate various noise control measures in accordance with the New York City Citywide Construction Noise Mitigation policy and to demonstrate compliance with the City’s Noise Control Code (Local Law No. 113 of 2005) (see Chapter 6, Mitigation). The following noise control measures are recommended to minimize these potentially adverse effects in the community:
• Reduce the impact sound of the ram hitting the pile cap by placing a resilient pad in the anvil chamber;
• Reduce the discharge sound of the hammer's air exhaust by installing a rectangular steel enclosure lined with acoustically-absorptive material to provide both sound absorption and a limp mass noise barrier;
• Reduce the "ringing" noise of the steel piles by utilizing acoustical paint across the web of each pile at 4 to 6-foot intervals; and
• Prohibit pile driving at night.
Construction Traffic
There would be a temporary increase in truck and vehicle traffic during the construction period. Trucks would be limited to local roads in the vicinity of LaGuardia Airport due to NYSDOT restrictions on the Grand Central Parkway. Due to space limitations within the central terminal area, construction workers would park at Ingraham’s Mountain (PANYNJ property located just west of the Airport) and commute to and from the construction site via shuttle buses (see Figure 5-1).
Per the CEQR Technical Manual, the methodology for predicting future on-road traffic noise levels assumes that existing noise levels are dominated by existing traffic volumes. Changes in future noise levels can be estimated by evaluating the proportional increase in traffic as a result of a given project. A doubling of traffic volume would increase noise levels by approximately 3 dBA (the minimum change in sound level that an average human ear can detect and the equivalent of doubling a sound’s intensity). Passenger Car Equivalents (PCE) can be used to create a common unit of measurement for different types of vehicles (cars, trucks, buses, etc.) to conservatively estimate noise from traffic. If the CTB Redevelopment Program would double PCE traffic and thus result in a 3 dBA increase in noise level, a more detailed analysis should be performed; however, if the increase is less than double the existing PCE, it is assumed that the CTB Redevelopment Program would not cause a significant adverse vehicular noise impact.
The mid-block PCE volumes along the roadway immediately adjacent to the noise sensitive receptors were calculated for each of the peak traffic periods (morning and afternoon) for which construction traffic was predicted (see traffic analysis in Appendix A of the 2014 EA). The peak period with the highest incremental PCEs was selected for the analysis. The analyses determined that the maximum incremental noise predicted for each roadway link within the project-related traffic network was below 3 dBA in all cases. Therefore, traffic noise impacts from construction of the CTB Redevelopment Program would not be significant and no mitigation measures related to construction traffic are warranted to comply with CEQR guidelines. Change: The construction traffic noise for the proposed design changes was analyzed using the updated construction traffic in Attachment 4. Results are presented in Attachment 6. The analyses determined that the maximum incremental noise predicted for each roadway link was below 3 dBA in all cases.
December 2015 Chapter 5 – Environmental Consequences 5-61
LaGuardia Airport Technical Report CTB Redevelopment Program
5.2.6.1.2 Operations
The CTB Redevelopment Program would accommodate 34 MAP compared to 30.1 MAP for the No-Action Alternative—an incremental increase in passenger demand of 3.9 MAP. As a result, noise may increase due to changes in the aircraft fleet mix and increased vehicular traffic. All other operations at the Airport would remain similar to existing conditions and have no impact on noise.
Since there would be no changes to the operational conditions compared to the previously approved design (2014) (i.e., no increase in passenger demand, no change in aircraft fleet mix, and only minor changes to the on-Airport roadway design), no further analysis of aircraft noise or future operational on-road vehicle noise was performed.
Aircraft Noise
An aircraft noise analysis was performed using the FAA-required INM, Version 7.0d. The noise contours calculated by the INM for an airport are a function of several factors including the number of aircraft operations during the period evaluated, the types of aircraft flown, the time of day when they are flown, how frequently each runway is used for arrivals and departures, the routes of flight used to and from the runways, and the operating weight of the aircraft. The noise analysis in Appendix E of the 2014 EA describes the methodology, assumptions, and the detailed results of the aircraft noise analysis that was conducted to assess the effects that the CTB Redevelopment Program would have on noise exposure in the communities surrounding LaGuardia Airport. The existing noise exposure contours were based on sample radar data compiled from April 2012 through March 2013, as it was the latest data available at the time of analysis.59 60 The data reflect the most recent arrival and departure procedures to and from the Airport, including the TNNIS climb departure procedure recently implemented by FAA.
The INM produces day-night average sound level (DNL) noise contours. The DNL metric represents the cumulative noise level in an area over a 24-hour period. Noise produced by all aircraft events during a 24-hour period are added together, with an extra 10 dB weight added to nighttime operations (between 10:00 PM and 6:59 AM). If any noise sensitive land uses within the DNL 65 dB noise contour would experience increases in noise of DNL 1.5 dB or greater as a result of the CTB Redevelopment Program, a significant noise impact would occur.
Aircraft operations (takeoffs and landings) are not expected to change with, or without, the CTB Redevelopment Program. As previously discussed, slot-controls are in place to help the FAA manage congestion at LaGuardia Airport by limiting the number of takeoffs and landings that may occur per hour. Instead of adding flights, forecast passenger demand would be accommodated through the use of larger aircraft with increased passenger loads (“upgauging”). The existing runway configuration, arrival or departure procedures, and runway use percentages would remain the same. Therefore, the aircraft noise analysis focuses specifically on the aircraft fleet mix change.
DNL noise exposure contours were prepared for the opening year (2021) and the horizon year (2030) for the CTB Redevelopment Program and No-Action Alternatives (see Attachment 1 of Appendix E of the 2014 EA). The larger aircraft accommodated by the CTB Redevelopment Program would result in an
59 Radar data from PANYNJ’s Airport Noise and Operations Management System (ANOMS). 60 The baseline year (April 2012 to March 2013) ensures the results incorporate the most recent flight procedures
implemented for the Airport, but differs from the Vehicle Traffic base year of 2012, which was based on data collected in the field that year.
December 2015 Chapter 5 – Environmental Consequences 5-62
LaGuardia Airport Technical Report CTB Redevelopment Program
increase of 0.2 square miles of the DNL 65-70 dB contour between the No-Action and CTB Redevelopment Program scenarios for 2030 (see Figure 5-12). The DNL 65 dB contour for the CTB Redevelopment Program, compared to the No-Action contour, increases only slightly along the primary approach and departure corridors. Based on this analysis, no areas within the DNL 65 dB contour beyond Airport property would experience an increase in noise of DNL 1.5 dB or greater as a result of the CTB Redevelopment Program.
The CTB Redevelopment Program would result in an increase to the number of noise-sensitive land uses located within the DNL 65 dB noise contour (see Appendix E of the 2014 EA, Attachment 1, Table 9); however, there would not be a 1.5 dB increase within the DNL 65 dB noise contour (FAA’s threshold of significance) over noise-sensitive land uses (see Section 5.13 and Appendix E of the 2014 EA). The Monsignor McClancy Memorial High School, Our Lady of Fatima School, and Korean Church of Queens, all located within the Jackson Heights and East Elmhurst neighborhoods, would experience a noise increase of 0.5 dB, while all other noise-sensitive land uses would experience an increase of less than 0.5 dB.
• Although not required since the noise increase would be less than 1.5 dB, additional analysis todetermine the extent of the potential increase in noise was conducted for disclosure purposesonly.
• A review of areas of noise increase less than 1.5 dB within the DNL 65 dB contour for the CTBRedevelopment Program indicates that there are no areas off-Airport property that wouldexperience a noise increase of 1.0 dB or more.
• A review of areas of noise increase less than 1.0 dB within the DNL 65 dB contour for the CTBRedevelopment Program indicates a 0.5 dB increase would occur near the south side of theAirport. As shown in Figure 5-13, the area of noise increase would occur over neighborhoodswithin the Jackson Heights and Steinway communities, between the Brooklyn QueensExpressway and the approach end of Runway 4. The area of noise increase occurs overresidential areas as well as other types of land uses and includes one place of worship and twoschools. No libraries, hospitals, or nursing homes have been identified within the area of noiseincrease.
• No other communities or neighborhoods within the DNL 65 dB contour located north, east, orwest of LaGuardia Airport would be expected to experience a noise increase of 0.5 dB or more.
Per FAA guidance, noise increases below 1.5 dB within the DNL 65 dB contour are not considered significant effects; therefore, the CTB Redevelopment Program is not expected to result in any significant impacts in noise-sensitive land uses around the Airport.
Traffic Noise
Operational traffic noise impacts were predicted based on PCE comparisons using the same method of proportionate traffic increases estimating future sound levels as construction traffic (see Section 5.13.1.1). The CTB Redevelopment Program scenario assumes the proposed roadway improvements are made and an additional 3.9 MAP utilize the Airport (beyond the background traffic increase assumed under the No-Action scenario). Analysis of future traffic conditions in the year 2030 under the Proposed Action conditions was performed based on the traffic analysis for forecast passenger demand (see Appendix A of the 2014 EA).
December 2015 Chapter 5 – Environmental Consequences 5-63
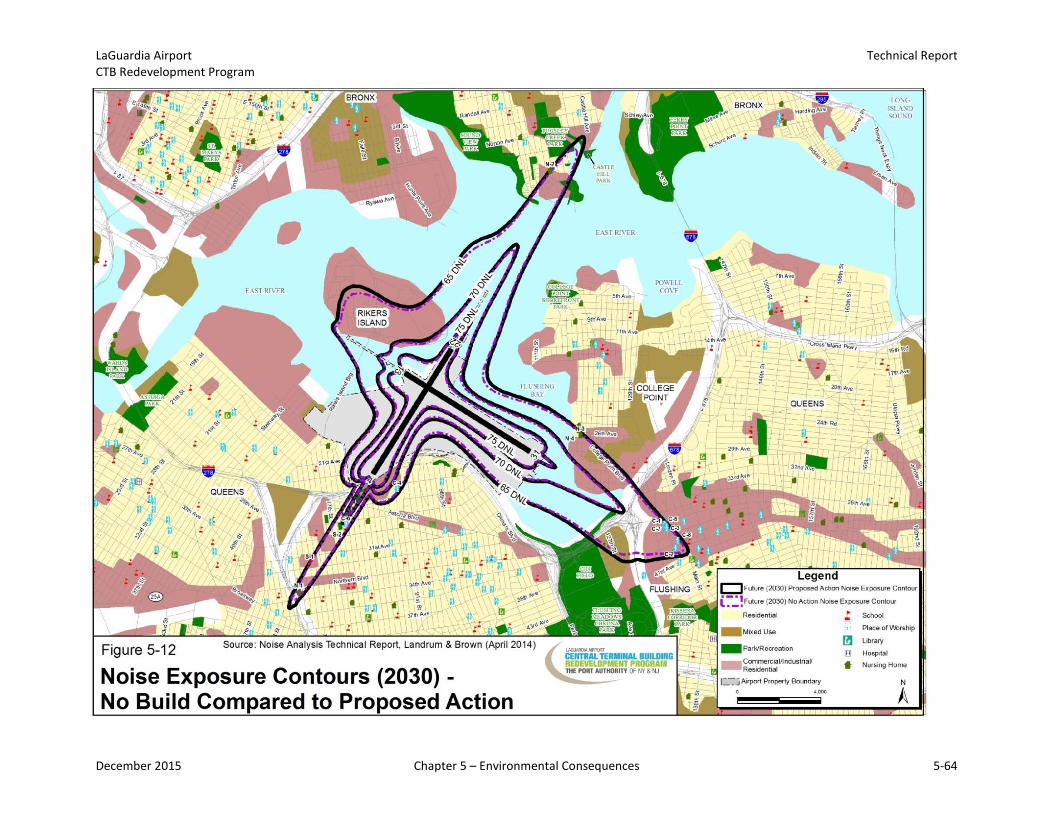
LaGuardia Airport Technical Report CTB Redevelopment Program
Figure 5-12. Noise Exposure Contours (2030) – No Build Compared to Proposed Action
December 2015 Chapter 5 – Environmental Consequences 5-64
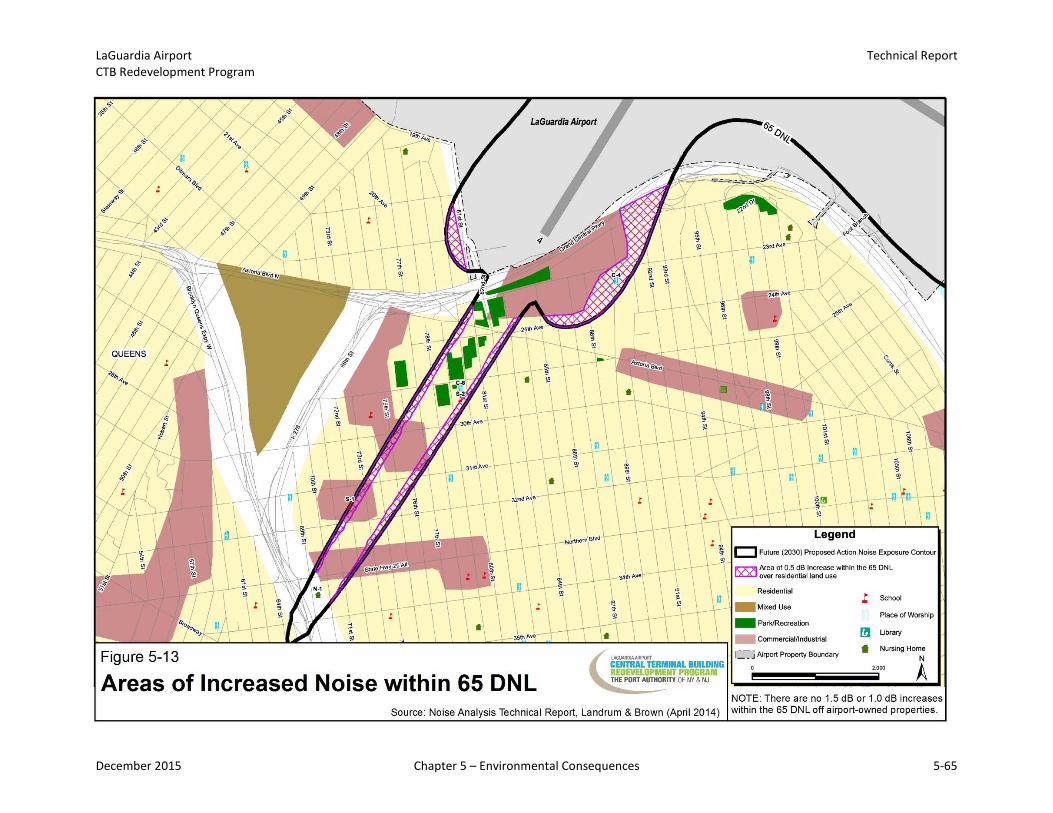
LaGuardia Airport Technical Report CTB Redevelopment Program
Figure 5-13. Areas of Increased Noise within 65 DNL
December 2015 Chapter 5 – Environmental Consequences 5-65
LaGuardia Airport Technical Report CTB Redevelopment Program
Assuming completion of the CTB Redevelopment Program and realization of the full forecasted passenger levels, the peak hour noise within the project traffic network during operations in the year 2030 is not predicted to be greater than 3 dBA for any study intersection. Therefore, traffic noise impacts from the CTB Redevelopment Program under the operational condition would not be significant. No mitigation measures related to operational traffic are warranted to comply with CEQR guidelines.
5.2.6.1.3 Summary of Impacts
The area around LaGuardia Airport has high existing background noise levels. With the exception of pile-driving activities during the first few years of construction, the noise generated during construction activities would not be discernible from the normal background noise levels in the area. Mitigation measures would be implemented and a noise control plan drafted to minimize the potential for adverse effects on the community. The temporary increase in vehicular traffic due to construction traffic would not result in noise impacts to residential or other sensitive land uses due to the distance between the construction site and the receptor. After construction, noise levels from aircraft and vehicular traffic would be expected to increase; however, the noise increase is predicted to be well below the 1.5 dB threshold established by the FAA.
5.2.6.2 No-Action Alternative
Under the No-Action Alternative, PANYNJ would renovate the existing buildings in their current locations, investing up to $3 billion to modernize the entire facility. Unlike the CTB Redevelopment Program, the scope of construction would not include roadway improvements or require pile-driving activities; therefore, it can be assumed that the construction-related noise levels would be consistent with background noise levels and that no adverse noise impacts would occur.
Without the CTB Redevelopment Program, forecasted passengers at LaGuardia Airport would still increase to 30.1 MAP by 2030—a 6.5 MAP increase over the 2010 baseline condition. That increase in demand would be achieved by a modest increase in the number of aircraft operations at the Airport and through upgauging of the fleet mix (although to a lesser degree than the CTB Redevelopment Program) resulting in a small increase in the size of the noise contours even without the CTB Redevelopment Program. In addition, passenger vehicle traffic would increase – although the increment would not be noticeable above background growth over that same time period, as described in Section 5.1. Therefore, though there would be an increase in noise in and around LaGuardia Airport under the No-Action Alternative, according to federal guidance, the increase would not result in a significant noise impact to sensitive receptors.
5.2.7 Construction Impacts
This section discusses the potential for adverse impacts on the environment due to construction. These are impacts caused by and confined to the construction period. Consequently, they are temporary in nature, terminating with the completion of construction activities and restoration of the project site. Many of the specific types of impacts that could occur and the permits or approvals that may be required are covered in the descriptions of the other appropriate impact categories, i.e., traffic, air quality, noise, etc. To avoid repeating information included in the other sections of this chapter, this section summarizes, for each environmental consequence, the impacts related specifically to the construction phase of the CTB Redevelopment Program as well as the corresponding mitigation measures that could be taken to avoid or minimize environmental harm. Construction-period mitigation measures, if necessary, are also discussed in Chapter 6, Mitigation.
December 2015 Chapter 5 – Environmental Consequences 5-66
LaGuardia Airport Technical Report CTB Redevelopment Program
The CTB Redevelopment Program is divided into multiple construction phases that would take approximately eight years to complete, beginning in 2014 and continuing through 2021. Change: The construction schedule and phasing for the proposed design changes has been reduced to 68 months, beginning in 2016 and continuing until the end of 2021. More detailed information about the construction phase activities is provided in Appendix F: Supporting Data of the 2014 EA. The CTB Redevelopment Program is described in Section 3.1, Proposed Action Alternative. The descriptions of the proposed project, the work to be performed, and the estimated quantities provide the foundation for assessing the following construction impacts:
• Construction-related traffic on local roadways • Air pollution, including engine exhaust emissions and fugitive dust • Habitat degradation and loss, including tree removal and replacement • Impacts on historic resources, including buildings and a potential archaeological site • Demolition and construction waste, including hazardous materials • Noise pollution, including construction-related traffic and equipment noise • Water pollution, including soil erosion and sedimentation
If the CTB Redevelopment Program is implemented, the project specifications would follow the provisions of FAA Advisory Circular 150/5370-10F, Standards for Specifying Construction of Airports. This Advisory Circular (AC) outlines the FAA’s guidelines and specifications for materials and methods used in the construction of airports. The use of this AC is mandatory for all projects funded with federal grant monies through the Airport Improvement Program (AIP) or with revenue from the Passenger Facility Charge (PFC) Program.61 In addition, as referenced throughout this section, the CTB Redevelopment Program would comply with PANYNJ Sustainable Design Guidelines to the degree practicable.62 These guidelines, which include Sustainable Building Guidelines (Part 1, for projects inside the building envelope) and Sustainable Infrastructure Guidelines (Part 2, for projects outside the building envelope), aim to optimize infrastructure project design through sustainable engineering practice, with the goal of cost savings, extending the lifecycle of a project and, in some cases, a reduction in operational costs.
5.2.7.1 Traffic and Transportation
During the construction period, temporary traffic impacts would be limited to increased traffic volumes on neighborhood roads, which may cause or contribute to increased traffic congestion and increased travel times for drivers—most of which would be expected to occur during off-peak times of the day. There are no proposed road closures, traffic detours, or other foreseeable disruptions of local surface
61 See Grant Assurance No. 34, “Policies, Standards, and Specifications,” and PFC Assurance No. 9, “Standards and Specifications.”
62 On July 13, 2006, the PANYNJ issued Administrative Instruction 45-2 (AI 45-2) “to reduce adverse environmental impacts of the design, construction, operation and maintenance and occupancy or leasing of new or substantially renovated buildings and facilities, reconstruction projects, and programs.” AI 45-2 referenced creation of sustainable design guidelines and an accompanying compliance framework, which were incorporated into the Sustainable Design Guidelines (formerly the Sustainable Design Project Manual, August 2007).
December 2015 Chapter 5 – Environmental Consequences 5-67
LaGuardia Airport Technical Report CTB Redevelopment Program
transportation patterns in the community surrounding the Airport. As such, there would be little to no impact to the traveling public and access by emergency vehicles would not be impeded. The Port Authority Police Department would regularly coordinate with the New York City Police and Fire Departments during construction. Traffic impacts during the construction-period are assessed in Section 5.1, Traffic and Transportation, and in Appendix A: Transportation of the 2014 EA.
Change: Traffic impacts during construction for the proposed design changes are assessed in Attachment 1: Updated Traffic Analysis for Construction Conditions.
Construction-induced traffic impacts cannot be avoided but the effects would be minimized using temporary measures to reduce delays such as adjusting signal timing at the study intersections, as discussed below.
Construction-Related Vehicles on Local Roadways
Construction activities would generate additional traffic on the local roadways. The incremental increase in traffic volumes associated with the CTB Redevelopment Program would consist of construction-related vehicles. Construction-related vehicles include both construction workers traveling to and from the designated contractor parking area via passenger vehicles and shuttle buses, as well as trucks hauling material and equipment to and from the construction site via established New York City truck routes. The designated contractor parking area is a site to be developed on Airport property along the north side of 19th Avenue between 45th Street and Hazen Street/Riker’s Island Bridge.63 Workers would be transported to and from the contractor parking area and the construction site using shuttle buses. As shown in Figure 5-1, the shuttle buses would use local roadways (e.g., 45th Street and 19th Avenue) to connect to a programmed construction-only access driveway (19th Avenue and 81st Street); the remainder of the shuttle bus route would utilize on-Airport roadways (e.g., Bowery Bay Boulevard, Marine Terminal Road, and Runway Drive/LaGuardia Road). Given the proposed construction shifts (7:00 am to 3:00 pm and 3:00 pm to 11:00 pm), worker trips would be concentrated during off-peak hours and would not represent a substantial increment during peak travel periods in the vicinity of the Airport.
Change: For a 5.5 month period centered around the peak quarter (second quarter of 2017), all construction activities are expected to take place during three construction shifts. The first shift would occur from approximately 6:00 AM to approximately 2:00 PM and comprise approximately 40 percent of the total construction personnel workforce. The second shift would occur from approximately 7:00 AM to approximately 3:00 PM and comprise approximately 40 percent of the total construction personnel workforce. The third shift would occur from approximately 10:00 PM to approximately 6:00 AM and comprise approximately 20 percent of the total construction personnel workforce. The peak hours for worker-generated vehicle trips (6:00 to 7:00 AM and 3:00 to 4:00 PM) would not overlap with the weekday morning and afternoon peak hours for traffic on the local street network (i.e., 7:30 to 8:30 AM and 4:00 to 5:00 PM) and would overlap by 15 minutes with the weekday morning peak hour of the Airport (i.e., 6:45 to 7:45 AM). Outside of the peak period, workers would arrive in two shifts: 6:00AM to 2:00PM and 7:00AM to 3:00PM.
63 It is anticipated that daily parking for construction personnel would be accommodated at the Ingraham’s Mountain site—a PANYNJ-owned parcel that would be developed for contractor parking associated with the LaGuardia Airport RSA Enhancements project, which is separate from and expected to precede the CTB Redevelopment Program.
December 2015 Chapter 5 – Environmental Consequences 5-68
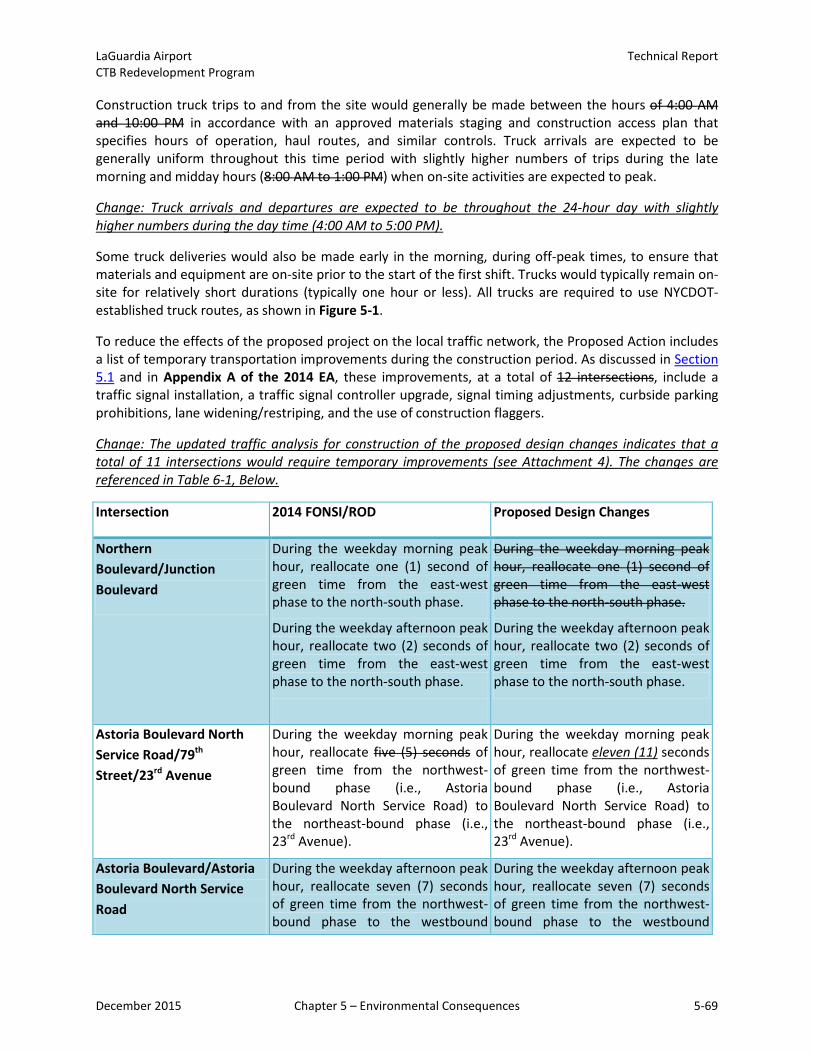
LaGuardia Airport Technical Report CTB Redevelopment Program
Construction truck trips to and from the site would generally be made between the hours of 4:00 AM and 10:00 PM in accordance with an approved materials staging and construction access plan that specifies hours of operation, haul routes, and similar controls. Truck arrivals are expected to be generally uniform throughout this time period with slightly higher numbers of trips during the late morning and midday hours (8:00 AM to 1:00 PM) when on-site activities are expected to peak.
Change: Truck arrivals and departures are expected to be throughout the 24-hour day with slightly higher numbers during the day time (4:00 AM to 5:00 PM).
Some truck deliveries would also be made early in the morning, during off-peak times, to ensure that materials and equipment are on-site prior to the start of the first shift. Trucks would typically remain on-site for relatively short durations (typically one hour or less). All trucks are required to use NYCDOT-established truck routes, as shown in Figure 5-1.
To reduce the effects of the proposed project on the local traffic network, the Proposed Action includes a list of temporary transportation improvements during the construction period. As discussed in Section 5.1 and in Appendix A of the 2014 EA, these improvements, at a total of 12 intersections, include a traffic signal installation, a traffic signal controller upgrade, signal timing adjustments, curbside parking prohibitions, lane widening/restriping, and the use of construction flaggers.
Change: The updated traffic analysis for construction of the proposed design changes indicates that a total of 11 intersections would require temporary improvements (see Attachment 4). The changes are referenced in Table 6-1, Below.
Intersection 2014 FONSI/ROD Proposed Design Changes
Northern Boulevard/Junction Boulevard
During the weekday morning peak hour, reallocate one (1) second of green time from the east-west phase to the north-south phase.
During the weekday afternoon peak hour, reallocate two (2) seconds of green time from the east-west phase to the north-south phase.
During the weekday morning peak hour, reallocate one (1) second of green time from the east-west phase to the north-south phase.
During the weekday afternoon peak hour, reallocate two (2) seconds of green time from the east-west phase to the north-south phase.
Astoria Boulevard North Service Road/79th Street/23rd Avenue
During the weekday morning peak hour, reallocate five (5) seconds of green time from the northwest-bound phase (i.e., Astoria Boulevard North Service Road) to the northeast-bound phase (i.e., 23rd Avenue).
During the weekday morning peak hour, reallocate eleven (11) seconds of green time from the northwest-bound phase (i.e., Astoria Boulevard North Service Road) to the northeast-bound phase (i.e., 23rd Avenue).
Astoria Boulevard/Astoria Boulevard North Service Road
During the weekday afternoon peak hour, reallocate seven (7) seconds of green time from the northwest-bound phase to the westbound
During the weekday afternoon peak hour, reallocate seven (7) seconds of green time from the northwest-bound phase to the westbound
December 2015 Chapter 5 – Environmental Consequences 5-69
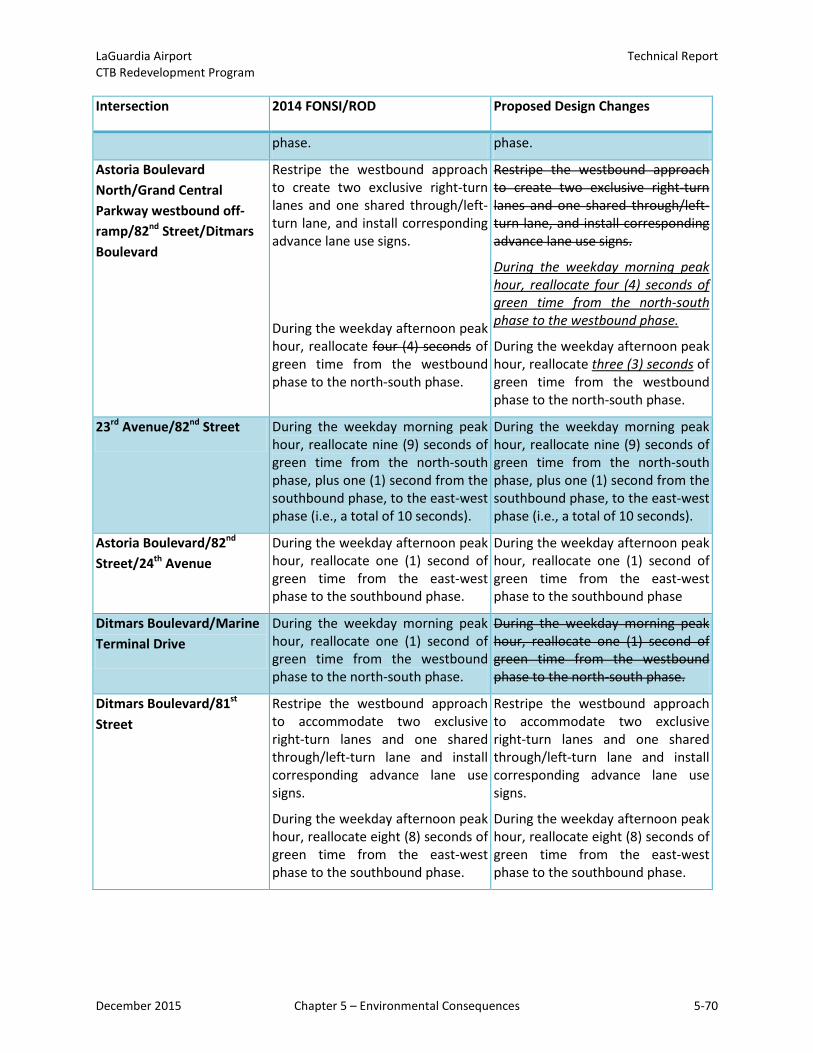
LaGuardia Airport Technical Report CTB Redevelopment Program
Intersection 2014 FONSI/ROD Proposed Design Changes
phase. phase.
Astoria Boulevard North/Grand Central Parkway westbound off-ramp/82nd Street/Ditmars Boulevard
Restripe the westbound approach to create two exclusive right-turn lanes and one shared through/left-turn lane, and install corresponding advance lane use signs.
During the weekday afternoon peak hour, reallocate four (4) seconds of green time from the westbound phase to the north-south phase.
Restripe the westbound approach to create two exclusive right-turn lanes and one shared through/left-turn lane, and install corresponding advance lane use signs.
During the weekday morning peak hour, reallocate four (4) seconds of green time from the north-south phase to the westbound phase.
During the weekday afternoon peak hour, reallocate three (3) seconds of green time from the westbound phase to the north-south phase.
23rd Avenue/82nd Street During the weekday morning peak hour, reallocate nine (9) seconds of green time from the north-south phase, plus one (1) second from the southbound phase, to the east-west phase (i.e., a total of 10 seconds).
During the weekday morning peak hour, reallocate nine (9) seconds of green time from the north-south phase, plus one (1) second from the southbound phase, to the east-west phase (i.e., a total of 10 seconds).
Astoria Boulevard/82nd Street/24th Avenue
During the weekday afternoon peak hour, reallocate one (1) second of green time from the east-west phase to the southbound phase.
During the weekday afternoon peak hour, reallocate one (1) second of green time from the east-west phase to the southbound phase
Ditmars Boulevard/Marine Terminal Drive
During the weekday morning peak hour, reallocate one (1) second of green time from the westbound phase to the north-south phase.
During the weekday morning peak hour, reallocate one (1) second of green time from the westbound phase to the north-south phase.
Ditmars Boulevard/81st Street
Restripe the westbound approach to accommodate two exclusive right-turn lanes and one shared through/left-turn lane and install corresponding advance lane use signs.
During the weekday afternoon peak hour, reallocate eight (8) seconds of green time from the east-west phase to the southbound phase.
Restripe the westbound approach to accommodate two exclusive right-turn lanes and one shared through/left-turn lane and install corresponding advance lane use signs.
During the weekday afternoon peak hour, reallocate eight (8) seconds of green time from the east-west phase to the southbound phase.
December 2015 Chapter 5 – Environmental Consequences 5-70
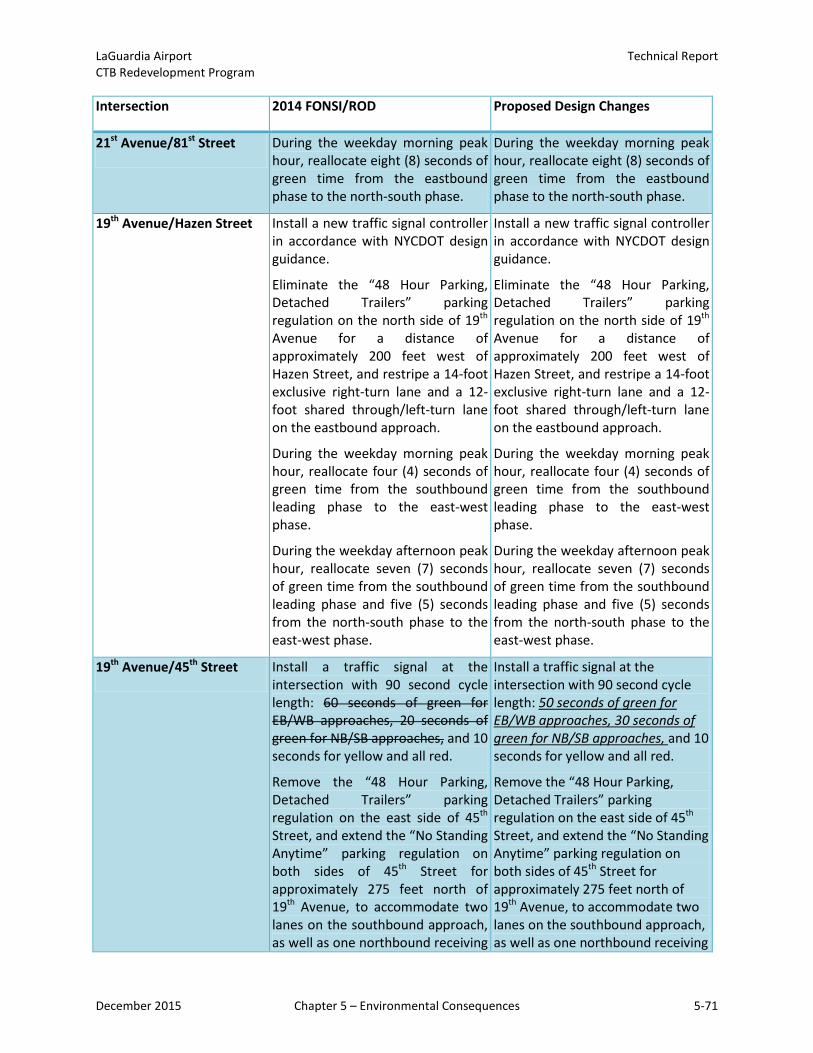
LaGuardia Airport Technical Report CTB Redevelopment Program
Intersection 2014 FONSI/ROD Proposed Design Changes
21st Avenue/81st Street During the weekday morning peak hour, reallocate eight (8) seconds of green time from the eastbound phase to the north-south phase.
During the weekday morning peak hour, reallocate eight (8) seconds of green time from the eastbound phase to the north-south phase.
19th Avenue/Hazen Street Install a new traffic signal controller in accordance with NYCDOT design guidance.
Eliminate the “48 Hour Parking, Detached Trailers” parking regulation on the north side of 19th Avenue for a distance of approximately 200 feet west of Hazen Street, and restripe a 14-foot exclusive right-turn lane and a 12-foot shared through/left-turn lane on the eastbound approach.
During the weekday morning peak hour, reallocate four (4) seconds of green time from the southbound leading phase to the east-west phase.
During the weekday afternoon peak hour, reallocate seven (7) seconds of green time from the southbound leading phase and five (5) seconds from the north-south phase to the east-west phase.
Install a new traffic signal controller in accordance with NYCDOT design guidance.
Eliminate the “48 Hour Parking, Detached Trailers” parking regulation on the north side of 19th Avenue for a distance of approximately 200 feet west of Hazen Street, and restripe a 14-foot exclusive right-turn lane and a 12-foot shared through/left-turn lane on the eastbound approach.
During the weekday morning peak hour, reallocate four (4) seconds of green time from the southbound leading phase to the east-west phase.
During the weekday afternoon peak hour, reallocate seven (7) seconds of green time from the southbound leading phase and five (5) seconds from the north-south phase to the east-west phase.
19th Avenue/45th Street Install a traffic signal at the intersection with 90 second cycle length: 60 seconds of green for EB/WB approaches, 20 seconds of green for NB/SB approaches, and 10 seconds for yellow and all red.
Remove the “48 Hour Parking, Detached Trailers” parking regulation on the east side of 45th Street, and extend the “No Standing Anytime” parking regulation on both sides of 45th Street for approximately 275 feet north of 19th Avenue, to accommodate two lanes on the southbound approach, as well as one northbound receiving
Install a traffic signal at the intersection with 90 second cycle length: 50 seconds of green for EB/WB approaches, 30 seconds of green for NB/SB approaches, and 10 seconds for yellow and all red.
Remove the “48 Hour Parking, Detached Trailers” parking regulation on the east side of 45th Street, and extend the “No Standing Anytime” parking regulation on both sides of 45th Street for approximately 275 feet north of 19th Avenue, to accommodate two lanes on the southbound approach, as well as one northbound receiving
December 2015 Chapter 5 – Environmental Consequences 5-71
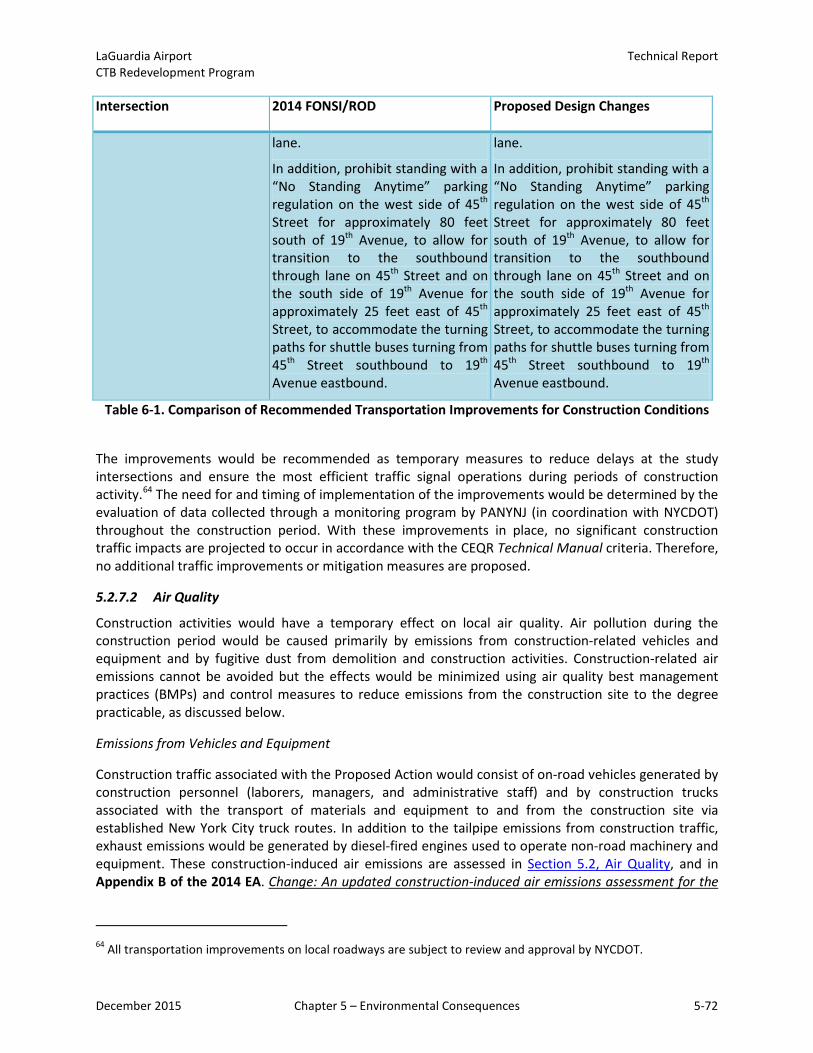
LaGuardia Airport Technical Report CTB Redevelopment Program
Intersection 2014 FONSI/ROD Proposed Design Changes
lane.
In addition, prohibit standing with a “No Standing Anytime” parking regulation on the west side of 45th Street for approximately 80 feet south of 19th Avenue, to allow for transition to the southbound through lane on 45th Street and on the south side of 19th Avenue for approximately 25 feet east of 45th Street, to accommodate the turning paths for shuttle buses turning from 45th Street southbound to 19th Avenue eastbound.
Table 6-1. Comparison of Recommended Transportation Improvements for Construction Conditions
The improvements would be recommended as temporary measures to reduce delays at the study intersections and ensure the most efficient traffic signal operations during periods of construction activity.64 The need for and timing of implementation of the improvements would be determined by the evaluation of data collected through a monitoring program by PANYNJ (in coordination with NYCDOT) throughout the construction period. With these improvements in place, no significant construction traffic impacts are projected to occur in accordance with the CEQR Technical Manual criteria. Therefore, no additional traffic improvements or mitigation measures are proposed.
5.2.7.2 Air Quality
Construction activities would have a temporary effect on local air quality. Air pollution during the construction period would be caused primarily by emissions from construction-related vehicles and equipment and by fugitive dust from demolition and construction activities. Construction-related air emissions cannot be avoided but the effects would be minimized using air quality best management practices (BMPs) and control measures to reduce emissions from the construction site to the degree practicable, as discussed below.
Emissions from Vehicles and Equipment
Construction traffic associated with the Proposed Action would consist of on-road vehicles generated by construction personnel (laborers, managers, and administrative staff) and by construction trucks associated with the transport of materials and equipment to and from the construction site via established New York City truck routes. In addition to the tailpipe emissions from construction traffic, exhaust emissions would be generated by diesel-fired engines used to operate non-road machinery and equipment. These construction-induced air emissions are assessed in Section 5.2, Air Quality, and in Appendix B of the 2014 EA. Change: An updated construction-induced air emissions assessment for the
64 All transportation improvements on local roadways are subject to review and approval by NYCDOT.
December 2015 Chapter 5 – Environmental Consequences 5-72
LaGuardia Airport Technical Report CTB Redevelopment Program
proposed design changes can be found in Attachments 5 and 8. Emissions remain below de minimis levels.
Emissions from construction vehicles and equipment would be reduced through the use of ultra-low sulfur diesel fuel, by requiring that heavy-duty equipment be retrofitted with best available technology (BAT) devices targeted primarily for particulate matter and secondarily toward the reduction of nitrogen oxides (NOX), and by minimizing the use of diesel-powered generators when electric power is available at the site. While the air quality analysis demonstrated that emissions from construction vehicles and equipment would not exceed any applicable standard, PANYNJ’s Sustainable Infrastructure Guidelines65 contain additional emission reduction strategies that could be implemented, if necessary. For example, trade contractors could be required to submit and comply with an Engine Idling Control Plan that requires operators to turn engines off after a specified period of non-activity.
Fugitive Dust
Construction is a source of dust emissions that could have an impact on air quality. “Dust” is particulate matter (PM), solid particles composed mainly of soil elements. “Fugitive” dust is small airborne PM that becomes suspended in the air and transported by the wind. Building demolition and construction activities which would produce fugitive dust include: land clearing, grading, and excavation with heavy equipment; truck travel into and out of the work area; aggregate storage piles; and loading and unloading demolition debris and building materials.
A wide array of BMPs and control measures are available to help prevent or reduce fugitive dust emissions from construction sites. These generally involve watering exposed soil surfaces, covering trucks transporting dust-producing material entering or leaving the project site, reducing construction vehicle speeds on unpaved surfaces, and using windbreaks or source enclosures to minimize wind erosion. Many situations require one or more methods to be used in combination, and several methods may be used to handle the variety of situations.66
The potential for fugitive dust emissions would be greatest during demolition activities, when large concrete structures such as the CTB parking garage are being removed, and during site preparation for the proposed new roadways. Although the exact method or combination of methods for abatement of erosion and emissions has not been determined at this time, at a minimum, contractors would be required to submit a proposed method of erosion and dust control together with a plan for the disposal of waste materials in accordance with FAA’s Standards for Specifying Construction of Airports.67
65 PANYNJ, Sustainable Infrastructure Guidelines, IC-4, Utilize Green Construction Equipment (March 23, 2011). 66At The World Trade Center Memorial site, where dust prevention is an important aspect of construction, multiple
tactics were employed. Stormwater collected in sedimentation tanks at the site is used for controlling fugitive dust. Strategies to minimize pollution include regular sweeping and wetting of dust and dry soils, use of approved sprayed suppression agents, wheel washing in designated truck wash-off areas, as well as wetting and covering of stockpiled materials to prevent erosion, when applicable.
67 FAA, Standards for Specifying Construction of Airports, Item P-156, Temporary Air and Water Pollution, Soil Erosion, and Siltation Control, AC 150-5370-10A (September 30, 2011).
December 2015 Chapter 5 – Environmental Consequences 5-73
LaGuardia Airport Technical Report CTB Redevelopment Program
Additional strategies to minimize air pollution from dust and particulate matter at the construction site are contained in PANYNJ’s Sustainable Infrastructure Guidelines.68 Adherence to the aforementioned BMP and control measures would be expected to effectively reduce air pollution during the construction period. No mitigation measures are proposed.
5.2.7.3 Fish, Wildlife and Plants
Local species of wildlife would be temporarily displaced by earth disturbance and tree removal associated with site preparation such as clearing/grubbing and by earth moving for grading, drainage, etc. After construction, trees would be replaced and landscaped areas would be re-established with shrubs and grasses, thereby allowing displaced wildlife to return. Of the approximately 270 trees located between the Airport and the Grand Central Parkway, it is estimated that approximately 200 would be removed (63 of which would be off Airport property) and that the remaining trees would be avoided and protected. Where NYC Tree Removal cannot be avoided, tree replacement would comply with NYC Rules Governing Tree Replacement.69 No impacts would occur to any NYC Trees without the applicable NYCDPR Construction and Forestry Permit and a mitigation plan approved by NYCDPR. In addition, all new or replacement landscaping would be required to comply with FAA standards and practices for wildlife hazard management.70 For more information, see Section 5.7, Fish, Wildlife and Plants.
5.2.7.4 Hazardous Materials and Solid Waste
Demolition and construction waste would be generated by the CTB Redevelopment Program. The majority of the waste material would result from the demolition of the terminal building, parking garage, hangars, roadways, and other paved areas. Prior to demolition, environmental site assessments would be prepared for each structure to determine the presence of asbestos, lead, PCBs, or other hazardous materials.71 All necessary precautions for the safe removal of hazardous materials and wastes would be coordinated with the appropriate state and local permitting agencies.
All construction waste would be disposed of in accordance with applicable federal, state, and local regulations. Clean construction debris (concrete, asphalt, etc.) may be recycled and used as fill material on the Airport and off-site, as needed, in accordance with present practices. The disposal of demolition and construction debris would be coordinated between PANYNJ, terminal tenants, the construction manager, and licensed waste haulers.
In addition, contaminated soils and/or groundwater may be encountered during excavation and dewatering associated with the installation of utilities, removal of underground storage tanks, and construction of foundations. Construction protocols would be in place to identify and manage the environmental issues that arise due to the discovery of soil and/or groundwater contamination at the construction site.
If hazardous materials are expected to be encountered or are otherwise discovered during construction, PANYNJ would implement appropriate safety procedures and remediation strategies as needed to
68 PANYNJ, Sustainable Infrastructure Guidelines, IC-1, Minimize Pollution from Construction Activity (March 23, 2011).
69 Title 56 of the New York City Rules and Regulations, Chapter 5 entitled “Rules Governing Tree Replacement.” 70 FAA Advisory Circular (AC) 150/520-33C, Hazardous Wildlife Attractants On or Near Airports (December 7, 2012). 71 See PANYNJ, Sustainable Infrastructure Guidelines, Appendix 05-Toxic and/or Hazardous Materials (March 23,
2011).
December 2015 Chapter 5 – Environmental Consequences 5-74
LaGuardia Airport Technical Report CTB Redevelopment Program
protect human health and the environment. The following preventative measures are appropriate for construction activities associated with each of the hazardous materials identified above.
• Asbestos would be removed from existing buildings prior to any demolition or construction work. Removal protocols, established by PANYNJ, the City, and the State would be followed, thereby minimizing potential risks to human health and the environment. These procedures would also address issues of noise and dust control, and thereby protect the public and workers from exposure to hazardous materials. The asbestos waste generated during the abatement process would be disposed of according to state (NYSDEC) regulatory requirements.
• Materials coated with lead-based paint would be removed from the buildings during demolition and the waste would be recycled or disposed of as appropriate. Construction protocols would ensure that dust is minimized and contained. Workers would be provided with protection from lead dust. Local and state permitting and notification would apply to the removal, transportation, recycling, and/or disposal of lead-containing materials.
• PCB-containing ballasts would be incinerated, recycled or disposed of in an approved landfill, subject to local, state and federal regulations. Transformers containing PCBs would be incinerated or recycled at approved facilities, also subject to local, state, and federal regulations. Incineration and recycling are more protective of the environment.
• Mercury-containing lamps would be removed prior to demolition in accordance with federal and state hazardous waste requirements. Removal protocols would ensure that lamps are protected from breakage and that waste lamps handled by qualified waste handlers and transporters are directed to appropriate recycling or disposal facilities. Mercury and lead in elemental form, such as thermostats, thermometers, switches, and solders, would be removed and disposed of or recycled at approved facilities in accordance with federal and state hazardous waste requirements.
• Construction activities may expose contaminated soils and/or groundwater. Soils from excavation would be tested and disposed of either as solid waste or petroleum contaminated soil in accordance with NYSDEC requirements. Groundwater from the dewatering process would also be tested for pollution concentration levels, treated if necessary, and disposed in accordance with NYSDEC requirements.
As discussed in Section 5.9, Hazardous Materials, Pollution Prevention and Solid Waste, adherence to the aforementioned BMPs and control measures would be expected to effectively reduce potential risks to human health and the environment. No additional mitigation measures are proposed.
5.2.7.5 Historic Resources
Demolition activities associated with the CTB Redevelopment Program would have an adverse effect on historic resources, while select earthwork and construction activities might impact an area of potential archaeological sensitivity. For this reason, mitigation measures would be implemented to reduce the effects of the CTB Redevelopment Program on historic resources at the Airport.
Adverse Effects on Historic Properties
As discussed in Section 5.10, Historic, Architectural, Archaeological and Cultural Resources, and Appendix D: Evaluation of Historic Resources of the 2014 EA, demolition of Hangars of 1, 2, and 4
December 2015 Chapter 5 – Environmental Consequences 5-75
LaGuardia Airport Technical Report CTB Redevelopment Program
cannot be avoided; therefore, the adverse effect could be mitigated by recording the NRHP-eligible Hangars 1, 2, 3, 4, and 5, as well as 7, to Level III Historical Architectural Building Survey and Historic American Engineering Record (HABS/HAER) standards of the National Park Service (NPS), which includes photographic documentation and submission into the archives maintained by New York State, developing an interpretive display of the Airport’s history to be prominently placed within a public section of the Airport, and maintaining Hangars 3 and 5 in a state-of-good repair for the foreseeable future. In addition, select excavation and trenching activities within a designated area of archaeological sensitivity (in the vicinity of the proposed West Garage) would be performed in accordance with an archaeological monitoring protocol that requires cultural resource staff to be present during specified construction activities and identifies the procedures to be followed if potentially significant archaeological deposits or features are discovered.
Change: The HABS/HAER documentation of the hangars has been completed and submitted to NPS. Hangars 2 and 4 were demolished in the summer of 2015, in accordance with the MOA. Hangar 1 will be demolished during the fourth quarter of 2019, as reflected in the phasing plans in Attachment 3.
Memorandum of Agreement
As discussed in Chapter 6, Mitigation, the nature and extent of the impacts on Hangars 1, 2, 3, 4, and 5, and the mitigation measures to reduce potential harm, have been documented in a Memorandum of Agreement (MOA) signed by PANYNJ, FAA, and the New York State Office of Parks, Recreation, and Historic Preservation, and concurred on by three Consulting Parties. The MOA is a result of the consultation process pursuant to Section 106 of the NHPA (see Section 5.10). A copy of the signed MOA is included in Appendix D of the 2014 EA. This ensures that mitigation measures will be implemented and demolition and construction activities will be carried out in such a manner as to minimize, to the greatest extent possible, the unavoidable adverse effects of the CTB Redevelopment Program on historic and cultural resources.
5.2.7.6 Noise
Construction activities would have a temporary effect on ambient noise levels. Noise impacts during the construction period would be caused primarily by construction vehicles and equipment operating at the construction site and to a lesser degree by increased traffic on local roads in the vicinity of the Airport. As discussed below, construction-related noise cannot be avoided, but the effects would be reduced and/or minimized to the degree practicable.
Construction Equipment Noise
Construction activities would generate noise levels in excess of those typically found in the project environs. Typical activities (and sources of noise) would include earthmoving (front loaders, backhoes, tractors, graders, pavers, trucks); materials handling (concrete mixers, concrete pumps, cranes); stationary sources (pumps, generators, compressors); impact equipment (pneumatic wrenches, jackhammers, pile drivers); and other miscellaneous activities and pieces of equipment.
Noise from construction activity differs from noise from other major sources for two reasons. First, it is caused by many different types of vehicles and equipment, as described above. Second, the resulting adverse effects are temporary because the individual activities are relatively short-term, in keeping with the construction schedule. In addition, since construction usually occurs during the day, there is minimal potential for sleep interference.
December 2015 Chapter 5 – Environmental Consequences 5-76
LaGuardia Airport Technical Report CTB Redevelopment Program
Construction-related noise levels are assessed in Section 5.13, Noise, and in Appendix E: Noise Technical Report of the 2014 EA.
Change: Attachment 6 presents an updated assessment of noise for the construction of the Proposed design changes.
While the analysis demonstrated that noise from construction vehicles and equipment would not exceed any applicable standard, a Noise Control Plan (NCP) would be prepared to minimize construction noise in accordance with New York City rules72 and to demonstrate compliance with the City’s Noise Code.73 To minimize construction noise, the Noise Code mandates that all construction be conducted in accordance with a noise mitigation plan that specifies the construction activities to be performed and when, lists the different types of construction equipment to be used at the site, and identifies the noise reduction method(s) for reducing the adverse impact of construction noise on the surrounding community. The Noise Code also establishes authorized work hours, sets standards for noise levels created by handling containers and construction material on public streets, and sets forth rules for mitigating noise from different categories of equipment.
The noisiest construction task would be pile driving. A pile driver is a mechanical device used to drive piles into soil to provide foundation support for buildings or other structures. The impact of the hammer hitting the pile creates a loud “ringing” sound. Because pile driving would be occurring during the early phases of construction, the following noise control measures are recommended:
• Reduce the impact sound of the ram hitting the pile by placing a resilient pad in the anvil chamber;
• Reduce the discharge sound of the hammer’s air exhaust by installing a rectangular steel enclosure lined with acoustically-absorptive material to provide both absorption and a limp mass noise barrier;
• Reduce the “ringing” noise of the steel piles by utilizing acoustical paint across the web of each pile at 4- to 6-foot intervals; and
• Prohibit pile driving at night.
Federal, state, and local rules and regulations for minimizing noise from construction vehicles and equipment provide adequate assurance that the temporary and unavoidable noise levels during construction would be less than significant. Additional strategies to minimize noise from the construction site are contained in PANYNJ’s Sustainable Infrastructure Guidelines.74 Adherence to these guidelines would be expected to further reduce noise pollution to the degree practicable.
Traffic Noise
Construction-related traffic noise along local roads in the vicinity of the Airport is discussed in Section 5.13, Noise, and in Appendix E: Noise Technical Report of the 2014 EA. The results of the analysis
72 Title 15 Rules of the City of New York–RCNY Chapter 28, Citywide Construction Noise Mitigation. 73 City of New York Local Law No. 113 of 2005—Noise Control Code. 74 PANYNJ, Sustainable Infrastructure Guidelines, IC-5, Reduce Noise and Vibration During Construction (March 23,
2011).
December 2015 Chapter 5 – Environmental Consequences 5-77
LaGuardia Airport Technical Report CTB Redevelopment Program
indicate that the maximum incremental increase in noise predicted for each roadway link is below screening thresholds per the CEQR Technical Manual. No mitigation measures are proposed.
Change: Attachment 6 demonstrates that the maximum incremental increase in noise predicted for each roadway link is below the screening threshold for construction of the Proposed design changes. No noise mitigation is therefore required.
5.2.7.7 Water Resources
The potential for soil erosion and degradation of water quality is greatest during the construction period when topsoil is exposed, thereby making it more susceptible to erosion that can contribute to increased sediment loading on downstream receiving waters. In addition, when stormwater flows over a construction site, it can pick up other pollutants such as debris, chemicals, concrete wash-out, etc., and transport them to nearby water bodies. As discussed in Section 5.16, Water Quality, stormwater runoff from the Airport is discharged into Flushing Bay under a State Pollutant Discharge Elimination System (SPDES) permit issued by the NYSDEC. Compliance with the SPDES permit requires minimal impacts to stormwater from airport activities, including construction.
Stormwater runoff during construction would be covered by the Airport’s individual SPDES permit, which requires the implementation of a Stormwater Pollution Prevention Plan (SWPPP) to reduce or prevent stormwater contamination during construction activities, and also requires the submission of a completed Notice of Intent (NOI) advising NYSDEC and the public of PANYNJ’s request for additional permit coverage for construction phase activities. Under the SPDES permit process, water quality BMPs would be recommended to deal with sedimentation and erosion control, containment of construction materials (hydraulic fluids, fuel, etc.), washing of construction vehicles, cleaning of concrete mixers, etc. These BMPs would be incorporated into the project’s construction documents and become an obligation of the contractor. PANYNJ would monitor compliance with these practices and assure that the stormwater management systems are protected.
All contractors would be required to comply with applicable federal, state, and local laws and regulations, including FAA guidance contained in AC 150/5370-10F, Standards for Specifying Construction of Airports, including Item P-156 Temporary Air and Water Pollution, Soil Erosion and Siltation Control; AC 150/5320-15A, Management of Airport Industrial Waste; and AC 150/5320-5C (including Change 1) Subsurface Drainage Design. No construction activity would occur within any regulated wetland or surface water body; no Clean Water Act, Section 404 permit would be required.
5.2.7.8 Summary of Impacts
Under the CTB Redevelopment Program, construction activities would cause or contribute to a temporary increase in air, noise, and water pollution, or traffic on local roadways; tree removal and the loss of urban landscaped area; removal of three hangars eligible for listing in the NRHP and excavation of a potential archaeological site; and the need to dispose of hazardous materials and construction waste including contaminated soils and groundwater. Therefore, implementation of the CTB Redevelopment Program would include various means and measures to minimize the potential for adverse environmental impacts, including, but not necessarily limited to, the following: best management practices and control measures for reducing air, noise and water pollution; temporary improvements to local roadway intersections; an airport-compatible landscape plan including tree replacement; recordation of the NRHP-eligible hangars and cultural resource monitoring during excavation of the potential archaeological site; and, adherence to health and safety plans for the removal and disposal of hazardous waste. Compliance with applicable federal, state, and local rules and
December 2015 Chapter 5 – Environmental Consequences 5-78
LaGuardia Airport Technical Report CTB Redevelopment Program
regulations, as well as environmental commitments including mitigation measures, best management practices, and PANYNJ sustainability guidelines, would ensure that unavoidable construction impacts are reduced to the degree practicable.
If No-Action is taken, the CTB Redevelopment Program would not be implemented and the above-listed construction impacts on the environment would not occur. However, as discussed in Section 3.2, No Build/No-Action Alternative, the existing terminal facilities cannot remain in the current condition for an extended period of time. PANYNJ would have no choice but to undertake another terminal modernization program in order to bring the CTB and ancillary facilities into a state of good repair. Although the larger scale development impacts may be avoided by taking No-Action, some degree of construction impacts, such as increased traffic and traffic-related air and noise pollution, would still be expected to occur.
5.2.8 Cumulative Impacts
Council on Environmental Quality (CEQ) regulations require that all federal agencies consider the cumulative effects of proposed actions. Cumulative effects are defined as “the impact on the environment which results from the incremental impact of the action when added to other past, present, and reasonably foreseeable future actions regardless of what agency or person undertakes such actions.” Cumulative impacts can result from individually minor, but collectively significant, actions taking place over a period of time. This cumulative impact analysis was conducted to comply with the intent of FAA Order 1050.1E, DOT Order 5610.1C, and the January 1997 CEQ guidance.
The cumulative impacts resulting from the implementation of the CTB Redevelopment Program have been assessed for projects on and off the Airport. Since the CTB Redevelopment Program is a major project with environmental consequences due to both construction and the operation of the project, the scope of this analysis is broader than that of a smaller project with fewer effects over a shorter period of time. Accordingly, PANYNJ considers all the projects in geographical or temporal proximity to each other. The geographic boundary of the analysis varies by resource but generally includes the existing Airport property, adjacent properties including Flushing Bay to the north and the Grand Central Parkway to the south, and the Queens neighborhoods of Ditmars/Steinway, Jackson Heights, East Elmhurst, and College Point. The temporal boundary (timeframe) for the analysis also varies by resource but the time limits generally extend five years into the past (2008-2013) and into the future through the aviation activity forecast period (2013-2030).
Change: For the purposes of this technical report, the time limits extend seven years into the past (2008-2015) and into the future through the aviation activity forecast period (2016-2030).
If the Proposed Action would not cause direct or indirect impacts on a resource, then it may be concluded that it will not contribute to a cumulative impact on the resource. As identified in prior sections of Chapter 5, Environmental Consequences, the CTB Redevelopment Program is likely to have an adverse, but not significant, effect on the following impact categories:
• Traffic• Air Quality• Section 4(f) Resources• Fish, Wildlife and Plants• Historic and Cultural Resources• Noise• Water Quality
December 2015 Chapter 5 – Environmental Consequences 5-79
LaGuardia Airport Technical Report CTB Redevelopment Program
Although these impacts may not be significant themselves, cumulative impacts from one or more projects can result in the degradation of important resources. The other projects included in the analysis occur in the same proximate geographical location as the CTB Redevelopment Program, and may occur in the past, present, or reasonably foreseeable future.
5.2.8.1 Past, Present and Reasonably Foreseeable Future Projects
This section identifies the past, on-going, and reasonably foreseeable future projects, within the defined geographic area and timeframe that could affect the same environmental resources as the CTB Redevelopment Program and result in a larger cumulative effect on these resources.
Past Projects
Airport projects and upgrades to existing facilities necessary for maintaining the Airport in a state-of-good repair are typically excluded from the need for further analysis under NEPA. These projects are by definition minor projects which do not individually or collectively have a significant impact on the environment; therefore, no further analysis is required for categorically excluded projects. Over the past five years, FAA has allowed for categorical exclusion after review of the following projects at the Airport:
• Perimeter Fence Strengthening (categorical exclusion or “CATEX” signed 07/30/2007)
• Rehabilitation of CTB Concourse Alleyway Pavements (CATEX signed 04/21/2011)
• Vaughn College Soundproofing (CATEX signed 07/21/2010)75
• Rehabilitation of Taxiways R, S, P, and G (CATEX signed 06/07/2012)
• Change: Delta C/D Connector Bridge (CATEX signed 03/10/2010)- project complete
• Change: Rehabilitation of Taxiways A, M, ZA, and B (CATEX signed 06/07/2012) – project complete
• Change: Pump House 4 Upgrades (CATEX 06/07/2012) - project complete
• Change: East End Road Pavement Rehabilitation – project complete
The only major development projects at LaGuardia Airport in recent years were the new Airport Traffic Control Tower (ATCT) and the Police Emergency Garage/Emergency Fire Pump Station. PANYNJ prepared EAs for both projects and the FAA issued a Finding of No Significant Impact (FONSI) for each of them.
• Air Traffic Control Tower Replacement: This FAA-sponsored project resulted in a new Airport Traffic Control Tower (ATCT) and an administrative base building to replace the previous ATCT
75 The completed project entailed the soundproofing of various rooms used for instructional purposes at Vaughn College of Aeronautics and Technology located south of LaGuardia Airport. The soundproofing work consisted of replacing and/or upgrading the windows and doors, adding mass to the walls and roofs as needed to decrease the transmission of noise from airport operations, and installing central air conditioning in the affected areas. The work required limited on-road construction equipment. The school is also performing some interior renovations on the main building.
December 2015 Chapter 5 – Environmental Consequences 5-80
LaGuardia Airport Technical Report CTB Redevelopment Program
(built 1964).76 Project-related environmental impacts addressed in the EA include changes to the visual setting and the need to demolish a historically-important, but not significant, building on the Airport. FAA commissioned the new ATCT in 2010.
• Police Emergency Garage/Emergency Fire Pump Station: PANYNJ undertook the following miscellaneous projects to upgrade, replace, or improve existing operating systems: a new Police Emergency Garage, a new Emergency Fire Pump Station, and Roadway Improvements West of the CTB.77 No adverse impacts to the affected environment were identified in the EA that was prepared for these projects.
• Change: East End Substation/East Garage: This project involved the construction and operation of a new electrical substation within Parking Lot 4 in front of Terminal C, including the installation of buried duct banks for commercial electric service feeder lines (provided by ConEdison) underneath the Grand Central Parkway.78 The project also involved the development of a parking garage for passengers using Terminals C and D. Project-related impacts on the affected environment include, but are not necessarily limited to, temporary construction impacts such as air, noise, and water pollution, and earth disturbance/tree removal along landscaped sections of the Grand Central Parkway. A FONSI was signed by FAA in February 2013 and construction was completed in 2015.
One off-Airport project within close proximity to LaGuardia was recently completed:
• NYSDOT Grand Central Parkway/94th Street Interchange Improvements: This state highway project implemented operational and capacity improvements by eliminating the weaving section between the eastbound entrance ramp from 94th Street/Ditmars Boulevard and the Exit 7 ramp to LaGuardia Airport. The project included resurfacing existing pavements and improving signage. Project-related environmental impacts included, but were not necessarily limited to, temporary construction impacts. NYSDOT prepared an EA for this project and no significant impacts were identified.
• Change: North Shore Marine Transfer Station: The NYC Department of Sanitation reopened a closed facility located approximately two miles east of LaGuardia Airport along the North Shore of Flushing Bay in College Point, Queens Borough.79 The fully enclosed building was designed for the transfer of municipal solid waste from collection vehicles into sealed, leak-proof containers for export by barge and rail. The station was completed in November 2014 and opened in early 2015.
Ongoing Projects
76 Environmental Assessment Re-Evaluation for the LaGuardia Airport Air Traffic Control Tower Replacement Project (FAA, September 2004) based on the Finding of No Significant Impact and Final Environmental Assessment (FAA, October 1996).
77 Environmental Evaluation Form C (Short Environmental Assessment) for Upgrades and Replacements at LaGuardia Airport (PANYNJ, 2002); FONSI signed February 2002; Written Re-Evaluation prepared in July 2006.
78 Final Environmental Assessment for the East End Substation and East Garage at LaGuardia Airport (PANYNJ, February 2013); FONSI signed February 5, 2013.
79 Solid Waste Management Plan, Final Environmental Impact Statement (NYC Department of Sanitation, April 2005).
December 2015 Chapter 5 – Environmental Consequences 5-81
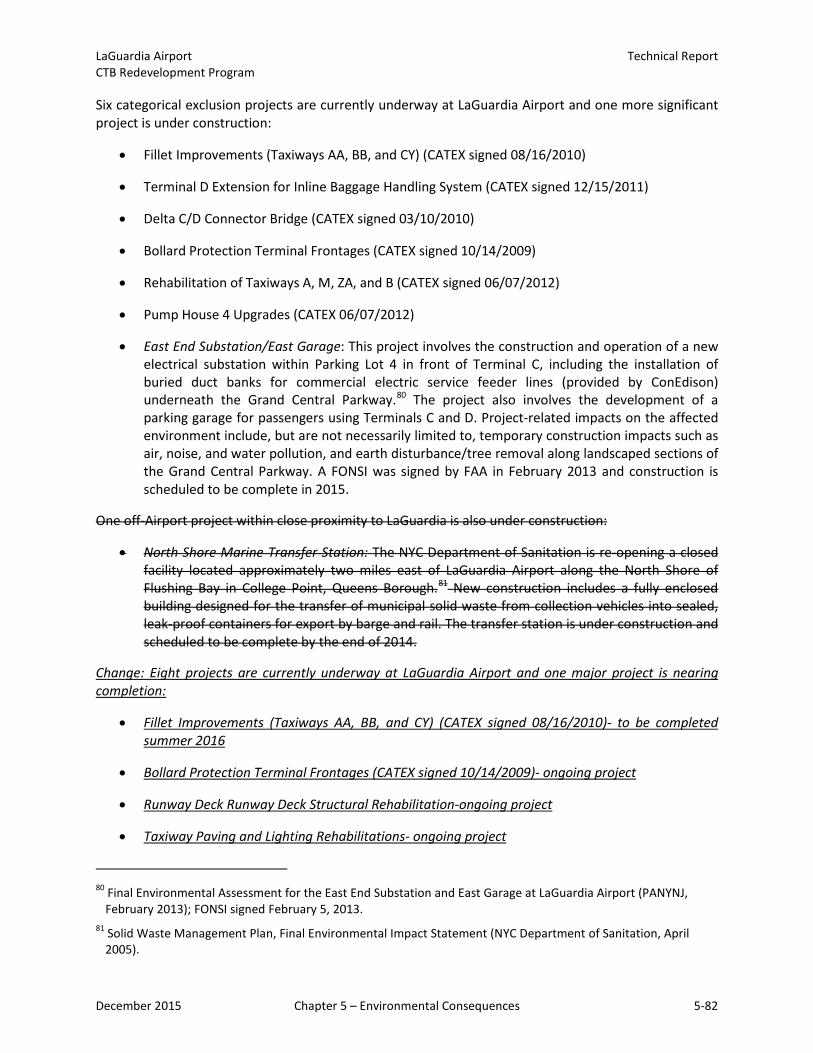
LaGuardia Airport Technical Report CTB Redevelopment Program
Six categorical exclusion projects are currently underway at LaGuardia Airport and one more significant project is under construction:
• Fillet Improvements (Taxiways AA, BB, and CY) (CATEX signed 08/16/2010)
• Terminal D Extension for Inline Baggage Handling System (CATEX signed 12/15/2011)
• Delta C/D Connector Bridge (CATEX signed 03/10/2010)
• Bollard Protection Terminal Frontages (CATEX signed 10/14/2009)
• Rehabilitation of Taxiways A, M, ZA, and B (CATEX signed 06/07/2012)
• Pump House 4 Upgrades (CATEX 06/07/2012)
• East End Substation/East Garage: This project involves the construction and operation of a new electrical substation within Parking Lot 4 in front of Terminal C, including the installation of buried duct banks for commercial electric service feeder lines (provided by ConEdison) underneath the Grand Central Parkway.80 The project also involves the development of a parking garage for passengers using Terminals C and D. Project-related impacts on the affected environment include, but are not necessarily limited to, temporary construction impacts such as air, noise, and water pollution, and earth disturbance/tree removal along landscaped sections of the Grand Central Parkway. A FONSI was signed by FAA in February 2013 and construction is scheduled to be complete in 2015.
One off-Airport project within close proximity to LaGuardia is also under construction:
• North Shore Marine Transfer Station: The NYC Department of Sanitation is re-opening a closed facility located approximately two miles east of LaGuardia Airport along the North Shore of Flushing Bay in College Point, Queens Borough.81 New construction includes a fully enclosed building designed for the transfer of municipal solid waste from collection vehicles into sealed, leak-proof containers for export by barge and rail. The transfer station is under construction and scheduled to be complete by the end of 2014.
Change: Eight projects are currently underway at LaGuardia Airport and one major project is nearing completion:
• Fillet Improvements (Taxiways AA, BB, and CY) (CATEX signed 08/16/2010)- to be completed summer 2016
• Bollard Protection Terminal Frontages (CATEX signed 10/14/2009)- ongoing project
• Runway Deck Runway Deck Structural Rehabilitation-ongoing project
• Taxiway Paving and Lighting Rehabilitations- ongoing project
80 Final Environmental Assessment for the East End Substation and East Garage at LaGuardia Airport (PANYNJ, February 2013); FONSI signed February 5, 2013.
81 Solid Waste Management Plan, Final Environmental Impact Statement (NYC Department of Sanitation, April 2005).
December 2015 Chapter 5 – Environmental Consequences 5-82
LaGuardia Airport Technical Report CTB Redevelopment Program
• Taxiway Rehabilitation (ZA, A, B, west of Runway 4-22)- to be completed summer 2016
• Runway 13-31 Rehabilitation- to be completed summer 2016
• Barrier Replacement (3 locations)- ongoing work
• Runway Safety Area (RSA) Enhancements: The project involves improving the RSA at the Runway 4 and Runway 31 ends by extending the existing decks further into Flushing Bay, constructing a new section of restricted vehicle service road (RSVR) south of the Runway 22 end, and establishing a construction staging area at Ingraham’s Mountain to support the development of the RSA and RSVR project elements.82 FAA signed the FONSI on December 31, 2013 and construction was initiated in 2014 and is expected to conclude in 2016, with the RSA portion completed by the end of 2015. 83
The Terminal D Extension for Inline Baggage Handling System is no longer a project at the airport.
Reasonably Foreseeable Projects
Within the next five years, in addition to the CTB Redevelopment Program, PANYNJ plans to undertake several state-of-good repair projects at LaGuardia Airport, as well as the Runway Safety Area (RSA) Enhancements project. The anticipated projects include the following:
• Runway Deck Structural Rehabilitation
• Taxiway Paving and Lighting Rehabilitations
• East End Road Pavement Rehabilitation
• Taxiway Rehabilitation (ZA, A, B, west of Runway 4-22)
• Barrier Replacement (3 locations)
• Runway 13-31 Rehabilitation
• Runway Safety Area (RSA) Enhancements: PANYNJ has prepared a separate EA for this project.84 The proposal is to: improve the RSA at the Runway 4 and Runway 31 ends by extending the existing decks further into Flushing Bay, construct a new section of restricted vehicle service road (RSVR) south of the Runway 22 end, and establish a construction staging area at Ingraham’s Mountain to support the development of the RSA and RSVR project elements.85 FAA
82 At the completion of the proposed RSA Enhancements project, the construction staging area (referred to as the Ingraham’s Mountain site) would continue to be used for contractor parking in support of the proposed CTB Redevelopment Program.
83 LaGuardia Airport Runway Safety Area Enhancements, Final Environmental Assessment (PANYNJ, December 2013).
84 LaGuardia Airport Runway Safety Area Enhancements, Final Environmental Assessment (PANYNJ, December 2013).
85 At the completion of the proposed RSA Enhancements project, the construction staging area (referred to as the Ingraham’s Mountain site) would continue to be used for contractor parking in support of the proposed CTB Redevelopment Program.
December 2015 Chapter 5 – Environmental Consequences 5-83
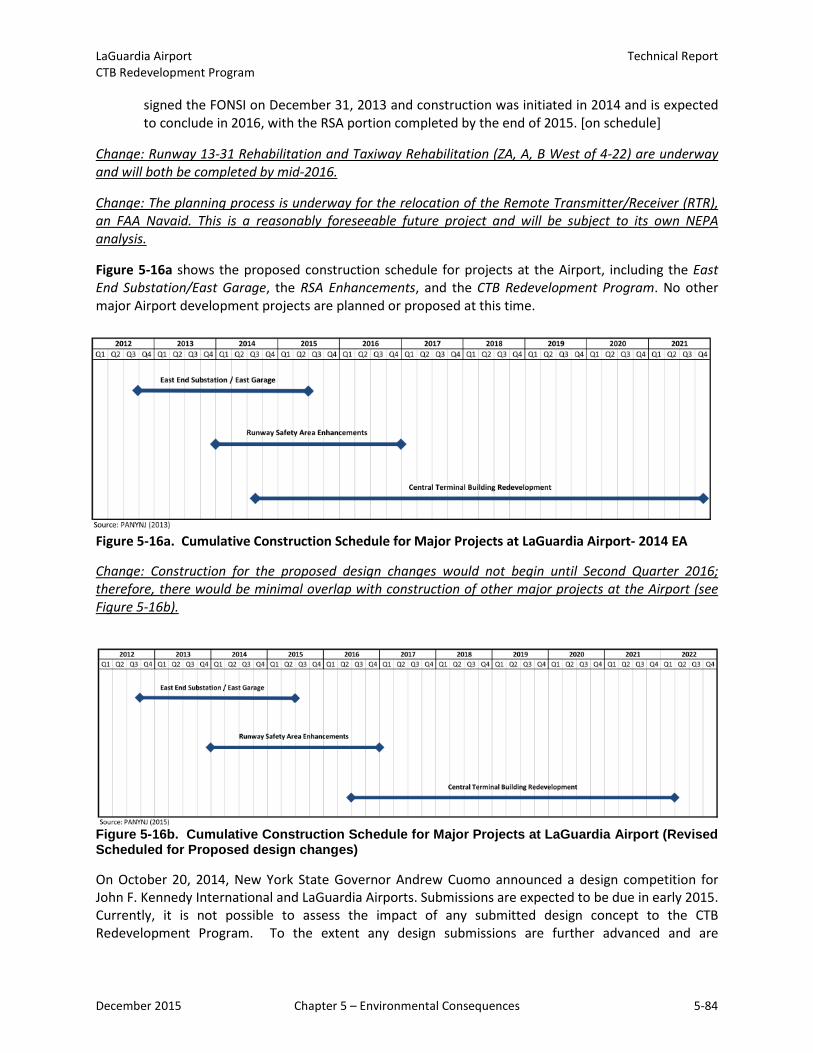
LaGuardia Airport Technical Report CTB Redevelopment Program
signed the FONSI on December 31, 2013 and construction was initiated in 2014 and is expected to conclude in 2016, with the RSA portion completed by the end of 2015. [on schedule]
Change: Runway 13-31 Rehabilitation and Taxiway Rehabilitation (ZA, A, B West of 4-22) are underway and will both be completed by mid-2016.
Change: The planning process is underway for the relocation of the Remote Transmitter/Receiver (RTR), an FAA Navaid. This is a reasonably foreseeable future project and will be subject to its own NEPA analysis.
Figure 5-16a shows the proposed construction schedule for projects at the Airport, including the East End Substation/East Garage, the RSA Enhancements, and the CTB Redevelopment Program. No other major Airport development projects are planned or proposed at this time.
Figure 5-16a. Cumulative Construction Schedule for Major Projects at LaGuardia Airport- 2014 EA
Change: Construction for the proposed design changes would not begin until Second Quarter 2016; therefore, there would be minimal overlap with construction of other major projects at the Airport (see Figure 5-16b).
Figure 5-16b. Cumulative Construction Schedule for Major Projects at LaGuardia Airport (Revised Scheduled for Proposed design changes)
On October 20, 2014, New York State Governor Andrew Cuomo announced a design competition for John F. Kennedy International and LaGuardia Airports. Submissions are expected to be due in early 2015. Currently, it is not possible to assess the impact of any submitted design concept to the CTB Redevelopment Program. To the extent any design submissions are further advanced and are
December 2015 Chapter 5 – Environmental Consequences 5-84
LaGuardia Airport Technical Report CTB Redevelopment Program
determined to impact the CTB Redevelopment project or other program elements, an appropriate analysis and review will be undertaken at that time.
Change: The public announcement of the Port Authority's selection of a preferred proposer for the CTB redevelopment project coincided with New York State Governor Andrew M. Cuomo’s announcement of his goal for a transformational redesign of LaGuardia Airport, which would include replacement of Terminals C and D, as well as the potential construction of an AirTrain, hotel, and other support facilities on airport, as recommended by the Governor's airport design panel. While preliminary planning efforts are underway to consider the other components of the transformational redesign, the CTB Redevelopment component represents a concrete specified design, a project that received approval from the Port Authority's board on May 28, 2015 and will shortly be presented to the Board for final approval. The other components of the new design are still pending consideration in the capital plans of the PANYNJ and other entities, and have not yet been the subject of sufficiently specific planning work to enable accurate and relevant NEPA analysis. Therefore, the nature, the extent, and the design of these other components are not determinable or reasonably foreseeable at the present time. In the event that these projects do become ripe for decision, they will be subject to their own appropriate NEPA analyses and those analyses will be required to look back on the CTB Redevelopment Program as a past project and to consider it in future project analysis of cumulative impacts. Finally, the following off-Airport projects may have the potential to affect environmental resources also affected by the CTB Redevelopment Program.
• Environmental Dredging of Flushing Bay: NYCDEP is proposing to dredge approximately 16.8 acres of Flushing Bay near two combined sewer overflow (CSO) outfalls located east of the Airport, near the World’s Fair Marina.86 The proposed project is needed to remove accumulated sediment mounds exposed at low tide and to reduce associated nuisance odors. The dredging project also includes the removal of deteriorated timber piles and the restoration of wetlands along the shoreline to further improve the aesthetics of the bay. The project is planned to be initiated in 2014 and completed by 2016.
• Willets Point Redevelopment: The Office of the Deputy Mayor for Economic Development acting as lead agency proposes to rezone, create an urban renewal area, and implement the Willets Point Development Plan in Willets, Queens.87 The proposed plan’s main goal is to transform a largely underutilized site with substandard conditions and substantial environmental degradation into a lively, mixed-use, sustainable community and regional destination. The approximately 61-acre Willets Point Development District would be redeveloped with residential, retail, hotel, convention center, entertainment, commercial office, community facility, open space, and parking uses at a cost of approximately $3 billion. In addition, the proposed plan would connect the Van Wyck Expressway with the District. Although groundbreaking has occurred for off-site infrastructure improvements, other aspects of the project have been delayed pending additional environmental reviews. A Notice of Completion per CEQR was issued by the Office of the Deputy Mayor for Economic Development on August 9, 2013. According to the recently completed Final Supplemental Environmental Impact Statement, the District would be redeveloped in several phases over a period of approximately 19 years.
86 For more information: www.nyc.gov/html/dep/html/environmental_reviews/flushing_bay_environmental_dredging.shtml
87 For more information: www.nycedc.com/project/willets-point-development
December 2015 Chapter 5 – Environmental Consequences 5-85
LaGuardia Airport Technical Report CTB Redevelopment Program
• National Tennis Center Strategic Vision Project: NYCDPR, in coordination with the U.S. Tennis Association National Tennis Center (NTC), proposes to improve and expand the facilities at the NTC located in Flushing Meadows in Corona Park, Queens.88 The 41-acre NTC is one of the world’s largest public recreation tennis facilities and is host to the U.S. Open. The proposed project would improve the NTC site plan, circulation, amenities, and landscaping, and would include construction of two new stadiums to replace the two existing stadiums (Stadiums 2 and 3) as well as possible improvements to Arthur Ashe Stadium (Stadium 1). A Notice of Completion per CEQR was issued by the NYC Department of Parks and Recreation on May 10, 2013. If implemented, the project is expected to be completed by 2019.
The following sections discuss the results of the cumulative effects analysis for the CTB Redevelopment Program on each affected environmental resource in turn.
5.2.8.2 Traffic and Transportation
The assessment of project-related impacts on traffic and transportation is discussed in Section 5.1 and Appendix A of the 2014 EA. The traffic analyses conducted for this project were conducted in accordance with the guidelines and methodologies described in the New York City Environmental Quality Review (CEQR) Technical Manual. In accordance with CEQR guidelines, all traffic analyses—including those conducted for year 2015 construction conditions and year 2030 operation conditions—are cumulative in nature, in that they reflect both projected future traffic volumes associated with future regional growth over time and other planned and approved development projects, as well as planned transportation improvements for the CTB Redevelopment Program that are anticipated to be in place by the projected future horizon year(s).
Change: Traffic and transportation related to the proposed design changes are discussed in Section 5.2.1 and Attachment 4 of this technical report. Revised traffic analyses were conducted for year 2017 construction conditions.
Specifically, all traffic volumes used in future conditions analyses are established from a baseline of existing (field-observed) traffic volumes. Once these baseline traffic volumes are established, future traffic volumes are projected from the baseline volumes to reflect cumulative future traffic growth from a variety of contributing factors, including:
• Incremental traffic volumes associated with regional background growth that is anticipated to occur over time;
• Incremental traffic volumes projected to be generated by the construction and operation of other planned or approved development projects through the future horizon years;
• Incremental traffic volumes associated with project passenger growth at LaGuardia Airport without the CTB Redevelopment Program;
• Incremental traffic volumes as a direct result of the CTB Redevelopment Program, including construction vehicles for peak year construction conditions (2015) and project-induced traffic for year 2030 operation conditions.
88 For more information: www.nycgovparks.org/park-features/fmcp/usta-ntc-strategic-vision-project
December 2015 Chapter 5 – Environmental Consequences 5-86
LaGuardia Airport Technical Report CTB Redevelopment Program
Change: Peak year construction conditions under the proposed design changes would be in 2017.
The sum of the traffic increases associated with the individual factors described above and the existing baseline traffic volumes yields the projected future cumulative traffic volumes. Furthermore, all future conditions traffic analyses also include planned transportation improvements that are anticipated to be in place through each of the horizon years (i.e., year 2015 for construction conditions and year 2030 for operation conditions). These improvements include the recent work by NYSDOT on lanes and ramps to and from the Grand Central Parkway in the vicinity of 82nd Street and 94th Street, as well as future improvements to the Bowery Bay Boulevard/Runway Drive/Marine Terminal Road intersection as part of the RSA Enhancements project at the Airport.
Change: The horizon year for construction was shifted to 2017 for the proposed design changes. The revised construction traffic analysis incorporated the improvements to the Grand Central Parkway lanes and ramps and the Bowery Bay Boulevard/Runway Drive/Marine Terminal Road intersection that were completed since the 2014 FONSI/ROD.
Construction Traffic Analysis
The construction conditions traffic analyses from the previously approved design (2014) identify how the study area’s transportation system is projected to operate in the fourth quarter of 2015 – the peak time period for construction activity at the CTB – accounting for the cumulative effects of construction traffic generated by the CTB, background traffic growth, and traffic generated by other projects planned for the study area. Both the future No-Action and Proposed Action Construction analyses include the NYSDOT improvements to the Grand Central Parkway in the vicinity of 82nd Street and 94th Street, as well as projected future traffic volumes associated with construction of the Willets Point Redevelopment and the RSA Enhancements project at LaGuardia Airport. In addition, between 2012 and 2015, it is expected that existing traffic volumes in the study area will increase due to regional growth over time. In order to forecast future traffic demands, a compounded annual growth rate of 1.51 percent was calculated through the 2015 horizon year and applied to the existing traffic volumes, in accordance with the growth rate recommendations for Queens described in the CEQR Technical Manual.
Change: The construction conditions traffic analyses for the proposed design changes identify how the study area’s transportation system is projected to operate in the second quarter of 2017 – the peak time period for construction activity at the CTB. Since the RSA Enhancements project at LaGuardia Airport would be completed by late 2016, construction analyses did not include construction traffic for that project. In addition, between 2014 and 2017, it is expected that existing traffic volumes in the study area will increase due to regional growth over time. In order to forecast future traffic demands, a compounded annual growth rate of 1.0 percent was calculated through the 2017 horizon year and applied to the existing traffic volumes.
The traffic volumes associated with construction of the Willets Point Redevelopment and RSA Enhancements projects were then added to the baseline volumes, compounded with the regional growth factor, to yield the adjusted volumes for the future No-Action traffic volumes. The future Proposed Action Construction condition analyses from the previously approved design (2014) builds upon the No-Action traffic volumes by adding the incremental vehicular traffic generated by trucks and construction personnel attributable the proposed redevelopment of the CTB.
Change: Since the peak construction year was shifted to 2017, after the completion of the RSA Enhancements project, the future construction condition analyses for the proposed design changes did not add construction volumes associated with that project as part of the No-Action traffic volume.
December 2015 Chapter 5 – Environmental Consequences 5-87
LaGuardia Airport Technical Report CTB Redevelopment Program
The results of the traffic analyses for construction conditions indicate that a variety of transportation system improvements may be necessary to provide for acceptable traffic operations, and would be implemented as indicated by traffic monitoring throughout the construction period. These improvements could include a traffic signal installation, a traffic signal controller upgrade, signal timing adjustments, curbside parking prohibitions, lane widening/restriping, and instituting the use of construction flaggers.
Operations Traffic Analysis
With or without the CTB Redevelopment Program, passenger travel at LaGuardia Airport is projected to continue to increase over time. PANYNJ estimates that, without the CTB Redevelopment Program, projected passenger travel at LaGuardia Airport would increase by 6.5 MAP by 2030. Therefore, the projected increase in vehicular traffic associated with this background passenger growth of 6.5 MAP was included in the year 2030 future No-Action (and Proposed Action) traffic volumes.
The operations traffic analyses accounts for the cumulative effects of background traffic growth and other projects planned in the study area up to the design year of 2030. As noted previously, the proposed redevelopment of LaGuardia Airport is anticipated to be fully completed and operational by 2021. However, because it is projected to take approximately nine years following the opening of the CTB to fully realize all of the forecast passenger growth associated with the redevelopment, the future study year for the future No-Action and Proposed Action conditions traffic analyses is 2030. Therefore, future conditions operations analyses included traffic increases as a result of projects anticipated to be completed by the year 2030, as well as traffic growth projections to the year 2030.
Change: The construction phasing plan for the proposed design changes have shifted the completion date of the CTB to the end of 2021; however, the future analysis year for full operation of the new terminal remains 2030.
The operations analyses include analyzing the effects of a series of recent or planned improvements in the vicinity of the Airport. Recent NYSDOT improvements include the reconfiguration of the eastbound ramps to and from the Grand Central Parkway in the vicinity of the 94th Street interchange, signalization of the Ditmars Boulevard/Grand Central Parkway eastbound on-ramp intersection, modification of the land configurations on the eastbound, westbound, and southbound approaches to the Ditmars Boulevard/94th Street intersection, and widening of the 82nd Street westbound off-ramp from the Parkway from two to three lanes at its approach to 82nd Street-Ditmars Boulevard. In addition, anticipated improvements to the Bowery Bay Boulevard/Runway Drive/Marine Terminal Road intersection as part of the RSA Enhancements project were included in all year 2030 future conditions traffic analyses (i.e., No-Action and Proposed Action conditions).
Change: Improvements to the Bowery Bay Boulevard/Runway Drive/Marine Terminal Road intersection were already completed as part of the RSA Enhancements project.
The Willets Point Redevelopment project, with a mix of residential, retail, office, community facility and institutional uses, and the National Tennis Center Strategic Vision Project, an expansion of an existing recreational use, are expected to be fully developed by the 2030 horizon year for the CTB Redevelopment Program. Traffic volumes associated with the Willets Point Redevelopment project were also included in the year 2030 No-Action and Proposed Action conditions analyses. The projected increase in attendance at the annual U.S. Open tennis tournament as a result of the NTC Strategic Vision Project is expected to have a negligible effect on the traffic analysis for the CTB Redevelopment Program. The tournament constitutes a special event condition (i.e., operating only two weeks of the
December 2015 Chapter 5 – Environmental Consequences 5-88
LaGuardia Airport Technical Report CTB Redevelopment Program
year) and is not projected to generate a significant volume of traffic to the west, through the traffic study area.
In addition, between 2012 and 2030, it is expected that existing traffic volumes in the study area will increase due to regional growth over time. In order to forecast future traffic demands without the CTB Redevelopment Program, a total growth rate of 5.91 percent was calculated for the 2030 horizon year and applied to the existing traffic volumes, in accordance with the growth rate recommendations for Queens described in the CEQR Technical Manual.
The traffic volumes associated with the 6.5 MAP growth at LaGuardia Airport, as well as the Willets Point Redevelopment project, were added to these adjusted volumes to arrive at the year 2030 future No-Action condition traffic volumes.
The future Proposed Action condition traffic analysis from the 2014 EA identifies how the study area’s transportation system would operate in the 2030 horizon year with the addition of vehicular traffic generated by the CTB Redevelopment Program (i.e., an additional 3.9 MAP). As part of the proposed improvements to LaGuardia Airport, background traffic patterns at the study intersections can be expected to be different due to the proposed roadway and ramp reconfigurations. As such, the future CTB Redevelopment Program traffic volumes accounted for the reassignment of traffic associated with these planned modifications to the roadway and ramp network. The projected peak hour vehicle trips associated with the CTB Redevelopment Program (i.e., 3.9 MAP) were added to the reassigned future No-Action condition traffic volumes to arrive at projected future CTB Redevelopment Program condition traffic volumes.
The results of the traffic analyses for the operation condition indicate that re-timing of traffic signals at several public street intersections in the vicinity of LaGuardia Airport may be necessary to ensure acceptable traffic operations according to CEQR Technical Manual guidelines. These intersections are:
• Bowery Bay Boulevard/Runway Drive/Marine Terminal Road
• Ditmars Boulevard/Marine Terminal Road
• Astoria Boulevard North-Grand Central Parkway westbound off-ramp/82nd Street-Ditmars Boulevard
• Astoria Boulevard/82nd Street-24th Avenue
In addition, restriping of the Astoria Boulevard/82nd Street-24th Avenue intersection and various parking restrictions along portions of 24th Avenue and 82nd Street are recommended. Traffic improvements would be coordinated with NYCDOT and implemented as indicated by traffic monitoring.
5.2.8.3 Air Quality
The CTB Redevelopment Program would occur within an EPA-designated nonattainment/maintenance area; therefore, the air emissions resulting from the construction and operation of the CTB Redevelopment Program are subject to review under the EPA’s Clean Air Act. The full assessment of project-related impacts on air quality is discussed in Section 5.2 and Appendix B of the 2014 EA. Attachment 5: Technical Memorandum – Updated Air Quality Analysis for the Construction Condition and Attachment 8: LGA CTB CO Hot Spot Analysis provide supplemental analysis and discussion on the air quality impacts from the proposed design changes.
December 2015 Chapter 5 – Environmental Consequences 5-89
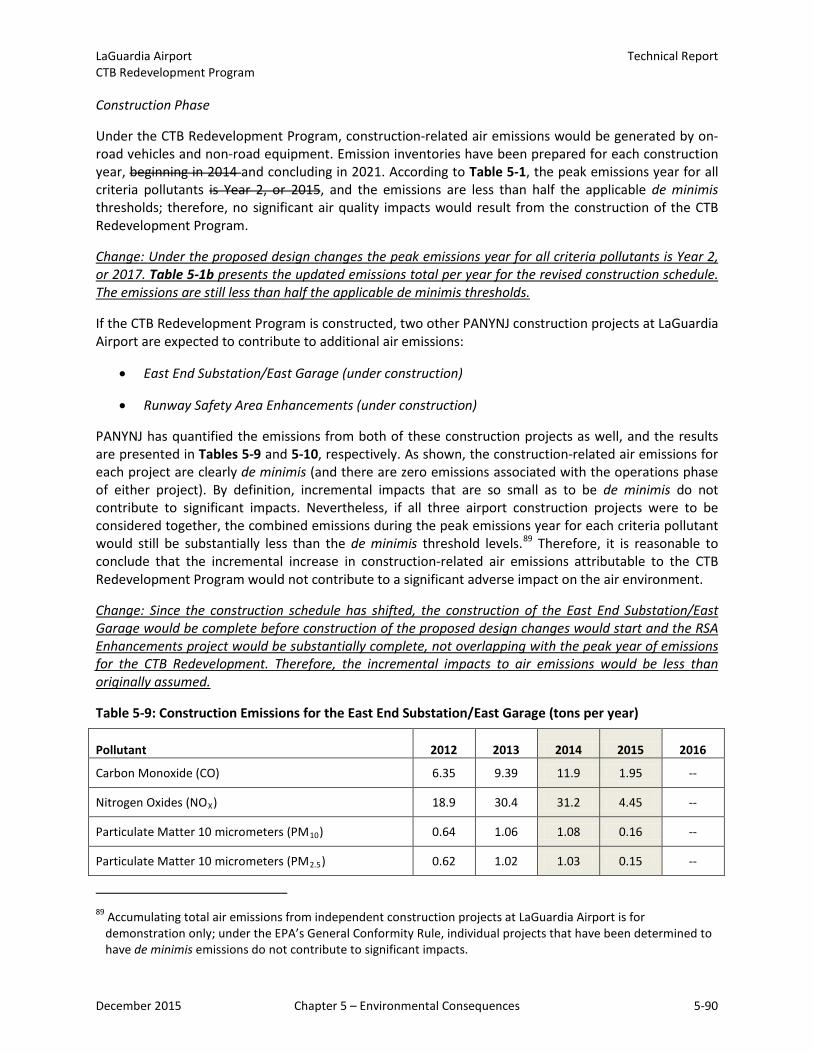
LaGuardia Airport Technical Report CTB Redevelopment Program
Construction Phase
Under the CTB Redevelopment Program, construction-related air emissions would be generated by on-road vehicles and non-road equipment. Emission inventories have been prepared for each construction year, beginning in 2014 and concluding in 2021. According to Table 5-1, the peak emissions year for all criteria pollutants is Year 2, or 2015, and the emissions are less than half the applicable de minimis thresholds; therefore, no significant air quality impacts would result from the construction of the CTB Redevelopment Program.
Change: Under the proposed design changes the peak emissions year for all criteria pollutants is Year 2, or 2017. Table 5-1b presents the updated emissions total per year for the revised construction schedule. The emissions are still less than half the applicable de minimis thresholds.
If the CTB Redevelopment Program is constructed, two other PANYNJ construction projects at LaGuardia Airport are expected to contribute to additional air emissions:
• East End Substation/East Garage (under construction)
• Runway Safety Area Enhancements (under construction)
PANYNJ has quantified the emissions from both of these construction projects as well, and the results are presented in Tables 5-9 and 5-10, respectively. As shown, the construction-related air emissions for each project are clearly de minimis (and there are zero emissions associated with the operations phase of either project). By definition, incremental impacts that are so small as to be de minimis do not contribute to significant impacts. Nevertheless, if all three airport construction projects were to be considered together, the combined emissions during the peak emissions year for each criteria pollutant would still be substantially less than the de minimis threshold levels.89 Therefore, it is reasonable to conclude that the incremental increase in construction-related air emissions attributable to the CTB Redevelopment Program would not contribute to a significant adverse impact on the air environment.
Change: Since the construction schedule has shifted, the construction of the East End Substation/East Garage would be complete before construction of the proposed design changes would start and the RSA Enhancements project would be substantially complete, not overlapping with the peak year of emissions for the CTB Redevelopment. Therefore, the incremental impacts to air emissions would be less than originally assumed.
Table 5-9: Construction Emissions for the East End Substation/East Garage (tons per year)
Pollutant 2012 2013 2014 2015 2016
Carbon Monoxide (CO) 6.35 9.39 11.9 1.95 --
Nitrogen Oxides (NOX) 18.9 30.4 31.2 4.45 --
Particulate Matter 10 micrometers (PM10) 0.64 1.06 1.08 0.16 --
Particulate Matter 10 micrometers (PM2.5) 0.62 1.02 1.03 0.15 --
89 Accumulating total air emissions from independent construction projects at LaGuardia Airport is for demonstration only; under the EPA’s General Conformity Rule, individual projects that have been determined to have de minimis emissions do not contribute to significant impacts.
December 2015 Chapter 5 – Environmental Consequences 5-90

LaGuardia Airport Technical Report CTB Redevelopment Program
Volatile Organic Compounds 0.95 1.71 1.71 0.29 --
Source: PANYNJ East End Substation and East Garage at LaGuardia Airport, Environmental Assessment/Finding of No Significant Impact (February 2013). Note: De minimis levels for CO, NOX, and PM2.5 are 100 tpy; and 50 tpy for VOCs.
Table 5-10: Construction Emissions for the RSA Enhancements (tons per year)
Pollutant 2012 2013 2014 2015 2016
Carbon Monoxide (CO) -- 0.37 29.9 22.4 9.87
Nitrogen Oxides (NOX) -- 0.29 31.5 22.3 9.94
Particulate Matter 10 micrometers (PM10) -- 1.06 24.3 10.4 8.46
Particulate Matter 10 micrometers (PM2.5) -- 0.12 4.21 2.21 1.39
Sulfur Dioxide (SO2) <0.01 0.10 0.06 0.03
Volatile Organic Compounds -- 0.03 3.16 2.43 1.33
Source: PANYNJ LaGuardia Airport Runway Safety Area Enhancements, Final Environmental Assessment (December 2013) Note: De minimis levels for CO, NOX, SO2, and PM2.5 are 100 tpy; and 50 tpy for VOCs.
Other major construction projects in the vicinity of the Airport that are proposed to be underway at approximately the same time include:
• Environmental Dredging of Flushing Bay by NYC
• Willets Point Redevelopment
• National Tennis Center Strategic Vision Project
All three projects have been evaluated by the respective City agencies and determined to have no significant adverse air quality impacts. Construction of the NYSDOT 94th Street Interchange Improvements along the Grand Central Parkway was recently completed, and construction of the North Shore Marine Transfer Station in College Point is expected to be complete soon; no incremental emissions would result from those projects. Change: The North Shore Marine Transfer Station has been completed. Operations PhaseAfter construction, day-to-day airport and airline operations would continue to generate emissions of criteria pollutants. Emissions inventories were prepared for the future year 2030 for mobile and stationary sources with and without the project. The assessment demonstrates that the emissions resulting from the CTB Redevelopment Program would be only marginally different, and in most cases less, than the emissions from the No-Action Alternative. Because the CTB Redevelopment Program would result in no emissions increase or an increase that is clearly de minimis, it can be concluded that the incremental emissions resulting from the future operation of the CTB Redevelopment Program would not contribute to a significant adverse impact on the air environment.
December 2015 Chapter 5 – Environmental Consequences 5-91
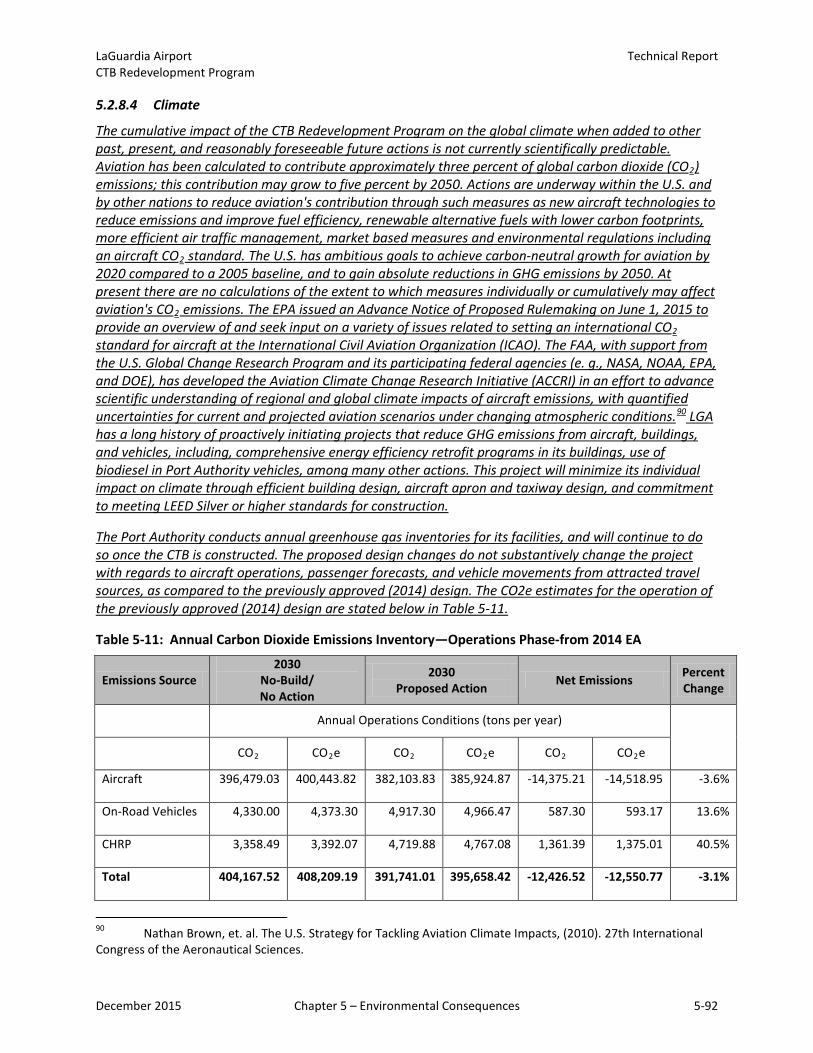
LaGuardia Airport Technical Report CTB Redevelopment Program
5.2.8.4 Climate
The cumulative impact of the CTB Redevelopment Program on the global climate when added to other past, present, and reasonably foreseeable future actions is not currently scientifically predictable. Aviation has been calculated to contribute approximately three percent of global carbon dioxide (CO2) emissions; this contribution may grow to five percent by 2050. Actions are underway within the U.S. and by other nations to reduce aviation's contribution through such measures as new aircraft technologies to reduce emissions and improve fuel efficiency, renewable alternative fuels with lower carbon footprints, more efficient air traffic management, market based measures and environmental regulations including an aircraft CO2 standard. The U.S. has ambitious goals to achieve carbon-neutral growth for aviation by 2020 compared to a 2005 baseline, and to gain absolute reductions in GHG emissions by 2050. At present there are no calculations of the extent to which measures individually or cumulatively may affect aviation's CO2 emissions. The EPA issued an Advance Notice of Proposed Rulemaking on June 1, 2015 to provide an overview of and seek input on a variety of issues related to setting an international CO2 standard for aircraft at the International Civil Aviation Organization (ICAO). The FAA, with support from the U.S. Global Change Research Program and its participating federal agencies (e. g., NASA, NOAA, EPA, and DOE), has developed the Aviation Climate Change Research Initiative (ACCRI) in an effort to advance scientific understanding of regional and global climate impacts of aircraft emissions, with quantified uncertainties for current and projected aviation scenarios under changing atmospheric conditions.90 LGA has a long history of proactively initiating projects that reduce GHG emissions from aircraft, buildings, and vehicles, including, comprehensive energy efficiency retrofit programs in its buildings, use of biodiesel in Port Authority vehicles, among many other actions. This project will minimize its individual impact on climate through efficient building design, aircraft apron and taxiway design, and commitment to meeting LEED Silver or higher standards for construction.
The Port Authority conducts annual greenhouse gas inventories for its facilities, and will continue to do so once the CTB is constructed. The proposed design changes do not substantively change the project with regards to aircraft operations, passenger forecasts, and vehicle movements from attracted travel sources, as compared to the previously approved (2014) design. The CO2e estimates for the operation of the previously approved (2014) design are stated below in Table 5-11.
Table 5-11: Annual Carbon Dioxide Emissions Inventory—Operations Phase-from 2014 EA
Emissions Source 2030
No-Build/ No Action
2030 Proposed Action Net Emissions Percent
Change
Annual Operations Conditions (tons per year)
CO2 CO2e CO2 CO2e CO2 CO2e
Aircraft 396,479.03 400,443.82 382,103.83 385,924.87 -14,375.21 -14,518.95 -3.6%
On-Road Vehicles 4,330.00 4,373.30 4,917.30 4,966.47 587.30 593.17 13.6%
CHRP 3,358.49 3,392.07 4,719.88 4,767.08 1,361.39 1,375.01 40.5%
Total 404,167.52 408,209.19 391,741.01 395,658.42 -12,426.52 -12,550.77 -3.1%
90 Nathan Brown, et. al. The U.S. Strategy for Tackling Aviation Climate Impacts, (2010). 27th International Congress of the Aeronautical Sciences.
December 2015 Chapter 5 – Environmental Consequences 5-92
LaGuardia Airport Technical Report CTB Redevelopment Program
Note: Based on EPA’s Inventory of U.S. Greenhouse Gas Emissions and Sinks: 1990-2007 (April 15, 2009) for fossil fuel combustion sources, CO2e calculated as 101% of CO2 emissions.
5.2.8.5 Coastal Resources and Floodplains
The area affected by the CTB Redevelopment Program is located within the Coastal Zone of New York, which includes the FEMA-designated 100-year tidal floodplain. PANYNJ has determined that the CTB Redevelopment Program is consistent with the State’s Coastal Management Program (CMP) and the Local Waterfront Revitalization Program (WRP), and the NYS Department of State has concurred with PANYNJ’s consistency determination. No adverse impacts to coastal resources would occur as a result of the CTB Redevelopment Program; therefore, it would not contribute to cumulative impacts on the resource. Other major development projects affecting coastal areas in the vicinity of the airport include:
• North Shore Marine Transfer Station (substantially complete)
Change: North Shore Marine Transfer Station (recently completed)
• East End Substation/East Garage (under construction)
East End Substation/East Garage (recently completed)
• Runway Safety Area Enhancements (under construction)
• Environmental Dredging of Flushing Bay (proposed)
These projects have also been evaluated by the NYSDOS and determined to not result in potential significant adverse impacts to coastal resources. Development actions along the City’s waterfront are strictly regulated. Compliance with applicable state and local coastal policies and programs for the protection of coastal resources provides adequate assurance that no significant individual or cumulative impacts would occur.
5.2.8.6 Fish, Wildlife and Plants
During construction, local species of wildlife would be temporarily displaced by earth disturbance and tree removal associated with site preparation activities. After construction, trees would be replaced and landscaped areas would be re-established in accordance with New York City Rules Governing Tree Replacement and FAA Advisory Circular 150/5200-33C, Hazardous Wildlife Attractants On or Near Airports. No federal- or state-listed species of fish, wildlife, plants, or critical habitat would be affected by the project.
Impacts to Upland Habitats
As discussed in Section 5.7, the CTB Redevelopment Program would result in the net loss of approximately four acres of urban landscaping located between the Airport and the Grand Central Parkway, which accounts for less than three percent of the project site and less than one percent of the Airport site. The various trees, shrubs, and mowed grasses associated with the landscaped medians between the roadways provide highly fragmented habitat with little or no value. Other listed projects affecting upland habitats on or near LaGuardia Airport include:
• East End Substation/East Garage: Less than one acre of upland vegetation will be disturbed during construction of a buried utility ductbank crossing the Grand Central Parkway. The construction impacts are localized, temporary, and minor, and the site will be restored to its original condition at
December 2015 Chapter 5 – Environmental Consequences 5-93

LaGuardia Airport Technical Report CTB Redevelopment Program
the completion of the project. As part of the project, 32 trees will be removed in compliance with a NYCDPR Construction and Forestry Permit including mitigation pursuant to NYC Rules Governing Tree Replacement.
• Runway Safety Area (RSA) Enhancements: According to the Final EA for this project, approximately nine acres of upland habitat, including numerous trees, would be removed for site preparation and development of the Ingraham’s Mountain Construction Staging Area. The remaining upland habitat within perimeter areas of the same property would be left undisturbed, along with the associated vegetation at Ingraham’s Mountain, during and after construction.
Upland habitats located on and in the vicinity of the Airport consist of trees, shrubs, and turf grasses that are either maintained as urban landscaping or left untended within small parcels of open space and undeveloped land. These areas support a limited variety of common wildlife species that have adapted to the surrounding developed urban community. PANYNJ has conducted natural resource assessments for all three Airport projects discussed above, and no potential for significant impacts to upland resources has been identified. Furthermore, no other off-Airport project has been identified as having a potentially significant impact on upland resources. Therefore, the CTB Redevelopment Program, including mitigation for tree removal, would not be expected to cause or contribute to significant adverse impacts to upland species or habitats.
5.2.8.7 DOT Act, Section 4(f)
As discussed in Section 5.5 of the 2014 EA, the CTB Redevelopment Program would not impact any publicly-owned park, recreation area, or wildlife or waterfowl refuge area of national, state or local significance. However, the CTB Redevelopment Program would require the use of historic resources, which are also regulated under Section 4(f) of the DOT Act. The assessment of cumulative impacts on historic resources is discussed in the following section. If the CTB Redevelopment Program would not cause or contribute to a significant adverse impact on historic resources, then it is reasonable to conclude that there would be no significant cumulative impacts on Section 4(f) resources.
5.2.8.8 Historic Resources
The FAA has determined that the CTB Redevelopment Program, including the demolition of Hangars 1, 2 and 4, which are eligible for listing on the NRHP, would adversely affect historic resources at LaGuardia Airport. The assessment of project-related impacts on historic resources is discussed in Section 5.10 and Appendix D of the 2014 EA.
Improvements and changes to LaGuardia Airport over the past 73 years of operation have been necessary to achieve and maintain the highest levels of airport safety and efficiency while keeping pace with changes in the U.S. airline industry, such as increasing passenger volumes, larger aircraft, new technologies, and more stringent federal regulations. As older buildings face the challenge of age and obsolescence, PANYNJ and FAA are under pressure to provide new facilities within the limited space available. As decades have passed, in order to accommodate the growing demand for passenger terminals and support facilities, buildings have been removed from LaGuardia Airport.
Today, the remaining original airport buildings include Hangars 1, 3, and 5; Hangars 2 and 4; Hangar 7; and the Marine Air Terminal (Terminal A)—all of which were constructed between 1939 and 1940. Of these remaining buildings, the CTB Redevelopment Program would directly impact Hangars 1, 2, and 4, which would indirectly impact the remaining Hangars 3 and 5. There would be no direct or indirect
December 2015 Chapter 5 – Environmental Consequences 5-94
LaGuardia Airport Technical Report CTB Redevelopment Program
adverse effects to the Marine Air Terminal—located on the west side of the Airport. There are no other ongoing or reasonably foreseeable projects or impacts to consider.
PANYNJ and FAA have strived to balance the need for new facilities at LaGuardia Airport with the need to preserve its historic resources. For example, the Marine Air Terminal has been designated a New York City Landmark (Landmarks Preservation Commission, 1980), and it is listed on the National Register of Historic Places (National Register, 1982). When the FAA removed the second generation Airport Traffic Control Tower, mitigation measures included HABS/HAER recordation as well as a booklet that chronicles LaGuardia Airport’s history and accomplishments with photographs of original buildings, vintage aircraft, key persons, and important events created collaboratively by the FAA and PANYNJ (FAA, 2011).
When an adverse effect to historic properties cannot be avoided, the Section 106 participants identify measures to mitigate the individual and cumulative effects of the project. Mitigation is the public benefit that balances the loss (or diminishment) of the historic resource. Under the CTB Redevelopment Program, the unavoidable adverse effects of removing NRHP-eligible Hangars 1, 2, and 4 would be reduced through standard mitigation measures, including photographic documentation and HABS/HAER recordation of Hangars 1, 3, and 5, Hangars 2 and 4, and Hangar 7, thereby establishing a permanent public record of all six airport buildings. Under the Section 106 process, mitigation measures needed to reduce the effects of the CTB Redevelopment Program to a level of non-significance are stipulated in the signed MOA included in Appendix D of the 2014 EA.
Compliance with the Section 106 process, including an executed MOA, provides adequate assurance that the incremental adverse effects of the CTB Redevelopment Program have been considered and that the CTB Redevelopment Program, with mitigation measures, would not cause or contribute to a significant adverse cumulative impact on historic resources at the Airport.
The terminal design and apron/taxilane layout was not a point of discussion for the consulting parties when evaluating the adverse effects on the historic resources as part of the original CTB Redevelopment Program. The requirements in the Memorandum of Agreement that was concurred upon by the consulting parties (see Appendix D) will still be met under the proposed design changes. There were no scenarios examined as part of the original alternatives analysis or the 4(f) analysis where adverse effects to historic resources did not occur. All scenarios examined required the demolition of Hangars 1, 2, and 4 in accordance with the MOA. The proposed design changes slightly modify the footprint of the West Garage and move it roughly 35 feet further away from Hangars 3 and 5. This design change has been highlighted to the New York State Historic Preservation Office, and details of discussions about the design changes are reflected in Attachment 10.
5.2.8.9 Noise
The assessment of project-related noise impacts on the surrounding community is discussed in Section 5.13 and Appendix E of the 2014 EA.
Construction Phase
Cumulative noise impacts during construction may result from two conditions:
• Multiple construction activities occurring simultaneously in proximity to the same noise receptor, such that the total construction noise level from the multiple sources exceeds the impact threshold.
December 2015 Chapter 5 – Environmental Consequences 5-95
LaGuardia Airport Technical Report CTB Redevelopment Program
• Multiple construction activities occurring during non-overlapping but consecutive time periodsproximate to the same noise receptor.
Regarding the second condition, the cumulative effect is an extension of the exposure period of an activity as it relates to sensitive sites. For example, one project may allow pile driving at night while another allows pile driving during the day, thereby exposing the receiver to an extended period of noise. Alternatively, one project may result in pile driving from January to March, while another project may result in pile driving from March or April to May, thereby also extending the period of exposure.
As discussed in Section 5.19, Construction Impacts, the CTB Redevelopment Program is divided into multiple construction phases that would take approximately eight years to complete, beginning in 2014 and continuing through 2021. Heavy construction work is expected to occur on weekdays between the hours of 7:00 AM and 3:00 PM. Minimal work would occur between 3:00 PM to 11:00 PM, and mainly involves accepting materials deliveries. No construction work is expected to occur late at night or on weekends.
Change: The construction schedule for the proposed design changes would take under 68 months to complete, beginning in 2016 and continuing until the end of 2021. Heavy construction work is expected to occur on weekdays during two overlapping shifts between the hours of 6:00 AM and 3:00 PM. For a period of approximately 5.5 months centered on the peak construction period (the second quarter of 2017), there would be nighttime demolition activities occurring on the airside of the airport. Nighttime demolition activities will include demolishing airside apron and utility infrastructure. There will be no construction activity during these overnight hours, such as paving or pile driving. Only demolition and material removal will happen during these overnight hours. Nighttime demolition work is required to maintain consistency with overall project phasing as well as to avoid conflicts with aircraft operations during daytime operating hours.
During construction of the CTB Redevelopment Program, pile driving is anticipated to be the worst-case noise activity. The highest noise levels would occur during the early construction phases (between 2014 and 2017) corresponding with the pile driving activities.
Change: The highest noise levels would occur during the early construction phases (between 2016 and 2018).
A construction noise analysis was performed (see Appendix E of the 2014 EA), and it was determined that distance from residences would attenuate noise from the construction site, including pile driving, to levels that are well below established noise thresholds for construction phase activities.
At the Airport, two reasonably foreseeable projects may be under construction at the same time as the CTB Redevelopment Program. However, because pile-driving for the East End Substation/East Garage is already underway and will have already been completed, only one other project would potentially involve pile-driving during construction of the CTB Redevelopment Program.
• Runway Safety Area Enhancements: This PANYNJ project involves placing additional piles in thewater to support the deck extensions further into Flushing Bay. As part of implementation of theproject, there would be a temporary and localized increase in noise during pile-driving activities.No pile driving is associated with construction of the other elements of this project – sitepreparation for the Ingraham’s Mountain Construction Staging Area and construction related tothe realignment of Runway Drive and the RVSR. A construction noise analysis was performed forthe RSA Enhancements project; no significant noise impacts are anticipated.
December 2015 Chapter 5 – Environmental Consequences 5-96
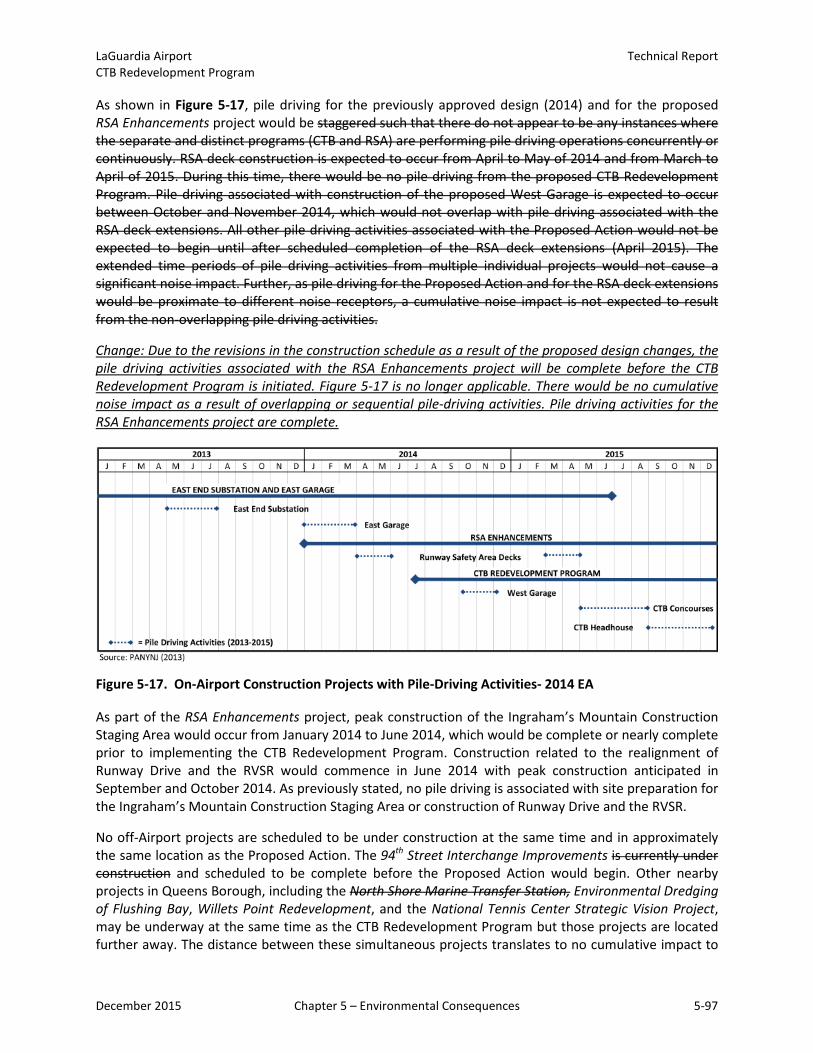
LaGuardia Airport Technical Report CTB Redevelopment Program
As shown in Figure 5-17, pile driving for the previously approved design (2014) and for the proposed RSA Enhancements project would be staggered such that there do not appear to be any instances where the separate and distinct programs (CTB and RSA) are performing pile driving operations concurrently or continuously. RSA deck construction is expected to occur from April to May of 2014 and from March to April of 2015. During this time, there would be no pile driving from the proposed CTB Redevelopment Program. Pile driving associated with construction of the proposed West Garage is expected to occur between October and November 2014, which would not overlap with pile driving associated with the RSA deck extensions. All other pile driving activities associated with the Proposed Action would not be expected to begin until after scheduled completion of the RSA deck extensions (April 2015). The extended time periods of pile driving activities from multiple individual projects would not cause a significant noise impact. Further, as pile driving for the Proposed Action and for the RSA deck extensions would be proximate to different noise receptors, a cumulative noise impact is not expected to result from the non-overlapping pile driving activities.
Change: Due to the revisions in the construction schedule as a result of the proposed design changes, the pile driving activities associated with the RSA Enhancements project will be complete before the CTB Redevelopment Program is initiated. Figure 5-17 is no longer applicable. There would be no cumulative noise impact as a result of overlapping or sequential pile-driving activities. Pile driving activities for the RSA Enhancements project are complete.
Figure 5-17. On-Airport Construction Projects with Pile-Driving Activities- 2014 EA
As part of the RSA Enhancements project, peak construction of the Ingraham’s Mountain Construction Staging Area would occur from January 2014 to June 2014, which would be complete or nearly complete prior to implementing the CTB Redevelopment Program. Construction related to the realignment of Runway Drive and the RVSR would commence in June 2014 with peak construction anticipated in September and October 2014. As previously stated, no pile driving is associated with site preparation for the Ingraham’s Mountain Construction Staging Area or construction of Runway Drive and the RVSR.
No off-Airport projects are scheduled to be under construction at the same time and in approximately the same location as the Proposed Action. The 94th Street Interchange Improvements is currently under construction and scheduled to be complete before the Proposed Action would begin. Other nearby projects in Queens Borough, including the North Shore Marine Transfer Station, Environmental Dredging of Flushing Bay, Willets Point Redevelopment, and the National Tennis Center Strategic Vision Project, may be underway at the same time as the CTB Redevelopment Program but those projects are located further away. The distance between these simultaneous projects translates to no cumulative impact to
December 2015 Chapter 5 – Environmental Consequences 5-97
LaGuardia Airport Technical Report CTB Redevelopment Program
the noise receptors that would be affected by construction noise resulting from the CTB Redevelopment Program.
Change: The 94th Street Interchange Improvements and North Shore Marine Transfer Station are complete.
Operations Phase
The potential for project related noise impacts on the surrounding community is discussed in Section 5.13 and Appendix E of the 2014 EA. An aircraft noise analysis was conducted and the results indicate that the CTB Redevelopment Program would result in a minor, but not significant, increase in noise levels in the vicinity of the airport. The changes would not begin to occur until after 2021 and would not reach predicted levels until 2030. The noise analysis was prepared using FAA-required methodology and the most current input data available from the Airport and the FAA, including aircraft operations forecasts, aircraft types, day-night distributions, runway use percentages, and flight tracks based on the latest published arrival and departures procedures.
Past, ongoing, and reasonably foreseeable future projects and/or actions were considered to determine if there is potential for cumulative exposure of individuals to aircraft noise in areas surrounding the Airport. The only major development projects at LaGuardia Airport in recent years were two infrastructure projects—the new Airport Traffic Control Tower (ATCT) and the Police Emergency Garage/Emergency Fire Pump Station—and neither project had any effect on the airport noise exposure contours. The East End Substation/East Garage project currently under construction is another Airport infrastructure project that will have no effect on Airport noise. In the future, if the Runway Safety Area Enhancements project is implemented, there would be no effect on aircraft noise because there would no change to runway length, touchdown points, or aircraft operations. Finally, no off-Airport projects—past, present or future—would have any effect on aircraft operations or noise levels in the vicinity of the Airport. On this basis, it can be concluded that no past, on-going, or reasonably foreseeable project undertaken by PANYNJ would combine with the noise impacts of the CTB Redevelopment Program to result in significant cumulative noise impacts for the operations phases of these projects.
Other federal actions involving airspace and air traffic control also have the potential to affect noise levels in the community. For this reason, the aircraft noise analysis (Appendix E of the 2014 EA) focuses on how the CTB Redevelopment Program would change the cumulative noise exposure of individuals to aircraft noise in areas surrounding the Airport. For example, the FAA recently implemented a departure procedure known as the TNNIS (pronounced “tennis”) climb.91 To ensure that the most recent flight procedures have been considered, flights tracks used for the aircraft noise analysis of existing and future conditions include the use of the TNNIS climb departure procedure, and the results indicate that, as defined by federal guidelines and requirements, no significant noise impacts would occur. No other changes to flight procedures are proposed at this time. In the future, no significant changes to flight track locations or track dispersions are expected to occur between operations years 2021 and 2030 as a result of the CTB Redevelopment Program.
5.2.8.10 Water Quality
As discussed in Chapter 4, Affected Environment, LaGuardia Airport is surrounded on three sides by surface waters associated with Flushing Bay; however, no surface waters are present within the project
91 The FAA conducted an environmental review pursuant to NEPA and determined that the use of this procedure will not produce significant environmental impacts and issued a Categorical Exclusion (October 2012).
December 2015 Chapter 5 – Environmental Consequences 5-98
LaGuardia Airport Technical Report CTB Redevelopment Program
site. For this reason, incremental effects would be limited to potential changes in the quantity and quality of storm runoff during and after construction, and the effects are expected to be minor.
Construction Phase
Past and ongoing projects undertaken by PANYNJ at LaGuardia Airport may have had temporary construction-period effects, but have not adversely affected water quality in the long term. No other past or ongoing construction projects in the cumulative impacts study area are known to have had an adverse impact on water resources associated with Flushing Bay. Two reasonably foreseeable actions that could affect water quality during construction of the CTB Redevelopment Program include:
• Runway Safety Area Enhancements at LaGuardia Airport. This PANYNJ project involves placing additional piles in the water to support the deck extensions further into Flushing Bay. If constructed, there would be a localized and temporary increase in suspended sediment levels during pile-driving. No long-term impacts or changes are expected to occur after the construction period. Change: The in-water work for this project is complete.
• Environmental Dredging of Flushing Bay. This project, to be undertaken by NYCDEP, would also result in temporary increases in suspended sediment levels during dredging operations, but is anticipated to have only localized, temporary, and minor adverse effects on water quality. BMPs and restrictions required by the U.S. Army Corps of Engineer permits would ensure water quality is maintained. The dredging project is intended to improve overall water quality within the area after construction is complete.
The assessment of impacts on water resources is discussed in Section 5.16, Water Quality and Section 5.19, Construction Impacts. The CTB Redevelopment Program does not involve in-water construction like the projects listed above; therefore, potential impacts on Flushing Bay would be limited to storm runoff from the construction site. Storm runoff during construction would be regulated by the NYSDEC under the SPDES program, which mandates implementation of a Storm Water Pollution Prevention Plan (SWPPP) to prevent storm water contamination during the construction period. The SWPPP would describe all the construction site operator’s activities to prevent storm water contamination, control sedimentation and erosion, and comply with the SPDES permit. Compliance with the SPDES permit, including the SWPPP for construction, provides adequate assurance that the CTB Redevelopment Program would avoid or minimize incremental increases in storm runoff pollution and that the limited discharges of sediment from the construction site would not cause or contribute to a significant adverse impact on the receiving waters associated with Flushing Bay.
Operations Phase
The CTB Redevelopment Program, when considered with other past, present, and reasonably foreseeable actions, would not have a significant adverse impact on surface waters adjacent to the Airport. As discussed in Section 5.16, the overall impact on storm runoff is expected to be a positive one due to the installation of new water quality devices and the implementation of BMPs and control measures to reduce the quantity and improve the quality of storm runoff from the Airport.
December 2015 Chapter 5 – Environmental Consequences 5-99
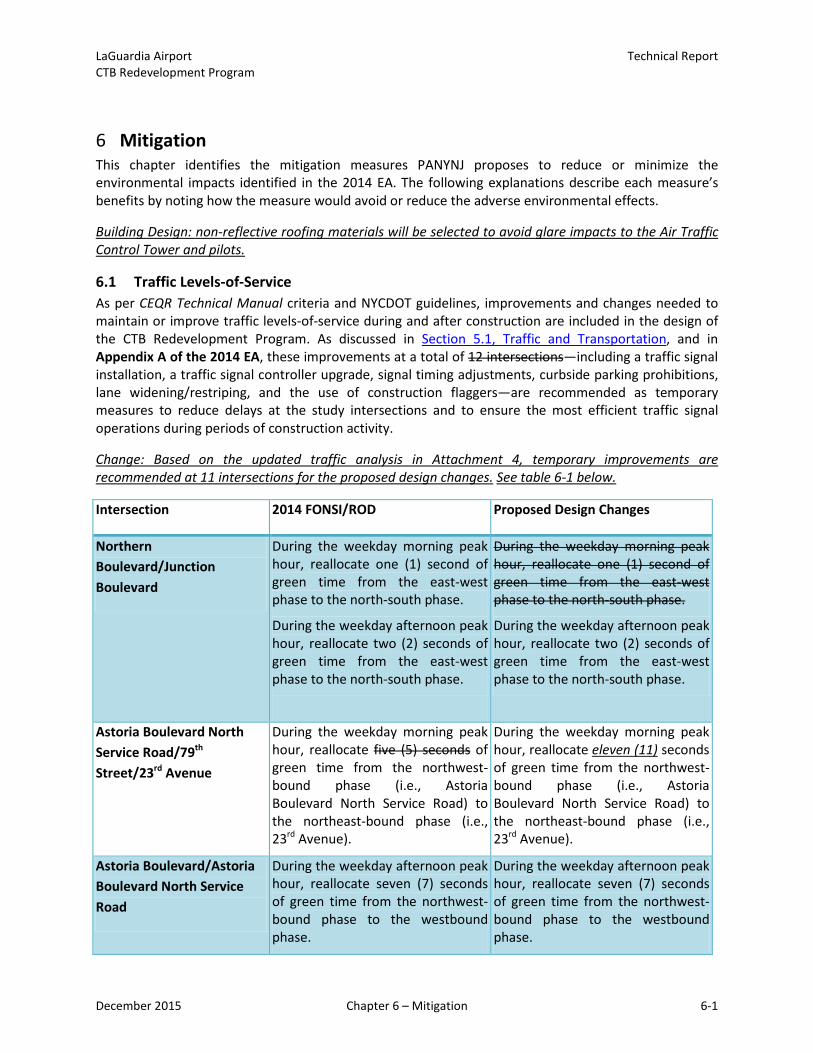
LaGuardia Airport Technical Report CTB Redevelopment Program
6 Mitigation This chapter identifies the mitigation measures PANYNJ proposes to reduce or minimize the environmental impacts identified in the 2014 EA. The following explanations describe each measure’s benefits by noting how the measure would avoid or reduce the adverse environmental effects.
Building Design: non-reflective roofing materials will be selected to avoid glare impacts to the Air Traffic Control Tower and pilots.
6.1 Traffic Levels-of-Service As per CEQR Technical Manual criteria and NYCDOT guidelines, improvements and changes needed to maintain or improve traffic levels-of-service during and after construction are included in the design of the CTB Redevelopment Program. As discussed in Section 5.1, Traffic and Transportation, and in Appendix A of the 2014 EA, these improvements at a total of 12 intersections—including a traffic signal installation, a traffic signal controller upgrade, signal timing adjustments, curbside parking prohibitions, lane widening/restriping, and the use of construction flaggers—are recommended as temporary measures to reduce delays at the study intersections and to ensure the most efficient traffic signal operations during periods of construction activity.
Change: Based on the updated traffic analysis in Attachment 4, temporary improvements are recommended at 11 intersections for the proposed design changes. See table 6-1 below.
Intersection 2014 FONSI/ROD Proposed Design Changes
Northern Boulevard/Junction Boulevard
During the weekday morning peak hour, reallocate one (1) second of green time from the east-west phase to the north-south phase.
During the weekday afternoon peak hour, reallocate two (2) seconds of green time from the east-west phase to the north-south phase.
During the weekday morning peak hour, reallocate one (1) second of green time from the east-west phase to the north-south phase.
During the weekday afternoon peak hour, reallocate two (2) seconds of green time from the east-west phase to the north-south phase.
Astoria Boulevard North Service Road/79th Street/23rd Avenue
During the weekday morning peak hour, reallocate five (5) seconds of green time from the northwest-bound phase (i.e., Astoria Boulevard North Service Road) to the northeast-bound phase (i.e., 23rd Avenue).
During the weekday morning peak hour, reallocate eleven (11) seconds of green time from the northwest-bound phase (i.e., Astoria Boulevard North Service Road) to the northeast-bound phase (i.e., 23rd Avenue).
Astoria Boulevard/Astoria Boulevard North Service Road
During the weekday afternoon peak hour, reallocate seven (7) seconds of green time from the northwest-bound phase to the westbound phase.
During the weekday afternoon peak hour, reallocate seven (7) seconds of green time from the northwest-bound phase to the westbound phase.
December 2015 Chapter 6 – Mitigation 6-1
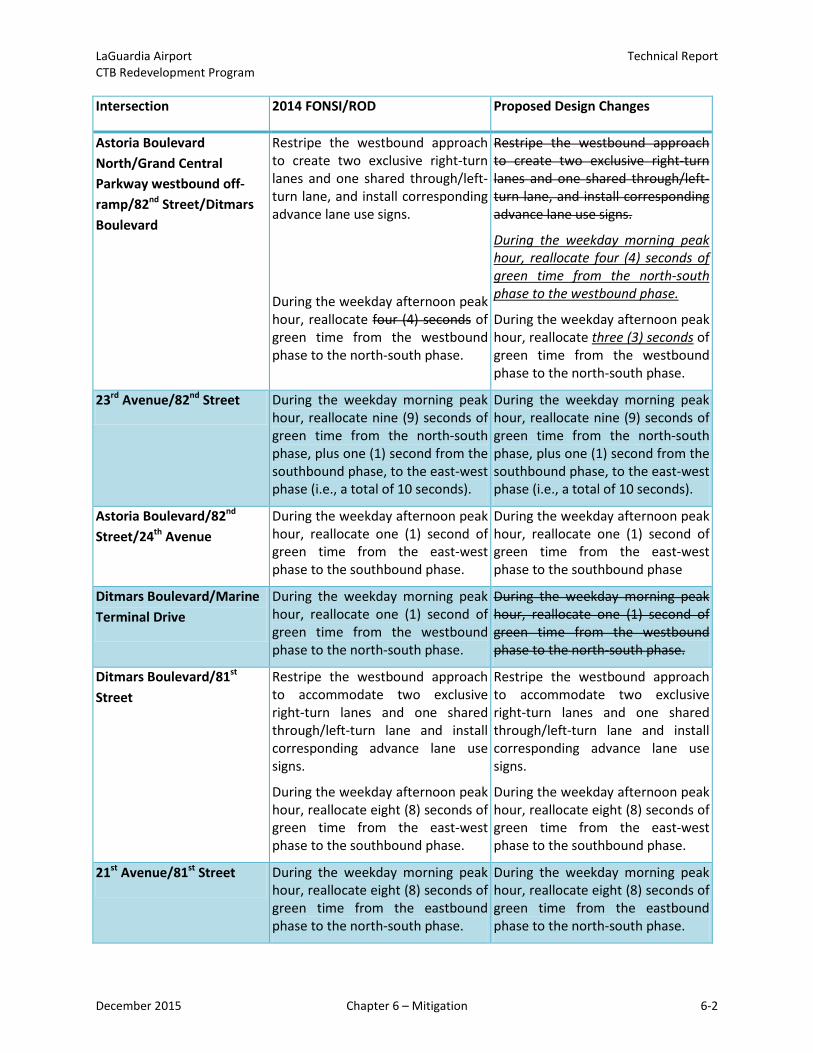
LaGuardia Airport Technical Report CTB Redevelopment Program
Intersection 2014 FONSI/ROD Proposed Design Changes
Astoria Boulevard North/Grand Central Parkway westbound off-ramp/82nd Street/Ditmars Boulevard
Restripe the westbound approach to create two exclusive right-turn lanes and one shared through/left-turn lane, and install corresponding advance lane use signs.
During the weekday afternoon peak hour, reallocate four (4) seconds of green time from the westbound phase to the north-south phase.
Restripe the westbound approach to create two exclusive right-turn lanes and one shared through/left-turn lane, and install corresponding advance lane use signs.
During the weekday morning peak hour, reallocate four (4) seconds of green time from the north-south phase to the westbound phase.
During the weekday afternoon peak hour, reallocate three (3) seconds of green time from the westbound phase to the north-south phase.
23rd Avenue/82nd Street During the weekday morning peak hour, reallocate nine (9) seconds of green time from the north-south phase, plus one (1) second from the southbound phase, to the east-west phase (i.e., a total of 10 seconds).
During the weekday morning peak hour, reallocate nine (9) seconds of green time from the north-south phase, plus one (1) second from the southbound phase, to the east-west phase (i.e., a total of 10 seconds).
Astoria Boulevard/82nd Street/24th Avenue
During the weekday afternoon peak hour, reallocate one (1) second of green time from the east-west phase to the southbound phase.
During the weekday afternoon peak hour, reallocate one (1) second of green time from the east-west phase to the southbound phase
Ditmars Boulevard/Marine Terminal Drive
During the weekday morning peak hour, reallocate one (1) second of green time from the westbound phase to the north-south phase.
During the weekday morning peak hour, reallocate one (1) second of green time from the westbound phase to the north-south phase.
Ditmars Boulevard/81st Street
Restripe the westbound approach to accommodate two exclusive right-turn lanes and one shared through/left-turn lane and install corresponding advance lane use signs.
During the weekday afternoon peak hour, reallocate eight (8) seconds of green time from the east-west phase to the southbound phase.
Restripe the westbound approach to accommodate two exclusive right-turn lanes and one shared through/left-turn lane and install corresponding advance lane use signs.
During the weekday afternoon peak hour, reallocate eight (8) seconds of green time from the east-west phase to the southbound phase.
21st Avenue/81st Street During the weekday morning peak hour, reallocate eight (8) seconds of green time from the eastbound phase to the north-south phase.
During the weekday morning peak hour, reallocate eight (8) seconds of green time from the eastbound phase to the north-south phase.
December 2015 Chapter 6 – Mitigation 6-2
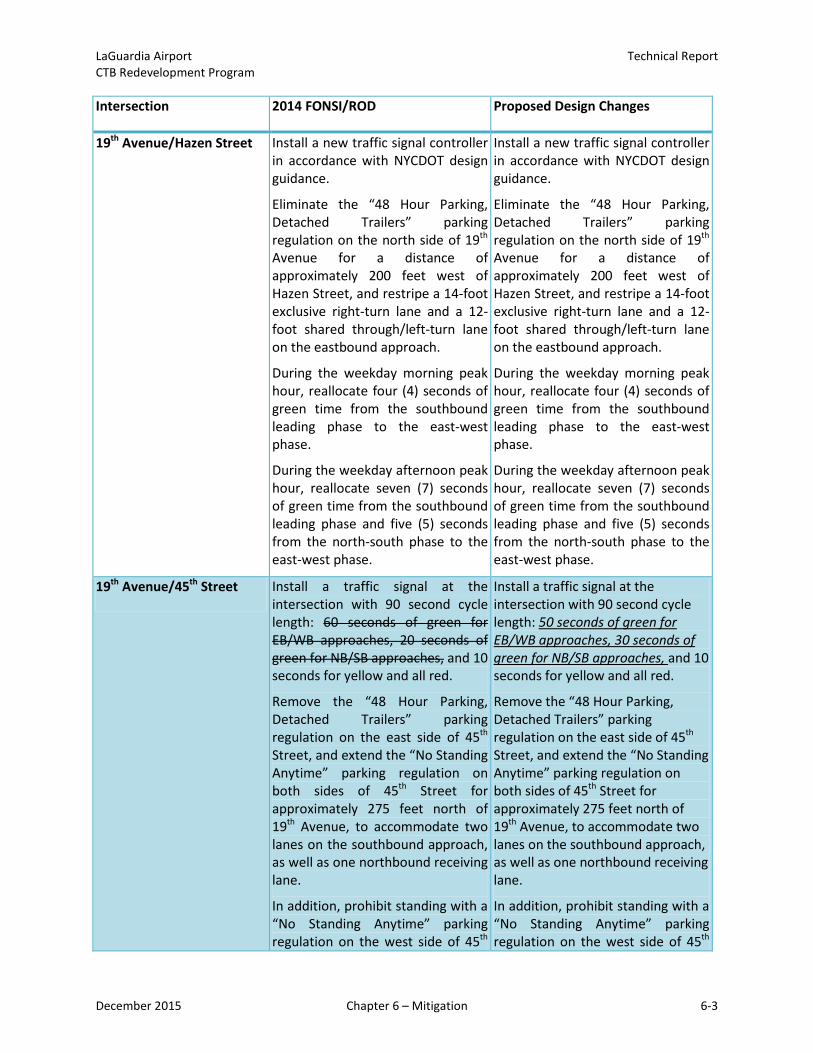
LaGuardia Airport Technical Report CTB Redevelopment Program
Intersection 2014 FONSI/ROD Proposed Design Changes
19th Avenue/Hazen Street Install a new traffic signal controller in accordance with NYCDOT design guidance.
Eliminate the “48 Hour Parking, Detached Trailers” parking regulation on the north side of 19th Avenue for a distance of approximately 200 feet west of Hazen Street, and restripe a 14-foot exclusive right-turn lane and a 12-foot shared through/left-turn lane on the eastbound approach.
During the weekday morning peak hour, reallocate four (4) seconds of green time from the southbound leading phase to the east-west phase.
During the weekday afternoon peak hour, reallocate seven (7) seconds of green time from the southbound leading phase and five (5) seconds from the north-south phase to the east-west phase.
Install a new traffic signal controller in accordance with NYCDOT design guidance.
Eliminate the “48 Hour Parking, Detached Trailers” parking regulation on the north side of 19th Avenue for a distance of approximately 200 feet west of Hazen Street, and restripe a 14-foot exclusive right-turn lane and a 12-foot shared through/left-turn lane on the eastbound approach.
During the weekday morning peak hour, reallocate four (4) seconds of green time from the southbound leading phase to the east-west phase.
During the weekday afternoon peak hour, reallocate seven (7) seconds of green time from the southbound leading phase and five (5) seconds from the north-south phase to the east-west phase.
19th Avenue/45th Street Install a traffic signal at the intersection with 90 second cycle length: 60 seconds of green for EB/WB approaches, 20 seconds of green for NB/SB approaches, and 10 seconds for yellow and all red.
Remove the “48 Hour Parking, Detached Trailers” parking regulation on the east side of 45th Street, and extend the “No Standing Anytime” parking regulation on both sides of 45th Street for approximately 275 feet north of 19th Avenue, to accommodate two lanes on the southbound approach, as well as one northbound receiving lane.
In addition, prohibit standing with a “No Standing Anytime” parking regulation on the west side of 45th
Install a traffic signal at the intersection with 90 second cycle length: 50 seconds of green for EB/WB approaches, 30 seconds of green for NB/SB approaches, and 10 seconds for yellow and all red.
Remove the “48 Hour Parking, Detached Trailers” parking regulation on the east side of 45th Street, and extend the “No Standing Anytime” parking regulation on both sides of 45th Street for approximately 275 feet north of 19th Avenue, to accommodate two lanes on the southbound approach, as well as one northbound receiving lane.
In addition, prohibit standing with a “No Standing Anytime” parking regulation on the west side of 45th
December 2015 Chapter 6 – Mitigation 6-3
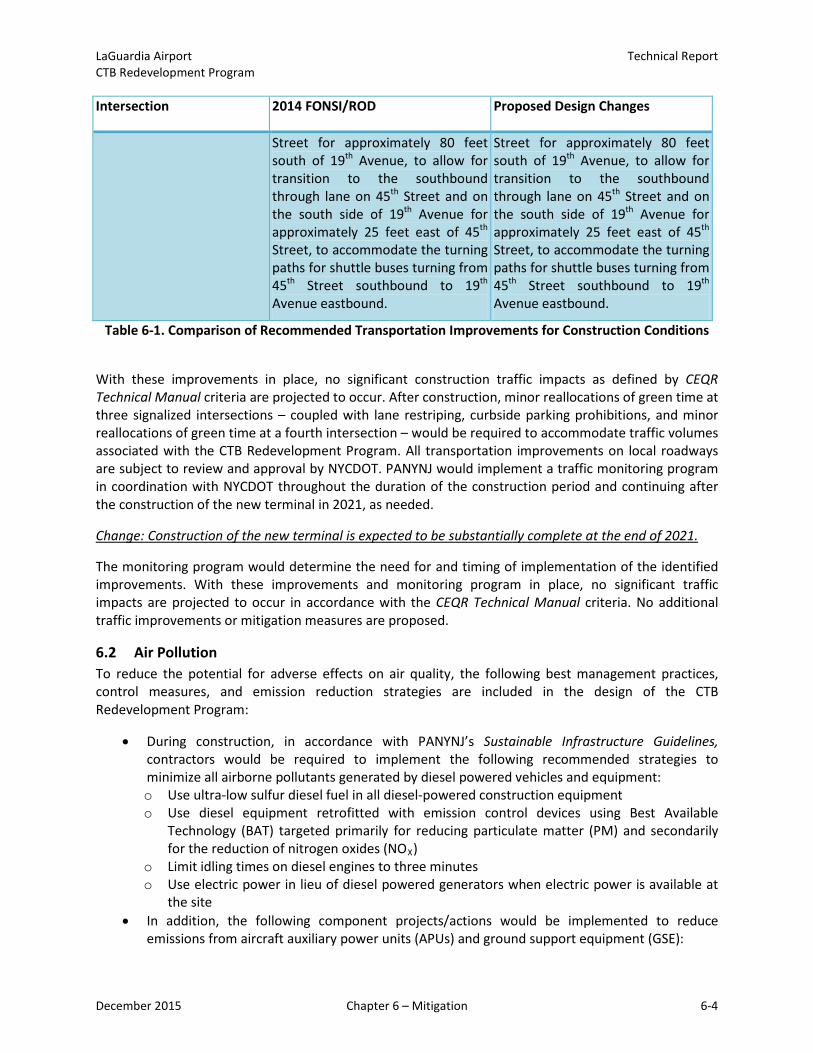
LaGuardia Airport Technical Report CTB Redevelopment Program
Intersection 2014 FONSI/ROD Proposed Design Changes
Street for approximately 80 feet south of 19th Avenue, to allow for transition to the southbound through lane on 45th Street and on the south side of 19th Avenue for approximately 25 feet east of 45th Street, to accommodate the turning paths for shuttle buses turning from 45th Street southbound to 19th Avenue eastbound.
Street for approximately 80 feet south of 19th Avenue, to allow for transition to the southbound through lane on 45th Street and on the south side of 19th Avenue for approximately 25 feet east of 45th Street, to accommodate the turning paths for shuttle buses turning from 45th Street southbound to 19th Avenue eastbound.
Table 6-1. Comparison of Recommended Transportation Improvements for Construction Conditions
With these improvements in place, no significant construction traffic impacts as defined by CEQR Technical Manual criteria are projected to occur. After construction, minor reallocations of green time at three signalized intersections – coupled with lane restriping, curbside parking prohibitions, and minor reallocations of green time at a fourth intersection – would be required to accommodate traffic volumes associated with the CTB Redevelopment Program. All transportation improvements on local roadways are subject to review and approval by NYCDOT. PANYNJ would implement a traffic monitoring program in coordination with NYCDOT throughout the duration of the construction period and continuing after the construction of the new terminal in 2021, as needed.
Change: Construction of the new terminal is expected to be substantially complete at the end of 2021.
The monitoring program would determine the need for and timing of implementation of the identified improvements. With these improvements and monitoring program in place, no significant traffic impacts are projected to occur in accordance with the CEQR Technical Manual criteria. No additional traffic improvements or mitigation measures are proposed.
6.2 Air Pollution To reduce the potential for adverse effects on air quality, the following best management practices, control measures, and emission reduction strategies are included in the design of the CTB Redevelopment Program:
• During construction, in accordance with PANYNJ’s Sustainable Infrastructure Guidelines, contractors would be required to implement the following recommended strategies to minimize all airborne pollutants generated by diesel powered vehicles and equipment: o Use ultra-low sulfur diesel fuel in all diesel-powered construction equipment o Use diesel equipment retrofitted with emission control devices using Best Available
Technology (BAT) targeted primarily for reducing particulate matter (PM) and secondarily for the reduction of nitrogen oxides (NOX)
o Limit idling times on diesel engines to three minutes o Use electric power in lieu of diesel powered generators when electric power is available at
the site • In addition, the following component projects/actions would be implemented to reduce
emissions from aircraft auxiliary power units (APUs) and ground support equipment (GSE):
December 2015 Chapter 6 – Mitigation 6-4
LaGuardia Airport Technical Report CTB Redevelopment Program
o Install 400Hz ground power and pre-conditioned air (PCAir) units at each gate position o Require exclusive use of electric bag tractors, belt loaders and push-back tractors at each
gate position
As discussed in Section 5.2, Air Quality and Appendix B of the 2014 EA, the CTB Redevelopment Program is designed to reduce aircraft congestion and delay on the terminal apron and traffic congestion and delay on the terminal area roadways, thereby reducing fuel consumption and, by extension, air pollution. In addition, the strategies listed above are included in the design of the CTB Redevelopment Program in an effort to further reduce emissions to the degree practicable. As a result, the CTB Redevelopment Program would result in no emissions increase or an increase that is clearly de minimis. No additional mitigation measures are proposed.
6.3 Impacts on Section 4(f) Resources Of the resources protected by Section 4(f) of the U.S. DOT Act, only historic properties have been identified as affected by the CTB Redevelopment Program. Adverse effects to historic properties and mitigation measures needed to resolve adverse effects are addressed separately in Section 6.7.
6.4 Tree Removal and Replacement Where NYC Tree removal cannot be avoided, tree replacement would comply with a NYCDPR Construction and Forestry Permit and a mitigation plan approved by NYCDPR. As discussed in Section 5.7, Fish, Wildlife and Plants, the number of trees needed to replace the trees approved for removal would be determined in consultation with NYCDPR and in accordance with NYC Rules Governing Tree Replacement. PANYNJ has committed to develop a plan with NYCDPR to address local impacts to NYC Trees, including provisions for restitution for the loss of those trees (see letter dated June 2, 2014 in Appendix G of the 2014 EA).
6.5 Floodplain Development Where development within the coastal floodplain cannot be avoided, the CTB Redevelopment Program would comply with federal, state, and local laws and regulations for the protection of floodplains as well as the referenced standards for flood resistant design and construction to the degree practicable. As discussed in Section 5.8, Floodplains, the CTB Redevelopment Program includes a flood hazard mitigation plan developed in accordance with the National Flood Insurance Program, the International Building Code, the American Society of Civil Engineers national reference standards, and the New York City Building Code.
Adherence to these requirements provides adequate assurance that project-related development impacts on the tidal floodplain would be less than significant. No additional mitigation measures are proposed.
6.6 Hazardous Materials and Pollution Prevention Where hazardous materials and waste cannot be avoided, PANYNJ would implement appropriate safety procedures and remediation strategies as needed to protect human health and the environment. As discussed in Section 5.9, Hazardous Materials, Pollution Prevention and Solid Waste, these procedures would include removal protocols for regulated hazardous substances including, but not necessarily limited to, the following: contaminated soils and/or groundwater; asbestos containing materials; lead-containing paint; and universal wastes such as light fixtures, PCB ballasts, thermostats, batteries, refrigerants, etc.
December 2015 Chapter 6 – Mitigation 6-5
LaGuardia Airport Technical Report CTB Redevelopment Program
After construction, PANYNJ would update the Spill Prevention Control and Countermeasures (SPCC) Plan for LaGuardia Airport. The current SPCC plan would be revised to reflect changes in the use, handling, and storage of hazardous materials and wastes associated with day-to-day operation and maintenance of the CTB Redevelopment Program.
6.7 Adverse Effects to Historic Properties Where adverse impacts to historic properties cannot be avoided, implementation of the CTB Redevelopment Program would include the following mitigation measures as stipulated in the signed Memorandum of Agreement that was developed by the FAA in consultation with SHPO, PANYNJ, and other Consulting Parties:
• Recordation. Level III Historical Architectural Building Survey/Historic American Engineering Record (HABS/HAER) recordation of Hangars 1, 3, and 5, Hangars 2 and 4, and Hangar 7. Change: This action has been completed and submitted to NPS. Hangars 2 and 4 were demolished during the summer of 2015 in accordance with the MOA. The mitigation measures detailed herein will continue to be followed. The proposed design changes were provided to SHPO, and details of discussions with agencies about the design changes are reflected in Attachment 10.
• Archaeological Monitoring of Areas of Sensitivity. Construction phase monitoring of select earthwork and excavation in the vicinity of the West Garage in accordance with a monitoring protocol approved by SHPO.
• Demolition/Construction Management Plan. Implementation of procedures to ensure that potential adverse effects to Hangars 3 and 5 are avoided to the greatest extent practicable during all phases of demolition and construction associated with the CTB Redevelopment Program.
• Maintenance Plan. Implementation of procedures to ensure that Hangars 3 and 5 are maintained in a state of good repair for the foreseeable future.
• Interpretive Display on the History of LaGuardia Airport. Preparation of a public display illustrating the significance of the 1939 and 1964 Central Terminal Buildings and Hangars 1, 2, 3, 4, 5 and 7.
As discussed in Section 5.10, Historical, Architectural, Archaeological, and Cultural Resources, a copy of the signed Memorandum of Agreement is included with Appendix D of the 2014 EA. A fully executed Memorandum of Agreement verifies that the unavoidable adverse effects to historic properties have been resolved and that the Section 106 process is complete.
6.8 Noise Though construction equipment noise levels are expected to be well below applicable significance thresholds, PANYNJ would require the contractor to prepare a Construction Noise Mitigation Plan, which would include various noise control measures and alternatives for contractors to continue their important construction tasks while having less noise impact on the surrounding environment.
Change: Those measures include the following:
• Conduct all construction activities during the daytime whenever possible (note that this will not be possible for a 5.5 month period around the 2nd Quarter of 2017, when demolition work will
December 2015 Chapter 6 – Mitigation 6-6
LaGuardia Airport Technical Report CTB Redevelopment Program
occur on the airside between 10:00PM and 6:00AM; this is discussed in Section 5.2.7-Construction Impacts);
• Require special permits for all construction within a specified distance and a specified time period for residential zones during the night and weekends;
• Use construction equipment with effective noise-suppression devices;
• Use noise control measures as necessary, such as enclosures and noise barriers, to protect the public and achieve compliance with all City noise ordinances; and
• Conduct all operations in a manner that will minimize, to the greatest extent feasible, disturbance to the public in areas adjacent to the construction activities and to occupants of nearby buildings.
As discussed in Section 5.13, Noise and Appendix E of the 2014 EA, the highest noise levels would be associated with pile-driving activities; therefore, the following pile-driving noise attenuation measures are recommended:
• Reduce the impact sound of the ram hitting the pile cap by placing a resilient pad in the anvil chamber;
• Reduce the discharge sound of the hammer's air exhaust by installing a rectangular steel enclosure lined with acoustically-absorptive material to provide both sound absorption and a limp mass noise barrier;
• Reduce the "ringing" noise of the steel piles by utilizing acoustical paint across the web of each pile at 4- to 6-foot intervals; and
• Prohibit pile driving at night.
Additional strategies to reduce noise and vibration during construction are provided in PANYNJ’s Sustainable Infrastructure Guidelines. They include:
• Require all debris conveyors and containers to be lined or covered with sound absorbing materials;
• Require all pneumatic support equipment to have intake and exhaust mufflers recommended by the manufacturer;
• Require all impact devices to be equipped with acoustically attenuating shields or shrouds recommended by the manufacturer;
• Require all internal combustion equipment to have mufflers and shield paneling recommended by the manufacturer;
• Require idling time for both on-road and off-road equipment and vehicles to be limited to 3 minutes;
• Minimize the use of equipment that generates more than 80 db(A) of noise, and use such equipment only during daylight hours (i.e. not at night in residential areas);
December 2015 Chapter 6 – Mitigation 6-7
LaGuardia Airport Technical Report CTB Redevelopment Program
• Limit vibration resulting from construction equipment when work is close to tunnels, utilities or other sensitive structures and closely monitor peak particle velocity compliance through seismograph readings;
• Utilize an approved sound level meter for self-monitoring and proactively correct conditions where the noise generated by specific pieces of equipment exceeds allowable levels; and
• Utilize noise barriers to contain noise where practicable.
After construction, no additional noise mitigation measures are proposed.
6.9 Water Quality Construction activities would comply with applicable NYSDEC water quality standards and permit requirements including preparing a Storm Water Pollution Prevention Plan (SWPPP) and filing a Notice of Intent. In accordance with the airport’s State Pollutant Discharge Elimination System (SPDES) permit, PANYNJ would implement appropriate water quality measures to minimize erosion and sedimentation during construction as described in the LaGuardia Airport Best Management Practices Plan. These measures include, but are not necessarily limited to, the following:
• Prepare spill prevention and erosion control plans;
• Stabilize construction entrances;
• Install slope drains;
• Install inlet filters at all drainage inlet structures;
• Use perimeter erosion and sedimentation controls consisting of staked hay bales, filter fence, and silt fence;
• Use water or suppressing agents to control dust; and
• Sweep clean paved construction roads at the end of each day.
After construction, all the improvements and changes needed for airport operations to comply with applicable NYSDEC water quality standards and permit requirements are included in the design of the CTB Redevelopment Program. As discussed in Section 5.16, Water Quality, the overall impact on storm runoff would be a positive one due the installation of manufactured treatment devices, bio-filtration swales, and a system to harvest rainwater for beneficial re-use—BMPs that are not in place today and could not be reasonably implemented without new construction, for example:
• Subsurface oil/water separators would be installed to slow the rate of runoff from the aircraft park apron and to ensure that pollutants are captured and collected during and after rainfall events;
• A deicing containment system would be installed as part of the apron storm drainage to allow spent aircraft deicing fluid to be isolated, pumped out, and properly disposed, preventing the discharge of contaminants to surrounding waters;
December 2015 Chapter 6 – Mitigation 6-8
LaGuardia Airport Technical Report CTB Redevelopment Program
• Vegetative swales would be designed to channel storm runoff away from the roadways and parking lots to be infiltrated or otherwise processed through oil/water separator before being discharged.
In addition, the Sustainable Design Plan identifies water efficiency measures to be incorporated into the design of the new terminal building. For instance, the terminal roof would be designed to collect and store rainwater for graywater applications (i.e., flush fixtures, landscape irrigation, etc.).
Change: Rainwater harvesting, stored in underground tanks below the headhouse, will be used for irrigation at the site.
In sum, the CTB Redevelopment Program includes more than adequate means and measures to reduce the quantity and to improve the quality of storm runoff during and after construction, and sustainability measures are also included in the design of the new terminal in order to achieve the benefits of green building and LEED certification. With these provisions in place, no additional mitigation measures are needed to reduce the impacts of the CTB Redevelopment Program below applicable significance thresholds.
December 2015 Chapter 6 – Mitigation 6-9
Technical Report
7 Public Involvement
The public involvement section from the 2014 EA is restated below. Since the 2014 FONSI/ROD additional outreach has occurred with the following agencies and organizations: The Offices of Senator Jose Peralta and Congressman Joe Crowley, Queens Community Board #3, the United Civic Community Association, the New York City Economic Development Corporation, New York State Department of Transportation, New York City Department of Transportation, New York State Department of State, and New York City Department of City Planning, the Federal Aviation Administration (FAA), the Queens Borough President (Melinda Katz) and the Transportation Security Administration (TSA). Details on specific outreach conducted as a result of the proposed design changes are included in Attachment 10.
In accordance with NEPA and the CEQ regulations, PANYNJ has and will continue to involve the public in the decision-making process for the CTB Redevelopment Program. PANYNJ is committed to ensuring that stakeholders are informed about the CTB Redevelopment Program and its benefits and potential impacts. The Draft EA’s public review and comment period also served the public involvement requirements of the special purpose laws triggered by the Proposed Action – U.S. DOT Act of 1966 Section 4(f), Section 106 of the National Historic Preservation Act, and Executive Order 11988, Floodplain Management.
The Port Authority is making this Technical Report available to the public electronically on its website and physically at its World Trade Center, New York, NY and LaGuardia Airport, Flushing, NY Offices. The Technical Report was also made available at the Jackson Heights and Flushing branches of the Queens Borough Public Library. Notice of availability will be published in the Daily News (Queens edition), Newsday, Queens Courier, Queens Chronicle, Queens Gazette, Queens Tribune, Queens Times Ledger, Queens Ledger, El Especialito, The National Herald, Sing Tao Daily, Newark Star Ledger, and Bergen Record between November 30 and December 4, 2015. The document was made publicly available for 15 days from publication (until December 14, 2015). The proofs of the notice of availability are included in Attachment 10.
Scoping and Agency Consultation
Efforts to address the redevelopment of the Central Terminal Building date back to 2004. Senior management from the Airport and Aviation Headquarters at PANYNJ has worked closely with the Airport tenants and the local community on the development of the terminal plan. The plan has evolved significantly since that time and their input at every stage of development of the plan has helped to shape and improve the final proposal.
During that time staff held multiple briefing and workshops for the Queens Borough President, federal, state and local elected officials, the surrounding Community Boards, the Queens Borough President’s Aviation Advisory Council, NYCEDC and other City agencies, as well as a variety of community and business groups and civic associations. In addition, PANYNJ met frequently with the air carriers and other Airport tenants. They conducted airside and landside tours for the aforementioned groups, and included information about the planning project on PANYNJ’s website.
In 2004, PANYNJ sought FAA approval to use Passenger Facility Charge (PFC) fees to fund the Feasibility Study for the CTB. This required a presentation to the air carriers, as well as a formal notification in the Federal Register and other local notifications seeking public comment. Six years later, PANYNJ sought to
December 2015 Chapter 7 – Public Outreach 7-1
Technical Report
use additional PFCs for the Planning and Engineering Study for the CTB. Staff conducted two formal presentations for the carriers, and published the PFC application on the PANYNJ website seeking public comment.
PANYNJ has continued to perform outreach to the community as part of the EA process. A project website has been in place since 2012. Ongoing communication and stakeholder involvement is planned throughout the construction period.
As part of the planning process for the CTB Redevelopment EA, PANYNJ has met with many State and local agencies and presented the progress to-date on the Program and NEPA process, and discussed the agencies’ concerns. Those agencies included the following:
• NYC Department of Transportation, Division of Traffic Planning
• New York State Department of Transportation
• Metropolitan Transportation Authority
• NYC Department of Parks and Recreation
• NYC Economic Development Corporation
NYC Mayor’s Office of Environmental Coordination Section 106 Consultation
Section 106 of the National Historic Preservation Act requires that the lead agency seek input from Consulting Parties. As part of that process, FAA invited six organizations with interest in the history of the local area and aviation to participate in multiple meetings. The parties were sent the Cultural Resources Technical Memorandum. The first Consulting Parties meeting was held on September 26, 2013 at PANYNJ offices in Manhattan (225 Park Avenue South) and attended by representatives from PANYNJ, FAA, SHPO, New York Landmarks Conservancy, and the Queens Borough President’s Office. At that meeting a presentation describing the Proposed Action and Purpose and Need was given and a discussion of the adverse impacts to the historic hangars was initiated. A second meeting was held on October 29, 2013 at LaGuardia Airport, attended by representatives from PANYNJ, FAA, SHPO and the Municipal Art Society. Participants were given a tour of the NRHP-eligible hangars. Afterwards, mitigation options were discussed. Having reached a conclusion that no feasible alternative would avoid impacts to the historic resources, it was agreed that a memorandum of agreement (MOA) should be developed. Further negotiation of the MOA and discussion among the Section 106 participants regarding mitigation measures continued through the comment period for the Draft EA. A Final MOA has been signed by the required signatories and concurring consulting parties (see Appendix D of the 2014 EA), indicating that the Section 106 process is complete.
Public Comment
A website has been established to introduce the Program and keep the public updated on its progress (http://www.panynj.gov/lgactb). The public can email questions about the Program at any time to [email protected]. In addition, there were two opportunities for in-person public input – the Public Information Open House and the Public Information Session/Public Hearing.
The Public Information Open House was held on December 12, 2012 at the LaGuardia Airport Marriott (located across from the Airport at 102-05 Ditmars Boulevard) to introduce the Central Terminal Building Redevelopment Program and Environmental Assessment. The meeting took place from 3:00 PM to 5:00 PM and 6:00 PM to 8:00 PM to allow ample opportunity for interested parties to attend. Email and/or
December 2015 Chapter 7 – Public Outreach 7-2
Technical Report
hard copy letters of invitation were sent to over 260 individuals and organizations and notices were placed in 10 local newspapers. PANYNJ and consultant staff was available to present the need for and considerations in the development of plans to improve LaGuardia Airport. A series of story boards were on display that addressed the following topics: Welcome, History of the CTB, Airport Community and Context, Purpose and Need, Concepts for Redevelopment, Environmental Assessment Process, and Next Steps. A total of 51 people were in attendance. The presentation materials and detailed summary of the open house can be found in Appendix H of the 2014 EA.
The Public Information Session and Public Hearing were held at the LaGuardia Airport Marriott on May 8, 2014. Email and/or hard copy letters of invitation were sent to over 800 individuals and organizations and notices were placed in 13 local newspapers. A total of 53 people were in attendance, between the two sessions. At the Public Information Session (3:00 PM to 6:00 PM), PANYNJ staff were available to answer questions regarding the CTB Redevelopment Program and the Draft EA. At the Public Hearing (from 7:00 PM to 9:00 PM), individuals were given the opportunity publicly comment on the Draft EA and comments were recorded by a stenographer. The Hearing Officer described the regulatory background and hearing guidelines. PANYNJ gave a brief presentation on the CTB Redevelopment Program and Draft EA findings. Only one individual (representing the Global Gateway Alliance) gave testimony at the hearing. The presentation materials and hearing transcript can be found in Appendix H of the 2014 EA.
The Draft EA and Draft DOT Section 4(f) Evaluation were available for public comment for 45 days from April 9 to May 23, 2014. An announcement was printed in the Daily News (Queens edition), Newsday, Queens Chronicle, Queens Gazette, Queens Times Ledger, Queens Ledger, El Especialito, The National Herald, Sing Tao Daily, Queens Courier, Queens Tribune, Newark Star Ledger, and Bergen Record newspapers. The document was available at the PANYNJ’s Administration Building at LaGuardia Airport, PANYNJ’s office in Manhattan (225 Park Avenue South) and two branches of the Queens Borough Public Library (35-81 81st Street in Jackson Heights and 41-17 Main Street in Flushing). In addition, the Draft EA was posted on the PANYNJ website (http://www.panynj.gov/about/pdf/lga-ctb-redevelopment-environmental-assessment.pdf). The public was able to provide comments on the Draft EA by submitting comment cards, emails or other written testimony throughout the public comment period. On May 18, 2014, approximately 1,200 comment cards were distributed at Flushing Meadow Park. The Draft EA’s public review and comment period served as the public involvement requirements of the special purpose laws triggered by the Proposed Action – U.S. DOT Act of 1966 Section 4(f), Section 106 of the National Historic Preservation Act, and Executive Order 11988, Floodplain Management.
All comments received during the public comment period are compiled in Appendix H of the 2014 EA along with a response, as appropriate. All comments have been addressed in the 2014 EA.
All feedback received during the public availability period for the Technical Report is included in Attachment 10. One comment relating to sustainable design was received and addressed by the Port Authority.
December 2015 Chapter 7 – Public Outreach 7-3
Attachment 1
Overlay of New CTB Layout and Previously Approved Layout
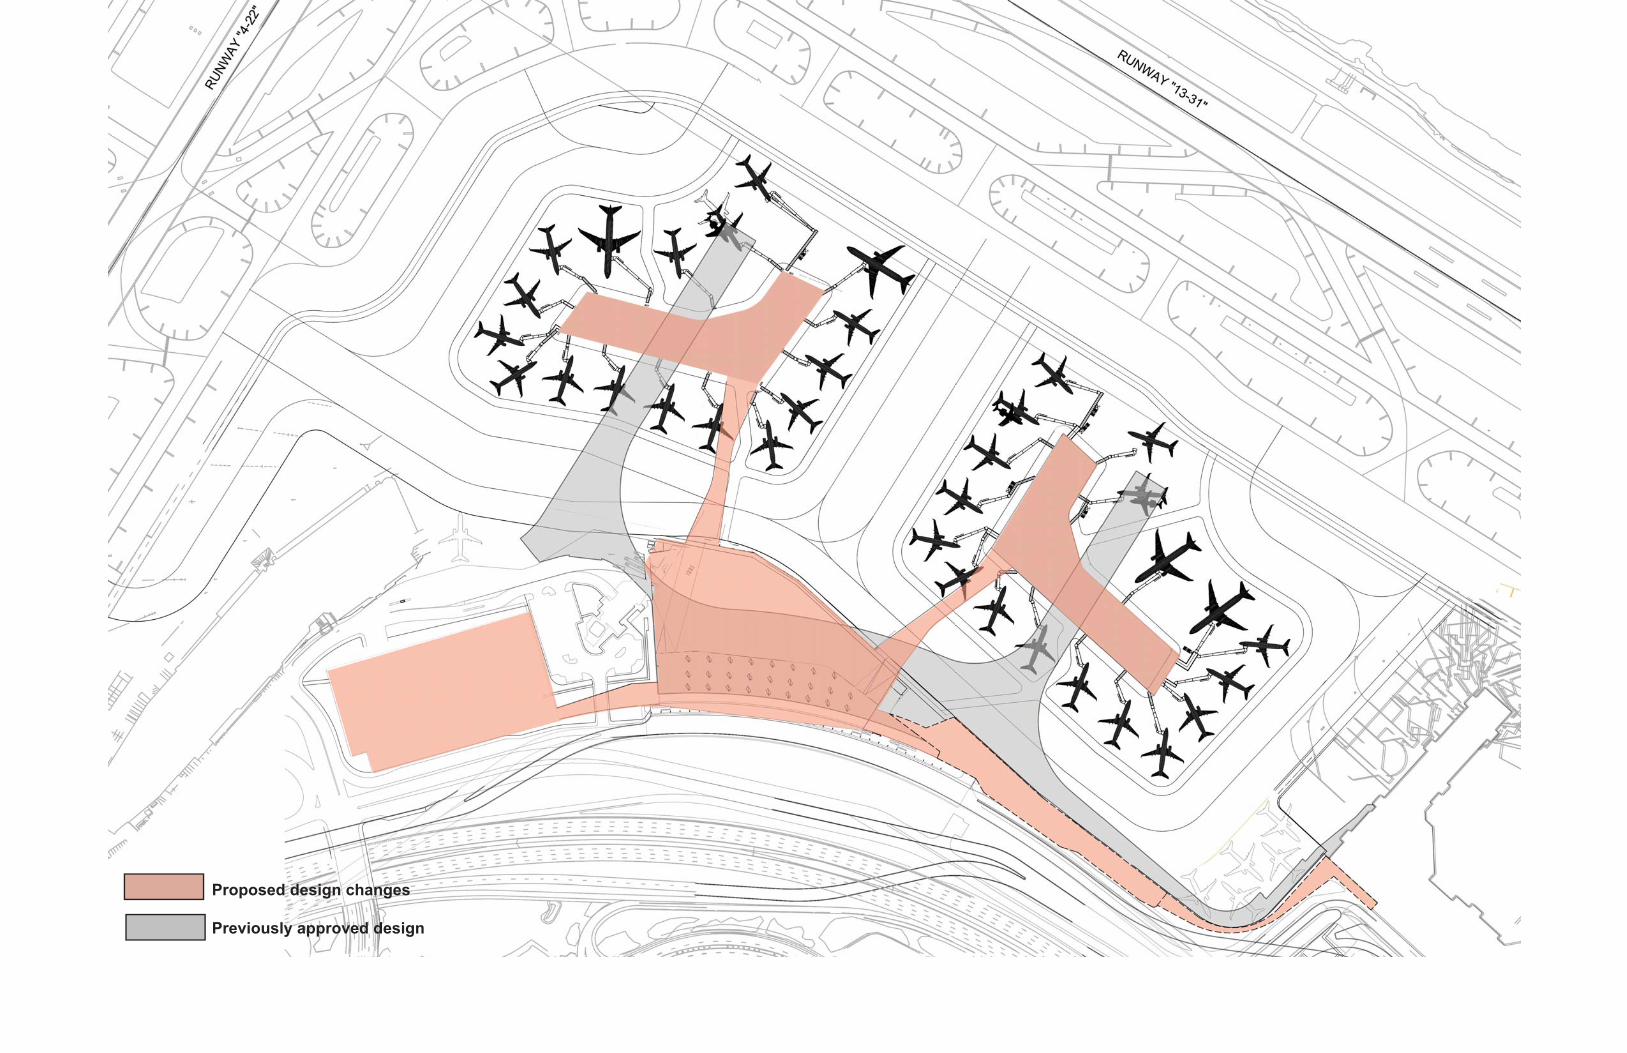
Proposed design changes
Previously approved design
Attachment 2
December 2015 LGA CTB Total
Aircraft and Airfield Model
(TAAM) Analysis
CENTRAL TERMINAL BUILDING
REDEVELOPMENT TAAM ANALYSIS
LAGUARDIA AIRPORT
PORT AUTHORITY OF NEW YORK AND
NEW JERSEY
Prepared by: Landrum & Brown
November 2015
LaGuardia Airport TAAM Analysis Central Terminal Building Redevelopment
Landrum & Brown 1 November 2015
1. INTRODUCTION
LaGuardia Airport (LGA) is one of three large-hub airports1 for the New York/New
Jersey Metropolitan region. In 2012, LGA was the third largest airport of the region in terms of passengers and in terms of aircraft operations. Indeed, LGA accommodated 25 million passengers or 23.3 percent of the region’s total
passenger traffic and 375,949 aircraft operations or 30.9 percent of the region’s traffic in 2012.
LGA accommodates domestic and precleared international traffic with regional commuter, narrow-body, and some wide-body commercial passenger aircraft.
LGA’s airfield includes two runways: one runway oriented in a northeast/southwest direction (Runway 04/22) and one runway oriented in a northwest/southeast
direction (Runway 13/31). Runway 04/22 is 7,001 feet in length and 150 feet wide, while Runway 13/31 is 7,003 feet long and 150 feet wide. Runway 04/22 intersects Runway 13/31 approximately 2,110 feet southwest of the Runway 22
threshold. Runway 13/31 intersects Runway 04/22 approximately 1,220 feet southeast of the Runway 13 threshold. LGA also has four passenger terminals,
known as Marine Air Terminal (Terminal A), Central Terminal Building (Terminal B), Delta Terminal (Terminal C), and Delta Terminal (Terminal D). Figure 1-1 presents LGA’s current layout plan.
1 Federal Aviation Administration, National Plan of Integrated Airport Systems.
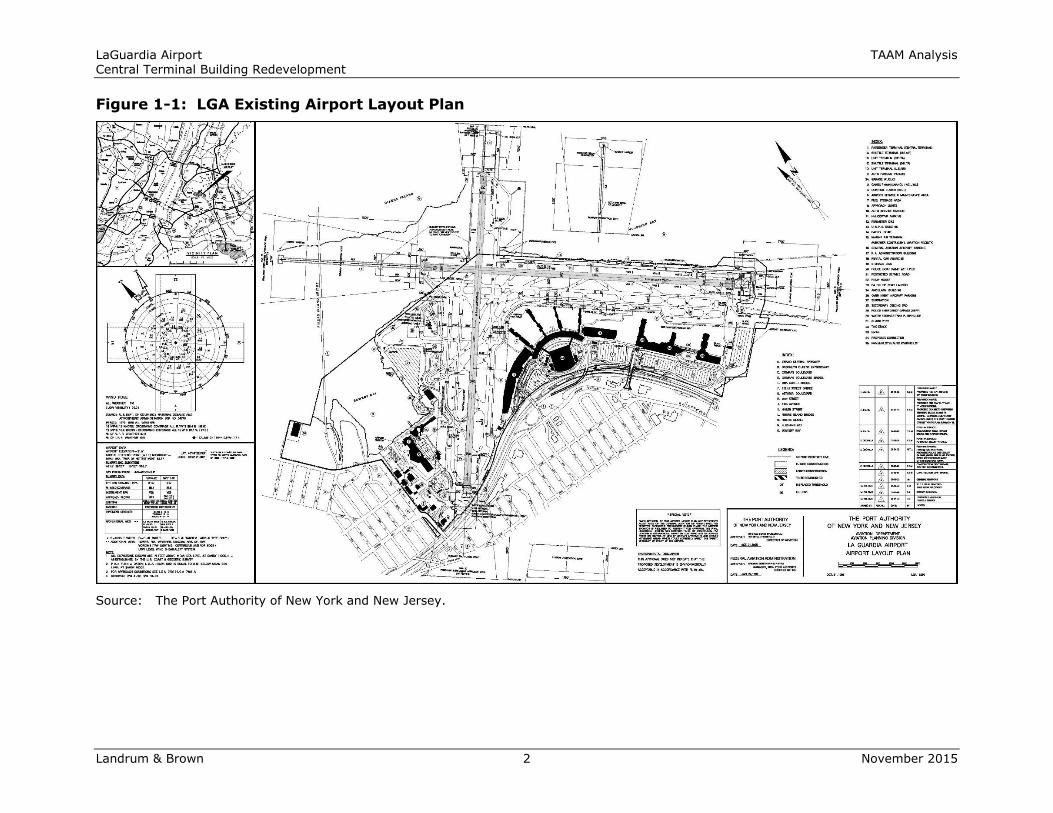
LaGuardia Airport TAAM Analysis Central Terminal Building Redevelopment
Landrum & Brown 2 November 2015
Figure 1-1: LGA Existing Airport Layout Plan
Source: The Port Authority of New York and New Jersey.
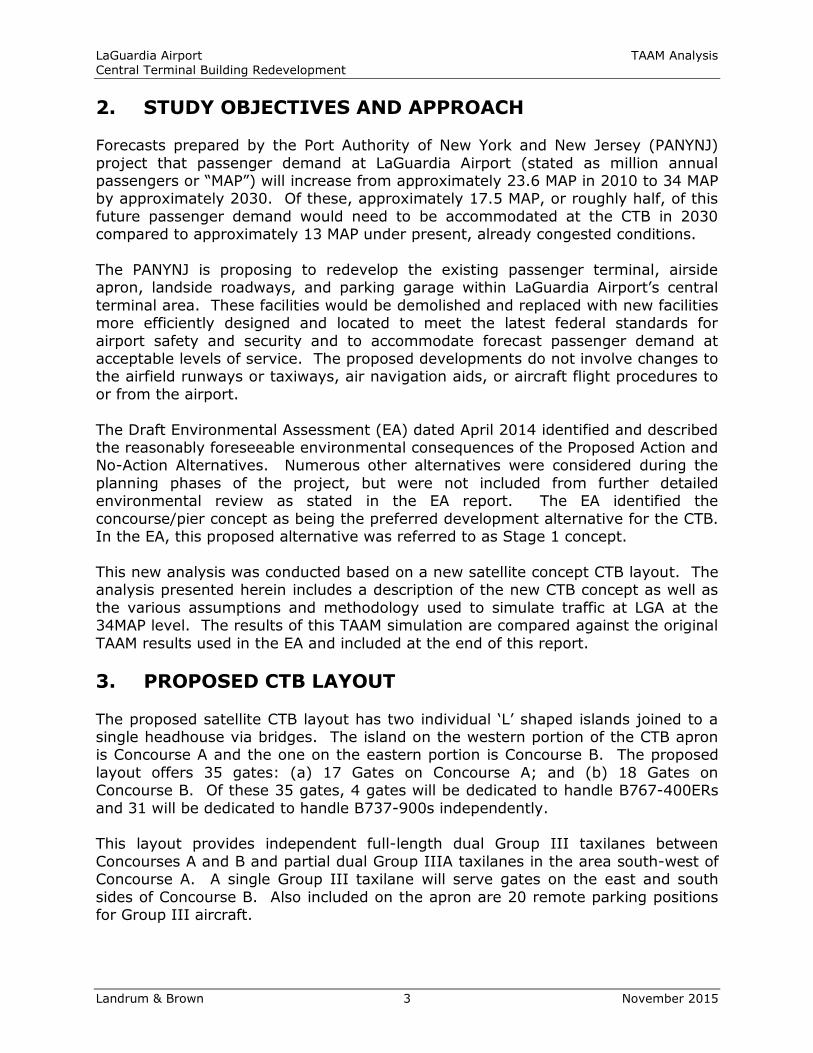
LaGuardia Airport TAAM Analysis Central Terminal Building Redevelopment
Landrum & Brown 3 November 2015
2. STUDY OBJECTIVES AND APPROACH
Forecasts prepared by the Port Authority of New York and New Jersey (PANYNJ)
project that passenger demand at LaGuardia Airport (stated as million annual passengers or “MAP”) will increase from approximately 23.6 MAP in 2010 to 34 MAP by approximately 2030. Of these, approximately 17.5 MAP, or roughly half, of this
future passenger demand would need to be accommodated at the CTB in 2030 compared to approximately 13 MAP under present, already congested conditions.
The PANYNJ is proposing to redevelop the existing passenger terminal, airside apron, landside roadways, and parking garage within LaGuardia Airport’s central
terminal area. These facilities would be demolished and replaced with new facilities more efficiently designed and located to meet the latest federal standards for
airport safety and security and to accommodate forecast passenger demand at acceptable levels of service. The proposed developments do not involve changes to the airfield runways or taxiways, air navigation aids, or aircraft flight procedures to
or from the airport.
The Draft Environmental Assessment (EA) dated April 2014 identified and described the reasonably foreseeable environmental consequences of the Proposed Action and No-Action Alternatives. Numerous other alternatives were considered during the
planning phases of the project, but were not included from further detailed environmental review as stated in the EA report. The EA identified the
concourse/pier concept as being the preferred development alternative for the CTB. In the EA, this proposed alternative was referred to as Stage 1 concept.
This new analysis was conducted based on a new satellite concept CTB layout. The analysis presented herein includes a description of the new CTB concept as well as
the various assumptions and methodology used to simulate traffic at LGA at the 34MAP level. The results of this TAAM simulation are compared against the original
TAAM results used in the EA and included at the end of this report.
3. PROPOSED CTB LAYOUT
The proposed satellite CTB layout has two individual ‘L’ shaped islands joined to a single headhouse via bridges. The island on the western portion of the CTB apron is Concourse A and the one on the eastern portion is Concourse B. The proposed
layout offers 35 gates: (a) 17 Gates on Concourse A; and (b) 18 Gates on Concourse B. Of these 35 gates, 4 gates will be dedicated to handle B767-400ERs
and 31 will be dedicated to handle B737-900s independently.
This layout provides independent full-length dual Group III taxilanes between
Concourses A and B and partial dual Group IIIA taxilanes in the area south-west of Concourse A. A single Group III taxilane will serve gates on the east and south
sides of Concourse B. Also included on the apron are 20 remote parking positions for Group III aircraft.
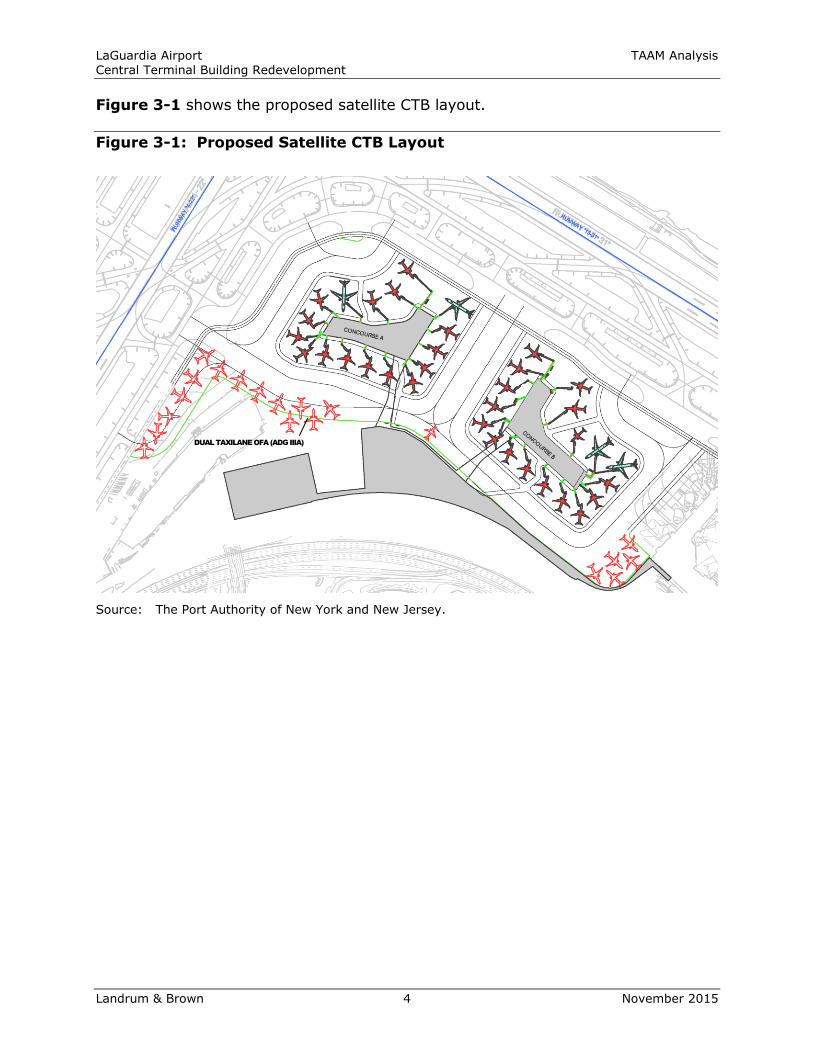
LaGuardia Airport TAAM Analysis Central Terminal Building Redevelopment
Landrum & Brown 4 November 2015
Figure 3-1 shows the proposed satellite CTB layout.
Figure 3-1: Proposed Satellite CTB Layout
Source: The Port Authority of New York and New Jersey.
DUAL TAXILANE OFA (ADG IIIA)
LaGuardia Airport TAAM Analysis Central Terminal Building Redevelopment
Landrum & Brown 5 November 2015
4. PROJECTED DEMAND
4.1 2012 Baseline Design Day Schedule
In the original development of the LGA TAAM model, a baseline design day schedule
was developed for year 2012. Data from the Official Airline Guide (OAG) was used as a basis for the development of this schedule, supplemented with data from the Port Authority’s AirScene database to evaluate the amount of general aviation and
military activity. This schedule included major changes in the airlines’ scheduling practices that occurred due to the Delta/US Airways slot swap. August 16, 2012
was selected as the new Peak Month Average Week Day (PMAWD) for the TAAM model update. The PMAWD is a busy day at the airport, but not the busiest day, and is the industry standard for analyzing airfield capacity and delay. Inputs from
both Delta Air Lines and US Airways were provided in order to appropriately reflect the changes in operations at LGA. Interim and end-state flight schedules were
obtained from Delta Airlines while US Airways provided flight schedules reflecting their traffic levels at LGA following the slot swap. The remaining operations were collected from OAG data while general aviation and military operations were
collected from the Port Authority’s AirScene database. This 2012 baseline schedule was used for the baseline TAAM model calibration process as presented in the TAAM
Baseline Model Development Report dated April 2013.
4.2 34MAP Design Day Schedule
To simulate future traffic conditions at LGA, a 34MAP design day schedule was
developed. According to the FAA approved forecasts, LGA traffic is expected to reach 34MAP around 2030. It is assumed that about half of the annual passenger
traffic will be handled in the CTB.
The 34MAP schedule used for this analysis is the same as the one used for the
Stage 1 layout in the EA report. Table 4-1 presents the fleet mix associated with the 34MAP schedule.

LaGuardia Airport TAAM Analysis Central Terminal Building Redevelopment
Landrum & Brown 6 November 2015
Table 4-1: LGA 34MAP Design Day Fleet Mix
Source: Landrum & Brown analysis.
Figure 4-1 presents the hourly profile for the 34MAP schedule.
Figure 4-1: LGA 34MAP Design Day Schedule Hourly Profile
Source: Landrum & Brown analysis.
Aircraft Arr Dep Total % of Tot.
Wide-Body B764 38 38 76 6.5%
Narrow-Body A319 56 56 112 9.6%
A320 55 55 110 9.4%
A321 20 20 40 3.4%
B738 57 57 114 9.7%
B739 68 68 136 11.6%
B73G 47 47 94 8.0%
E190 36 36 72 6.2%
Total 339 339 678 57.9%
Regional Jet CRJ7 14 14 28 2.4%
CRJ9 21 21 42 3.6%
E175 84 84 168 14.4%
Total 119 119 238 20.3%
Turboprop Q300 18 18 36 3.1%
Q400 71 71 142 12.1%
Total 89 89 178 15.2%
Total 585 585 1,170 100.0%
60
50
40
30
20
10
0
10
20
30
40
50
60
0 1 2 3 4 5 6 7 8 9 1011121314151617181920212223
<-
Dep
artu
res |
Arriv
als
->
Hour of the Day
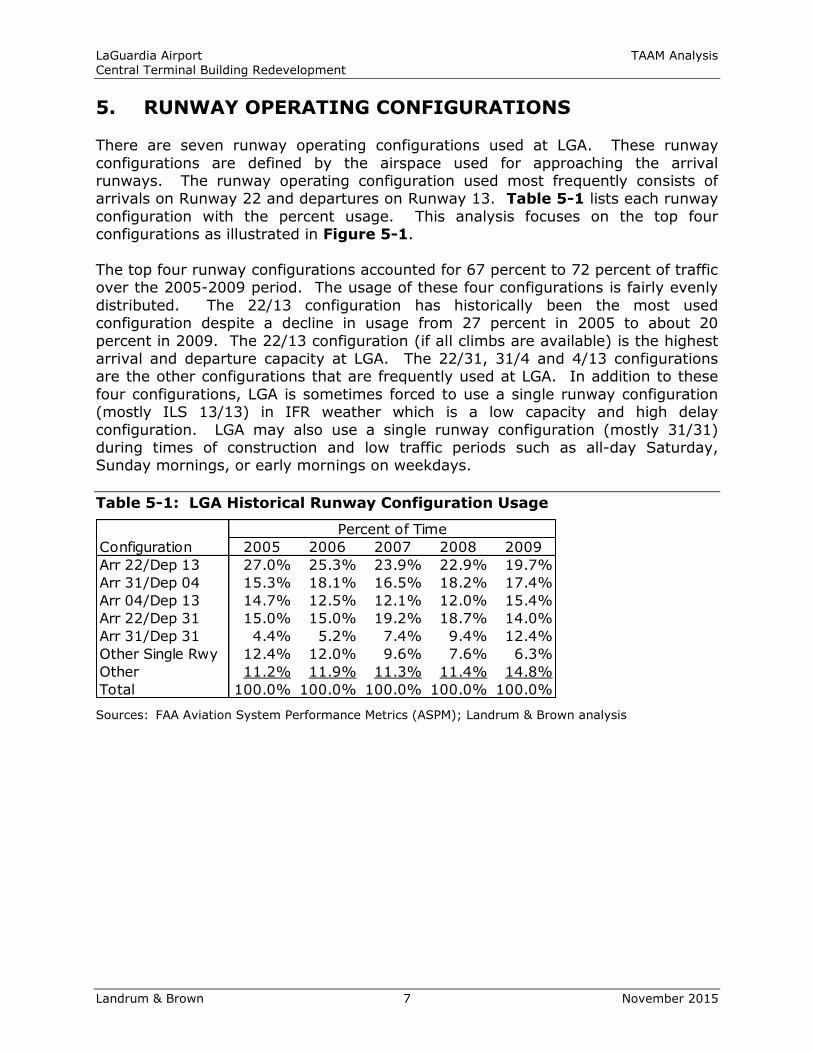
LaGuardia Airport TAAM Analysis Central Terminal Building Redevelopment
Landrum & Brown 7 November 2015
5. RUNWAY OPERATING CONFIGURATIONS There are seven runway operating configurations used at LGA. These runway
configurations are defined by the airspace used for approaching the arrival runways. The runway operating configuration used most frequently consists of arrivals on Runway 22 and departures on Runway 13. Table 5-1 lists each runway
configuration with the percent usage. This analysis focuses on the top four configurations as illustrated in Figure 5-1.
The top four runway configurations accounted for 67 percent to 72 percent of traffic over the 2005-2009 period. The usage of these four configurations is fairly evenly
distributed. The 22/13 configuration has historically been the most used configuration despite a decline in usage from 27 percent in 2005 to about 20
percent in 2009. The 22/13 configuration (if all climbs are available) is the highest arrival and departure capacity at LGA. The 22/31, 31/4 and 4/13 configurations are the other configurations that are frequently used at LGA. In addition to these
four configurations, LGA is sometimes forced to use a single runway configuration (mostly ILS 13/13) in IFR weather which is a low capacity and high delay
configuration. LGA may also use a single runway configuration (mostly 31/31) during times of construction and low traffic periods such as all-day Saturday, Sunday mornings, or early mornings on weekdays.
Table 5-1: LGA Historical Runway Configuration Usage
Sources: FAA Aviation System Performance Metrics (ASPM); Landrum & Brown analysis
Percent of Time
Configuration 2005 2006 2007 2008 2009
Arr 22/Dep 13 27.0% 25.3% 23.9% 22.9% 19.7%
Arr 31/Dep 04 15.3% 18.1% 16.5% 18.2% 17.4%
Arr 04/Dep 13 14.7% 12.5% 12.1% 12.0% 15.4%
Arr 22/Dep 31 15.0% 15.0% 19.2% 18.7% 14.0%
Arr 31/Dep 31 4.4% 5.2% 7.4% 9.4% 12.4%
Other Single Rwy 12.4% 12.0% 9.6% 7.6% 6.3%
Other 11.2% 11.9% 11.3% 11.4% 14.8%
Total 100.0% 100.0% 100.0% 100.0% 100.0%
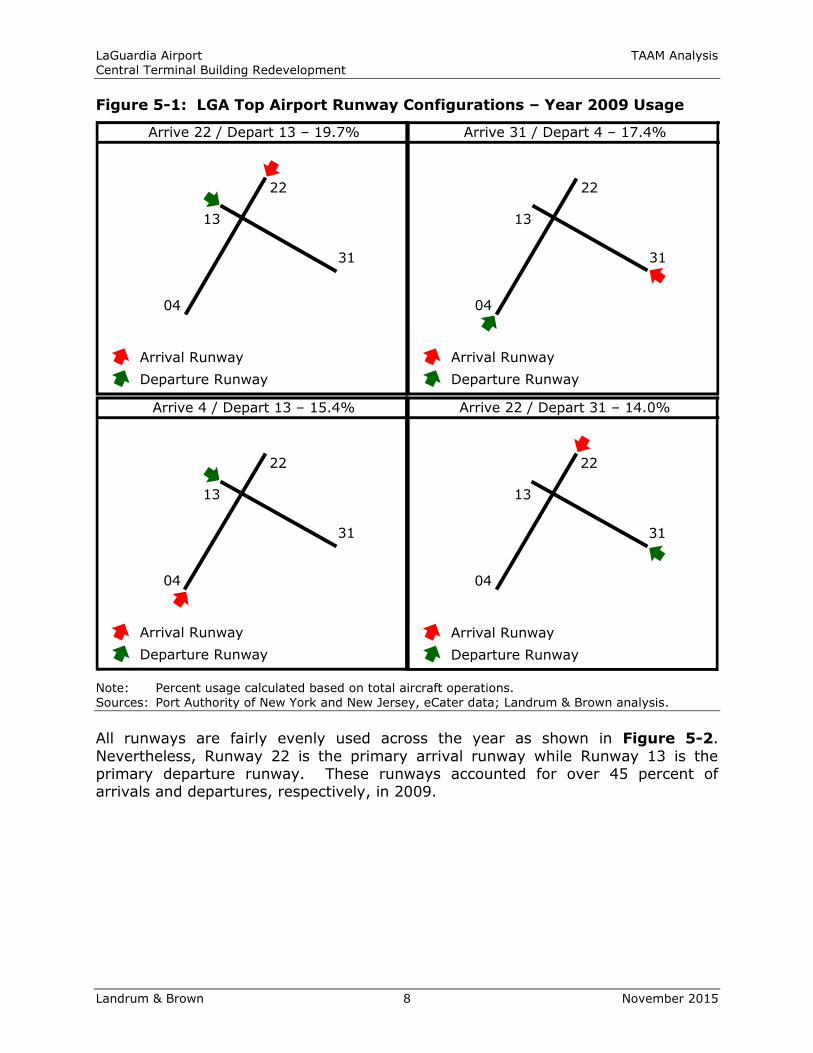
LaGuardia Airport TAAM Analysis Central Terminal Building Redevelopment
Landrum & Brown 8 November 2015
Figure 5-1: LGA Top Airport Runway Configurations – Year 2009 Usage
Note: Percent usage calculated based on total aircraft operations.
Sources: Port Authority of New York and New Jersey, eCater data; Landrum & Brown analysis.
All runways are fairly evenly used across the year as shown in Figure 5-2.
Nevertheless, Runway 22 is the primary arrival runway while Runway 13 is the primary departure runway. These runways accounted for over 45 percent of arrivals and departures, respectively, in 2009.
Arrive 22 / Depart 13 – 19.7%
Arrival Runway
Departure Runway
31
13
22
04
Arrive 31 / Depart 4 – 17.4%
Arrival Runway
Departure Runway
31
13
22
04
Arrive 4 / Depart 13 – 15.4%
Arrival Runway
Departure Runway
31
13
22
04
Arrive 22 / Depart 31 – 14.0%
Arrival Runway
Departure Runway
31
13
22
04
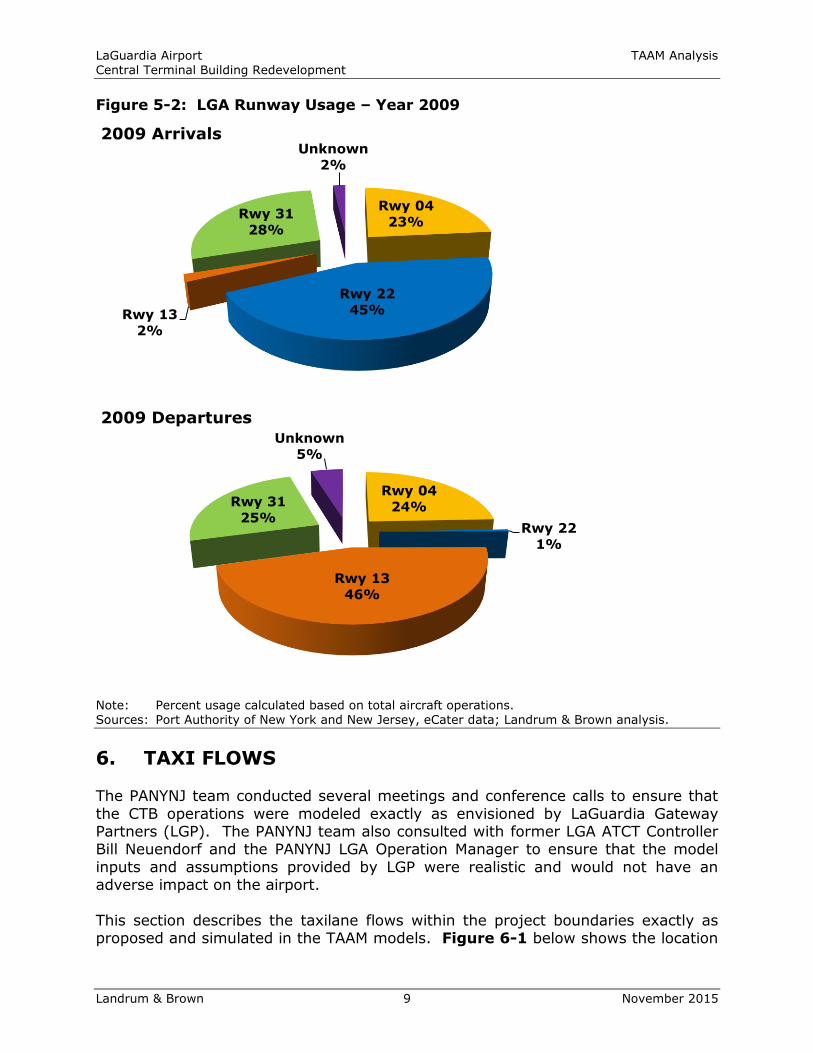
LaGuardia Airport TAAM Analysis Central Terminal Building Redevelopment
Landrum & Brown 9 November 2015
Figure 5-2: LGA Runway Usage – Year 2009
Note: Percent usage calculated based on total aircraft operations. Sources: Port Authority of New York and New Jersey, eCater data; Landrum & Brown analysis.
6. TAXI FLOWS The PANYNJ team conducted several meetings and conference calls to ensure that
the CTB operations were modeled exactly as envisioned by LaGuardia Gateway Partners (LGP). The PANYNJ team also consulted with former LGA ATCT Controller Bill Neuendorf and the PANYNJ LGA Operation Manager to ensure that the model
inputs and assumptions provided by LGP were realistic and would not have an adverse impact on the airport.
This section describes the taxilane flows within the project boundaries exactly as proposed and simulated in the TAAM models. Figure 6-1 below shows the location
Rwy 0423%
Rwy 2245%Rwy 13
2%
Rwy 31
28%
Unknown2%
2009 Arrivals
Rwy 0424%
Rwy 22
1%
Rwy 13
46%
Rwy 3125%
Unknown
5%
2009 Departures
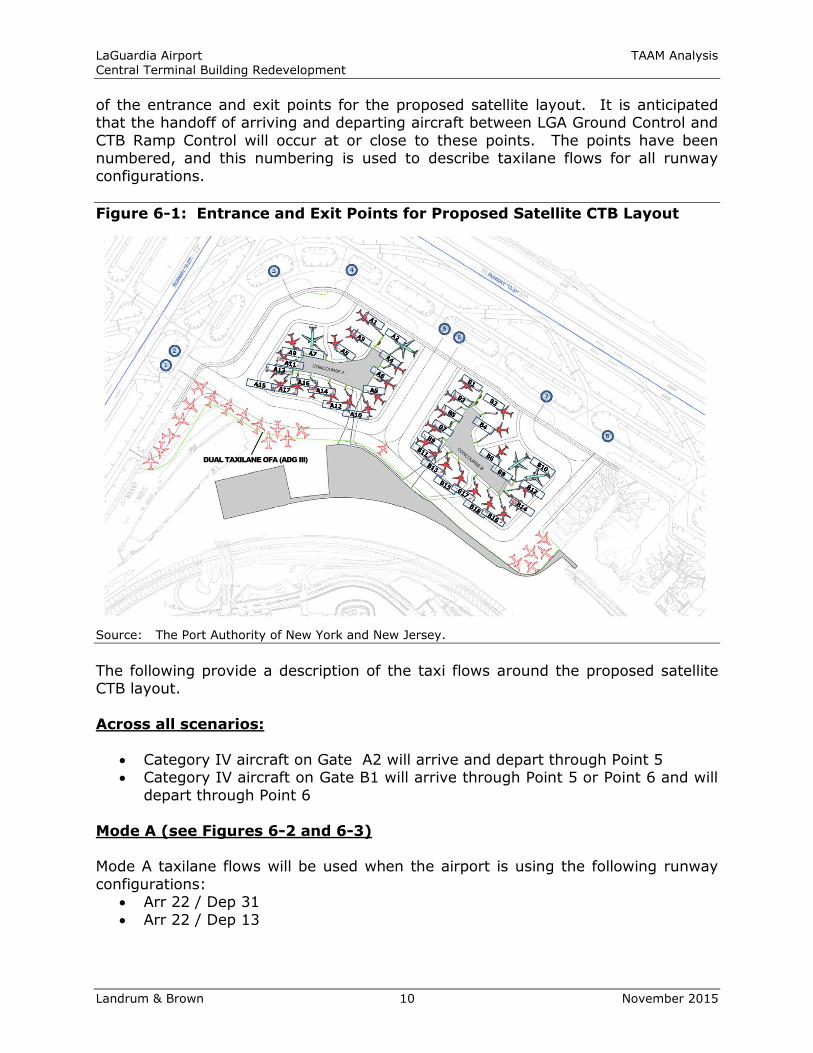
LaGuardia Airport TAAM Analysis Central Terminal Building Redevelopment
Landrum & Brown 10 November 2015
of the entrance and exit points for the proposed satellite layout. It is anticipated that the handoff of arriving and departing aircraft between LGA Ground Control and
CTB Ramp Control will occur at or close to these points. The points have been numbered, and this numbering is used to describe taxilane flows for all runway
configurations.
Figure 6-1: Entrance and Exit Points for Proposed Satellite CTB Layout
Source: The Port Authority of New York and New Jersey.
The following provide a description of the taxi flows around the proposed satellite CTB layout.
Across all scenarios:
Category IV aircraft on Gate A2 will arrive and depart through Point 5 Category IV aircraft on Gate B1 will arrive through Point 5 or Point 6 and will
depart through Point 6
Mode A (see Figures 6-2 and 6-3) Mode A taxilane flows will be used when the airport is using the following runway
configurations: Arr 22 / Dep 31
Arr 22 / Dep 13
DUAL TAXILANE OFA (ADG III)

LaGuardia Airport TAAM Analysis Central Terminal Building Redevelopment
Landrum & Brown 11 November 2015
Arrivals
Point 2 will be used for arrivals to: Gates A15, A17, A16, A14, A12, A10, A8, A6, A4 and A2 (if not assigned to a
Cat IV aircraft) Gates A13 and A11 Gates B3, B5, B7, B9, B11, B13, B15, B17, B18, B16 and B1 (if not assigned
to a Cat IV aircraft)
Point 3 will be used for arrivals to: Gates A9, A7, A5, A3, A1
Point 7 will be used for arrivals to: Gates B2, B4, B6, B8
Point 8 will be used for arrivals to:
Gates B10, B12, B14
Departures
Point 4 will be used for departures from:
Gates A13, A11, A9, A7, A5, A3, A1 Point 5 will be used for departures from:
Gates A15, A17, A16, A14, A12, A10, A8, A6, A4 and A2
Point 6 will be used for departures from: Gates B9, B7, B5, B3 and B1
Point 8 will be used for departures from: Gates B11, B13, B15, B17, B18, B16, B14, B12, B10, B8, B6, B4 and B2
Other rules
For arrivals through Point 2: if the queue extends beyond gate A15 and the RON positions on the taxilane to its south are unoccupied, then new arriving
aircraft will use this parallel taxilane through Point 1. Departures from gates A15, A17, A16, A14, A12 and A10 use the taxilane in
the center alley that has the fewest aircraft on it.
Mode B (see Figures 6-4 and 6-5)
Mode B taxilane flows will be used when the airport is using the following configurations:
Arr 04 / Dep 13 (VFR) Arr 04 / Dep 13 (IFR)
Arr 31 / Dep 04
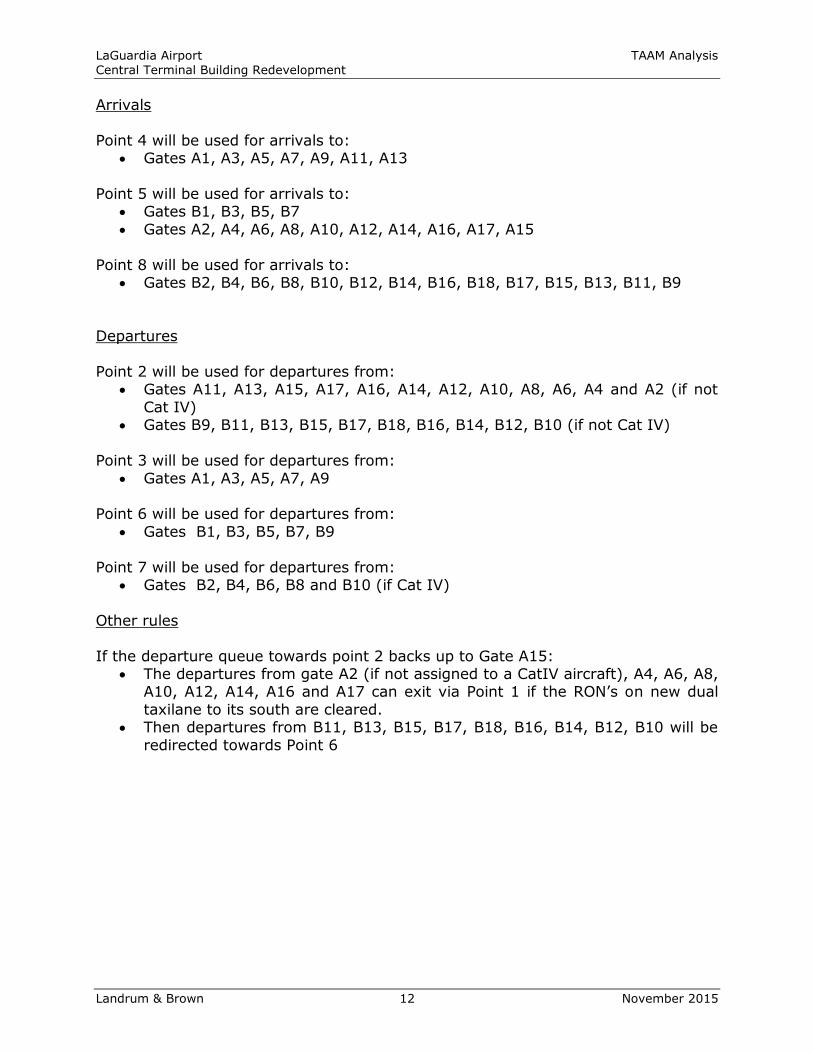
LaGuardia Airport TAAM Analysis Central Terminal Building Redevelopment
Landrum & Brown 12 November 2015
Arrivals
Point 4 will be used for arrivals to: Gates A1, A3, A5, A7, A9, A11, A13
Point 5 will be used for arrivals to: Gates B1, B3, B5, B7
Gates A2, A4, A6, A8, A10, A12, A14, A16, A17, A15
Point 8 will be used for arrivals to: Gates B2, B4, B6, B8, B10, B12, B14, B16, B18, B17, B15, B13, B11, B9
Departures
Point 2 will be used for departures from: Gates A11, A13, A15, A17, A16, A14, A12, A10, A8, A6, A4 and A2 (if not
Cat IV) Gates B9, B11, B13, B15, B17, B18, B16, B14, B12, B10 (if not Cat IV)
Point 3 will be used for departures from:
Gates A1, A3, A5, A7, A9
Point 6 will be used for departures from:
Gates B1, B3, B5, B7, B9
Point 7 will be used for departures from: Gates B2, B4, B6, B8 and B10 (if Cat IV)
Other rules
If the departure queue towards point 2 backs up to Gate A15: The departures from gate A2 (if not assigned to a CatIV aircraft), A4, A6, A8,
A10, A12, A14, A16 and A17 can exit via Point 1 if the RON’s on new dual
taxilane to its south are cleared. Then departures from B11, B13, B15, B17, B18, B16, B14, B12, B10 will be
redirected towards Point 6
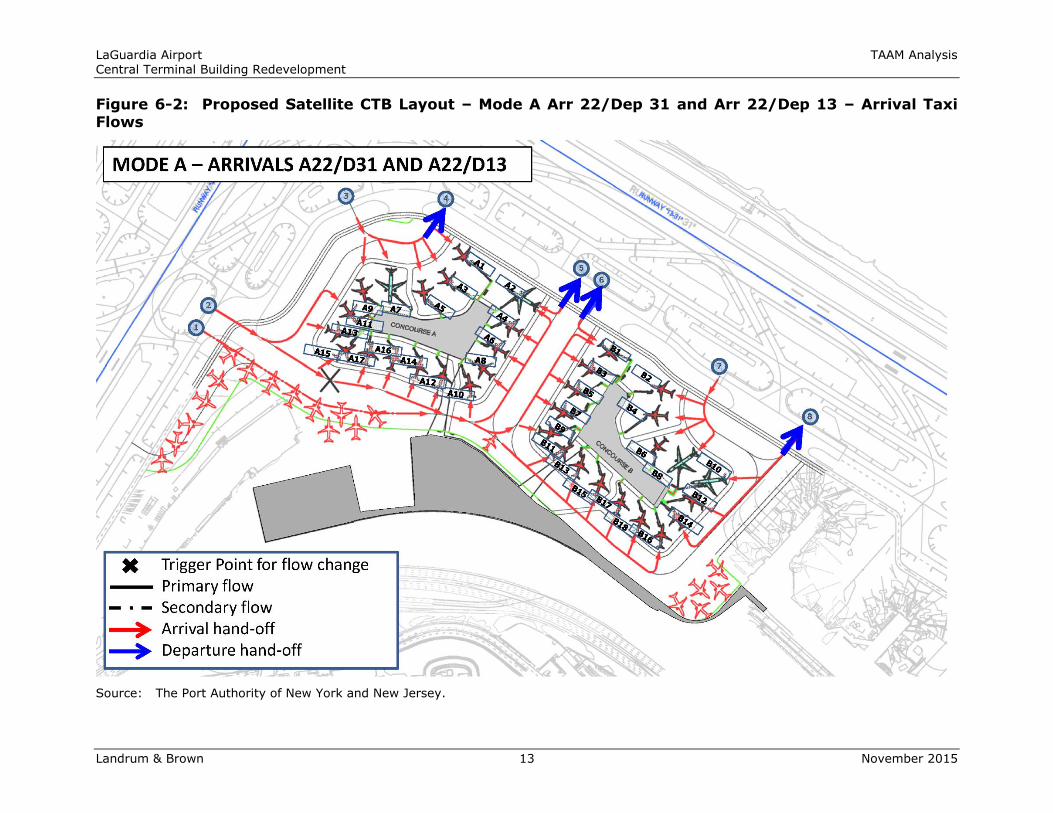
LaGuardia Airport TAAM Analysis Central Terminal Building Redevelopment
Landrum & Brown 13 November 2015
Figure 6-2: Proposed Satellite CTB Layout – Mode A Arr 22/Dep 31 and Arr 22/Dep 13 – Arrival Taxi Flows
Source: The Port Authority of New York and New Jersey.
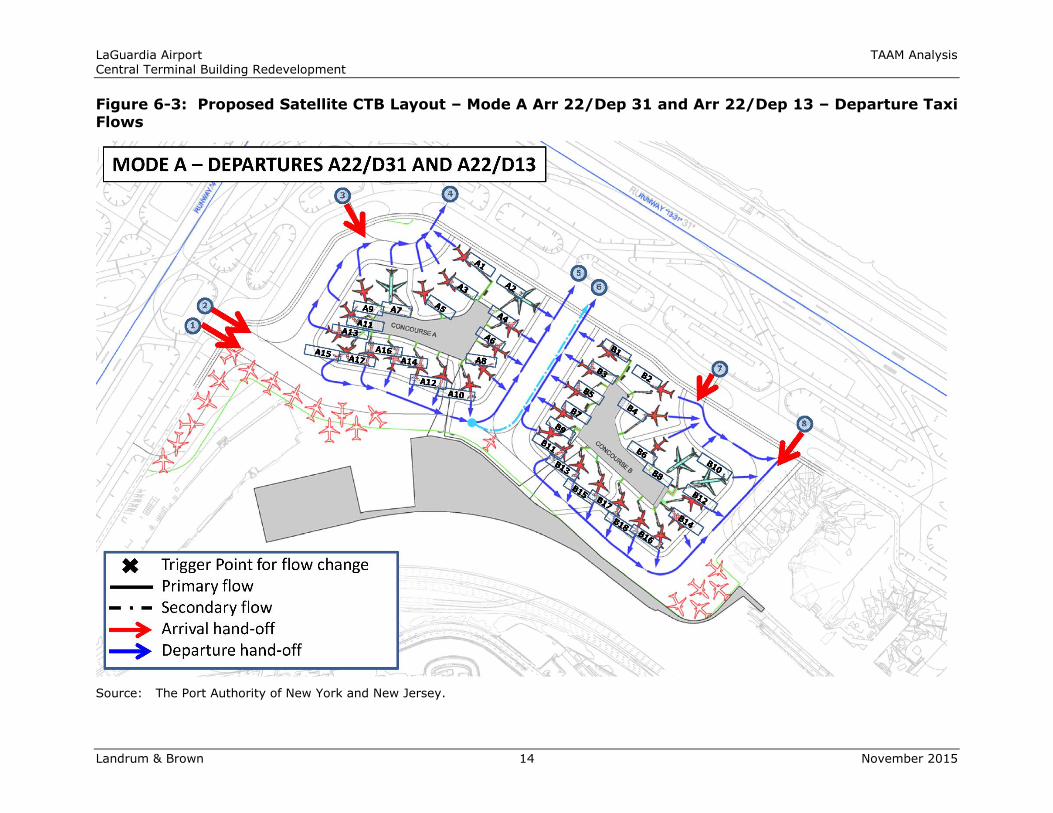
LaGuardia Airport TAAM Analysis Central Terminal Building Redevelopment
Landrum & Brown 14 November 2015
Figure 6-3: Proposed Satellite CTB Layout – Mode A Arr 22/Dep 31 and Arr 22/Dep 13 – Departure Taxi Flows
Source: The Port Authority of New York and New Jersey.
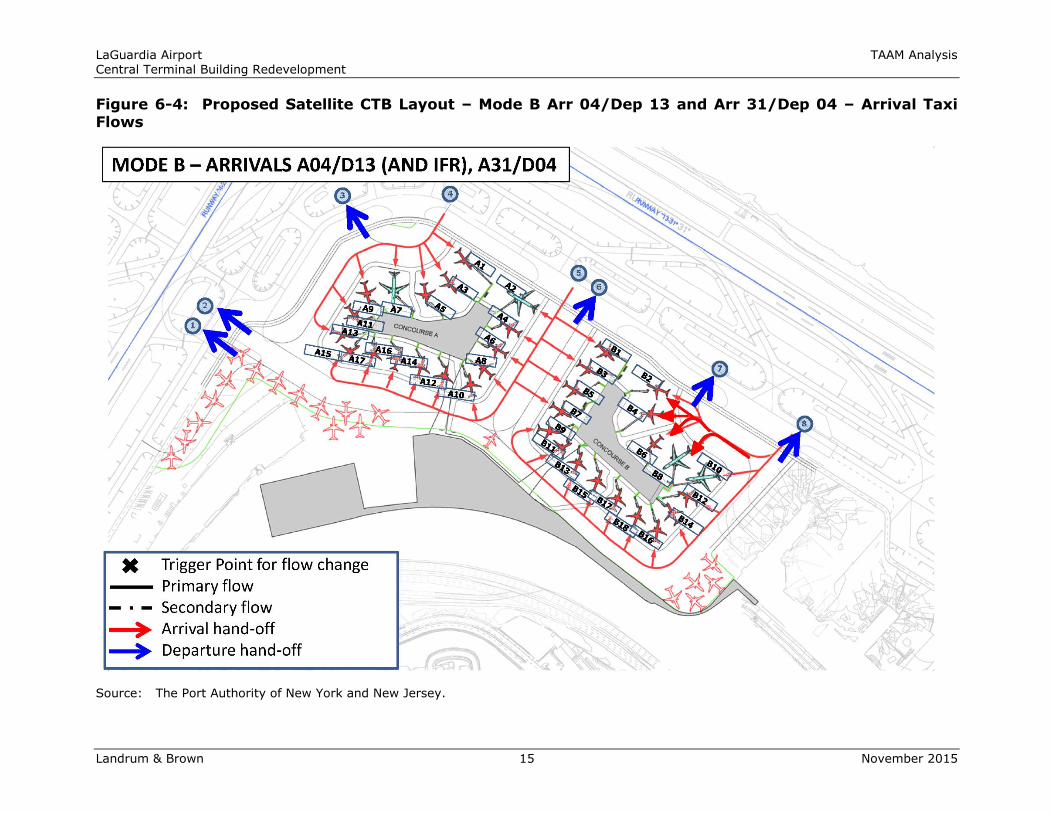
LaGuardia Airport TAAM Analysis Central Terminal Building Redevelopment
Landrum & Brown 15 November 2015
Figure 6-4: Proposed Satellite CTB Layout – Mode B Arr 04/Dep 13 and Arr 31/Dep 04 – Arrival Taxi Flows
Source: The Port Authority of New York and New Jersey.
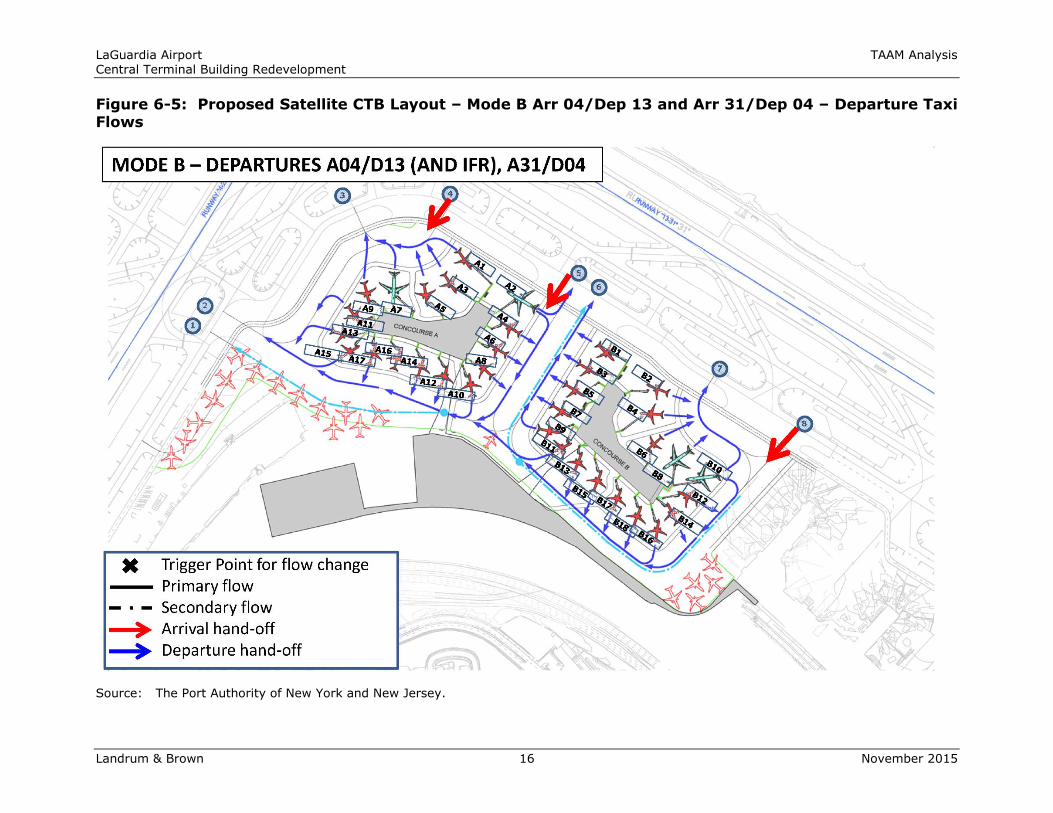
LaGuardia Airport TAAM Analysis Central Terminal Building Redevelopment
Landrum & Brown 16 November 2015
Figure 6-5: Proposed Satellite CTB Layout – Mode B Arr 04/Dep 13 and Arr 31/Dep 04 – Departure Taxi Flows
Source: The Port Authority of New York and New Jersey.

LaGuardia Airport TAAM Analysis Central Terminal Building Redevelopment
Landrum & Brown 17 November 2015
7. TAAM MODEL OVERVIEW AND CALIBRATION
Airside simulation models use a description of the airport’s facilities and operating
environment as input, simulate air traffic movements through the defined environment, and provide as output the two critical measures that are used to determine airside capacity--throughput and delay. The analysis involved the
simulation of the airfield and airspace system to quantify performance metrics associated with forecast demand. The airside includes the aircraft parking
positions, apron area, taxiways, runways and all other aircraft movement areas of the Airport. The airspace system modeled included all the arrival and departure fixes. This analysis reflected input from air traffic controllers, airlines, Port
Authority and airport staff. Mr. Bill Neuendorf, the PANYNJ LGA Operation Manager and LGP were regularly consulted throughout the simulation study to ensure
acceptance of the input assumptions, methodology, results and recommendations.
Jeppesen’s Total Airport and Airspace Modeler, referred to as TAAM®, is a computer
simulation modeling tool that models airspace and airports to facilitate planning, analysis and decision making. TAAM was used to model and evaluate the proposed
airfield concepts as part of this study. It presents a realistic 4D representation of airspace and airports to quantify performance and address “what-if” questions about changes in demand, airspace, airfield layout, and related air traffic control
procedures. Accordingly, this model is a valuable tool that facilitates decision support, planning, and analysis. TAAM can simulate:
Aircraft movements in detail;
A full individual airfield (including runways, taxiways, and apron areas); An airfield and its associated terminal airspace; A regional system of airports and the associated airspace or a regional
volume of airspace.
TAAM can produce detailed statistics for each aircraft operation simulated and high quality animations of the simulation. Outputs include, but are not limited to: aircraft en route travel times; airport movements, operations on taxiways and
runways, runway occupancy; airspace operation metrics such as usage of routes, sectors, fixes and coordination; throughput capacity per unit of time; delays by
time of day and location on the airfield or in airspace, along with the reason for each delay; fuel consumption and potential conflicts.
The model is calibrated to reflect the real-world operating environment as closely as possible. Simulation models are not designed to replicate all aspects of the real-
world operating environment, but the models must reflect the logic applied by pilots and air traffic controllers to the greatest extent possible. A critical aspect of any simulation analysis is the process by which the characteristics of the future
operating environment are defined and established as input to the model. The interpretation of the simulation results is equally important, and it requires an in-
depth understanding of the model itself as well as the real-world air traffic control system.
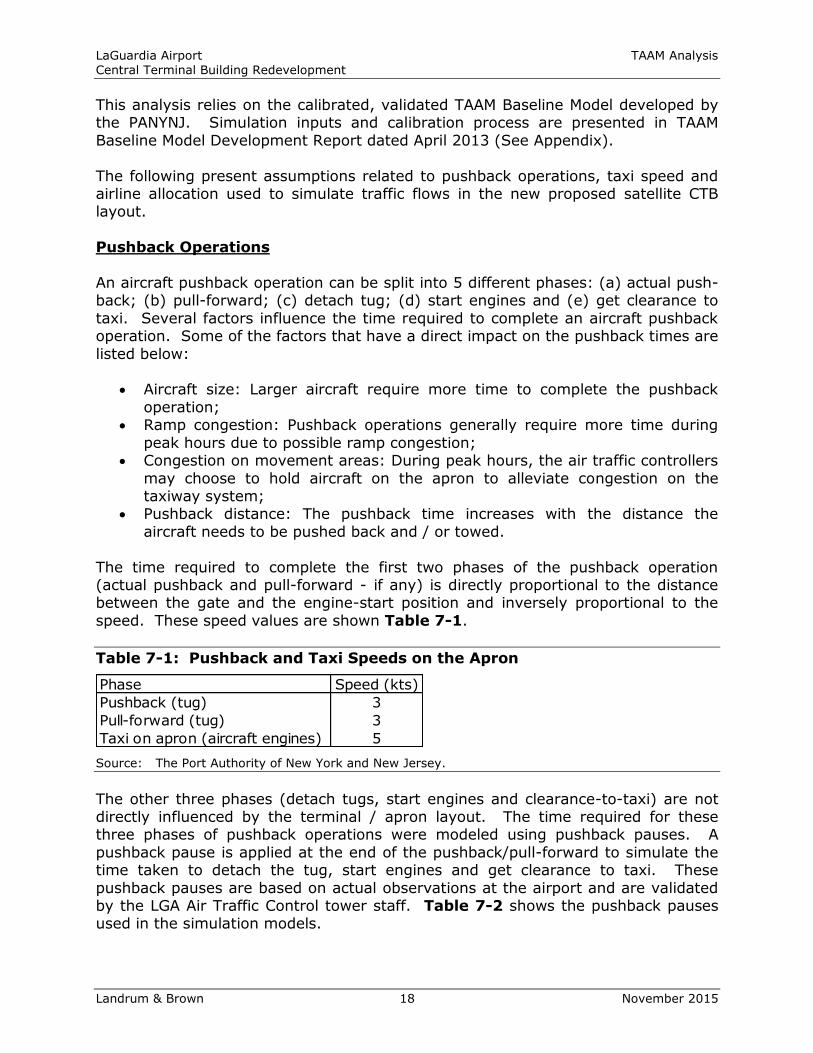
LaGuardia Airport TAAM Analysis Central Terminal Building Redevelopment
Landrum & Brown 18 November 2015
This analysis relies on the calibrated, validated TAAM Baseline Model developed by the PANYNJ. Simulation inputs and calibration process are presented in TAAM
Baseline Model Development Report dated April 2013 (See Appendix).
The following present assumptions related to pushback operations, taxi speed and airline allocation used to simulate traffic flows in the new proposed satellite CTB layout.
Pushback Operations
An aircraft pushback operation can be split into 5 different phases: (a) actual push-back; (b) pull-forward; (c) detach tug; (d) start engines and (e) get clearance to
taxi. Several factors influence the time required to complete an aircraft pushback operation. Some of the factors that have a direct impact on the pushback times are
listed below:
Aircraft size: Larger aircraft require more time to complete the pushback
operation; Ramp congestion: Pushback operations generally require more time during
peak hours due to possible ramp congestion; Congestion on movement areas: During peak hours, the air traffic controllers
may choose to hold aircraft on the apron to alleviate congestion on thetaxiway system;
Pushback distance: The pushback time increases with the distance the
aircraft needs to be pushed back and / or towed.
The time required to complete the first two phases of the pushback operation (actual pushback and pull-forward - if any) is directly proportional to the distance between the gate and the engine-start position and inversely proportional to the
speed. These speed values are shown Table 7-1.
Table 7-1: Pushback and Taxi Speeds on the Apron
Source: The Port Authority of New York and New Jersey.
The other three phases (detach tugs, start engines and clearance-to-taxi) are not directly influenced by the terminal / apron layout. The time required for these three phases of pushback operations were modeled using pushback pauses. A
pushback pause is applied at the end of the pushback/pull-forward to simulate the time taken to detach the tug, start engines and get clearance to taxi. These
pushback pauses are based on actual observations at the airport and are validated by the LGA Air Traffic Control tower staff. Table 7-2 shows the pushback pauses used in the simulation models.
Phase Speed (kts)
Pushback (tug) 3
Pull-forward (tug) 3
Taxi on apron (aircraft engines) 5
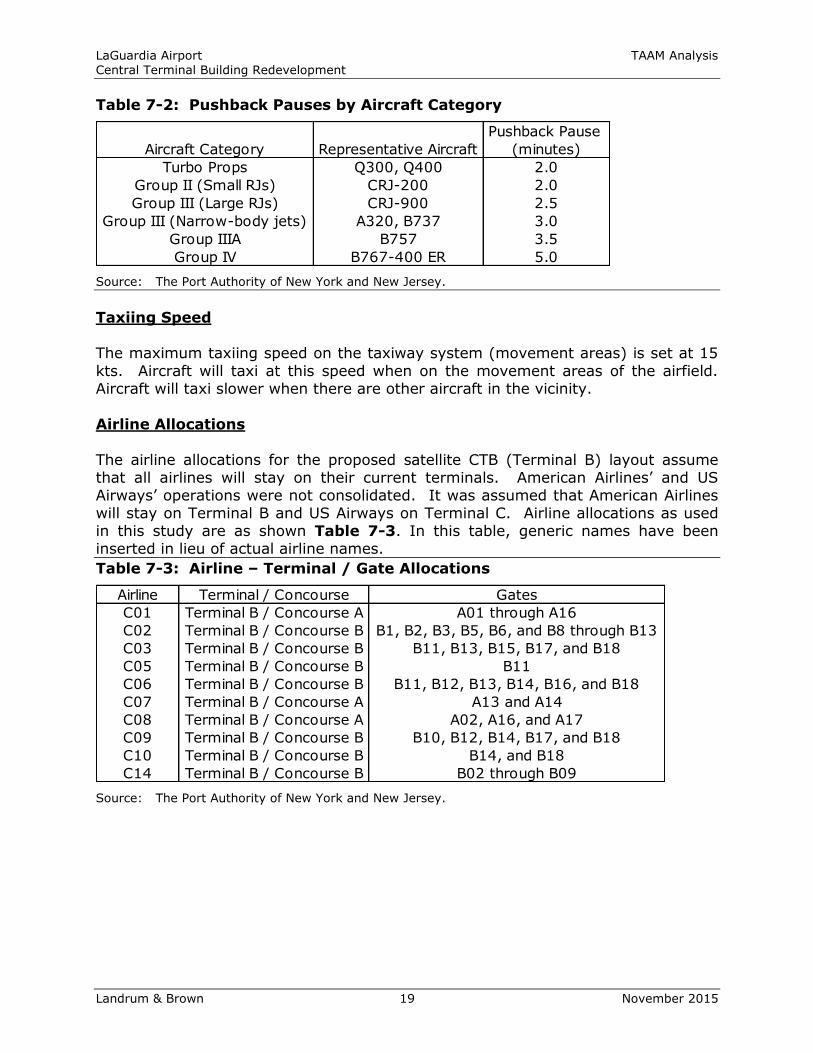
LaGuardia Airport TAAM Analysis Central Terminal Building Redevelopment
Landrum & Brown 19 November 2015
Table 7-2: Pushback Pauses by Aircraft Category
Source: The Port Authority of New York and New Jersey.
Taxiing Speed
The maximum taxiing speed on the taxiway system (movement areas) is set at 15
kts. Aircraft will taxi at this speed when on the movement areas of the airfield. Aircraft will taxi slower when there are other aircraft in the vicinity.
Airline Allocations
The airline allocations for the proposed satellite CTB (Terminal B) layout assume that all airlines will stay on their current terminals. American Airlines’ and US Airways’ operations were not consolidated. It was assumed that American Airlines will stay on Terminal B and US Airways on Terminal C. Airline allocations as used in this study are as shown Table 7-3. In this table, generic names have been inserted in lieu of actual airline names.Table 7-3: Airline – Terminal / Gate Allocations
Source: The Port Authority of New York and New Jersey.
Pushback Pause
Aircraft Category Representative Aircraft (minutes)
Turbo Props Q300, Q400 2.0
Group II (Small RJs) CRJ-200 2.0
Group III (Large RJs) CRJ-900 2.5
Group III (Narrow-body jets) A320, B737 3.0
Group IIIA B757 3.5
Group IV B767-400 ER 5.0
Airline Terminal / Concourse Gates
C01 Terminal B / Concourse A A01 through A16
C02 Terminal B / Concourse B B1, B2, B3, B5, B6, and B8 through B13
C03 Terminal B / Concourse B B11, B13, B15, B17, and B18
C05 Terminal B / Concourse B B11
C06 Terminal B / Concourse B B11, B12, B13, B14, B16, and B18
C07 Terminal B / Concourse A A13 and A14
C08 Terminal B / Concourse A A02, A16, and A17
C09 Terminal B / Concourse B B10, B12, B14, B17, and B18
C10 Terminal B / Concourse B B14, and B18
C14 Terminal B / Concourse B B02 through B09
LaGuardia Airport TAAM Analysis Central Terminal Building Redevelopment
Landrum & Brown 20 November 2015
8. TAAM RESULTS
In order to conduct a thorough review, it is necessary to study the performance of
the proposed concepts for all the predominant runway configurations and operating conditions at the airport. LGA has four predominant runway/flow configurations (22/13, 31/4, 4/13, and 22/31). All four configurations were modeled under Visual
Flight Rules (VFR).
The key parameters used to measure the performance the proposed satellite CTB layout are as follows:
Unimpeded Flight / Taxi Times - Delay and travel time is reported throughoutthe 24-hour period for different phases of the operation. Therefore,
operational performance characteristics for each phase of operation can beeasily identified. Unimpeded travel time represents the time it would take anaircraft to travel from Point A to Point B if it were the only aircraft in the
system. Ground travel time is comprised of unimpeded ground time anddelay time and is influenced by the taxi speed and the travel distance
between the runway and the gate. On the other hand, flight time is the sumof the unimpeded flight time and airspace delay:
o Avg. Taxi Time = Unimpeded Avg. Taxi Time + Avg. Taxi Delay
o Avg. Flight Time = Unimpeded Avg. Flight Time + Avg. Airspace Delay Delay - Delay is the operating time attributable to any impediment to the
free flow of aircraft through the system. Delay increases the total travel timefrom Point A to Point B as a result of interactions with other aircraft. As a
result, total delay for any given aircraft is the difference between the actualtime it takes the aircraft to get from Point A to Point B while interacting withother aircraft and the unimpeded time it would theoretically take the aircraft
to get from Point A to Point B without other aircraft in the system.o Arrival ground delay is incurred between the runway exit and the gate
as a result of taxiway congestion, and runway crossings.o Arrival gate delay is incurred when an arriving fight cannot pull into its
gate due to the unavailability of the gate.
o Arrival airspace delay time is incurred between the arrival fix andrunway exit due to aircraft sequencing or holding.
o Departure ground delay is incurred between the time the aircraft iscleared for push-back from its assigned gate and the time it isreleased for runway departure.
o Departure ground delay includes runway crossings, airfield congestionand departure queue delay.
o Departure gate delay is incurred due to gate push-back blocking.o Departure airspace delay is incurred after takeoff until the aircraft
reach the departure fix.
All results in this section reflect operating conditions at all terminals, and not just at Terminal B. Table 8-1 presents the taxi time and delay results
related to each runway configuration.
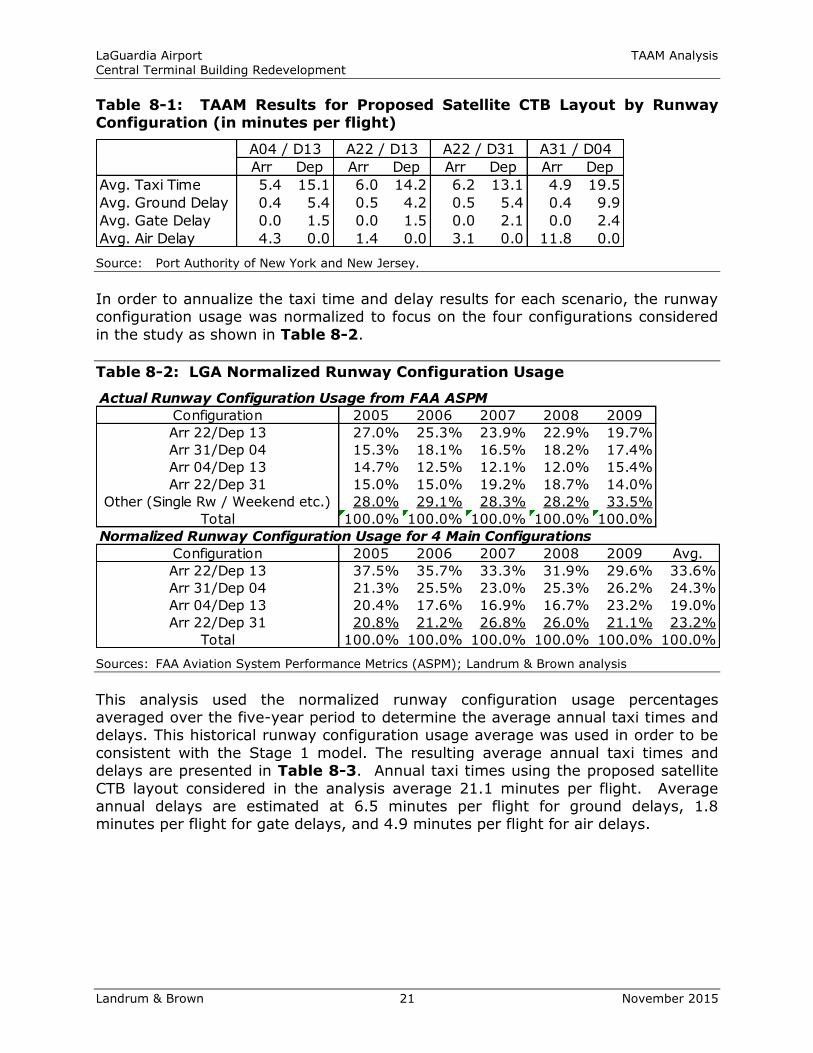
LaGuardia Airport TAAM Analysis Central Terminal Building Redevelopment
Landrum & Brown 21 November 2015
Table 8-1: TAAM Results for Proposed Satellite CTB Layout by Runway Configuration (in minutes per flight)
Source: Port Authority of New York and New Jersey.
In order to annualize the taxi time and delay results for each scenario, the runway configuration usage was normalized to focus on the four configurations considered
in the study as shown in Table 8-2.
Table 8-2: LGA Normalized Runway Configuration Usage
Sources: FAA Aviation System Performance Metrics (ASPM); Landrum & Brown analysis
This analysis used the normalized runway configuration usage percentages averaged over the five-year period to determine the average annual taxi times and delays. This historical runway configuration usage average was used in order to be
consistent with the Stage 1 model. The resulting average annual taxi times and delays are presented in Table 8-3. Annual taxi times using the proposed satellite
CTB layout considered in the analysis average 21.1 minutes per flight. Average annual delays are estimated at 6.5 minutes per flight for ground delays, 1.8 minutes per flight for gate delays, and 4.9 minutes per flight for air delays.
A04 / D13 A22 / D13 A22 / D31 A31 / D04
Arr Dep Arr Dep Arr Dep Arr Dep
Avg. Taxi Time 5.4 15.1 6.0 14.2 6.2 13.1 4.9 19.5
Avg. Ground Delay 0.4 5.4 0.5 4.2 0.5 5.4 0.4 9.9
Avg. Gate Delay 0.0 1.5 0.0 1.5 0.0 2.1 0.0 2.4
Avg. Air Delay 4.3 0.0 1.4 0.0 3.1 0.0 11.8 0.0
Actual Runway Configuration Usage from FAA ASPM
Configuration 2005 2006 2007 2008 2009
Arr 22/Dep 13 27.0% 25.3% 23.9% 22.9% 19.7%
Arr 31/Dep 04 15.3% 18.1% 16.5% 18.2% 17.4%
Arr 04/Dep 13 14.7% 12.5% 12.1% 12.0% 15.4%
Arr 22/Dep 31 15.0% 15.0% 19.2% 18.7% 14.0%
Other (Single Rw / Weekend etc.) 28.0% 29.1% 28.3% 28.2% 33.5%
Total 100.0% 100.0% 100.0% 100.0% 100.0%
Normalized Runway Configuration Usage for 4 Main Configurations
Configuration 2005 2006 2007 2008 2009 Avg.
Arr 22/Dep 13 37.5% 35.7% 33.3% 31.9% 29.6% 33.6%
Arr 31/Dep 04 21.3% 25.5% 23.0% 25.3% 26.2% 24.3%
Arr 04/Dep 13 20.4% 17.6% 16.9% 16.7% 23.2% 19.0%
Arr 22/Dep 31 20.8% 21.2% 26.8% 26.0% 21.1% 23.2%
Total 100.0% 100.0% 100.0% 100.0% 100.0% 100.0%
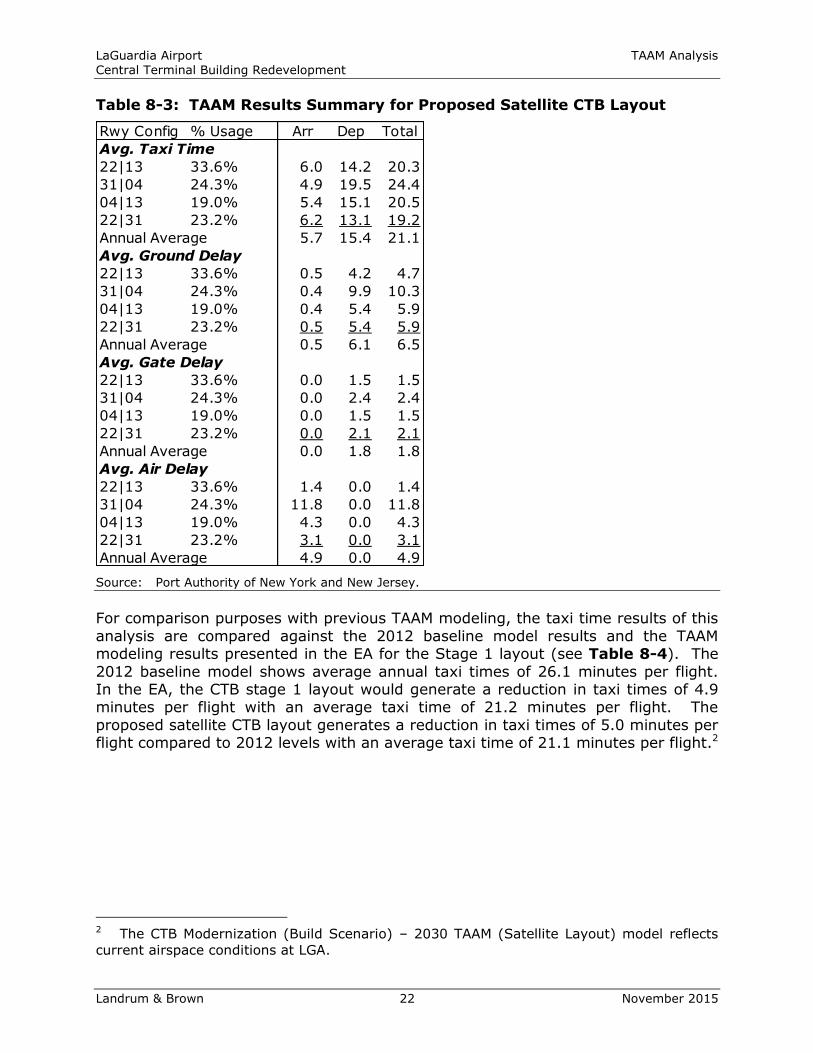
LaGuardia Airport TAAM Analysis Central Terminal Building Redevelopment
Landrum & Brown 22 November 2015
Table 8-3: TAAM Results Summary for Proposed Satellite CTB Layout
Source: Port Authority of New York and New Jersey.
For comparison purposes with previous TAAM modeling, the taxi time results of this
analysis are compared against the 2012 baseline model results and the TAAM modeling results presented in the EA for the Stage 1 layout (see Table 8-4). The
2012 baseline model shows average annual taxi times of 26.1 minutes per flight. In the EA, the CTB stage 1 layout would generate a reduction in taxi times of 4.9 minutes per flight with an average taxi time of 21.2 minutes per flight. The
proposed satellite CTB layout generates a reduction in taxi times of 5.0 minutes per flight compared to 2012 levels with an average taxi time of 21.1 minutes per flight.2
2 The CTB Modernization (Build Scenario) – 2030 TAAM (Satellite Layout) model reflects
current airspace conditions at LGA.
Rwy Config % Usage Arr Dep Total
Avg. Taxi Time
22|13 33.6% 6.0 14.2 20.3
31|04 24.3% 4.9 19.5 24.4
04|13 19.0% 5.4 15.1 20.5
22|31 23.2% 6.2 13.1 19.2
Annual Average 5.7 15.4 21.1
Avg. Ground Delay
22|13 33.6% 0.5 4.2 4.7
31|04 24.3% 0.4 9.9 10.3
04|13 19.0% 0.4 5.4 5.9
22|31 23.2% 0.5 5.4 5.9
Annual Average 0.5 6.1 6.5
Avg. Gate Delay
22|13 33.6% 0.0 1.5 1.5
31|04 24.3% 0.0 2.4 2.4
04|13 19.0% 0.0 1.5 1.5
22|31 23.2% 0.0 2.1 2.1
Annual Average 0.0 1.8 1.8
Avg. Air Delay
22|13 33.6% 1.4 0.0 1.4
31|04 24.3% 11.8 0.0 11.8
04|13 19.0% 4.3 0.0 4.3
22|31 23.2% 3.1 0.0 3.1
Annual Average 4.9 0.0 4.9
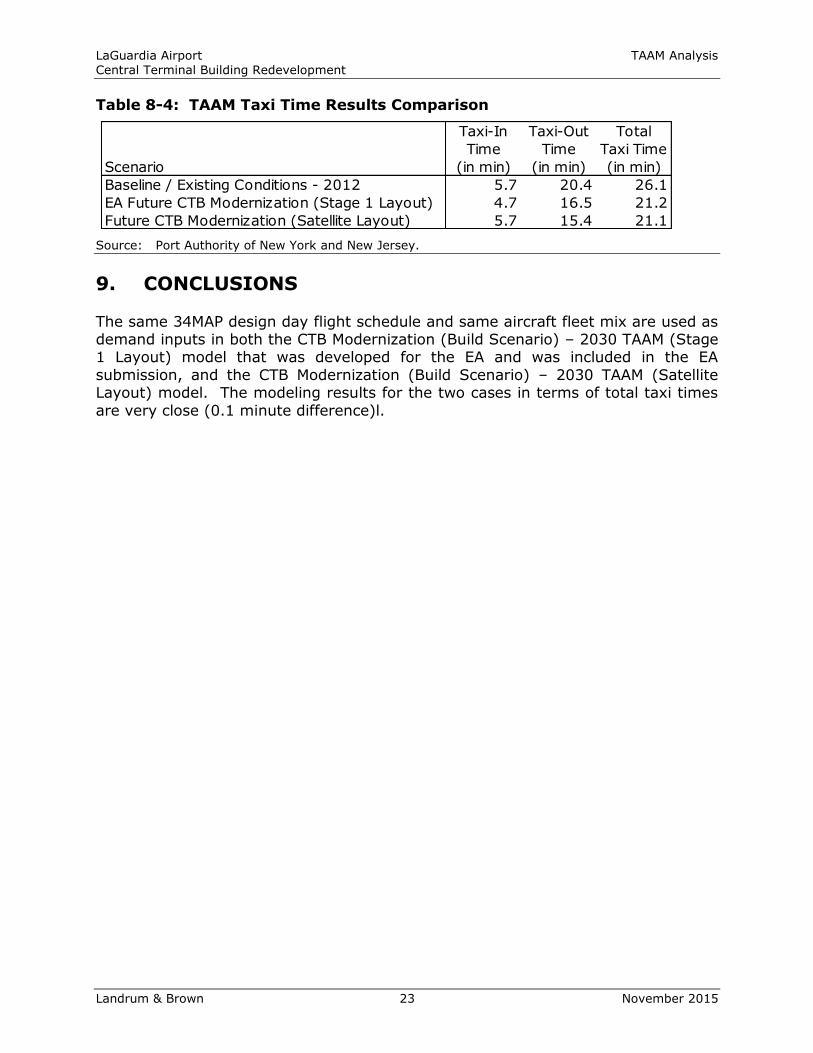
LaGuardia Airport TAAM Analysis Central Terminal Building Redevelopment
Landrum & Brown 23 November 2015
Table 8-4: TAAM Taxi Time Results Comparison
Source: Port Authority of New York and New Jersey.
9. CONCLUSIONS
The same 34MAP design day flight schedule and same aircraft fleet mix are used as demand inputs in both the CTB Modernization (Build Scenario) – 2030 TAAM (Stage 1 Layout) model that was developed for the EA and was included in the EA
submission, and the CTB Modernization (Build Scenario) – 2030 TAAM (Satellite Layout) model. The modeling results for the two cases in terms of total taxi times
are very close (0.1 minute difference)l.
Taxi-In Taxi-Out Total
Time Time Taxi Time
Scenario (in min) (in min) (in min)
Baseline / Existing Conditions - 2012 5.7 20.4 26.1
EA Future CTB Modernization (Stage 1 Layout) 4.7 16.5 21.2
Future CTB Modernization (Satellite Layout) 5.7 15.4 21.1
LaGuardia Airport TAAM Analysis Central Terminal Building Redevelopment
Landrum & Brown 24 November 2015
APPENDIX
TAAM BASELINE MODEL DEVELOPMENT
NEW YORK LA GUARDIA AIRPORT
PORT AUTHORITY OF NEW YORK AND NEW JERSEY
Prepared by:
PA Aviation Planning Department / Landrum & Brown April 2013
THE PORT AUTHORITY OF NEW YORK AND NEW JERSEY TAAM BASELINE MODEL DEVELOPMENT LGA
April 2013 Page - 1
INPUTS AND ASSUMPTIONS
1. AIRPORT OVERVIEW
Airside simulation models use a description of the airport’s facilities and operating environment as input, simulate air traffic movements through the defined environment, and provide as output the two critical measures that are used to determine airside capacity--throughput and delay. The analysis involved the simulation of the airfield and airspace system to quantify performance metrics associated with forecast demand. The airside includes the aircraft parking positions, apron area, taxiways, runways and all other aircraft movement areas of the Airport. The airspace system modeled included all the arrival and departure fixes. This analysis reflected input from air traffic controllers, airlines, Port Authority and airport staff. Key stakeholders were regularly consulted throughout the simulation study to ensure acceptance of the input assumptions, methodology, results and recommendations.
Jeppesen’s Total Airspace and Airport Modeler (TAAM) is a simulation tool used to assess airport and airspace operations. It is capable of conducting large scale, detailed, fast-time simulations for modeling of entire air traffic systems. TAAM is a four-dimensional flight path simulation. TAAM also produces high quality animations of the simulation. TAAM can be used to simulate aircraft movement in detail: a full individual airfield (including runways, taxiways and apron areas); an airfield and its associated terminal airspace; a regional system of airports and the associated airspace; or, a regional volume of airspace. It can produce detailed statistics on each aircraft operation simulated. Outputs include, but are not limited to: aircraft en route travel times; airport movements, operations on taxiways and runways, runway occupancy; airspace operation metrics such as usage of routes, sectors, fixes and coordination; throughput capacity per unit of time; delays by time of day and location on the airfield or in airspace, along with the reason for each delay; fuel consumption and potential conflicts.
It should be noted that airspace/airfield simulation modeling is not designed to produce an exact replication of all aspects of the real-world operating environment. To be effective, however, the model must reflect the logic applied by pilots and air traffic controllers to the greatest extent possible, and produce representative performance metrics associated with the most likely future operating conditions.
LaGuardia Airport (LGA) is one of three large-hub airports1 for the New York/New Jersey Metropolitan region. In 2009, LGA was the third largest airport of the region in terms of passengers and in terms of aircraft operations. Indeed, LGA accommodated 22.2 million passengers or 21.7 percent of the region’s total passenger traffic and processed 354,388 aircraft operations or 26 percent of the region’s traffic in 2009.
1 Federal Aviation Administration, National Plan of Integrated Airport Systems.
THE PORT AUTHORITY OF NEW YORK AND NEW JERSEY TAAM BASELINE MODEL DEVELOPMENT LGA
April 2013 Page - 2
LGA’s current airfield consists of two runways: one runway oriented in a northwest/southeast direction (Runway 13/31) and one runway oriented in a northeast/southwest direction (Runway 04/22). Runway 04/22 is 7,001 feet in length and 150 feet wide, oriented along a northeast to southwest alignment. Runway 04/22 intersects Runway 13/31 approximately 2,110 feet southwest of the Runway 22 threshold. Currently the airport hosts 10 domestic airlines and one international airline2. Terminals are usually dominated by one carrier. Delta and US Airways have their own terminal while other airlines are accommodated in the Central Terminal Building (CTB). LGA has four passenger terminals, known as Marine Air Terminal (Terminal A), Central Terminal Building (Terminal B), US Air / Delta Terminal (Terminal C), and Delta Terminal (Terminal D). The following sections provide the background analyses used to develop and calibrate the baseline TAAM model for LGA. 2. AIR TRAFFIC DEMAND In the original development of the LGA TAAM model, a baseline design day schedule was developed for year 2010. Data from the Official Airline Guide (OAG) was used as a basis for the development of this schedule, supplemented with data from the Port Authority’s AirScene database to evaluate the amount of general aviation and military activity. August 11, 2010 was selected as the Peak Month Average Weekday (PMAWD) for this original analysis. The PMAWD is a busy day at the airport, but not the busiest day, and is the industry standard for analyzing airfield capacity and delay. In 2012, major changes in the airlines’ scheduling practices occurred due to the Delta/US Airways slot swap. It was therefore decided to update the LGA TAAM model to reflect the latest operation levels at the airport following the slot swap. August 16, 2012 was selected as the new PMAWD for the TAAM model update. Inputs from both Delta Air Lines and US Airways were provided in order to appropriately reflect the changes in operations at LGA. Interim and end-state flight schedules were obtained from by Delta Airlines while US Airways provided flight schedules reflecting their traffic levels at LGA following the slot swap. The remaining of the operations were collected from OAG data while general aviation and military operations were collected from the Port Authority’s AirScene database. Changes expected after the slot swap are as follows:
US Airways will give up 132 daily pairs. US Airways will continue shuttle service to BOS and DCA. US Airways will also continue service to CLT, PHL, and PIT. US Airways will retain 6 gates and 3 hardstands on Terminal C.
Delta will add 116 daily pairs to their existing operation. Delta will get 16 gates on Terminal C.
JetBlue will add 8 daily pairs to their existing operation. JetBlue will get an additional gate on CTB. JetBlue will operate out of gates A3 and A4.
2 Based on Airport website.
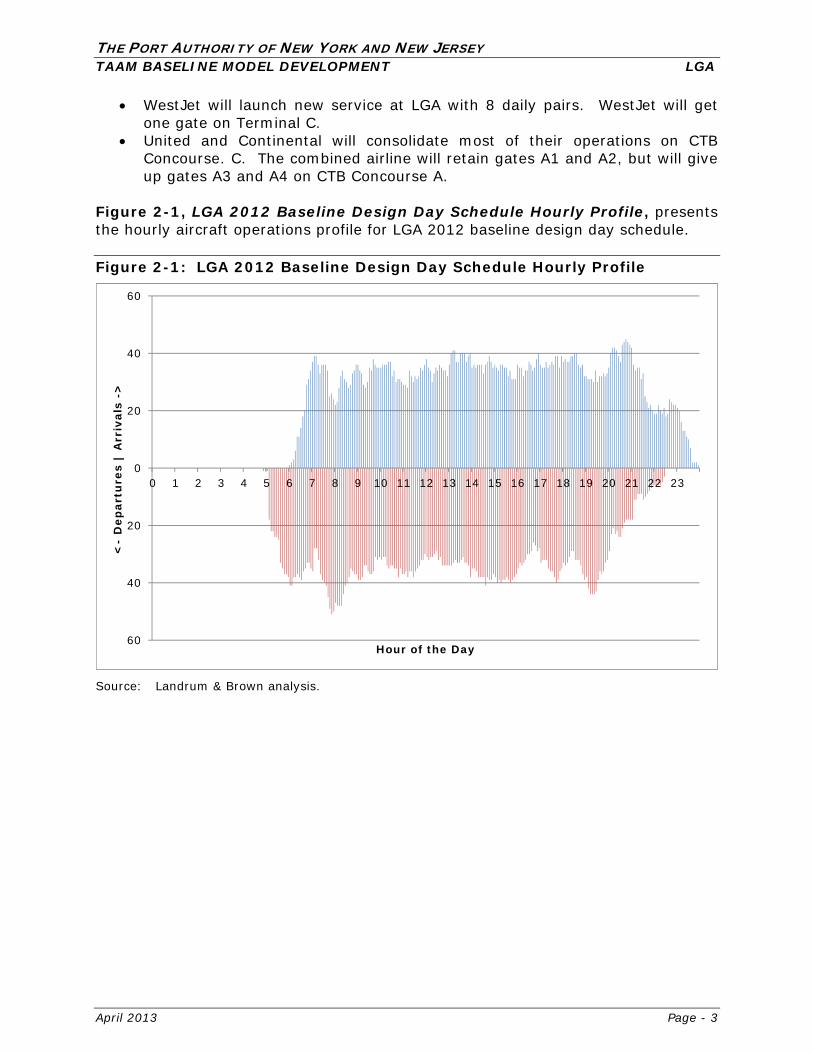
THE PORT AUTHORITY OF NEW YORK AND NEW JERSEY TAAM BASELINE MODEL DEVELOPMENT LGA
April 2013 Page - 3
WestJet will launch new service at LGA with 8 daily pairs. WestJet will get one gate on Terminal C.
United and Continental will consolidate most of their operations on CTB Concourse. C. The combined airline will retain gates A1 and A2, but will give up gates A3 and A4 on CTB Concourse A.
Figure 2-1, LGA 2012 Baseline Design Day Schedule Hourly Profile, presents the hourly aircraft operations profile for LGA 2012 baseline design day schedule. Figure 2-1: LGA 2012 Baseline Design Day Schedule Hourly Profile
Source: Landrum & Brown analysis.
60
40
20
0
20
40
60
0 1 2 3 4 5 6 7 8 9 10 11 12 13 14 15 16 17 18 19 20 21 22 23
<-
Dep
artu
res
| A
rriv
als
->
Hour of the Day
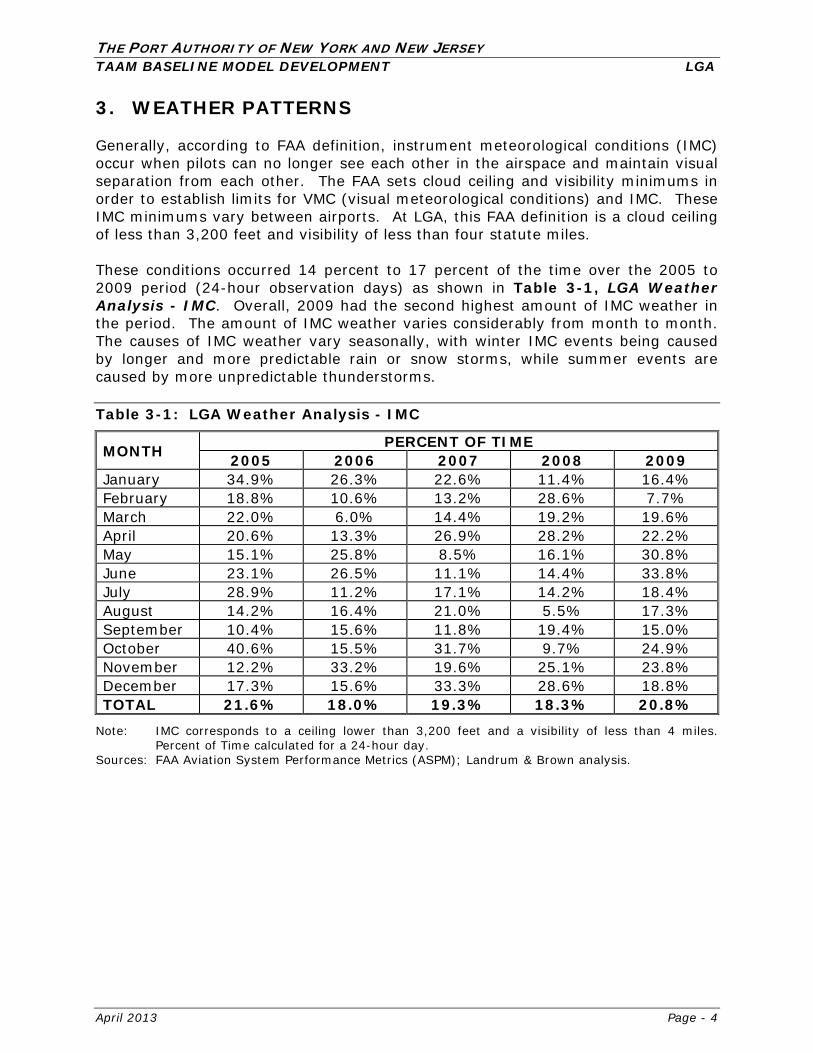
THE PORT AUTHORITY OF NEW YORK AND NEW JERSEY TAAM BASELINE MODEL DEVELOPMENT LGA
April 2013 Page - 4
3. WEATHER PATTERNS
Generally, according to FAA definition, instrument meteorological conditions (IMC) occur when pilots can no longer see each other in the airspace and maintain visual separation from each other. The FAA sets cloud ceiling and visibility minimums in order to establish limits for VMC (visual meteorological conditions) and IMC. These IMC minimums vary between airports. At LGA, this FAA definition is a cloud ceiling of less than 3,200 feet and visibility of less than four statute miles.
These conditions occurred 14 percent to 17 percent of the time over the 2005 to 2009 period (24-hour observation days) as shown in Table 3-1, LGA Weather Analysis - IMC. Overall, 2009 had the second highest amount of IMC weather in the period. The amount of IMC weather varies considerably from month to month. The causes of IMC weather vary seasonally, with winter IMC events being caused by longer and more predictable rain or snow storms, while summer events are caused by more unpredictable thunderstorms.
Table 3-1: LGA Weather Analysis - IMC
MONTH PERCENT OF TIME 2005 2006 2007 2008 2009
January 34.9% 26.3% 22.6% 11.4% 16.4% February 18.8% 10.6% 13.2% 28.6% 7.7% March 22.0% 6.0% 14.4% 19.2% 19.6%April 20.6% 13.3% 26.9% 28.2% 22.2% May 15.1% 25.8% 8.5% 16.1% 30.8%June 23.1% 26.5% 11.1% 14.4% 33.8% July 28.9% 11.2% 17.1% 14.2% 18.4% August 14.2% 16.4% 21.0% 5.5% 17.3% September 10.4% 15.6% 11.8% 19.4% 15.0% October 40.6% 15.5% 31.7% 9.7% 24.9% November 12.2% 33.2% 19.6% 25.1% 23.8% December 17.3% 15.6% 33.3% 28.6% 18.8% TOTAL 21.6% 18.0% 19.3% 18.3% 20.8%
Note: IMC corresponds to a ceiling lower than 3,200 feet and a visibility of less than 4 miles. Percent of Time calculated for a 24-hour day.
Sources: FAA Aviation System Performance Metrics (ASPM); Landrum & Brown analysis.
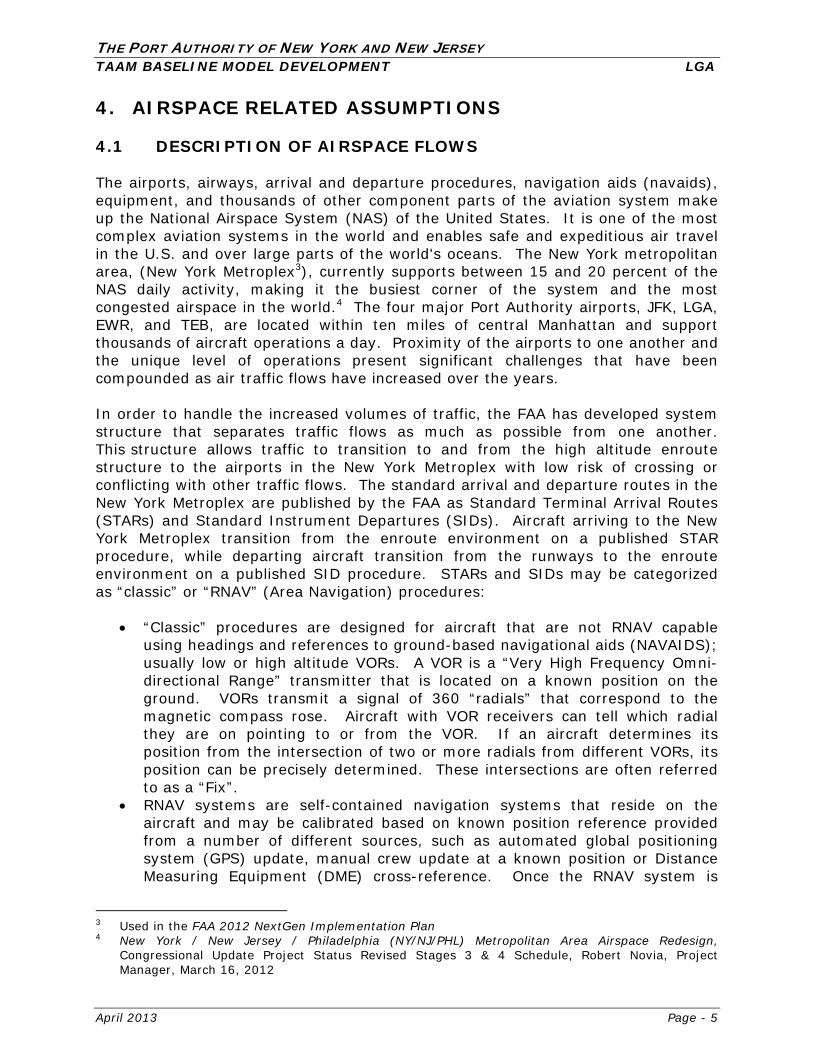
THE PORT AUTHORITY OF NEW YORK AND NEW JERSEY TAAM BASELINE MODEL DEVELOPMENT LGA
April 2013 Page - 5
4. AIRSPACE RELATED ASSUMPTIONS 4.1 DESCRIPTION OF AIRSPACE FLOWS The airports, airways, arrival and departure procedures, navigation aids (navaids), equipment, and thousands of other component parts of the aviation system make up the National Airspace System (NAS) of the United States. It is one of the most complex aviation systems in the world and enables safe and expeditious air travel in the U.S. and over large parts of the world's oceans. The New York metropolitan area, (New York Metroplex3), currently supports between 15 and 20 percent of the NAS daily activity, making it the busiest corner of the system and the most congested airspace in the world.4 The four major Port Authority airports, JFK, LGA, EWR, and TEB, are located within ten miles of central Manhattan and support thousands of aircraft operations a day. Proximity of the airports to one another and the unique level of operations present significant challenges that have been compounded as air traffic flows have increased over the years. In order to handle the increased volumes of traffic, the FAA has developed system structure that separates traffic flows as much as possible from one another. This structure allows traffic to transition to and from the high altitude enroute structure to the airports in the New York Metroplex with low risk of crossing or conflicting with other traffic flows. The standard arrival and departure routes in the New York Metroplex are published by the FAA as Standard Terminal Arrival Routes (STARs) and Standard Instrument Departures (SIDs). Aircraft arriving to the New York Metroplex transition from the enroute environment on a published STAR procedure, while departing aircraft transition from the runways to the enroute environment on a published SID procedure. STARs and SIDs may be categorized as “classic” or “RNAV” (Area Navigation) procedures:
“Classic” procedures are designed for aircraft that are not RNAV capable using headings and references to ground-based navigational aids (NAVAIDS); usually low or high altitude VORs. A VOR is a “Very High Frequency Omni-directional Range” transmitter that is located on a known position on the ground. VORs transmit a signal of 360 “radials” that correspond to the magnetic compass rose. Aircraft with VOR receivers can tell which radial they are on pointing to or from the VOR. If an aircraft determines its position from the intersection of two or more radials from different VORs, its position can be precisely determined. These intersections are often referred to as a “Fix”.
RNAV systems are self-contained navigation systems that reside on the aircraft and may be calibrated based on known position reference provided from a number of different sources, such as automated global positioning system (GPS) update, manual crew update at a known position or Distance Measuring Equipment (DME) cross-reference. Once the RNAV system is
3 Used in the FAA 2012 NextGen Implementation Plan 4 New York / New Jersey / Philadelphia (NY/NJ/PHL) Metropolitan Area Airspace Redesign,
Congressional Update Project Status Revised Stages 3 & 4 Schedule, Robert Novia, Project Manager, March 16, 2012

THE PORT AUTHORITY OF NEW YORK AND NEW JERSEY TAAM BASELINE MODEL DEVELOPMENT LGA
April 2013 Page - 6
calibrated to a known position, it can be used to navigate without constant reference to ground-based NAVAIDS.
Due to the proximity of JFK’s and EWR’s airspace, LGA’s airspace is one of the world’s most difficult airspace to control as it forms a narrow band in a northeast to southwest orientation between JFK’s and EWR’s airspace. As a result, arrivals bound to LGA from the western fixes are routed around EWR’s airspace before turning north or south on a direct route to LGA. Arrivals from the north are designed to remain clear of arriving flows to TEB and EWR and the long island airspace used for JFK’s arrival traffic.
LGA has five charted arrival flows:
The HAARP TWO ARRIVAL (classic) used by turbojets arriving from the north; The NOBBI FIVE ARRIVAL (classic) used by turboprops arriving from the
north; The MILTON FOUR ARRIVAL (classic) for aircraft arriving from the west; The KORRY THREE ARRIVAL (classic) used by turbojets arriving from the
south; and, The GATBY ONE ARRIVAL (classic) used by turboprops arriving from the
south.
LGA uses Runways 13/31 and 04 for all departures with the exception of few rare occasions when winds force a single runway operation. LGA uses Runway 04 approximately 18-20 percent of the time for departures. The rest of the time, LGA is evenly split using Runway 13 or Runway 31 for departure, although, in IFR conditions, Runway 13 is predominantly used (according to FAA ASPM data). LGA’s traffic shares departure fixes with JFK and EWR and has six SIDs, five of which are RNAV procedures. The five RNAV procedures are used to help mitigate noise and relieve operation constraints caused by LGA’s proximity with JFK and are runway-specific for departures from Runway 13 and Runway 22.
LGA has six departure procedures, five of them being RNAV procedures. LGA has three departure procedures when using Runway 13:
The TNNIS FOUR DEPARTURE (RNAV) procedure; The NTHNS TWO DEPARTURE (RNAV) procedure; and, The GLDMN FOUR DEPARTURE (RNAV) procedure.
LGA also has two departure procedures for departures from Runway 22:
The HOPEA ONE DEPARTURE (RNAV) procedures; and, The JUTES TWO DEPARTURE (RNAV) procedure.
The last LGA SID is a classic DP that covers departures from all four runways at LGA.
4.2 APPROACH AND TAKEOFF SEPARATIONS
Data from the Port Authority AirScene database for the months of June and July 2010 were analyzed in order to evaluate current aircraft wake turbulence

THE PORT AUTHORITY OF NEW YORK AND NEW JERSEY TAAM BASELINE MODEL DEVELOPMENT LGA
April 2013 Page - 7
separations at LGA (see Table 4-1, LGA Aircraft Approach Separations – 22/13 Configuration, Table 4-2, LGA Aircraft Approach Separations – 31/4 Configuration, Table 4-3, LGA Aircraft Approach Separations – 4/13 Configuration, Table 4-4, LGA Aircraft Approach Separations – 22/31 Configuration). These statistics were compared to the FAA standard aircraft separations presented in Table 4-5, Aircraft Approach Separations – FAA ATC Regulation. It revealed that FAA ATCT at the airport usually adds a buffer of 0.5 to 1.0 nautical miles to standard FAA aircraft separations for two consecutive arrivals. However, it should be noted that consecutive arrivals or departures only occur 30 percent of the time at LGA. Indeed, LGA ATCT controllers usually insert one or two departures between successive arrivals in order to maximize hourly airfield capacity. According to FAA data, this operational practice affects about 70 percent of the traffic at LGA. Further interviews with LGA FAA ATCT personnel corroborated these findings. For purposes of this simulation study, the actual separations obtained from the data analysis were used in the TAAM model to more closely reflect actual operations at the airport and surrounding airspace.
Table 4-1: LGA Aircraft Approach Separations (in Nautical Miles) – 22/13 Configuration
Arrival followed by Arrival LEADING AIRCRAFT
TRAILING AIRCRAFT A380 HEAVY B757 LARGE SMALL
A380 n.a. n.a. n.a. n.a. n.a.Heavy n.a. n.a. n.a. n.a. n.a.B757 n.a. n.a. 3.9-4.1 4.3-4.5 4.2-4.6 Large n.a. n.a. 3.0-3.2 2.4-2.8 2.6-3.0 Small n.a. n.a. 3.0-3.2 2.4-2.8 2.5-2.6
Arrival followed by Departure followed by Arrival LEADING AIRCRAFT
TRAILING AIRCRAFT A380 HEAVY B757 LARGE SMALL
A380 n.a. n.a. n.a. n.a. n.a.Heavy n.a. n.a. n.a. n.a. n.a.B757 n.a. n.a. 4.7-4.8 3.7-3.9 3.9-4.1 Large n.a. n.a. 3.1-3.6 2.8-3.2 2.7-3.1 Small n.a. n.a. 3.0-3.3 2.7-3.0 2.9-3.3
Arrival followed by Departure followed by Departure followed by Arrival LEADING AIRCRAFT
TRAILING AIRCRAFT A380 HEAVY B757 LARGE SMALL
A380 n.a. n.a. n.a. n.a. n.a.Heavy n.a. n.a. n.a. n.a. n.a.B757 n.a. n.a. 4.5-4.7 4.3-4.4 3.9-4.2 Large n.a. n.a. 3.3-3.6 3.4-3.6 3.5-3.6 Small n.a. n.a. 3.8-3.9 3.8-4.0 3.7-3.9
Note: Data analyzed for the months of June and July 2010. Sources: Port Authority of New York and New Jersey, AirScene data; Landrum & Brown analysis.
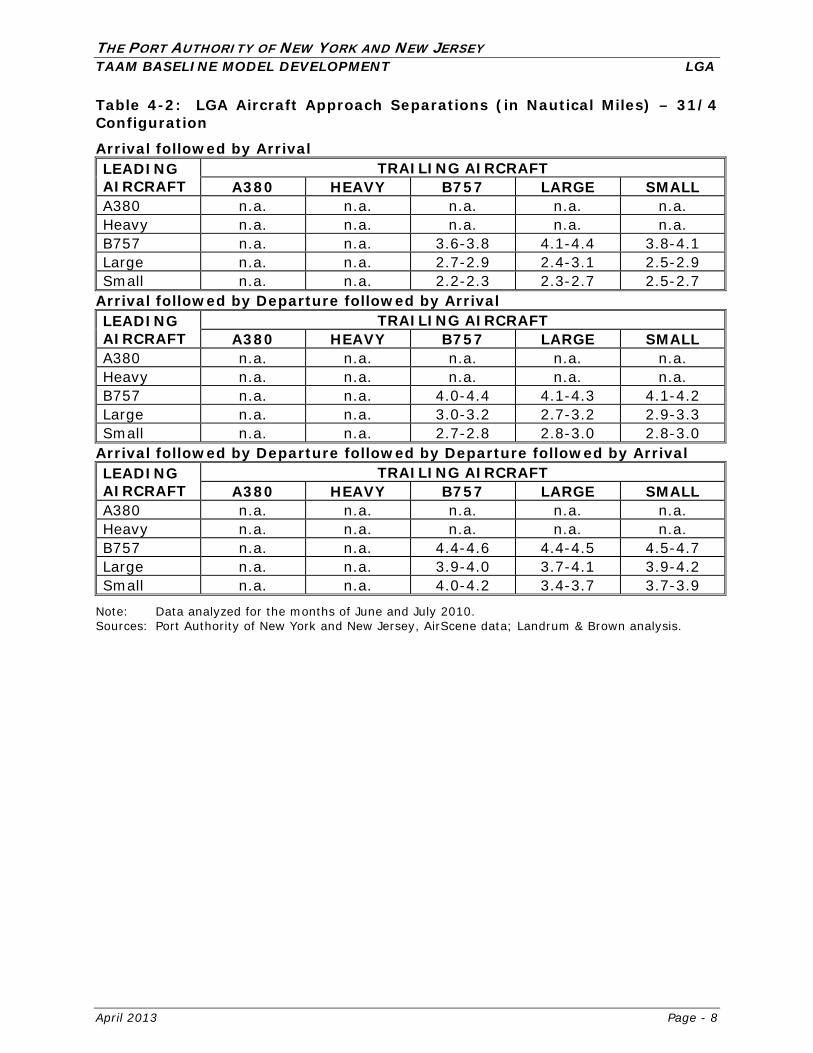
THE PORT AUTHORITY OF NEW YORK AND NEW JERSEY TAAM BASELINE MODEL DEVELOPMENT LGA
April 2013 Page - 8
Table 4-2: LGA Aircraft Approach Separations (in Nautical Miles) – 31/4 Configuration
Arrival followed by Arrival LEADING AIRCRAFT
TRAILING AIRCRAFT A380 HEAVY B757 LARGE SMALL
A380 n.a. n.a. n.a. n.a. n.a. Heavy n.a. n.a. n.a. n.a. n.a. B757 n.a. n.a. 3.6-3.8 4.1-4.4 3.8-4.1 Large n.a. n.a. 2.7-2.9 2.4-3.1 2.5-2.9 Small n.a. n.a. 2.2-2.3 2.3-2.7 2.5-2.7
Arrival followed by Departure followed by Arrival LEADING AIRCRAFT
TRAILING AIRCRAFT A380 HEAVY B757 LARGE SMALL
A380 n.a. n.a. n.a. n.a. n.a. Heavy n.a. n.a. n.a. n.a. n.a. B757 n.a. n.a. 4.0-4.4 4.1-4.3 4.1-4.2 Large n.a. n.a. 3.0-3.2 2.7-3.2 2.9-3.3 Small n.a. n.a. 2.7-2.8 2.8-3.0 2.8-3.0
Arrival followed by Departure followed by Departure followed by Arrival LEADING AIRCRAFT
TRAILING AIRCRAFT A380 HEAVY B757 LARGE SMALL
A380 n.a. n.a. n.a. n.a. n.a. Heavy n.a. n.a. n.a. n.a. n.a. B757 n.a. n.a. 4.4-4.6 4.4-4.5 4.5-4.7 Large n.a. n.a. 3.9-4.0 3.7-4.1 3.9-4.2 Small n.a. n.a. 4.0-4.2 3.4-3.7 3.7-3.9
Note: Data analyzed for the months of June and July 2010. Sources: Port Authority of New York and New Jersey, AirScene data; Landrum & Brown analysis.
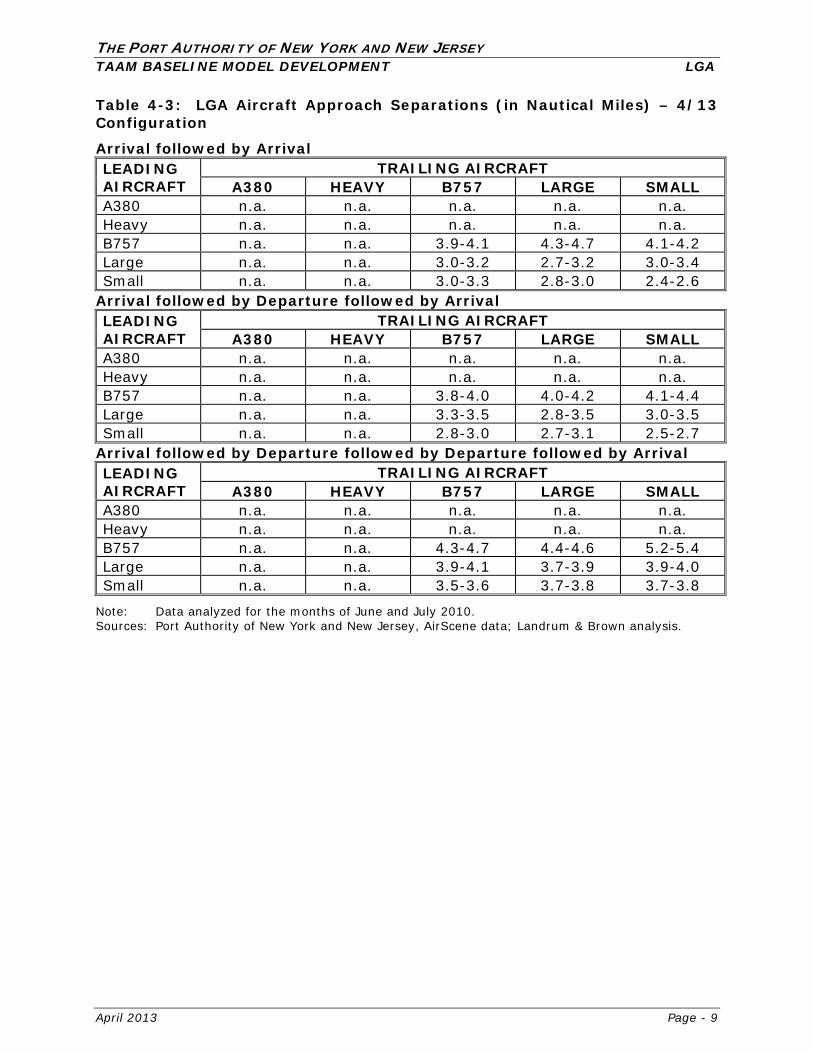
THE PORT AUTHORITY OF NEW YORK AND NEW JERSEY TAAM BASELINE MODEL DEVELOPMENT LGA
April 2013 Page - 9
Table 4-3: LGA Aircraft Approach Separations (in Nautical Miles) – 4/13 Configuration
Arrival followed by Arrival LEADING AIRCRAFT
TRAILING AIRCRAFT A380 HEAVY B757 LARGE SMALL
A380 n.a. n.a. n.a. n.a. n.a. Heavy n.a. n.a. n.a. n.a. n.a. B757 n.a. n.a. 3.9-4.1 4.3-4.7 4.1-4.2 Large n.a. n.a. 3.0-3.2 2.7-3.2 3.0-3.4 Small n.a. n.a. 3.0-3.3 2.8-3.0 2.4-2.6
Arrival followed by Departure followed by Arrival LEADING AIRCRAFT
TRAILING AIRCRAFT A380 HEAVY B757 LARGE SMALL
A380 n.a. n.a. n.a. n.a. n.a. Heavy n.a. n.a. n.a. n.a. n.a. B757 n.a. n.a. 3.8-4.0 4.0-4.2 4.1-4.4 Large n.a. n.a. 3.3-3.5 2.8-3.5 3.0-3.5 Small n.a. n.a. 2.8-3.0 2.7-3.1 2.5-2.7
Arrival followed by Departure followed by Departure followed by Arrival LEADING AIRCRAFT
TRAILING AIRCRAFT A380 HEAVY B757 LARGE SMALL
A380 n.a. n.a. n.a. n.a. n.a. Heavy n.a. n.a. n.a. n.a. n.a. B757 n.a. n.a. 4.3-4.7 4.4-4.6 5.2-5.4 Large n.a. n.a. 3.9-4.1 3.7-3.9 3.9-4.0 Small n.a. n.a. 3.5-3.6 3.7-3.8 3.7-3.8
Note: Data analyzed for the months of June and July 2010. Sources: Port Authority of New York and New Jersey, AirScene data; Landrum & Brown analysis.
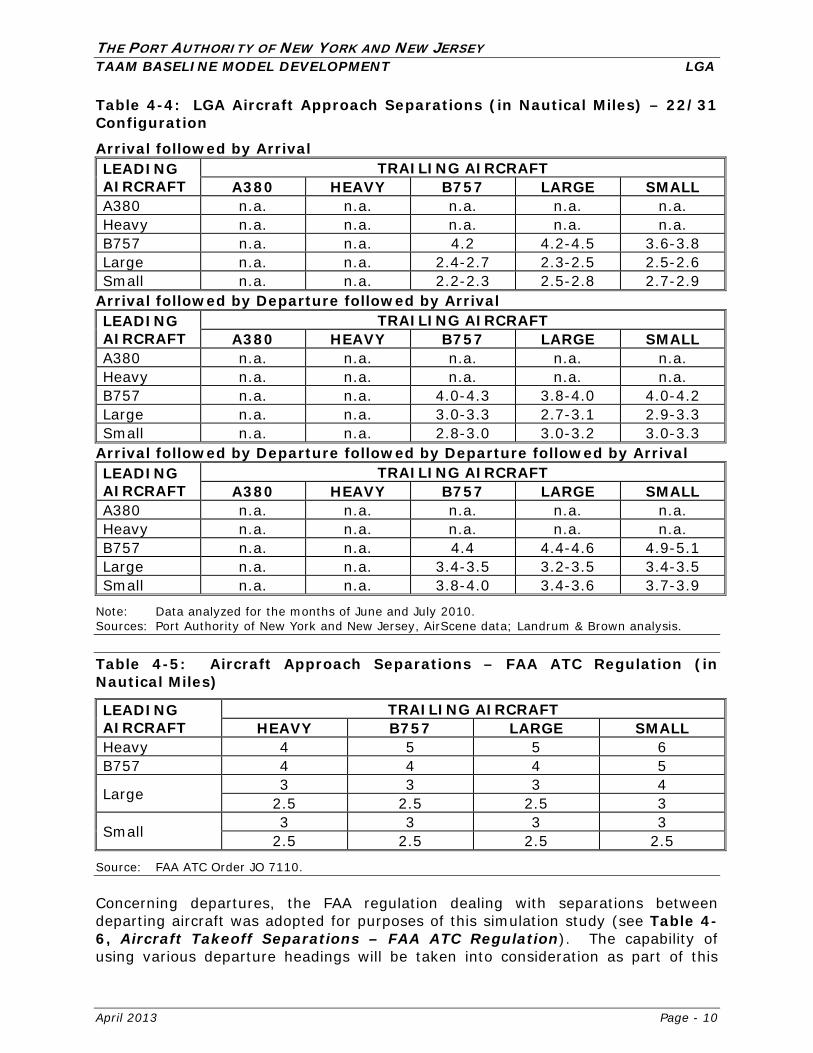
THE PORT AUTHORITY OF NEW YORK AND NEW JERSEY TAAM BASELINE MODEL DEVELOPMENT LGA
April 2013 Page - 10
Table 4-4: LGA Aircraft Approach Separations (in Nautical Miles) – 22/31 Configuration
Arrival followed by Arrival LEADING AIRCRAFT
TRAILING AIRCRAFT A380 HEAVY B757 LARGE SMALL
A380 n.a. n.a. n.a. n.a. n.a.Heavy n.a. n.a. n.a. n.a. n.a.B757 n.a. n.a. 4.2 4.2-4.5 3.6-3.8Large n.a. n.a. 2.4-2.7 2.3-2.5 2.5-2.6 Small n.a. n.a. 2.2-2.3 2.5-2.8 2.7-2.9
Arrival followed by Departure followed by Arrival LEADING AIRCRAFT
TRAILING AIRCRAFT A380 HEAVY B757 LARGE SMALL
A380 n.a. n.a. n.a. n.a. n.a.Heavy n.a. n.a. n.a. n.a. n.a.B757 n.a. n.a. 4.0-4.3 3.8-4.0 4.0-4.2 Large n.a. n.a. 3.0-3.3 2.7-3.1 2.9-3.3 Small n.a. n.a. 2.8-3.0 3.0-3.2 3.0-3.3
Arrival followed by Departure followed by Departure followed by Arrival LEADING AIRCRAFT
TRAILING AIRCRAFT A380 HEAVY B757 LARGE SMALL
A380 n.a. n.a. n.a. n.a. n.a.Heavy n.a. n.a. n.a. n.a. n.a.B757 n.a. n.a. 4.4 4.4-4.6 4.9-5.1Large n.a. n.a. 3.4-3.5 3.2-3.5 3.4-3.5 Small n.a. n.a. 3.8-4.0 3.4-3.6 3.7-3.9
Note: Data analyzed for the months of June and July 2010. Sources: Port Authority of New York and New Jersey, AirScene data; Landrum & Brown analysis.
Table 4-5: Aircraft Approach Separations – FAA ATC Regulation (in Nautical Miles)
LEADING AIRCRAFT
TRAILING AIRCRAFT HEAVY B757 LARGE SMALL
Heavy 4 5 5 6B757 4 4 4 5
Large 3 3 3 42.5 2.5 2.5 3
Small 3 3 3 32.5 2.5 2.5 2.5
Source: FAA ATC Order JO 7110.
Concerning departures, the FAA regulation dealing with separations between departing aircraft was adopted for purposes of this simulation study (see Table 4-6, Aircraft Takeoff Separations – FAA ATC Regulation). The capability of using various departure headings will be taken into consideration as part of this
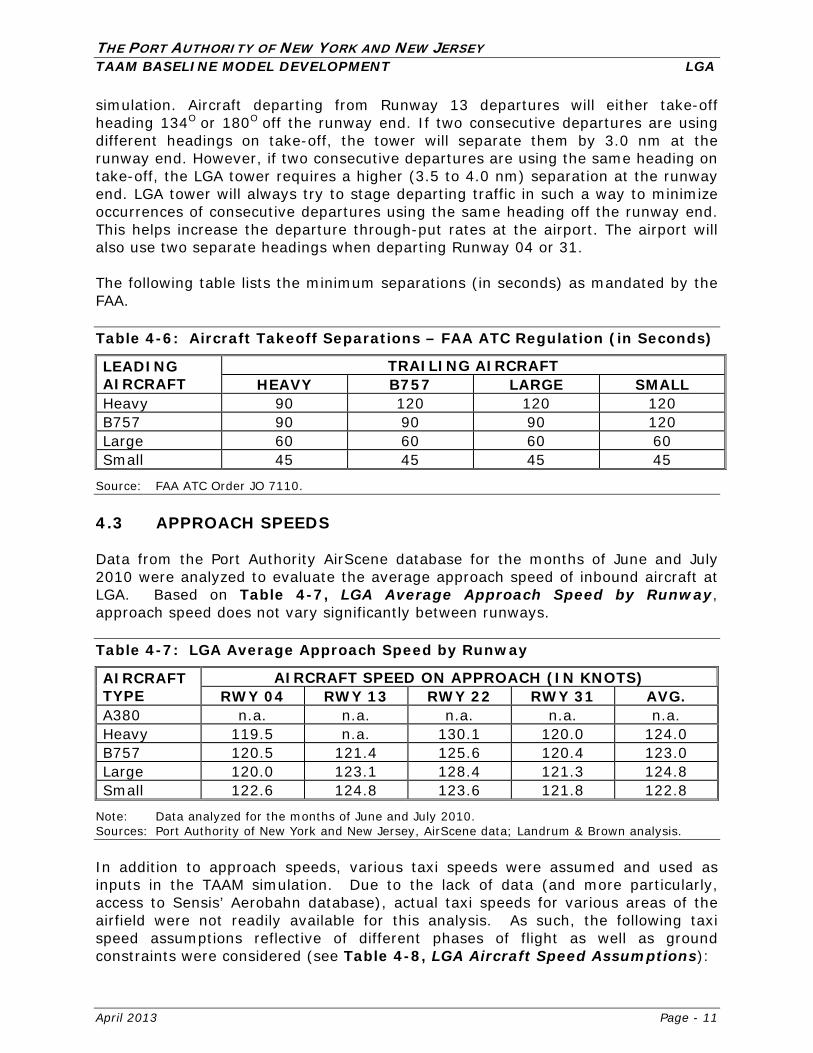
THE PORT AUTHORITY OF NEW YORK AND NEW JERSEY TAAM BASELINE MODEL DEVELOPMENT LGA
April 2013 Page - 11
simulation. Aircraft departing from Runway 13 departures will either take-off heading 134O or 180O off the runway end. If two consecutive departures are using different headings on take-off, the tower will separate them by 3.0 nm at the runway end. However, if two consecutive departures are using the same heading on take-off, the LGA tower requires a higher (3.5 to 4.0 nm) separation at the runway end. LGA tower will always try to stage departing traffic in such a way to minimize occurrences of consecutive departures using the same heading off the runway end. This helps increase the departure through-put rates at the airport. The airport will also use two separate headings when departing Runway 04 or 31. The following table lists the minimum separations (in seconds) as mandated by the FAA. Table 4-6: Aircraft Takeoff Separations – FAA ATC Regulation (in Seconds)
LEADING AIRCRAFT
TRAILING AIRCRAFT HEAVY B757 LARGE SMALL
Heavy 90 120 120 120 B757 90 90 90 120 Large 60 60 60 60 Small 45 45 45 45
Source: FAA ATC Order JO 7110. 4.3 APPROACH SPEEDS Data from the Port Authority AirScene database for the months of June and July 2010 were analyzed to evaluate the average approach speed of inbound aircraft at LGA. Based on Table 4-7, LGA Average Approach Speed by Runway, approach speed does not vary significantly between runways. Table 4-7: LGA Average Approach Speed by Runway
AIRCRAFT TYPE
AIRCRAFT SPEED ON APPROACH (IN KNOTS) RWY 04 RWY 13 RWY 22 RWY 31 AVG.
A380 n.a. n.a. n.a. n.a. n.a. Heavy 119.5 n.a. 130.1 120.0 124.0 B757 120.5 121.4 125.6 120.4 123.0 Large 120.0 123.1 128.4 121.3 124.8 Small 122.6 124.8 123.6 121.8 122.8
Note: Data analyzed for the months of June and July 2010. Sources: Port Authority of New York and New Jersey, AirScene data; Landrum & Brown analysis. In addition to approach speeds, various taxi speeds were assumed and used as inputs in the TAAM simulation. Due to the lack of data (and more particularly, access to Sensis’ Aerobahn database), actual taxi speeds for various areas of the airfield were not readily available for this analysis. As such, the following taxi speed assumptions reflective of different phases of flight as well as ground constraints were considered (see Table 4-8, LGA Aircraft Speed Assumptions):
THE PORT AUTHORITY OF NEW YORK AND NEW JERSEY TAAM BASELINE MODEL DEVELOPMENT LGA
April 2013 Page - 12
Apron Area - 5.0 knots Push-Back/Taxi-In - 3.0 knots Taxiways - 10.0 to 22.0 knots depending on the taxiway, taxi distance
covered and the level of congestion in the area considered Concerning approach speeds, actual speed by aircraft type were used in the TAAM simulation rather than aircraft group averages.
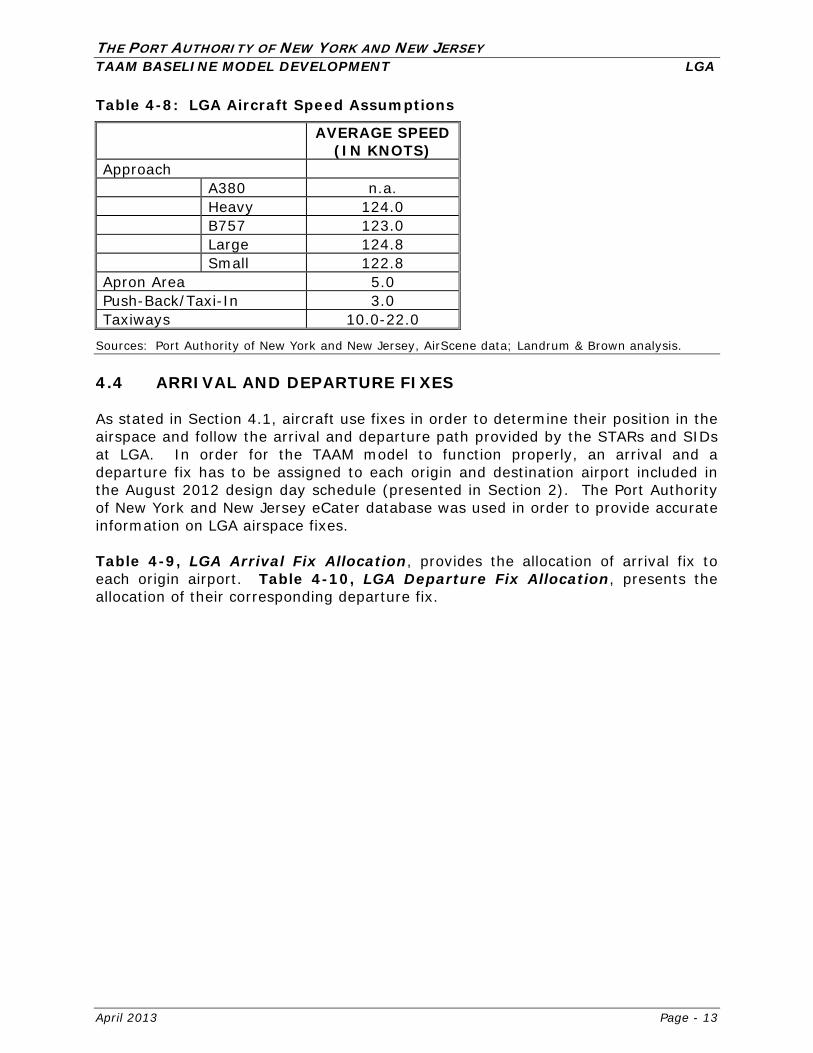
THE PORT AUTHORITY OF NEW YORK AND NEW JERSEY TAAM BASELINE MODEL DEVELOPMENT LGA
April 2013 Page - 13
Table 4-8: LGA Aircraft Speed Assumptions
AVERAGE SPEED (IN KNOTS)
ApproachA380 n.a.Heavy 124.0B757 123.0Large 124.8Small 122.8
Apron Area 5.0 Push-Back/Taxi-In 3.0Taxiways 10.0-22.0
Sources: Port Authority of New York and New Jersey, AirScene data; Landrum & Brown analysis.
4.4 ARRIVAL AND DEPARTURE FIXES
As stated in Section 4.1, aircraft use fixes in order to determine their position in the airspace and follow the arrival and departure path provided by the STARs and SIDs at LGA. In order for the TAAM model to function properly, an arrival and a departure fix has to be assigned to each origin and destination airport included in the August 2012 design day schedule (presented in Section 2). The Port Authority of New York and New Jersey eCater database was used in order to provide accurate information on LGA airspace fixes.
Table 4-9, LGA Arrival Fix Allocation, provides the allocation of arrival fix to each origin airport. Table 4-10, LGA Departure Fix Allocation, presents the allocation of their corresponding departure fix.
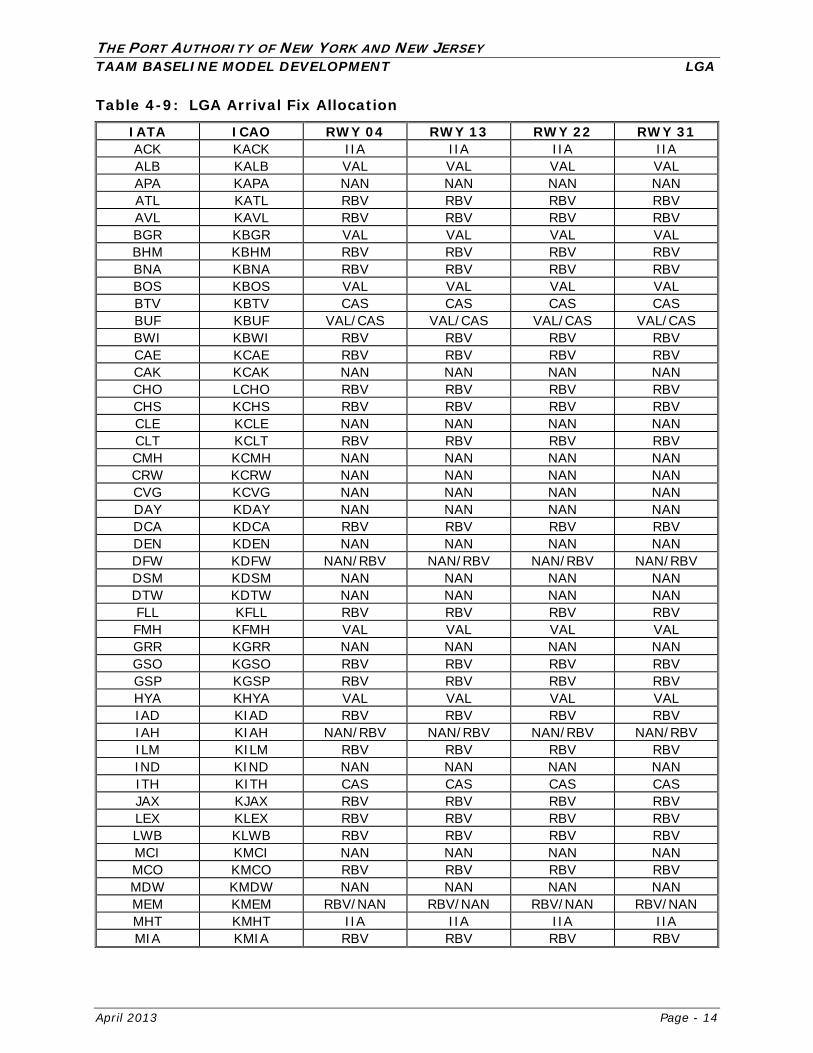
THE PORT AUTHORITY OF NEW YORK AND NEW JERSEY TAAM BASELINE MODEL DEVELOPMENT LGA
April 2013 Page - 14
Table 4-9: LGA Arrival Fix Allocation
IATA ICAO RWY 04 RWY 13 RWY 22 RWY 31 ACK KACK IIA IIA IIA IIA ALB KALB VAL VAL VAL VAL APA KAPA NAN NAN NAN NAN ATL KATL RBV RBV RBV RBV AVL KAVL RBV RBV RBV RBV BGR KBGR VAL VAL VAL VAL BHM KBHM RBV RBV RBV RBV BNA KBNA RBV RBV RBV RBV BOS KBOS VAL VAL VAL VAL BTV KBTV CAS CAS CAS CAS BUF KBUF VAL/CAS VAL/CAS VAL/CAS VAL/CAS BWI KBWI RBV RBV RBV RBV CAE KCAE RBV RBV RBV RBV CAK KCAK NAN NAN NAN NAN CHO LCHO RBV RBV RBV RBV CHS KCHS RBV RBV RBV RBV CLE KCLE NAN NAN NAN NAN CLT KCLT RBV RBV RBV RBV CMH KCMH NAN NAN NAN NAN CRW KCRW NAN NAN NAN NAN CVG KCVG NAN NAN NAN NAN DAY KDAY NAN NAN NAN NAN DCA KDCA RBV RBV RBV RBV DEN KDEN NAN NAN NAN NAN DFW KDFW NAN/RBV NAN/RBV NAN/RBV NAN/RBV DSM KDSM NAN NAN NAN NAN DTW KDTW NAN NAN NAN NAN FLL KFLL RBV RBV RBV RBV FMH KFMH VAL VAL VAL VAL GRR KGRR NAN NAN NAN NAN GSO KGSO RBV RBV RBV RBV GSP KGSP RBV RBV RBV RBV HYA KHYA VAL VAL VAL VAL IAD KIAD RBV RBV RBV RBV IAH KIAH NAN/RBV NAN/RBV NAN/RBV NAN/RBV ILM KILM RBV RBV RBV RBV IND KIND NAN NAN NAN NAN ITH KITH CAS CAS CAS CAS JAX KJAX RBV RBV RBV RBV LEX KLEX RBV RBV RBV RBV LWB KLWB RBV RBV RBV RBV MCI KMCI NAN NAN NAN NAN MCO KMCO RBV RBV RBV RBV MDW KMDW NAN NAN NAN NAN MEM KMEM RBV/NAN RBV/NAN RBV/NAN RBV/NAN MHT KMHT IIA IIA IIA IIA MIA KMIA RBV RBV RBV RBV
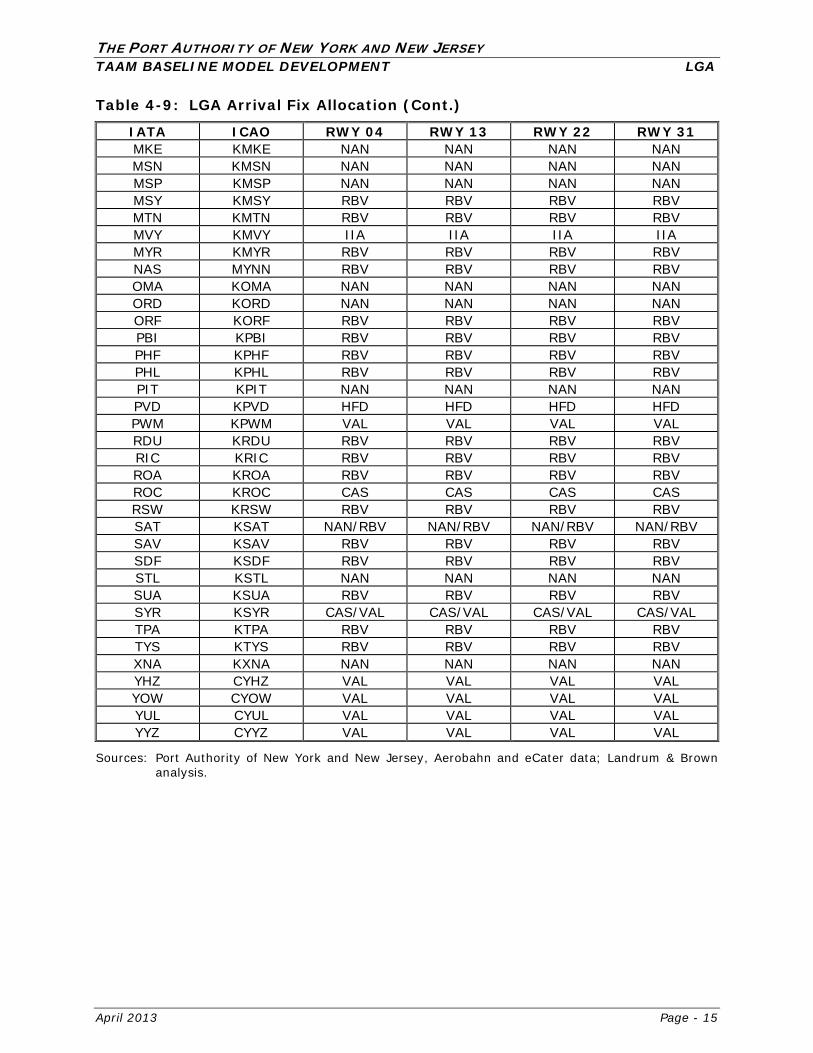
THE PORT AUTHORITY OF NEW YORK AND NEW JERSEY TAAM BASELINE MODEL DEVELOPMENT LGA
April 2013 Page - 15
Table 4-9: LGA Arrival Fix Allocation (Cont.)
IATA ICAO RWY 04 RWY 13 RWY 22 RWY 31 MKE KMKE NAN NAN NAN NAN MSN KMSN NAN NAN NAN NAN MSP KMSP NAN NAN NAN NAN MSY KMSY RBV RBV RBV RBV MTN KMTN RBV RBV RBV RBV MVY KMVY IIA IIA IIA IIA MYR KMYR RBV RBV RBV RBV NAS MYNN RBV RBV RBV RBV OMA KOMA NAN NAN NAN NAN ORD KORD NAN NAN NAN NAN ORF KORF RBV RBV RBV RBV PBI KPBI RBV RBV RBV RBV PHF KPHF RBV RBV RBV RBV PHL KPHL RBV RBV RBV RBV PIT KPIT NAN NAN NAN NAN PVD KPVD HFD HFD HFD HFD PWM KPWM VAL VAL VAL VAL RDU KRDU RBV RBV RBV RBV RIC KRIC RBV RBV RBV RBV ROA KROA RBV RBV RBV RBV ROC KROC CAS CAS CAS CAS RSW KRSW RBV RBV RBV RBV SAT KSAT NAN/RBV NAN/RBV NAN/RBV NAN/RBV SAV KSAV RBV RBV RBV RBV SDF KSDF RBV RBV RBV RBV STL KSTL NAN NAN NAN NAN SUA KSUA RBV RBV RBV RBV SYR KSYR CAS/VAL CAS/VAL CAS/VAL CAS/VAL TPA KTPA RBV RBV RBV RBV TYS KTYS RBV RBV RBV RBV XNA KXNA NAN NAN NAN NAN YHZ CYHZ VAL VAL VAL VAL YOW CYOW VAL VAL VAL VAL YUL CYUL VAL VAL VAL VAL YYZ CYYZ VAL VAL VAL VAL
Sources: Port Authority of New York and New Jersey, Aerobahn and eCater data; Landrum & Brown analysis.
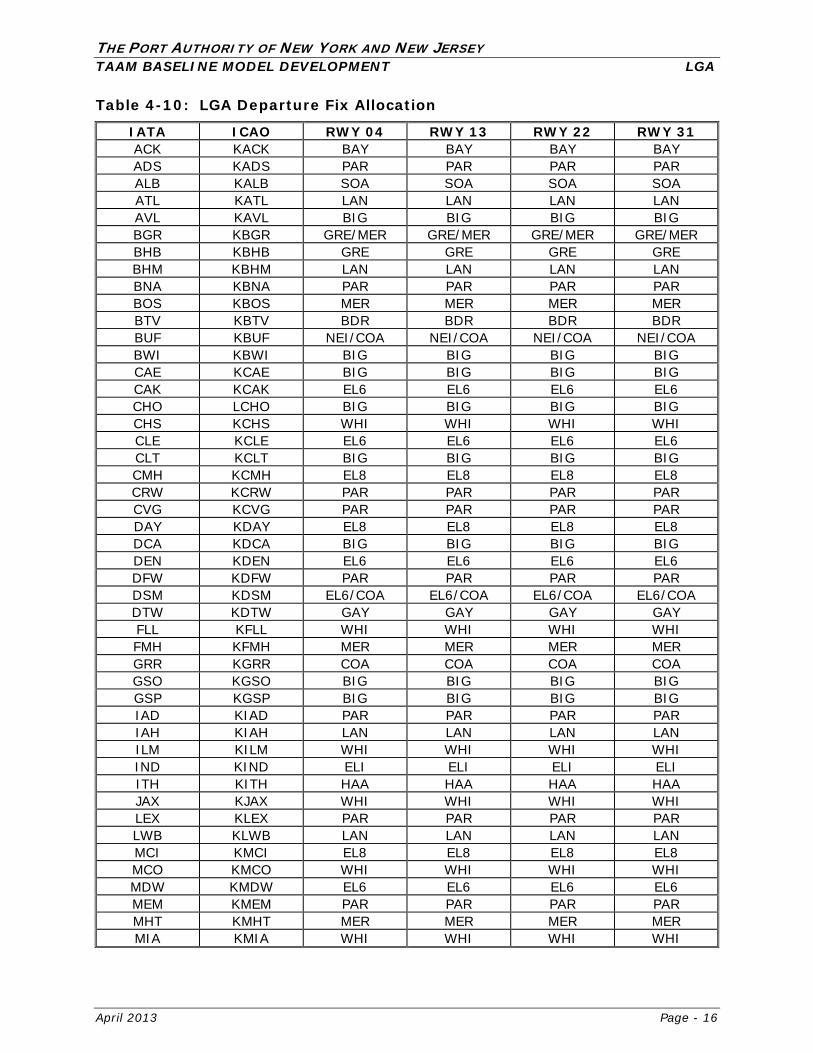
THE PORT AUTHORITY OF NEW YORK AND NEW JERSEY TAAM BASELINE MODEL DEVELOPMENT LGA
April 2013 Page - 16
Table 4-10: LGA Departure Fix Allocation
IATA ICAO RWY 04 RWY 13 RWY 22 RWY 31 ACK KACK BAY BAY BAY BAYADS KADS PAR PAR PAR PARALB KALB SOA SOA SOA SOAATL KATL LAN LAN LAN LANAVL KAVL BIG BIG BIG BIGBGR KBGR GRE/MER GRE/MER GRE/MER GRE/MER BHB KBHB GRE GRE GRE GREBHM KBHM LAN LAN LAN LANBNA KBNA PAR PAR PAR PARBOS KBOS MER MER MER MERBTV KBTV BDR BDR BDR BDRBUF KBUF NEI/COA NEI/COA NEI/COA NEI/COA BWI KBWI BIG BIG BIG BIGCAE KCAE BIG BIG BIG BIGCAK KCAK EL6 EL6 EL6 EL6CHO LCHO BIG BIG BIG BIGCHS KCHS WHI WHI WHI WHICLE KCLE EL6 EL6 EL6 EL6CLT KCLT BIG BIG BIG BIGCMH KCMH EL8 EL8 EL8 EL8CRW KCRW PAR PAR PAR PARCVG KCVG PAR PAR PAR PARDAY KDAY EL8 EL8 EL8 EL8DCA KDCA BIG BIG BIG BIGDEN KDEN EL6 EL6 EL6 EL6DFW KDFW PAR PAR PAR PARDSM KDSM EL6/COA EL6/COA EL6/COA EL6/COA DTW KDTW GAY GAY GAY GAYFLL KFLL WHI WHI WHI WHIFMH KFMH MER MER MER MERGRR KGRR COA COA COA COAGSO KGSO BIG BIG BIG BIGGSP KGSP BIG BIG BIG BIGIAD KIAD PAR PAR PAR PARIAH KIAH LAN LAN LAN LANILM KILM WHI WHI WHI WHIIND KIND ELI ELI ELI ELIITH KITH HAA HAA HAA HAAJAX KJAX WHI WHI WHI WHILEX KLEX PAR PAR PAR PARLWB KLWB LAN LAN LAN LANMCI KMCI EL8 EL8 EL8 EL8MCO KMCO WHI WHI WHI WHIMDW KMDW EL6 EL6 EL6 EL6MEM KMEM PAR PAR PAR PARMHT KMHT MER MER MER MERMIA KMIA WHI WHI WHI WHI
THE PORT AUTHORITY OF NEW YORK AND NEW JERSEY TAAM BASELINE MODEL DEVELOPMENT LGA
April 2013 Page - 17
Table 4-10: LGA Departure Fix Allocation (Cont.)
IATA ICAO RWY 04 RWY 13 RWY 22 RWY 31 MKE KMKE COA COA COA COAMSN KMSN COA COA COA COAMSP KMSP GAY/COA GAY/COA GAY/COA GAY/COA MSY KMSY LAN LAN LAN LANMTN KMTN BIG BIG BIG BIGMVY KMVY MAD/BAY MAD/BAY MAD/BAY MAD/BAY MYR KMYR WHI WHI WHI WHINAS MYNN WHI WHI WHI WHIOMA KOMA EL6 EL6 EL6 EL6ORD KORD COA COA COA COAORF KORF WHI WHI WHI WHIPBI KPBI WHI WHI WHI WHIPHF KPHF WHI WHI WHI WHIPHL KPHL SAX/CYN SAX/CYN SAX/CYN SAX/CYN PIT KPIT EL8 EL8 EL8 EL8PVD KPVD BAY BAY BAY BAYPWM KPWM GRE GRE GRE GRERDU KRDU WHI WHI WHI WHIRIC KRIC WHI WHI WHI WHIROA KROA LAN LAN LAN LANROC KROC HAA/NEI HAA/NEI HAA/NEI HAA/NEI RSW KRSW BIG BIG BIG BIGSAV KSAV WHI WHI WHI WHISDF KSDF PAR PAR PAR PARSTL KSTL EL8 EL8 EL8 EL8SYR KSYR HAA/NEI HAA/NEI HAA/NEI HAA/NEI TPA KTPA BIG BIG BIG BIGTYS KTYS LAN LAN LAN LANXNA KXNA PAR PAR PAR PARYHZ CYHZ GRE GRE GRE GREYOW CYOW GRE GRE GRE GREYUL CYUL GRE GRE GRE GREYYZ CYYZ GAY GAY GAY GAY
Sources: Port Authority of New York and New Jersey, Aerobahn and eCater data; Landrum & Brown analysis.
THE PORT AUTHORITY OF NEW YORK AND NEW JERSEY TAAM BASELINE MODEL DEVELOPMENT LGA
April 2013 Page - 18
5. AIRFIELD RELATED ASSUMPTIONS
5.1 RUNWAY FLOWS
There are seven runway operating configurations used at LGA. The seven runway configurations used at LGA are defined by the airspace used for approaching the arrival runways. The runway operating configuration used most frequently consists of arrivals on Runway 22 and departures on Runway 13. Table 5-1, LGA Historical Runway Configuration Usage, lists each runway configuration with the percent usage. The top four configurations are also illustrated in Figure 5-1, LGA Top Airport Runway Configurations – Year 2009 Usage.
The top five runway configurations were used 78.9 percent of the time in 2009. The usage of these five configurations is fairly evenly distributed. However, it is worth noting an increase in the use of the runway configuration 31|31 over the past five years to the detriment of 22|13. The 22/13 configuration has historically been the most used configuration over the past five years despite a decline in usage from 27 percent in 2005 to about 20 percent in 2009. The 22/13 configuration (if all climbs are available) is the highest arrival and departure capacity at LGA. The 22/31, 31/4 and 4/13 configurations are the other configurations that are frequently used at LGA. All together, the top four configurations accounted for 67 percent to 72 percent of traffic over the past five years. In addition to these four configurations, LGA is sometimes forced to use a single runway configuration (mostly ILS 13/13) in IFR weather which is a low capacity and high delay configuration. LGA may also use a single runway configuration (mostly 31/31) during low traffic periods such as all-day Saturday, Sunday mornings, or early mornings on weekdays.
Table 5-1: LGA Historical Runway Configuration Usage
FLOW PERCENT OF TIME CY2005 CY2006 CY2007 CY2008 CY2009
Arr 22/Dep 13 27.0% 25.3% 23.9% 22.9% 19.7% Arr 31/Dep 4 15.3% 18.1% 16.5% 18.2% 17.4% Arr 4/Dep 13 14.7% 12.5% 12.1% 12.0% 15.4% Arr 22/Dep 31 15.0% 15.0% 19.2% 18.7% 14.0% Arr 31/Dep 31 4.4% 5.2% 7.4% 9.4% 12.4% Other Single Rwy 12.4% 12.0% 9.6% 7.6% 6.3% Other 11.2% 11.9% 11.3% 11.4% 14.8% TOTAL 100.0% 100.0% 100.0% 100.0% 100.0%
Sources: FAA Aviation System Performance Metrics (ASPM); Landrum & Brown analysis
THE PORT AUTHORITY OF NEW YORK AND NEW JERSEY TAAM BASELINE MODEL DEVELOPMENT LGA
April 2013 Page - 19
Figure 5-1: LGA Top Airport Runway Configurations – Year 2009 Usage
Note: Percent usage calculated based on total aircraft operations. Sources: Port Authority of New York and New Jersey, eCater data; Landrum & Brown analysis.
All runways are fairly evenly used across the year as shown in Figure 5-2, LGA Runway Usage – Year 2009. Nevertheless, Runway 22 is the primary arrival runway while Runway 13 is the primary departure runway. These runways accounted for over 45 percent of arrivals and departures, respectively, in 2009.

THE PORT AUTHORITY OF NEW YORK AND NEW JERSEY TAAM BASELINE MODEL DEVELOPMENT LGA
April 2013 Page - 20
Figure 5-2: LGA Runway Usage – Year 2009
Note: Percent usage calculated based on total aircraft operations. Sources: Port Authority of New York and New Jersey, eCater data; Landrum & Brown analysis. 5.2 RUNWAY EXITS In order to properly calibrate the TAAM model, an analysis of runway exits and runway occupancy time was conducted for year 2009 at LGA using the FAA Runway Exit Design Interactive Model (REDIM). As shown in Figure 5-3, Runway Exit Utilization – Runway 22, Figure 5-4, Runway Exit Utilization – Runway 31, and Figure 5-5, Runway Exit Utilization – Runway 4, twelve runway exits are available on Runway 4/22 (six exits in each flow direction) and six runway exits can be used for arrivals on Runway 31. The 2009 fleet mix presented in Table 5-2, LGA 2009 Fleet Mix for REDIM, was used as inputs in the REDIM model. The model was calibrated and adjusted based on the inputs received from the LGA tower.
THE PORT AUTHORITY OF NEW YORK AND NEW JERSEY TAAM BASELINE MODEL DEVELOPMENT LGA
April 2013 Page - 21
Table 5-2: LGA 2009 Fleet Mix for REDIM
AIRCRAFT TYPE PERCENT OF TOTAL CRJ-200 12.0% DHC-8 6.0% Do-328 1.0% EMB145 23.0%
SAAB-340 6.0% A320-200 15.0% B717-200 2.0% B737-300 2.0% B737-800 8.0% B757-200 8.0% DC-9-32 1.0% MD-83 16.0% Total 100.0%
Source: Port Authority of New York and New Jersey.
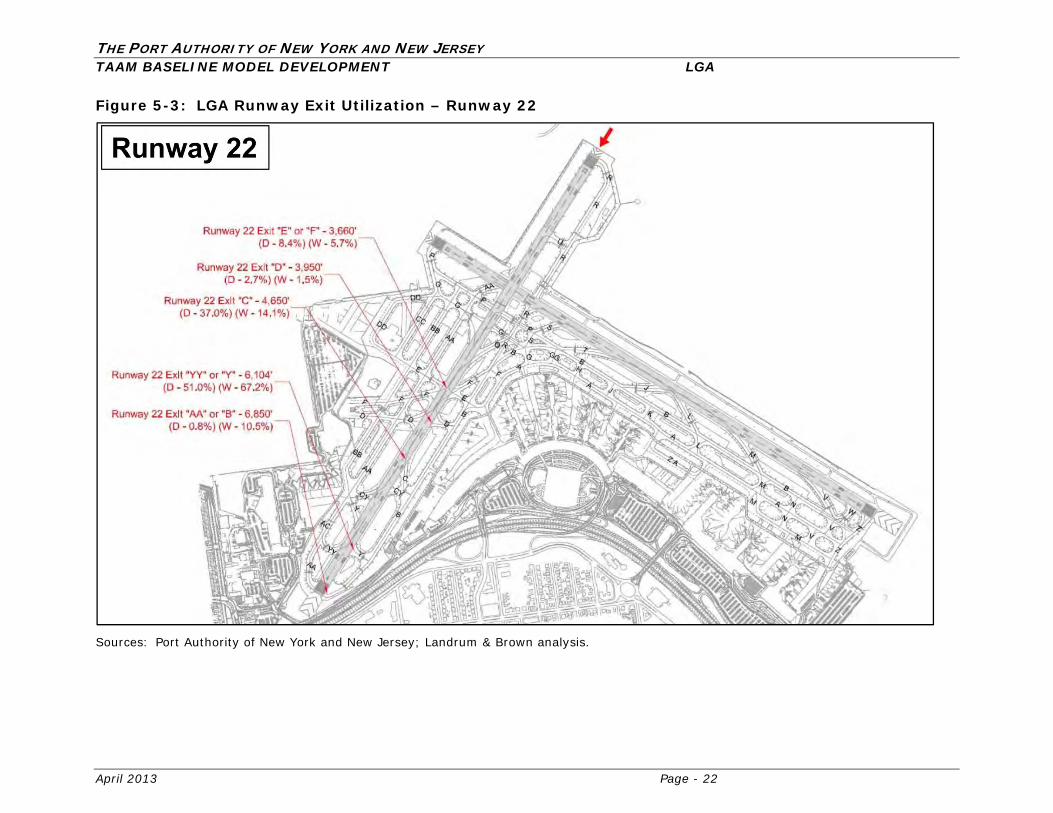
THE PORT AUTHORITY OF NEW YORK AND NEW JERSEY TAAM BASELINE MODEL DEVELOPMENT LGA
April 2013 Page - 22
Figure 5-3: LGA Runway Exit Utilization – Runway 22
Sources: Port Authority of New York and New Jersey; Landrum & Brown analysis.
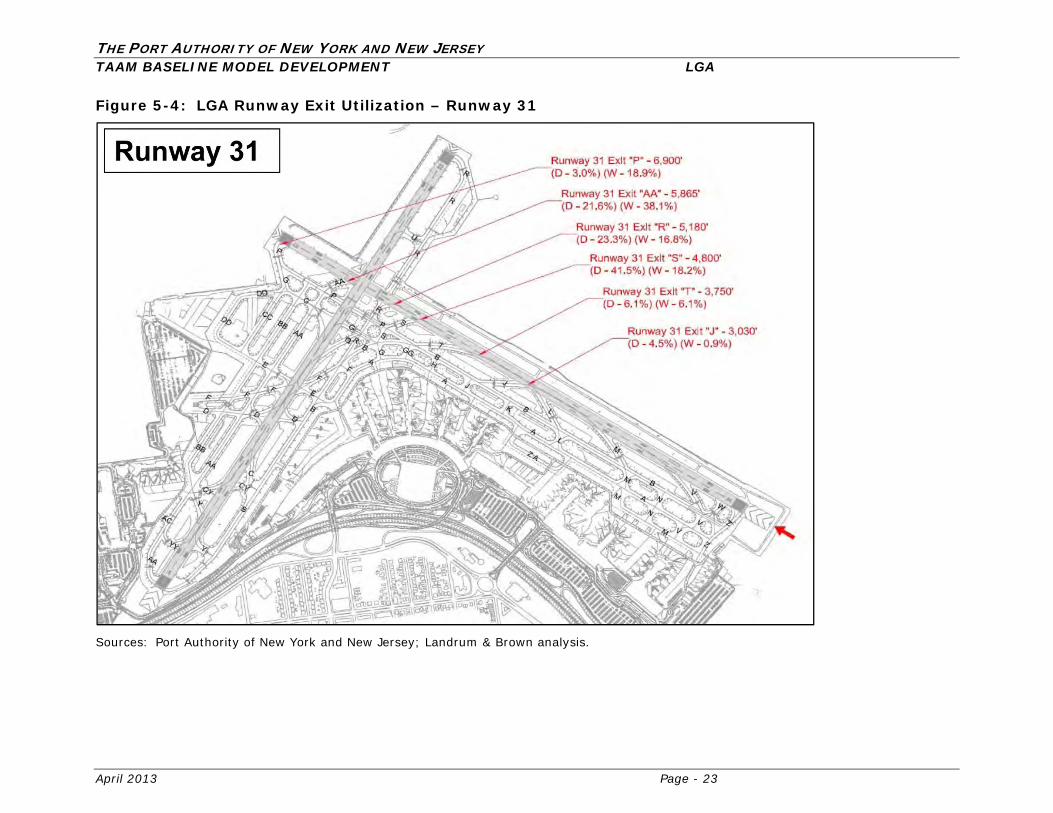
THE PORT AUTHORITY OF NEW YORK AND NEW JERSEY TAAM BASELINE MODEL DEVELOPMENT LGA
April 2013 Page - 23
Figure 5-4: LGA Runway Exit Utilization – Runway 31
Sources: Port Authority of New York and New Jersey; Landrum & Brown analysis.

THE PORT AUTHORITY OF NEW YORK AND NEW JERSEY TAAM BASELINE MODEL DEVELOPMENT LGA
April 2013 Page - 24
Figure 5-5: LGA Runway Exit Utilization – Runway 04
Sources: Port Authority of New York and New Jersey; Landrum & Brown analysis.
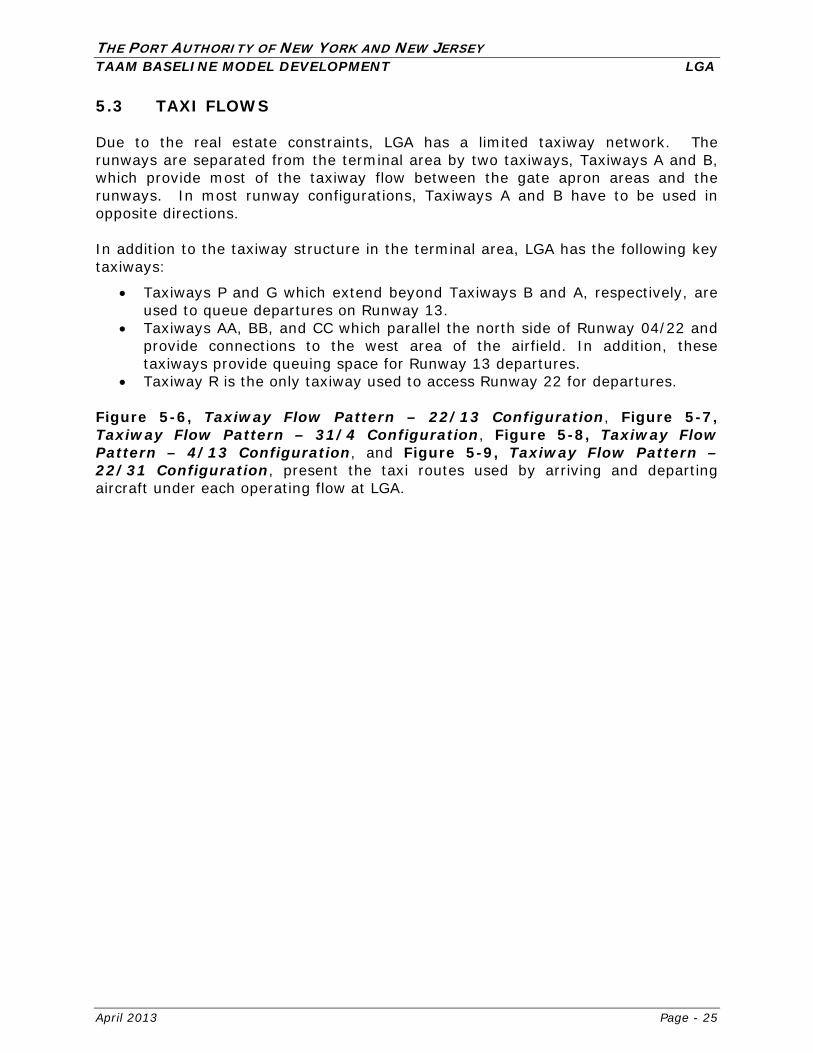
THE PORT AUTHORITY OF NEW YORK AND NEW JERSEY TAAM BASELINE MODEL DEVELOPMENT LGA
April 2013 Page - 25
5.3 TAXI FLOWS Due to the real estate constraints, LGA has a limited taxiway network. The runways are separated from the terminal area by two taxiways, Taxiways A and B, which provide most of the taxiway flow between the gate apron areas and the runways. In most runway configurations, Taxiways A and B have to be used in opposite directions. In addition to the taxiway structure in the terminal area, LGA has the following key taxiways:
Taxiways P and G which extend beyond Taxiways B and A, respectively, are used to queue departures on Runway 13.
Taxiways AA, BB, and CC which parallel the north side of Runway 04/22 and provide connections to the west area of the airfield. In addition, these taxiways provide queuing space for Runway 13 departures.
Taxiway R is the only taxiway used to access Runway 22 for departures. Figure 5-6, Taxiway Flow Pattern – 22/13 Configuration, Figure 5-7, Taxiway Flow Pattern – 31/4 Configuration, Figure 5-8, Taxiway Flow Pattern – 4/13 Configuration, and Figure 5-9, Taxiway Flow Pattern – 22/31 Configuration, present the taxi routes used by arriving and departing aircraft under each operating flow at LGA.

THE PORT AUTHORITY OF NEW YORK AND NEW JERSEY TAAM BASELINE MODEL DEVELOPMENT LGA
April 2013 Page - 26
Figure 5-6: Taxiway Flow Pattern – 22/13 Configuration
Source: Landrum & Brown analysis.
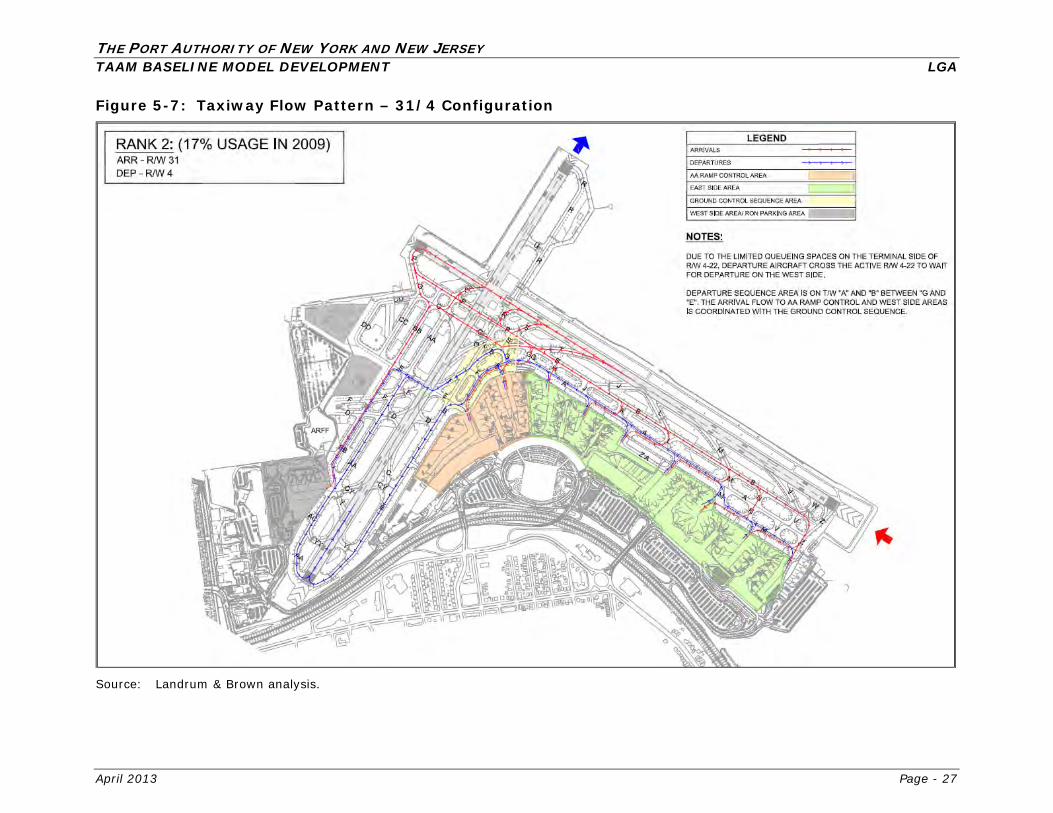
THE PORT AUTHORITY OF NEW YORK AND NEW JERSEY TAAM BASELINE MODEL DEVELOPMENT LGA
April 2013 Page - 27
Figure 5-7: Taxiway Flow Pattern – 31/4 Configuration
Source: Landrum & Brown analysis.
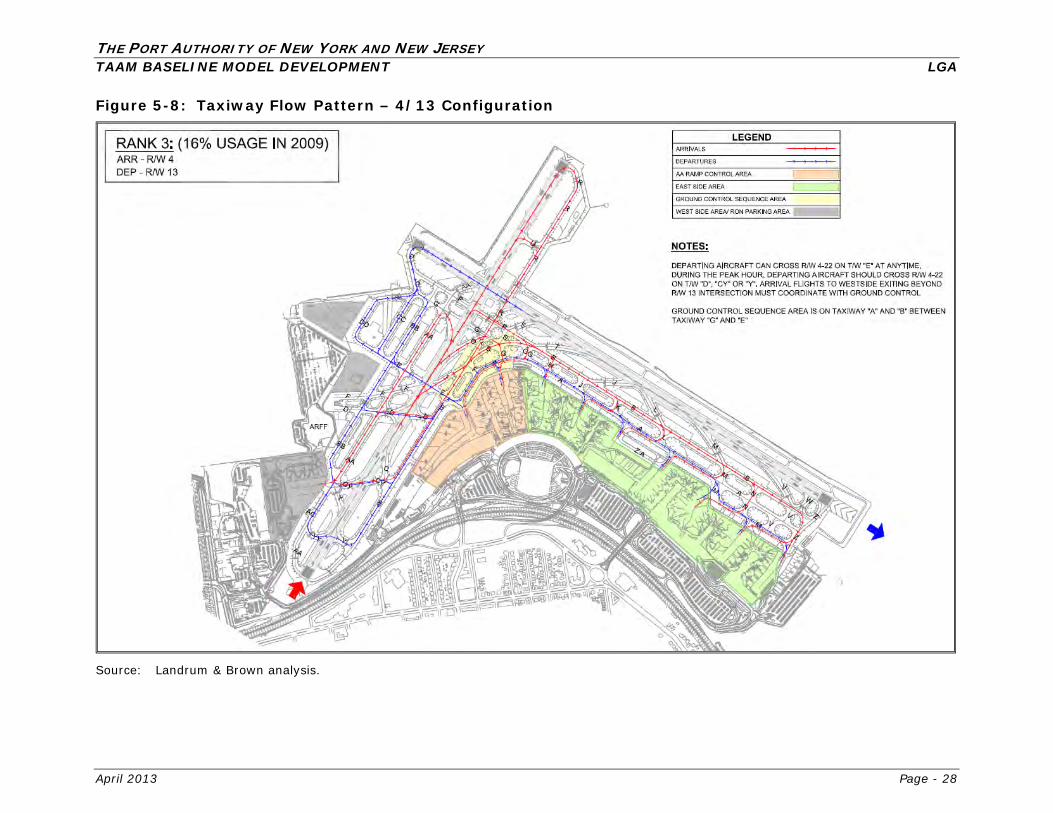
THE PORT AUTHORITY OF NEW YORK AND NEW JERSEY TAAM BASELINE MODEL DEVELOPMENT LGA
April 2013 Page - 28
Figure 5-8: Taxiway Flow Pattern – 4/13 Configuration
Source: Landrum & Brown analysis.
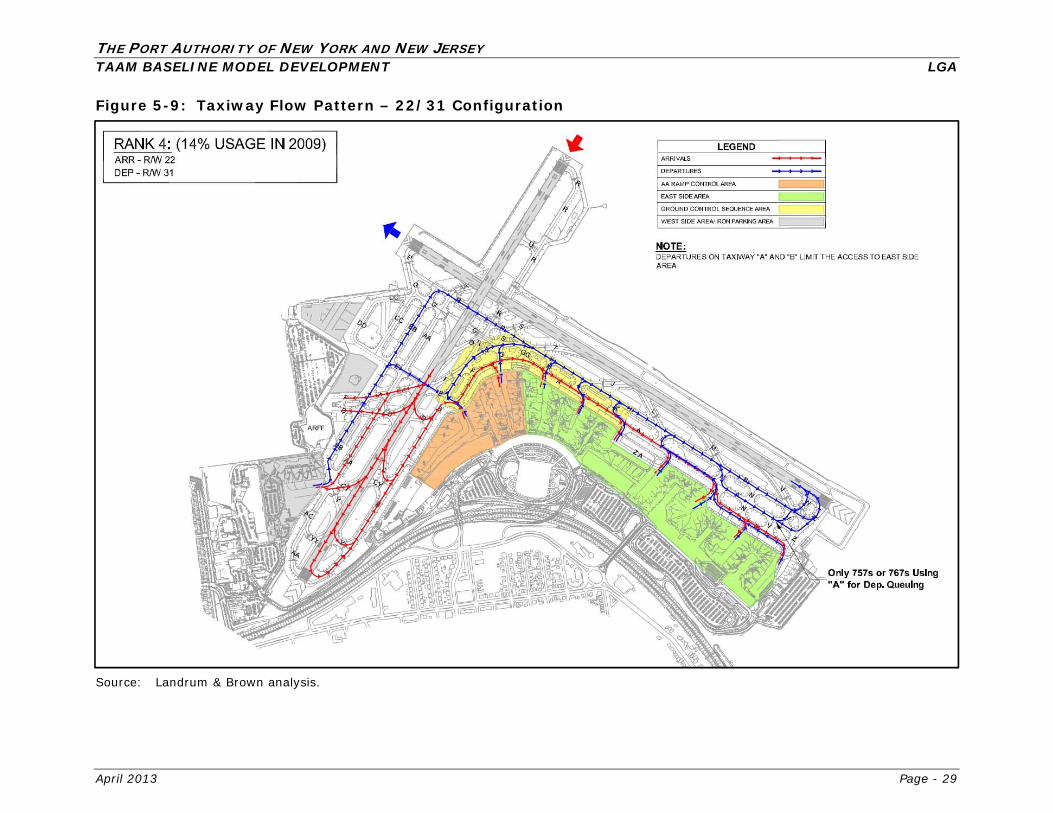
THE PORT AUTHORITY OF NEW YORK AND NEW JERSEY TAAM BASELINE MODEL DEVELOPMENT LGA
April 2013 Page - 29
Figure 5-9: Taxiway Flow Pattern – 22/31 Configuration
Source: Landrum & Brown analysis.
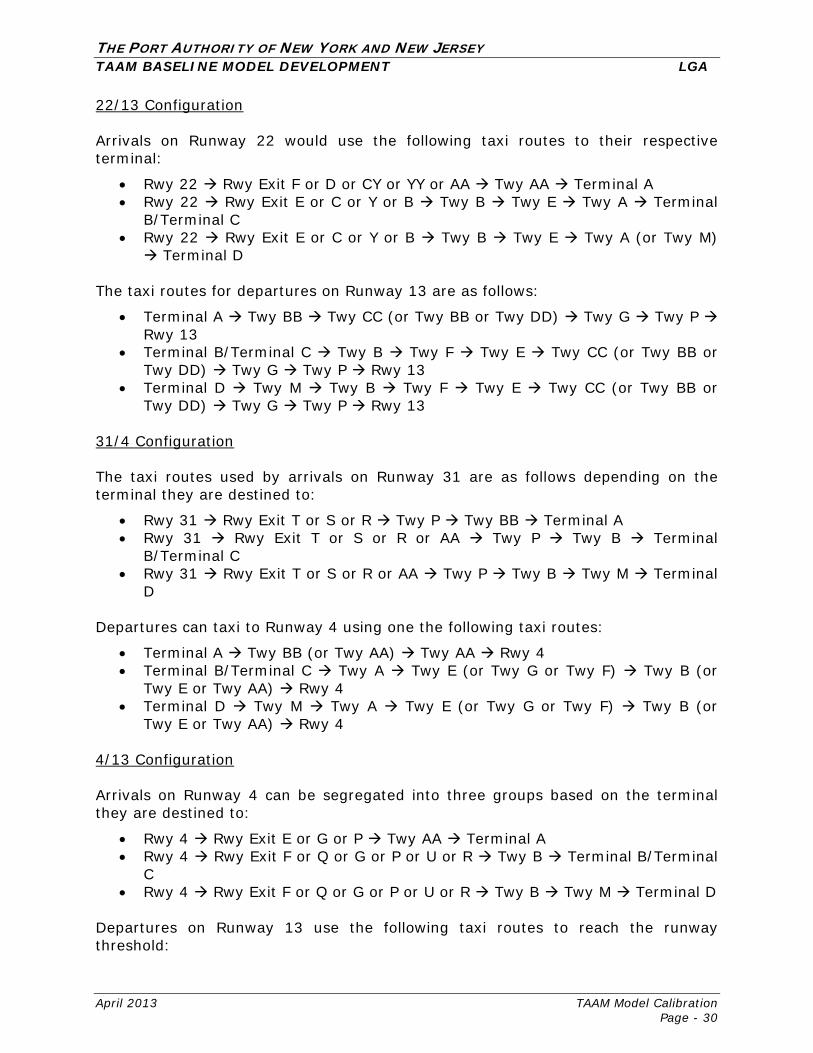
THE PORT AUTHORITY OF NEW YORK AND NEW JERSEY TAAM BASELINE MODEL DEVELOPMENT LGA
April 2013 TAAM Model Calibration Page - 30
22/13 Configuration
Arrivals on Runway 22 would use the following taxi routes to their respective terminal:
Rwy 22 Rwy Exit F or D or CY or YY or AA Twy AA Terminal A Rwy 22 Rwy Exit E or C or Y or B Twy B Twy E Twy A Terminal
B/Terminal C Rwy 22 Rwy Exit E or C or Y or B Twy B Twy E Twy A (or Twy M) Terminal D
The taxi routes for departures on Runway 13 are as follows:
Terminal A Twy BB Twy CC (or Twy BB or Twy DD) Twy G Twy P Rwy 13
Terminal B/Terminal C Twy B Twy F Twy E Twy CC (or Twy BB orTwy DD) Twy G Twy P Rwy 13
Terminal D Twy M Twy B Twy F Twy E Twy CC (or Twy BB orTwy DD) Twy G Twy P Rwy 13
31/4 Configuration
The taxi routes used by arrivals on Runway 31 are as follows depending on the terminal they are destined to:
Rwy 31 Rwy Exit T or S or R Twy P Twy BB Terminal A Rwy 31 Rwy Exit T or S or R or AA Twy P Twy B Terminal
B/Terminal C Rwy 31 Rwy Exit T or S or R or AA Twy P Twy B Twy M Terminal
D
Departures can taxi to Runway 4 using one the following taxi routes:
Terminal A Twy BB (or Twy AA) Twy AA Rwy 4 Terminal B/Terminal C Twy A Twy E (or Twy G or Twy F) Twy B (or
Twy E or Twy AA) Rwy 4 Terminal D Twy M Twy A Twy E (or Twy G or Twy F) Twy B (or
Twy E or Twy AA) Rwy 4
4/13 Configuration
Arrivals on Runway 4 can be segregated into three groups based on the terminal they are destined to:
Rwy 4 Rwy Exit E or G or P Twy AA Terminal A Rwy 4 Rwy Exit F or Q or G or P or U or R Twy B Terminal B/Terminal
C Rwy 4 Rwy Exit F or Q or G or P or U or R Twy B Twy M Terminal D
Departures on Runway 13 use the following taxi routes to reach the runway threshold:
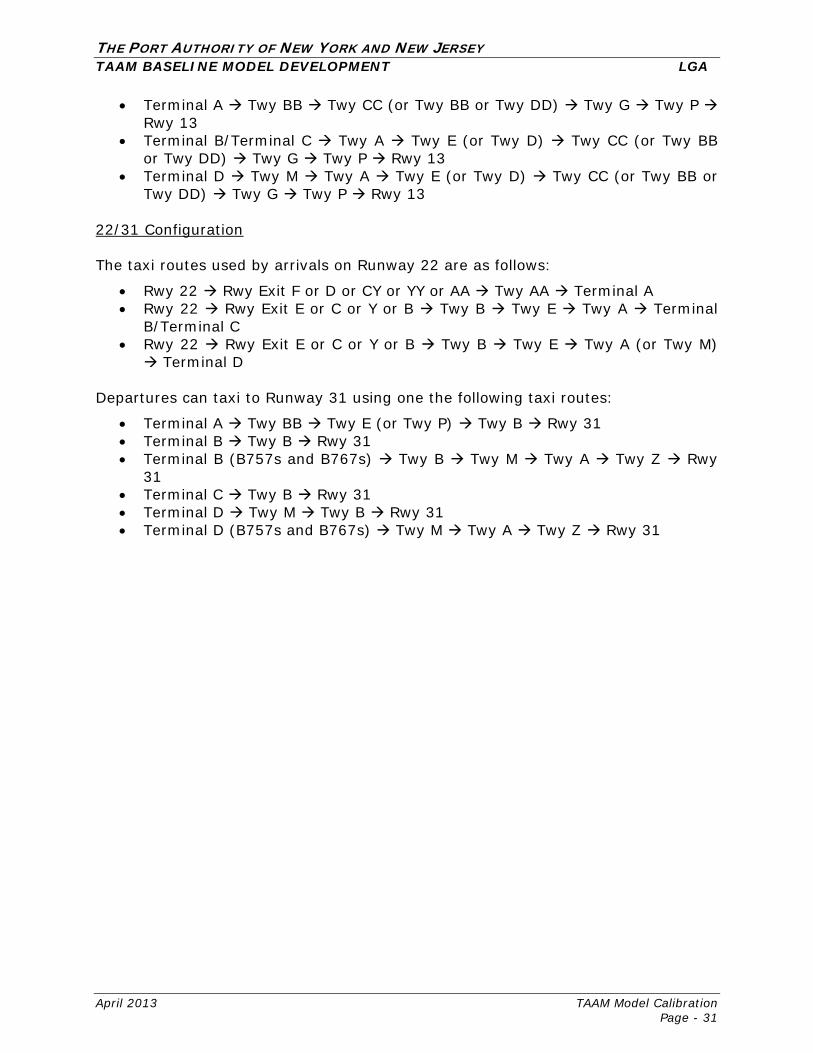
THE PORT AUTHORITY OF NEW YORK AND NEW JERSEY TAAM BASELINE MODEL DEVELOPMENT LGA
April 2013 TAAM Model Calibration Page - 31
Terminal A Twy BB Twy CC (or Twy BB or Twy DD) Twy G Twy P Rwy 13
Terminal B/Terminal C Twy A Twy E (or Twy D) Twy CC (or Twy BB or Twy DD) Twy G Twy P Rwy 13
Terminal D Twy M Twy A Twy E (or Twy D) Twy CC (or Twy BB or Twy DD) Twy G Twy P Rwy 13
22/31 Configuration The taxi routes used by arrivals on Runway 22 are as follows:
Rwy 22 Rwy Exit F or D or CY or YY or AA Twy AA Terminal A Rwy 22 Rwy Exit E or C or Y or B Twy B Twy E Twy A Terminal
B/Terminal C Rwy 22 Rwy Exit E or C or Y or B Twy B Twy E Twy A (or Twy M) Terminal D
Departures can taxi to Runway 31 using one the following taxi routes:
Terminal A Twy BB Twy E (or Twy P) Twy B Rwy 31 Terminal B Twy B Rwy 31 Terminal B (B757s and B767s) Twy B Twy M Twy A Twy Z Rwy
31 Terminal C Twy B Rwy 31 Terminal D Twy M Twy B Rwy 31 Terminal D (B757s and B767s) Twy M Twy A Twy Z Rwy 31
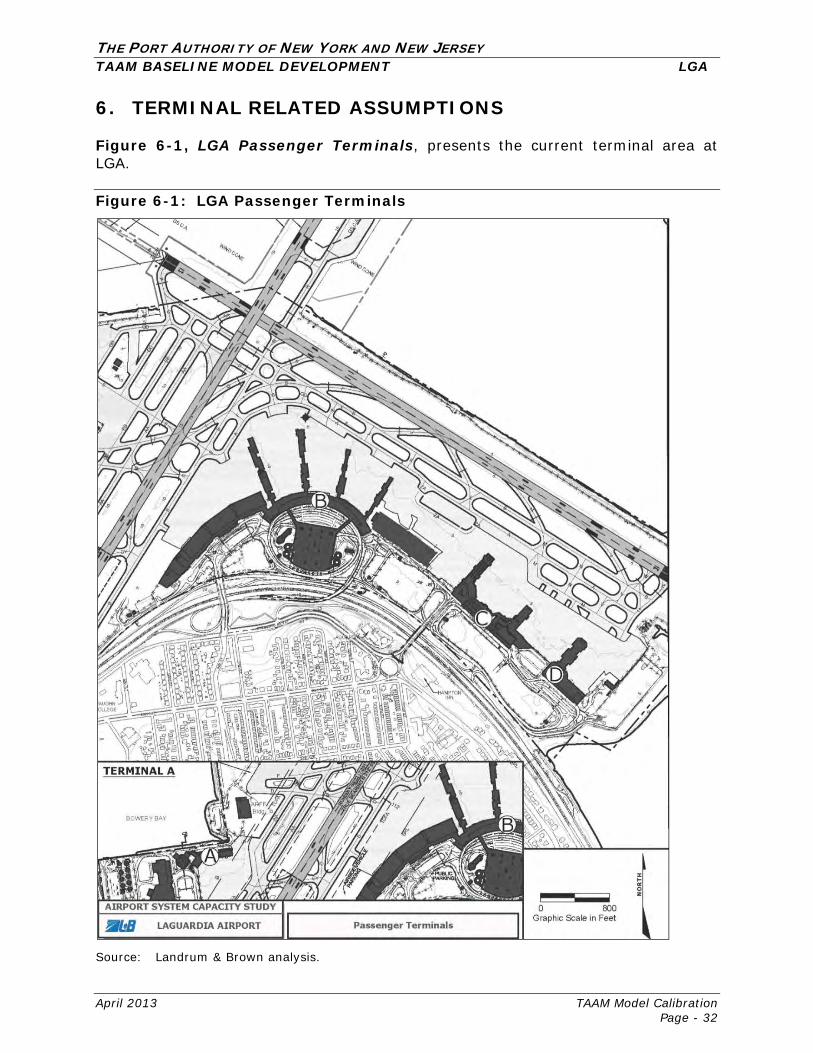
THE PORT AUTHORITY OF NEW YORK AND NEW JERSEY TAAM BASELINE MODEL DEVELOPMENT LGA
April 2013 TAAM Model Calibration Page - 32
6. TERMINAL RELATED ASSUMPTIONS Figure 6-1, LGA Passenger Terminals, presents the current terminal area at LGA. Figure 6-1: LGA Passenger Terminals
Source: Landrum & Brown analysis.
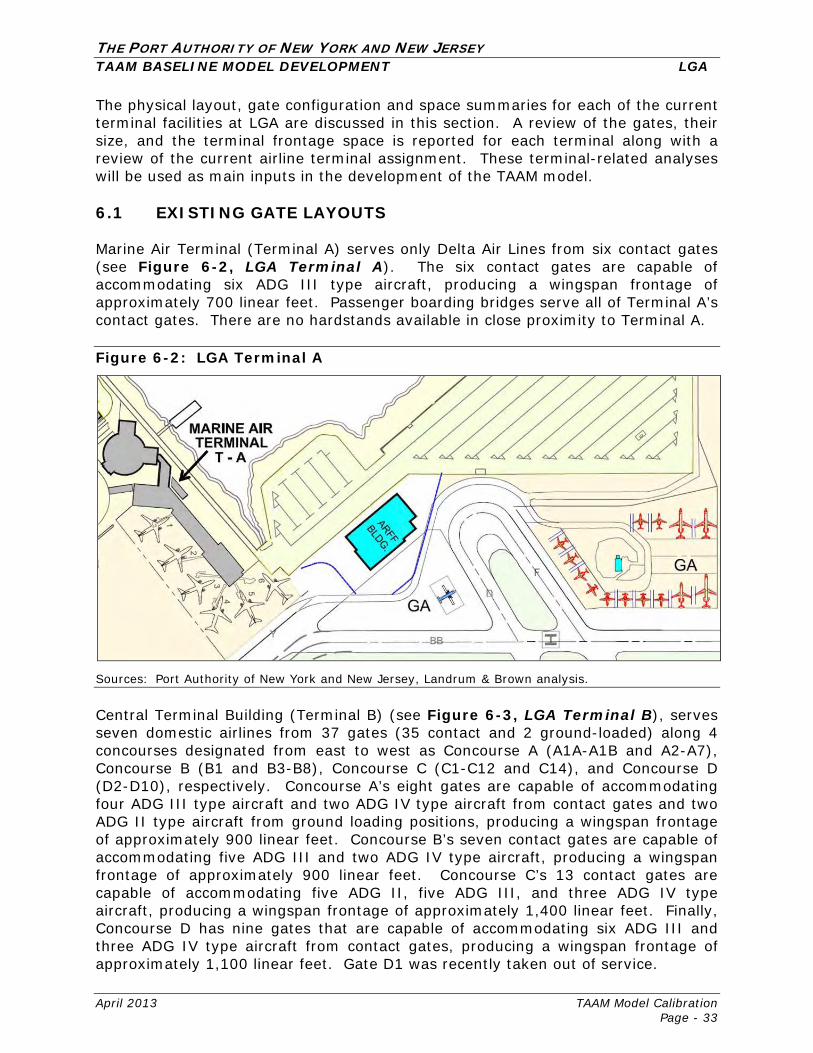
THE PORT AUTHORITY OF NEW YORK AND NEW JERSEY TAAM BASELINE MODEL DEVELOPMENT LGA
April 2013 TAAM Model Calibration Page - 33
The physical layout, gate configuration and space summaries for each of the current terminal facilities at LGA are discussed in this section. A review of the gates, their size, and the terminal frontage space is reported for each terminal along with a review of the current airline terminal assignment. These terminal-related analyses will be used as main inputs in the development of the TAAM model.
6.1 EXISTING GATE LAYOUTS
Marine Air Terminal (Terminal A) serves only Delta Air Lines from six contact gates (see Figure 6-2, LGA Terminal A). The six contact gates are capable of accommodating six ADG III type aircraft, producing a wingspan frontage of approximately 700 linear feet. Passenger boarding bridges serve all of Terminal A’s contact gates. There are no hardstands available in close proximity to Terminal A.
Figure 6-2: LGA Terminal A
Sources: Port Authority of New York and New Jersey, Landrum & Brown analysis.
Central Terminal Building (Terminal B) (see Figure 6-3, LGA Terminal B), serves seven domestic airlines from 37 gates (35 contact and 2 ground-loaded) along 4 concourses designated from east to west as Concourse A (A1A-A1B and A2-A7), Concourse B (B1 and B3-B8), Concourse C (C1-C12 and C14), and Concourse D (D2-D10), respectively. Concourse A’s eight gates are capable of accommodating four ADG III type aircraft and two ADG IV type aircraft from contact gates and two ADG II type aircraft from ground loading positions, producing a wingspan frontage of approximately 900 linear feet. Concourse B’s seven contact gates are capable of accommodating five ADG III and two ADG IV type aircraft, producing a wingspan frontage of approximately 900 linear feet. Concourse C’s 13 contact gates are capable of accommodating five ADG II, five ADG III, and three ADG IV type aircraft, producing a wingspan frontage of approximately 1,400 linear feet. Finally, Concourse D has nine gates that are capable of accommodating six ADG III and three ADG IV type aircraft from contact gates, producing a wingspan frontage of approximately 1,100 linear feet. Gate D1 was recently taken out of service.
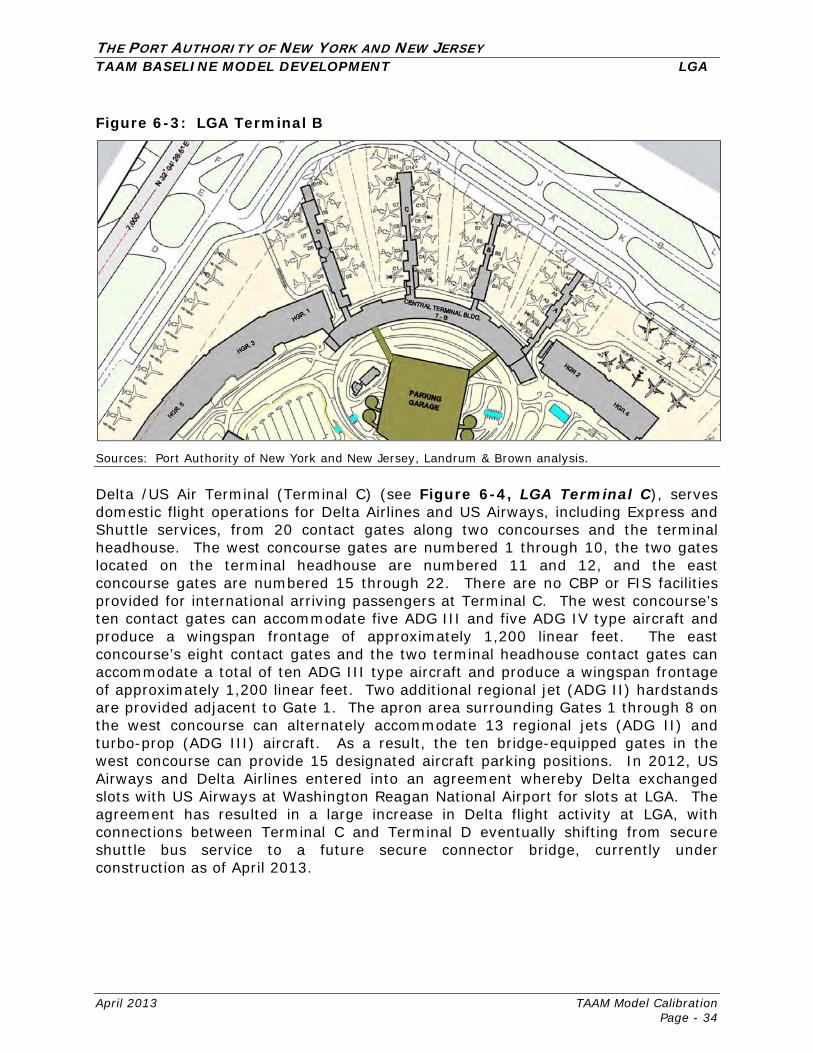
THE PORT AUTHORITY OF NEW YORK AND NEW JERSEY TAAM BASELINE MODEL DEVELOPMENT LGA
April 2013 TAAM Model Calibration Page - 34
Figure 6-3: LGA Terminal B
Sources: Port Authority of New York and New Jersey, Landrum & Brown analysis. Delta /US Air Terminal (Terminal C) (see Figure 6-4, LGA Terminal C), serves domestic flight operations for Delta Airlines and US Airways, including Express and Shuttle services, from 20 contact gates along two concourses and the terminal headhouse. The west concourse gates are numbered 1 through 10, the two gates located on the terminal headhouse are numbered 11 and 12, and the east concourse gates are numbered 15 through 22. There are no CBP or FIS facilities provided for international arriving passengers at Terminal C. The west concourse’s ten contact gates can accommodate five ADG III and five ADG IV type aircraft and produce a wingspan frontage of approximately 1,200 linear feet. The east concourse’s eight contact gates and the two terminal headhouse contact gates can accommodate a total of ten ADG III type aircraft and produce a wingspan frontage of approximately 1,200 linear feet. Two additional regional jet (ADG II) hardstands are provided adjacent to Gate 1. The apron area surrounding Gates 1 through 8 on the west concourse can alternately accommodate 13 regional jets (ADG II) and turbo-prop (ADG III) aircraft. As a result, the ten bridge-equipped gates in the west concourse can provide 15 designated aircraft parking positions. In 2012, US Airways and Delta Airlines entered into an agreement whereby Delta exchanged slots with US Airways at Washington Reagan National Airport for slots at LGA. The agreement has resulted in a large increase in Delta flight activity at LGA, with connections between Terminal C and Terminal D eventually shifting from secure shuttle bus service to a future secure connector bridge, currently under construction as of April 2013.
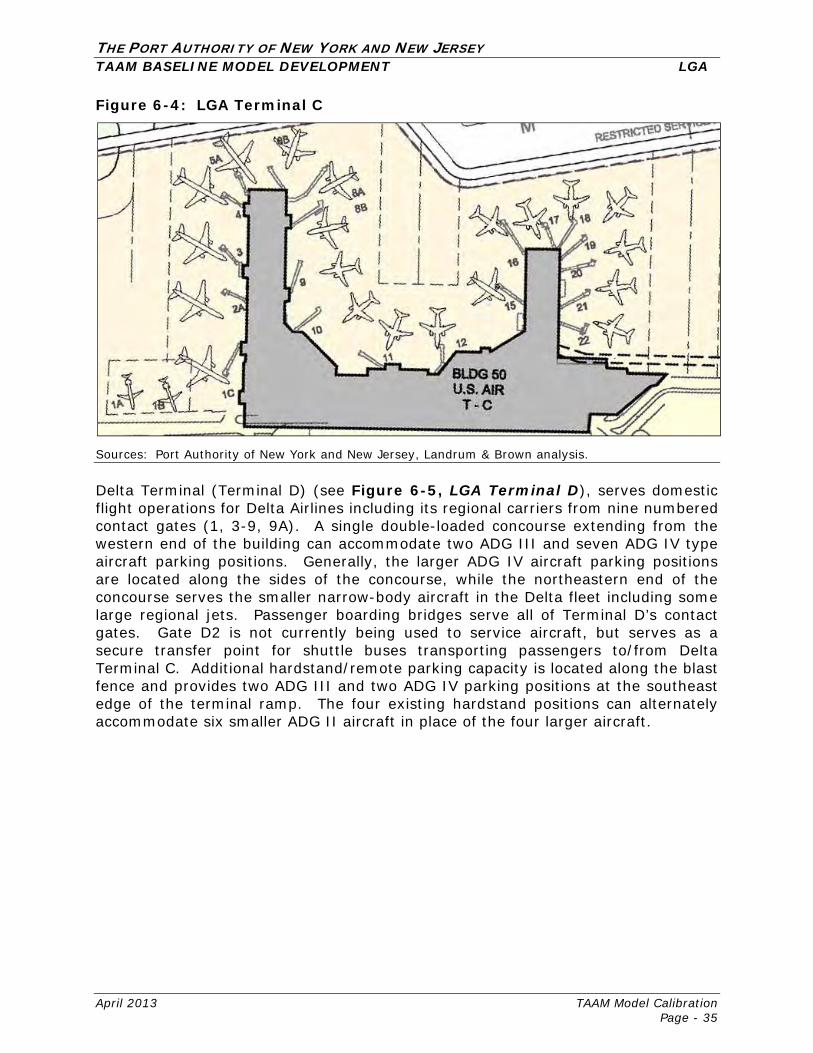
THE PORT AUTHORITY OF NEW YORK AND NEW JERSEY TAAM BASELINE MODEL DEVELOPMENT LGA
April 2013 TAAM Model Calibration Page - 35
Figure 6-4: LGA Terminal C
Sources: Port Authority of New York and New Jersey, Landrum & Brown analysis. Delta Terminal (Terminal D) (see Figure 6-5, LGA Terminal D), serves domestic flight operations for Delta Airlines including its regional carriers from nine numbered contact gates (1, 3-9, 9A). A single double-loaded concourse extending from the western end of the building can accommodate two ADG III and seven ADG IV type aircraft parking positions. Generally, the larger ADG IV aircraft parking positions are located along the sides of the concourse, while the northeastern end of the concourse serves the smaller narrow-body aircraft in the Delta fleet including some large regional jets. Passenger boarding bridges serve all of Terminal D’s contact gates. Gate D2 is not currently being used to service aircraft, but serves as a secure transfer point for shuttle buses transporting passengers to/from Delta Terminal C. Additional hardstand/remote parking capacity is located along the blast fence and provides two ADG III and two ADG IV parking positions at the southeast edge of the terminal ramp. The four existing hardstand positions can alternately accommodate six smaller ADG II aircraft in place of the four larger aircraft.
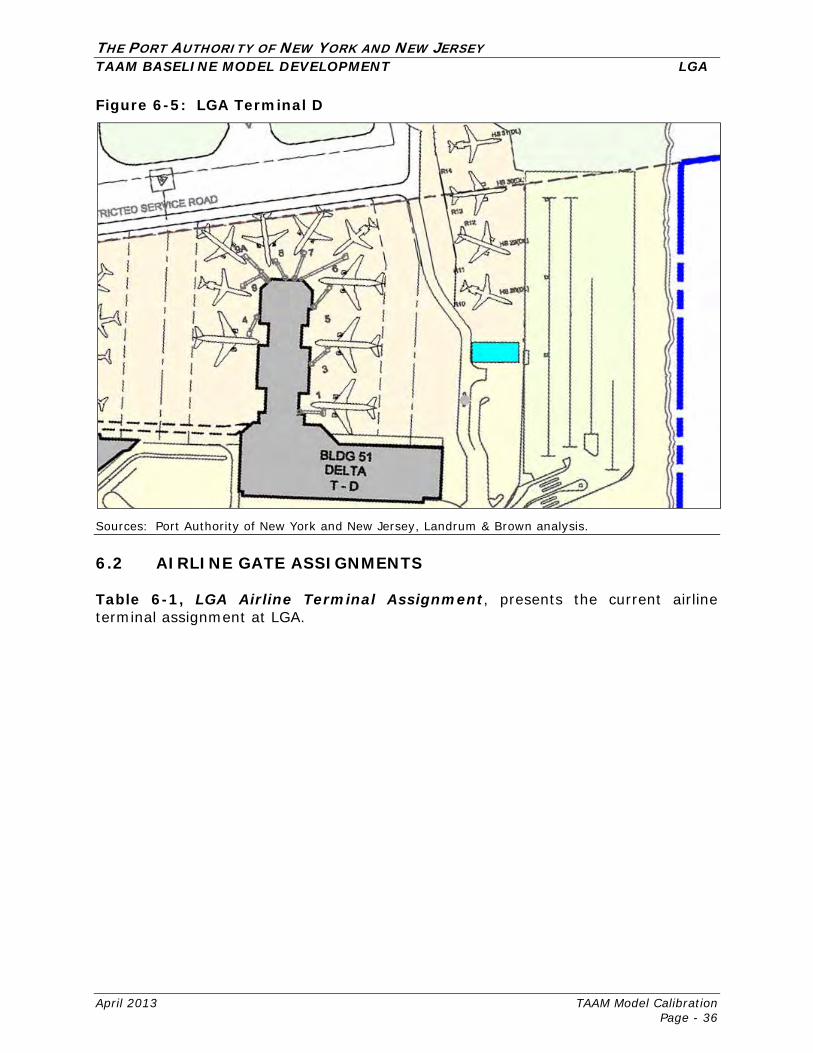
THE PORT AUTHORITY OF NEW YORK AND NEW JERSEY TAAM BASELINE MODEL DEVELOPMENT LGA
April 2013 TAAM Model Calibration Page - 36
Figure 6-5: LGA Terminal D
Sources: Port Authority of New York and New Jersey, Landrum & Brown analysis.
6.2 AIRLINE GATE ASSIGNMENTS
Table 6-1, LGA Airline Terminal Assignment, presents the current airline terminal assignment at LGA.
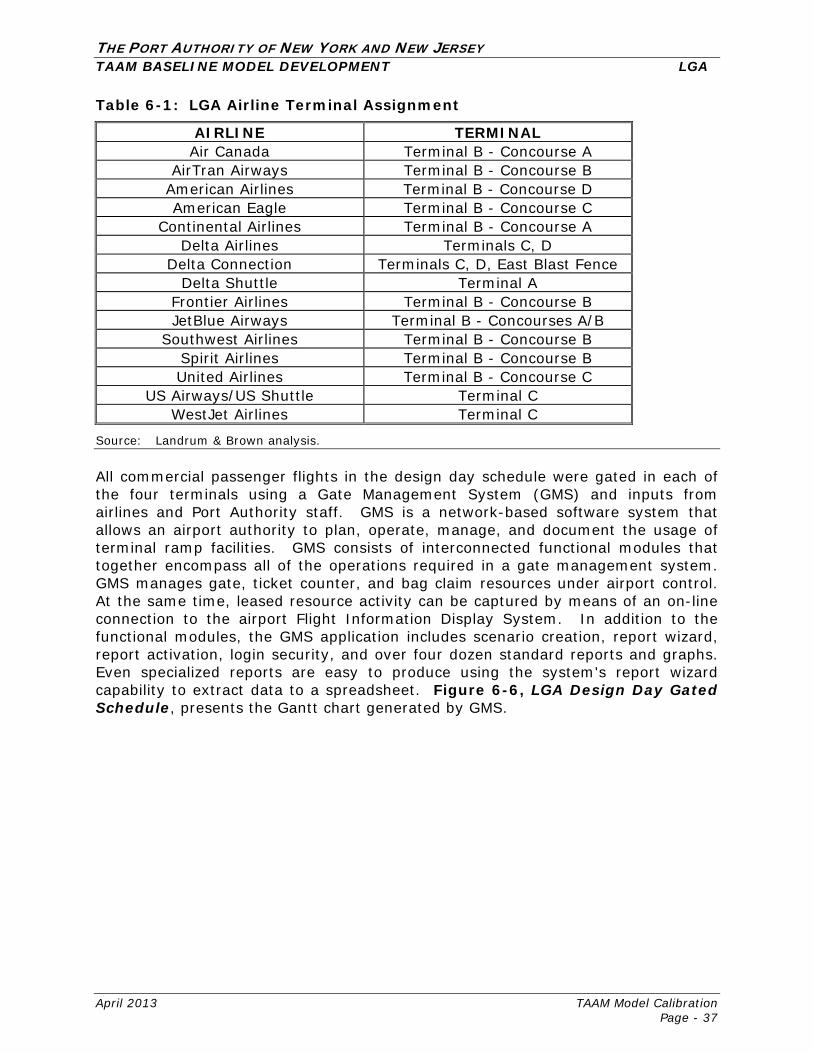
THE PORT AUTHORITY OF NEW YORK AND NEW JERSEY TAAM BASELINE MODEL DEVELOPMENT LGA
April 2013 TAAM Model Calibration Page - 37
Table 6-1: LGA Airline Terminal Assignment
AIRLINE TERMINAL Air Canada Terminal B - Concourse A
AirTran Airways Terminal B - Concourse B American Airlines Terminal B - Concourse D American Eagle Terminal B - Concourse C
Continental Airlines Terminal B - Concourse A Delta Airlines Terminals C, D
Delta Connection Terminals C, D, East Blast Fence Delta Shuttle Terminal A
Frontier Airlines Terminal B - Concourse B JetBlue Airways Terminal B - Concourses A/B
Southwest Airlines Terminal B - Concourse B Spirit Airlines Terminal B - Concourse B United Airlines Terminal B - Concourse C
US Airways/US Shuttle Terminal C WestJet Airlines Terminal C
Source: Landrum & Brown analysis. All commercial passenger flights in the design day schedule were gated in each of the four terminals using a Gate Management System (GMS) and inputs from airlines and Port Authority staff. GMS is a network-based software system that allows an airport authority to plan, operate, manage, and document the usage of terminal ramp facilities. GMS consists of interconnected functional modules that together encompass all of the operations required in a gate management system. GMS manages gate, ticket counter, and bag claim resources under airport control. At the same time, leased resource activity can be captured by means of an on-line connection to the airport Flight Information Display System. In addition to the functional modules, the GMS application includes scenario creation, report wizard, report activation, login security, and over four dozen standard reports and graphs. Even specialized reports are easy to produce using the system's report wizard capability to extract data to a spreadsheet. Figure 6-6, LGA Design Day Gated Schedule, presents the Gantt chart generated by GMS.
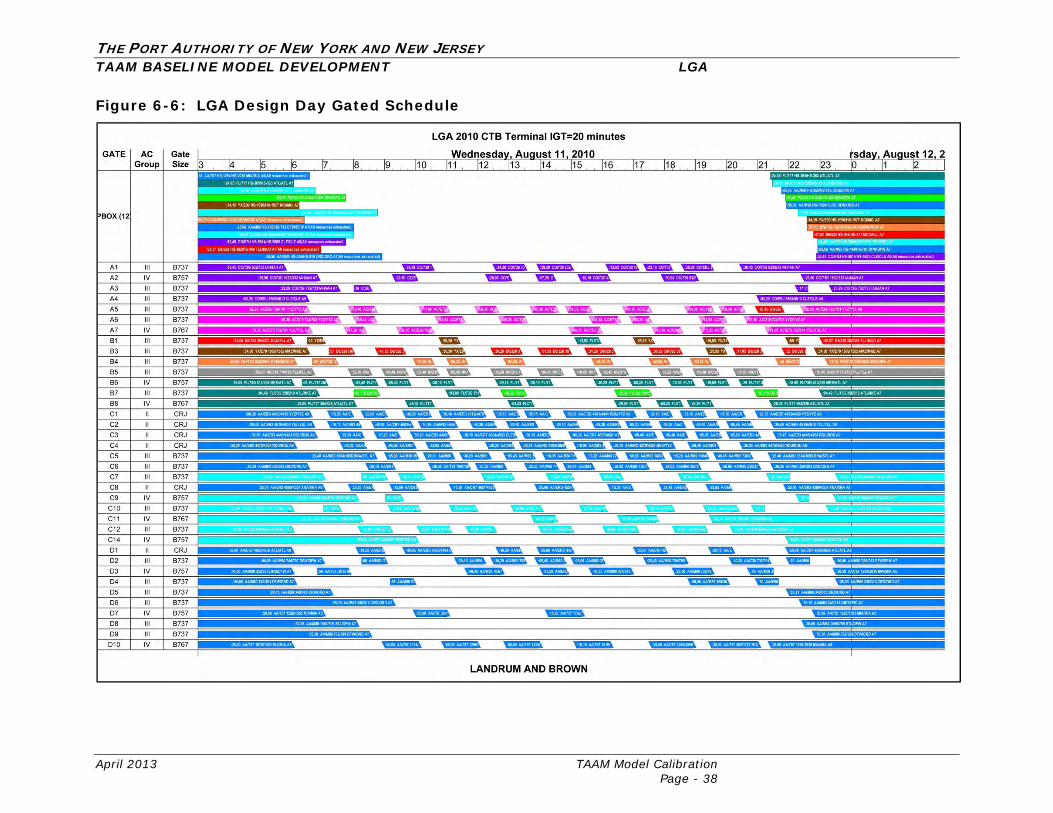
THE PORT AUTHORITY OF NEW YORK AND NEW JERSEY TAAM BASELINE MODEL DEVELOPMENT LGA
April 2013 TAAM Model Calibration Page - 38
Figure 6-6: LGA Design Day Gated Schedule
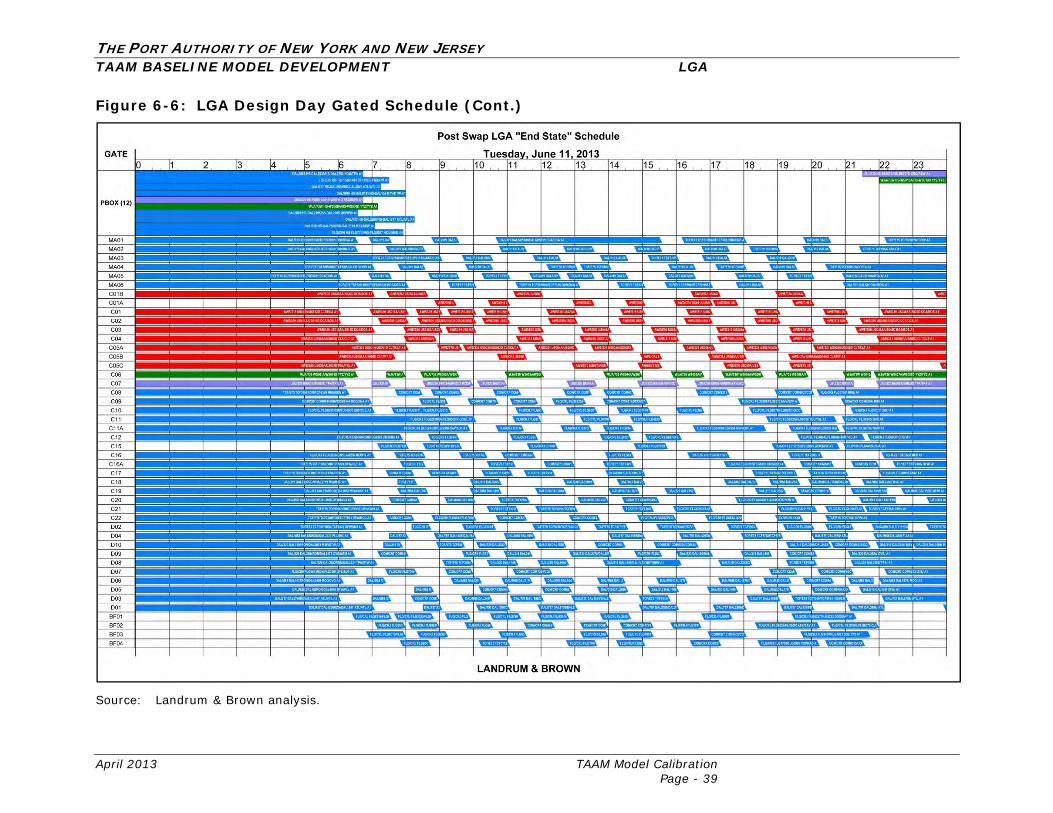
THE PORT AUTHORITY OF NEW YORK AND NEW JERSEY TAAM BASELINE MODEL DEVELOPMENT LGA
April 2013 TAAM Model Calibration Page - 39
Figure 6-6: LGA Design Day Gated Schedule (Cont.)
Source: Landrum & Brown analysis.

THE PORT AUTHORITY OF NEW YORK AND NEW JERSEY TAAM BASELINE MODEL DEVELOPMENT LGA
April 2013 TAAM Model Calibration Page - 40
6.3 OTHER TERMINAL-RELATED ASSUMPTIONS 6.3.1 Aircraft Pushback Operations An Aircraft pushback operation can be split into five different phases: (a) actual push-back; (b) pull-forward; (c) detach tug; (d) start engines and (e) get clearance to taxi. Aircraft pushback operations were timed for each phase of the operation for CTB and the Delta Terminal at LGA. Due to the configuration of the terminals at LGA, several factors influence the time required to complete an aircraft pushback operation. It can take anywhere between 7 and 15 minutes for a single operation. Some of the factors that have a direct impact on the pushback times are listed below:
Gate location: generally speaking, the closer the gate is to the passenger terminal, the longer it takes for the aircraft to pushback;
Aircraft size: larger aircraft require more time to complete the pushback operation;
Adjacent gates: the time required for a pushback operation depends on whether the adjacent gates are occupied or not and the size of the aircraft using the adjacent gates;
Time of day: pushback operations generally require more time during peak hours due to possible ramp congestion; and,
Pushback distance: the pushback time increases with the distance the aircraft needs to be pushed back and/or towed before the aircraft engines can be turned on.
6.3.2 Aircraft Engine Start Positions Due to proximity to the terminal building and very limited apron space, all aircraft departing from LGA are required to be pushed-back and/or towed to one of the engine-start (ES) positions marked on the airfield (see Figure 6-7, Engine Start Positions), before the engines can be turned on. Using the ES positions on active taxiways (A, M, etc.) can lead to taxiway congestion and airfield gridlock issues. As a result, the use of the ES positions on active taxiways is generally avoided. Several adjacent ES positions at LGA are inter-dependent. This further complicates pushback operations at LGA. All these pushback operations rules, restrictions and ES positions have been incorporated in the LGA baseline models.
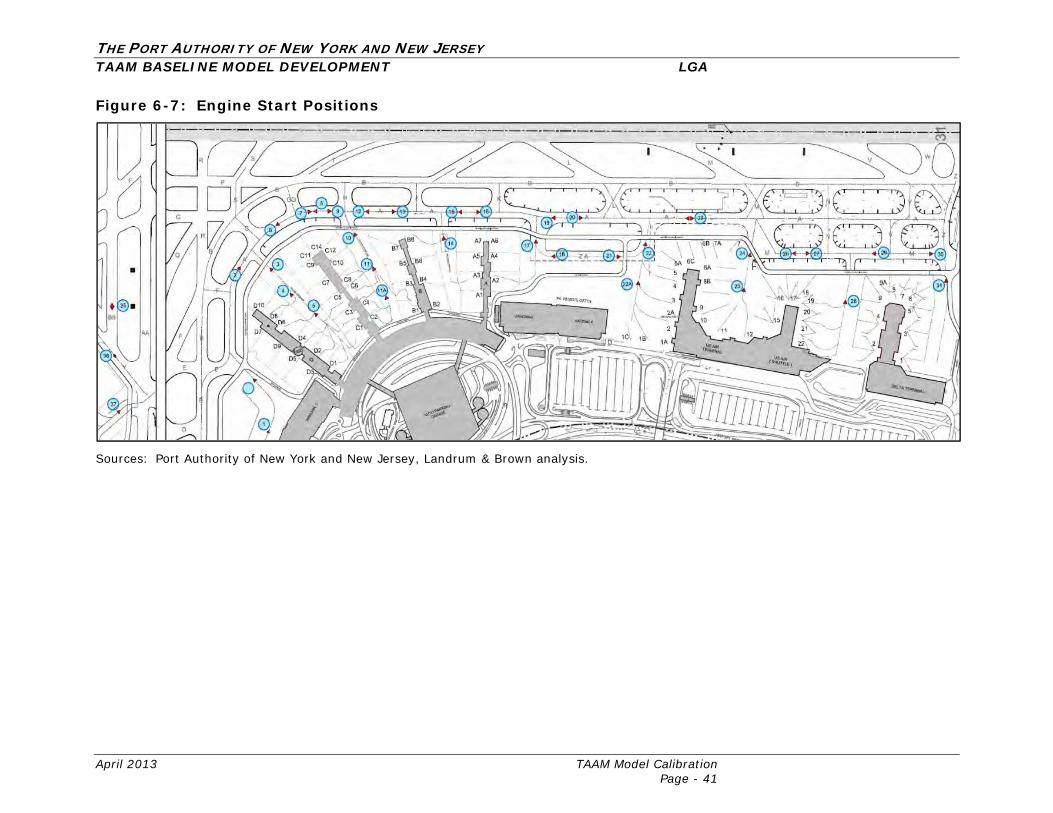
THE PORT AUTHORITY OF NEW YORK AND NEW JERSEY TAAM BASELINE MODEL DEVELOPMENT LGA
April 2013 TAAM Model Calibration Page - 41
Figure 6-7: Engine Start Positions
Sources: Port Authority of New York and New Jersey, Landrum & Brown analysis.
THE PORT AUTHORITY OF NEW YORK AND NEW JERSEY TAAM BASELINE MODEL DEVELOPMENT LGA
April 2013 TAAM Model Calibration Page - 42
7. TAAM MODEL CALIBRATION
7.1 PERFORMANCE METRICS DEFINITIONS
The key parameters used to measure the performance of an airport system are as follows:
Peak Hour Throughput: This is a measure of the practical capacity of anairport system during periods of constant demand. Throughput is reportedfor each 60-minute interval in a 24-hour period for a given operatingscenarios.
Unimpeded Departure Taxiing Time: This is the time required for adeparting aircraft to reach the departure runway after it begins to taxi fromits departure gate and taxies at the default taxiing speed without anyinterruption. This does not include the time required for aircraft pushbackand to detach the tug.
Unimpeded Arrival Taxiing Time: This is the time required for an arrivingaircraft to reach the arrival gate after it exits the arrival runway and taxies atthe default taxiing speed without any interruption.
Average Departure Queuing Delay: This is the average delay incurred bya departing aircraft due to excess time spent while waiting in the runwayline-up queue for its turn to take-off.
Average Arrival Sequencing Delay: This is the average delay incurred byan arriving aircraft because the aircraft had to hold or adjust its speed inorder to maintain safe separations from other arriving aircraft.
Average Taxiing Delay: This is the average delay incurred by an aircraftwhile taxiing. The delay reported in this metric is incurred due to aircrafttaxiing at lower-than-default speeds or stopping-and-starting on the taxiwaysdue to the presence of other aircraft in the vicinity.
Average Gate Delay: Average gate delay includes delays incurred due togates being unavailable and/or due to impediments that delay timelypushback from gates.
Average Overall Taxiing Time: Average overall taxiing time is thecombination of average unimpeded taxiing time and average taxiing delay.
Average Overall Delay: Average overall delay includes all delays incurredby an aircraft during each phase of flight. These delays include excess traveltimes associated with the presence of other aircraft in the simulations.Delays included in this metric were incurred because aircraft had to wait onthe gate or taxiway, had to hold, adjust their speed, or adjust the distancethey flew in order to maintain safe separations from other aircraft in thesimulation. These delays do not include pre-departure delay, airlinescheduling delay, en-route arrival delays incurred due to bad weather,inefficient gate allocation strategies, etc.
7.2 TAAM MODEL DEVELOPMENT AND CALIBRATION
This section provides a summary of the TAAM simulation results. It includes a discussion of the calibration of the model followed by a presentation of the results for the various runway operating configurations at LGA.
THE PORT AUTHORITY OF NEW YORK AND NEW JERSEY TAAM BASELINE MODEL DEVELOPMENT LGA
April 2013 TAAM Model Calibration Page - 43
7.2.1 Methodology
The TAAM model development and calibration process involved the following important steps:
Meetings with LGA Staff to collect relevant operations data on October 6,2010 and October 20, 2010. Attendees included Tom Bosco, WarrenKroeppel, Roy Caspe, Lisa Board, April Gasparri, Jack Martini, Terry Kiter,Doug Stearns, Michael Moran, Joe Soave, Kent Turner, Hui Xu, Bruce Hu andAni Kane.
Visit to the LGA Air Traffic Control Tower and discussions with LGA ATCT staffon 10/20/2010, 11/23/2010, and 2/8/2011. Attendees included Leon Prusak(ATCT), Bill Neuendorf (ATCT), Matt Lee (L&B), Hui Xu (PA) and Ani Kane(PA). The visits to the tower were supplemented by another visit onNovember 23, 2010 to collect additional data for the development of theTAAM model.
Visit to Delta Airlines’ Ramp Tower and discussions with Ramp Tower staff onNovember 23, 2010. Attendees included Hui Xu (PA) and Ani Kane (PA).
Visit to New York TRACON and discussions with NY TRACON staff onSeptember 2, 2010. Attendees included Ralph Tamburro (NY TRACON),Kiran Merchant (PA), Peter Bellini (PA), Hui Xu (PA) and Ani Kane (PA).
Meeting with LGA ATCT and LGA Staff to review updated LGA baselinemodels on March 12, 2012. Attendees included Ed McKenna (ATCT), BillNeuendorf (ATCT), Laura Stensland (ATCT), Andy Chiurazzi, Doug Stearns,Kiran Merchant, Michael Moran, Bruce Hu, Michael Gernant, Hui Xu and AniKane.
Detailed statistical analysis.
7.2.2 TAAM Calibration
An initial step in the simulation process is to develop inputs to the TAAM simulation models for each runway operating configuration. Simulation assumptions were based upon various data that were collected and analyzed in order to better understand the current operational procedures at LGA. The data collected were presented in detail in previous sections and include:
Historical weather conditions Airspace geometry and routings Aircraft speed at takeoff and final approach Aircraft wake turbulence separation rules Runway usage rules and procedures
o Aircraft to runway assignment ruleso Departure queue balancing techniqueso Arrival rate balancing techniqueso Runway crossing procedureso Runway coordination/dependencieso Landing and take-off roll (runway occupancy)o Runway exit utilization
THE PORT AUTHORITY OF NEW YORK AND NEW JERSEY TAAM BASELINE MODEL DEVELOPMENT LGA
April 2013 TAAM Model Calibration Page - 44
Aircraft taxi procedures including taxi routing, taxi speed limit, and aircraft safe taxi distance
Gate definitions and usage procedures o Aircraft stand dimensions and characteristics o Airline gate allocation plans o Aircraft push-back procedures o Time required between stand uses o Long-term parking positions o Aircraft holding bays
The Port Authority of New York and New Jersey, the airlines, and FAA ATCT were very cooperative in providing the data required for this analysis. Various Port Authority and FAA databases were used such as the Port Authority AirScene and eCater databases, FAA Aviation System Performance Metrics (ASPM), and FAA Air Traffic Activity Data System (ATADS). The air traffic demand used as input in computer simulation analyses normally consists of a schedule of arrivals and departures for a 24-hour period. These flight schedules represent activity for a “design day” (planning level) of a given annual level of aircraft operations. A daily profile of aircraft activity is a key input to the simulation models because performance can be directly affected by the characteristics of aircraft demand. For this analysis, the August 2012 design day schedule presented in Section 2 was used. All commercial passenger flights in the design day schedule were gated in each of the four terminals using GMS and inputs from airlines and Port Authority staff (see section 6.2). Arrivals and departures were assigned to an arrival or departure fix based on their origin/destination airport. Data from the Port Authority AirScene database was used to determine what fix is currently used for each airport served to/from LGA. The calibration process was conducted for the following runway flow configurations:
22/13 Configuration - All Climbs 22/13 Configuration - All Whitestone Climbs 31/4 Configuration 4/13 Configuration 22/31 Configuration
The existing airside runway flows LGA were first evaluated using queue models based on the data about runway operating flows and weather conditions presented previous sections. Queue models that relate throughput rates to aircraft runway delays were developed for each of the runway flow and weather condition scenarios identified. The queue models were calibrated against FAA ASPM data to ensure that they can produce throughput and delay values that reflect existing airport conditions. The calibration processes resulted in some minor differences between modeled and observed throughput rates and delays. Once calibrated, the queue models along with FAA ASPM data were used to calibrate the TAAM model for LGA. The detailed results of the calibration for the flows modeled at LGA are provided in Figure 7-1, LGA TAAM Calibration – 22/13 All Climbs, Figure 7-2, LGA TAAM Calibration – 22/13 All Whitestone Climbs, Figure 7-3, LGA TAAM
THE PORT AUTHORITY OF NEW YORK AND NEW JERSEY TAAM BASELINE MODEL DEVELOPMENT LGA
April 2013 TAAM Model Calibration Page - 45
Calibration – 31/4 Configuration, Figure 7-4, LGA TAAM Calibration – 4/13 Configuration, and Figure 7-5, LGA TAAM Calibration – 22/31 Configuration.

THE PORT AUTHORITY OF NEW YORK AND NEW JERSEY TAAM BASELINE MODEL DEVELOPMENT LGA
April 2013 TAAM Model Calibration Page - 46
Figure 7-1: LGA TAAM Calibration – 22/13 All Climbs
Source: Landrum & Brown analysis.
0
10
20
30
40
50
60
70
80
1 2 3 4 5 6 7 8 9 10 11 12 13 14 15 16 17 18 19 20 21 22 23 24
Air
craf
t Th
rou
ghpu
t (O
ps/
Hr)
Hour of Day
Arrival Throughput - 22 | 13 Flow (All Climbs)LaGuardia Airport
ASPM Arrival Throughput Queue Model Arrival Throughput TAAM Arrival Throughput
0
10
20
30
40
50
60
70
80
1 2 3 4 5 6 7 8 9 10 11 12 13 14 15 16 17 18 19 20 21 22 23 24
Air
craf
t Th
rou
ghp
ut
(Op
s /
Hr)
Hour of Day
Departure Throughput - 22 | 13 Flow (All Climbs)LaGuardia Airport
ASPM Departure Throughput Queue Model Departure Throughput TAAM Departure Throughput
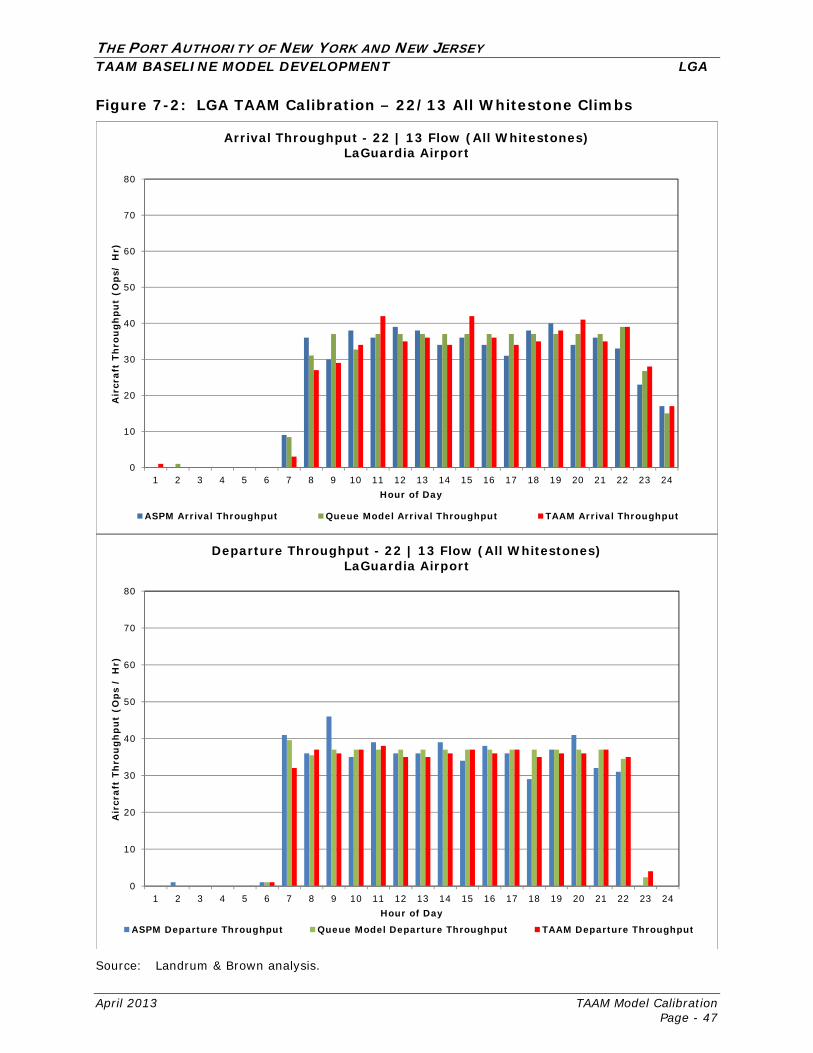
THE PORT AUTHORITY OF NEW YORK AND NEW JERSEY TAAM BASELINE MODEL DEVELOPMENT LGA
April 2013 TAAM Model Calibration Page - 47
Figure 7-2: LGA TAAM Calibration – 22/13 All Whitestone Climbs
Source: Landrum & Brown analysis.
0
10
20
30
40
50
60
70
80
1 2 3 4 5 6 7 8 9 10 11 12 13 14 15 16 17 18 19 20 21 22 23 24
Air
craf
t Th
rou
ghpu
t (O
ps/
Hr)
Hour of Day
Arrival Throughput - 22 | 13 Flow (All Whitestones)LaGuardia Airport
ASPM Arrival Throughput Queue Model Arrival Throughput TAAM Arrival Throughput
0
10
20
30
40
50
60
70
80
1 2 3 4 5 6 7 8 9 10 11 12 13 14 15 16 17 18 19 20 21 22 23 24
Air
craf
t Th
rou
ghp
ut
(Op
s /
Hr)
Hour of Day
Departure Throughput - 22 | 13 Flow (All Whitestones)LaGuardia Airport
ASPM Departure Throughput Queue Model Departure Throughput TAAM Departure Throughput

THE PORT AUTHORITY OF NEW YORK AND NEW JERSEY TAAM BASELINE MODEL DEVELOPMENT LGA
April 2013 TAAM Model Calibration Page - 48
Figure 7-3: LGA TAAM Calibration – 31/4 Configuration
Source: Landrum & Brown analysis.
0
10
20
30
40
50
60
70
80
1 2 3 4 5 6 7 8 9 10 11 12 13 14 15 16 17 18 19 20 21 22 23 24
Air
craf
t Th
rou
ghpu
t (O
ps/
Hr)
Hour of Day
Arrival Throughput - 31 | 04 FlowLaGuardia Airport
ASPM Arrival Throughput Queue Model Arrival Throughput TAAM Arrival Throughput
0
10
20
30
40
50
60
70
80
1 2 3 4 5 6 7 8 9 10 11 12 13 14 15 16 17 18 19 20 21 22 23 24
Air
craf
t Th
rou
ghp
ut
(Op
s /
Hr)
Hour of Day
Departure Throughput - 31 | 04 FlowLaGuardia Airport
ASPM Departure Throughput Queue Model Departure Throughput TAAM Departure Throughput

THE PORT AUTHORITY OF NEW YORK AND NEW JERSEY TAAM BASELINE MODEL DEVELOPMENT LGA
April 2013 TAAM Model Calibration Page - 49
Figure 7-4: LGA TAAM Calibration – 4/13 Configuration
Source: Landrum & Brown analysis
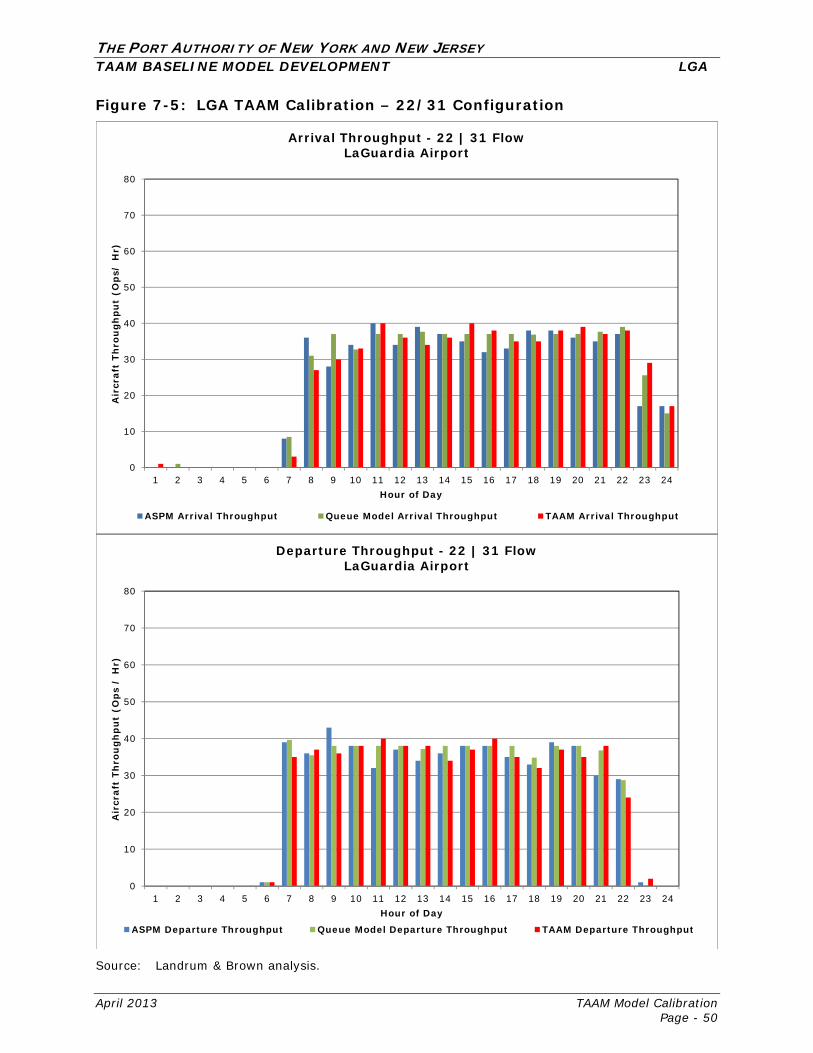
THE PORT AUTHORITY OF NEW YORK AND NEW JERSEY TAAM BASELINE MODEL DEVELOPMENT LGA
April 2013 TAAM Model Calibration Page - 50
Figure 7-5: LGA TAAM Calibration – 22/31 Configuration
Source: Landrum & Brown analysis.
0
10
20
30
40
50
60
70
80
1 2 3 4 5 6 7 8 9 10 11 12 13 14 15 16 17 18 19 20 21 22 23 24
Air
craf
t Th
rou
ghpu
t (O
ps/
Hr)
Hour of Day
Arrival Throughput - 22 | 31 FlowLaGuardia Airport
ASPM Arrival Throughput Queue Model Arrival Throughput TAAM Arrival Throughput
0
10
20
30
40
50
60
70
80
1 2 3 4 5 6 7 8 9 10 11 12 13 14 15 16 17 18 19 20 21 22 23 24
Air
craf
t Th
rou
ghp
ut
(Op
s /
Hr)
Hour of Day
Departure Throughput - 22 | 31 FlowLaGuardia Airport
ASPM Departure Throughput Queue Model Departure Throughput TAAM Departure Throughput
Attachment 3
LGA CTB Phasing Plan 2016‐2022
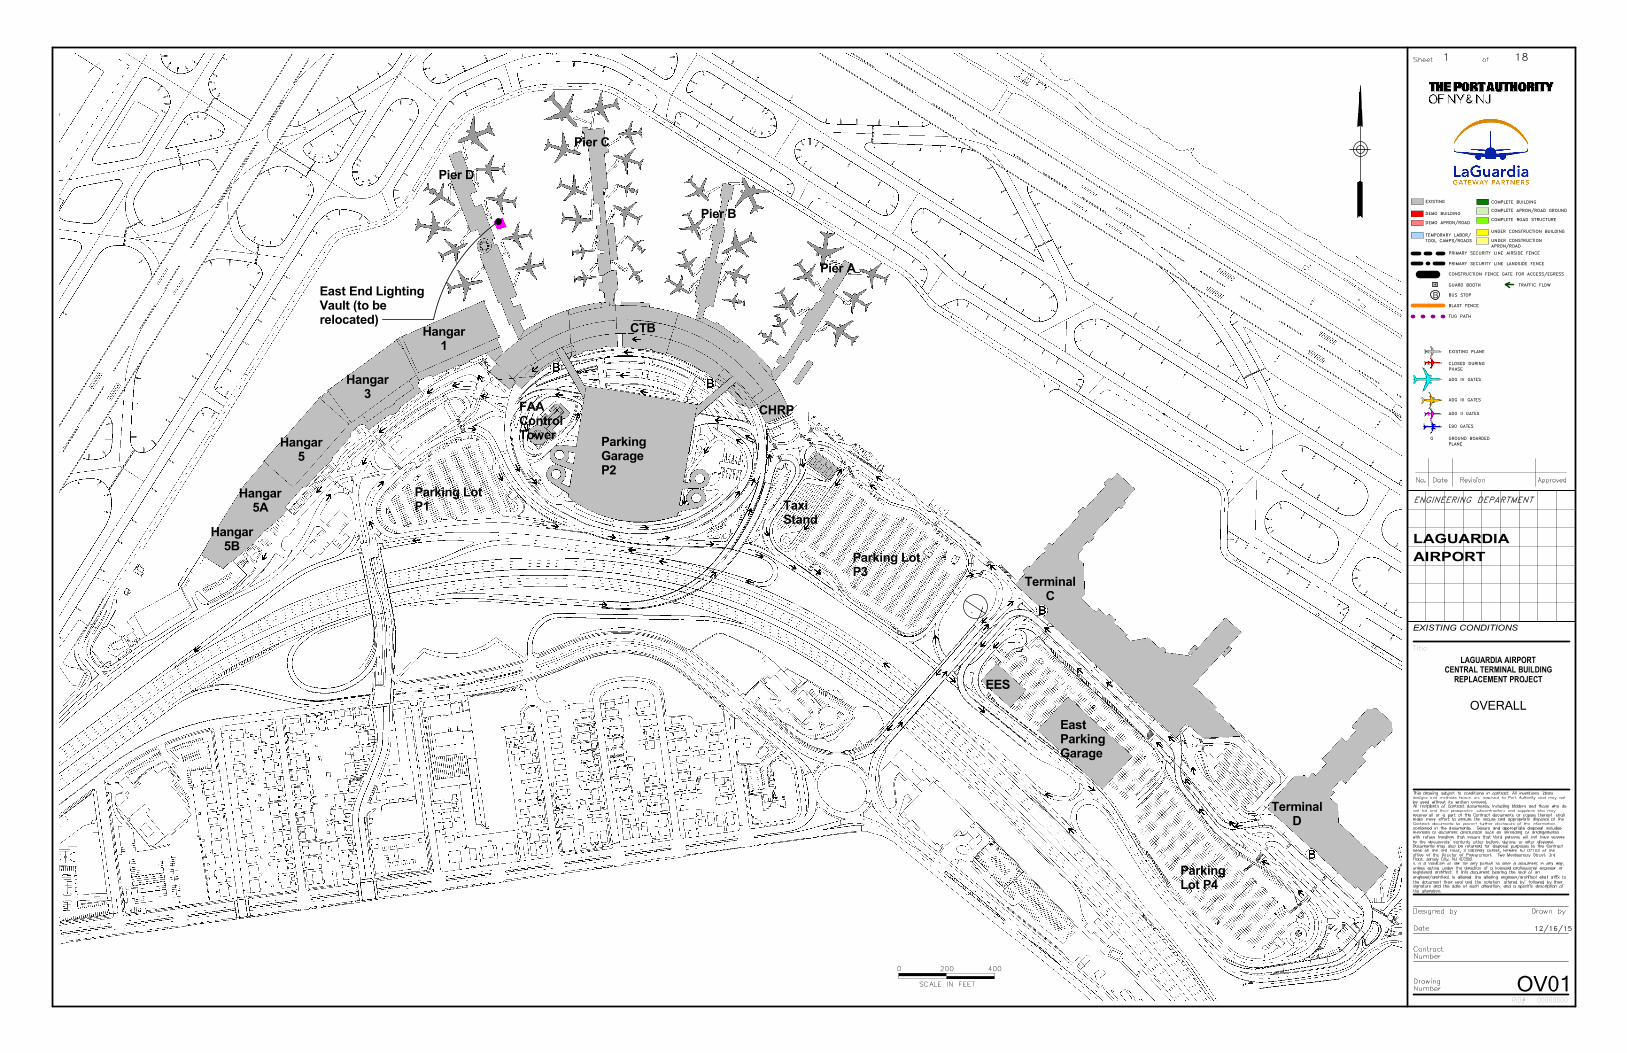
-
East End LightingVault (to berelocated)
TerminalC
Hangar1
Hangar3
Hangar5
ParkingGarageP2
CTB
Pier A
Pier B
Pier C
Pier D
Parking LotP3
TaxiStand
EES
EastParkingGarage
Hangar5A
Hangar5B
Parking LotP1
TerminalD
ParkingLot P4
FAAControlTower
CHRP
DEMO BUILDING
TEMPORARY LABOR/TOOL CAMPS/ROADS
EXISTING
PRIMARY SECURITY LINE AIRSIDE FENCE
BUS STOPB
CONSTRUCTION FENCE GATE FOR ACCESS/EGRESS
ADG IV GATES
E90 GATES
ADG II GATES
ADG III GATES
PRIMARY SECURITY LINE LANDSIDE FENCE
GUARD BOOTH
ENGINEERING DEPARTMENT
PID# 00000000
LAGUARDIA
LAGUARDIA AIRPORTCENTRAL TERMINAL BUILDING
REPLACEMENT PROJECT
Title
TUG PATH
COMPLETE BUILDING
UNDER CONSTRUCTION BUILDING
COMPLETE APRON/ROAD GROUND
CLOSED DURINGPHASE
EXISTING PLANE
GROUND BOARDEDPLANE
G
COMPLETE ROAD STRUCTUREDEMO APRON/ROAD
UNDER CONSTRUCTIONAPRON/ROAD
SCALE IN FEET
0 200 400
BLAST FENCE
TRAFFIC FLOW
AIRPORT
12/16/15
OV01
OVERALL
1 18
EXISTING CONDITIONS
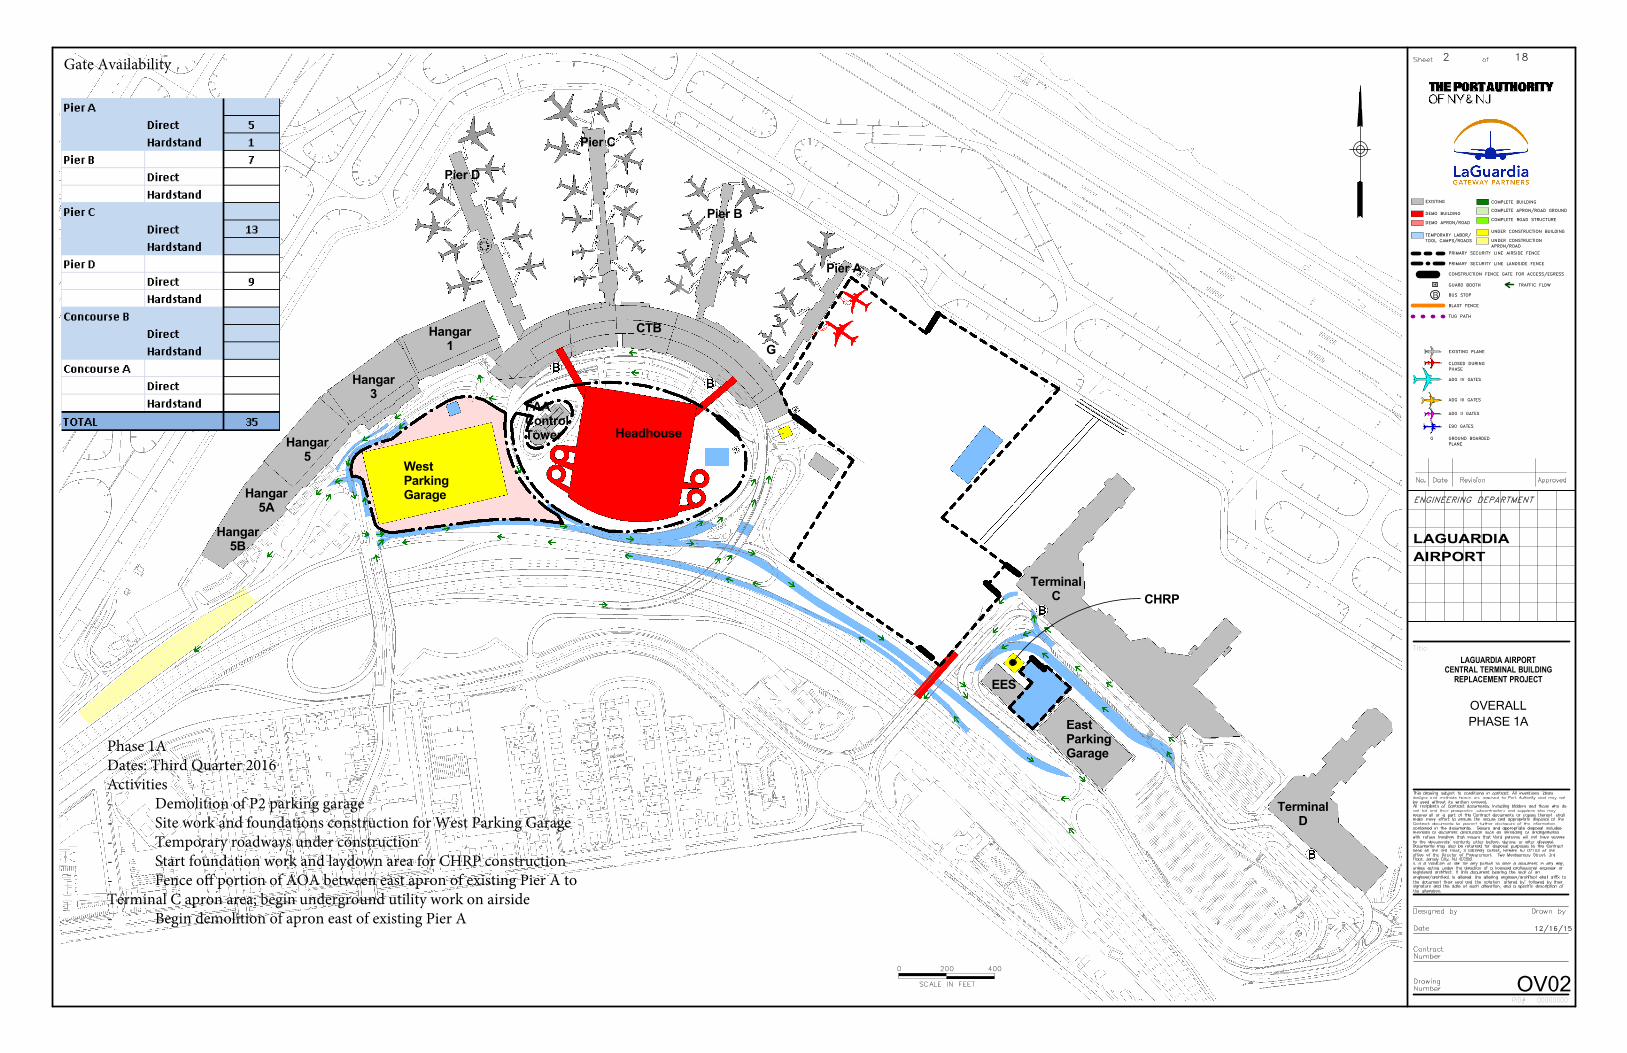
G
CHRP
Headhouse
WestParkingGarage
TerminalC
Hangar1
Hangar3
Hangar5
EES
EastParkingGarage
Hangar5A
Hangar5B
TerminalD
FAAControlTower
CTB
Pier A
Pier B
Pier C
Pier D
DEMO BUILDING
TEMPORARY LABOR/TOOL CAMPS/ROADS
EXISTING
PRIMARY SECURITY LINE AIRSIDE FENCE
BUS STOPB
CONSTRUCTION FENCE GATE FOR ACCESS/EGRESS
ADG IV GATES
E90 GATES
ADG II GATES
ADG III GATES
PRIMARY SECURITY LINE LANDSIDE FENCE
GUARD BOOTH
ENGINEERING DEPARTMENT
PID# 00000000
LAGUARDIA
LAGUARDIA AIRPORTCENTRAL TERMINAL BUILDING
REPLACEMENT PROJECT
Title
TUG PATH
COMPLETE BUILDING
UNDER CONSTRUCTION BUILDING
COMPLETE APRON/ROAD GROUND
CLOSED DURINGPHASE
EXISTING PLANE
GROUND BOARDEDPLANE
G
COMPLETE ROAD STRUCTUREDEMO APRON/ROAD
UNDER CONSTRUCTIONAPRON/ROAD
SCALE IN FEET
0 200 400
BLAST FENCE
TRAFFIC FLOW
AIRPORT
12/16/15
OV02
PHASE 1A
OVERALL
2 18Gate Availability
Phase 1ADates: Third Quarter 2016Activities- Demolition of P2 parking garage- Site work and foundations construction for West Parking Garage- Temporary roadways under construction- Start foundation work and laydown area for CHRP construction- Fence off portion of AOA between east apron of existing Pier A to Terminal C apron area; begin underground utility work on airside- Begin demolition of apron east of existing Pier A
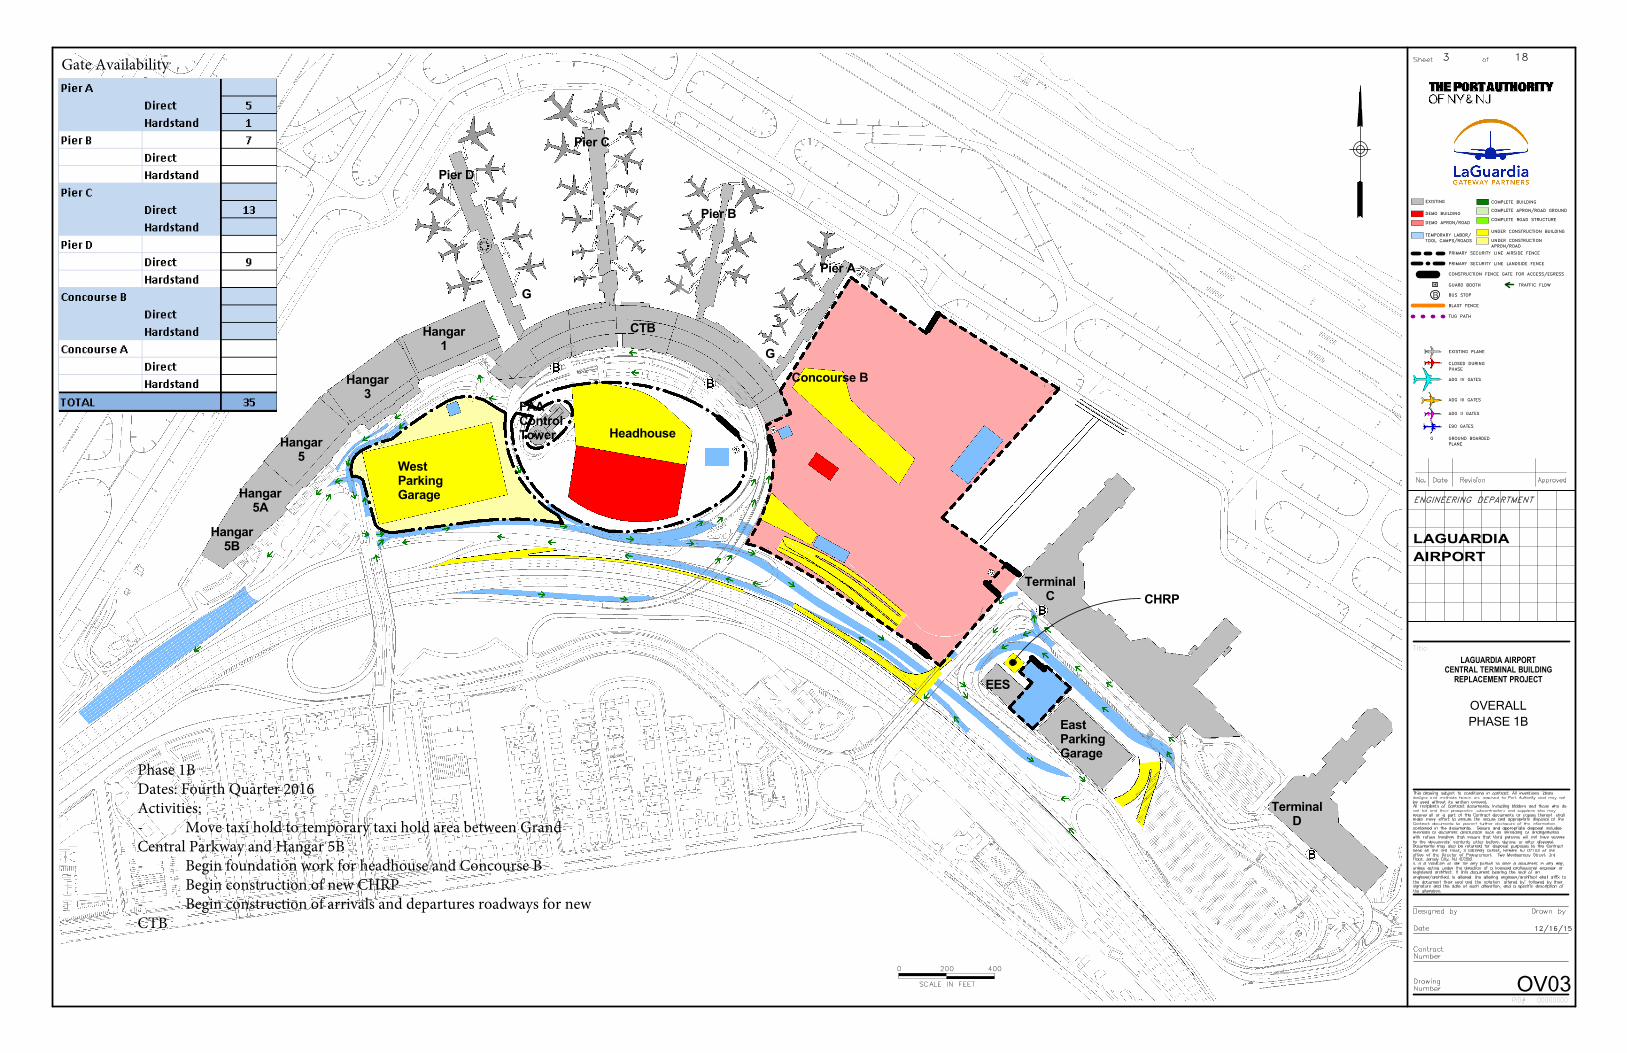
G
CHRP
G
Concourse B
Headhouse
WestParkingGarage
TerminalC
Hangar1
Hangar3
Hangar5
EES
EastParkingGarage
Hangar5A
Hangar5B
TerminalD
FAAControlTower
CTB
Pier A
Pier B
Pier C
Pier D
DEMO BUILDING
TEMPORARY LABOR/TOOL CAMPS/ROADS
EXISTING
PRIMARY SECURITY LINE AIRSIDE FENCE
BUS STOPB
CONSTRUCTION FENCE GATE FOR ACCESS/EGRESS
ADG IV GATES
E90 GATES
ADG II GATES
ADG III GATES
PRIMARY SECURITY LINE LANDSIDE FENCE
GUARD BOOTH
ENGINEERING DEPARTMENT
PID# 00000000
LAGUARDIA
LAGUARDIA AIRPORTCENTRAL TERMINAL BUILDING
REPLACEMENT PROJECT
Title
TUG PATH
COMPLETE BUILDING
UNDER CONSTRUCTION BUILDING
COMPLETE APRON/ROAD GROUND
CLOSED DURINGPHASE
EXISTING PLANE
GROUND BOARDEDPLANE
G
COMPLETE ROAD STRUCTUREDEMO APRON/ROAD
UNDER CONSTRUCTIONAPRON/ROAD
SCALE IN FEET
0 200 400
BLAST FENCE
TRAFFIC FLOW
AIRPORT
12/16/15
OV03
PHASE 1B
OVERALL
3 18Gate Availability
Phase 1BDates: Fourth Quarter 2016Activities:- Move taxi hold to temporary taxi hold area between Grand Central Parkway and Hangar 5B- Begin foundation work for headhouse and Concourse B- Begin construction of new CHRP- Begin construction of arrivals and departures roadways for new CTB
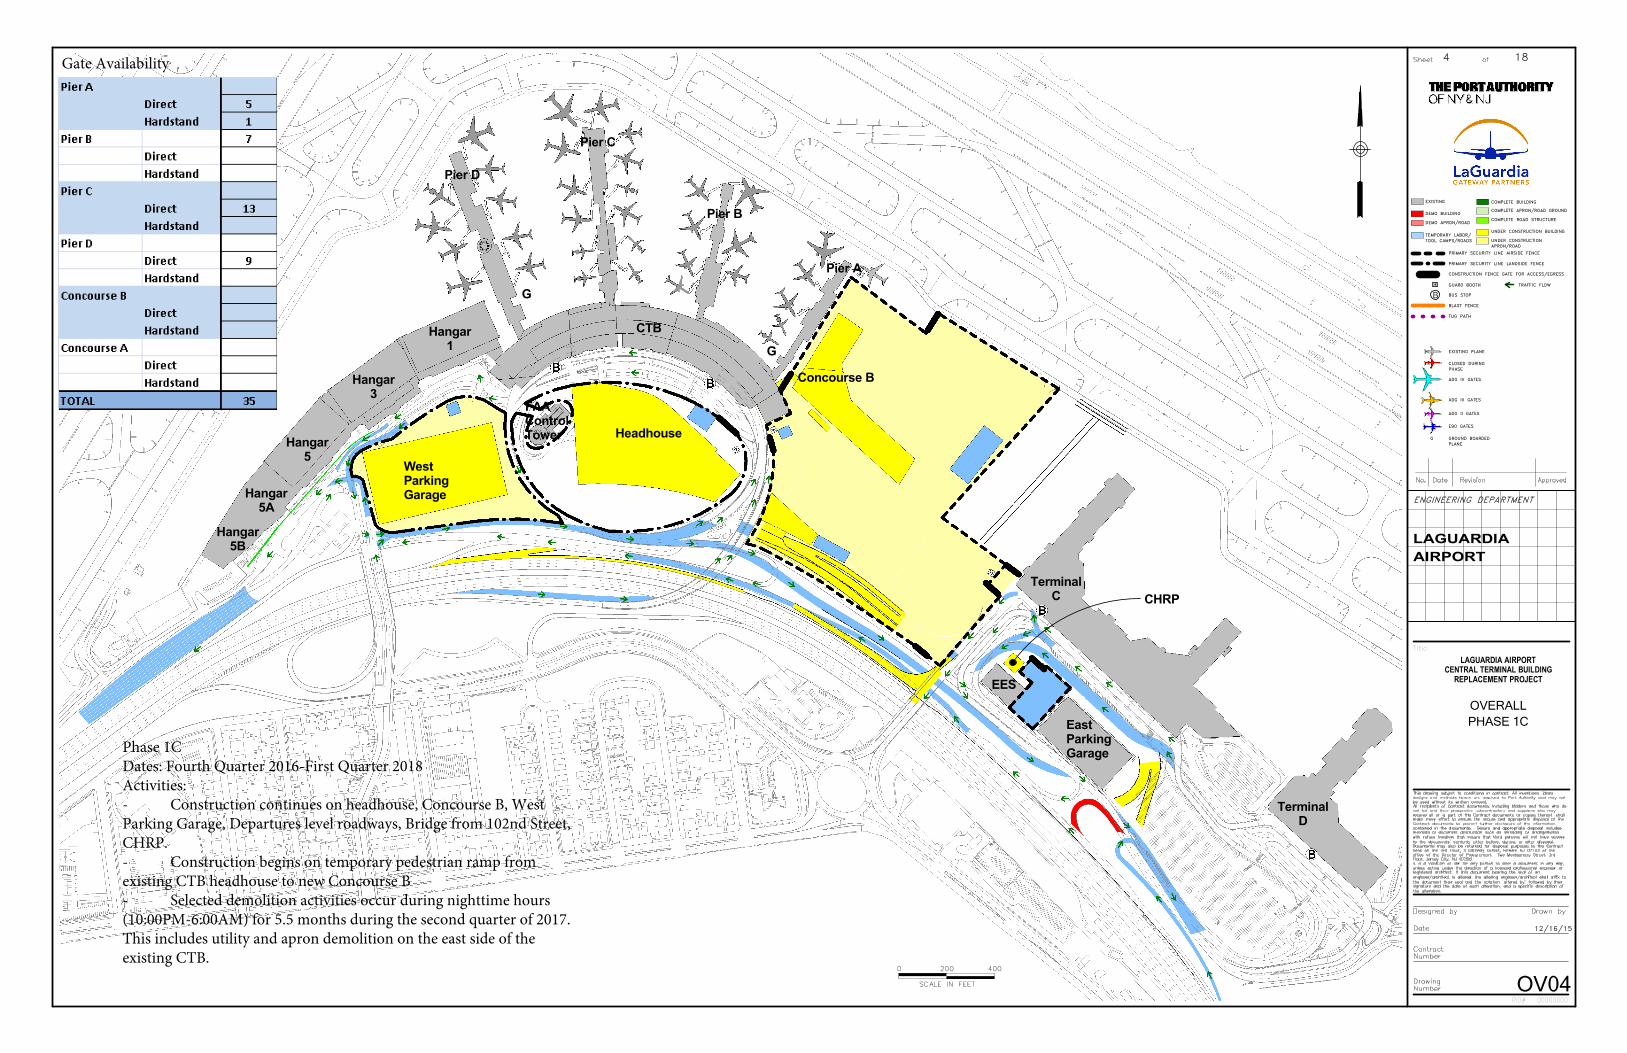
G
CHRP
G
Concourse B
Headhouse
WestParkingGarage
TerminalC
Hangar1
Hangar3
Hangar5
EES
EastParkingGarage
Hangar5A
Hangar5B
TerminalD
FAAControlTower
CTB
Pier A
Pier B
Pier C
Pier D
DEMO BUILDING
TEMPORARY LABOR/TOOL CAMPS/ROADS
EXISTING
PRIMARY SECURITY LINE AIRSIDE FENCE
BUS STOPB
CONSTRUCTION FENCE GATE FOR ACCESS/EGRESS
ADG IV GATES
E90 GATES
ADG II GATES
ADG III GATES
PRIMARY SECURITY LINE LANDSIDE FENCE
GUARD BOOTH
ENGINEERING DEPARTMENT
PID# 00000000
LAGUARDIA
LAGUARDIA AIRPORTCENTRAL TERMINAL BUILDING
REPLACEMENT PROJECT
Title
TUG PATH
COMPLETE BUILDING
UNDER CONSTRUCTION BUILDING
COMPLETE APRON/ROAD GROUND
CLOSED DURINGPHASE
EXISTING PLANE
GROUND BOARDEDPLANE
G
COMPLETE ROAD STRUCTUREDEMO APRON/ROAD
UNDER CONSTRUCTIONAPRON/ROAD
SCALE IN FEET
0 200 400
BLAST FENCE
TRAFFIC FLOW
AIRPORT
12/16/15
OV04
PHASE 1C
OVERALL
4 18Gate Availability
Phase 1CDates: Fourth Quarter 2016-First Quarter 2018Activities:- Construction continues on headhouse, Concourse B, West Parking Garage, Departures level roadways, Bridge from 102nd Street, CHRP.- Construction begins on temporary pedestrian ramp from existing CTB headhouse to new Concourse B- Selected demolition activities occur during nighttime hours (10:00PM-6:00AM) for 5.5 months during the second quarter of 2017. This includes utility and apron demolition on the east side of the existing CTB.
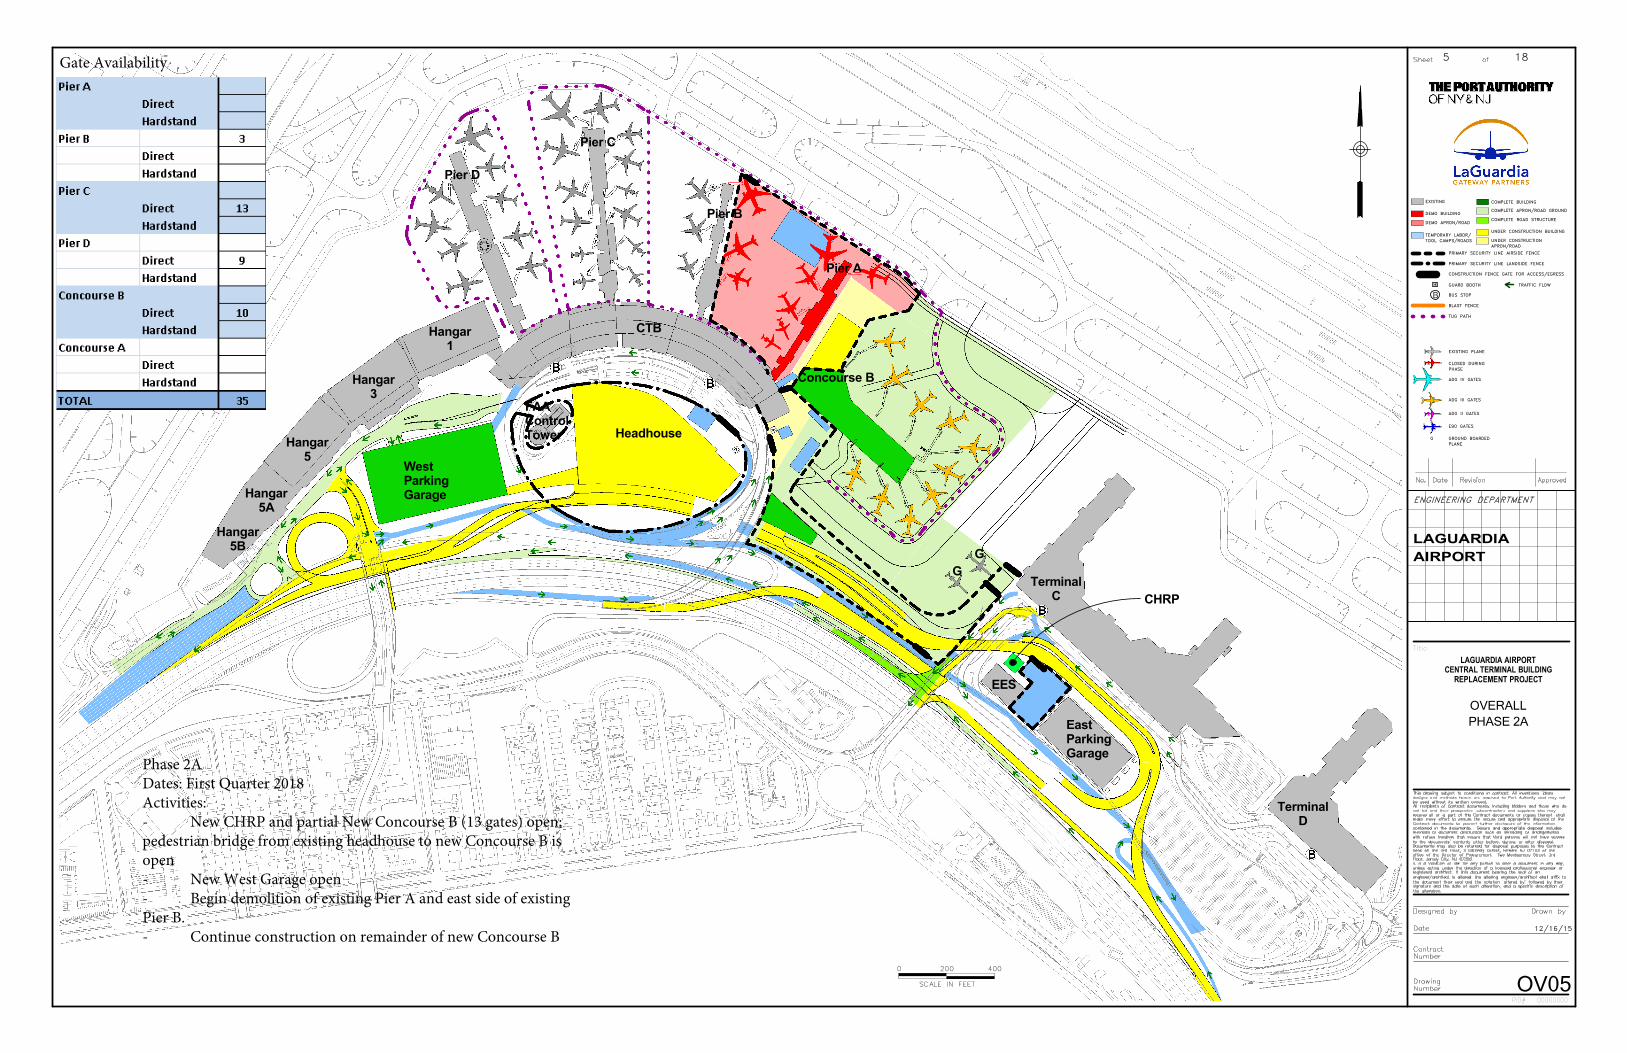
G
G
CHRP
Concourse B
Headhouse
WestParkingGarage
TerminalC
Hangar1
Hangar3
Hangar5
EES
EastParkingGarage
Hangar5A
Hangar5B
TerminalD
FAAControlTower
CTB
Pier A
Pier B
Pier C
Pier D
DEMO BUILDING
TEMPORARY LABOR/TOOL CAMPS/ROADS
EXISTING
PRIMARY SECURITY LINE AIRSIDE FENCE
BUS STOPB
CONSTRUCTION FENCE GATE FOR ACCESS/EGRESS
ADG IV GATES
E90 GATES
ADG II GATES
ADG III GATES
PRIMARY SECURITY LINE LANDSIDE FENCE
GUARD BOOTH
ENGINEERING DEPARTMENT
PID# 00000000
LAGUARDIA
LAGUARDIA AIRPORTCENTRAL TERMINAL BUILDING
REPLACEMENT PROJECT
Title
TUG PATH
COMPLETE BUILDING
UNDER CONSTRUCTION BUILDING
COMPLETE APRON/ROAD GROUND
CLOSED DURINGPHASE
EXISTING PLANE
GROUND BOARDEDPLANE
G
COMPLETE ROAD STRUCTUREDEMO APRON/ROAD
UNDER CONSTRUCTIONAPRON/ROAD
SCALE IN FEET
0 200 400
BLAST FENCE
TRAFFIC FLOW
AIRPORT
12/16/15
OV05
PHASE 2A
OVERALL
5 18Gate Availability
Phase 2ADates: First Quarter 2018Activities:- New CHRP and partial New Concourse B (13 gates) open; pedestrian bridge from existing headhouse to new Concourse B is open- New West Garage open- Begin demolition of existing Pier A and east side of existing Pier B.- Continue construction on remainder of new Concourse B

G
G
CHRP
TerminalC
Hangar1
Hangar3
Hangar5
EES
EastParkingGarage
Hangar5A
Hangar5B
TerminalD
FAAControlTower
CTB
Pier C
Pier D
Concourse B
Headhouse
WestParkingGarage
CHRP
DEMO BUILDING
TEMPORARY LABOR/TOOL CAMPS/ROADS
EXISTING
PRIMARY SECURITY LINE AIRSIDE FENCE
BUS STOPB
CONSTRUCTION FENCE GATE FOR ACCESS/EGRESS
ADG IV GATES
E90 GATES
ADG II GATES
ADG III GATES
PRIMARY SECURITY LINE LANDSIDE FENCE
GUARD BOOTH
ENGINEERING DEPARTMENT
PID# 00000000
LAGUARDIA
LAGUARDIA AIRPORTCENTRAL TERMINAL BUILDING
REPLACEMENT PROJECT
Title
TUG PATH
COMPLETE BUILDING
UNDER CONSTRUCTION BUILDING
COMPLETE APRON/ROAD GROUND
CLOSED DURINGPHASE
EXISTING PLANE
GROUND BOARDEDPLANE
G
COMPLETE ROAD STRUCTUREDEMO APRON/ROAD
UNDER CONSTRUCTIONAPRON/ROAD
SCALE IN FEET
0 200 400
BLAST FENCE
TRAFFIC FLOW
AIRPORT
12/16/15
OV06
PHASE 2B
OVERALL
6 18Gate Availability
Phase 2BDates: Second Quarter 2018Activities:- Demolition of existing CHRP- Continue construction on taxiway/apron area and utility work between new Concourse B and Existing Pier B.- Continue construction of headhouse and arrivals/departures roadways.
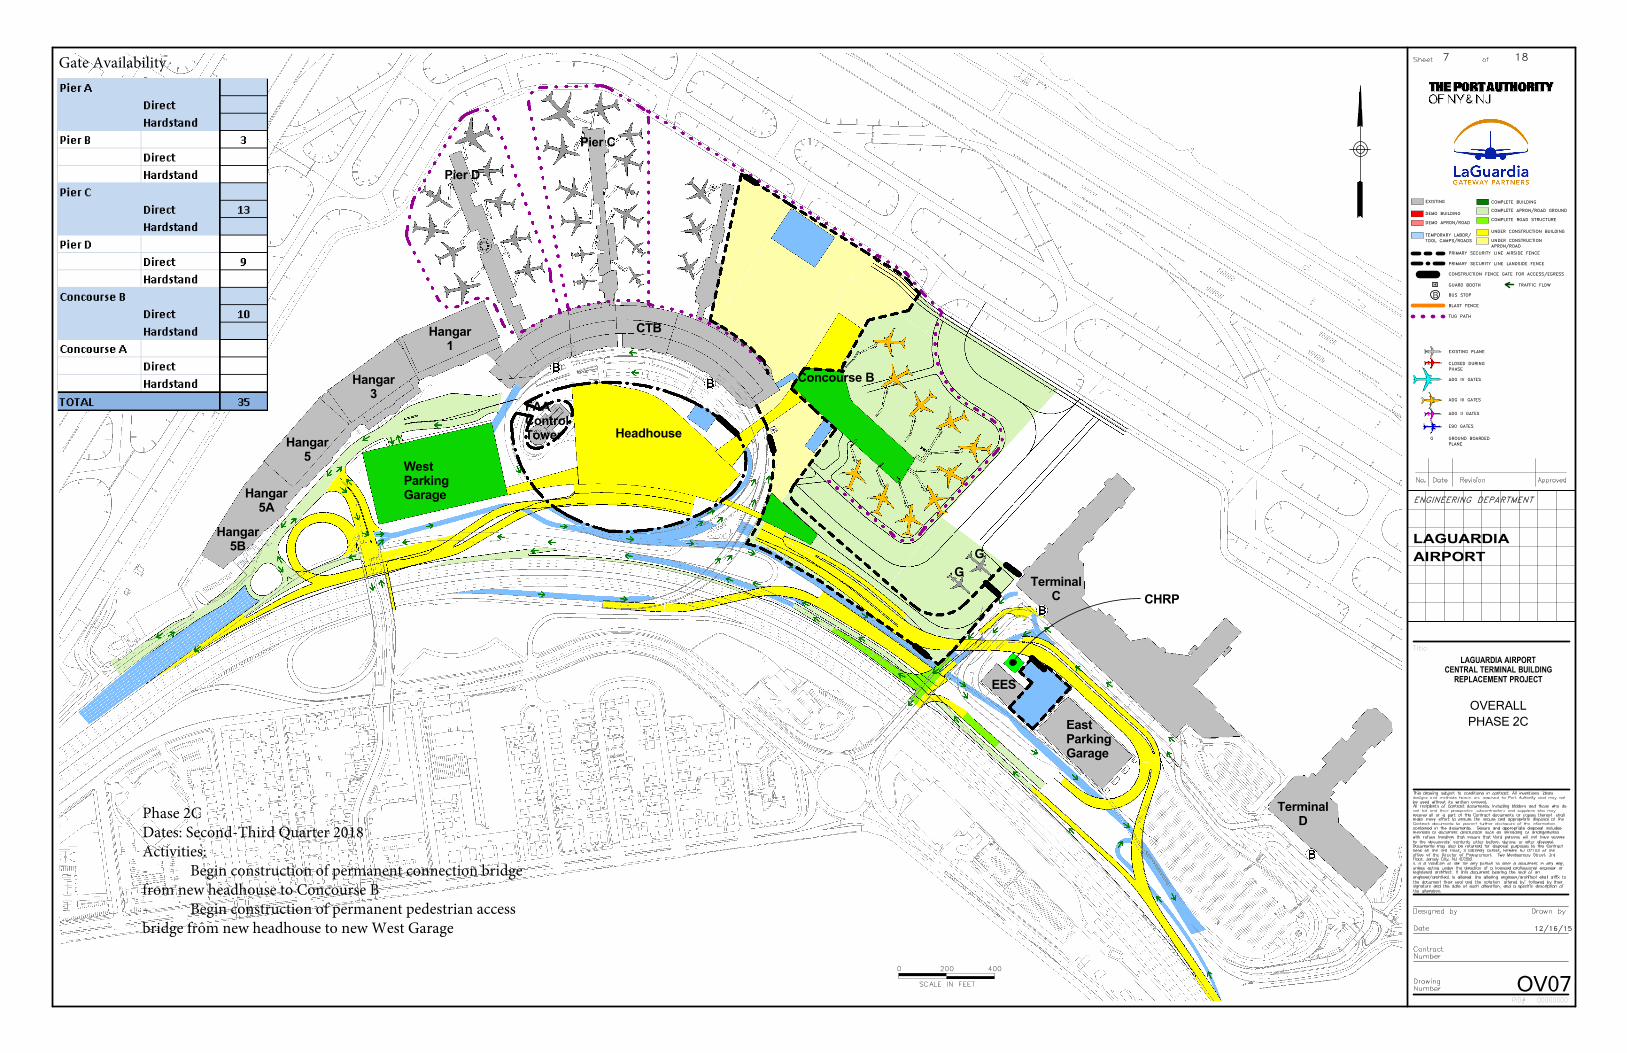
G
G
CHRP
Concourse B
Headhouse
WestParkingGarage
TerminalC
Hangar1
Hangar3
Hangar5
CTB
Pier C
Pier D
EES
EastParkingGarage
Hangar5A
Hangar5B
TerminalD
FAAControlTower
DEMO BUILDING
TEMPORARY LABOR/TOOL CAMPS/ROADS
EXISTING
PRIMARY SECURITY LINE AIRSIDE FENCE
BUS STOPB
CONSTRUCTION FENCE GATE FOR ACCESS/EGRESS
ADG IV GATES
E90 GATES
ADG II GATES
ADG III GATES
PRIMARY SECURITY LINE LANDSIDE FENCE
GUARD BOOTH
ENGINEERING DEPARTMENT
PID# 00000000
LAGUARDIA
LAGUARDIA AIRPORTCENTRAL TERMINAL BUILDING
REPLACEMENT PROJECT
Title
TUG PATH
COMPLETE BUILDING
UNDER CONSTRUCTION BUILDING
COMPLETE APRON/ROAD GROUND
CLOSED DURINGPHASE
EXISTING PLANE
GROUND BOARDEDPLANE
G
COMPLETE ROAD STRUCTUREDEMO APRON/ROAD
UNDER CONSTRUCTIONAPRON/ROAD
SCALE IN FEET
0 200 400
BLAST FENCE
TRAFFIC FLOW
AIRPORT
12/16/15
OV07
PHASE 2C
OVERALL
7 18Gate Availability
Phase 2CDates: Second-Third Quarter 2018Activities:- Begin construction of permanent connection bridge from new headhouse to Concourse B - Begin construction of permanent pedestrian access bridge from new headhouse to new West Garage
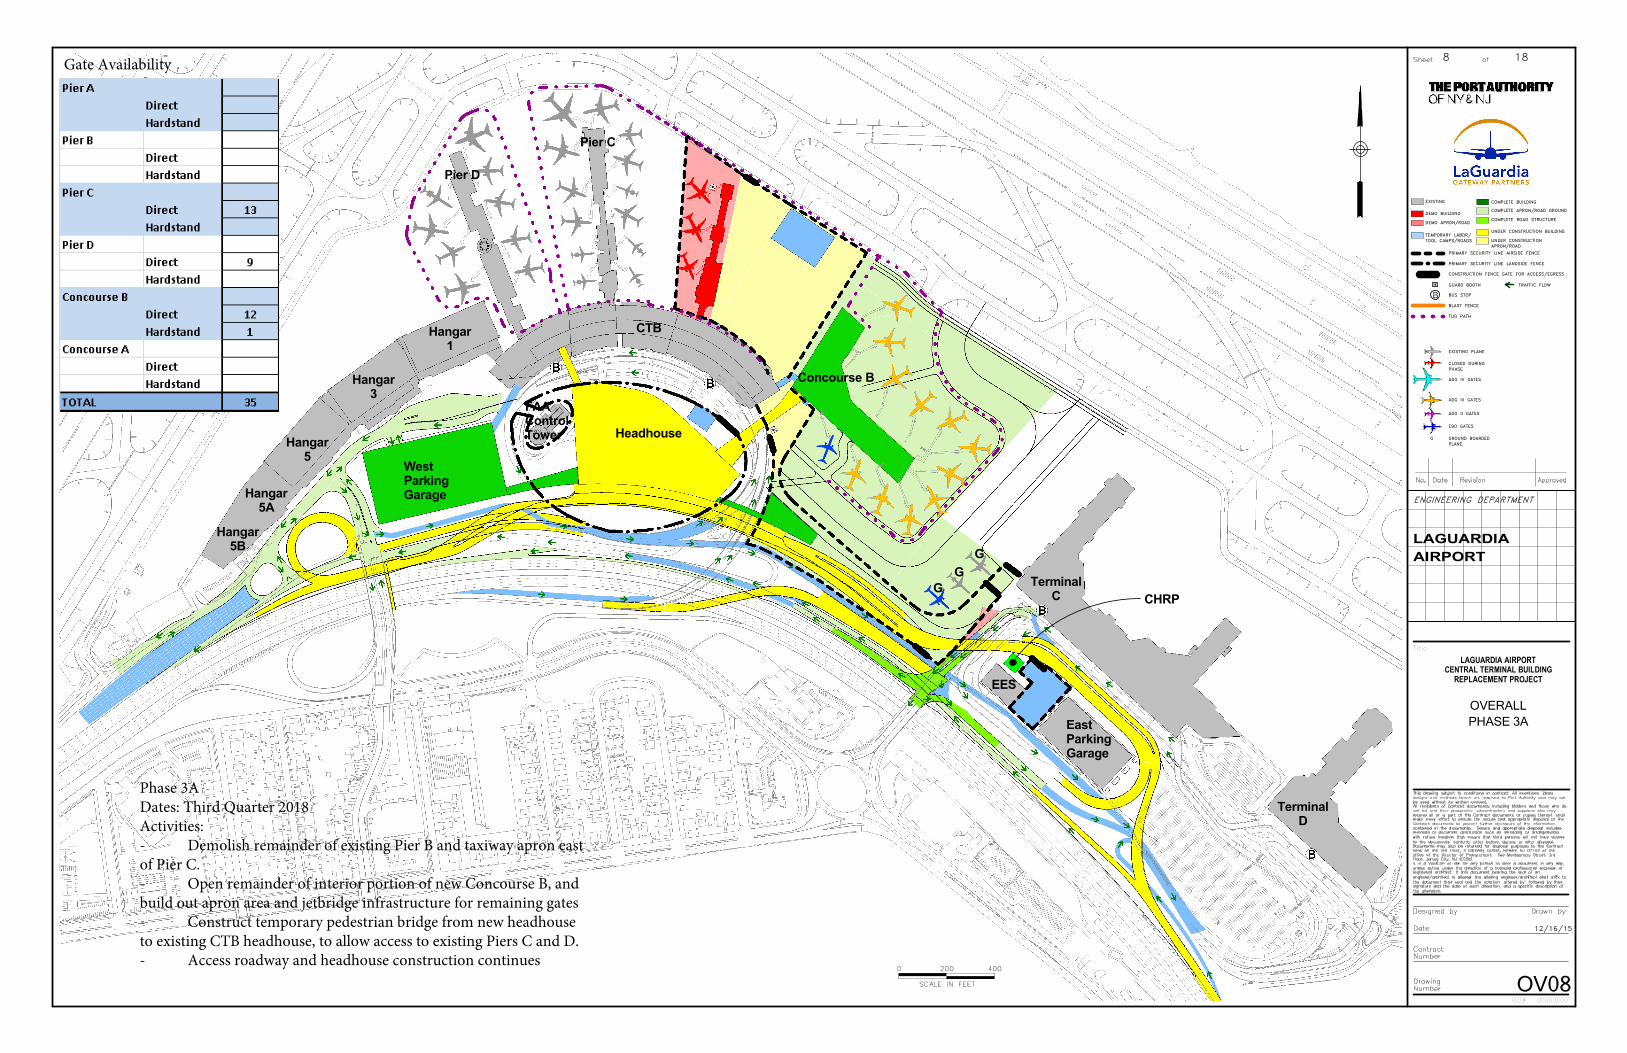
G
G
GCHRP
Concourse B
Headhouse
WestParkingGarage
TerminalC
Hangar1
Hangar3
Hangar5
CTB
Pier C
Pier D
EES
EastParkingGarage
Hangar5A
Hangar5B
TerminalD
FAAControlTower
DEMO BUILDING
TEMPORARY LABOR/TOOL CAMPS/ROADS
EXISTING
PRIMARY SECURITY LINE AIRSIDE FENCE
BUS STOPB
CONSTRUCTION FENCE GATE FOR ACCESS/EGRESS
ADG IV GATES
E90 GATES
ADG II GATES
ADG III GATES
PRIMARY SECURITY LINE LANDSIDE FENCE
GUARD BOOTH
ENGINEERING DEPARTMENT
PID# 00000000
LAGUARDIA
LAGUARDIA AIRPORTCENTRAL TERMINAL BUILDING
REPLACEMENT PROJECT
Title
TUG PATH
COMPLETE BUILDING
UNDER CONSTRUCTION BUILDING
COMPLETE APRON/ROAD GROUND
CLOSED DURINGPHASE
EXISTING PLANE
GROUND BOARDEDPLANE
G
COMPLETE ROAD STRUCTUREDEMO APRON/ROAD
UNDER CONSTRUCTIONAPRON/ROAD
SCALE IN FEET
0 200 400
BLAST FENCE
TRAFFIC FLOW
AIRPORT
12/16/15
OV08
PHASE 3A
OVERALL
8 18Gate Availability
Phase 3ADates: Third Quarter 2018Activities:- Demolish remainder of existing Pier B and taxiway apron east of Pier C.- Open remainder of interior portion of new Concourse B, and build out apron area and jetbridge infrastructure for remaining gates- Construct temporary pedestrian bridge from new headhouse to existing CTB headhouse, to allow access to existing Piers C and D.- Access roadway and headhouse construction continues
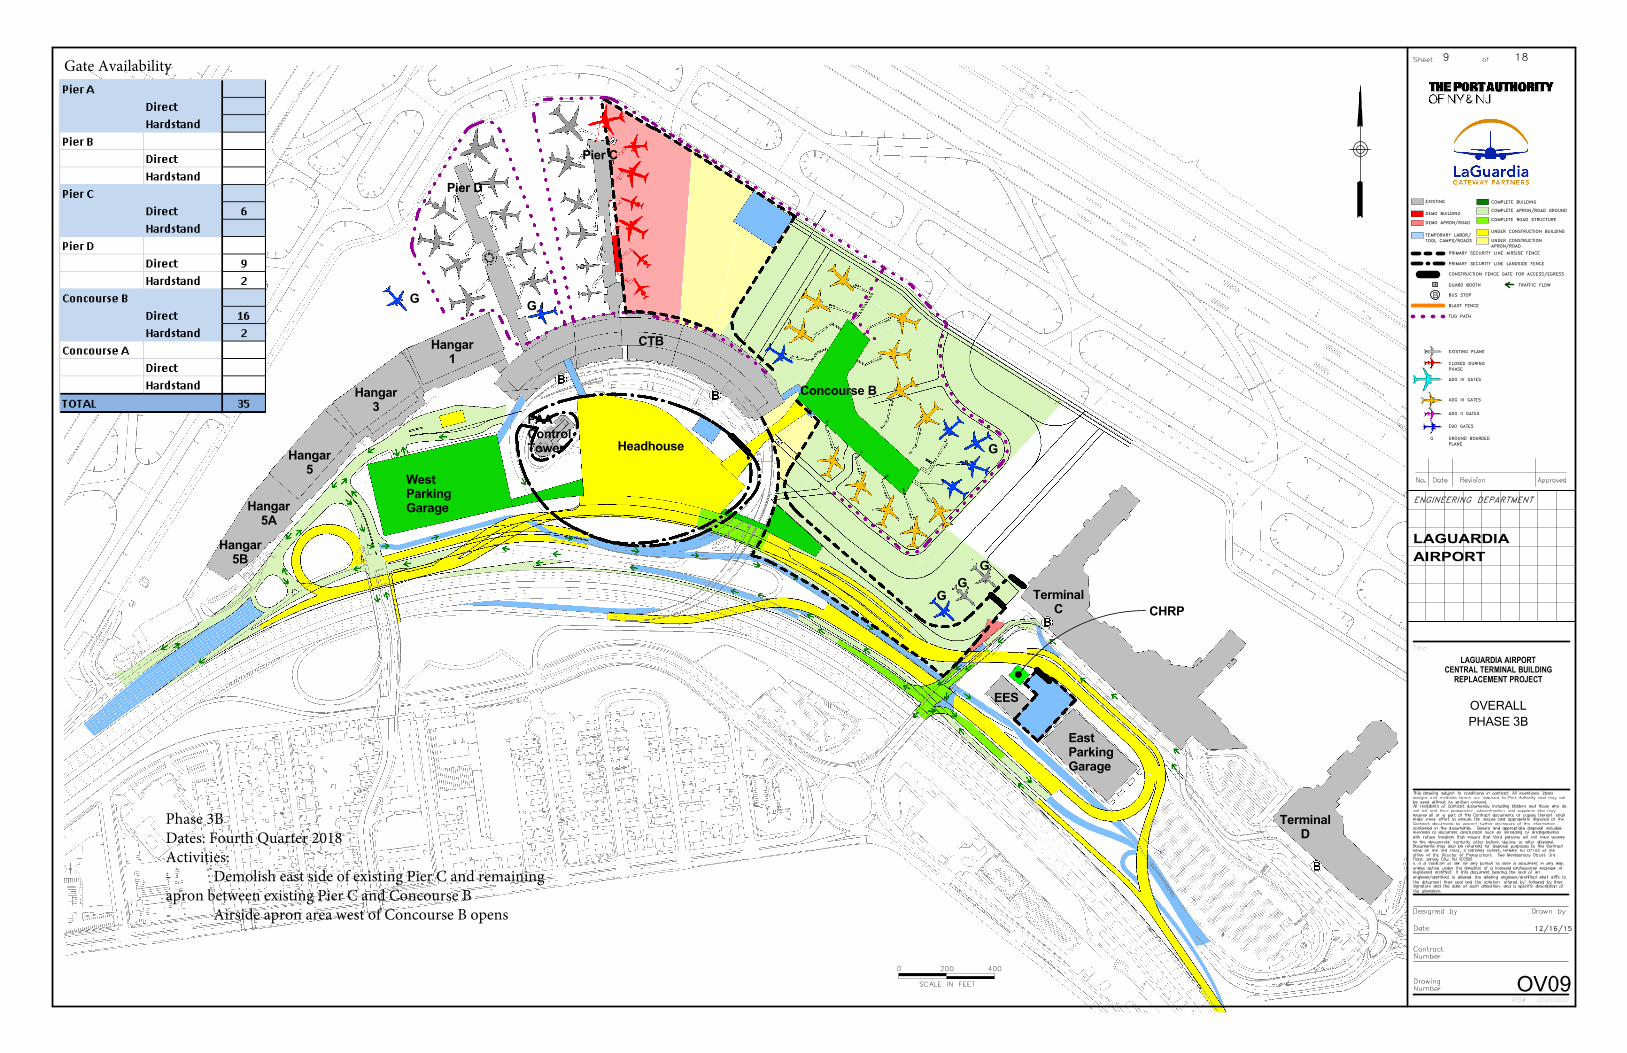
G
GG
GG
G
CHRP
Concourse B
Headhouse
WestParkingGarage
TerminalC
Hangar1
Hangar3
Hangar5
CTB
Pier C
Pier D
EES
EastParkingGarage
Hangar5A
Hangar5B
TerminalD
FAAControlTower
DEMO BUILDING
TEMPORARY LABOR/TOOL CAMPS/ROADS
EXISTING
PRIMARY SECURITY LINE AIRSIDE FENCE
BUS STOPB
CONSTRUCTION FENCE GATE FOR ACCESS/EGRESS
ADG IV GATES
E90 GATES
ADG II GATES
ADG III GATES
PRIMARY SECURITY LINE LANDSIDE FENCE
GUARD BOOTH
ENGINEERING DEPARTMENT
PID# 00000000
LAGUARDIA
LAGUARDIA AIRPORTCENTRAL TERMINAL BUILDING
REPLACEMENT PROJECT
Title
TUG PATH
COMPLETE BUILDING
UNDER CONSTRUCTION BUILDING
COMPLETE APRON/ROAD GROUND
CLOSED DURINGPHASE
EXISTING PLANE
GROUND BOARDEDPLANE
G
COMPLETE ROAD STRUCTUREDEMO APRON/ROAD
UNDER CONSTRUCTIONAPRON/ROAD
SCALE IN FEET
0 200 400
BLAST FENCE
TRAFFIC FLOW
AIRPORT
12/16/15
OV09
PHASE 3B
OVERALL
9 18Gate Availability
Phase 3BDates: Fourth Quarter 2018Activities:- Demolish east side of existing Pier C and remaining apron between existing Pier C and Concourse B- Airside apron area west of Concourse B opens
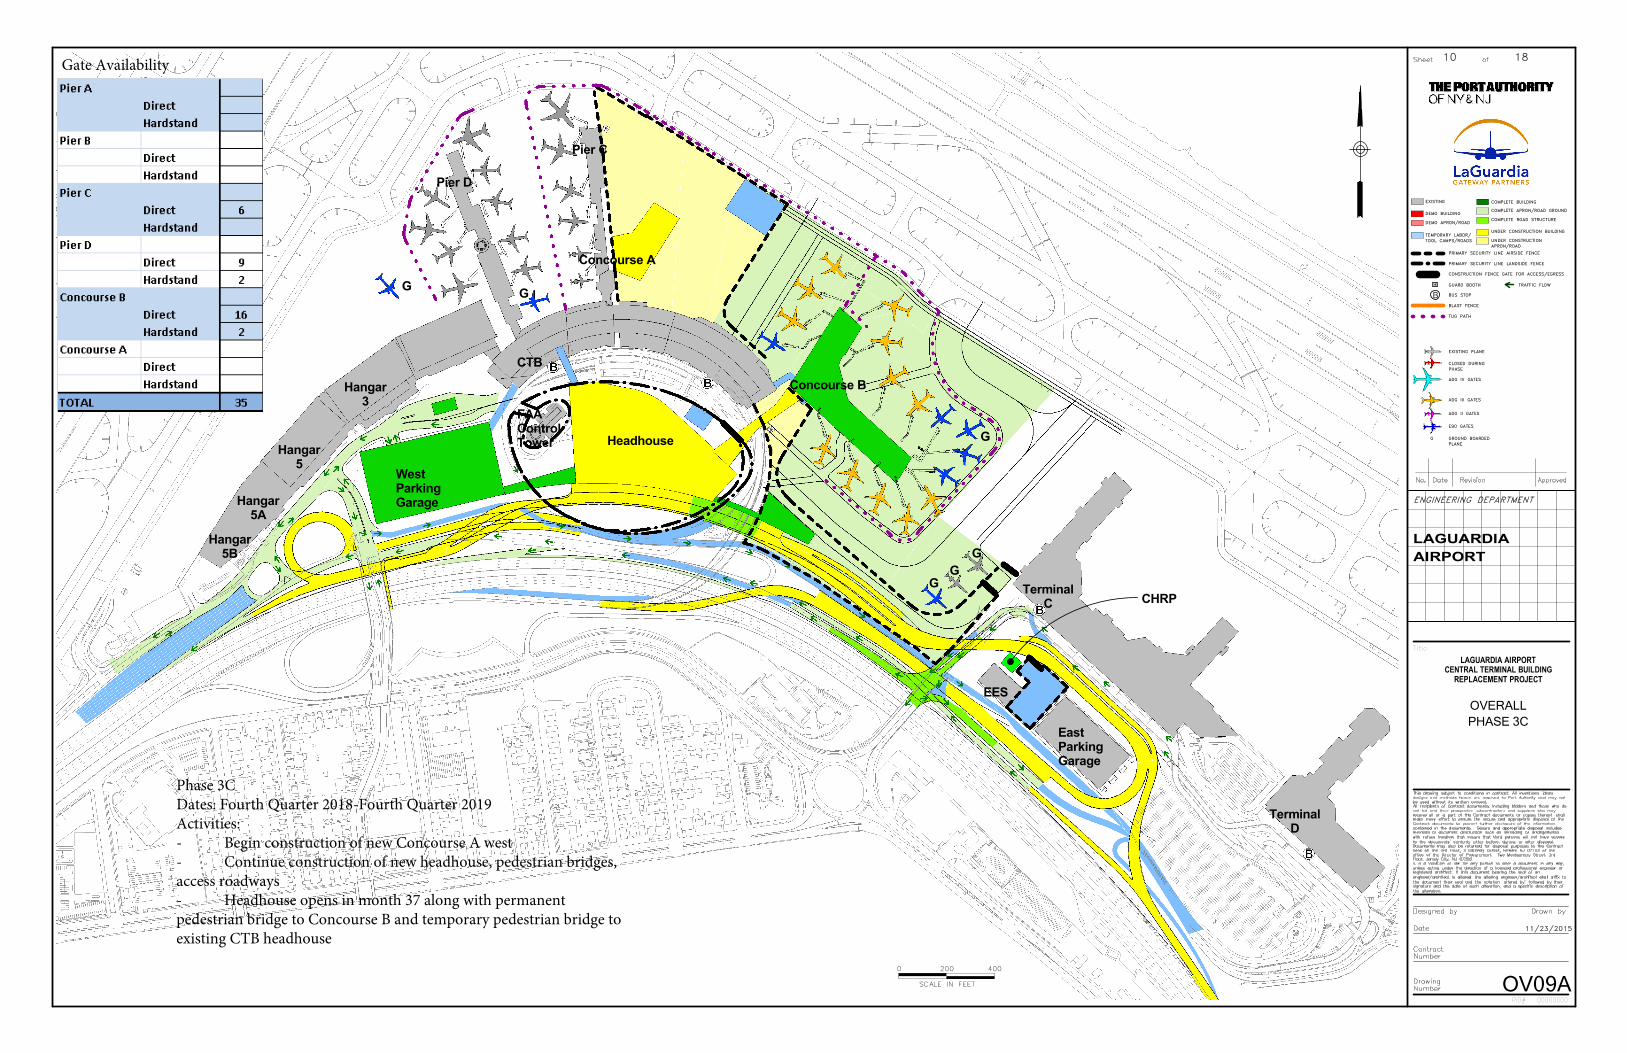
G
GG
GG
G
CHRP
CTB
Concourse B
Headhouse
WestParkingGarage
Concourse A
TerminalC
Hangar3
Hangar5
Pier C
Pier D
EES
EastParkingGarage
Hangar5A
Hangar5B
TerminalD
FAAControlTower
DEMO BUILDING
TEMPORARY LABOR/TOOL CAMPS/ROADS
EXISTING
PRIMARY SECURITY LINE AIRSIDE FENCE
BUS STOPB
CONSTRUCTION FENCE GATE FOR ACCESS/EGRESS
ADG IV GATES
E90 GATES
ADG II GATES
ADG III GATES
PRIMARY SECURITY LINE LANDSIDE FENCE
GUARD BOOTH
ENGINEERING DEPARTMENT
PID# 00000000
LAGUARDIA
LAGUARDIA AIRPORTCENTRAL TERMINAL BUILDING
REPLACEMENT PROJECT
Title
TUG PATH
COMPLETE BUILDING
UNDER CONSTRUCTION BUILDING
COMPLETE APRON/ROAD GROUND
CLOSED DURINGPHASE
EXISTING PLANE
GROUND BOARDEDPLANE
G
COMPLETE ROAD STRUCTUREDEMO APRON/ROAD
UNDER CONSTRUCTIONAPRON/ROAD
SCALE IN FEET
0 200 400
BLAST FENCE
TRAFFIC FLOW
AIRPORT
11/23/2015
OV09A
PHASE 3C
OVERALL
10 18Gate Availability
Phase 3CDates: Fourth Quarter 2018-Fourth Quarter 2019Activities:- Begin construction of new Concourse A west- Continue construction of new headhouse, pedestrian bridges, access roadways- Headhouse opens in month 37 along with permanent pedestrian bridge to Concourse B and temporary pedestrian bridge to existing CTB headhouse
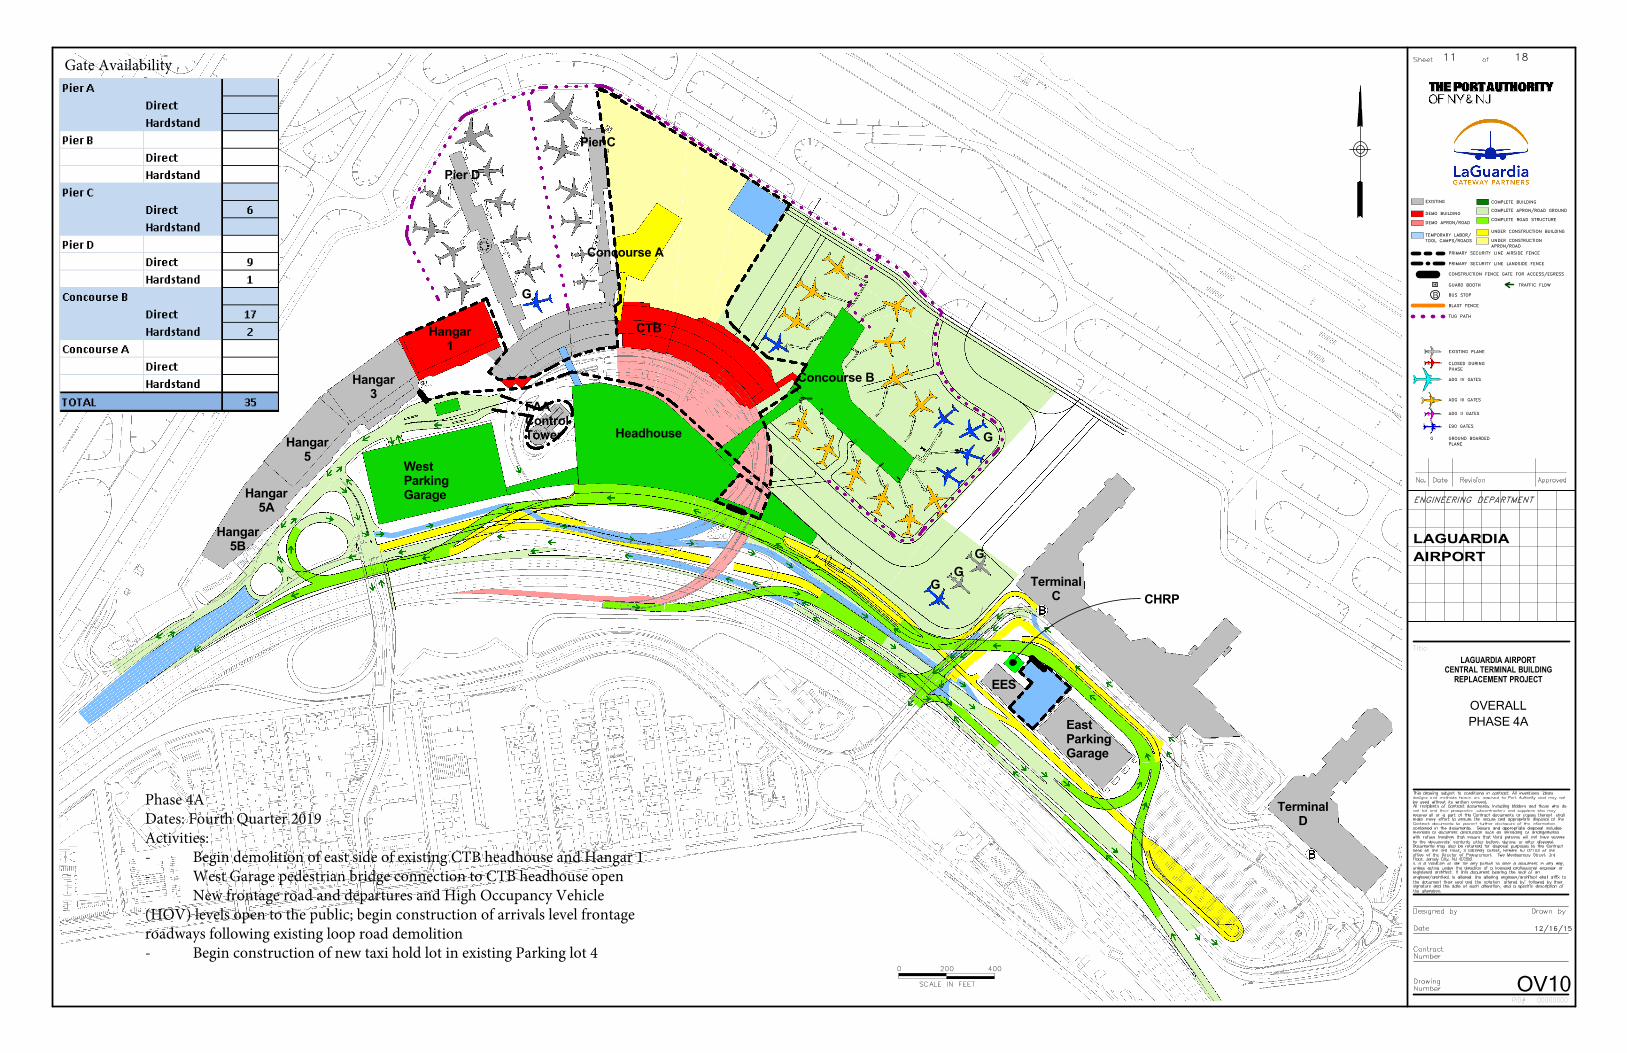
G
GG
G
G
CHRP
TerminalC
Hangar1
Hangar3
Hangar5
CTB
Pier C
Pier D
EES
EastParkingGarage
Hangar5A
Hangar5B
TerminalD
FAAControlTower
Concourse B
Headhouse
WestParkingGarage
Concourse A
DEMO BUILDING
TEMPORARY LABOR/TOOL CAMPS/ROADS
EXISTING
PRIMARY SECURITY LINE AIRSIDE FENCE
BUS STOPB
CONSTRUCTION FENCE GATE FOR ACCESS/EGRESS
ADG IV GATES
E90 GATES
ADG II GATES
ADG III GATES
PRIMARY SECURITY LINE LANDSIDE FENCE
GUARD BOOTH
ENGINEERING DEPARTMENT
PID# 00000000
LAGUARDIA
LAGUARDIA AIRPORTCENTRAL TERMINAL BUILDING
REPLACEMENT PROJECT
Title
TUG PATH
COMPLETE BUILDING
UNDER CONSTRUCTION BUILDING
COMPLETE APRON/ROAD GROUND
CLOSED DURINGPHASE
EXISTING PLANE
GROUND BOARDEDPLANE
G
COMPLETE ROAD STRUCTUREDEMO APRON/ROAD
UNDER CONSTRUCTIONAPRON/ROAD
SCALE IN FEET
0 200 400
BLAST FENCE
TRAFFIC FLOW
AIRPORT
12/16/15
OV10
PHASE 4A
OVERALL
11 18Gate Availability
Phase 4ADates: Fourth Quarter 2019Activities:- Begin demolition of east side of existing CTB headhouse and Hangar 1- West Garage pedestrian bridge connection to CTB headhouse open- New frontage road and departures and High Occupancy Vehicle (HOV) levels open to the public; begin construction of arrivals level frontage roadways following existing loop road demolition- Begin construction of new taxi hold lot in existing Parking lot 4

G
GG
G
G
CHRP
CTB
Concourse B
Headhouse
WestParkingGarage
Concourse A
TerminalC
Hangar3
Hangar5
Pier C
Pier D
EES
EastParkingGarage
Hangar5A
Hangar5B
TerminalD
FAAControlTower
DEMO BUILDING
TEMPORARY LABOR/TOOL CAMPS/ROADS
EXISTING
PRIMARY SECURITY LINE AIRSIDE FENCE
BUS STOPB
CONSTRUCTION FENCE GATE FOR ACCESS/EGRESS
ADG IV GATES
E90 GATES
ADG II GATES
ADG III GATES
PRIMARY SECURITY LINE LANDSIDE FENCE
GUARD BOOTH
ENGINEERING DEPARTMENT
PID# 00000000
LAGUARDIA
LAGUARDIA AIRPORTCENTRAL TERMINAL BUILDING
REPLACEMENT PROJECT
Title
TUG PATH
COMPLETE BUILDING
UNDER CONSTRUCTION BUILDING
COMPLETE APRON/ROAD GROUND
CLOSED DURINGPHASE
EXISTING PLANE
GROUND BOARDEDPLANE
G
COMPLETE ROAD STRUCTUREDEMO APRON/ROAD
UNDER CONSTRUCTIONAPRON/ROAD
SCALE IN FEET
0 200 400
BLAST FENCE
TRAFFIC FLOW
AIRPORT
12/16/15
OV11
PHASE 4B
OVERALL
12 18Gate Availability
Phase 4BDates: Fourth Quarter 2019-Second Quarter 2020Activities:- Begin construction of pedestrian bridge from new headhouse to new Concourse A- Begin construction of permanent parking for FAA staff/control tower
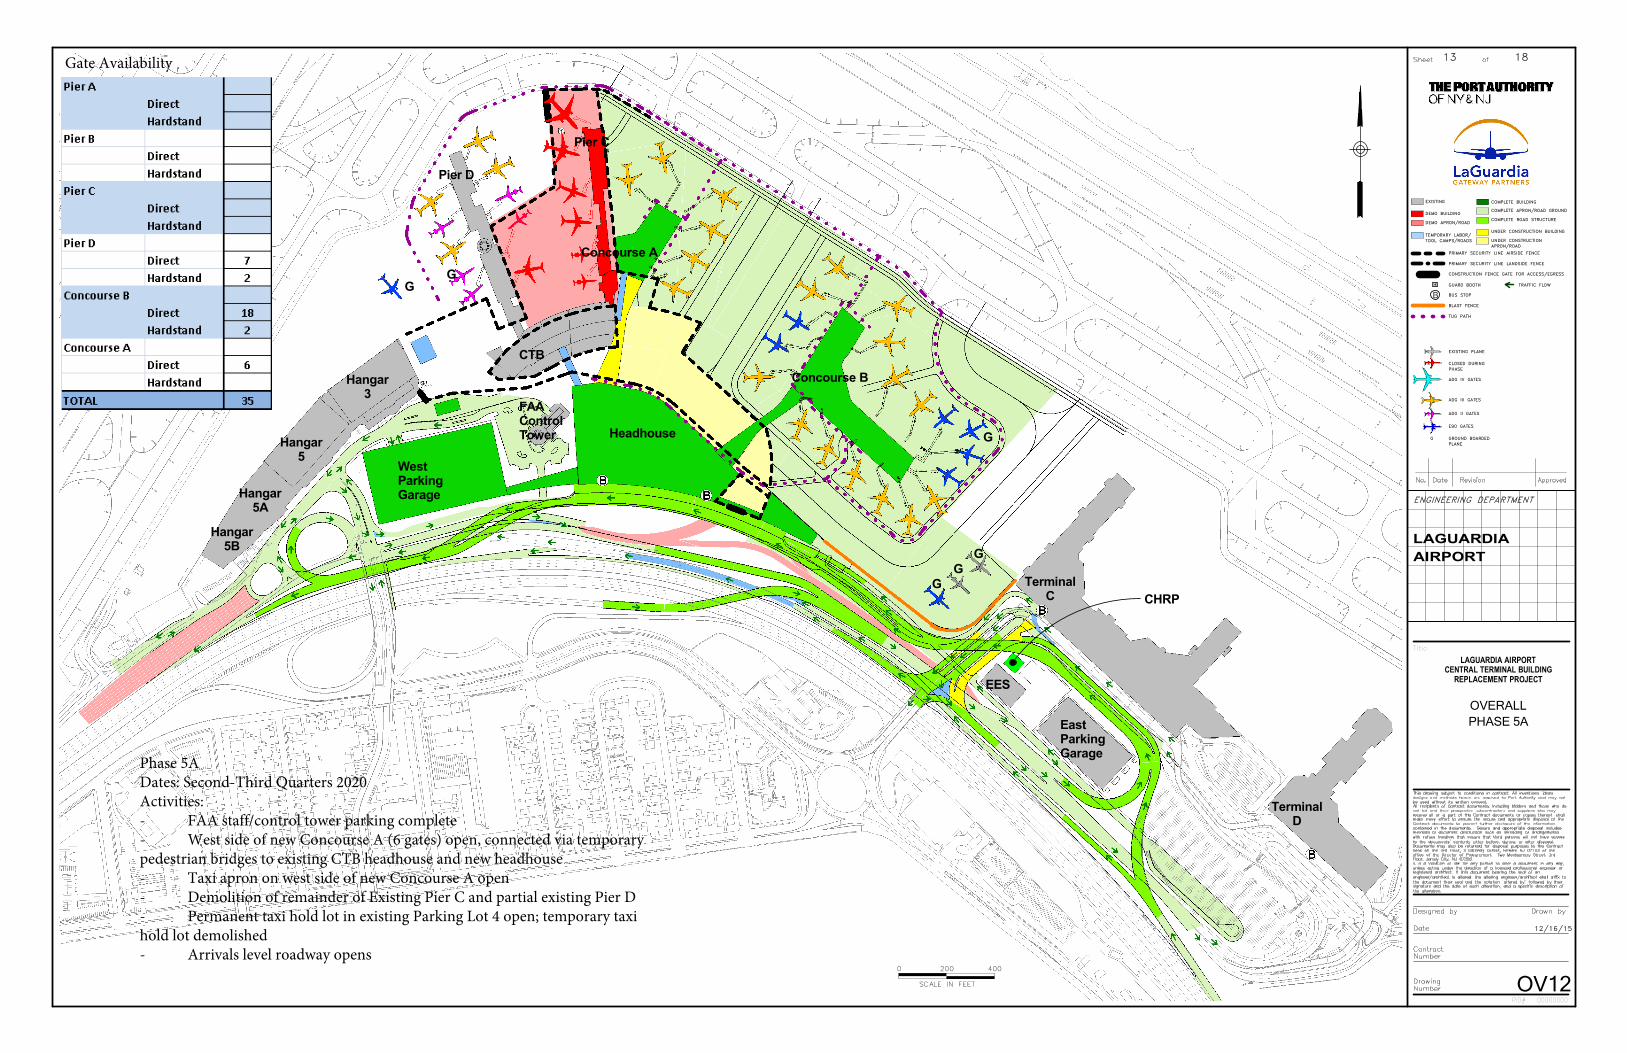
G
G
G
G
G
G
CHRP
CTB
Concourse B
Headhouse
WestParkingGarage
Concourse A
TerminalC
Hangar3
Hangar5
Pier C
Pier D
EES
EastParkingGarage
Hangar5A
Hangar5B
TerminalD
FAAControlTower
DEMO BUILDING
TEMPORARY LABOR/TOOL CAMPS/ROADS
EXISTING
PRIMARY SECURITY LINE AIRSIDE FENCE
BUS STOPB
CONSTRUCTION FENCE GATE FOR ACCESS/EGRESS
ADG IV GATES
E90 GATES
ADG II GATES
ADG III GATES
PRIMARY SECURITY LINE LANDSIDE FENCE
GUARD BOOTH
ENGINEERING DEPARTMENT
PID# 00000000
LAGUARDIA
LAGUARDIA AIRPORTCENTRAL TERMINAL BUILDING
REPLACEMENT PROJECT
Title
TUG PATH
COMPLETE BUILDING
UNDER CONSTRUCTION BUILDING
COMPLETE APRON/ROAD GROUND
CLOSED DURINGPHASE
EXISTING PLANE
GROUND BOARDEDPLANE
G
COMPLETE ROAD STRUCTUREDEMO APRON/ROAD
UNDER CONSTRUCTIONAPRON/ROAD
SCALE IN FEET
0 200 400
BLAST FENCE
TRAFFIC FLOW
AIRPORT
12/16/15
OV12
PHASE 5A
OVERALL
13 18Gate Availability
Phase 5ADates: Second-Third Quarters 2020Activities:- FAA staff/control tower parking complete- West side of new Concourse A (6 gates) open, connected via temporary pedestrian bridges to existing CTB headhouse and new headhouse- Taxi apron on west side of new Concourse A open- Demolition of remainder of Existing Pier C and partial existing Pier D- Permanent taxi hold lot in existing Parking Lot 4 open; temporary taxi hold lot demolished- Arrivals level roadway opens
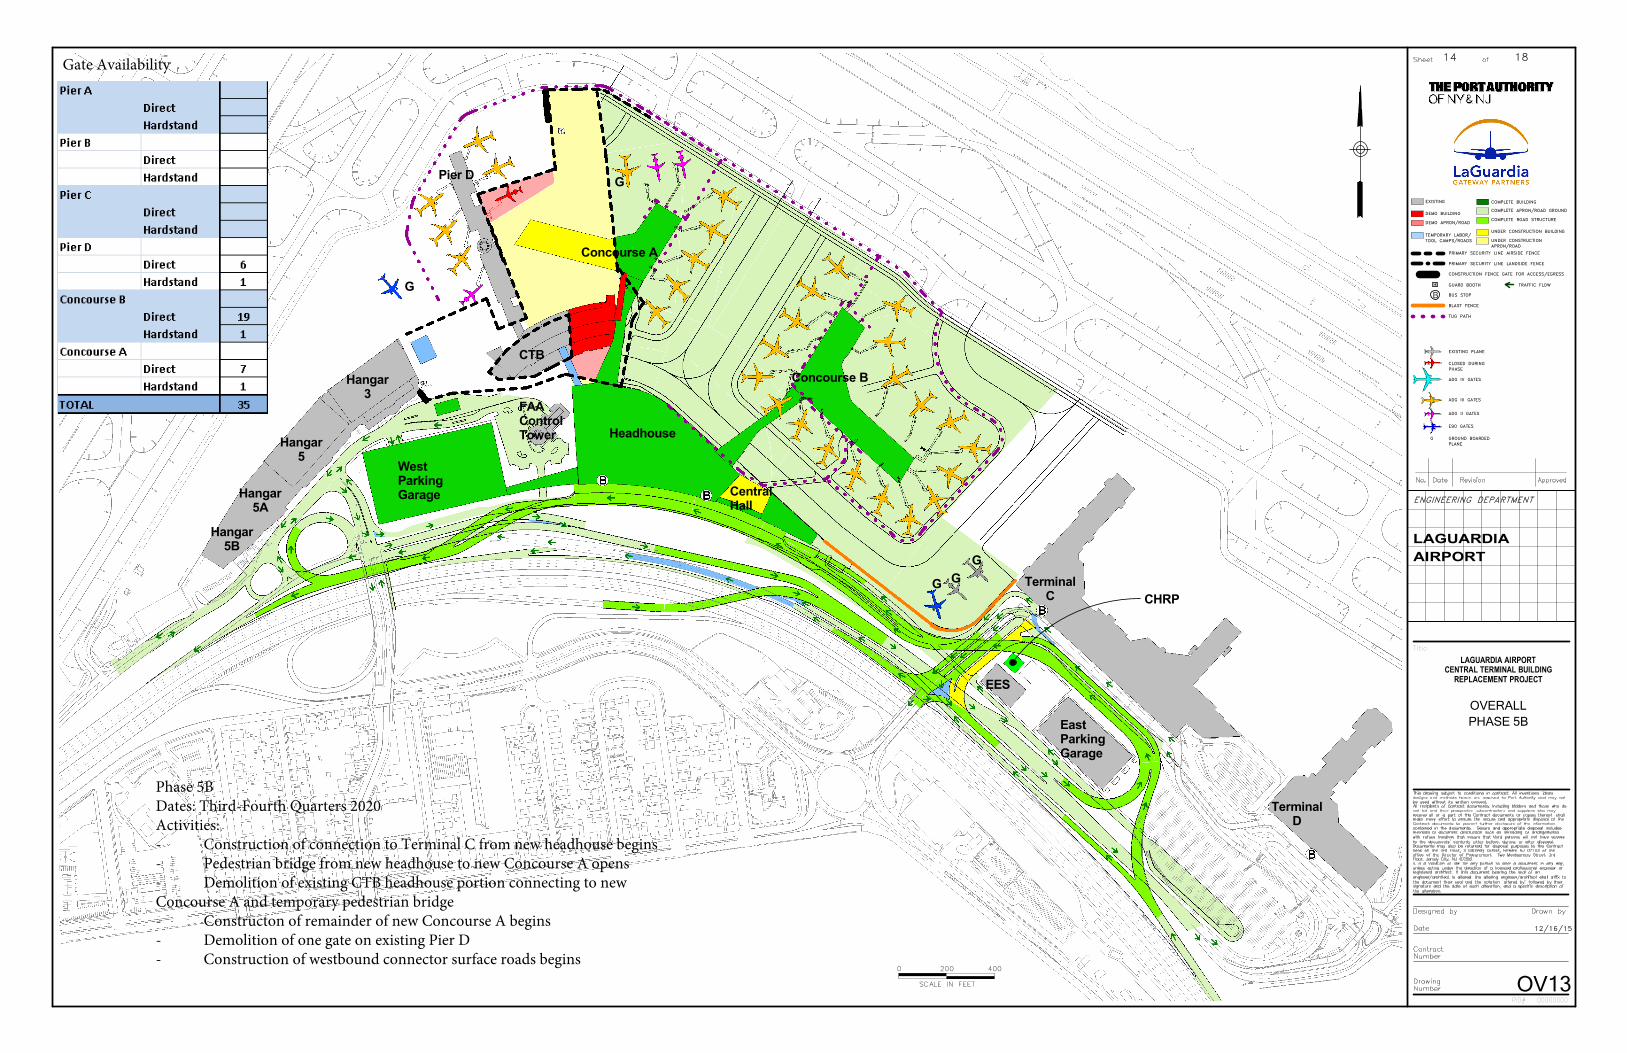
G
G
G
G
CentralHall
G
CHRP
CTB
Concourse B
Headhouse
WestParkingGarage
Concourse A
TerminalC
Hangar3
Hangar5
Pier D
EES
EastParkingGarage
Hangar5A
Hangar5B
TerminalD
FAAControlTower
DEMO BUILDING
TEMPORARY LABOR/TOOL CAMPS/ROADS
EXISTING
PRIMARY SECURITY LINE AIRSIDE FENCE
BUS STOPB
CONSTRUCTION FENCE GATE FOR ACCESS/EGRESS
ADG IV GATES
E90 GATES
ADG II GATES
ADG III GATES
PRIMARY SECURITY LINE LANDSIDE FENCE
GUARD BOOTH
ENGINEERING DEPARTMENT
PID# 00000000
LAGUARDIA
LAGUARDIA AIRPORTCENTRAL TERMINAL BUILDING
REPLACEMENT PROJECT
Title
TUG PATH
COMPLETE BUILDING
UNDER CONSTRUCTION BUILDING
COMPLETE APRON/ROAD GROUND
CLOSED DURINGPHASE
EXISTING PLANE
GROUND BOARDEDPLANE
G
COMPLETE ROAD STRUCTUREDEMO APRON/ROAD
UNDER CONSTRUCTIONAPRON/ROAD
SCALE IN FEET
0 200 400
BLAST FENCE
TRAFFIC FLOW
AIRPORT
12/16/15
OV13
PHASE 5B
OVERALL
14 18Gate Availability
Phase 5BDates: Third-Fourth Quarters 2020Activities:- Construction of connection to Terminal C from new headhouse begins- Pedestrian bridge from new headhouse to new Concourse A opens- Demolition of existing CTB headhouse portion connecting to new Concourse A and temporary pedestrian bridge- Constructon of remainder of new Concourse A begins- Demolition of one gate on existing Pier D - Construction of westbound connector surface roads begins
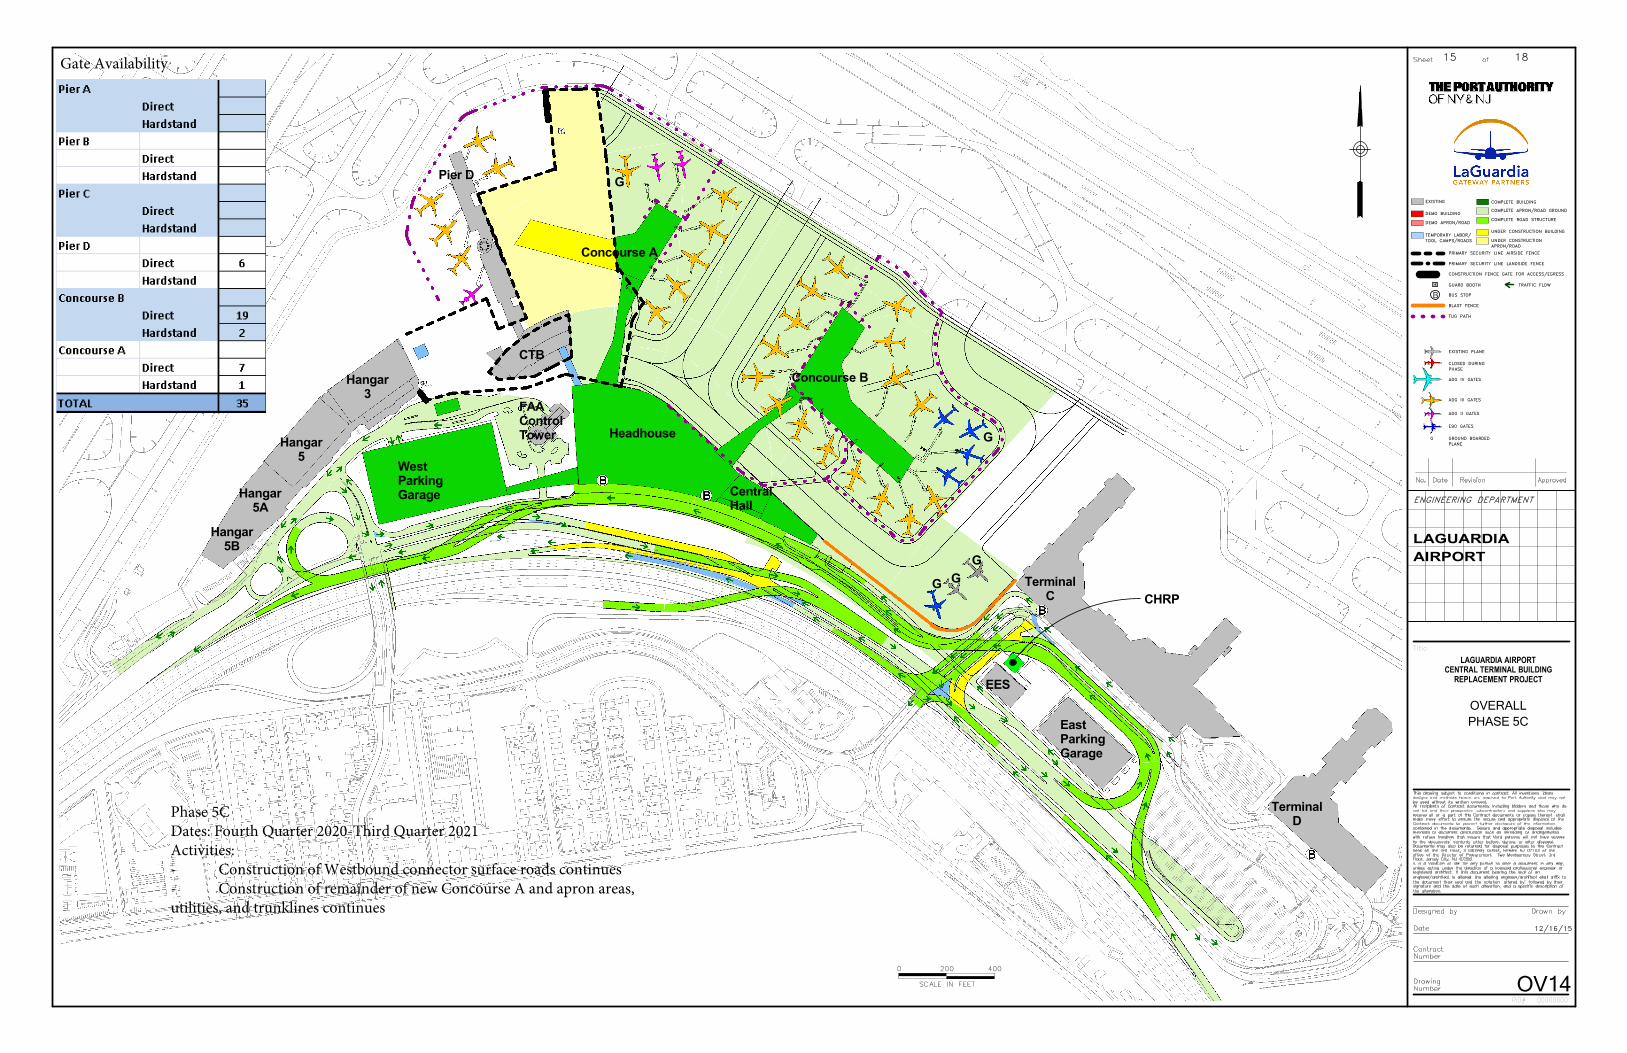
G
G
G
G
CentralHall
G
CHRP
CTB
Concourse B
Headhouse
WestParkingGarage
Concourse A
TerminalC
Hangar3
Hangar5
Pier D
EES
EastParkingGarage
Hangar5A
Hangar5B
TerminalD
FAAControlTower
DEMO BUILDING
TEMPORARY LABOR/TOOL CAMPS/ROADS
EXISTING
PRIMARY SECURITY LINE AIRSIDE FENCE
BUS STOPB
CONSTRUCTION FENCE GATE FOR ACCESS/EGRESS
ADG IV GATES
E90 GATES
ADG II GATES
ADG III GATES
PRIMARY SECURITY LINE LANDSIDE FENCE
GUARD BOOTH
ENGINEERING DEPARTMENT
PID# 00000000
LAGUARDIA
LAGUARDIA AIRPORTCENTRAL TERMINAL BUILDING
REPLACEMENT PROJECT
Title
TUG PATH
COMPLETE BUILDING
UNDER CONSTRUCTION BUILDING
COMPLETE APRON/ROAD GROUND
CLOSED DURINGPHASE
EXISTING PLANE
GROUND BOARDEDPLANE
G
COMPLETE ROAD STRUCTUREDEMO APRON/ROAD
UNDER CONSTRUCTIONAPRON/ROAD
SCALE IN FEET
0 200 400
BLAST FENCE
TRAFFIC FLOW
AIRPORT
12/16/15
OV14
PHASE 5C
OVERALL
15 18Gate Availability
Phase 5CDates: Fourth Quarter 2020-Third Quarter 2021Activities:- Construction of Westbound connector surface roads continues- Construction of remainder of new Concourse A and apron areas, utilities, and trunklines continues
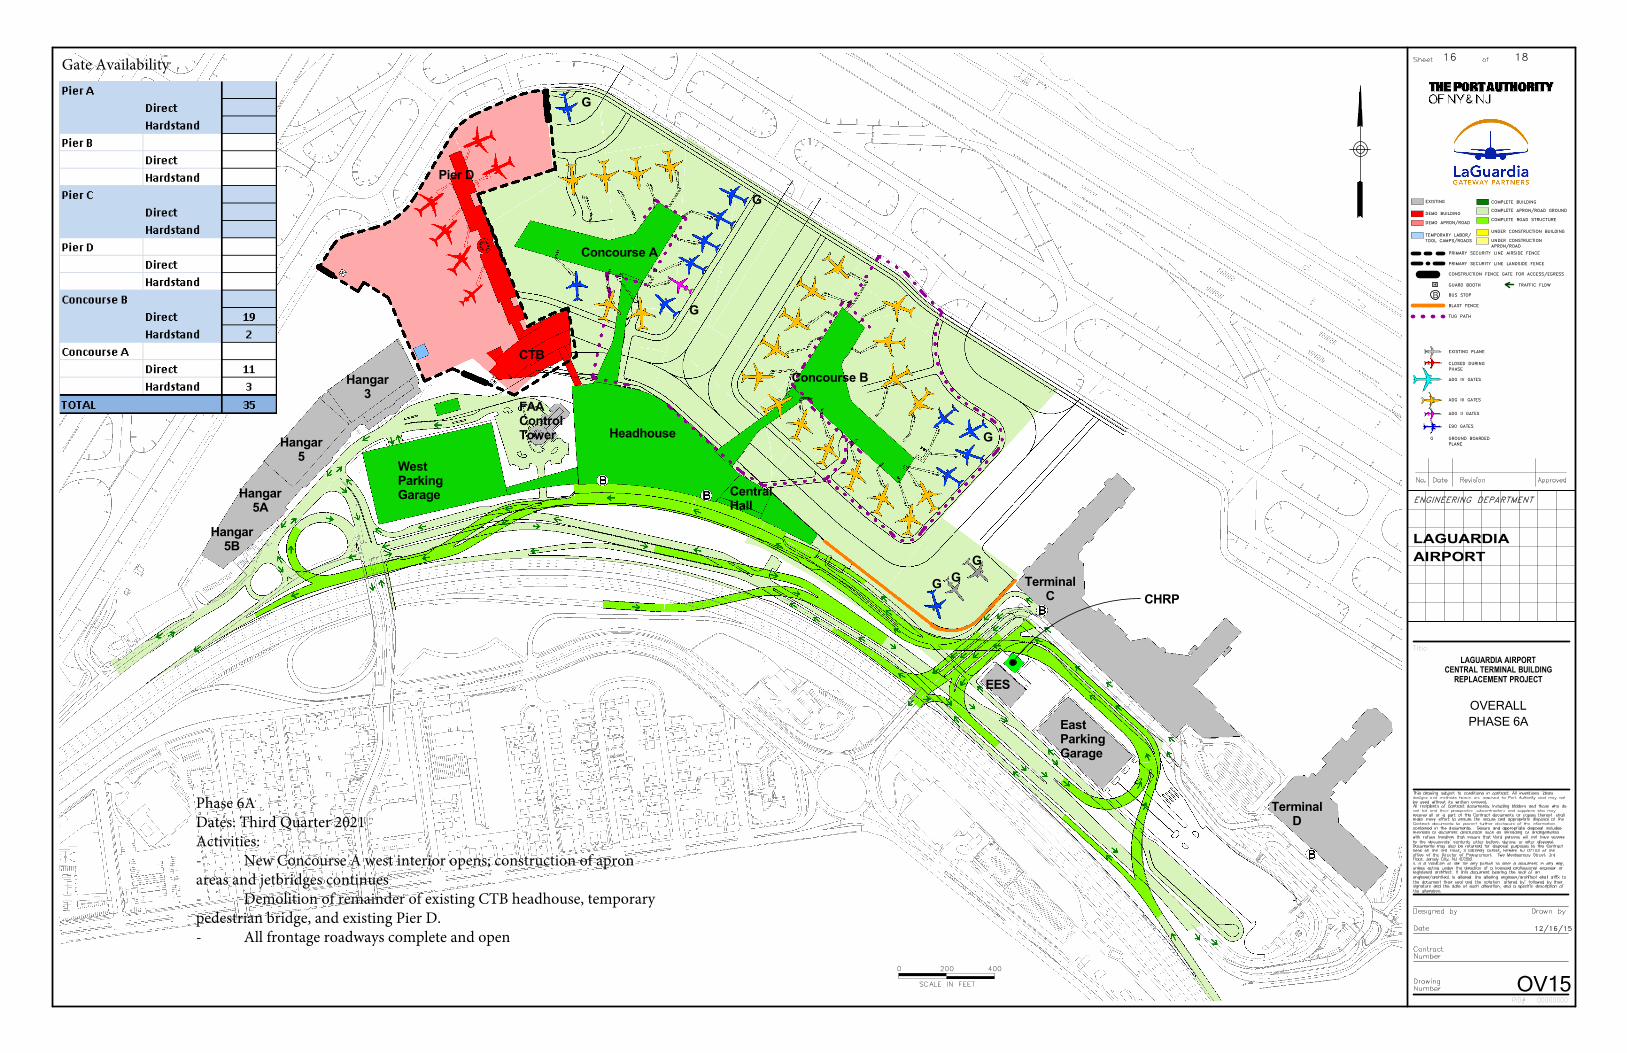
G
G
G
G
G
G
CentralHall
G
CHRP
CTB
Concourse B
Headhouse
WestParkingGarage
Concourse A
TerminalC
Hangar3
Hangar5
Pier D
EES
EastParkingGarage
Hangar5A
Hangar5B
TerminalD
FAAControlTower
DEMO BUILDING
TEMPORARY LABOR/TOOL CAMPS/ROADS
EXISTING
PRIMARY SECURITY LINE AIRSIDE FENCE
BUS STOPB
CONSTRUCTION FENCE GATE FOR ACCESS/EGRESS
ADG IV GATES
E90 GATES
ADG II GATES
ADG III GATES
PRIMARY SECURITY LINE LANDSIDE FENCE
GUARD BOOTH
ENGINEERING DEPARTMENT
PID# 00000000
LAGUARDIA
LAGUARDIA AIRPORTCENTRAL TERMINAL BUILDING
REPLACEMENT PROJECT
Title
TUG PATH
COMPLETE BUILDING
UNDER CONSTRUCTION BUILDING
COMPLETE APRON/ROAD GROUND
CLOSED DURINGPHASE
EXISTING PLANE
GROUND BOARDEDPLANE
G
COMPLETE ROAD STRUCTUREDEMO APRON/ROAD
UNDER CONSTRUCTIONAPRON/ROAD
SCALE IN FEET
0 200 400
BLAST FENCE
TRAFFIC FLOW
AIRPORT
12/16/15
OV15
PHASE 6A
OVERALL
16 18Gate Availability
Phase 6ADates: Third Quarter 2021Activities:- New Concourse A west interior opens; construction of apron areas and jetbridges continues- Demolition of remainder of existing CTB headhouse, temporary pedestrian bridge, and existing Pier D.- All frontage roadways complete and open
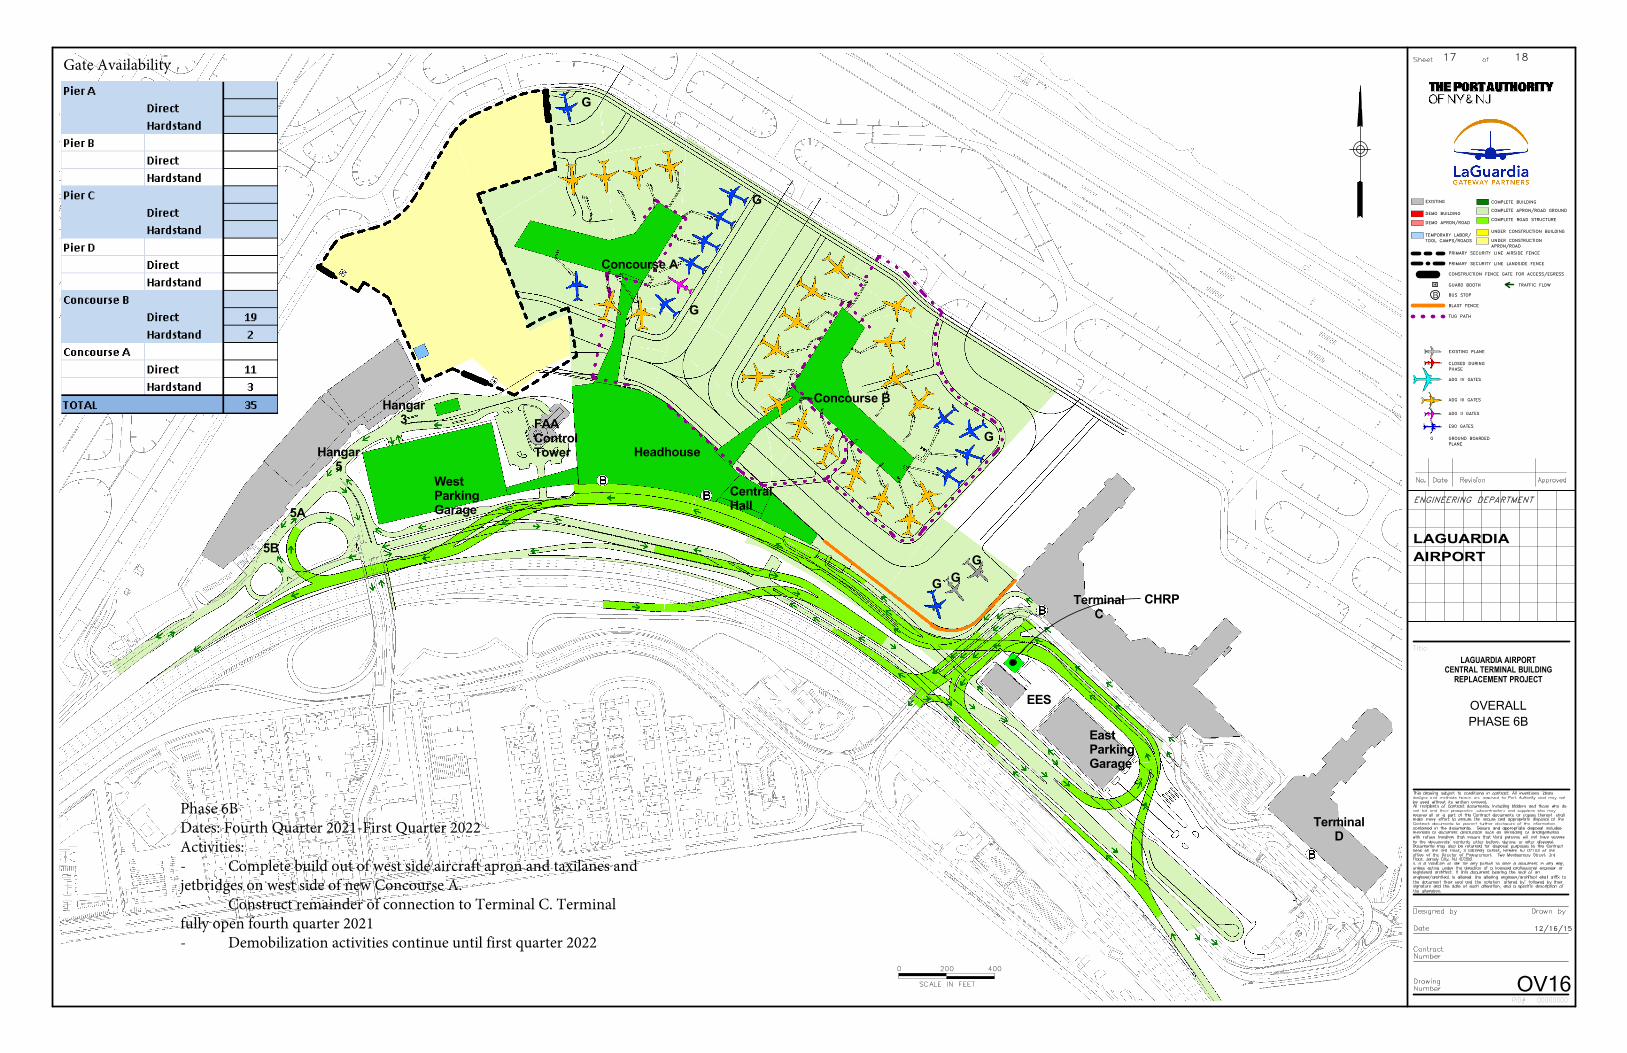
G
G
G
G
G
CentralHall
G
G
CHRP
Concourse B
Headhouse
5A
5B
TerminalC
Hangar3
Hangar5
FAAControlTower
EES
EastParkingGarage
WestParkingGarage
TerminalD
Concourse A
DEMO BUILDING
TEMPORARY LABOR/TOOL CAMPS/ROADS
EXISTING
PRIMARY SECURITY LINE AIRSIDE FENCE
BUS STOPB
CONSTRUCTION FENCE GATE FOR ACCESS/EGRESS
ADG IV GATES
E90 GATES
ADG II GATES
ADG III GATES
PRIMARY SECURITY LINE LANDSIDE FENCE
GUARD BOOTH
ENGINEERING DEPARTMENT
PID# 00000000
LAGUARDIA
LAGUARDIA AIRPORTCENTRAL TERMINAL BUILDING
REPLACEMENT PROJECT
Title
TUG PATH
COMPLETE BUILDING
UNDER CONSTRUCTION BUILDING
COMPLETE APRON/ROAD GROUND
CLOSED DURINGPHASE
EXISTING PLANE
GROUND BOARDEDPLANE
G
COMPLETE ROAD STRUCTUREDEMO APRON/ROAD
UNDER CONSTRUCTIONAPRON/ROAD
SCALE IN FEET
0 200 400
BLAST FENCE
TRAFFIC FLOW
AIRPORT
12/16/15
OV16
PHASE 6B
OVERALL
17 18Gate Availability
Phase 6BDates: Fourth Quarter 2021-First Quarter 2022Activities:- Complete build out of west side aircraft apron and taxilanes and jetbridges on west side of new Concourse A.- Construct remainder of connection to Terminal C. Terminal fully open fourth quarter 2021- Demobilization activities continue until first quarter 2022
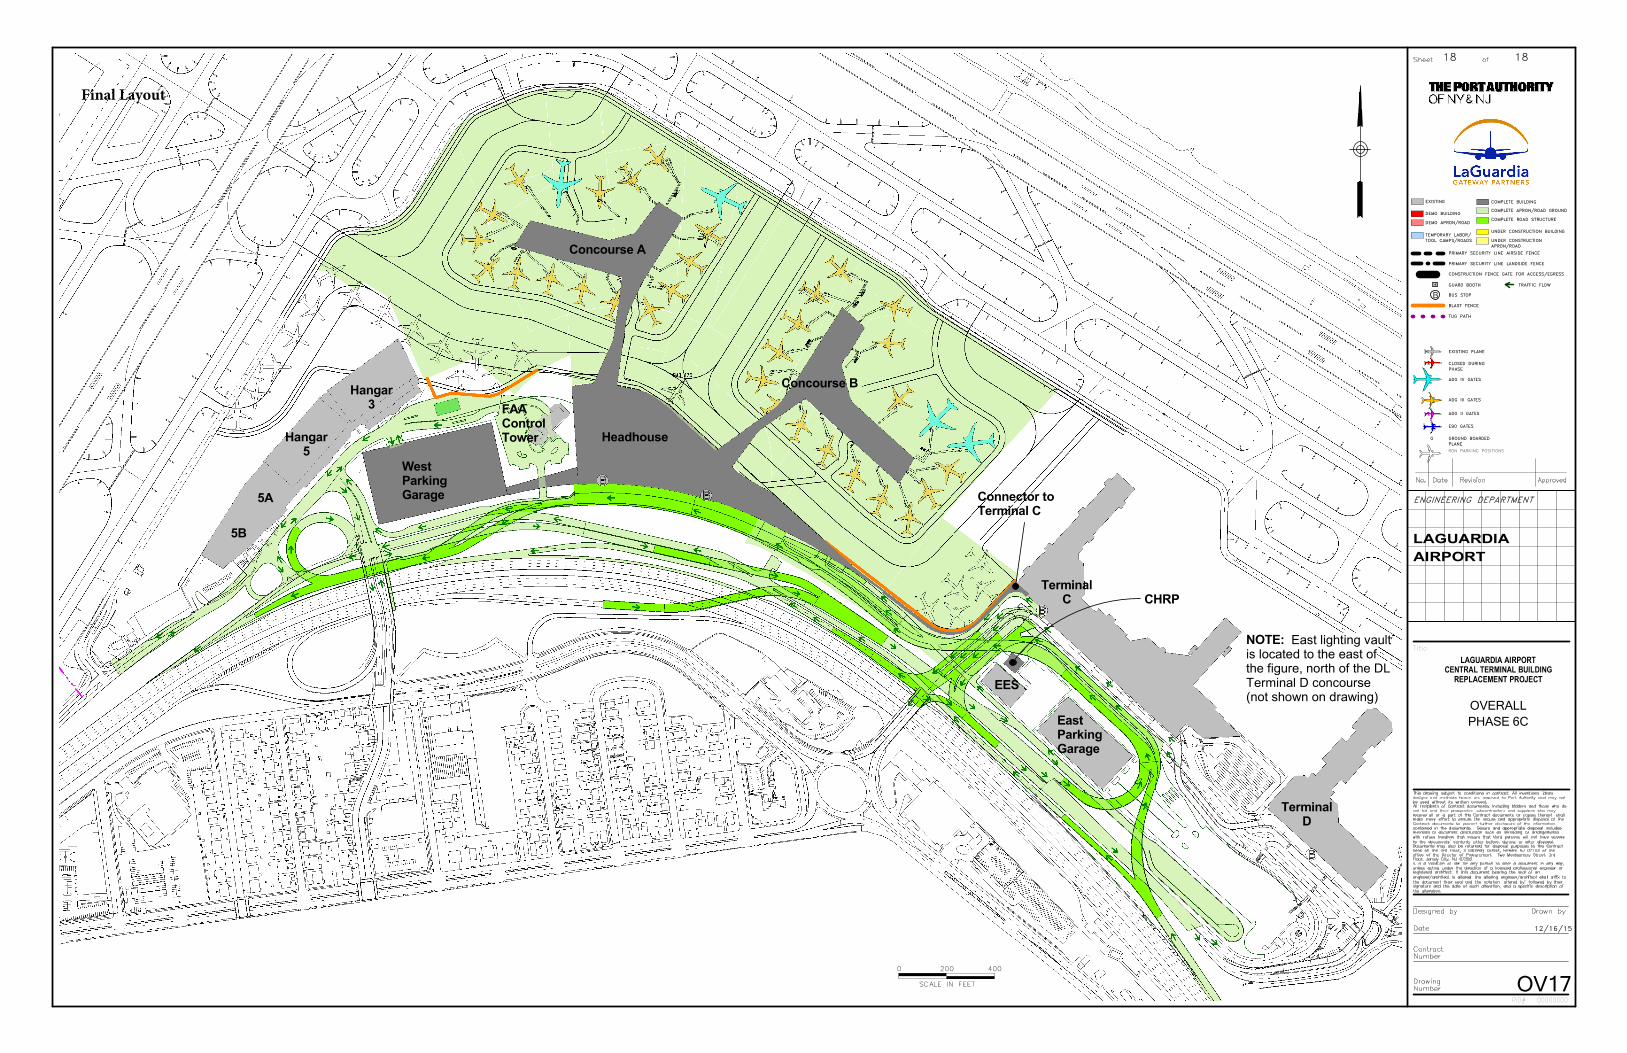
CHRP
Connector toTerminal C
NOTE: East lighting vaultis located to the east ofthe figure, north of the DLTerminal D concourse(not shown on drawing)
Concourse B
Headhouse
5A
5B
TerminalC
Hangar3
Hangar5
FAAControlTower
EES
EastParkingGarage
WestParkingGarage
TerminalD
Concourse A
RON PARKING POSITIONS
DEMO BUILDING
TEMPORARY LABOR/TOOL CAMPS/ROADS
EXISTING
PRIMARY SECURITY LINE AIRSIDE FENCE
BUS STOPB
CONSTRUCTION FENCE GATE FOR ACCESS/EGRESS
ADG IV GATES
E90 GATES
ADG II GATES
ADG III GATES
PRIMARY SECURITY LINE LANDSIDE FENCE
GUARD BOOTH
ENGINEERING DEPARTMENT
PID# 00000000
LAGUARDIA
LAGUARDIA AIRPORTCENTRAL TERMINAL BUILDING
REPLACEMENT PROJECT
Title
TUG PATH
COMPLETE BUILDING
UNDER CONSTRUCTION BUILDING
COMPLETE APRON/ROAD GROUND
CLOSED DURINGPHASE
EXISTING PLANE
GROUND BOARDEDPLANE
G
COMPLETE ROAD STRUCTUREDEMO APRON/ROAD
UNDER CONSTRUCTIONAPRON/ROAD
SCALE IN FEET
0 200 400
BLAST FENCE
TRAFFIC FLOW
AIRPORT
12/16/15
OV17
PHASE 6C
OVERALL
18 18
Final Layout
Attachment 4
Technical Memorandum – Updated Traffic Analysis for Construction Conditions
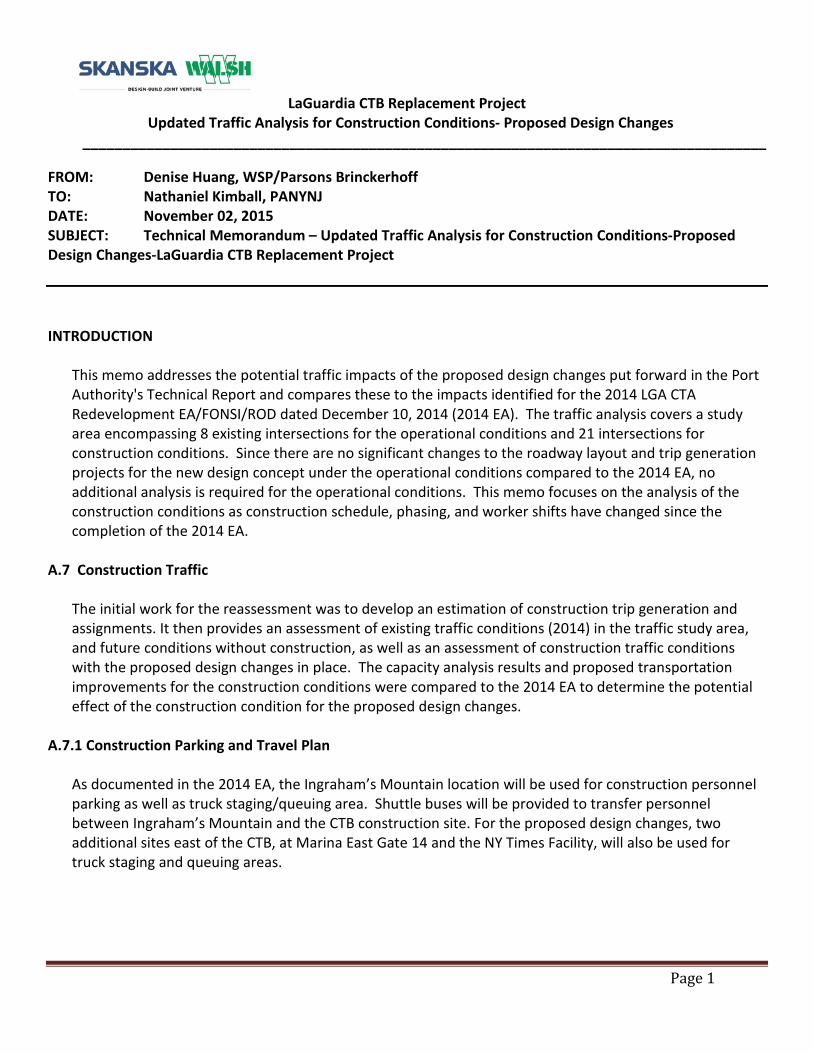
LaGuardia CTB Replacement Project Updated Traffic Analysis for Construction Conditions- Proposed Design Changes
______________________________________________________________________________________
FROM: Denise Huang, WSP/Parsons Brinckerhoff TO: Nathaniel Kimball, PANYNJ DATE: November 02, 2015 SUBJECT: Technical Memorandum – Updated Traffic Analysis for Construction Conditions-Proposed Design Changes-LaGuardia CTB Replacement Project
INTRODUCTION
This memo addresses the potential traffic impacts of the proposed design changes put forward in the Port Authority's Technical Report and compares these to the impacts identified for the 2014 LGA CTA Redevelopment EA/FONSI/ROD dated December 10, 2014 (2014 EA). The traffic analysis covers a study area encompassing 8 existing intersections for the operational conditions and 21 intersections for construction conditions. Since there are no significant changes to the roadway layout and trip generation projects for the new design concept under the operational conditions compared to the 2014 EA, no additional analysis is required for the operational conditions. This memo focuses on the analysis of the construction conditions as construction schedule, phasing, and worker shifts have changed since the completion of the 2014 EA.
A.7 Construction Traffic
The initial work for the reassessment was to develop an estimation of construction trip generation and assignments. It then provides an assessment of existing traffic conditions (2014) in the traffic study area, and future conditions without construction, as well as an assessment of construction traffic conditions with the proposed design changes in place. The capacity analysis results and proposed transportation improvements for the construction conditions were compared to the 2014 EA to determine the potential effect of the construction condition for the proposed design changes.
A.7.1 Construction Parking and Travel Plan
As documented in the 2014 EA, the Ingraham’s Mountain location will be used for construction personnel parking as well as truck staging/queuing area. Shuttle buses will be provided to transfer personnel between Ingraham’s Mountain and the CTB construction site. For the proposed design changes, two additional sites east of the CTB, at Marina East Gate 14 and the NY Times Facility, will also be used for truck staging and queuing areas.
Page 1
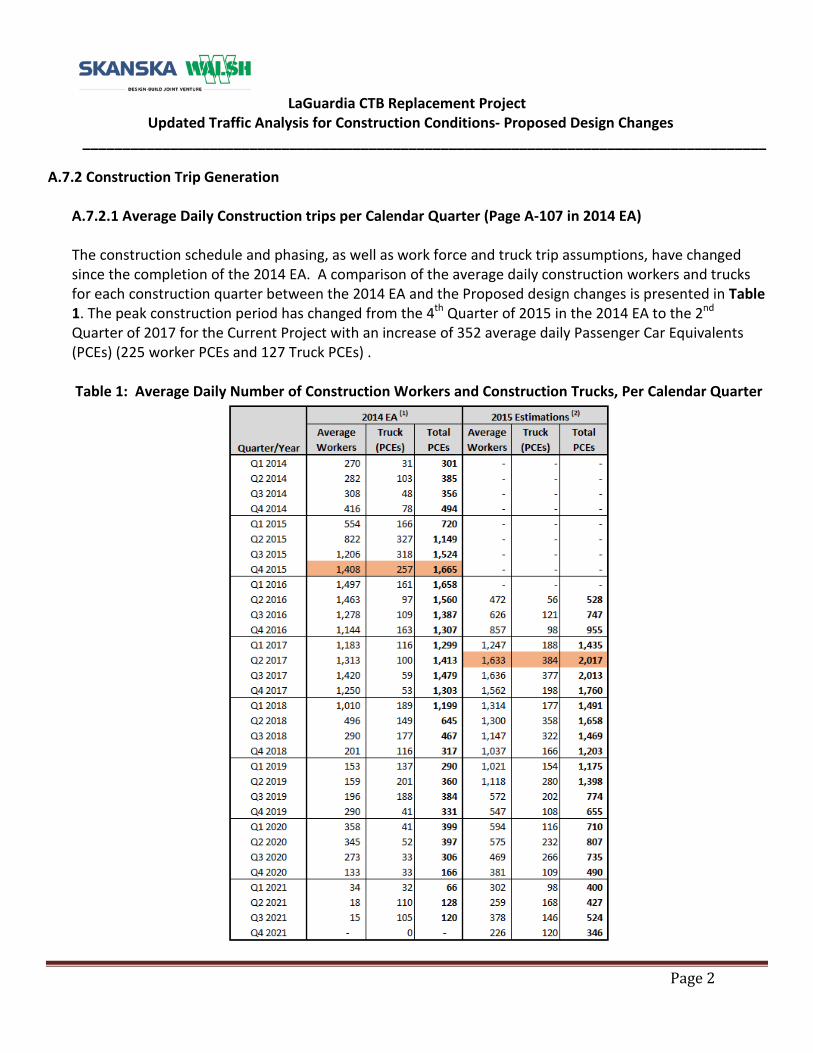
LaGuardia CTB Replacement Project Updated Traffic Analysis for Construction Conditions- Proposed Design Changes
______________________________________________________________________________________
A.7.2 Construction Trip Generation
A.7.2.1 Average Daily Construction trips per Calendar Quarter (Page A-107 in 2014 EA)
The construction schedule and phasing, as well as work force and truck trip assumptions, have changed since the completion of the 2014 EA. A comparison of the average daily construction workers and trucks for each construction quarter between the 2014 EA and the Proposed design changes is presented in Table 1. The peak construction period has changed from the 4th Quarter of 2015 in the 2014 EA to the 2nd
Quarter of 2017 for the Current Project with an increase of 352 average daily Passenger Car Equivalents (PCEs) (225 worker PCEs and 127 Truck PCEs) .
Table 1: Average Daily Number of Construction Workers and Construction Trucks, Per Calendar Quarter
Page 2
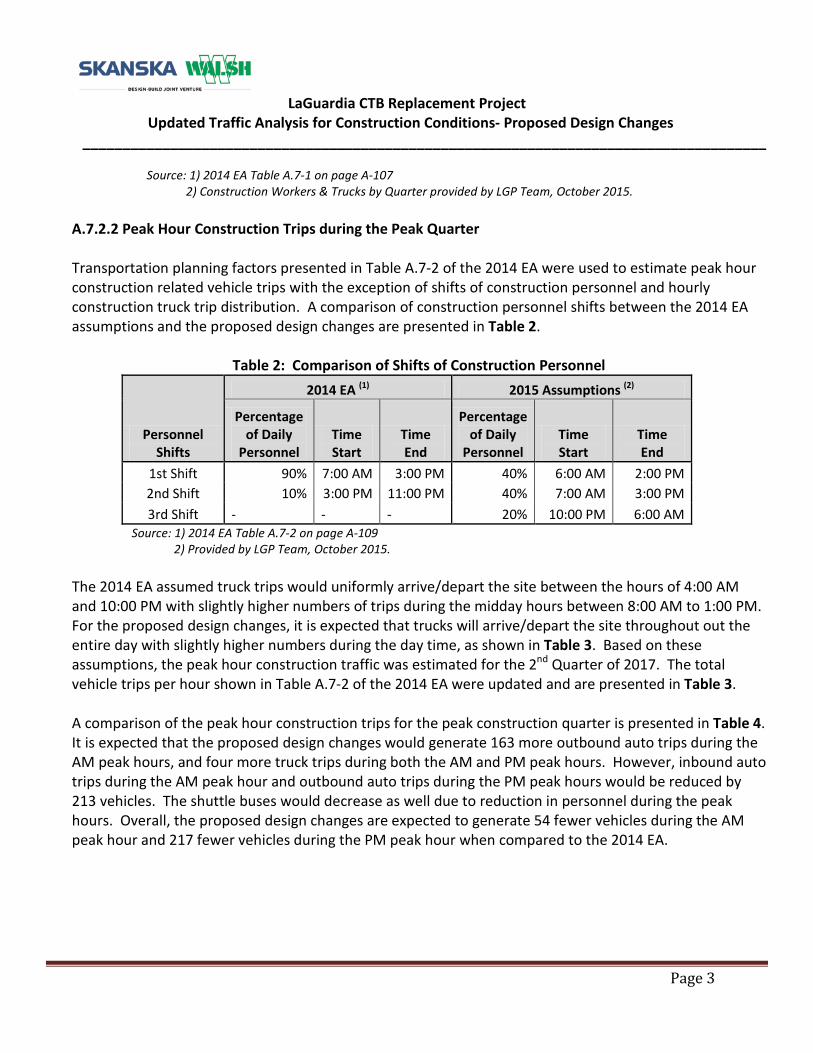
LaGuardia CTB Replacement Project Updated Traffic Analysis for Construction Conditions- Proposed Design Changes
______________________________________________________________________________________
Source: 1) 2014 EA Table A.7-1 on page A-107 2) Construction Workers & Trucks by Quarter provided by LGP Team, October 2015.
A.7.2.2 Peak Hour Construction Trips during the Peak Quarter Transportation planning factors presented in Table A.7-2 of the 2014 EA were used to estimate peak hour construction related vehicle trips with the exception of shifts of construction personnel and hourly construction truck trip distribution. A comparison of construction personnel shifts between the 2014 EA assumptions and the proposed design changes are presented in Table 2.
Table 2: Comparison of Shifts of Construction Personnel
Personnel Shifts
2014 EA (1) 2015 Assumptions (2)
Percentage of Daily
Personnel Time Start
Time End
Percentage of Daily
Personnel Time Start
Time End
1st Shift 90% 7:00 AM 3:00 PM 40% 6:00 AM 2:00 PM 2nd Shift 10% 3:00 PM 11:00 PM 40% 7:00 AM 3:00 PM 3rd Shift - - - 20% 10:00 PM 6:00 AM
Source: 1) 2014 EA Table A.7-2 on page A-109 2) Provided by LGP Team, October 2015.
The 2014 EA assumed truck trips would uniformly arrive/depart the site between the hours of 4:00 AM and 10:00 PM with slightly higher numbers of trips during the midday hours between 8:00 AM to 1:00 PM. For the proposed design changes, it is expected that trucks will arrive/depart the site throughout out the entire day with slightly higher numbers during the day time, as shown in Table 3. Based on these assumptions, the peak hour construction traffic was estimated for the 2nd Quarter of 2017. The total vehicle trips per hour shown in Table A.7-2 of the 2014 EA were updated and are presented in Table 3. A comparison of the peak hour construction trips for the peak construction quarter is presented in Table 4. It is expected that the proposed design changes would generate 163 more outbound auto trips during the AM peak hours, and four more truck trips during both the AM and PM peak hours. However, inbound auto trips during the AM peak hour and outbound auto trips during the PM peak hours would be reduced by 213 vehicles. The shuttle buses would decrease as well due to reduction in personnel during the peak hours. Overall, the proposed design changes are expected to generate 54 fewer vehicles during the AM peak hour and 217 fewer vehicles during the PM peak hour when compared to the 2014 EA.
Page 3
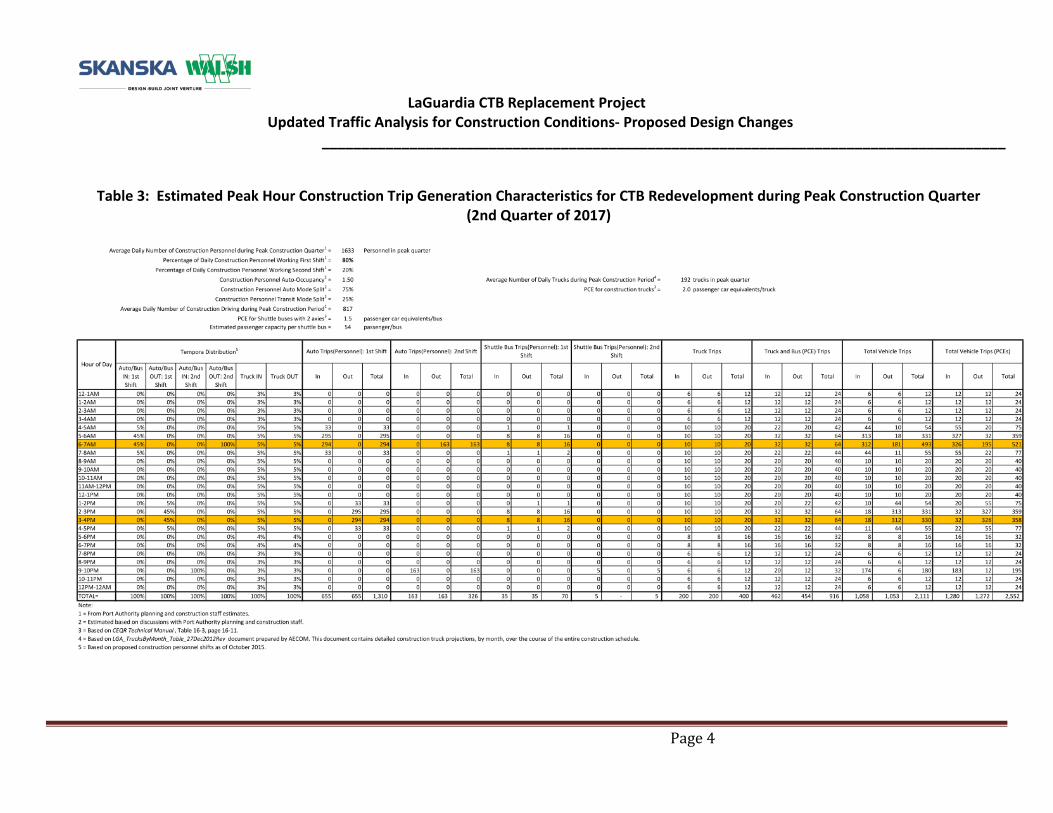
LaGuardia CTB Replacement Project Updated Traffic Analysis for Construction Conditions- Proposed Design Changes
______________________________________________________________________________________
Table 3: Estimated Peak Hour Construction Trip Generation Characteristics for CTB Redevelopment during Peak Construction Quarter (2nd Quarter of 2017)
Page 4

LaGuardia CTB Replacement Project Updated Traffic Analysis for Construction Conditions- Proposed Design Changes
______________________________________________________________________________________
Table 4: Comparison of Peak Construction peak hour trips
Vehicle Type
2015 Construction Condition (2014 EA) (1)
2017 Construction Condition (2) Net Change
Direction AM (6-7AM)
PM (3-4PM)
AM (6-7AM)
PM (3-4PM)
AM (6-7AM)
PM (3-4PM)
Auto (Personnel)
In 507 0 294 0 -213 0 Out 0 507 163 294 163 -213
Trucks In 6 6 10 10 4 4
Out 6 6 10 10 4 4
Buses In 14 14 8 8 -6 -6
Out 14 14 8 8 -6 -6 Total 547 547 493 330 -54 -217
Source: 1) 2014 EA Table A.7-2 on page A-109 2) WSP/Parsons Brinckerhoff.
A.7.2.3 Construction Trip Distribution
Construction trip distribution patterns for personnel vehicles and shuttle buses are expected to be the same as for the previously approved (2014) design, presented in Figure 1. An average auto occupancy rate of 1.50 and an auto mode share of 75 percent were assumed for construction personnel. The same passenger car equivalent (PCE) assumptions of 1.0 PCE per auto, 1.5 PCEs per shuttle bus, and 2.0 PCES per truck were also used for the proposed design changes.
For trucks, the 2014 EA assumed all trucks would enter the construction site and staging and queuing areas would be at the airfield near construction sites. For the proposed design changes, three off-site trailer staging and queuing areas are proposed at Ingrahams Mountain, Marina East Gate 14, and the NY Times Facility. The truck origin/destination assumptions remain the same as those in the previously approved (2014) design: 35% from/to the BQE and points west, 35% from/to the Northern Blvd and Van Wyck Expressway, and 30% from/to The Northern Blvd and LIE. These trucks will be evenly distributed to the three staging/queuing areas: 34% to Ingraham’s Mountain, 33% to Marina East Gate 14, and 33% to the NY Times Facility. The average queue time at the staging areas will be 20 to 30 minutes. Trucks will then leave the staging/queuing areas and travel to the construction site within the same hour. As with the previously approved (2014) design, the truck trip distribution are based on the NYCDOT “local” and “through” truck routes including Astoria Boulevard and 94th Street-Junction Boulevard.
A.7.2.4 Construction Trip Assignment
A comparison of construction trips generated during the peak construction conditions for each of the 21 analyzed intersections are presented in Table 5.
Page 5
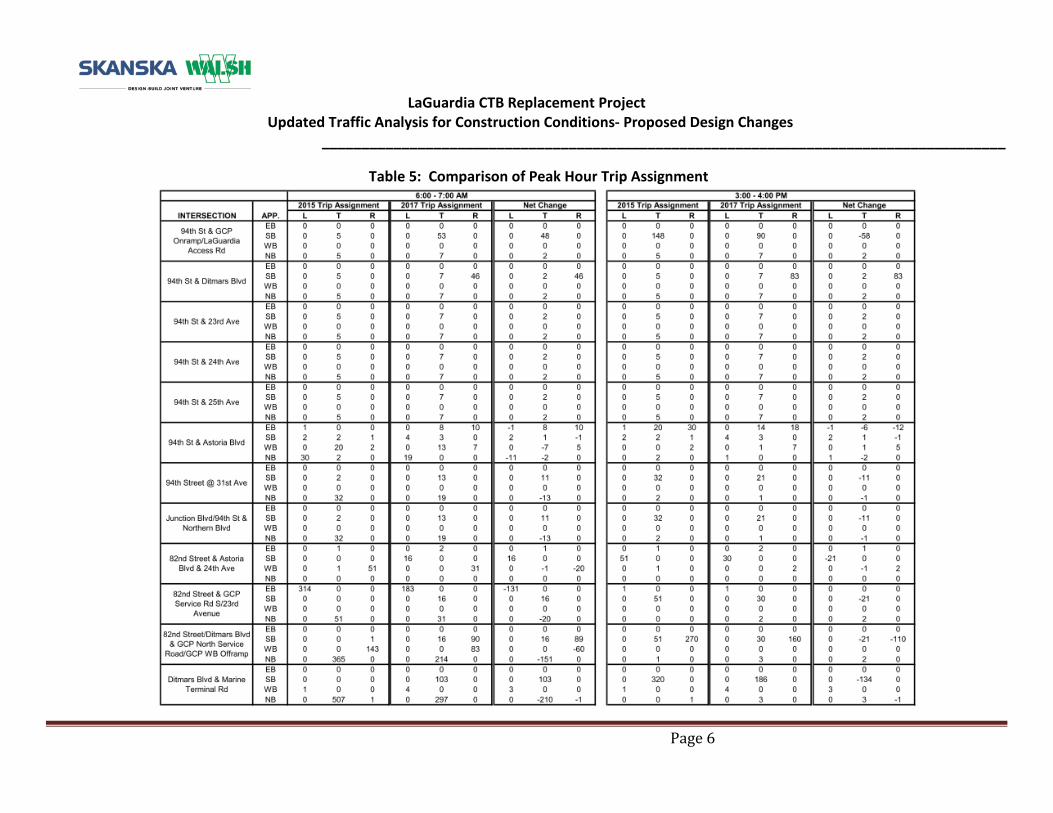
LaGuardia CTB Replacement Project Updated Traffic Analysis for Construction Conditions- Proposed Design Changes
______________________________________________________________________________________
Table 5: Comparison of Peak Hour Trip Assignment
Page 6
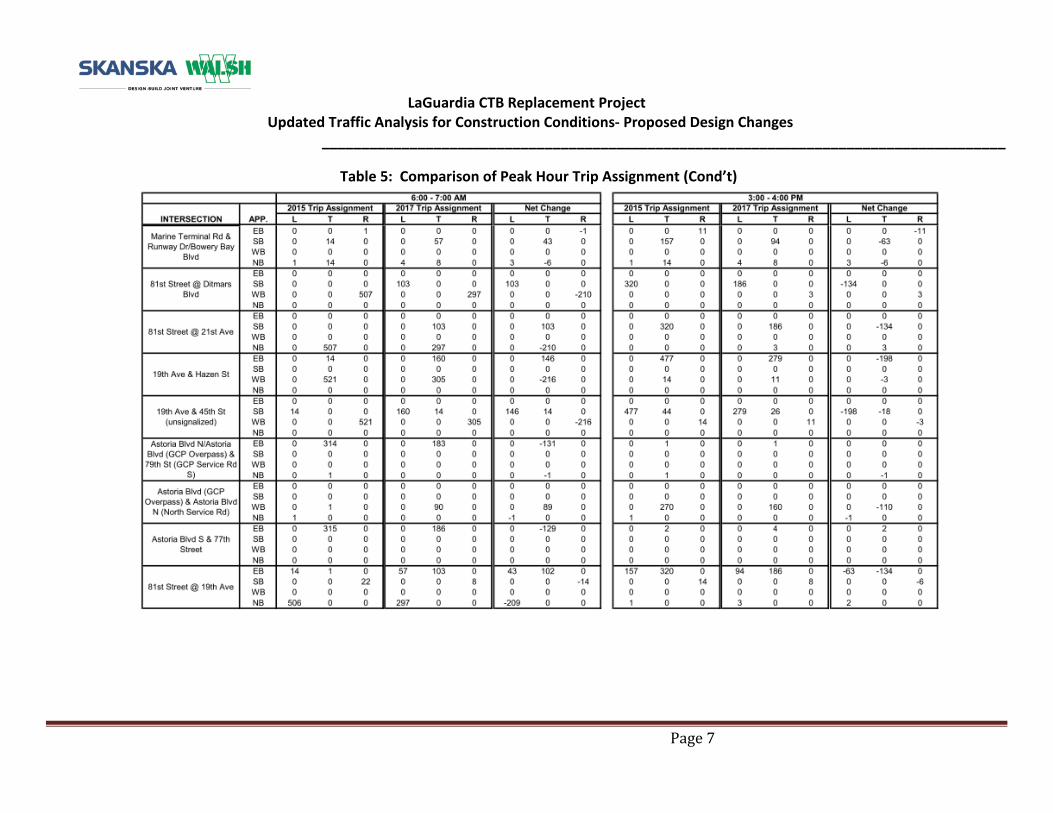
LaGuardia CTB Replacement Project Updated Traffic Analysis for Construction Conditions- Proposed Design Changes
______________________________________________________________________________________
Table 5: Comparison of Peak Hour Trip Assignment (Cond’t)
Page 7
LaGuardia CTB Replacement Project Updated Traffic Analysis for Construction Conditions- Proposed Design Changes
______________________________________________________________________________________
A.7.6 Operations Analyses
A.7.6.1 Existing Conditions
As presented in Figure 1, a total of 21 intersections (20 existing intersection plus one newly construction intersection during the peak construction condition) were analyzed during the 6:00-7:00 AM and 3:00-4:00 PM peak hours for the Construction Conditions- previously approved (2014) design scenario. These same intersections were analyzed during the same peak hours for the proposed design changes. As 2014 traffic data are available for some of the intersections as part of the LGA 2014 Data Collection Program, the base year for this analysis changes from 2012 Existing Condition in the previously approved (2014) design to the 2014 Existing Condition for the proposed design changes. As presented in Table 6, the LGA 2014 Data Collection Program (2014 Counts) were used to establish the 2014 Existing Condition. For locations without available 2014 traffic data, the 2012 traffic volumes from the 2014 EA were utilized. A compound background growth rate of 1.0 percent (0.5 percent per year) was applied to the 2012 data to establish the 2014 Existing Conditions. A copy of the traffic volume comparison tables for the Existing Conditions is provided in Exhibit A.
Traffic improvements have been implemented at two of the analyzed intersections since the 2014 EA was prepared and these improvements were reflected in the 2014 existing analysis for the proposed design changes. These improvements included the lane modification at the Ditmars Blvd/94th St intersection and the widening of the 82nd St Westbound Off-Ramp. A comparison of the capacity analysis results are presented in Table 7.
Page 8
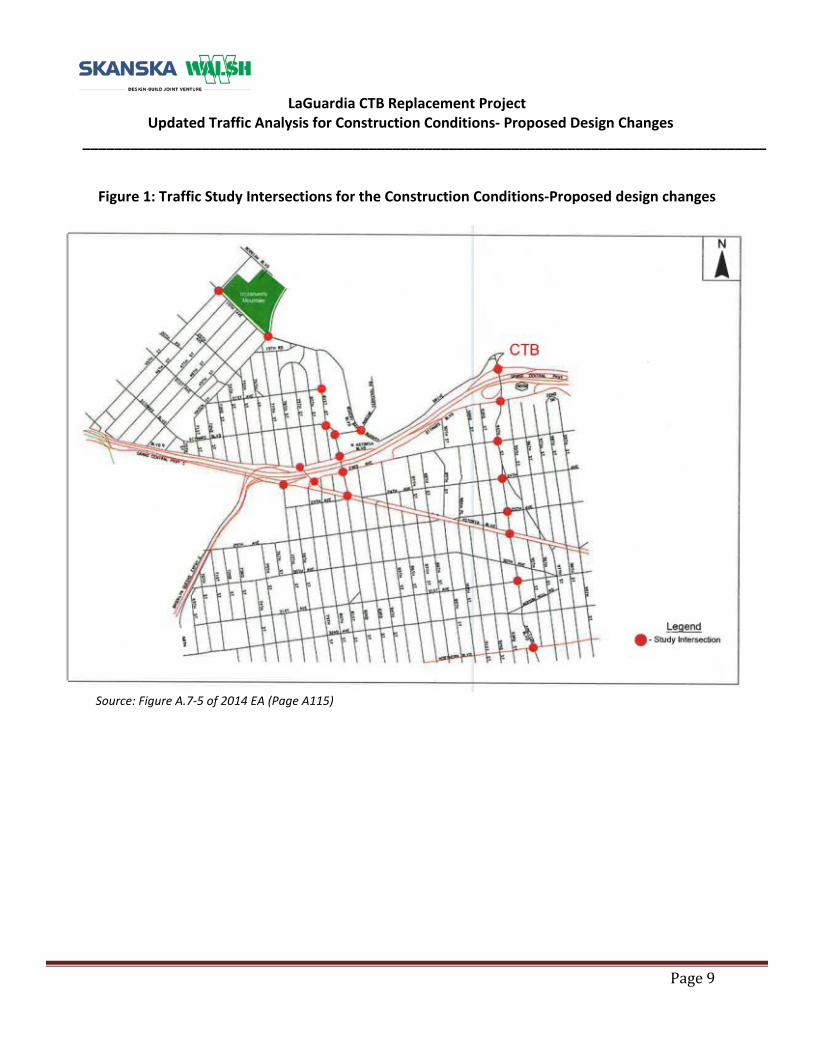
LaGuardia CTB Replacement Project Updated Traffic Analysis for Construction Conditions- Proposed Design Changes
______________________________________________________________________________________
Figure 1: Traffic Study Intersections for the Construction Conditions-Proposed design changes
Source: Figure A.7-5 of 2014 EA (Page A115)
Page 9
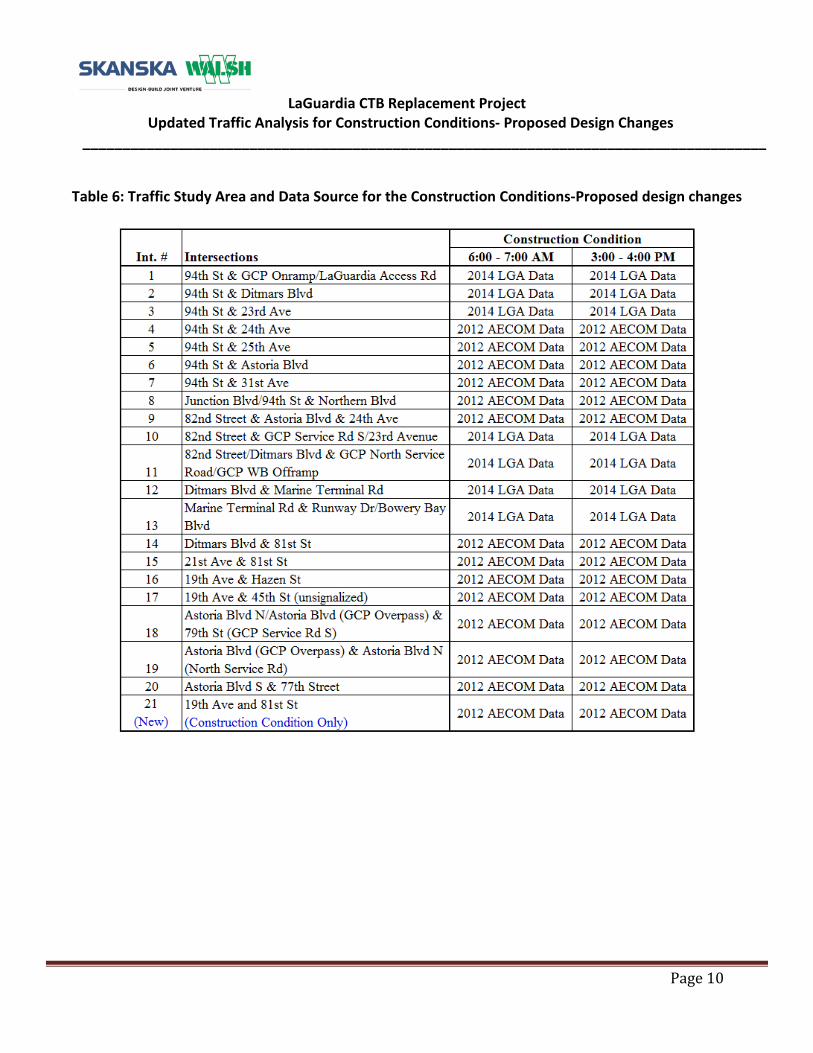
LaGuardia CTB Replacement Project Updated Traffic Analysis for Construction Conditions- Proposed Design Changes
______________________________________________________________________________________
Table 6: Traffic Study Area and Data Source for the Construction Conditions-Proposed design changes
Page 10
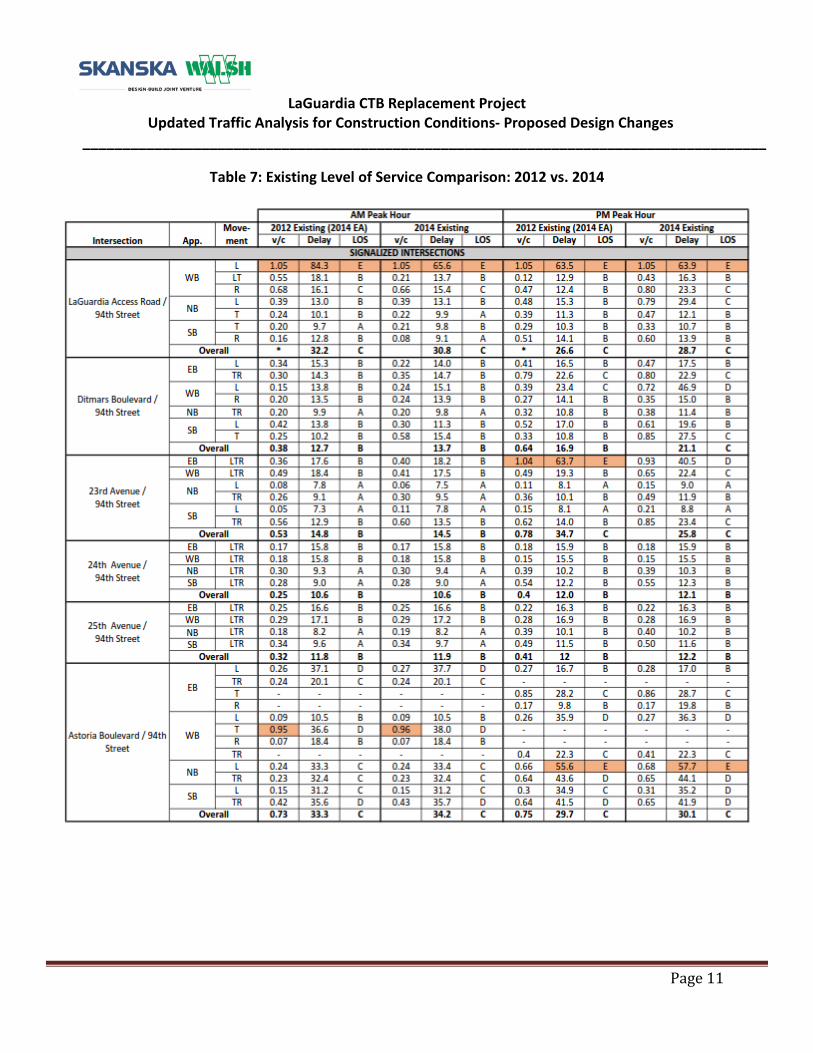
LaGuardia CTB Replacement Project Updated Traffic Analysis for Construction Conditions- Proposed Design Changes
______________________________________________________________________________________
Table 7: Existing Level of Service Comparison: 2012 vs. 2014
Page 11
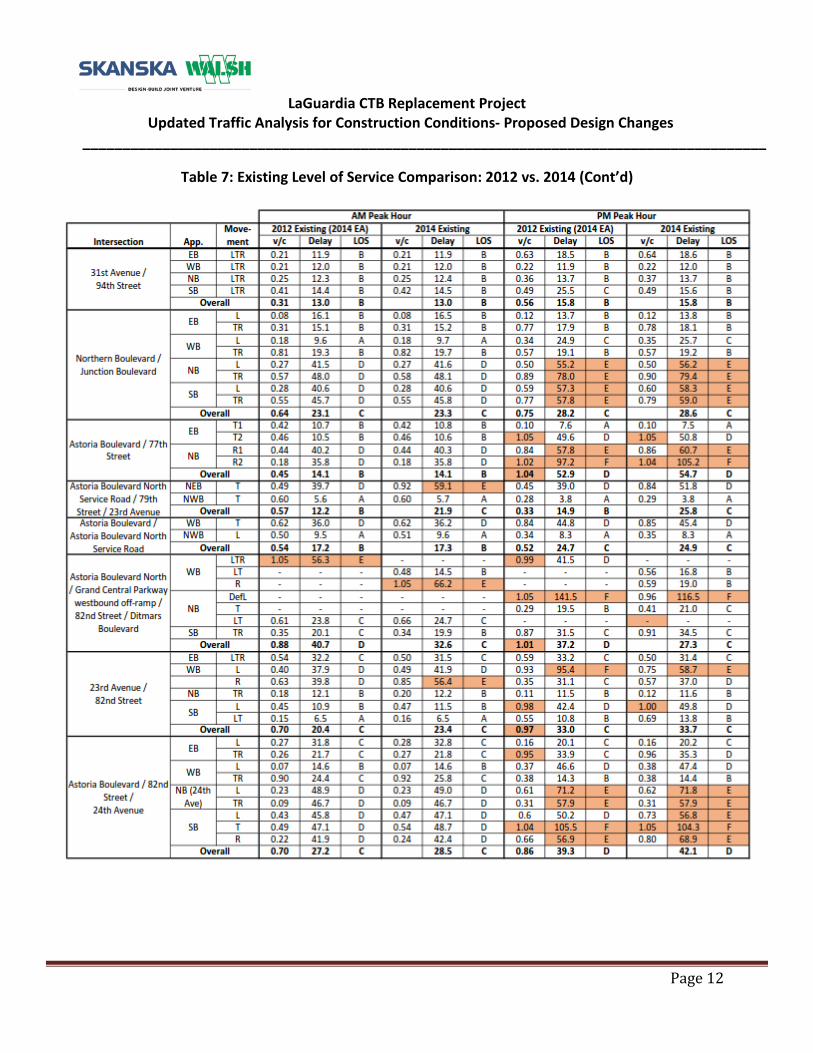
LaGuardia CTB Replacement Project Updated Traffic Analysis for Construction Conditions- Proposed Design Changes
______________________________________________________________________________________
Table 7: Existing Level of Service Comparison: 2012 vs. 2014 (Cont’d)
Page 12
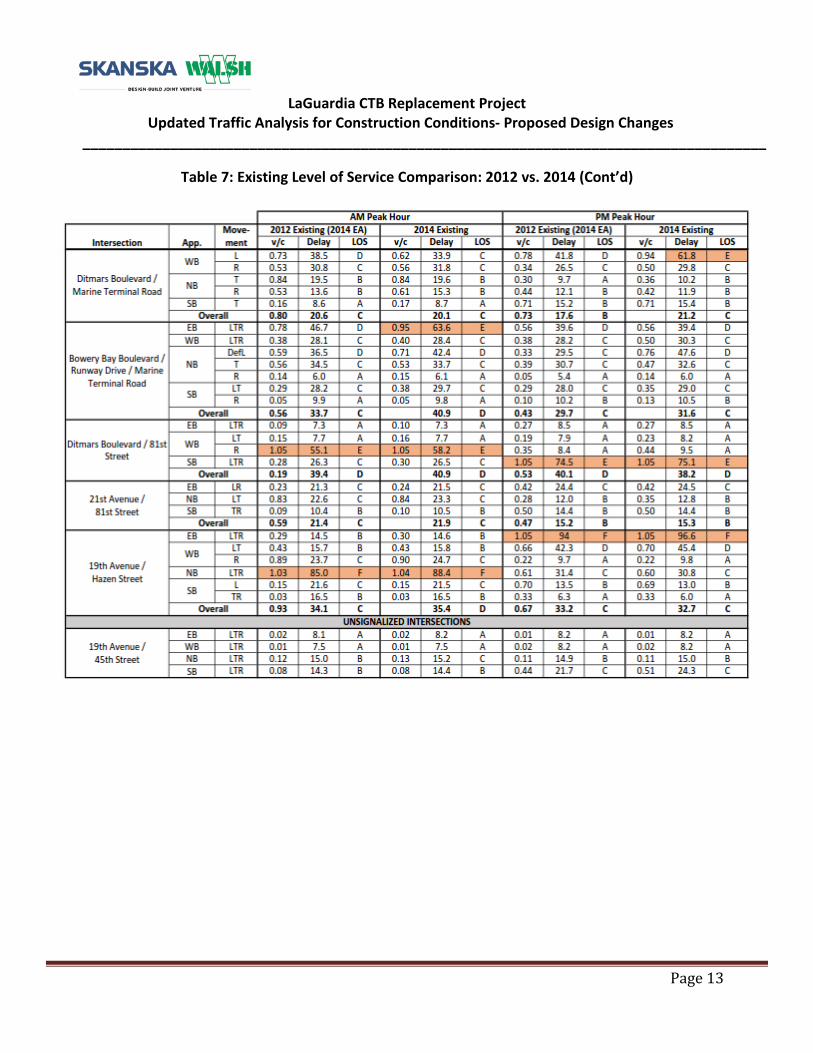
LaGuardia CTB Replacement Project Updated Traffic Analysis for Construction Conditions- Proposed Design Changes
______________________________________________________________________________________
Table 7: Existing Level of Service Comparison: 2012 vs. 2014 (Cont’d)
Page 13
LaGuardia CTB Replacement Project Updated Traffic Analysis for Construction Conditions- Proposed Design Changes
______________________________________________________________________________________
A.7.6.2 Future Without Construction Conditions
A compounded total growth rate of 1.51 percent was applied to the 2014 existing traffic volumes to establish the Future Without Construction traffic volumes in 2017. It should be noted that the 2014 EA included the Runway Safety Area Enhancement (RSAE) project in the 2015 peak construction condition. The runway project started in 2014 and is expected to be completed at the end of 2016. Since the peak construction year for the proposed design changes is expected to occur in the 2nd quarter of 2017, vehicle trips associated with the RSAE project were not included in the 2017 peak construction condition. A copy of the traffic volume comparison tables for the Future Without Construction Conditions is provided in Exhibit A.
A comparison of LOS for the Future Without Construction Conditions is presented in Table 8 for the AM and PM Peak Hours.
Page 14
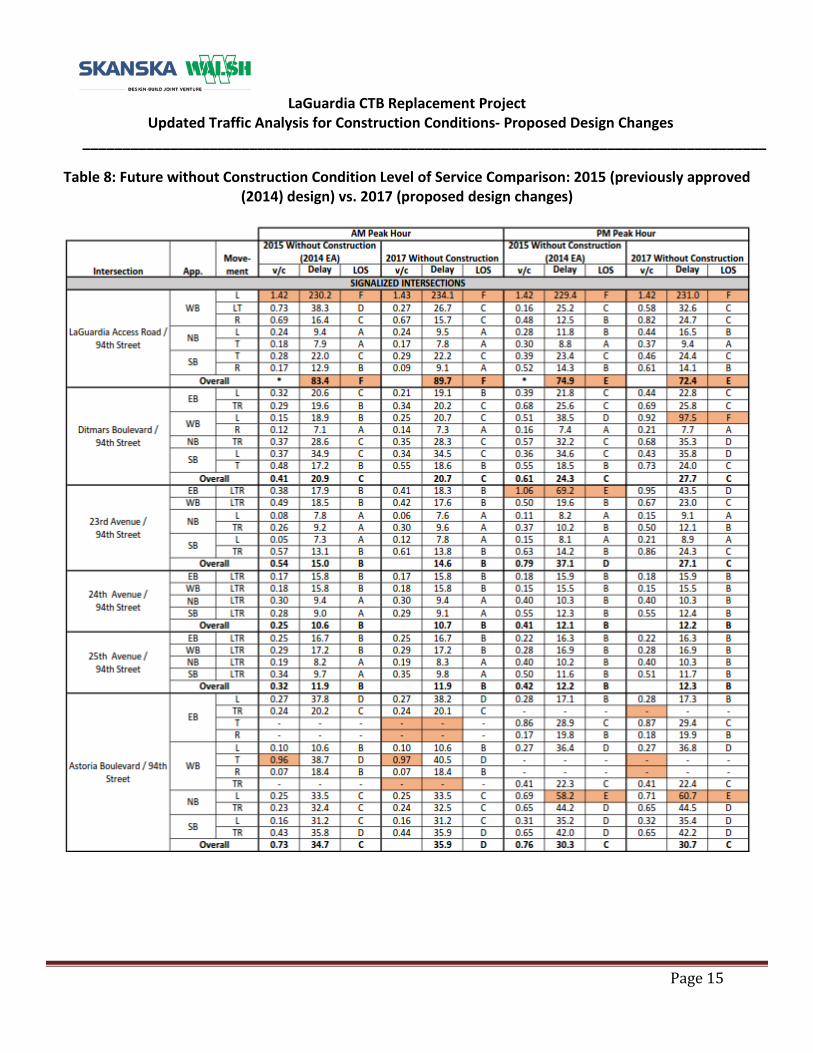
LaGuardia CTB Replacement Project Updated Traffic Analysis for Construction Conditions- Proposed Design Changes
______________________________________________________________________________________
Table 8: Future without Construction Condition Level of Service Comparison: 2015 (previously approved (2014) design) vs. 2017 (proposed design changes)
Page 15
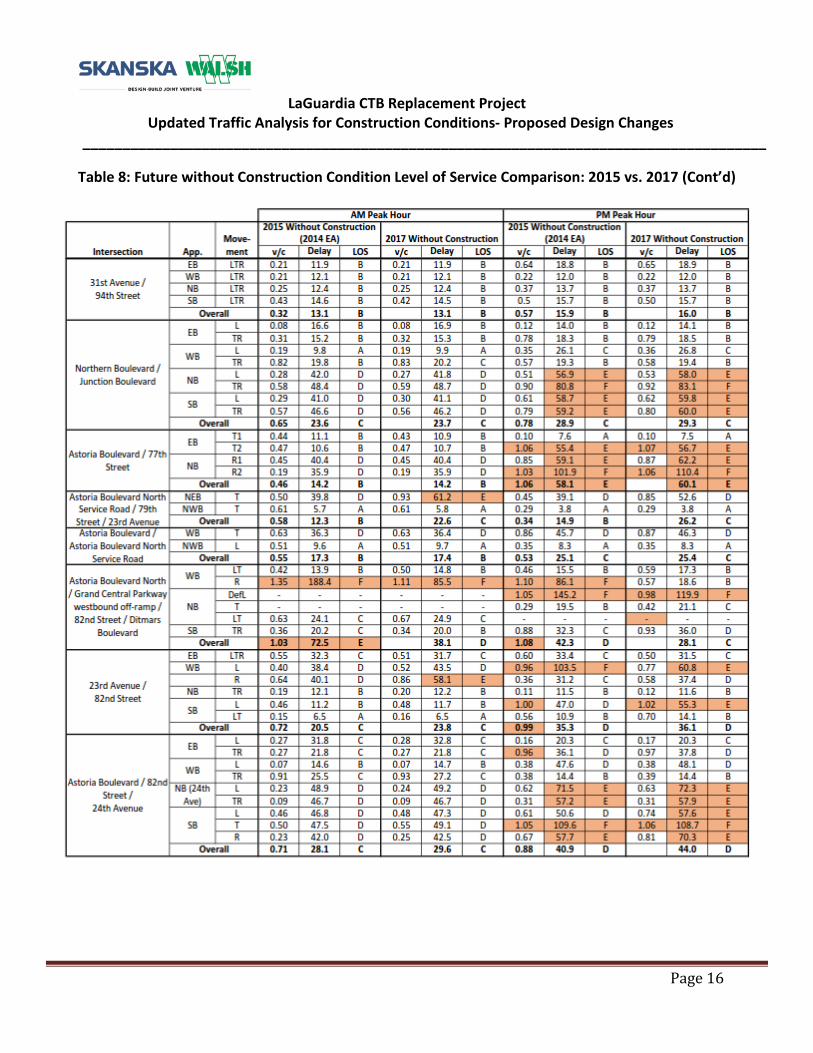
LaGuardia CTB Replacement Project Updated Traffic Analysis for Construction Conditions- Proposed Design Changes
______________________________________________________________________________________
Table 8: Future without Construction Condition Level of Service Comparison: 2015 vs. 2017 (Cont’d)
Page 16
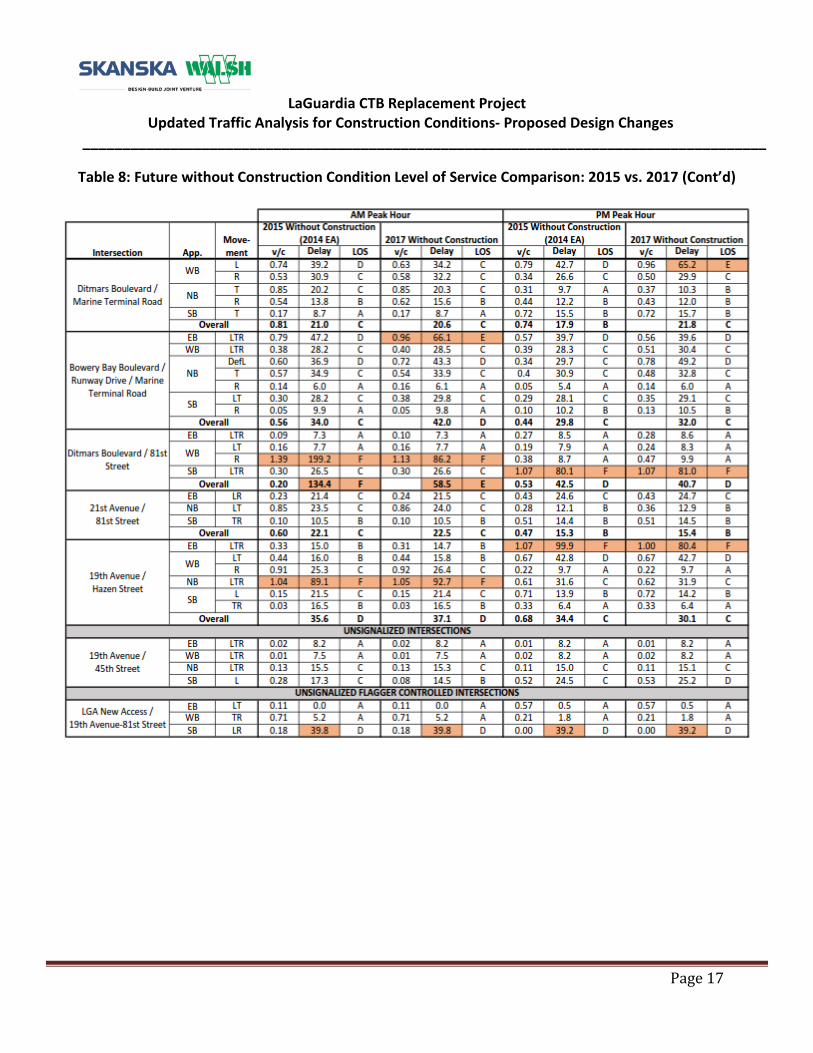
LaGuardia CTB Replacement Project Updated Traffic Analysis for Construction Conditions- Proposed Design Changes
______________________________________________________________________________________
Table 8: Future without Construction Condition Level of Service Comparison: 2015 vs. 2017 (Cont’d)
Page 17

LaGuardia CTB Replacement Project Updated Traffic Analysis for Construction Conditions- Proposed Design Changes
______________________________________________________________________________________
A.7.6.3 Future With Construction Conditions - Proposed design changes
Construction trips generated during the peak construction period for the proposed design changes (Table 5) were added to the 2017 Future Without Condition to develop traffic volumes for the 2017 Future WithConstruction Conditions-proposed design changes. A copy of the traffic volume comparison tables for the Future Without Construction Conditions is provided in Exhibit A.
Intersection capacity analysis was conducted for the same 21 intersections for the 2017 Future With Construction Conditions. The results of the Future Without Construction and Future With Construction conditions were then compared in accordance with CEQR Technical Manual criteria. This was done to identify any critical changes in projected traffic operations associated with construction of the proposed design changes, as well as any transportation improvements that would be required to ensure acceptable traffic operations with the addition of construction traffic during peak construction peak time periods. As shown in the 2014 EA, transportation improvements were recommended for 12 of the 21 analyzed intersections. Some of these improvements were adjusted or eliminated to reflect projected traffic conditions during the peak construction condition in 2017 and are documented in Table 9.
Table 10 compares the weekday AM and PM peak hour intersection capacity analysis results for the Future Without Construction with those under the Future With Construction Condition with the transportation improvements identified in Table 9. With these improvements in place, no significant impacts are projected during the construction period in accordance with the CEQR Technical Manual criteria. A comparison of the construction capacity analysis results for the 2014 EA and the proposed design changes are presented in Table 11.
Page 18
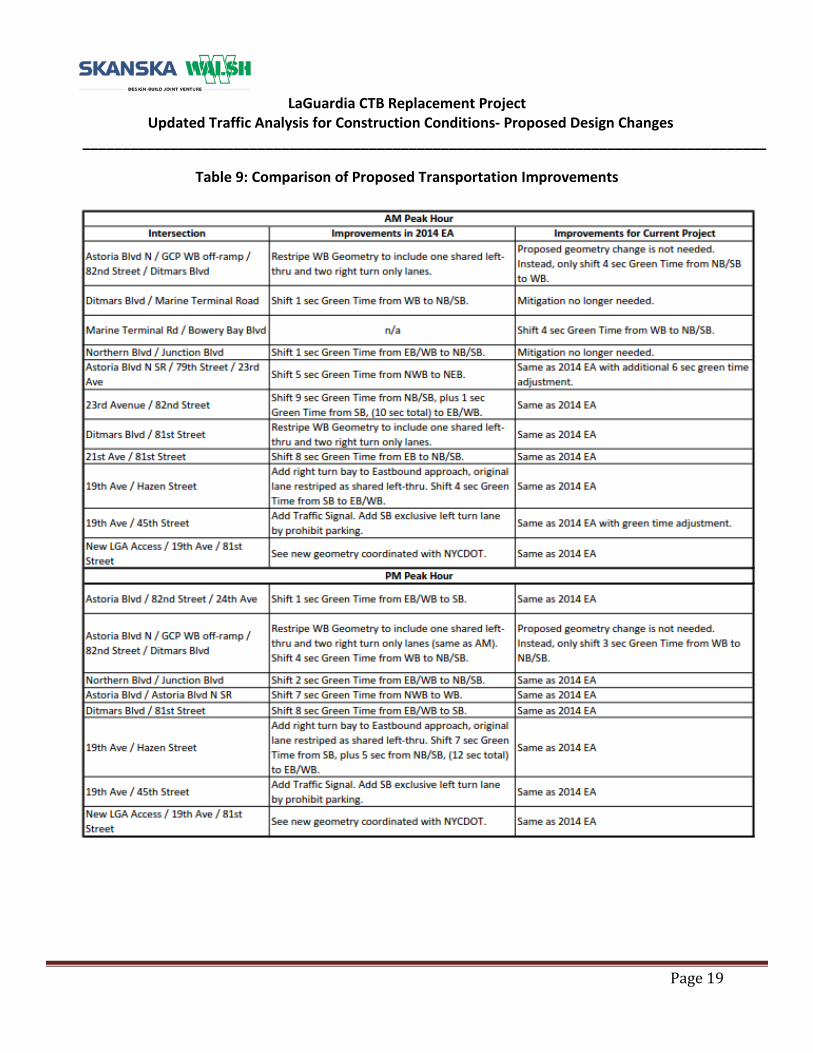
LaGuardia CTB Replacement Project Updated Traffic Analysis for Construction Conditions- Proposed Design Changes
______________________________________________________________________________________
Table 9: Comparison of Proposed Transportation Improvements
Page 19
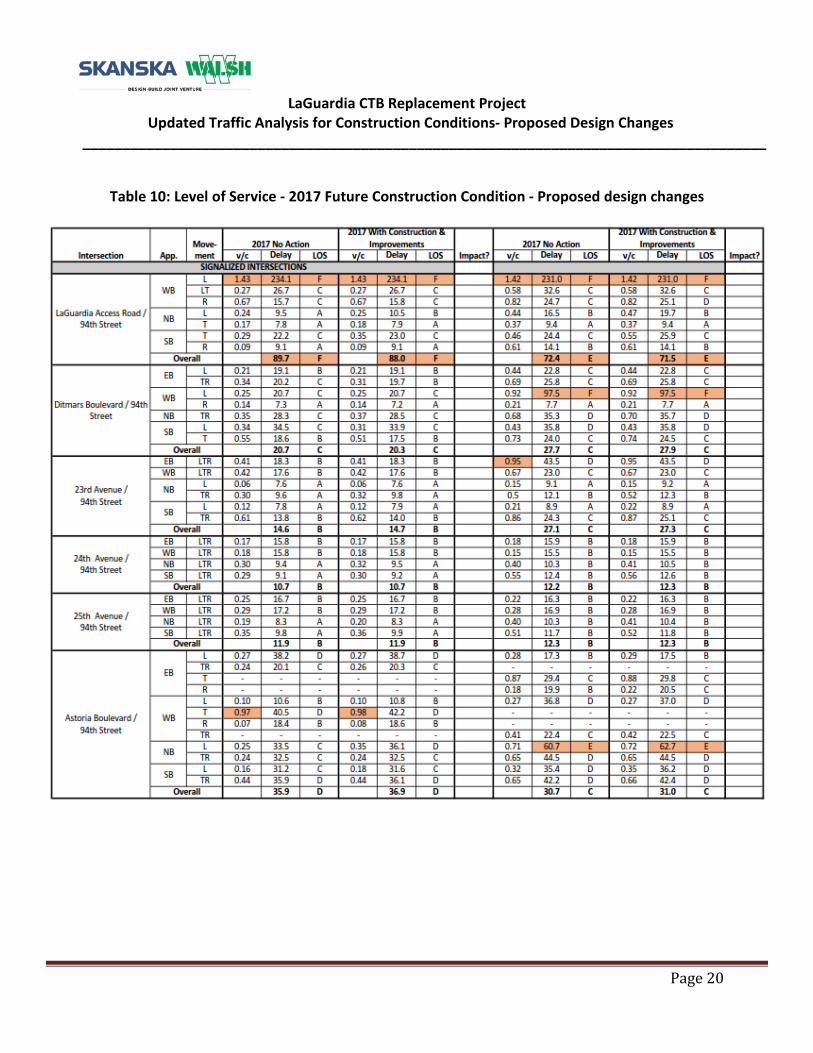
LaGuardia CTB Replacement Project Updated Traffic Analysis for Construction Conditions- Proposed Design Changes
______________________________________________________________________________________
Table 10: Level of Service - 2017 Future Construction Condition - Proposed design changes
Page 20
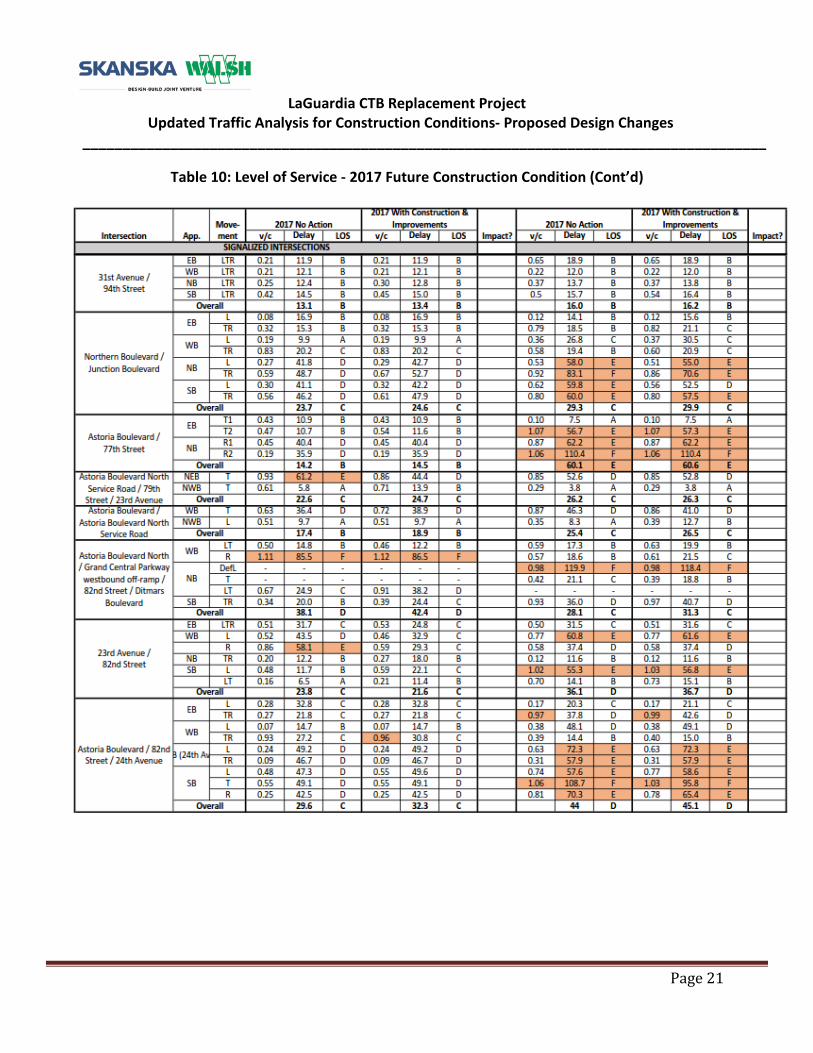
LaGuardia CTB Replacement Project Updated Traffic Analysis for Construction Conditions- Proposed Design Changes
______________________________________________________________________________________
Table 10: Level of Service - 2017 Future Construction Condition (Cont’d)
Page 21
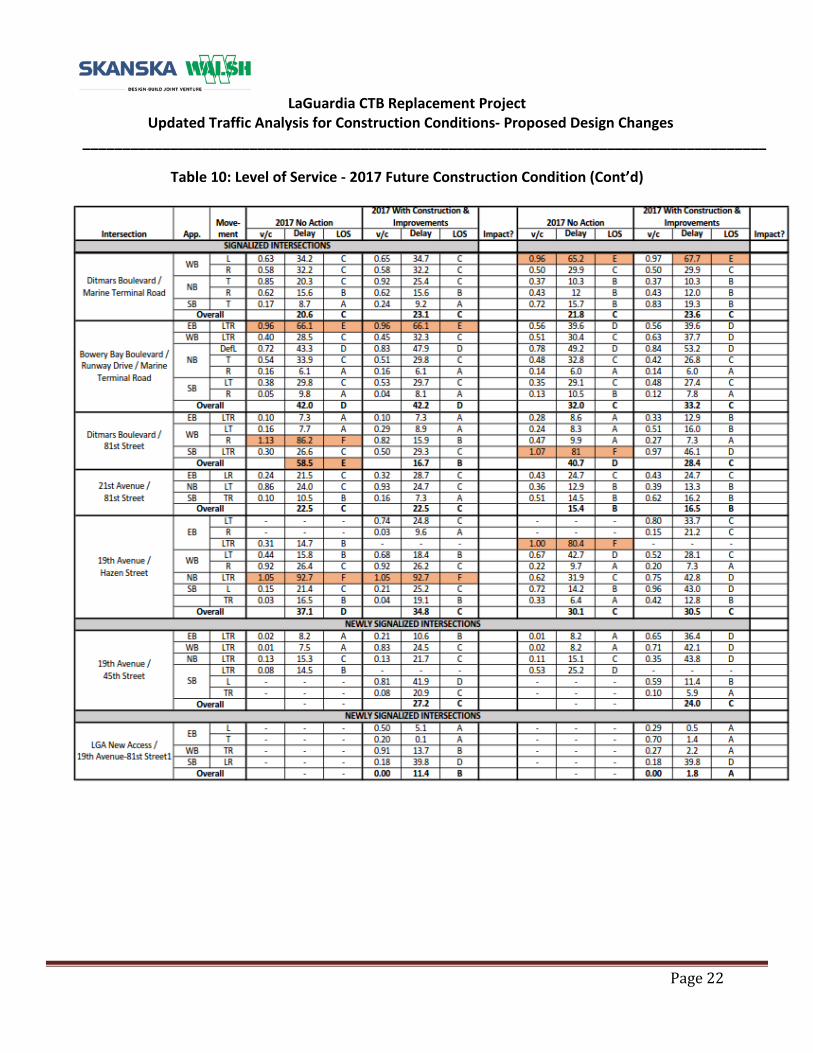
LaGuardia CTB Replacement Project Updated Traffic Analysis for Construction Conditions- Proposed Design Changes
______________________________________________________________________________________
Table 10: Level of Service - 2017 Future Construction Condition (Cont’d)
Page 22

LaGuardia CTB Replacement Project Updated Traffic Analysis for Construction Conditions- Proposed Design Changes
______________________________________________________________________________________
Table 11: Future Construction Condition LOS Comparison: 2015 vs. 2017
Page 23

LaGuardia CTB Replacement Project Updated Traffic Analysis for Construction Conditions- Proposed Design Changes
______________________________________________________________________________________
Table 11: Future Construction Condition LOS Comparison: 2015 vs. 2017 (Cont’d)
Page 24
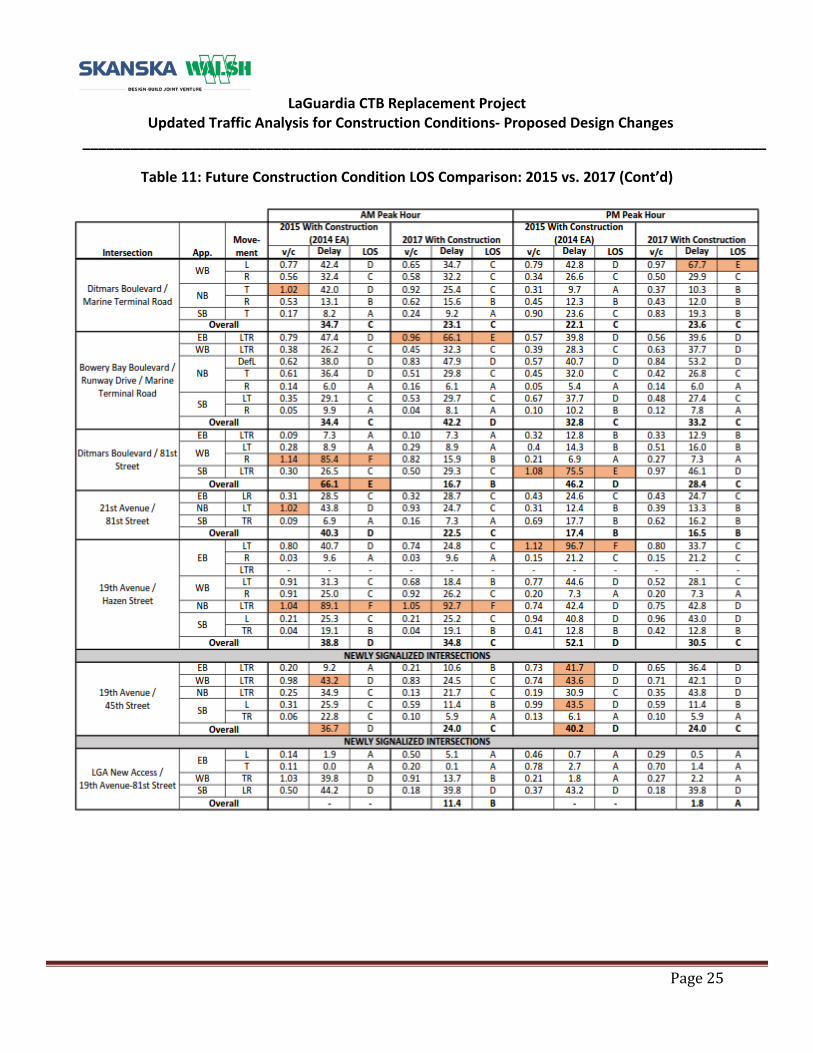
LaGuardia CTB Replacement Project Updated Traffic Analysis for Construction Conditions- Proposed Design Changes
______________________________________________________________________________________
Table 11: Future Construction Condition LOS Comparison: 2015 vs. 2017 (Cont’d)
Page 25
LaGuardia CTB Replacement Project Updated Traffic Analysis for Construction Conditions- Proposed Design Changes
______________________________________________________________________________________
A.7.6.4 Conclusion Based on the traffic analysis conducted for the peak construction period for the proposed design changes in the 2nd Quarter of 2017, it was determined that the potential traffic impact as a result of the proposed design changes is comparable to, or less than the peak construction condition analyzed in the 2014 EA for the previously approved (2014) design. The findings of the traffic analysis results indicate that no additional unmitigated impacts are identified under the peak construction condition for the proposed design changes, when compared with the peak construction condition for the project analyzed in the 2014 EA. As stated in the 2014 EA (pages A-131 and A-135), the proposed improvements are subject to review and approval by the New York City Department of Transportation (NYCDOT). A traffic monitoring program, in coordination with NYCDOT, was recommended throughout the duration of the construction period and the monitoring program efforts should be conducted annually, or at an agreed-upon frequency to be determined as part of on-going coordination efforts between the Port Authority and NYCDOT during the construction period. The NYCDOT reviews and approvals, the traffic monitoring, and other coordination will still take place for the proposed design changes.
Page 26

LaGuardia CTB Replacement Project Updated Traffic Analysis for the Construction Conditions
______________________________________________________________________________________
Exhibit A – Traffic Volume Comparison Tables
Confidential Page 27
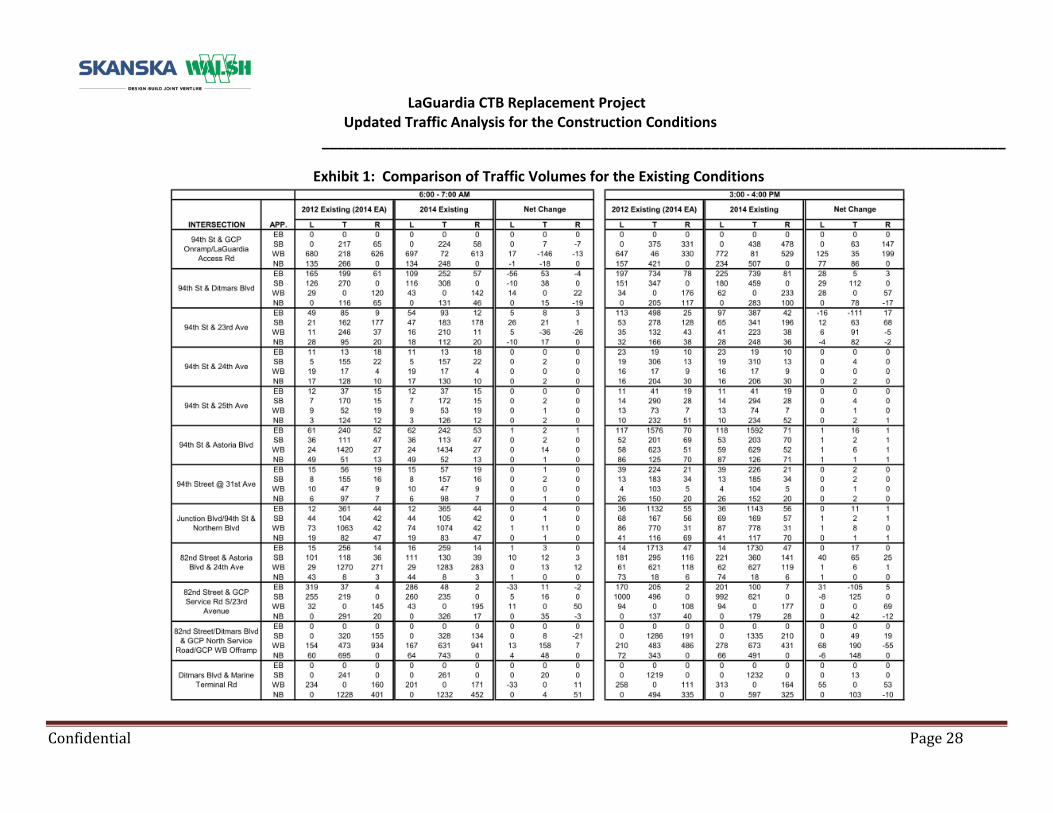
LaGuardia CTB Replacement Project Updated Traffic Analysis for the Construction Conditions
______________________________________________________________________________________
Exhibit 1: Comparison of Traffic Volumes for the Existing Conditions
Confidential Page 28
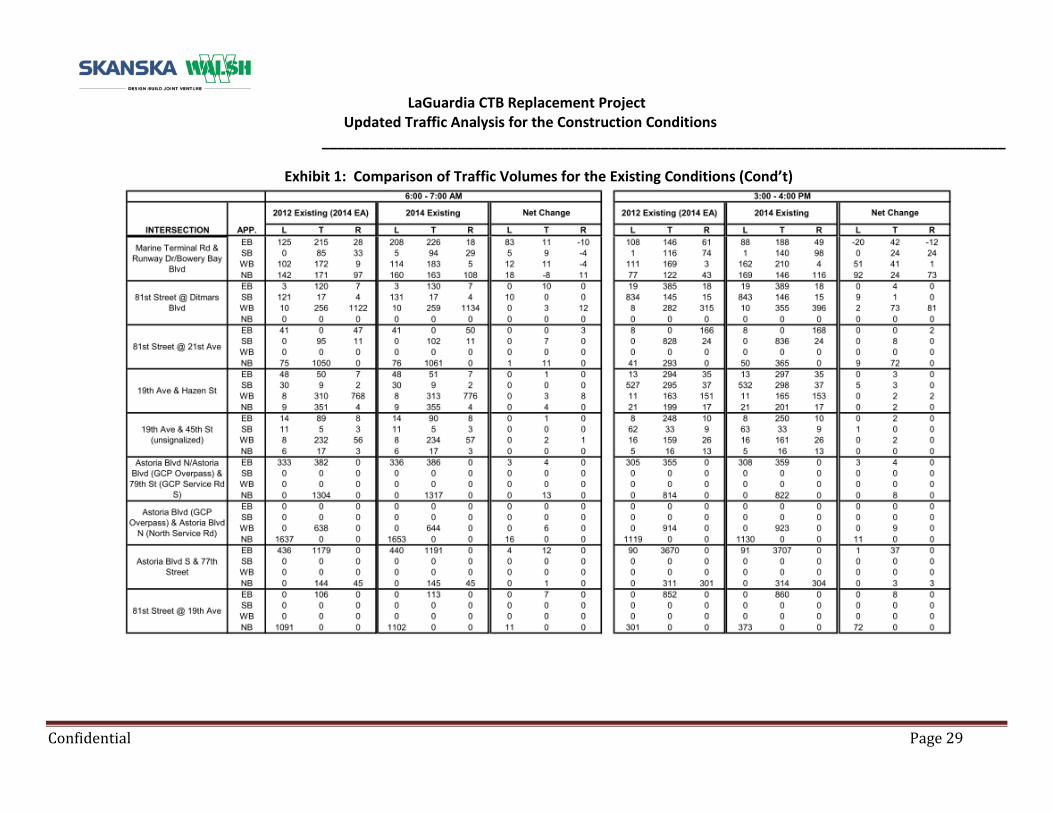
LaGuardia CTB Replacement Project Updated Traffic Analysis for the Construction Conditions
______________________________________________________________________________________
Exhibit 1: Comparison of Traffic Volumes for the Existing Conditions (Cond’t)
Confidential Page 29

LaGuardia CTB Replacement Project Updated Traffic Analysis for the Construction Conditions
______________________________________________________________________________________
Exhibit 2: Comparison of Traffic Volumes for the Future Without Construction Conditions
Confidential Page 30
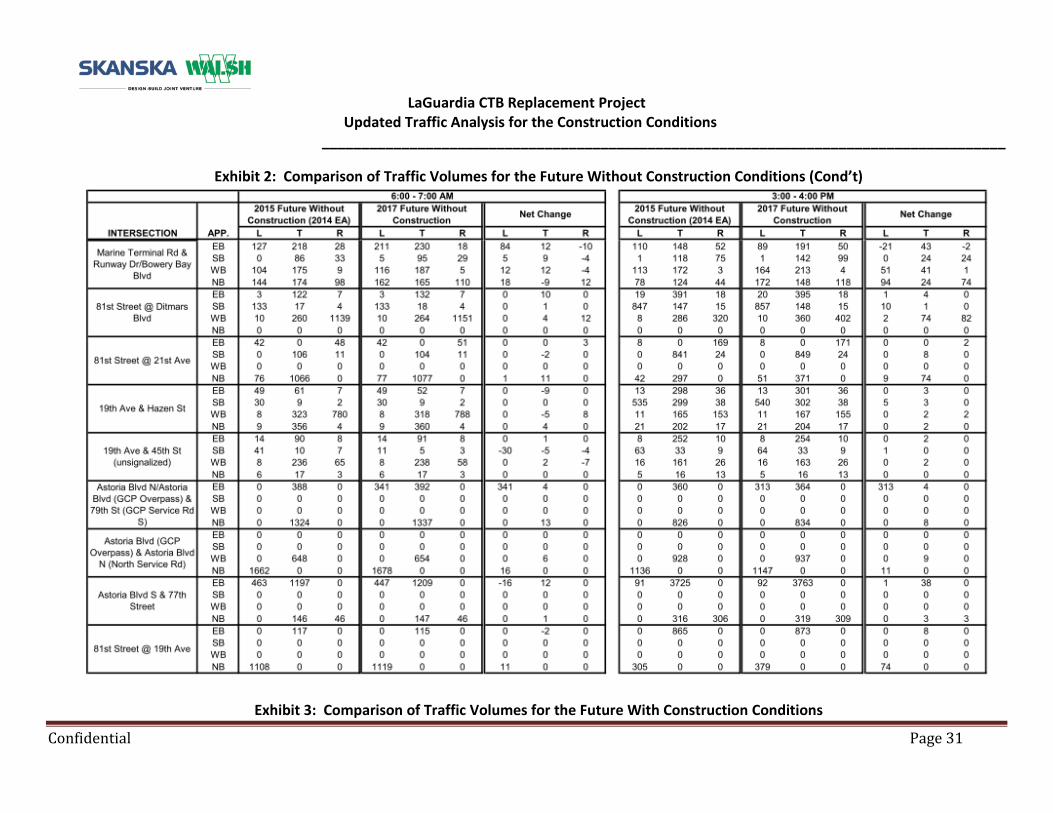
LaGuardia CTB Replacement Project Updated Traffic Analysis for the Construction Conditions
______________________________________________________________________________________
Exhibit 2: Comparison of Traffic Volumes for the Future Without Construction Conditions (Cond’t)
Exhibit 3: Comparison of Traffic Volumes for the Future With Construction Conditions
Confidential Page 31
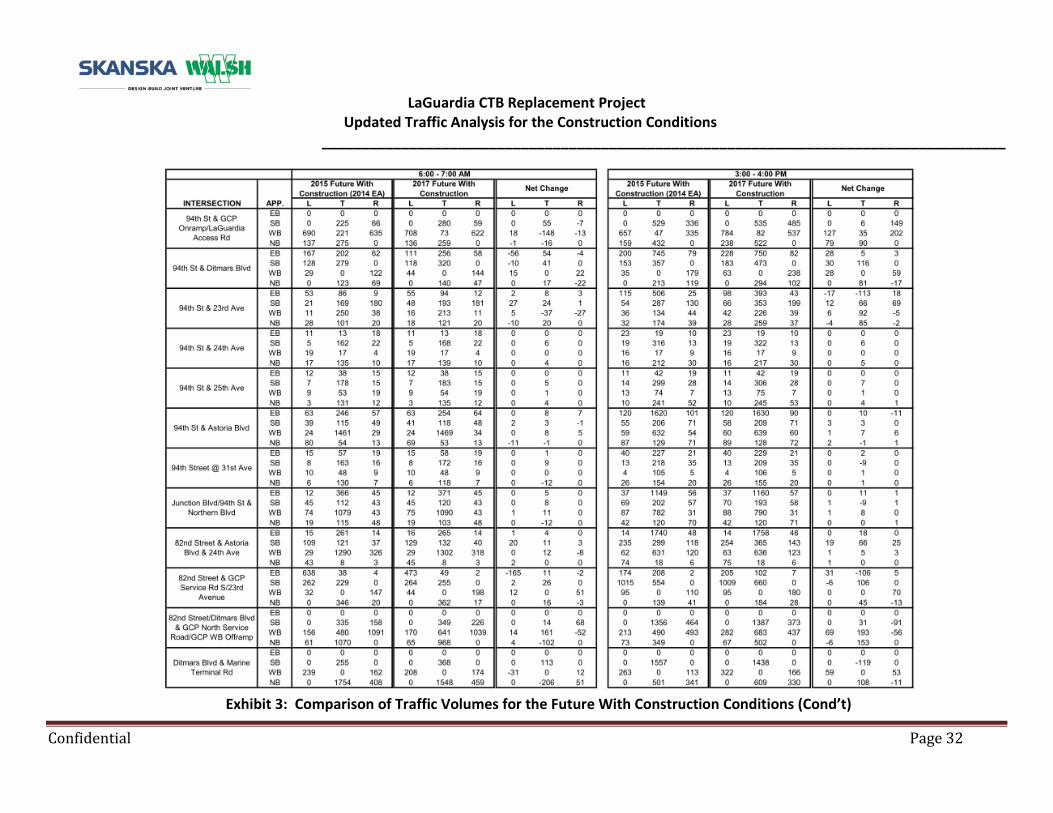
LaGuardia CTB Replacement Project Updated Traffic Analysis for the Construction Conditions
______________________________________________________________________________________
Exhibit 3: Comparison of Traffic Volumes for the Future With Construction Conditions (Cond’t)
Confidential Page 32
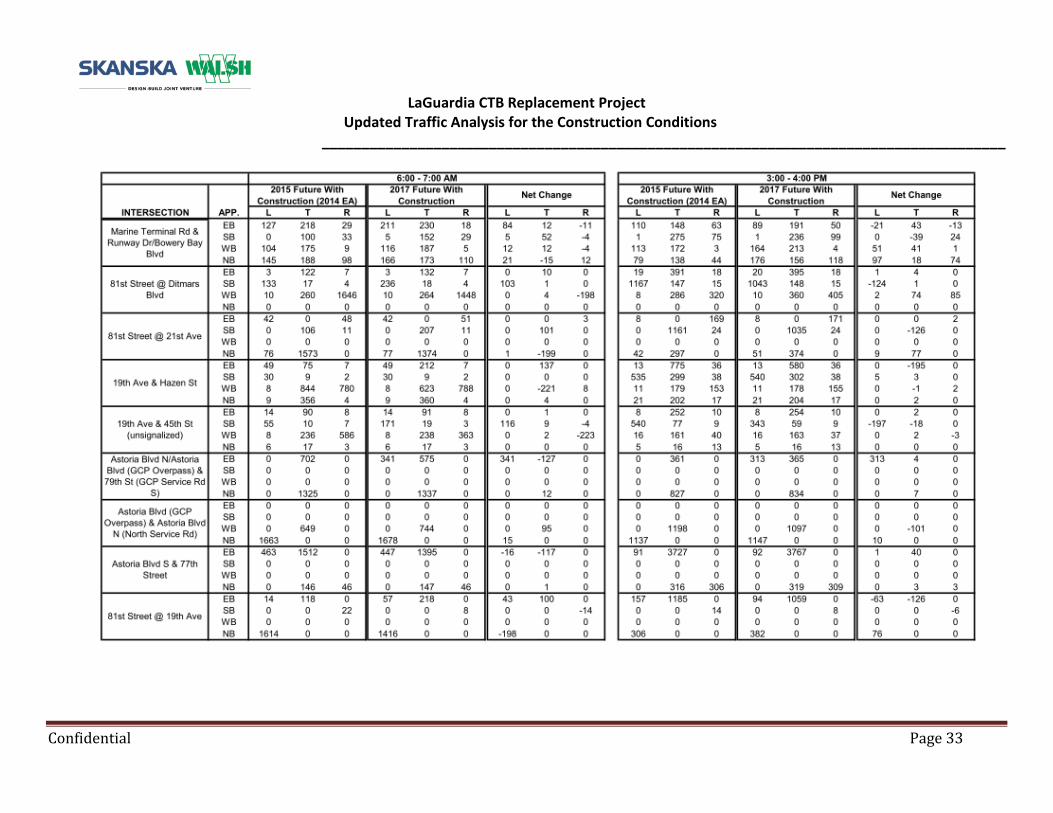
LaGuardia CTB Replacement Project Updated Traffic Analysis for the Construction Conditions
______________________________________________________________________________________
Confidential Page 33
Attachment 5
Technical Memorandum – Updated Air Quality Analysis for the Construction Condition

LaGuardia CTB Replacement Project Updated Air Quality Analysis for the Construction Conditions-Proposed Design Changes
______________________________________________________________________________________
FROM: Alice Lovegrove & Edward Tadross, WSP/Parsons Brinckerhoff TO: Nathaniel Kimball, PANYNJ DATE: December 15, 2015 SUBJECT: Technical Memorandum – Updated Air Quality Analysis for the Construction Conditions- Proposed Design Changes
INTRODUCTION
The purpose of this Air Quality Technical Memo is to provide an update of the construction emission burdens associated with the LaGuardia Airport Central Terminal Building based on the proposed design changes advanced in the Port Authority's Technical Report. In addition, this tech memo will compare the emissions estimates with those from the June 2014 Air Quality Technical Report, which was included in the 2014 EA for the previously approved (2014) design. This memo only analyzes the construction emission burdens of the proposed design changes, as there are no operational changes associated with the project since issuance of the 2014 EA; as such, the operational analyses in the June 2014 Air Quality Technical Report are still valid. The below sections have been numbered to coordinate with the relevant section in the June 2014 Air Quality Technical Report.
B.2.1. Construction Emissions
There are no changes in the methodology to determine construction emissions since issuance of the 2014 EA; as such, the methodology described in this section of the 2014 Air Quality Technical Report is still valid.
B.4.1 General Conformity Analysis (Emissions)
Increased direct and indirect NOx, VOC, PM2.5, CO and SO2 emissions from the proposed construction activities associated with the proposed design changes would result from:
Direct • Use of diesel- and gas-powered demolition and construction equipment• Movement of trucks transporting construction materials and concrete• Construction workers’ commutes
Indirect
• Change in aircraft and ground support equipment• Change in on-road vehicle trips to and from the airport• Replacement of the Central Heating and Refrigeration Plant (CHRP)
Page 1
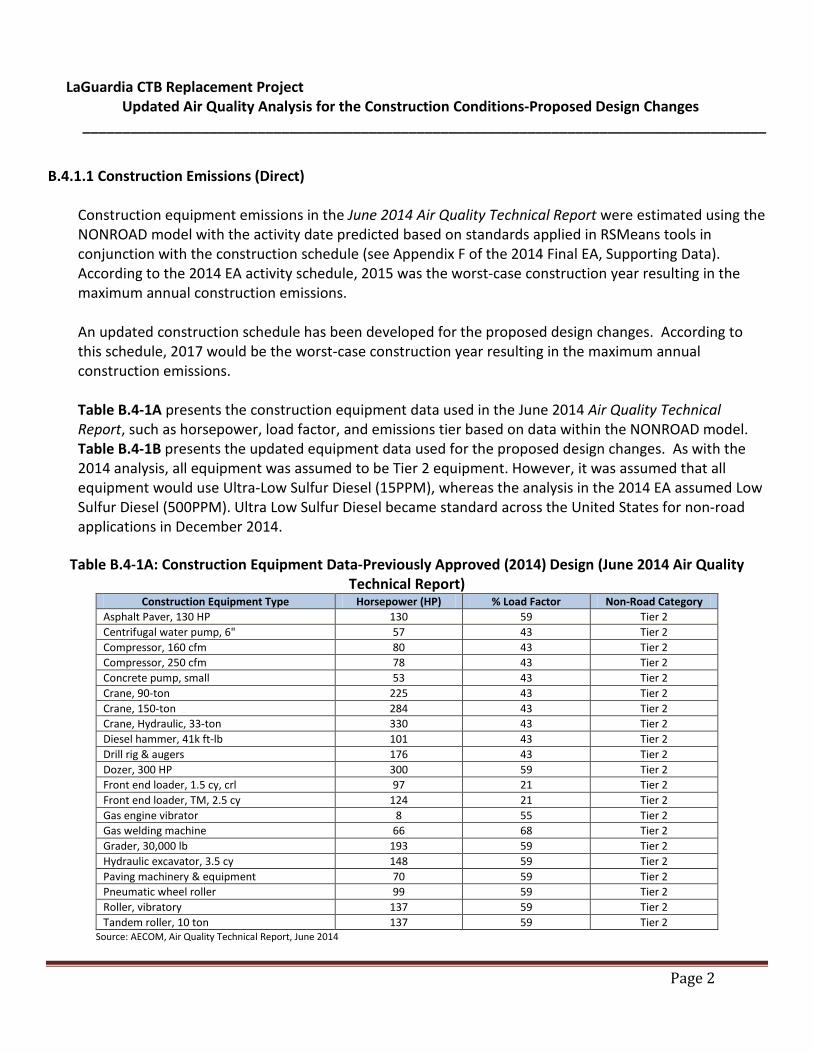
LaGuardia CTB Replacement Project Updated Air Quality Analysis for the Construction Conditions-Proposed Design Changes
______________________________________________________________________________________
B.4.1.1 Construction Emissions (Direct)
Construction equipment emissions in the June 2014 Air Quality Technical Report were estimated using the NONROAD model with the activity date predicted based on standards applied in RSMeans tools in conjunction with the construction schedule (see Appendix F of the 2014 Final EA, Supporting Data). According to the 2014 EA activity schedule, 2015 was the worst-case construction year resulting in the maximum annual construction emissions.
An updated construction schedule has been developed for the proposed design changes. According to this schedule, 2017 would be the worst-case construction year resulting in the maximum annual construction emissions.
Table B.4-1A presents the construction equipment data used in the June 2014 Air Quality Technical Report, such as horsepower, load factor, and emissions tier based on data within the NONROAD model. Table B.4-1B presents the updated equipment data used for the proposed design changes. As with the 2014 analysis, all equipment was assumed to be Tier 2 equipment. However, it was assumed that all equipment would use Ultra-Low Sulfur Diesel (15PPM), whereas the analysis in the 2014 EA assumed Low Sulfur Diesel (500PPM). Ultra Low Sulfur Diesel became standard across the United States for non-road applications in December 2014.
Table B.4-1A: Construction Equipment Data-Previously Approved (2014) Design (June 2014 Air Quality Technical Report)
Construction Equipment Type Horsepower (HP) % Load Factor Non-Road Category Asphalt Paver, 130 HP 130 59 Tier 2 Centrifugal water pump, 6" 57 43 Tier 2 Compressor, 160 cfm 80 43 Tier 2 Compressor, 250 cfm 78 43 Tier 2 Concrete pump, small 53 43 Tier 2 Crane, 90-ton 225 43 Tier 2 Crane, 150-ton 284 43 Tier 2 Crane, Hydraulic, 33-ton 330 43 Tier 2 Diesel hammer, 41k ft-lb 101 43 Tier 2 Drill rig & augers 176 43 Tier 2 Dozer, 300 HP 300 59 Tier 2 Front end loader, 1.5 cy, crl 97 21 Tier 2 Front end loader, TM, 2.5 cy 124 21 Tier 2 Gas engine vibrator 8 55 Tier 2 Gas welding machine 66 68 Tier 2 Grader, 30,000 lb 193 59 Tier 2 Hydraulic excavator, 3.5 cy 148 59 Tier 2 Paving machinery & equipment 70 59 Tier 2 Pneumatic wheel roller 99 59 Tier 2 Roller, vibratory 137 59 Tier 2 Tandem roller, 10 ton 137 59 Tier 2
Source: AECOM, Air Quality Technical Report, June 2014
Page 2
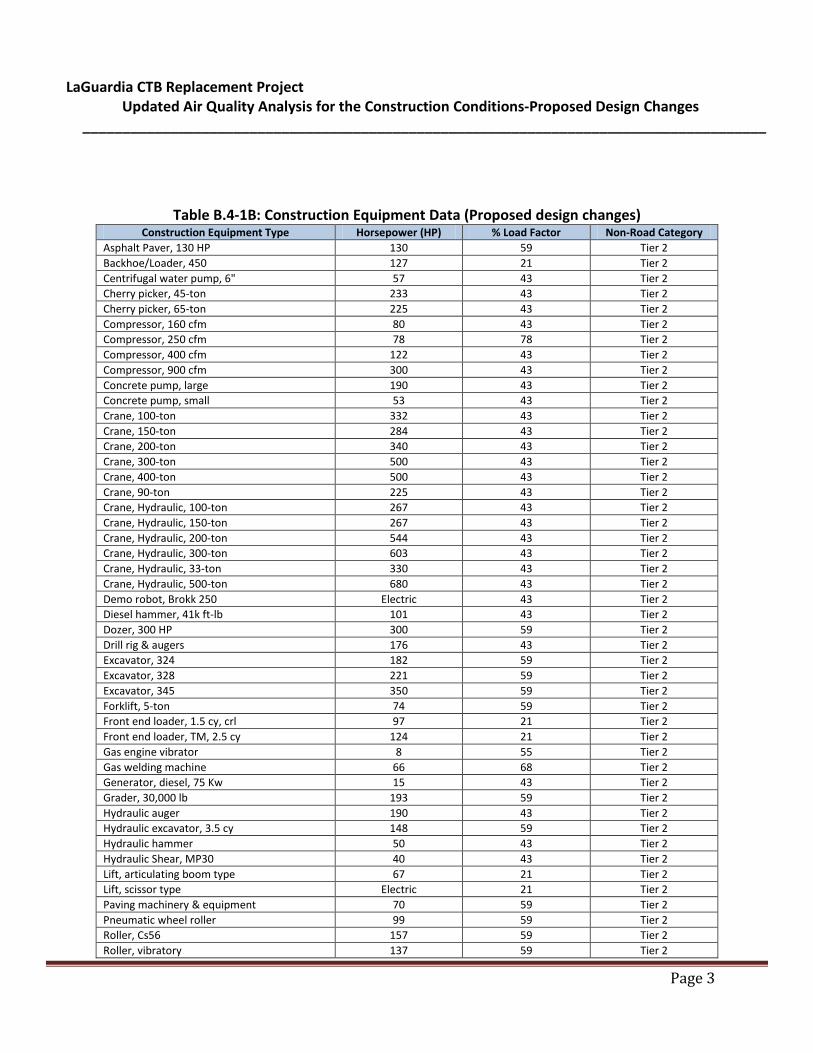
LaGuardia CTB Replacement Project Updated Air Quality Analysis for the Construction Conditions-Proposed Design Changes
______________________________________________________________________________________
Table B.4-1B: Construction Equipment Data (Proposed design changes) Construction Equipment Type Horsepower (HP) % Load Factor Non-Road Category
Asphalt Paver, 130 HP 130 59 Tier 2 Backhoe/Loader, 450 127 21 Tier 2 Centrifugal water pump, 6" 57 43 Tier 2 Cherry picker, 45-ton 233 43 Tier 2 Cherry picker, 65-ton 225 43 Tier 2 Compressor, 160 cfm 80 43 Tier 2 Compressor, 250 cfm 78 78 Tier 2 Compressor, 400 cfm 122 43 Tier 2 Compressor, 900 cfm 300 43 Tier 2 Concrete pump, large 190 43 Tier 2 Concrete pump, small 53 43 Tier 2 Crane, 100-ton 332 43 Tier 2 Crane, 150-ton 284 43 Tier 2 Crane, 200-ton 340 43 Tier 2 Crane, 300-ton 500 43 Tier 2 Crane, 400-ton 500 43 Tier 2 Crane, 90-ton 225 43 Tier 2 Crane, Hydraulic, 100-ton 267 43 Tier 2 Crane, Hydraulic, 150-ton 267 43 Tier 2 Crane, Hydraulic, 200-ton 544 43 Tier 2 Crane, Hydraulic, 300-ton 603 43 Tier 2 Crane, Hydraulic, 33-ton 330 43 Tier 2 Crane, Hydraulic, 500-ton 680 43 Tier 2 Demo robot, Brokk 250 Electric 43 Tier 2 Diesel hammer, 41k ft-lb 101 43 Tier 2 Dozer, 300 HP 300 59 Tier 2 Drill rig & augers 176 43 Tier 2 Excavator, 324 182 59 Tier 2 Excavator, 328 221 59 Tier 2 Excavator, 345 350 59 Tier 2 Forklift, 5-ton 74 59 Tier 2 Front end loader, 1.5 cy, crl 97 21 Tier 2 Front end loader, TM, 2.5 cy 124 21 Tier 2 Gas engine vibrator 8 55 Tier 2 Gas welding machine 66 68 Tier 2 Generator, diesel, 75 Kw 15 43 Tier 2 Grader, 30,000 lb 193 59 Tier 2 Hydraulic auger 190 43 Tier 2 Hydraulic excavator, 3.5 cy 148 59 Tier 2 Hydraulic hammer 50 43 Tier 2 Hydraulic Shear, MP30 40 43 Tier 2 Lift, articulating boom type 67 21 Tier 2 Lift, scissor type Electric 21 Tier 2 Paving machinery & equipment 70 59 Tier 2 Pneumatic wheel roller 99 59 Tier 2 Roller, Cs56 157 59 Tier 2 Roller, vibratory 137 59 Tier 2
Page 3
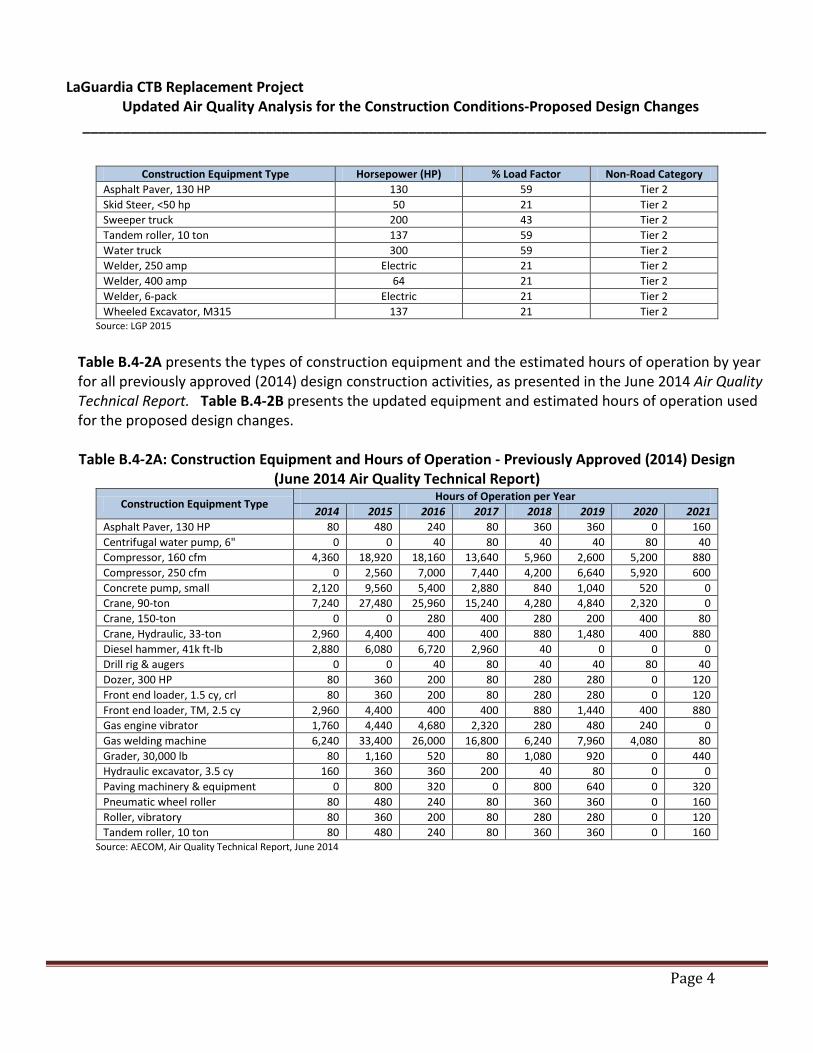
LaGuardia CTB Replacement Project Updated Air Quality Analysis for the Construction Conditions-Proposed Design Changes
______________________________________________________________________________________
Construction Equipment Type Horsepower (HP) % Load Factor Non-Road Category Asphalt Paver, 130 HP 130 59 Tier 2 Skid Steer, <50 hp 50 21 Tier 2 Sweeper truck 200 43 Tier 2 Tandem roller, 10 ton 137 59 Tier 2 Water truck 300 59 Tier 2 Welder, 250 amp Electric 21 Tier 2 Welder, 400 amp 64 21 Tier 2 Welder, 6-pack Electric 21 Tier 2 Wheeled Excavator, M315 137 21 Tier 2
Source: LGP 2015
Table B.4-2A presents the types of construction equipment and the estimated hours of operation by year for all previously approved (2014) design construction activities, as presented in the June 2014 Air Quality Technical Report. Table B.4-2B presents the updated equipment and estimated hours of operation used for the proposed design changes.
Table B.4-2A: Construction Equipment and Hours of Operation - Previously Approved (2014) Design (June 2014 Air Quality Technical Report)
Construction Equipment Type Hours of Operation per Year
2014 2015 2016 2017 2018 2019 2020 2021 Asphalt Paver, 130 HP 80 480 240 80 360 360 0 160 Centrifugal water pump, 6" 0 0 40 80 40 40 80 40 Compressor, 160 cfm 4,360 18,920 18,160 13,640 5,960 2,600 5,200 880 Compressor, 250 cfm 0 2,560 7,000 7,440 4,200 6,640 5,920 600 Concrete pump, small 2,120 9,560 5,400 2,880 840 1,040 520 0 Crane, 90-ton 7,240 27,480 25,960 15,240 4,280 4,840 2,320 0 Crane, 150-ton 0 0 280 400 280 200 400 80 Crane, Hydraulic, 33-ton 2,960 4,400 400 400 880 1,480 400 880 Diesel hammer, 41k ft-lb 2,880 6,080 6,720 2,960 40 0 0 0 Drill rig & augers 0 0 40 80 40 40 80 40 Dozer, 300 HP 80 360 200 80 280 280 0 120 Front end loader, 1.5 cy, crl 80 360 200 80 280 280 0 120 Front end loader, TM, 2.5 cy 2,960 4,400 400 400 880 1,440 400 880 Gas engine vibrator 1,760 4,440 4,680 2,320 280 480 240 0 Gas welding machine 6,240 33,400 26,000 16,800 6,240 7,960 4,080 80 Grader, 30,000 lb 80 1,160 520 80 1,080 920 0 440 Hydraulic excavator, 3.5 cy 160 360 360 200 40 80 0 0 Paving machinery & equipment 0 800 320 0 800 640 0 320 Pneumatic wheel roller 80 480 240 80 360 360 0 160 Roller, vibratory 80 360 200 80 280 280 0 120 Tandem roller, 10 ton 80 480 240 80 360 360 0 160
Source: AECOM, Air Quality Technical Report, June 2014
Page 4
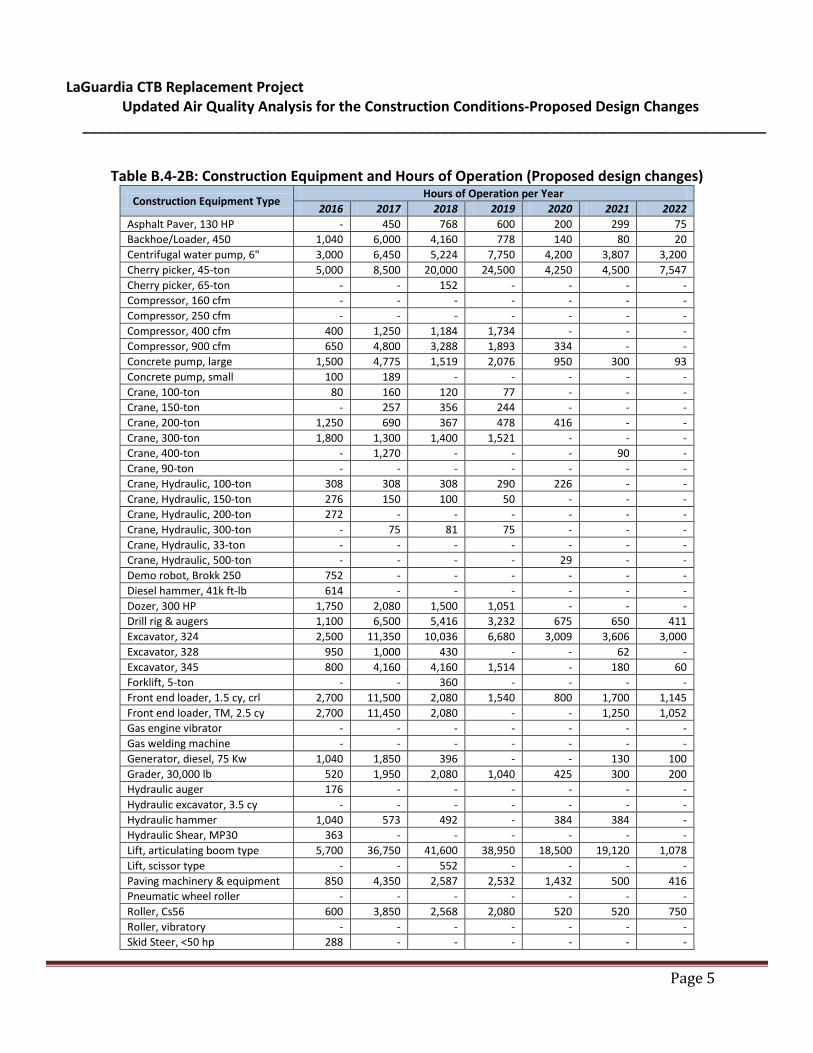
LaGuardia CTB Replacement Project Updated Air Quality Analysis for the Construction Conditions-Proposed Design Changes
______________________________________________________________________________________
Table B.4-2B: Construction Equipment and Hours of Operation (Proposed design changes)
Construction Equipment Type Hours of Operation per Year
2016 2017 2018 2019 2020 2021 2022 Asphalt Paver, 130 HP - 450 768 600 200 299 75 Backhoe/Loader, 450 1,040 6,000 4,160 778 140 80 20 Centrifugal water pump, 6" 3,000 6,450 5,224 7,750 4,200 3,807 3,200 Cherry picker, 45-ton 5,000 8,500 20,000 24,500 4,250 4,500 7,547 Cherry picker, 65-ton - - 152 - - - - Compressor, 160 cfm - - - - - - - Compressor, 250 cfm - - - - - - - Compressor, 400 cfm 400 1,250 1,184 1,734 - - - Compressor, 900 cfm 650 4,800 3,288 1,893 334 - - Concrete pump, large 1,500 4,775 1,519 2,076 950 300 93 Concrete pump, small 100 189 - - - - - Crane, 100-ton 80 160 120 77 - - - Crane, 150-ton - 257 356 244 - - - Crane, 200-ton 1,250 690 367 478 416 - - Crane, 300-ton 1,800 1,300 1,400 1,521 - - - Crane, 400-ton - 1,270 - - - 90 - Crane, 90-ton - - - - - - - Crane, Hydraulic, 100-ton 308 308 308 290 226 - - Crane, Hydraulic, 150-ton 276 150 100 50 - - - Crane, Hydraulic, 200-ton 272 - - - - - - Crane, Hydraulic, 300-ton - 75 81 75 - - - Crane, Hydraulic, 33-ton - - - - - - - Crane, Hydraulic, 500-ton - - - - 29 - - Demo robot, Brokk 250 752 - - - - - - Diesel hammer, 41k ft-lb 614 - - - - - - Dozer, 300 HP 1,750 2,080 1,500 1,051 - - - Drill rig & augers 1,100 6,500 5,416 3,232 675 650 411 Excavator, 324 2,500 11,350 10,036 6,680 3,009 3,606 3,000 Excavator, 328 950 1,000 430 - - 62 - Excavator, 345 800 4,160 4,160 1,514 - 180 60 Forklift, 5-ton - - 360 - - - - Front end loader, 1.5 cy, crl 2,700 11,500 2,080 1,540 800 1,700 1,145 Front end loader, TM, 2.5 cy 2,700 11,450 2,080 - - 1,250 1,052 Gas engine vibrator - - - - - - - Gas welding machine - - - - - - - Generator, diesel, 75 Kw 1,040 1,850 396 - - 130 100 Grader, 30,000 lb 520 1,950 2,080 1,040 425 300 200 Hydraulic auger 176 - - - - - - Hydraulic excavator, 3.5 cy - - - - - - - Hydraulic hammer 1,040 573 492 - 384 384 - Hydraulic Shear, MP30 363 - - - - - - Lift, articulating boom type 5,700 36,750 41,600 38,950 18,500 19,120 1,078 Lift, scissor type - - 552 - - - - Paving machinery & equipment 850 4,350 2,587 2,532 1,432 500 416 Pneumatic wheel roller - - - - - - - Roller, Cs56 600 3,850 2,568 2,080 520 520 750 Roller, vibratory - - - - - - - Skid Steer, <50 hp 288 - - - - - -
Page 5

LaGuardia CTB Replacement Project Updated Air Quality Analysis for the Construction Conditions-Proposed Design Changes
______________________________________________________________________________________
Construction Equipment Type Hours of Operation per Year
2016 2017 2018 2019 2020 2021 2022 Sweeper truck 800 3,080 1,080 440 - 120 120 Tandem roller, 10 ton 800 4,750 4,160 4,160 1,400 1,951 - Water truck 100 480 480 480 480 224 140 Welder, 250 amp 750 7,500 6,240 5,150 1,080 950 1,994 Welder, 400 amp - 6,500 8,320 3,600 980 600 393 Welder, 6-pack 200 2,800 800 - 750 - - Wheeled Excavator, M315 - 201 - - - - -
Source: LGP 2015
The estimated equipment operational emissions from the previously approved (2014) design from the June 2014 Air Quality Technical Report are presented in Table B.4-3A. The estimated equipment operational emissions from the proposed design changes are presented in Table B.4-3B.
Table B.4-3A: Construction Equipment Emissions (tons) (June 2014 Air Quality Technical Report)
Year VOC NOx CO PM10 PM2.5 SO2 CO2 CO2e 2014 0.61 8.81 2.51 0.35 0.33 0.34 1,153.82 1,165.36 2015 2.31 31.06 10.09 1.29 1.25 1.22 4,067.81 4,108.49 2016 1.95 25.09 8.39 1.06 1.03 0.99 3,293.05 3,325.98 2017 1.24 15.98 5.58 0.68 0.66 0.63 2,090.00 2,110.90 2018 0.56 7.50 2.58 0.32 0.31 0.29 975.84 985.60 2019 0.61 8.31 2.81 0.35 0.34 0.33 1,083.24 1,094.07 2020 0.34 4.53 1.80 0.20 0.20 0.18 584.94 590.79 2021 0.11 1.64 0.45 0.06 0.06 0.06 212.71 214.84
Source: AECOM, Air Quality Technical Report, June 2014
Table B.4-3B: Construction Equipment Emissions (tons) (Current Analysis)
Year VOC NOx CO PM10 PM2.5 SO2 CO2 CO2e 2016 1.03 13.54 5.32 0.70 0.67 0.02 1,818.38 1,836.57 2017 3.11 38.73 16.37 2.13 2.05 0.05 5,214.54 5,266.68 2018 2.84 35.07 14.52 1.89 1.82 0.04 4,737.31 4,784.69 2019 2.43 29.23 12.32 1.59 1.53 0.04 3,960.16 3,999.77 2020 0.69 7.95 3.92 0.47 0.45 0.01 1,075.60 1,086.36 2021 0.68 7.80 3.81 0.47 0.45 0.01 1,055.79 1,066.35 2022 0.54 6.16 2.43 0.32 0.31 0.01 844.77 853.22
Source: LGP 2015
Various construction trucks (e.g., concrete and material delivery and haul trucks), workers’ commuting vehicles, and shuttle bus operations would also result in indirect emissions during construction periods. The trip forecasts from the Updated Traffic Analysis for the Construction Conditions (October 2015) were used for the on-road construction emissions analysis. These on-road construction related vehicles are assumed to:
• Travel at an average speed of 25 miles per hour;
Page 6
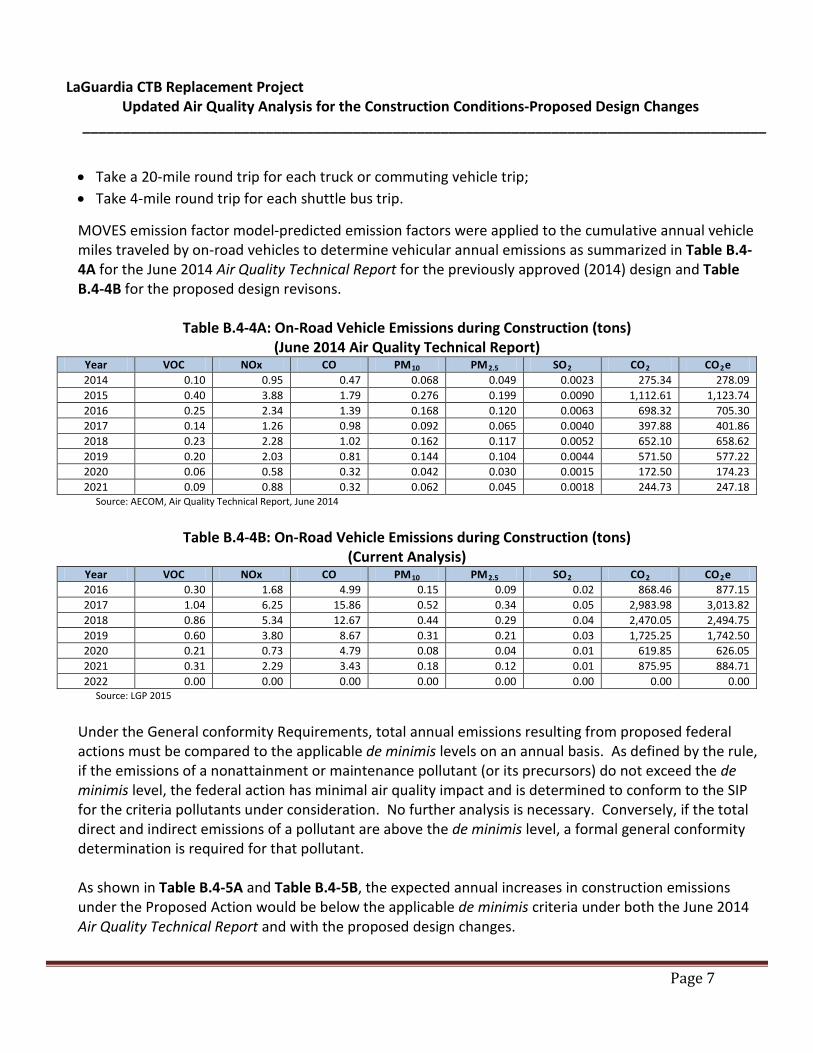
LaGuardia CTB Replacement Project Updated Air Quality Analysis for the Construction Conditions-Proposed Design Changes
______________________________________________________________________________________
• Take a 20-mile round trip for each truck or commuting vehicle trip; • Take 4-mile round trip for each shuttle bus trip.
MOVES emission factor model-predicted emission factors were applied to the cumulative annual vehicle miles traveled by on-road vehicles to determine vehicular annual emissions as summarized in Table B.4-4A for the June 2014 Air Quality Technical Report for the previously approved (2014) design and Table B.4-4B for the proposed design revisons.
Table B.4-4A: On-Road Vehicle Emissions during Construction (tons)
(June 2014 Air Quality Technical Report) Year VOC NOx CO PM10 PM2.5 SO2 CO2 CO2e 2014 0.10 0.95 0.47 0.068 0.049 0.0023 275.34 278.09 2015 0.40 3.88 1.79 0.276 0.199 0.0090 1,112.61 1,123.74 2016 0.25 2.34 1.39 0.168 0.120 0.0063 698.32 705.30 2017 0.14 1.26 0.98 0.092 0.065 0.0040 397.88 401.86 2018 0.23 2.28 1.02 0.162 0.117 0.0052 652.10 658.62 2019 0.20 2.03 0.81 0.144 0.104 0.0044 571.50 577.22 2020 0.06 0.58 0.32 0.042 0.030 0.0015 172.50 174.23 2021 0.09 0.88 0.32 0.062 0.045 0.0018 244.73 247.18
Source: AECOM, Air Quality Technical Report, June 2014
Table B.4-4B: On-Road Vehicle Emissions during Construction (tons)
(Current Analysis) Year VOC NOx CO PM10 PM2.5 SO2 CO2 CO2e 2016 0.30 1.68 4.99 0.15 0.09 0.02 868.46 877.15 2017 1.04 6.25 15.86 0.52 0.34 0.05 2,983.98 3,013.82 2018 0.86 5.34 12.67 0.44 0.29 0.04 2,470.05 2,494.75 2019 0.60 3.80 8.67 0.31 0.21 0.03 1,725.25 1,742.50 2020 0.21 0.73 4.79 0.08 0.04 0.01 619.85 626.05 2021 0.31 2.29 3.43 0.18 0.12 0.01 875.95 884.71 2022 0.00 0.00 0.00 0.00 0.00 0.00 0.00 0.00
Source: LGP 2015
Under the General conformity Requirements, total annual emissions resulting from proposed federal actions must be compared to the applicable de minimis levels on an annual basis. As defined by the rule, if the emissions of a nonattainment or maintenance pollutant (or its precursors) do not exceed the de minimis level, the federal action has minimal air quality impact and is determined to conform to the SIP for the criteria pollutants under consideration. No further analysis is necessary. Conversely, if the total direct and indirect emissions of a pollutant are above the de minimis level, a formal general conformity determination is required for that pollutant. As shown in Table B.4-5A and Table B.4-5B, the expected annual increases in construction emissions under the Proposed Action would be below the applicable de minimis criteria under both the June 2014 Air Quality Technical Report and with the proposed design changes.
Page 7

LaGuardia CTB Replacement Project Updated Air Quality Analysis for the Construction Conditions-Proposed Design Changes
______________________________________________________________________________________
Table B.4-5A: Total Construction Year Annual Emissions (tons)
(June 2014 Air Quality Technical Report) Year VOC NOx CO PM10 PM2.5 SO2 CO2 CO2e 2014 0.71 9.76 2.98 0.41 0.38 0.35 1,429.16 1,443.45 2015 2.71 34.94 11.89 1.56 1.45 1.23 5,180.43 5,232.23 2016 2.20 27.42 9.78 1.23 1.15 1.00 3,991.37 4,031.28 2017 1.38 17.24 6.57 0.78 0.73 0.63 2,487.88 2,512.76 2018 0.79 9.78 3.60 0.48 0.42 0.30 1,627.94 1,644.22 2019 0.81 10.35 3.62 0.49 0.44 0.33 1,654.74 1,671.29 2020 0.40 5.12 2.12 0.25 0.23 0.18 757.43 765.00 2021 0.19 2.52 0.77 0.13 0.11 0.07 457.44 462.01
Annual de minimis Levels
50 100 100 n/a 100 100 n/a n/a
Source: AECOM, Air Quality Technical Report, June 2014
Table B.4-5B: Total Construction Year Annual Emissions (tons) (Current Analysis)
Year VOC NOx CO PM10 PM2.5 SO2 CO2 CO2e 2016 1.33 15.22 10.31 0.85 0.77 0.03 2,686.85 2,713.71 2017 4.16 44.98 32.23 2.66 2.39 0.10 8,198.51 8,280.50 2018 3.71 40.41 27.19 2.33 2.11 0.08 7,207.37 7,279.44 2019 3.03 33.03 20.98 1.90 1.74 0.06 5,685.41 5,742.27 2020 0.90 8.68 8.71 0.55 0.50 0.02 1,695.45 1,712.40 2021 0.99 10.10 7.25 0.65 0.57 0.02 1,931.75 1,951.06 2022 0.54 6.16 2.43 0.32 0.31 0.01 844.77 853.22
Annual de minimis Levels
50 100 100 n/a 100 100 n/a n/a
Source: LGP 2015
Therefore, since the cumulative emissions predicted during construction (including the peak year of 2017) are estimated to be well below the de minimis limits, the air quality impacts can be assumed to be negligible and not significant; therefore, a formal conformity determination is not required. Emissions compared to the previously approved (2014) design are higher due to the compressed construction schedule and nighttime work that occurs during the peak construction period associated with the proposed design changes. Reductions in SO2 are the result of the switch to Ultra Low Sulfur Diesel in the model runs for the proposed design changes.
B.4.1.2 Operational Emissions (Indirect)
There are no operational changes associated with the project since issuance of the 2014 EA; as such, the operation analyses in the June 2014 Air Quality Technical Report are still valid.
Page 8
Attachment 6
Technical Memorandum – Updated Noise Analysis for the Construction Conditions

[AREA-DATE(YYMonDD)-MEETING TITLE-SEQ]
LaGuardia CTB Replacement Project Updated Noise Analysis for the Construction Conditions
______________________________________________________________________________________
FROM: Arthur Morrone, WSP/Parsons Brinckerhoff TO: Nathaniel Kimball, PANYNJ DATE: December 15, 2015 SUBJECT: Technical Memorandum – Updated Air Quality Analysis for the Construction Conditions
INTRODUCTION
As part of the Port Authority of New York and New Jersey's (PANYNJ) proposed redevelopment of the Central Terminal Building (CTB) at LaGuardia Airport, a reevaluation of the Environmental Assessment (EA, November 2014) traffic and construction related noise analysis were completed in accordance with federal, state, and local requirements. This updated analysis was conducted and completed in accordance with the National Environmental Policy Act (NEPA), the Federal Aviation Administration (FAA) guidance, the New York City Environmental Quality Review (CEQR) guidance and the New York State Environmental Quality Review Act (SEQRA).
The noise re-assessment was limited to the temporary construction related activities. There are no operational changes associated with the project since issuance of the 2014 EA; as such, the operation analyses in the June 2014 Noise Technical Report (Appendix E) are still valid.
E.1. Noise Fundamentals and Evaluation Criteria
E.1.1 Noise Fundamentals
Noise can be defined as any unwanted sound. Sound is all around, but becomes noise when it interferes with normal activities such as sleep and conversation. The principal human response to noise is perceived annoyance. Human response can vary according to the type and source of the noise, the distance between the source and the human receptor, the perceived importance of the noise, its appropriateness in the setting, and the sensitivity of the person receiving the noise (receptor).
The measurement of the human perception of sound results from its three basic physical characteristics: intensity, frequency, and duration. Intensity is a measure of the acoustic energy of the sound vibrations and is expressed in terms of sound pressure. As sound pressure increases, the energy carried by the sound increases, and the perception of loudness of that sound increases as well. Frequency is the number of times per second the air vibrates or oscillates. Low frequency sounds are characterized as rumbles or roars, while sirens or screeches typify high frequency sounds. Duration is the length of time the sound can be detected.
Confidential Page 1
[AREA-DATE(YYMonDD)-MEETING TITLE-SEQ]
LaGuardia CTB Replacement Project Updated Noise Analysis for the Construction Conditions
______________________________________________________________________________________
The loudest sounds that can be detected without pain by the human ear have intensities that are a trillion times higher than those of sounds that can barely be detected. Because of this vast range, a logarithmic unit known as the decibel (dB) is used to represent the intensity of a sound. Such a representation is called a sound level. The logarithmic nature of the dB unit does not allow sound levels to be arithmetically added or subtracted. However, some simple rules can be used to understand sound levels. If a sound’s intensity is doubled, the sound level increases by 3 dB, regardless of the initial sound level. For example:
60 dB + 60 dB = 63 dB
80 dB + 80 dB = 83 dB
Second, the total sound level produced by two sounds of different levels is usually only slightly more than the greater of the two. For example:
60 dB + 70 dB = 70.4 dB
The minimum change in the sound level of individual events that an average human ear can detect is about 3 dB. On average, a person perceives a change in sound level of about 10 dB as a doubling (or halving) of the sound's loudness, and this relation holds true for loud and quiet sounds. A decrease in sound level of 10 dB actually represents a 90% decrease in sound intensity, but only a 50% decrease in perceived loudness because of the nonlinear response of the human ear. Noise measurements assessed relative to human exposure are usually expressed using an “A-weighted” scale that filters out very low and very high frequencies in order to replicate human sensitivity. It is common to add the letter “A” to the unit of measurement (dBA) in order to identify that the measurement has been made with this filtering process. Human hearing ranges from approximately 30 dBA (the threshold of hearing) to between 130 and 140 dBA (the threshold of pain). Table E-1 summarizes typical noise levels from common sources and Table E-2 provides a summary of human perceptibility of changes in noise levels.
Since the dBA noise metric describes a noise level at just one moment, and very few noises are constant, other ways of describing noise over extended periods are needed. One way of describing fluctuating sound is to describe the fluctuating noise heard over a specific time period as if it had been a steady, unchanging sound. For this condition, a descriptor called the equivalent sound level (or Leq) can be computed. The Leq descriptor is the constant sound level that, in a given situation and time period (e.g., one-hour Leq, or 24-hour Leq), conveys the same sound energy as the actual time-varying sound. Statistical sound level descriptors, such as L1, L10, L50 and L90 are also sometimes used to indicate noise levels which are exceeded 1, 10, 50 and 90 percent of the time, respectively. The descriptors of the maximum and minimum noise during a noise event are Lmax and Lmin, respectively. Among these descriptors, the one-hour Leq (or simply Leq(1)) is considered a standard metric for evaluating traffic noise impact by the Federal Highway Administration (FHWA) and is also a common metric for all sources by the City of New York as per the City Environmental Quality Review (CEQR) Technical Manual.
Confidential Page 2
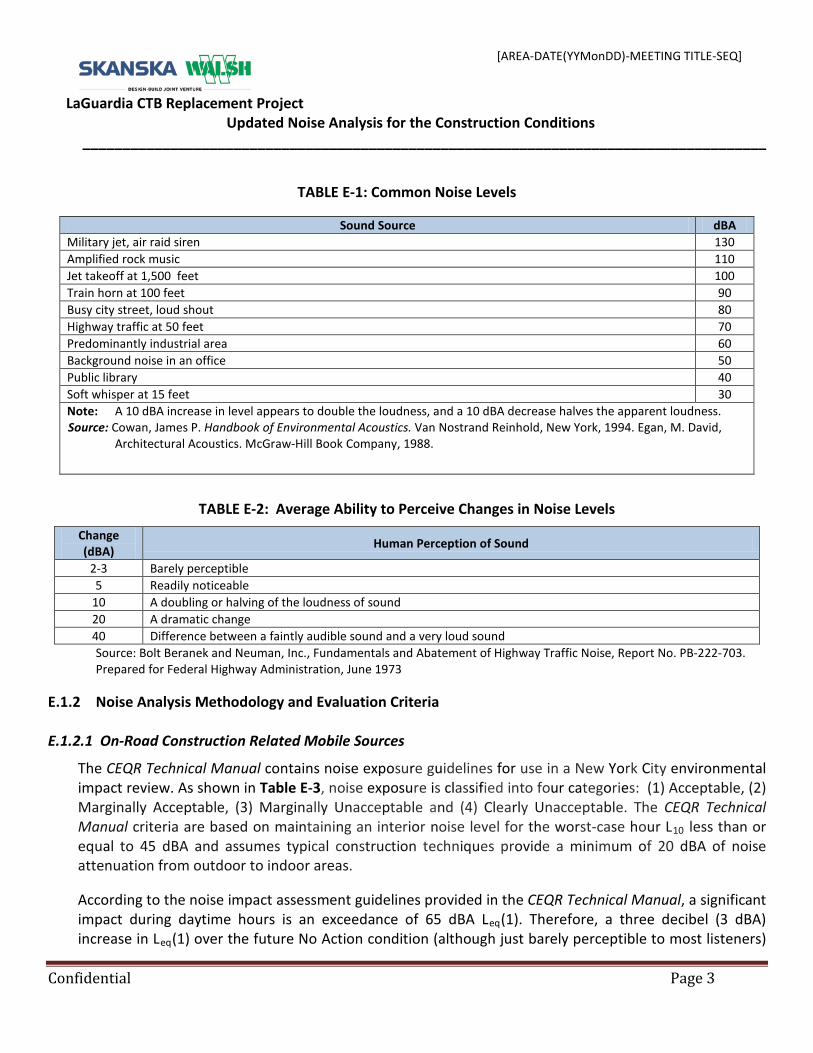
[AREA-DATE(YYMonDD)-MEETING TITLE-SEQ]
LaGuardia CTB Replacement Project Updated Noise Analysis for the Construction Conditions
______________________________________________________________________________________
TABLE E-1: Common Noise Levels
Sound Source dBA Military jet, air raid siren 130 Amplified rock music 110 Jet takeoff at 1,500 feet 100 Train horn at 100 feet 90 Busy city street, loud shout 80 Highway traffic at 50 feet 70 Predominantly industrial area 60 Background noise in an office 50 Public library 40 Soft whisper at 15 feet 30 Note: A 10 dBA increase in level appears to double the loudness, and a 10 dBA decrease halves the apparent loudness. Source: Cowan, James P. Handbook of Environmental Acoustics. Van Nostrand Reinhold, New York, 1994. Egan, M. David,
Architectural Acoustics. McGraw-Hill Book Company, 1988.
TABLE E-2: Average Ability to Perceive Changes in Noise Levels
Change (dBA) Human Perception of Sound
2-3 Barely perceptible 5 Readily noticeable
10 A doubling or halving of the loudness of sound 20 A dramatic change 40 Difference between a faintly audible sound and a very loud sound Source: Bolt Beranek and Neuman, Inc., Fundamentals and Abatement of Highway Traffic Noise, Report No. PB-222-703. Prepared for Federal Highway Administration, June 1973
E.1.2 Noise Analysis Methodology and Evaluation Criteria E.1.2.1 On-Road Construction Related Mobile Sources
The CEQR Technical Manual contains noise exposure guidelines for use in a New York City environmental impact review. As shown in Table E-3, noise exposure is classified into four categories: (1) Acceptable, (2) Marginally Acceptable, (3) Marginally Unacceptable and (4) Clearly Unacceptable. The CEQR Technical Manual criteria are based on maintaining an interior noise level for the worst-case hour L10 less than or equal to 45 dBA and assumes typical construction techniques provide a minimum of 20 dBA of noise attenuation from outdoor to indoor areas.
According to the noise impact assessment guidelines provided in the CEQR Technical Manual, a significant impact during daytime hours is an exceedance of 65 dBA Leq(1). Therefore, a three decibel (3 dBA) increase in Leq(1) over the future No Action condition (although just barely perceptible to most listeners)
Confidential Page 3
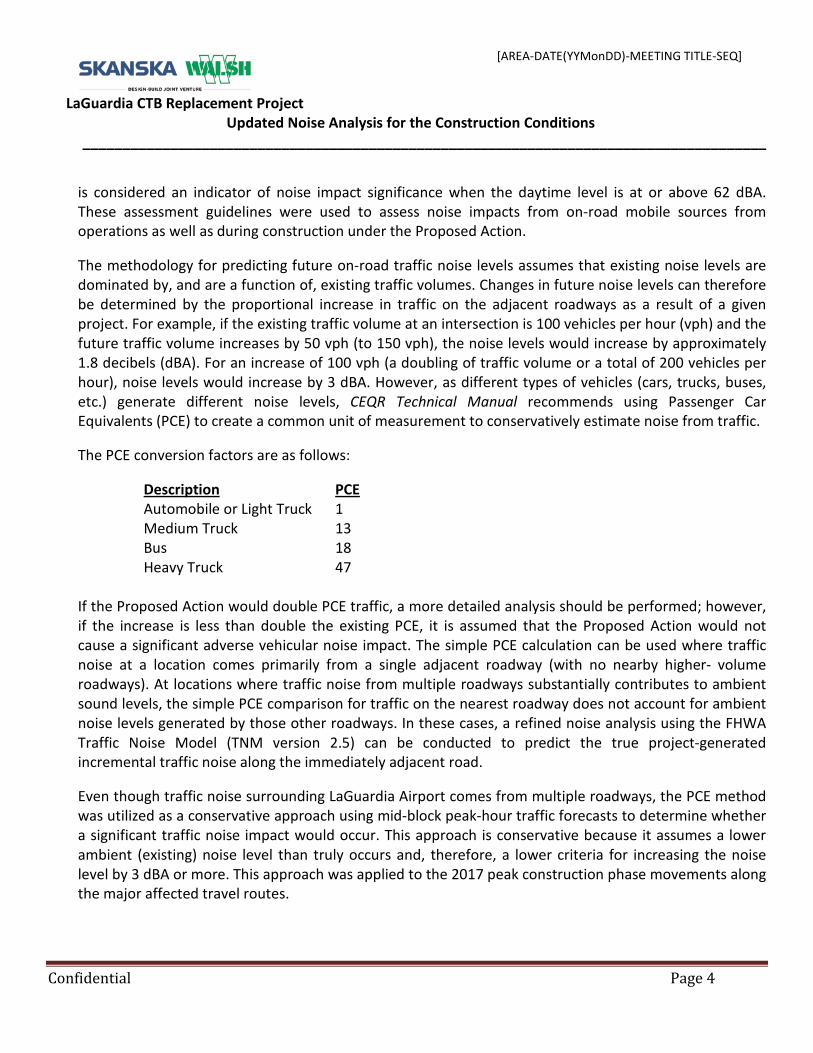
[AREA-DATE(YYMonDD)-MEETING TITLE-SEQ]
LaGuardia CTB Replacement Project Updated Noise Analysis for the Construction Conditions
______________________________________________________________________________________
is considered an indicator of noise impact significance when the daytime level is at or above 62 dBA. These assessment guidelines were used to assess noise impacts from on-road mobile sources from operations as well as during construction under the Proposed Action.
The methodology for predicting future on-road traffic noise levels assumes that existing noise levels are dominated by, and are a function of, existing traffic volumes. Changes in future noise levels can therefore be determined by the proportional increase in traffic on the adjacent roadways as a result of a given project. For example, if the existing traffic volume at an intersection is 100 vehicles per hour (vph) and the future traffic volume increases by 50 vph (to 150 vph), the noise levels would increase by approximately 1.8 decibels (dBA). For an increase of 100 vph (a doubling of traffic volume or a total of 200 vehicles per hour), noise levels would increase by 3 dBA. However, as different types of vehicles (cars, trucks, buses, etc.) generate different noise levels, CEQR Technical Manual recommends using Passenger Car Equivalents (PCE) to create a common unit of measurement to conservatively estimate noise from traffic.
The PCE conversion factors are as follows:
Description PCE Automobile or Light Truck 1 Medium Truck 13 Bus 18 Heavy Truck 47
If the Proposed Action would double PCE traffic, a more detailed analysis should be performed; however, if the increase is less than double the existing PCE, it is assumed that the Proposed Action would not cause a significant adverse vehicular noise impact. The simple PCE calculation can be used where traffic noise at a location comes primarily from a single adjacent roadway (with no nearby higher- volume roadways). At locations where traffic noise from multiple roadways substantially contributes to ambient sound levels, the simple PCE comparison for traffic on the nearest roadway does not account for ambient noise levels generated by those other roadways. In these cases, a refined noise analysis using the FHWA Traffic Noise Model (TNM version 2.5) can be conducted to predict the true project-generated incremental traffic noise along the immediately adjacent road.
Even though traffic noise surrounding LaGuardia Airport comes from multiple roadways, the PCE method was utilized as a conservative approach using mid-block peak-hour traffic forecasts to determine whether a significant traffic noise impact would occur. This approach is conservative because it assumes a lower ambient (existing) noise level than truly occurs and, therefore, a lower criteria for increasing the noise level by 3 dBA or more. This approach was applied to the 2017 peak construction phase movements along the major affected travel routes.
Confidential Page 4
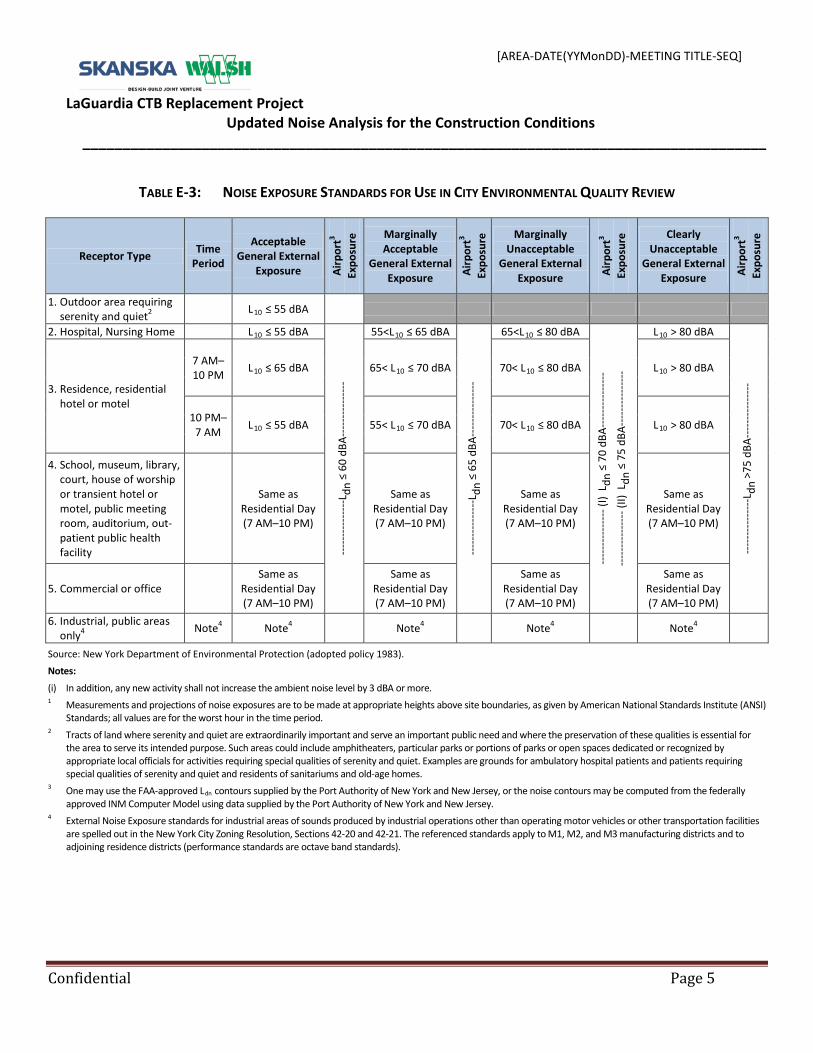
[AREA-DATE(YYMonDD)-MEETING TITLE-SEQ]
LaGuardia CTB Replacement Project Updated Noise Analysis for the Construction Conditions
______________________________________________________________________________________
TABLE E-3: NOISE EXPOSURE STANDARDS FOR USE IN CITY ENVIRONMENTAL QUALITY REVIEW
Receptor Type Time Period
Acceptable General External
Exposure Airp
ort3
Expo
sure
Marginally Acceptable
General External Exposure Ai
rpor
t3 Ex
posu
re Marginally
Unacceptable General External
Exposure Airp
ort3
Expo
sure
Clearly Unacceptable
General External Exposure Ai
rpor
t3 Ex
posu
re
1. Outdoor area requiringserenity and quiet2 L10 ≤ 55 dBA
2. Hospital, Nursing Home L10 ≤ 55 dBA ---
------
------
L dn
≤ 6
0 d
BA
------
------
---55<L10 ≤ 65 dBA
------
------
---L d
n ≤
65
dB
A---
------
------
65<L10 ≤ 80 dBA
------
------
--- (I
) L d
n ≤
70
dB
A---
------
------
------
------
--- (I
I) L
dn ≤
75
dB
A---
------
------
L10 > 80 dBA
------
------
---L d
n >7
5 dB
A----
------
-----3. Residence, residential
hotel or motel
7 AM–10 PM L10 ≤ 65 dBA 65< L10 ≤ 70 dBA 70< L10 ≤ 80 dBA L10 > 80 dBA
10 PM–7 AM L10 ≤ 55 dBA 55< L10 ≤ 70 dBA 70< L10 ≤ 80 dBA L10 > 80 dBA
4. School, museum, library,court, house of worship or transient hotel ormotel, public meetingroom, auditorium, out-patient public health facility
Same as Residential Day (7 AM–10 PM)
Same as Residential Day (7 AM–10 PM)
Same as Residential Day (7 AM–10 PM)
Same as Residential Day (7 AM–10 PM)
5. Commercial or office Same as
Residential Day (7 AM–10 PM)
Same as Residential Day (7 AM–10 PM)
Same as Residential Day (7 AM–10 PM)
Same as Residential Day (7 AM–10 PM)
6. Industrial, public areasonly4 Note4 Note4 Note4 Note4 Note4
Source: New York Department of Environmental Protection (adopted policy 1983).
Notes:
(i) In addition, any new activity shall not increase the ambient noise level by 3 dBA or more. 1 Measurements and projections of noise exposures are to be made at appropriate heights above site boundaries, as given by American National Standards Institute (ANSI)
Standards; all values are for the worst hour in the time period. 2 Tracts of land where serenity and quiet are extraordinarily important and serve an important public need and where the preservation of these qualities is essential for
the area to serve its intended purpose. Such areas could include amphitheaters, particular parks or portions of parks or open spaces dedicated or recognized by appropriate local officials for activities requiring special qualities of serenity and quiet. Examples are grounds for ambulatory hospital patients and patients requiring special qualities of serenity and quiet and residents of sanitariums and old-age homes.
3 One may use the FAA-approved Ldn contours supplied by the Port Authority of New York and New Jersey, or the noise contours may be computed from the federally approved INM Computer Model using data supplied by the Port Authority of New York and New Jersey.
4 External Noise Exposure standards for industrial areas of sounds produced by industrial operations other than operating motor vehicles or other transportation facilities are spelled out in the New York City Zoning Resolution, Sections 42-20 and 42-21. The referenced standards apply to M1, M2, and M3 manufacturing districts and to adjoining residence districts (performance standards are octave band standards).
Confidential Page 5

[AREA-DATE(YYMonDD)-MEETING TITLE-SEQ]
LaGuardia CTB Replacement Project Updated Noise Analysis for the Construction Conditions
______________________________________________________________________________________
E.1.2.2 Stationary Construction Equipment (Non-Road Mobile Sources)
On-site construction noise is generally short in duration and its effects are temporary. Unlike operational impacts, there is a lack of specific impact criteria on a federal, state, or city level. However, according to the New York State Department of Transportation (NYSDOT) Noise Analysis Policy and Procedures (4.4.18), there would be no impact from construction noise at any sensitive receptor when levels are under 85 dBA of Leq(1) in New York City. In addition, in Assessing and Mitigating Noise Impacts (policy dated February 2, 2001) New York State Department of Environmental Conservation (DEC) identifies an increase of 10 dBA as deserving consideration of avoidance and mitigation measures.
To assess the construction noise impacts from on-site equipment operations for the Proposed Action, the loudest projected hourly noise level in any given month was predicted assuming that all likely equipment would be operating within the same hour. These cumulative noise levels were then adjusted based on applicable usage factors.
The Federal Highway Administration (FHWA)-approved Roadway Construction Noise Model (RCNM, version 1.1) was used to predict construction noise levels from on-site construction equipment. RCNM was released for public use in 2006 after several years of development stemming from an earlier version used at the Central Artery/Third Harbor Tunnel Project in Boston. Noise emission levels for generic types of heavy equipment are contained in a database in the model. The equipment noise emission reference levels, which were all measured under actual field conditions, are expressed as A-weighted Lmax levels at 50 feet.
Based on the equipment type, the distance between the work zone and the selected receptor, the RCNM computes the Lmax and/or Leq(1) levels at each receptor location. Adjustments are also applied to reflect any additional shielding factors such as the noise reduction expected from noise barriers. The model automatically accesses a database of equipment usage factors to compute the equipment noise levels over any period of interest. The RCNM model does not account for excess ground attenuation or atmospheric absorption, so the resulting predicted noise levels are higher than would actually be perceived.
E.2 Existing Conditions
Noise levels at and around LaGuardia Airport are affected both by the setting of the Airport, which includes an urban area close to a major highway (the Grand Central Parkway), and the aircraft operations taking place on the airfield. Vehicle traffic on and off the Airport is a mostly steady source of ambient noise while aircraft operations make a more intermittent but significant contribution to existing noise levels. A total of four noise-sensitive sites were selected for typical weekday 24-hour noise monitoring to
Confidential Page 6
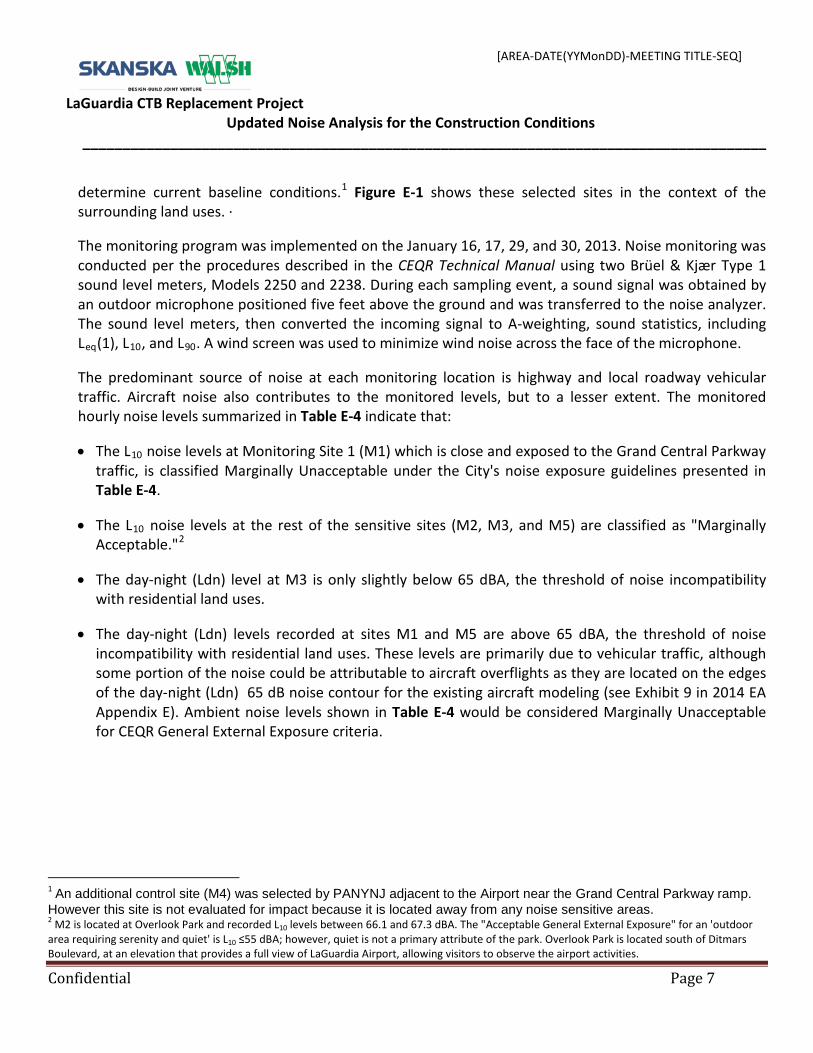
[AREA-DATE(YYMonDD)-MEETING TITLE-SEQ]
LaGuardia CTB Replacement Project Updated Noise Analysis for the Construction Conditions
______________________________________________________________________________________
determine current baseline conditions.1 Figure E-1 shows these selected sites in the context of the surrounding land uses. ·
The monitoring program was implemented on the January 16, 17, 29, and 30, 2013. Noise monitoring was conducted per the procedures described in the CEQR Technical Manual using two Brüel & Kjær Type 1 sound level meters, Models 2250 and 2238. During each sampling event, a sound signal was obtained by an outdoor microphone positioned five feet above the ground and was transferred to the noise analyzer. The sound level meters, then converted the incoming signal to A-weighting, sound statistics, including Leq(1), L10, and L90. A wind screen was used to minimize wind noise across the face of the microphone.
The predominant source of noise at each monitoring location is highway and local roadway vehicular traffic. Aircraft noise also contributes to the monitored levels, but to a lesser extent. The monitored hourly noise levels summarized in Table E-4 indicate that:
• The L10 noise levels at Monitoring Site 1 (M1) which is close and exposed to the Grand Central Parkwaytraffic, is classified Marginally Unacceptable under the City's noise exposure guidelines presented inTable E-4.
• The L10 noise levels at the rest of the sensitive sites (M2, M3, and M5) are classified as "MarginallyAcceptable."2
• The day-night (Ldn) level at M3 is only slightly below 65 dBA, the threshold of noise incompatibilitywith residential land uses.
• The day-night (Ldn) levels recorded at sites M1 and M5 are above 65 dBA, the threshold of noiseincompatibility with residential land uses. These levels are primarily due to vehicular traffic, althoughsome portion of the noise could be attributable to aircraft overflights as they are located on the edgesof the day-night (Ldn) 65 dB noise contour for the existing aircraft modeling (see Exhibit 9 in 2014 EAAppendix E). Ambient noise levels shown in Table E-4 would be considered Marginally Unacceptablefor CEQR General External Exposure criteria.
1 An additional control site (M4) was selected by PANYNJ adjacent to the Airport near the Grand Central Parkway ramp. However this site is not evaluated for impact because it is located away from any noise sensitive areas. 2 M2 is located at Overlook Park and recorded L10 levels between 66.1 and 67.3 dBA. The "Acceptable General External Exposure" for an 'outdoor area requiring serenity and quiet' is L10 ≤55 dBA; however, quiet is not a primary attribute of the park. Overlook Park is located south of Ditmars Boulevard, at an elevation that provides a full view of LaGuardia Airport, allowing visitors to observe the airport activities.
Confidential Page 7
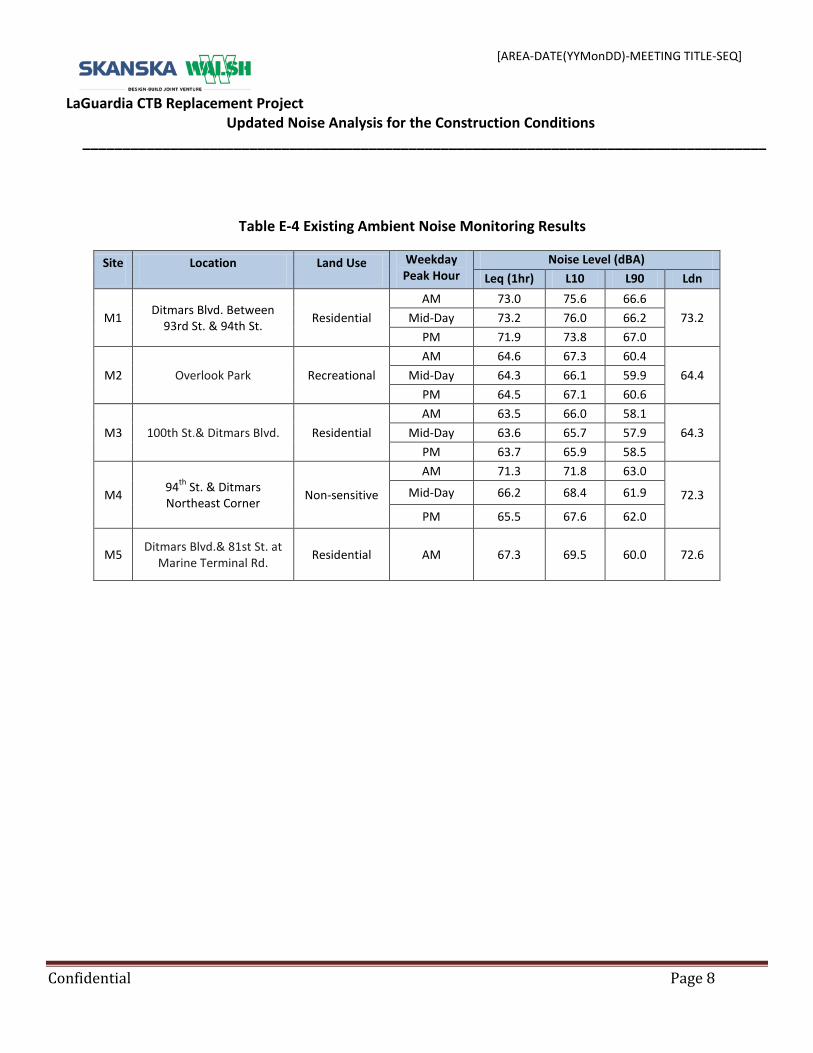
[AREA-DATE(YYMonDD)-MEETING TITLE-SEQ]
LaGuardia CTB Replacement Project Updated Noise Analysis for the Construction Conditions
______________________________________________________________________________________
Table E-4 Existing Ambient Noise Monitoring Results
Site Location Land Use Weekday Peak Hour
Noise Level (dBA) Leq (1hr) L10 L90 Ldn
M1 Ditmars Blvd. Between 93rd St. & 94th St. Residential
AM 73.0 75.6 66.6 73.2 Mid-Day 73.2 76.0 66.2
PM 71.9 73.8 67.0
M2 Overlook Park Recreational AM 64.6 67.3 60.4
64.4 Mid-Day 64.3 66.1 59.9 PM 64.5 67.1 60.6
M3 100th St.& Ditmars Blvd. Residential AM 63.5 66.0 58.1
64.3 Mid-Day 63.6 65.7 57.9 PM 63.7 65.9 58.5
M4 94th St. & Ditmars Northeast Corner Non-sensitive
AM 71.3 71.8 63.0
72.3 Mid-Day 66.2 68.4 61.9
PM 65.5 67.6 62.0
M5 Ditmars Blvd.& 81st St. at Marine Terminal Rd. Residential AM 67.3 69.5 60.0 72.6
Confidential Page 8
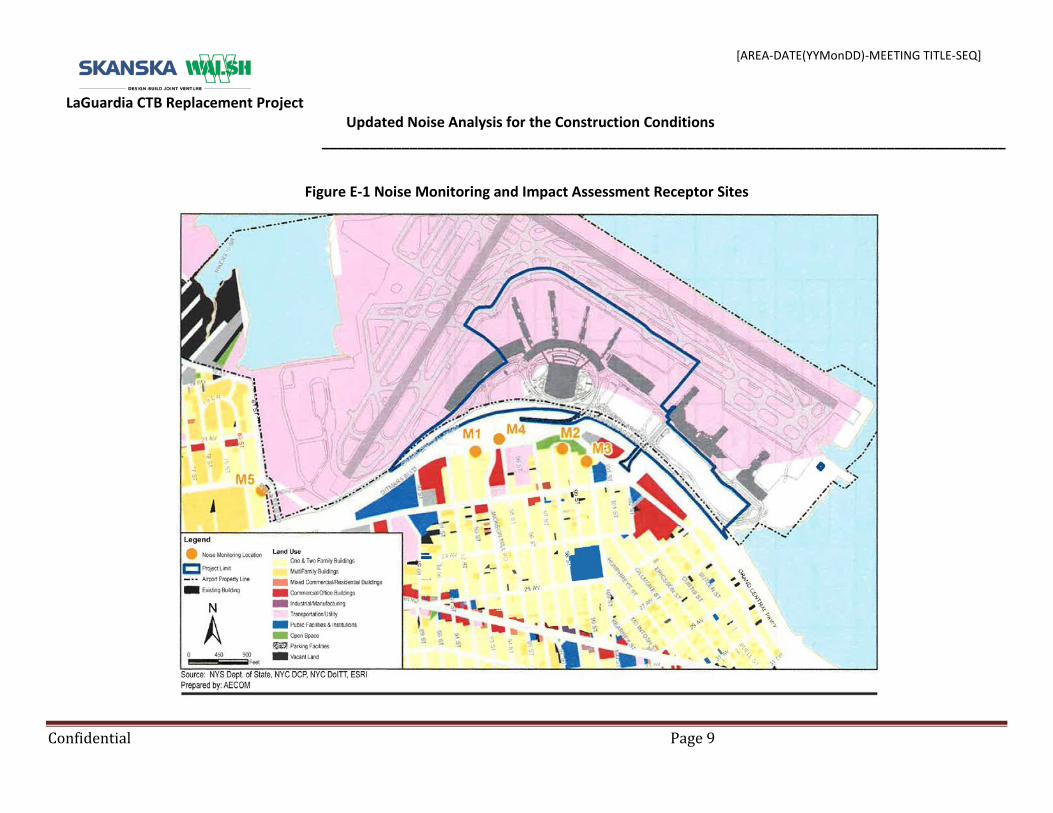
[AREA-DATE(YYMonDD)-MEETING TITLE-SEQ]
LaGuardia CTB Replacement Project Updated Noise Analysis for the Construction Conditions
______________________________________________________________________________________
Figure E-1 Noise Monitoring and Impact Assessment Receptor Sites
Confidential Page 9
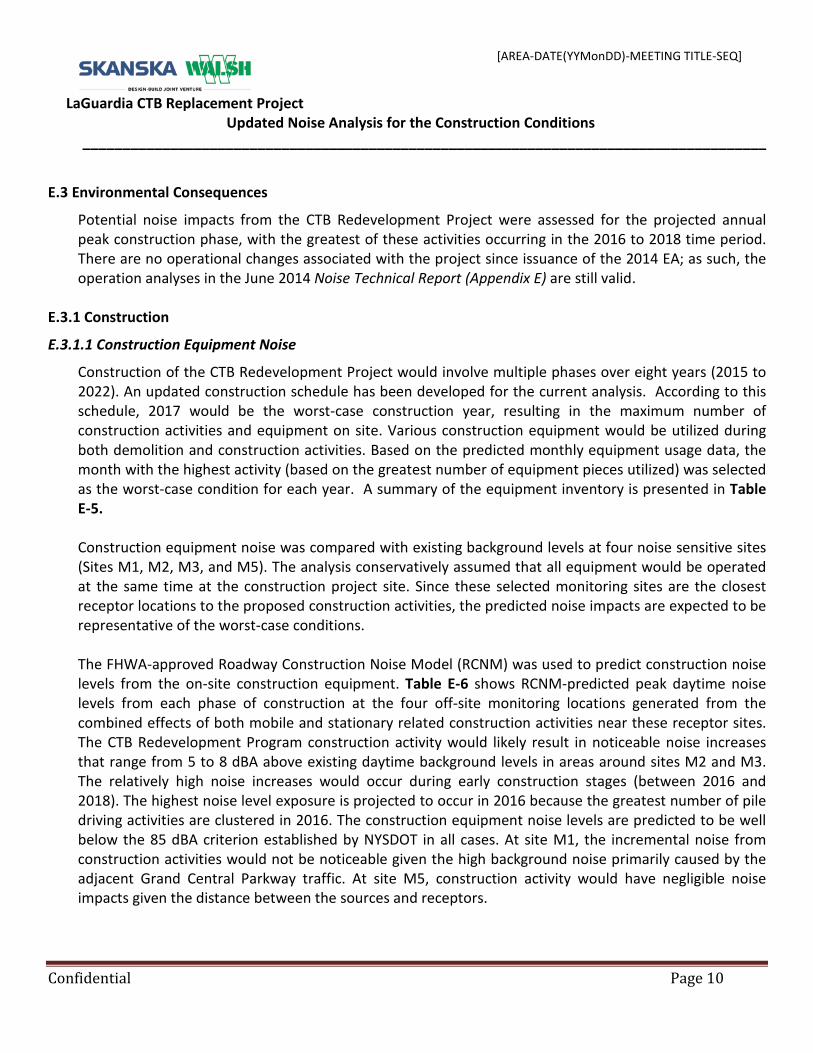
[AREA-DATE(YYMonDD)-MEETING TITLE-SEQ]
LaGuardia CTB Replacement Project Updated Noise Analysis for the Construction Conditions
______________________________________________________________________________________
E.3 Environmental Consequences
Potential noise impacts from the CTB Redevelopment Project were assessed for the projected annual peak construction phase, with the greatest of these activities occurring in the 2016 to 2018 time period. There are no operational changes associated with the project since issuance of the 2014 EA; as such, the operation analyses in the June 2014 Noise Technical Report (Appendix E) are still valid.
E.3.1 Construction
E.3.1.1 Construction Equipment Noise
Construction of the CTB Redevelopment Project would involve multiple phases over eight years (2015 to 2022). An updated construction schedule has been developed for the current analysis. According to this schedule, 2017 would be the worst-case construction year, resulting in the maximum number of construction activities and equipment on site. Various construction equipment would be utilized during both demolition and construction activities. Based on the predicted monthly equipment usage data, the month with the highest activity (based on the greatest number of equipment pieces utilized) was selected as the worst-case condition for each year. A summary of the equipment inventory is presented in Table E-5. Construction equipment noise was compared with existing background levels at four noise sensitive sites (Sites M1, M2, M3, and M5). The analysis conservatively assumed that all equipment would be operated at the same time at the construction project site. Since these selected monitoring sites are the closest receptor locations to the proposed construction activities, the predicted noise impacts are expected to be representative of the worst-case conditions. The FHWA-approved Roadway Construction Noise Model (RCNM) was used to predict construction noise levels from the on-site construction equipment. Table E-6 shows RCNM-predicted peak daytime noise levels from each phase of construction at the four off-site monitoring locations generated from the combined effects of both mobile and stationary related construction activities near these receptor sites. The CTB Redevelopment Program construction activity would likely result in noticeable noise increases that range from 5 to 8 dBA above existing daytime background levels in areas around sites M2 and M3. The relatively high noise increases would occur during early construction stages (between 2016 and 2018). The highest noise level exposure is projected to occur in 2016 because the greatest number of pile driving activities are clustered in 2016. The construction equipment noise levels are predicted to be well below the 85 dBA criterion established by NYSDOT in all cases. At site M1, the incremental noise from construction activities would not be noticeable given the high background noise primarily caused by the adjacent Grand Central Parkway traffic. At site M5, construction activity would have negligible noise impacts given the distance between the sources and receptors.
Confidential Page 10
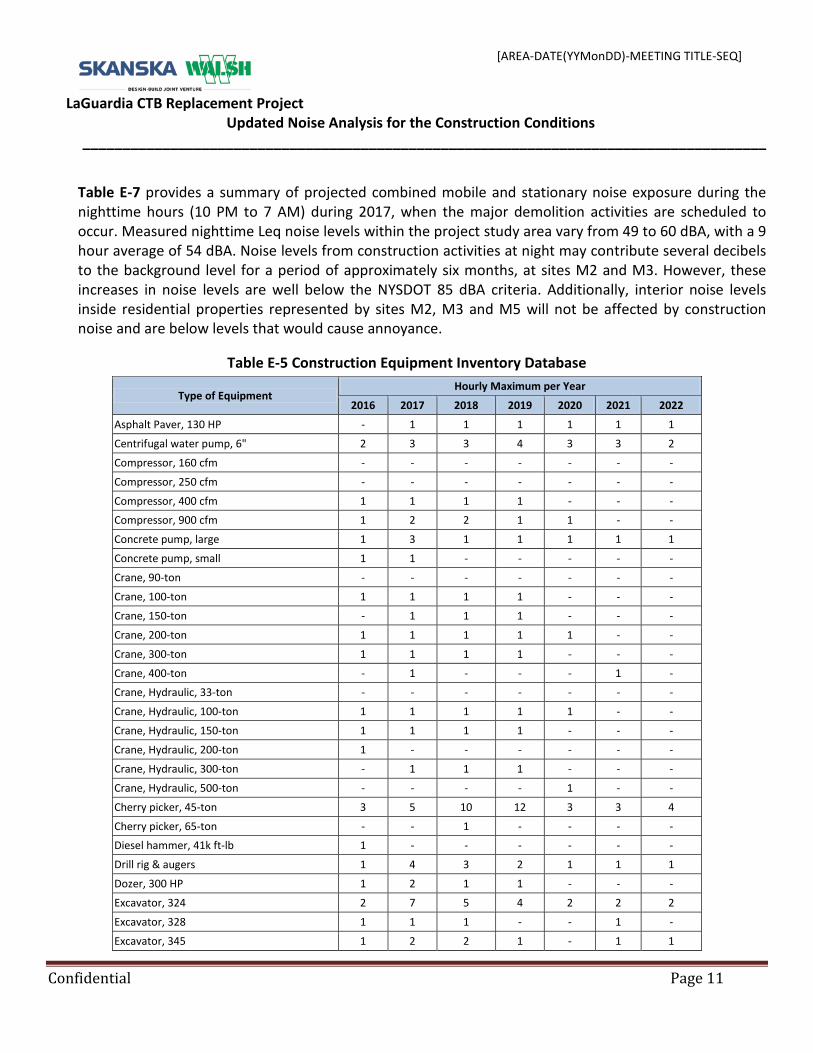
[AREA-DATE(YYMonDD)-MEETING TITLE-SEQ]
LaGuardia CTB Replacement Project Updated Noise Analysis for the Construction Conditions
______________________________________________________________________________________
Table E-7 provides a summary of projected combined mobile and stationary noise exposure during the nighttime hours (10 PM to 7 AM) during 2017, when the major demolition activities are scheduled to occur. Measured nighttime Leq noise levels within the project study area vary from 49 to 60 dBA, with a 9 hour average of 54 dBA. Noise levels from construction activities at night may contribute several decibels to the background level for a period of approximately six months, at sites M2 and M3. However, these increases in noise levels are well below the NYSDOT 85 dBA criteria. Additionally, interior noise levels inside residential properties represented by sites M2, M3 and M5 will not be affected by construction noise and are below levels that would cause annoyance.
Table E-5 Construction Equipment Inventory Database
Type of Equipment Hourly Maximum per Year
2016 2017 2018 2019 2020 2021 2022
Asphalt Paver, 130 HP - 1 1 1 1 1 1
Centrifugal water pump, 6" 2 3 3 4 3 3 2
Compressor, 160 cfm - - - - - - -
Compressor, 250 cfm - - - - - - -
Compressor, 400 cfm 1 1 1 1 - - -
Compressor, 900 cfm 1 2 2 1 1 - -
Concrete pump, large 1 3 1 1 1 1 1
Concrete pump, small 1 1 - - - - -
Crane, 90-ton - - - - - - -
Crane, 100-ton 1 1 1 1 - - -
Crane, 150-ton - 1 1 1 - - -
Crane, 200-ton 1 1 1 1 1 - -
Crane, 300-ton 1 1 1 1 - - -
Crane, 400-ton - 1 - - - 1 -
Crane, Hydraulic, 33-ton - - - - - - -
Crane, Hydraulic, 100-ton 1 1 1 1 1 - -
Crane, Hydraulic, 150-ton 1 1 1 1 - - -
Crane, Hydraulic, 200-ton 1 - - - - - -
Crane, Hydraulic, 300-ton - 1 1 1 - - -
Crane, Hydraulic, 500-ton - - - - 1 - -
Cherry picker, 45-ton 3 5 10 12 3 3 4
Cherry picker, 65-ton - - 1 - - - -
Diesel hammer, 41k ft-lb 1 - - - - - -
Drill rig & augers 1 4 3 2 1 1 1
Dozer, 300 HP 1 2 1 1 - - -
Excavator, 324 2 7 5 4 2 2 2
Excavator, 328 1 1 1 - - 1 -
Excavator, 345 1 2 2 1 - 1 1
Confidential Page 11
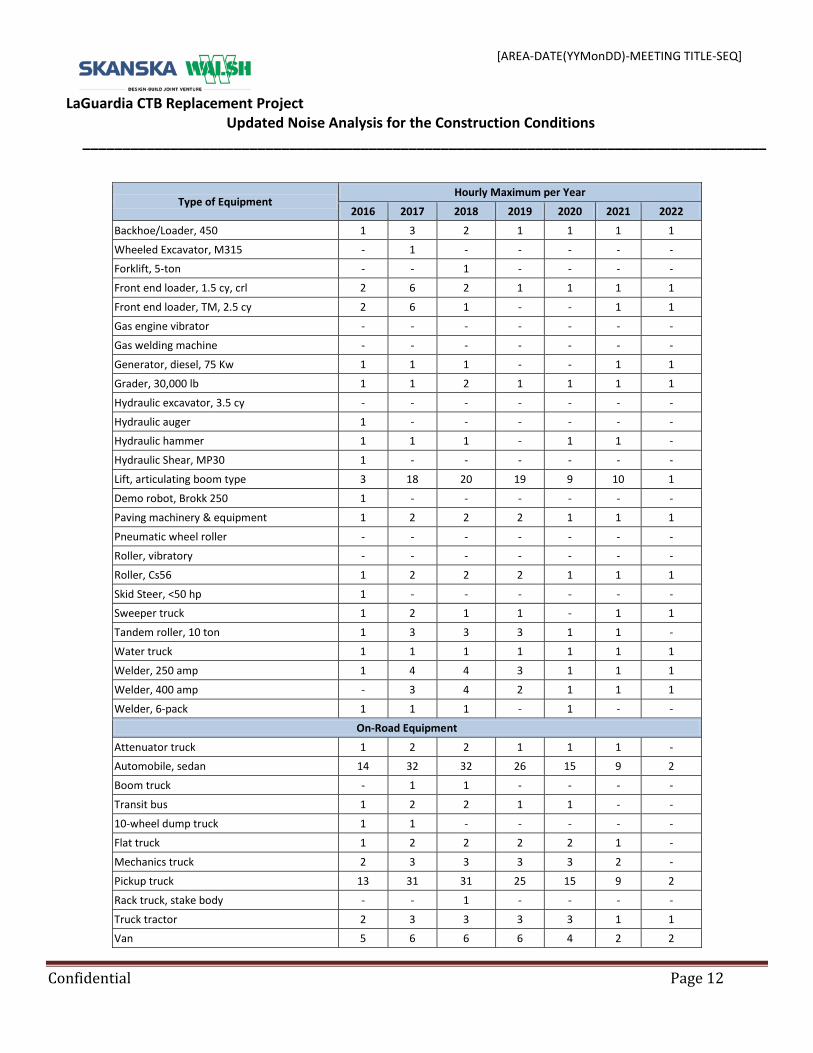
[AREA-DATE(YYMonDD)-MEETING TITLE-SEQ]
LaGuardia CTB Replacement Project Updated Noise Analysis for the Construction Conditions
______________________________________________________________________________________
Type of Equipment Hourly Maximum per Year
2016 2017 2018 2019 2020 2021 2022
Backhoe/Loader, 450 1 3 2 1 1 1 1
Wheeled Excavator, M315 - 1 - - - - -
Forklift, 5-ton - - 1 - - - -
Front end loader, 1.5 cy, crl 2 6 2 1 1 1 1
Front end loader, TM, 2.5 cy 2 6 1 - - 1 1
Gas engine vibrator - - - - - - -
Gas welding machine - - - - - - -
Generator, diesel, 75 Kw 1 1 1 - - 1 1
Grader, 30,000 lb 1 1 2 1 1 1 1
Hydraulic excavator, 3.5 cy - - - - - - -
Hydraulic auger 1 - - - - - -
Hydraulic hammer 1 1 1 - 1 1 -
Hydraulic Shear, MP30 1 - - - - - -
Lift, articulating boom type 3 18 20 19 9 10 1
Demo robot, Brokk 250 1 - - - - - -
Paving machinery & equipment 1 2 2 2 1 1 1
Pneumatic wheel roller - - - - - - -
Roller, vibratory - - - - - - -
Roller, Cs56 1 2 2 2 1 1 1
Skid Steer, <50 hp 1 - - - - - -
Sweeper truck 1 2 1 1 - 1 1
Tandem roller, 10 ton 1 3 3 3 1 1 -
Water truck 1 1 1 1 1 1 1
Welder, 250 amp 1 4 4 3 1 1 1
Welder, 400 amp - 3 4 2 1 1 1
Welder, 6-pack 1 1 1 - 1 - -
On-Road Equipment
Attenuator truck 1 2 2 1 1 1 -
Automobile, sedan 14 32 32 26 15 9 2
Boom truck - 1 1 - - - -
Transit bus 1 2 2 1 1 - -
10-wheel dump truck 1 1 - - - - -
Flat truck 1 2 2 2 2 1 -
Mechanics truck 2 3 3 3 3 2 -
Pickup truck 13 31 31 25 15 9 2
Rack truck, stake body - - 1 - - - -
Truck tractor 2 3 3 3 3 1 1
Van 5 6 6 6 4 2 2
Confidential Page 12
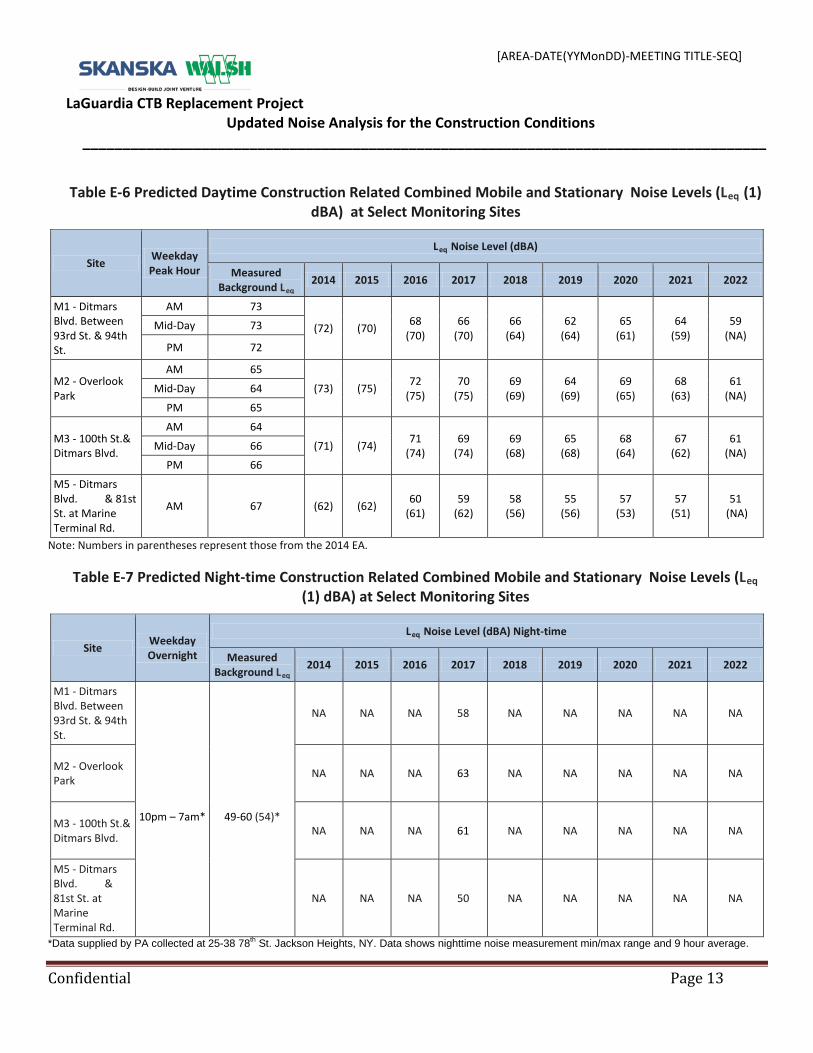
[AREA-DATE(YYMonDD)-MEETING TITLE-SEQ]
LaGuardia CTB Replacement Project Updated Noise Analysis for the Construction Conditions
______________________________________________________________________________________
Table E-6 Predicted Daytime Construction Related Combined Mobile and Stationary Noise Levels (Leq (1)
dBA) at Select Monitoring Sites
Site Weekday Peak Hour
Leq Noise Level (dBA)
Measured Background Leq 2014 2015 2016 2017 2018 2019 2020 2021 2022
M1 - Ditmars Blvd. Between 93rd St. & 94th St.
AM 73
(72) (70) 68 (70)
66 (70)
66 (64)
62 (64)
65 (61)
64 (59)
59 (NA)
Mid-Day 73
PM 72
M2 - Overlook Park
AM 65
(73) (75) 72 (75)
70 (75)
69 (69)
64 (69)
69 (65)
68 (63)
61 (NA) Mid-Day 64
PM 65
M3 - 100th St.& Ditmars Blvd.
AM 64
(71) (74) 71 (74)
69 (74)
69 (68)
65 (68)
68 (64)
67 (62)
61 (NA) Mid-Day 66
PM 66
M5 - Ditmars Blvd. & 81st St. at Marine Terminal Rd.
AM 67 (62) (62) 60 (61)
59 (62)
58 (56)
55 (56)
57 (53)
57 (51)
51 (NA)
Note: Numbers in parentheses represent those from the 2014 EA.
Table E-7 Predicted Night-time Construction Related Combined Mobile and Stationary Noise Levels (Leq (1) dBA) at Select Monitoring Sites
Site Weekday Overnight
Leq Noise Level (dBA) Night-time
Measured Background Leq 2014 2015 2016 2017 2018 2019 2020 2021 2022
M1 - Ditmars Blvd. Between 93rd St. & 94th St.
10pm – 7am*
49-60 (54)*
NA NA NA 58 NA NA NA NA NA
M2 - Overlook Park NA NA NA 63 NA NA NA NA NA
M3 - 100th St.& Ditmars Blvd. NA NA NA 61 NA NA NA NA NA
M5 - Ditmars Blvd. & 81st St. at Marine Terminal Rd.
NA NA NA 50 NA NA NA NA NA
*Data supplied by PA collected at 25-38 78th St. Jackson Heights, NY. Data shows nighttime noise measurement min/max range and 9 hour average.
Confidential Page 13
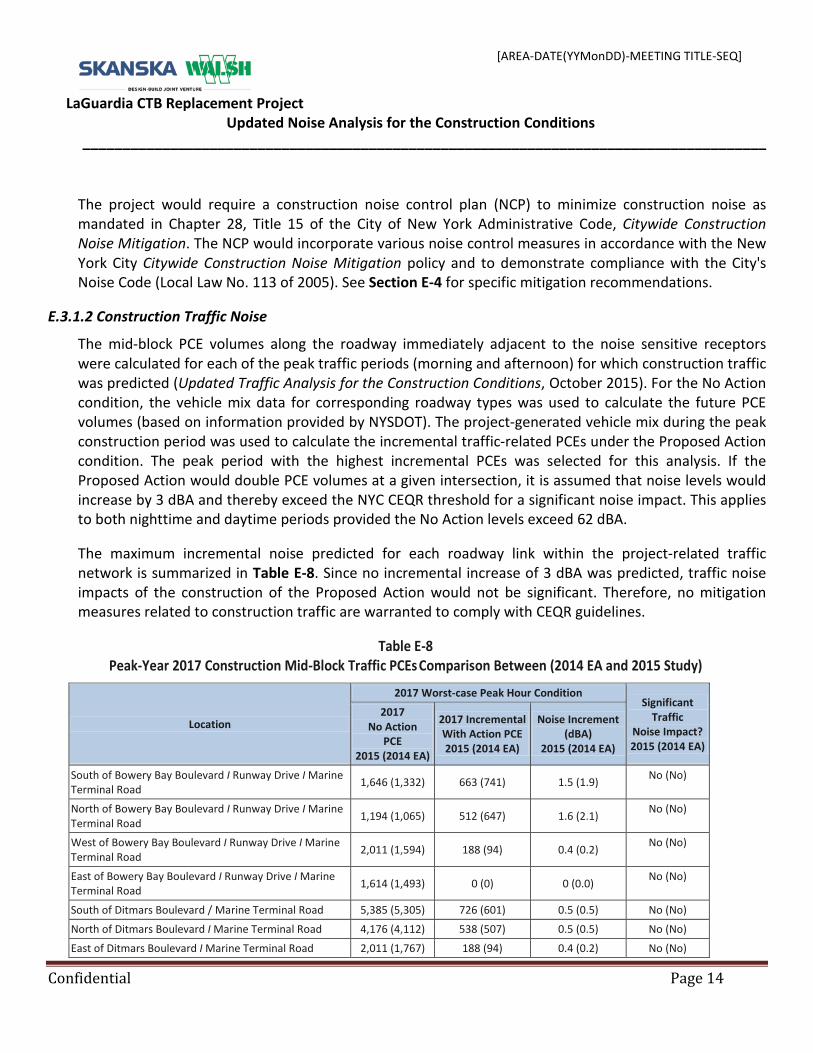
[AREA-DATE(YYMonDD)-MEETING TITLE-SEQ]
LaGuardia CTB Replacement Project Updated Noise Analysis for the Construction Conditions
______________________________________________________________________________________
The project would require a construction noise control plan (NCP) to minimize construction noise as mandated in Chapter 28, Title 15 of the City of New York Administrative Code, Citywide Construction Noise Mitigation. The NCP would incorporate various noise control measures in accordance with the New York City Citywide Construction Noise Mitigation policy and to demonstrate compliance with the City's Noise Code (Local Law No. 113 of 2005). See Section E-4 for specific mitigation recommendations.
E.3.1.2 Construction Traffic Noise
The mid-block PCE volumes along the roadway immediately adjacent to the noise sensitive receptors were calculated for each of the peak traffic periods (morning and afternoon) for which construction traffic was predicted (Updated Traffic Analysis for the Construction Conditions, October 2015). For the No Action condition, the vehicle mix data for corresponding roadway types was used to calculate the future PCE volumes (based on information provided by NYSDOT). The project-generated vehicle mix during the peak construction period was used to calculate the incremental traffic-related PCEs under the Proposed Action condition. The peak period with the highest incremental PCEs was selected for this analysis. If the Proposed Action would double PCE volumes at a given intersection, it is assumed that noise levels would increase by 3 dBA and thereby exceed the NYC CEQR threshold for a significant noise impact. This applies to both nighttime and daytime periods provided the No Action levels exceed 62 dBA.
The maximum incremental noise predicted for each roadway link within the project-related traffic network is summarized in Table E-8. Since no incremental increase of 3 dBA was predicted, traffic noise impacts of the construction of the Proposed Action would not be significant. Therefore, no mitigation measures related to construction traffic are warranted to comply with CEQR guidelines.
Table E-8 Peak-Year 2017 Construction Mid-Block Traffic PCEs Comparison Between (2014 EA and 2015 Study)
Location
2017 Worst-case Peak Hour Condition Significant
Traffic Noise Impact? 2015 (2014 EA)
2017 No Action
PCE 2015 (2014 EA)
2017 Incremental With Action PCE 2015 (2014 EA)
Noise Increment (dBA)
2015 (2014 EA)
South of Bowery Bay Boulevard I Runway Drive I Marine Terminal Road 1,646 (1,332) 663 (741) 1.5 (1.9) No (No)
North of Bowery Bay Boulevard I Runway Drive I Marine Terminal Road 1,194 (1,065) 512 (647) 1.6 (2.1) No (No)
West of Bowery Bay Boulevard I Runway Drive I Marine Terminal Road 2,011 (1,594) 188 (94) 0.4 (0.2) No (No)
East of Bowery Bay Boulevard I Runway Drive I Marine Terminal Road 1,614 (1,493) 0 (0) 0 (0.0) No (No)
South of Ditmars Boulevard / Marine Terminal Road 5,385 (5,305) 726 (601) 0.5 (0.5) No (No)
North of Ditmars Boulevard I Marine Terminal Road 4,176 (4,112) 538 (507) 0.5 (0.5) No (No)
East of Ditmars Boulevard I Marine Terminal Road 2,011 (1,767) 188 (94) 0.4 (0.2) No (No)
Confidential Page 14

[AREA-DATE(YYMonDD)-MEETING TITLE-SEQ]
LaGuardia CTB Replacement Project Updated Noise Analysis for the Construction Conditions
______________________________________________________________________________________
Location
2017 Worst-case Peak Hour Condition Significant
Traffic Noise Impact? 2015 (2014 EA)
2017 No Action
PCE 2015 (2014 EA)
2017 Incremental With Action PCE 2015 (2014 EA)
Noise Increment (dBA)
2015 (2014 EA)
South of Astoria Boulevard North I 82nd Street I Ditmars Boulevard 3,267 (3,106) 368 (411) 0.5 (0.5) No (No)
North of Astoria Boulevard North / 82nd Street I Ditmars Boulevard 5,385 (5,301) 725 (601) 0.5 (0.5) No (No)
West of Astoria Boulevard North I 82nd Street I Ditmars Boulevard 2,380 (1,871) 344 (316) 0.6 (0.7) No (No)
East of Astoria Boulevard North I 82nd Street I Ditmars Boulevard 4,366 (3,914) 83 (143) 0.1 (0.2) No (No)
South of 23rd Avenue I 82nd Street 1,564 (1,310) 139 (98) 0.4 (0.3) No (No)
North of 23rd Avenue / 82nd Street 3,267 (2,983) 368 (458) 0.5 (0.6) No (No)
West of 23rd Avenue I 82nd Street 843 (904) 229 (360) 1.0 (1.5) No (No)
East of 23rd Avenue I 82nd Street 1,4133 (1,233) 0(0) 0.0 (0.0) No (No)
South of Astoria Boulevard I 82nd Street I 24th Avenue 571 (539) 0 (0) 0 (0.0) No (No)
North of Astoria Boulevard I 82nd Street I 24th Avenue 1,473 (1,438) 139 (51) 0.4 (0.2) No (No)
West of Astoria Boulevard I 82nd Street I 24th Avenue 4,151 (4,391) 94 (94) 0.1 (0.1) No (No)
East of Astoria Boulevard I 82nd Street / 24th Avenue 4,935 (5,231) 233 (145) 0.2 (0.1) No (No)
South of Astoria Boulevard North I 79th Street 4,147 (3,153) 0 (47) 0 (0.1) No (No)
West of Astoria Boulevard North I 79th Street 5,150 (5,446) 344 (363) 0.3 (0.3) No (No)
East of Astoria Boulevard North I 79th Street 1,616 (2,293) 274 (316) 0.7 (0.6) No (No)
South of Astoria Boulevard North / 23rd Avenue 3,304 (2,387) 0 (47) 0 (0.1) No (No)
North of Astoria Boulevard North / 23rd Avenue 4,147 (3,153) 0 (47) 0 (0.1) No (No)
West of Astoria Boulevard North I 23rd Avenue 1,811 (1,794) 229 (360) 0.5 (0.8) No (No)
East of Astoria Boulevard North I 23rd Avenue 969 (959) 229 (360) 0.9 (1.4) No (No)
South of Astoria Boulevard I 77th Street 477 (474) 0 (0) 0 (0.0) No (No)
North of Astoria Boulevard I 77th Street 1,468 (1,505) 0 (0) 0 (0.0) No (No)
West of Astoria Boulevard I 77th Street 4,092 (4,302) 551 (407) 0.4 (0.4) No (No)
East of Astoria Boulevard I 77th Street 3,101 (3,272) 370 (407) 0.5 (0.5) No (No)
South of LaGuardia Access Road I 94th Street 3,269 (4,013) 704 (613) 0.8 (0.6) No (No)
North of LaGuardia Access Road I 94th Street 2,866 (3,655) 704 (613) 1.0 (0.7) No (No)
West of LaGuardia Access Road I 94th Street 662 (1,048) 0 (0) 0 (0.0) No (No)
East of LaGuardia Access Road I 94th Street 3,467 (3,820) 0 (0) 0 (0.0) No (No)
South of Ditmars Boulevard / 94th Street 1,470 (1,364) 658 (470) 1.6 (1.3) No (No)
North of Ditmars Boulevard I 94th Street 3,269 (1,999) 704 (470) 0.8 (0.9) No (No)
West of Ditmars Boulevard / 94th Street 4,053 (1,065) 83 (0) 0.1 (0.0) No (No)
East of Ditmars Boulevard I 94th Street 1,505 (1,359) 0 (0) 0 (0.0) No (No)
South of 23rd Avenue / 94th Street 904 (811) 658 (470) 2.4 (2.0) No (No)
North of 23rd Avenue / 94th Street 1,470 (1,364) 658 (470) 1.6 (1.3) No (No)
Confidential Page 15
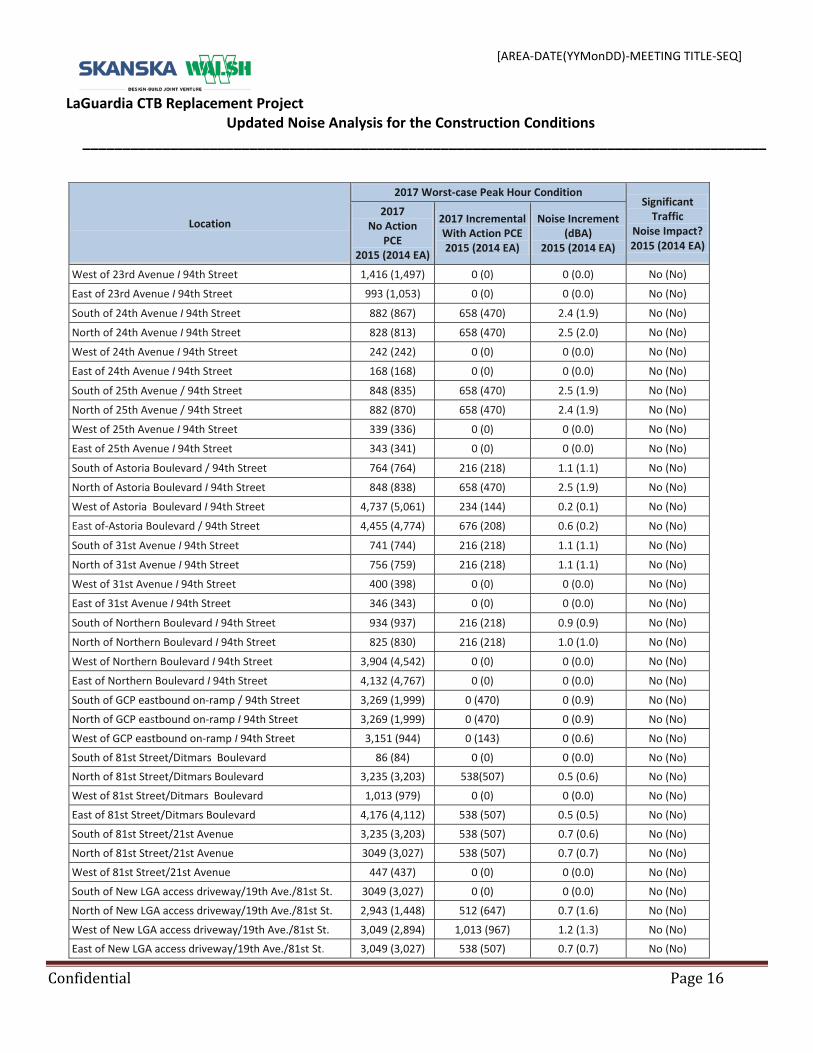
[AREA-DATE(YYMonDD)-MEETING TITLE-SEQ]
LaGuardia CTB Replacement Project Updated Noise Analysis for the Construction Conditions
______________________________________________________________________________________
Location
2017 Worst-case Peak Hour Condition Significant
Traffic Noise Impact? 2015 (2014 EA)
2017 No Action
PCE 2015 (2014 EA)
2017 Incremental With Action PCE 2015 (2014 EA)
Noise Increment (dBA)
2015 (2014 EA)
West of 23rd Avenue I 94th Street 1,416 (1,497) 0 (0) 0 (0.0) No (No)
East of 23rd Avenue I 94th Street 993 (1,053) 0 (0) 0 (0.0) No (No)
South of 24th Avenue I 94th Street 882 (867) 658 (470) 2.4 (1.9) No (No)
North of 24th Avenue I 94th Street 828 (813) 658 (470) 2.5 (2.0) No (No)
West of 24th Avenue I 94th Street 242 (242) 0 (0) 0 (0.0) No (No)
East of 24th Avenue I 94th Street 168 (168) 0 (0) 0 (0.0) No (No)
South of 25th Avenue / 94th Street 848 (835) 658 (470) 2.5 (1.9) No (No)
North of 25th Avenue / 94th Street 882 (870) 658 (470) 2.4 (1.9) No (No)
West of 25th Avenue I 94th Street 339 (336) 0 (0) 0 (0.0) No (No)
East of 25th Avenue I 94th Street 343 (341) 0 (0) 0 (0.0) No (No)
South of Astoria Boulevard / 94th Street 764 (764) 216 (218) 1.1 (1.1) No (No)
North of Astoria Boulevard I 94th Street 848 (838) 658 (470) 2.5 (1.9) No (No)
West of Astoria Boulevard I 94th Street 4,737 (5,061) 234 (144) 0.2 (0.1) No (No)
East of-Astoria Boulevard / 94th Street 4,455 (4,774) 676 (208) 0.6 (0.2) No (No)
South of 31st Avenue I 94th Street 741 (744) 216 (218) 1.1 (1.1) No (No)
North of 31st Avenue I 94th Street 756 (759) 216 (218) 1.1 (1.1) No (No)
West of 31st Avenue I 94th Street 400 (398) 0 (0) 0 (0.0) No (No)
East of 31st Avenue I 94th Street 346 (343) 0 (0) 0 (0.0) No (No)
South of Northern Boulevard I 94th Street 934 (937) 216 (218) 0.9 (0.9) No (No)
North of Northern Boulevard I 94th Street 825 (830) 216 (218) 1.0 (1.0) No (No)
West of Northern Boulevard I 94th Street 3,904 (4,542) 0 (0) 0 (0.0) No (No)
East of Northern Boulevard I 94th Street 4,132 (4,767) 0 (0) 0 (0.0) No (No)
South of GCP eastbound on-ramp / 94th Street 3,269 (1,999) 0 (470) 0 (0.9) No (No)
North of GCP eastbound on-ramp I 94th Street 3,269 (1,999) 0 (470) 0 (0.9) No (No)
West of GCP eastbound on-ramp I 94th Street 3,151 (944) 0 (143) 0 (0.6) No (No)
South of 81st Street/Ditmars Boulevard 86 (84) 0 (0) 0 (0.0) No (No)
North of 81st Street/Ditmars Boulevard 3,235 (3,203) 538(507) 0.5 (0.6) No (No)
West of 81st Street/Ditmars Boulevard 1,013 (979) 0 (0) 0 (0.0) No (No)
East of 81st Street/Ditmars Boulevard 4,176 (4,112) 538 (507) 0.5 (0.5) No (No)
South of 81st Street/21st Avenue 3,235 (3,203) 538 (507) 0.7 (0.6) No (No)
North of 81st Street/21st Avenue 3049 (3,027) 538 (507) 0.7 (0.7) No (No)
West of 81st Street/21st Avenue 447 (437) 0 (0) 0 (0.0) No (No)
South of New LGA access driveway/19th Ave./81st St. 3049 (3,027) 0 (0) 0 (0.0) No (No)
North of New LGA access driveway/19th Ave./81st St. 2,943 (1,448) 512 (647) 0.7 (1.6) No (No)
West of New LGA access driveway/19th Ave./81st St. 3,049 (2,894) 1,013 (967) 1.2 (1.3) No (No)
East of New LGA access driveway/19th Ave./81st St. 3,049 (3,027) 538 (507) 0.7 (0.7) No (No)
Confidential Page 16
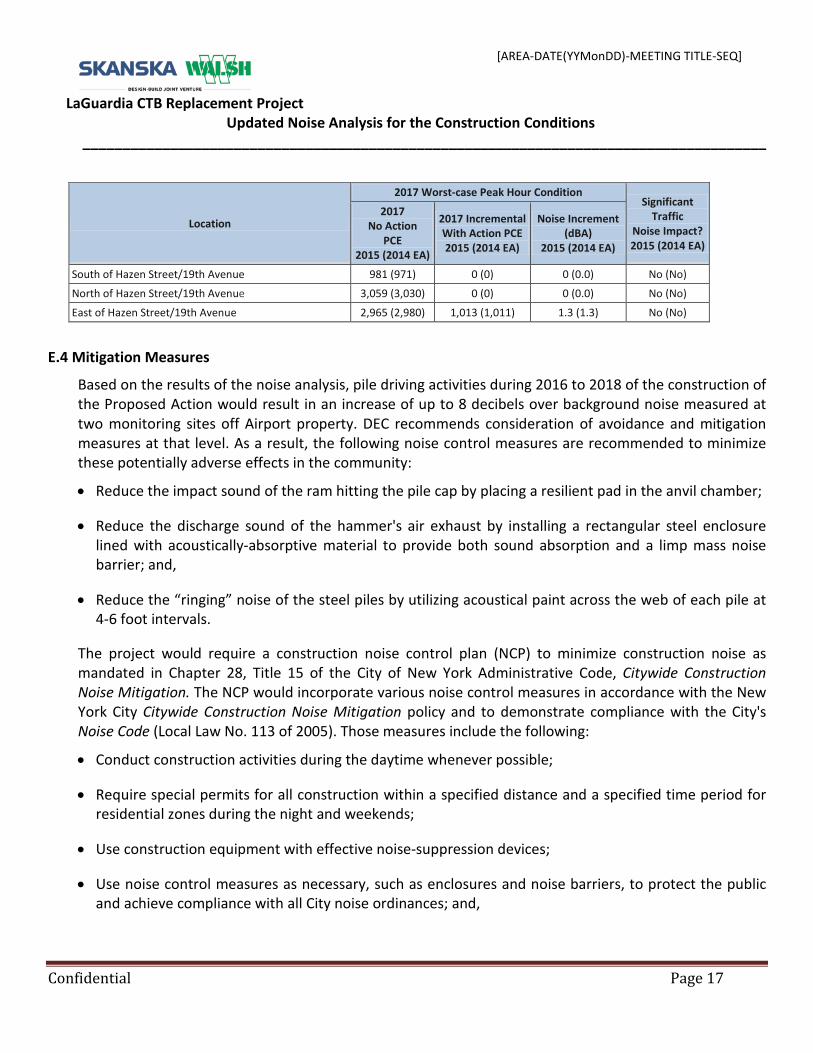
[AREA-DATE(YYMonDD)-MEETING TITLE-SEQ]
LaGuardia CTB Replacement Project Updated Noise Analysis for the Construction Conditions
______________________________________________________________________________________
Location
2017 Worst-case Peak Hour Condition Significant
Traffic Noise Impact? 2015 (2014 EA)
2017 No Action
PCE 2015 (2014 EA)
2017 Incremental With Action PCE 2015 (2014 EA)
Noise Increment (dBA)
2015 (2014 EA)
South of Hazen Street/19th Avenue 981 (971) 0 (0) 0 (0.0) No (No)
North of Hazen Street/19th Avenue 3,059 (3,030) 0 (0) 0 (0.0) No (No)
East of Hazen Street/19th Avenue 2,965 (2,980) 1,013 (1,011) 1.3 (1.3) No (No)
E.4 Mitigation Measures
Based on the results of the noise analysis, pile driving activities during 2016 to 2018 of the construction of the Proposed Action would result in an increase of up to 8 decibels over background noise measured at two monitoring sites off Airport property. DEC recommends consideration of avoidance and mitigation measures at that level. As a result, the following noise control measures are recommended to minimize these potentially adverse effects in the community:
• Reduce the impact sound of the ram hitting the pile cap by placing a resilient pad in the anvil chamber;
• Reduce the discharge sound of the hammer's air exhaust by installing a rectangular steel enclosurelined with acoustically-absorptive material to provide both sound absorption and a limp mass noisebarrier; and,
• Reduce the “ringing” noise of the steel piles by utilizing acoustical paint across the web of each pile at4-6 foot intervals.
The project would require a construction noise control plan (NCP) to minimize construction noise as mandated in Chapter 28, Title 15 of the City of New York Administrative Code, Citywide Construction Noise Mitigation. The NCP would incorporate various noise control measures in accordance with the New York City Citywide Construction Noise Mitigation policy and to demonstrate compliance with the City's Noise Code (Local Law No. 113 of 2005). Those measures include the following:
• Conduct construction activities during the daytime whenever possible;
• Require special permits for all construction within a specified distance and a specified time period forresidential zones during the night and weekends;
• Use construction equipment with effective noise-suppression devices;
• Use noise control measures as necessary, such as enclosures and noise barriers, to protect the publicand achieve compliance with all City noise ordinances; and,
Confidential Page 17
[AREA-DATE(YYMonDD)-MEETING TITLE-SEQ]
LaGuardia CTB Replacement Project Updated Noise Analysis for the Construction Conditions
______________________________________________________________________________________
• Conduct all operations in a manner that will minimize, to the greatest extent feasible, disturbance tothe public in areas adjacent to the construction activities and to occupants of nearby buildings.
E.5 Summary The noise re-assessment was limited to the temporary construction related activities. There are no operational changes associated with the project since issuance of the 2014 EA; as such, the operation analyses in the June 2014 Noise Technical Report (Appendix E) are still valid. Construction activities would include use of equipment on-site as well as construction traffic in the surrounding area. The increased construction traffic would result in only minor noise increments. Use of construction equipment on-site (particularly pile-driving) would likely result in noticeable noise increases above existing background levels in a couple of areas (representative receptor sites M2 and M3) around the construction site during the early stages (2016 to 2018) of the project. Mitigation measures would be implemented and a noise control plan drafted to minimize the adverse effects on the community.
Confidential Page 18
Attachment 7
Comparison – New CTB Roadway Layout and Previously Approved Layout
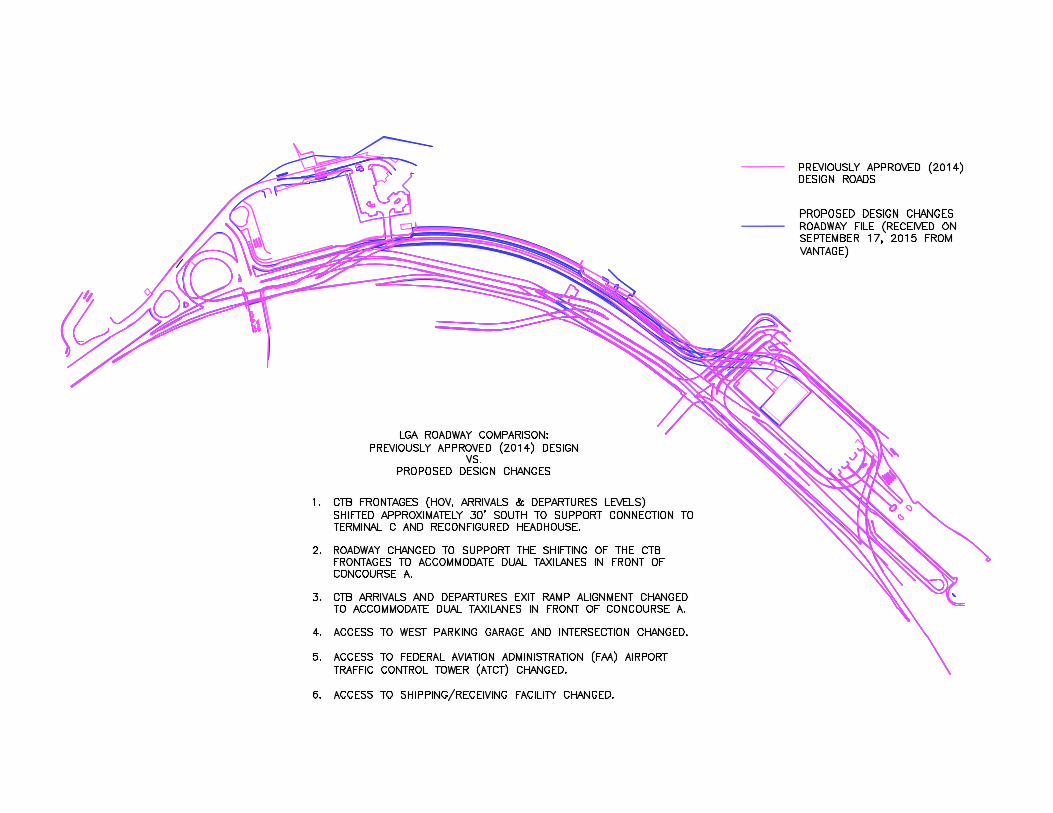
Attachment 8
Technical Memorandum – LGA CTB CO Hot Spot Analysis
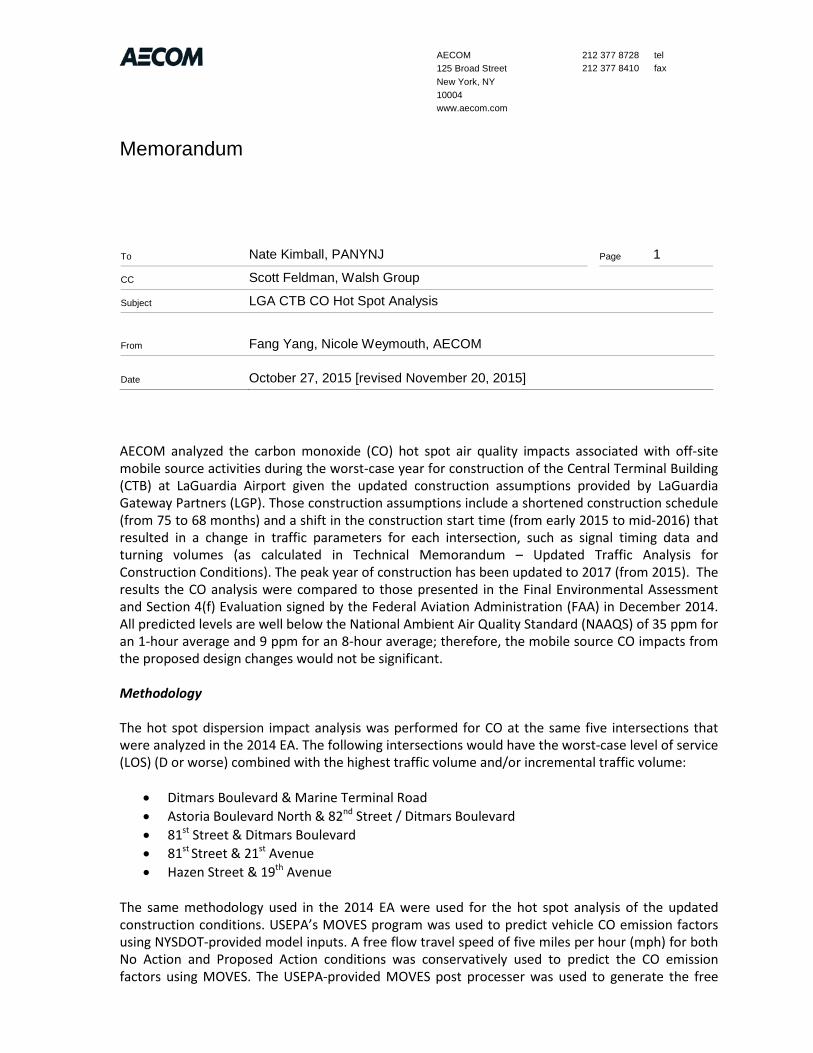
\ AECOM 125 Broad Street New York, NY 10004 www.aecom.com
212 377 8728 tel 212 377 8410 fax
Memorandum
AECOM analyzed the carbon monoxide (CO) hot spot air quality impacts associated with off-site mobile source activities during the worst-case year for construction of the Central Terminal Building (CTB) at LaGuardia Airport given the updated construction assumptions provided by LaGuardia Gateway Partners (LGP). Those construction assumptions include a shortened construction schedule (from 75 to 68 months) and a shift in the construction start time (from early 2015 to mid-2016) that resulted in a change in traffic parameters for each intersection, such as signal timing data and turning volumes (as calculated in Technical Memorandum – Updated Traffic Analysis for Construction Conditions). The peak year of construction has been updated to 2017 (from 2015). The results the CO analysis were compared to those presented in the Final Environmental Assessment and Section 4(f) Evaluation signed by the Federal Aviation Administration (FAA) in December 2014. All predicted levels are well below the National Ambient Air Quality Standard (NAAQS) of 35 ppm for an 1-hour average and 9 ppm for an 8-hour average; therefore, the mobile source CO impacts from the proposed design changes would not be significant.
Methodology
The hot spot dispersion impact analysis was performed for CO at the same five intersections that were analyzed in the 2014 EA. The following intersections would have the worst-case level of service (LOS) (D or worse) combined with the highest traffic volume and/or incremental traffic volume:
• Ditmars Boulevard & Marine Terminal Road• Astoria Boulevard North & 82nd Street / Ditmars Boulevard• 81st Street & Ditmars Boulevard• 81st Street & 21st Avenue• Hazen Street & 19th Avenue
The same methodology used in the 2014 EA were used for the hot spot analysis of the updated construction conditions. USEPA’s MOVES program was used to predict vehicle CO emission factors using NYSDOT-provided model inputs. A free flow travel speed of five miles per hour (mph) for both No Action and Proposed Action conditions was conservatively used to predict the CO emission factors using MOVES. The USEPA-provided MOVES post processer was used to generate the free
To Nate Kimball, PANYNJ Page 1
CC Scott Feldman, Walsh Group
Subject LGA CTB CO Hot Spot Analysis
From Fang Yang, Nicole Weymouth, AECOM
Date October 27, 2015 [revised November 20, 2015]
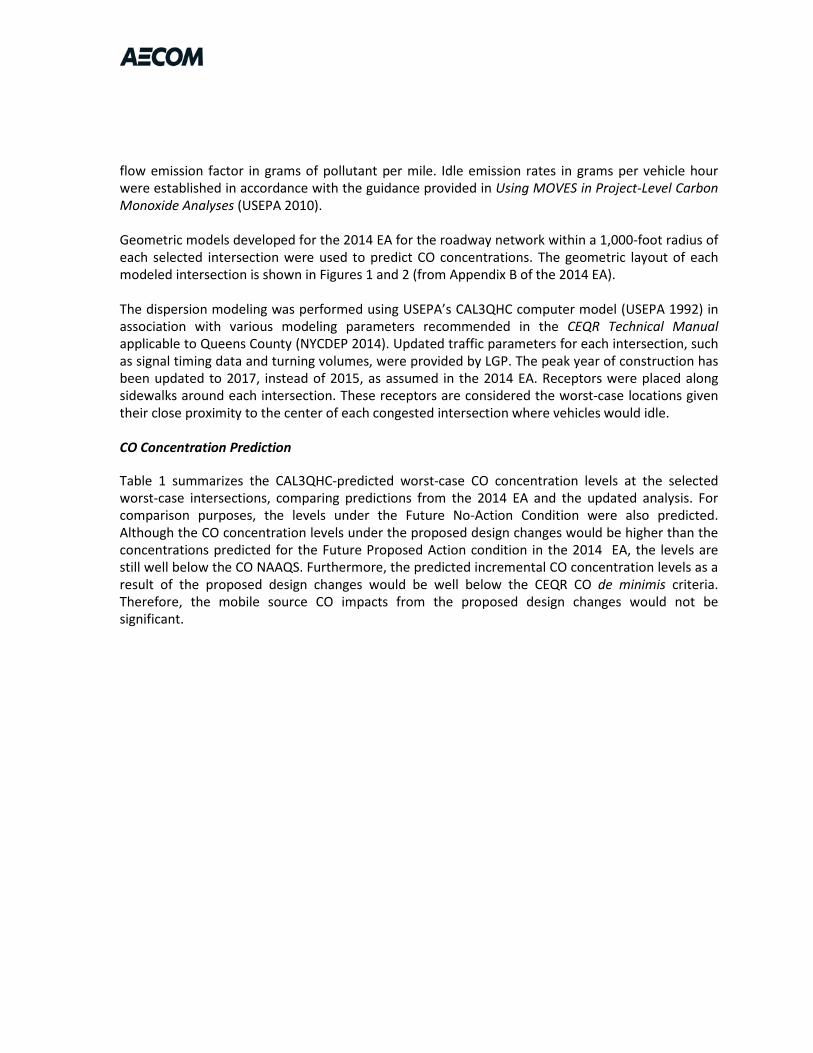
flow emission factor in grams of pollutant per mile. Idle emission rates in grams per vehicle hour were established in accordance with the guidance provided in Using MOVES in Project-Level Carbon Monoxide Analyses (USEPA 2010). Geometric models developed for the 2014 EA for the roadway network within a 1,000-foot radius of each selected intersection were used to predict CO concentrations. The geometric layout of each modeled intersection is shown in Figures 1 and 2 (from Appendix B of the 2014 EA). The dispersion modeling was performed using USEPA’s CAL3QHC computer model (USEPA 1992) in association with various modeling parameters recommended in the CEQR Technical Manual applicable to Queens County (NYCDEP 2014). Updated traffic parameters for each intersection, such as signal timing data and turning volumes, were provided by LGP. The peak year of construction has been updated to 2017, instead of 2015, as assumed in the 2014 EA. Receptors were placed along sidewalks around each intersection. These receptors are considered the worst-case locations given their close proximity to the center of each congested intersection where vehicles would idle. CO Concentration Prediction
Table 1 summarizes the CAL3QHC-predicted worst-case CO concentration levels at the selected worst-case intersections, comparing predictions from the 2014 EA and the updated analysis. For comparison purposes, the levels under the Future No-Action Condition were also predicted. Although the CO concentration levels under the proposed design changes would be higher than the concentrations predicted for the Future Proposed Action condition in the 2014 EA, the levels are still well below the CO NAAQS. Furthermore, the predicted incremental CO concentration levels as a result of the proposed design changes would be well below the CEQR CO de minimis criteria. Therefore, the mobile source CO impacts from the proposed design changes would not be significant.
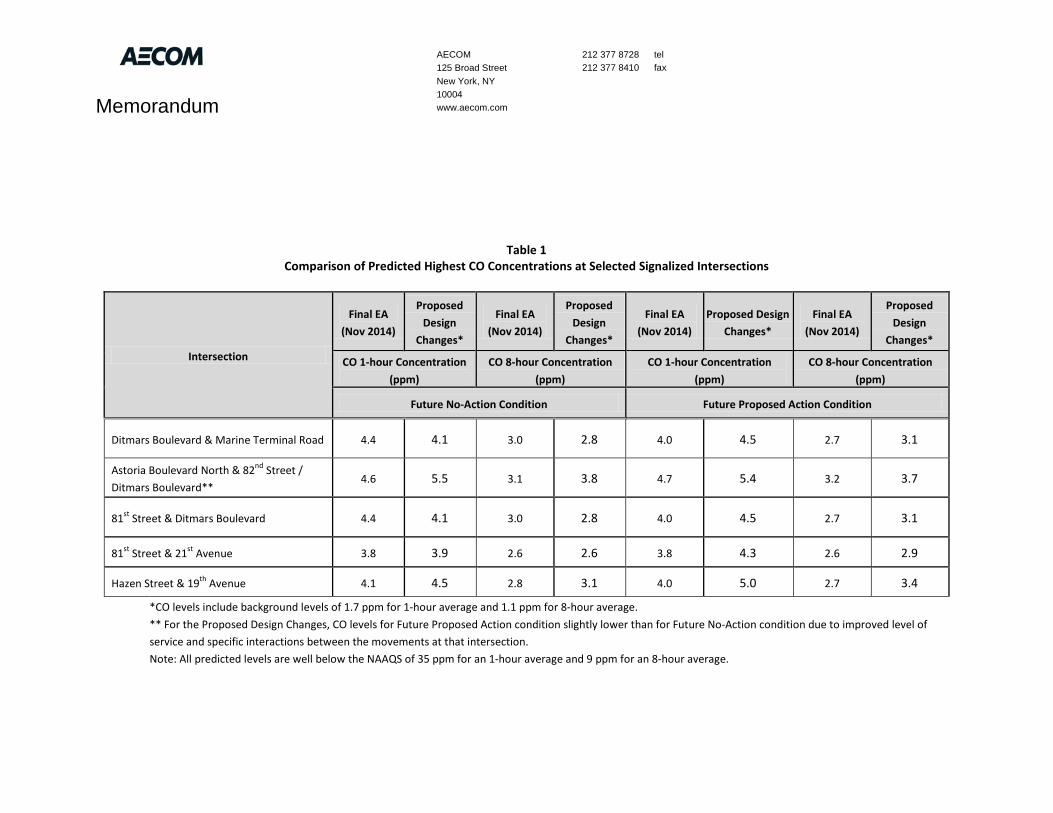
\ AECOM 125 Broad Street New York, NY 10004 www.aecom.com
212 377 8728 tel 212 377 8410 fax
Memorandum
Table 1 Comparison of Predicted Highest CO Concentrations at Selected Signalized Intersections
Intersection
Final EA (Nov 2014)
Proposed Design
Changes*
Final EA (Nov 2014)
Proposed Design
Changes*
Final EA (Nov 2014)
Proposed Design Changes*
Final EA (Nov 2014)
Proposed Design
Changes*
CO 1-hour Concentration (ppm)
CO 8-hour Concentration (ppm)
CO 1-hour Concentration (ppm)
CO 8-hour Concentration (ppm)
Future No-Action Condition Future Proposed Action Condition
Ditmars Boulevard & Marine Terminal Road 4.4 4.1 3.0 2.8 4.0 4.5 2.7 3.1
Astoria Boulevard North & 82nd Street / Ditmars Boulevard**
4.6 5.5 3.1 3.8 4.7 5.4 3.2 3.7
81st Street & Ditmars Boulevard 4.4 4.1 3.0 2.8 4.0 4.5 2.7 3.1
81st Street & 21st Avenue 3.8 3.9 2.6 2.6 3.8 4.3 2.6 2.9
Hazen Street & 19th Avenue 4.1 4.5 2.8 3.1 4.0 5.0 2.7 3.4
*CO levels include background levels of 1.7 ppm for 1-hour average and 1.1 ppm for 8-hour average.** For the Proposed Design Changes, CO levels for Future Proposed Action condition slightly lower than for Future No-Action condition due to improved level of service and specific interactions between the movements at that intersection. Note: All predicted levels are well below the NAAQS of 35 ppm for an 1-hour average and 9 ppm for an 8-hour average.
Attachment 9
Hydrant Fuel Lines and Pits
B737 MAX 9
B737
MAX
9
A
E
F
L
W
FF
B737 MAX 8
B737
MAX
8
F
FvFv
B737 MAX 9
B737
MAX
9
A
E
F
L
W
FF
B737 MAX 8
B737
MAX
8
F
FvFv
MD-
88
MD-88
B737 MAX 9
B737
MAX
9
A
E
F
L
W
FF
B737 MAX 8
B737
MAX
8
F
FvFv
MD-
88
MD-88B737 MAX 9
B737
MAX
9
A
E
F
L
W
F
F
B737 MAX 8
B737
MAX
8
F
Fv
Fv
B737 MAX 9
B737
MAX
9
A
E
F
L
W
F
F
B737 MAX 8
B737
MAX
8
F
Fv
Fv
B737 MAX 7
B737
MAX
7
A
E
F
L W
F
F
B737 MAX 9
B737 MAX 9
A
E
F
L
W
F
F
B737 MAX 8
B737 MAX 8
F
Fv
Fv
B737 MAX 9
B737 MAX 9
A
E
F
L
W
F
F
B737 MAX 8
B737 MAX 8
F
Fv
Fv
B767-300ERW
B767-300ERW
B767-300ERW
B767-300ERW
MD-88
MD-88B737 MAX 9
B737 MAX 9
A
E
F
L
W
F
F
B737 MAX 8
B737 MAX 8
F
Fv
Fv
MD-88
MD-88
B737 M
AX 9
B737 MAX 9
A
EF
LW
F
F
B737 M
AX 8
B737 MAX 8
F
Fv
Fv
MD-88
MD-
88B7
37 M
AX 9
B737 MAX 9
A
E
F
L
W
F
F
B737
MAX
8
B737 MAX 8
F
Fv
Fv
MD-88
MD-
88B7
37 M
AX 9
B737 MAX 9
A
E
F
L
WF
F
B737 MAX 9
B737 MAX 9
A
E
F
L
W
F
F
B737 MAX 8
B737 MAX 8
F
Fv
Fv
B737 MAX 9
B737 MAX 9
A
E
F
L
W
F
F
B737 MAX 8
B737 MAX 8
F
Fv
Fv
B737 MAX 9
B737 MAX 9
A
E
F
L
W
F
F
B737 MAX 8
B737 MAX 8
F
Fv
Fv
B737 MAX 9
B737 MAX 9
A
E
F
L
W
F
F
B737 MAX 8
B737 MAX 8
F
Fv
Fv
B737 MAX 9
B737
MAX
9
A
E
F
L
W
FF
B737
MAX
9
B737 MAX 9
A
E
F
L
W
FF
MD-
88
MD-88
MD-
88
MD-88
MD-
88
MD-88
B737
MAX
8
B737 MAX 8
F
Fv
Fv
B767-400ER
B767-400ER
A318 PW-S
A318 P
W-S
MD90-30
MD90-30
A31
8 P
W-S
A318 P
W-S
MD
90-30
MD90-30
B767-400ER
B767-400ER
MD9
0-30
MD90-30
MD9
0-30
MD90-30
MD9
0-30
MD90-30
A318 PW-S
A318 P
W-S
MD
90-3
0
MD90-30
MD9
0-30
MD90-30
A318 P
W-S
A318 PW-S
MD90-30
MD9
0-30
MD90-30
MD9
0-30
MD90-30
MD9
0-30
MD-88
MD-
88B7
37 M
AX 9
B737 MAX 9
A
E
F
L
W
FF
B737
MAX
8
B737 MAX 8
F
FvFv
MD90-30
MD9
0-30
MD-88
MD-
88B7
37 M
AX 9
B737 MAX 9
A
E
F
L
W
FF
B737
MAX
8
B737 MAX 8
F
FvFv
MD90-30
MD9
0-30
MD-88
MD-
88B7
37 M
AX 9
B737 MAX 9
A
E
F
L
W
FF
B737
MAX
8
B737 MAX 8
F
FvFv
MD90-30
MD9
0-30
B737
MAX
9
B737 MAX 9
A
E
F
L
W
FF
B737
MAX
8
B737 MAX 8
F
FvFv
MD90-30
MD
90-3
0B7
37 M
AX 9
B737 MAX 9
A
E
F
L
W
F
F
B737
MAX
8
B737 MAX 8
F
Fv
Fv
A318 P
W-S
A318 PW-S
B737
MAX
9
B737 MAX 9
A
E
F
L
W
F
F
B737
MAX
8
B737 MAX 8
F
Fv
Fv
A318 P
W-S
A318 PW-S
MD90-30
MD90-30B737 MAX 9B737 MAX 9
A
E
F
L
W
F
F
B737 MAX 8B737 MAX 8
F
Fv
Fv
A318 PW
-S
A318 PW-S
MD90-30
MD90-30
MD-88
MD-88B737 MAX 9B737 MAX 9
A
E
F
L
W
F
F
B737 MAX 8B737 MAX 8
F
Fv
Fv
MD90-30
MD90-30B737 MAX 9B737 MAX 9
A
E
F
L
W
F
F
B737 MAX 8B737 MAX 8
F
Fv
Fv
B737 MAX 9B737 MAX 9
A
E
F
L
W
F
F
B737 MAX 8B737 MAX 8
F
Fv
Fv
MD9
0-30
MD90-30B737 MAX 9
B737
MAX
9
A
E
F
L
W
F
F
B737 MAX 8
B737
MAX
8
F
Fv
Fv
A318 PW-S
A318 P
W-S
B737 MAX 9
B737
MAX
9
A
E
F
L W
F
F
B737 MAX 8
B737
MAX
8
F
Fv
Fv
A318 PW-S
A318 P
W-S
B737 MAX 9
B737
MAX
9
A
E
F
L W
F
F
B737 MAX 8
B737
MAX
8
F
Fv
Fv
A318 P
W-S
A318 P
W-S
B757-300W
B757-300W
B757-200W
B757-200W
B737 MAX 9
B737 MAX 9
A
E
F
L
WF
F
B737 MAX 8
B737 MAX 8
F
Fv
Fv
A318 P
W-S
A318 PW
-S
B767-400ER
B767-400ER
B767-300ERW
B767-300ERW
B767-400ER
B767-400ER
B767-300ERW
B767-300ERW
B757-300W
B757-300W
B757-200W
B757-200W
B737 MAX 9
B737 MAX 9
A
E
F
L
W
F
F
B737 MAX 8
B737 MAX 8
F
Fv
Fv
MD9
0-30
MD90-30
MD-
88
MD-88
B737 MAX 9
B737
MAX
9
A
E
F
L
W
FF
B737 MAX 8
B737
MAX
8
F
FvFv
MD-88
MD-
88
MD-88
MD-
88
MD-88
MD-88
MD-
88
MD-88
MD-88
MD-88
JMTJMTJRD
HF10.00N
ENGINEERING DEPARTMENT
NumberDrawing
NumberContract
Title
ApprovedDateNo. Revision
Sheet of
PID#
This drawing subject to conditions in contract. All inventions, ideas, designs and methodsherein are reserved to Port Authority and may not be used without its written consent.All recipients of Contract documents, including bidders and those who do not bid and theirprospective subcontractors and suppliers who may receive all or a part of the Contractdocuments or copies thereof, shall make every effort to ensure the secure and appropriatedisposal of the Contract documents to prevent further disclosure of the informationcontained in the documents. Secure and appropriate disposal includes methods ofdocument destruction such as shredding or arrangements with refuse handlers that ensurethat third persons will not have access to the documents' contents either before, during, orafter disposal. Documents may also be returned for disposal purposes to the ContractDesk on the 14th Floor, 2 Gateway Center, Newark NJ 07102 or the office of the Directorof Procurement, 4 World Trade Center, 21st Floor, New York, NY 10006.It is a violation of law for any person to alter a document in any way, unless acting underthe direction of a licensed professional engineer or registered architect. If this documentbearing the seal of an engineer/architect is altered, the altering engineer/architect shallaffix to the document their seal and the notation "altered by" followed by their signature andthe date of such alteration, and a specific description of the alteration.
Date
Drawn byDesigned by
Checked by
6
LAGUARDIAAIRPORTCONCOURSE B
LAGUARIDA AIRPORTCENTRAL TERMINAL BUILDING
REPLACEMENT PROJECT
10/30/2015
FAC-XXX.XXX
NUMBER
30% - ISSUED FORCOORDINATION ONLY
CO
PYR
IGH
T ©
NO
TIC
E:TH
IS D
OC
UM
ENT
IS T
HE
PRO
PER
TY O
F AR
GU
S C
ON
SULT
ING
, IN
C. A
ND
IS N
OT
TO B
E PR
OD
UC
ED O
R C
OPI
ED IN
WH
OLE
OR
IN P
ART.
IT IS
ON
LY T
O B
E U
SED
FO
R T
HE
PRO
JEC
T A
ND
SIT
E S
PEC
IFIC
ALLY
IDEN
TIFI
ED H
EREI
N A
ND
IS N
OT
TO B
E U
SED
FO
R A
NY
OTH
ER P
UR
POSE
OR
ON
AN
Y O
THER
PR
OJE
CTS
. IT
MU
ST B
E R
ETU
RN
ED U
PON
REQ
UES
T.
Attachment 10
Public Involvement
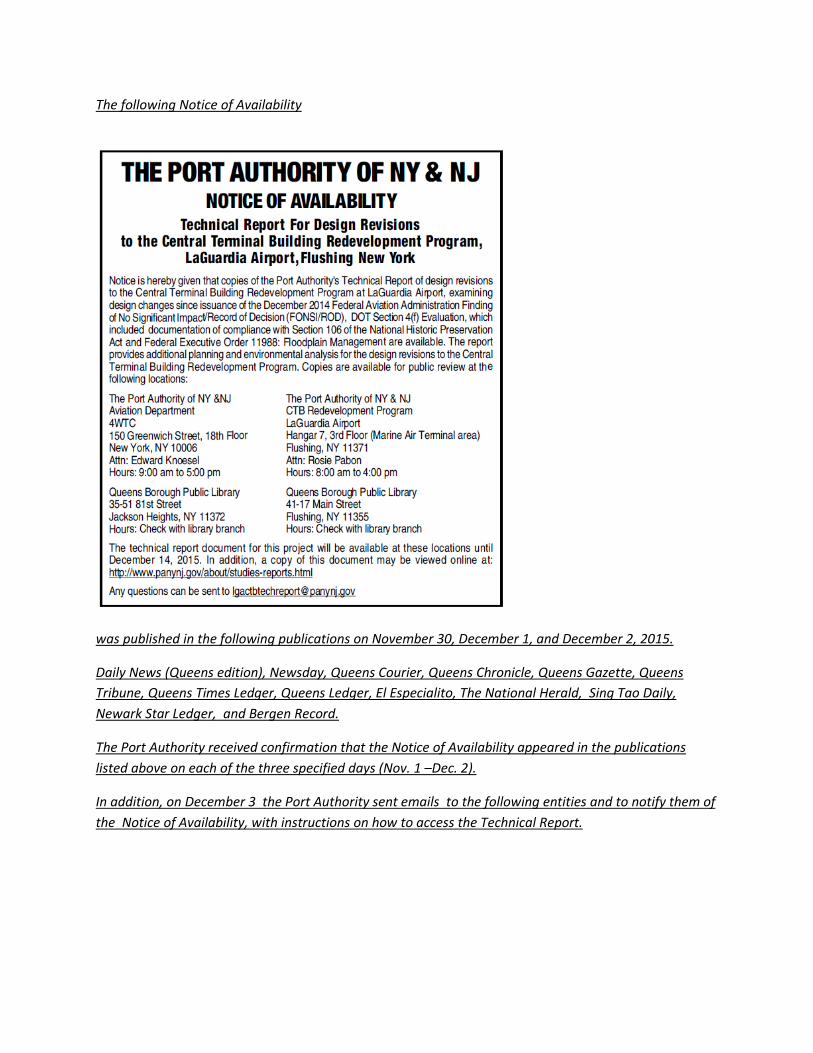
The following Notice of Availability
was published in the following publications on November 30, December 1, and December 2, 2015.
Daily News (Queens edition), Newsday, Queens Courier, Queens Chronicle, Queens Gazette, Queens Tribune, Queens Times Ledger, Queens Ledger, El Especialito, The National Herald, Sing Tao Daily, Newark Star Ledger, and Bergen Record.
The Port Authority received confirmation that the Notice of Availability appeared in the publications listed above on each of the three specified days (Nov. 1 –Dec. 2).
In addition, on December 3 the Port Authority sent emails to the following entities and to notify them of the Notice of Availability, with instructions on how to access the Technical Report.
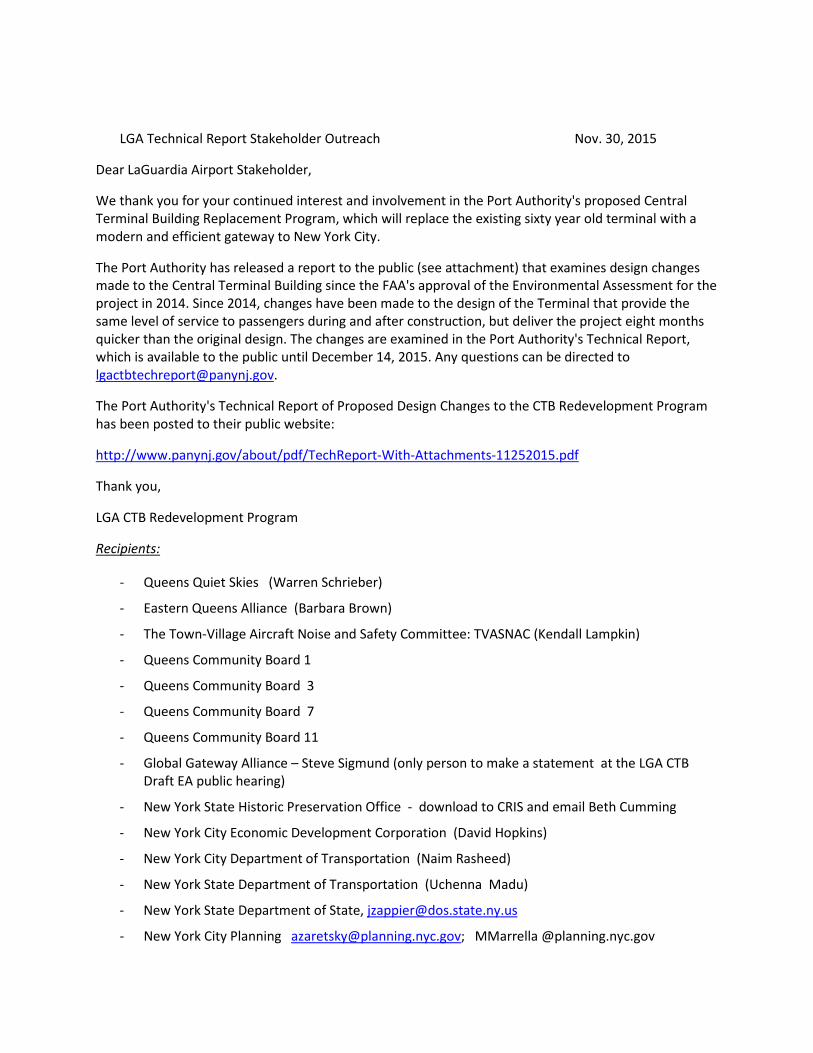
LGA Technical Report Stakeholder Outreach Nov. 30, 2015
Dear LaGuardia Airport Stakeholder,
We thank you for your continued interest and involvement in the Port Authority's proposed Central Terminal Building Replacement Program, which will replace the existing sixty year old terminal with a modern and efficient gateway to New York City.
The Port Authority has released a report to the public (see attachment) that examines design changes made to the Central Terminal Building since the FAA's approval of the Environmental Assessment for the project in 2014. Since 2014, changes have been made to the design of the Terminal that provide the same level of service to passengers during and after construction, but deliver the project eight months quicker than the original design. The changes are examined in the Port Authority's Technical Report, which is available to the public until December 14, 2015. Any questions can be directed to [email protected].
The Port Authority's Technical Report of Proposed Design Changes to the CTB Redevelopment Program has been posted to their public website:
http://www.panynj.gov/about/pdf/TechReport-With-Attachments-11252015.pdf
Thank you,
LGA CTB Redevelopment Program
Recipients:
- Queens Quiet Skies (Warren Schrieber)
- Eastern Queens Alliance (Barbara Brown)
- The Town-Village Aircraft Noise and Safety Committee: TVASNAC (Kendall Lampkin)
- Queens Community Board 1
- Queens Community Board 3
- Queens Community Board 7
- Queens Community Board 11
- Global Gateway Alliance – Steve Sigmund (only person to make a statement at the LGA CTB Draft EA public hearing)
- New York State Historic Preservation Office - download to CRIS and email Beth Cumming
- New York City Economic Development Corporation (David Hopkins)
- New York City Department of Transportation (Naim Rasheed)
- New York State Department of Transportation (Uchenna Madu)
- New York State Department of State, [email protected]
- New York City Planning [email protected]; MMarrella @planning.nyc.gov
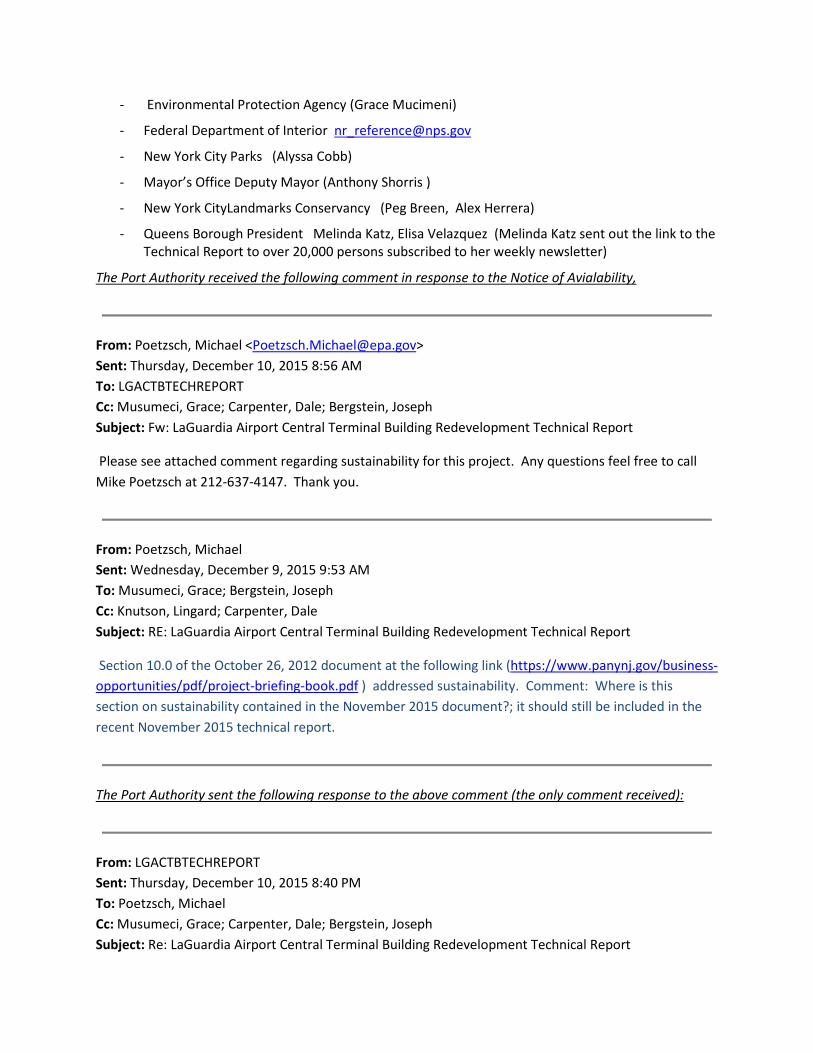
- Environmental Protection Agency (Grace Mucimeni)
- Federal Department of Interior [email protected]
- New York City Parks (Alyssa Cobb)
- Mayor’s Office Deputy Mayor (Anthony Shorris )
- New York CityLandmarks Conservancy (Peg Breen, Alex Herrera)
- Queens Borough President Melinda Katz, Elisa Velazquez (Melinda Katz sent out the link to the Technical Report to over 20,000 persons subscribed to her weekly newsletter)
The Port Authority received the following comment in response to the Notice of Avialability,
From: Poetzsch, Michael <[email protected]> Sent: Thursday, December 10, 2015 8:56 AM To: LGACTBTECHREPORT Cc: Musumeci, Grace; Carpenter, Dale; Bergstein, Joseph Subject: Fw: LaGuardia Airport Central Terminal Building Redevelopment Technical Report
Please see attached comment regarding sustainability for this project. Any questions feel free to call Mike Poetzsch at 212-637-4147. Thank you.
From: Poetzsch, Michael Sent: Wednesday, December 9, 2015 9:53 AM To: Musumeci, Grace; Bergstein, Joseph Cc: Knutson, Lingard; Carpenter, Dale Subject: RE: LaGuardia Airport Central Terminal Building Redevelopment Technical Report
Section 10.0 of the October 26, 2012 document at the following link (https://www.panynj.gov/business-opportunities/pdf/project-briefing-book.pdf ) addressed sustainability. Comment: Where is this section on sustainability contained in the November 2015 document?; it should still be included in the recent November 2015 technical report.
The Port Authority sent the following response to the above comment (the only comment received):
From: LGACTBTECHREPORT Sent: Thursday, December 10, 2015 8:40 PM To: Poetzsch, Michael Cc: Musumeci, Grace; Carpenter, Dale; Bergstein, Joseph Subject: Re: LaGuardia Airport Central Terminal Building Redevelopment Technical Report
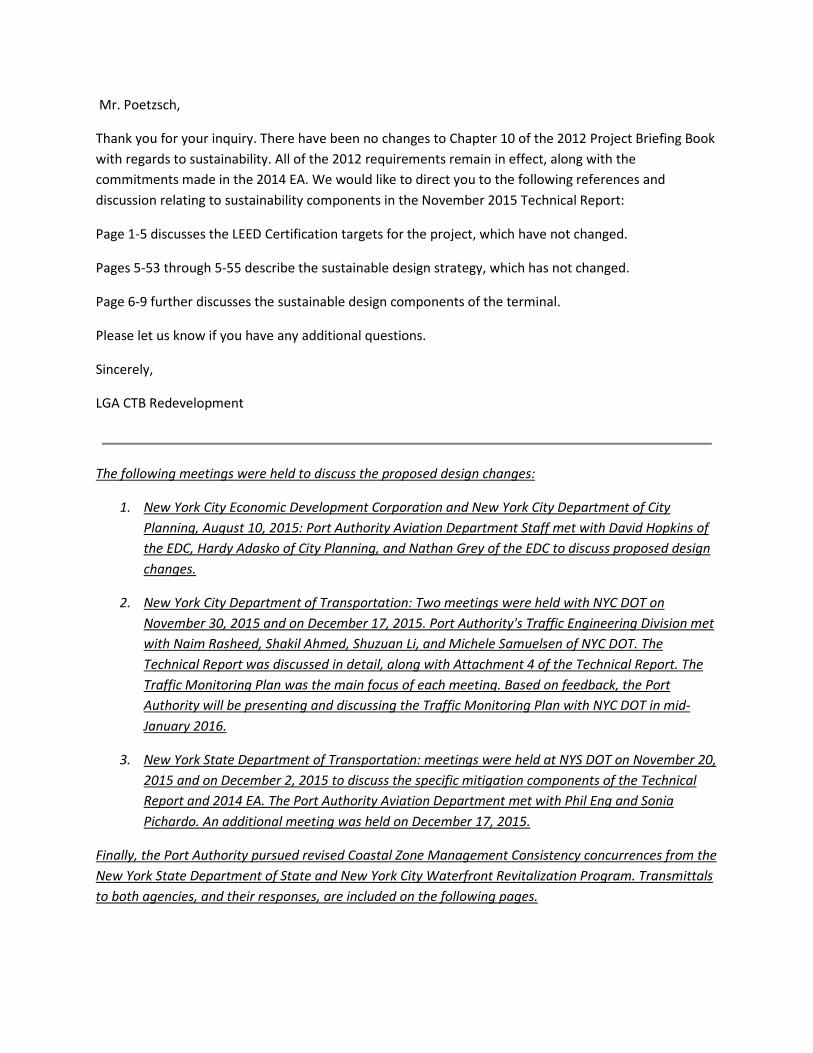
Mr. Poetzsch,
Thank you for your inquiry. There have been no changes to Chapter 10 of the 2012 Project Briefing Book with regards to sustainability. All of the 2012 requirements remain in effect, along with the commitments made in the 2014 EA. We would like to direct you to the following references and discussion relating to sustainability components in the November 2015 Technical Report:
Page 1-5 discusses the LEED Certification targets for the project, which have not changed.
Pages 5-53 through 5-55 describe the sustainable design strategy, which has not changed.
Page 6-9 further discusses the sustainable design components of the terminal.
Please let us know if you have any additional questions.
Sincerely,
LGA CTB Redevelopment
The following meetings were held to discuss the proposed design changes:
1. New York City Economic Development Corporation and New York City Department of City Planning, August 10, 2015: Port Authority Aviation Department Staff met with David Hopkins of the EDC, Hardy Adasko of City Planning, and Nathan Grey of the EDC to discuss proposed design changes.
2. New York City Department of Transportation: Two meetings were held with NYC DOT on November 30, 2015 and on December 17, 2015. Port Authority's Traffic Engineering Division met with Naim Rasheed, Shakil Ahmed, Shuzuan Li, and Michele Samuelsen of NYC DOT. The Technical Report was discussed in detail, along with Attachment 4 of the Technical Report. The Traffic Monitoring Plan was the main focus of each meeting. Based on feedback, the Port Authority will be presenting and discussing the Traffic Monitoring Plan with NYC DOT in mid-January 2016.
3. New York State Department of Transportation: meetings were held at NYS DOT on November 20, 2015 and on December 2, 2015 to discuss the specific mitigation components of the Technical Report and 2014 EA. The Port Authority Aviation Department met with Phil Eng and Sonia Pichardo. An additional meeting was held on December 17, 2015.
Finally, the Port Authority pursued revised Coastal Zone Management Consistency concurrences from the New York State Department of State and New York City Waterfront Revitalization Program. Transmittals to both agencies, and their responses, are included on the following pages.
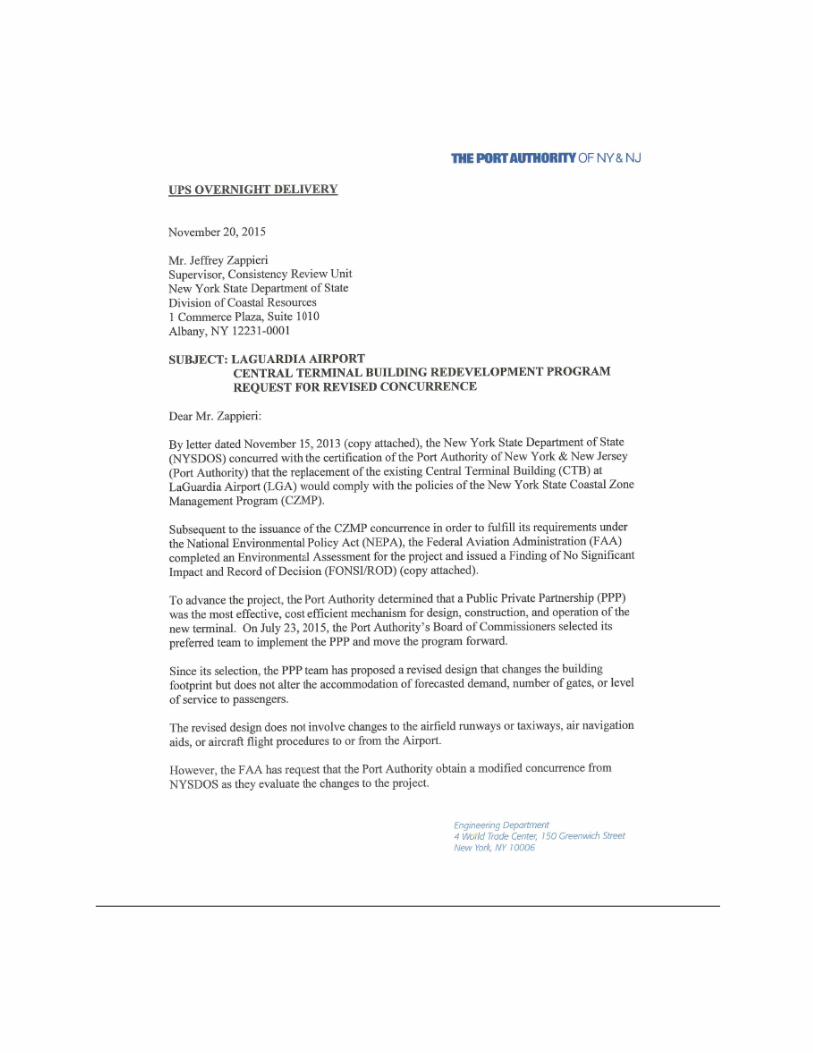
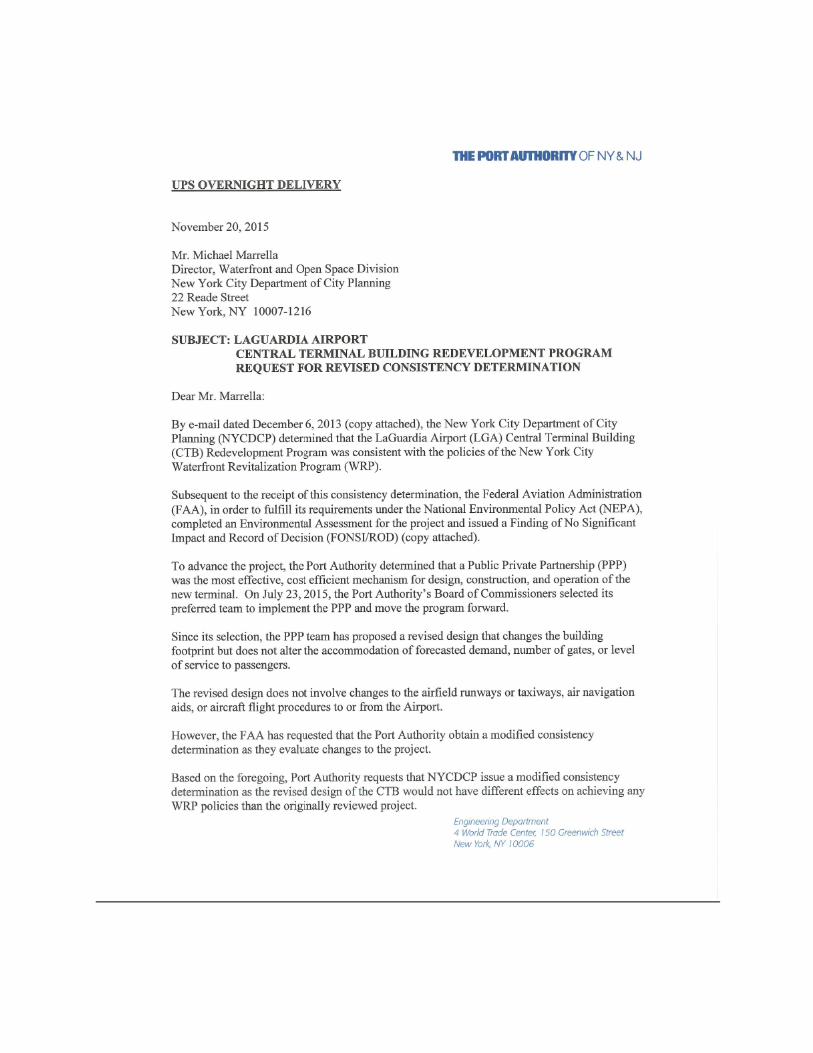

From: Mary Kimball (DCP) [mailto:[email protected]] Sent: Tuesday, December 08, 2015 10:44 AM To: Helman, Marc Cc: Michael Marrella (DCP) Subject: RE: LaGuardia Airport Central Terminal Building - WRP #13-089
Dear Marc –
We have completed the review of the revised project as described below for consistency with the policies and intent of the New York City Waterfront Revitalization Program (WRP).
LaGuardia Airport Central Terminal Building Redevelopment Program
Revised design to building footprint for the redevelopment of the LaGuardia Airport Central Terminal Building project.
Based on the information submitted, the Waterfront Open Space Division, on behalf of the New York City Coastal Commission, having reviewed the waterfront aspect of this action, finds that the actions will not substantially hinder the achievement of any Waterfront Revitalization Program (WRP) policy and hereby provides its finding to the New York State Department of State (DOS) that this action is consistent with the WRP policies and the local program. Please note that the proposed action(s) are subject to consistency review and approval by the New York State Department of State (DOS) in accordance with the New York State Coastal Management Program.
This finding is only applicable to the information received and the current proposal. Any additional information or project modifications would require an independent consistency review.
For your records, this project has been assigned WRP # 13-089. If there are any questions regarding this review, please contact me.
MARY KIMBALL
PROGRAM MANAGER, RESILIENT NEIGHBORHOODS • WATERFRONT AND OPEN SPACE DIVISION
NYC DEPT. OF CITY PLANNING
120 BROADWAY, 31st FLOOR • NEW YORK, NY 10271
212-720-3623 I [email protected]
Follow us on Twitter @NYCPlanning
http://www.nyc.gov/planning
Division for Historic Preservation
P.O. Box 189, Waterford, New York 12188-0189 • (518) 237-8643 • www.nysparks.com
ANDREW M. CUOMO
ROSE HARVEY
Governor
Commissioner
December 17, 2015
Ms. Marie Jenet Environmental Specialist Federal Aviation Administration 159-30 Rockaway Blvd, Suite 111 Jamaica, NY 11434
Re:
FAA Central Terminal Building at LaGuardia Airport LaGuardia Airport 12PR05127
Dear Ms. Jenet:
Thank you for continuing to consult with the New York State Historic Preservation Office (SHPO). We have reviewed the provided documentation in accordance with Section 106 of the National Historic Preservation Act of 1966 and the Memorandum of Agreement (MOA) in place for this project. These comments are those of the SHPO and relate only to Historic/Cultural resources. As requested we have reviewed the MOA in place for this project and Technical Report dated November 2015 which proposes project design changes. Based upon this review, we understand that the West Garage is now slightly further away from the historic Hanger 3. The impacts to historic resources and agreed upon mitigation measures in the MOA are not changed due to the proposed design modification. As such, we concur there is no need to amend the MOA. If you have any questions, I can be reached at (518) 268-2181. Sincerely,
Beth A. Cumming Senior Historic Site Restoration Coordinator e-mail: [email protected] via e-mail only
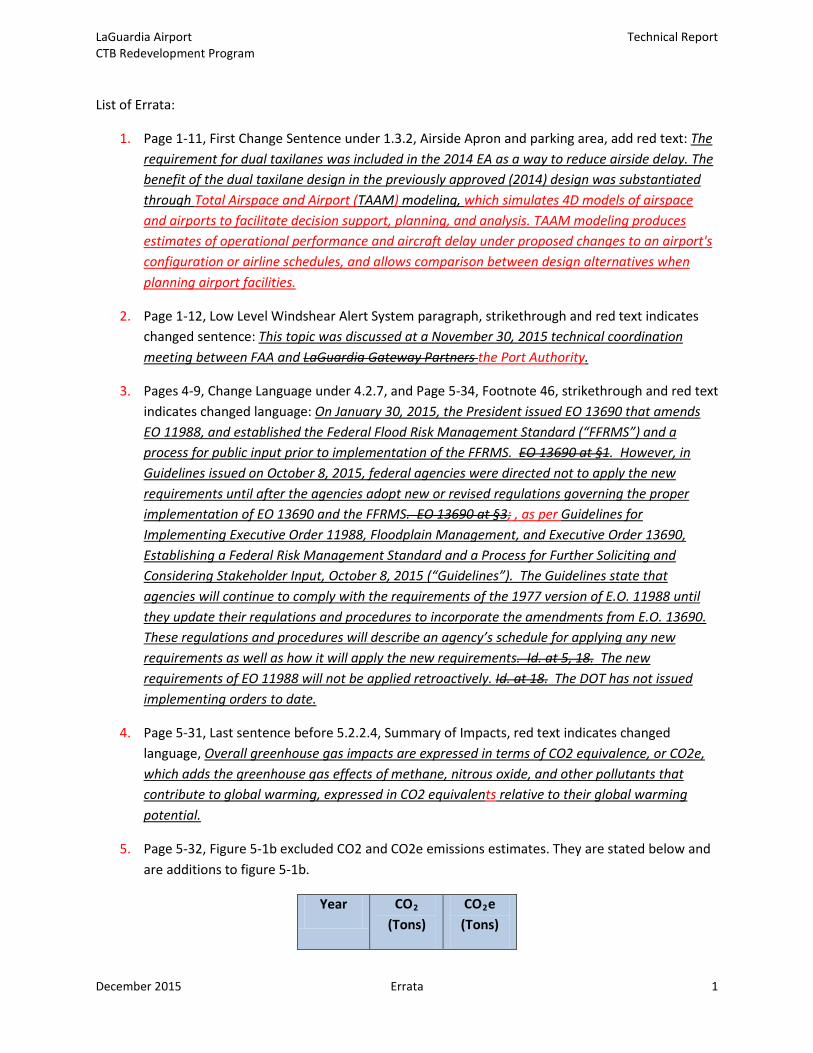
LaGuardia Airport Technical Report CTB Redevelopment Program
List of Errata:
1. Page 1-11, First Change Sentence under 1.3.2, Airside Apron and parking area, add red text: The requirement for dual taxilanes was included in the 2014 EA as a way to reduce airside delay. The benefit of the dual taxilane design in the previously approved (2014) design was substantiated through Total Airspace and Airport (TAAM) modeling, which simulates 4D models of airspace and airports to facilitate decision support, planning, and analysis. TAAM modeling produces estimates of operational performance and aircraft delay under proposed changes to an airport's configuration or airline schedules, and allows comparison between design alternatives when planning airport facilities.
2. Page 1-12, Low Level Windshear Alert System paragraph, strikethrough and red text indicates changed sentence: This topic was discussed at a November 30, 2015 technical coordination meeting between FAA and LaGuardia Gateway Partners the Port Authority.
3. Pages 4-9, Change Language under 4.2.7, and Page 5-34, Footnote 46, strikethrough and red text indicates changed language: On January 30, 2015, the President issued EO 13690 that amends EO 11988, and established the Federal Flood Risk Management Standard (“FFRMS”) and a process for public input prior to implementation of the FFRMS. EO 13690 at §1. However, in Guidelines issued on October 8, 2015, federal agencies were directed not to apply the new requirements until after the agencies adopt new or revised regulations governing the proper implementation of EO 13690 and the FFRMS. EO 13690 at §3; , as per Guidelines for Implementing Executive Order 11988, Floodplain Management, and Executive Order 13690, Establishing a Federal Risk Management Standard and a Process for Further Soliciting and Considering Stakeholder Input, October 8, 2015 (“Guidelines”). The Guidelines state that agencies will continue to comply with the requirements of the 1977 version of E.O. 11988 until they update their regulations and procedures to incorporate the amendments from E.O. 13690. These regulations and procedures will describe an agency’s schedule for applying any new requirements as well as how it will apply the new requirements. Id. at 5, 18. The new requirements of EO 11988 will not be applied retroactively. Id. at 18. The DOT has not issued implementing orders to date.
4. Page 5-31, Last sentence before 5.2.2.4, Summary of Impacts, red text indicates changed language, Overall greenhouse gas impacts are expressed in terms of CO2 equivalence, or CO2e, which adds the greenhouse gas effects of methane, nitrous oxide, and other pollutants that contribute to global warming, expressed in CO2 equivalents relative to their global warming potential.
5. Page 5-32, Figure 5-1b excluded CO2 and CO2e emissions estimates. They are stated below and are additions to figure 5-1b.
Year CO2
(Tons) CO2e
(Tons)
December 2015 Errata 1
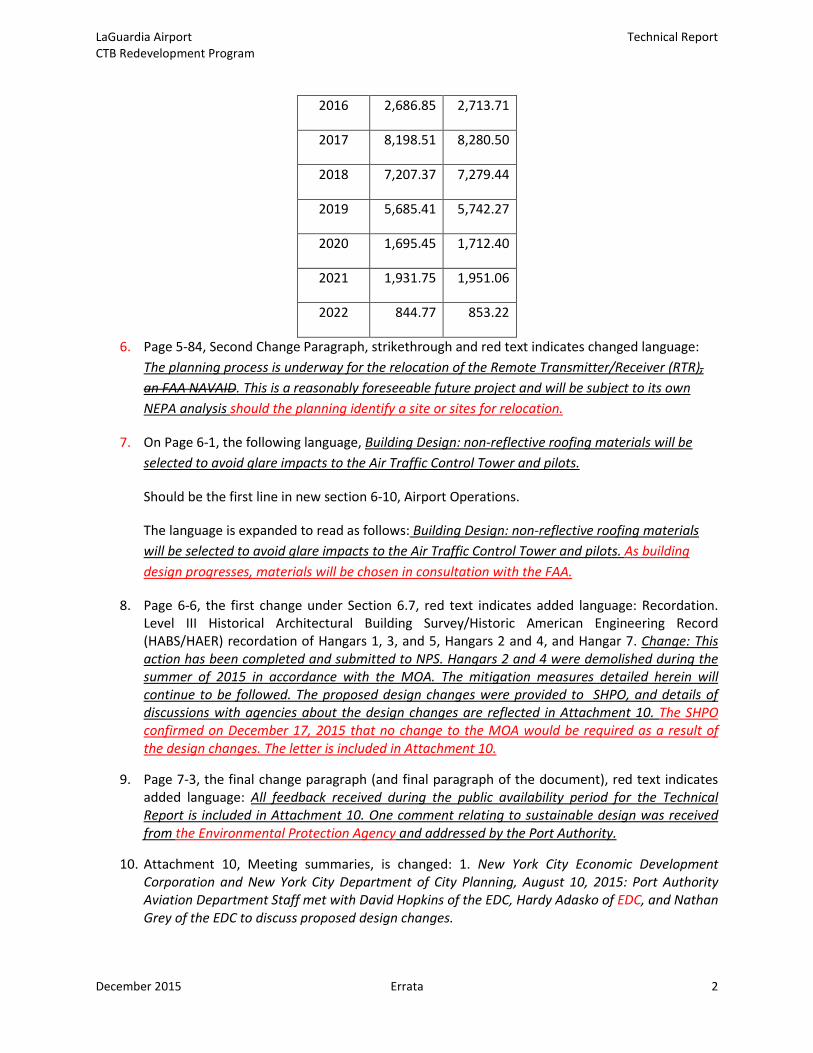
LaGuardia Airport Technical Report CTB Redevelopment Program
2016 2,686.85 2,713.71
2017 8,198.51 8,280.50
2018 7,207.37 7,279.44
2019 5,685.41 5,742.27
2020 1,695.45 1,712.40
2021 1,931.75 1,951.06
2022 844.77 853.22
6. Page 5-84, Second Change Paragraph, strikethrough and red text indicates changed language: The planning process is underway for the relocation of the Remote Transmitter/Receiver (RTR), an FAA NAVAID. This is a reasonably foreseeable future project and will be subject to its own NEPA analysis should the planning identify a site or sites for relocation.
7. On Page 6-1, the following language, Building Design: non-reflective roofing materials will be selected to avoid glare impacts to the Air Traffic Control Tower and pilots.
Should be the first line in new section 6-10, Airport Operations.
The language is expanded to read as follows: Building Design: non-reflective roofing materials will be selected to avoid glare impacts to the Air Traffic Control Tower and pilots. As building design progresses, materials will be chosen in consultation with the FAA.
8. Page 6-6, the first change under Section 6.7, red text indicates added language: Recordation. Level III Historical Architectural Building Survey/Historic American Engineering Record (HABS/HAER) recordation of Hangars 1, 3, and 5, Hangars 2 and 4, and Hangar 7. Change: This action has been completed and submitted to NPS. Hangars 2 and 4 were demolished during the summer of 2015 in accordance with the MOA. The mitigation measures detailed herein will continue to be followed. The proposed design changes were provided to SHPO, and details of discussions with agencies about the design changes are reflected in Attachment 10. The SHPO confirmed on December 17, 2015 that no change to the MOA would be required as a result of the design changes. The letter is included in Attachment 10.
9. Page 7-3, the final change paragraph (and final paragraph of the document), red text indicates added language: All feedback received during the public availability period for the Technical Report is included in Attachment 10. One comment relating to sustainable design was received from the Environmental Protection Agency and addressed by the Port Authority.
10. Attachment 10, Meeting summaries, is changed: 1. New York City Economic Development Corporation and New York City Department of City Planning, August 10, 2015: Port Authority Aviation Department Staff met with David Hopkins of the EDC, Hardy Adasko of EDC, and Nathan Grey of the EDC to discuss proposed design changes.
December 2015 Errata 2


![Package ‘arm’ - The Comprehensive R Archive Network · Package ‘arm ’ April 13, 2018 ... Maria Grazia Pittau [ctb], Jouni Kerman [ctb], Tian Zheng [ctb], Vincent Dorie [ctb]](https://img.pdfslide.us/doc/110x75/5af7d0be7f8b9a7444913dbb/package-arm-the-comprehensive-r-archive-network-arm-april-13-2018.jpg)

![Package ‘kyotil’ › web › packages › kyotil › kyotil.pdf · Jason Becker [ctb], Bendix Carstensen [ctb], Daryl Morris [ctb], Josh Pasek [ctb], Dennis Chao [ctb], Andri](https://img.pdfslide.us/doc/110x75/5f1a10767e663e367f7f2769/package-akyotila-a-web-a-packages-a-kyotil-a-kyotilpdf-jason-becker.jpg)


![Package ‘broom’ - The Comprehensive R Archive Network · Michelle Evans [ctb], Jason Cory Brunson [ctb], Simon Jackson [ctb], Ben Whalley [ctb], Michael Kuehn [ctb], Jorge Cimentada](https://img.pdfslide.us/doc/110x75/5f03a8507e708231d40a21aa/package-abrooma-the-comprehensive-r-archive-network-michelle-evans-ctb.jpg)