Embed Size (px)
Citation preview

1
LG Energy Solution
National Research project(PV + ESS + Water desalinization in Korea)
Hybrid System ( PV + ESS + Diesel)
Agenda
LG Energy Solution
National Research project(PV + ESS + Water desalinization in Korea)
Hybrid System ( PV + ESS + Diesel)
Agenda
2

LG Microgrid Solution
1) OT : Operational Technology4
Eco-friendly Energy Infrastructure Public Energy Welfare
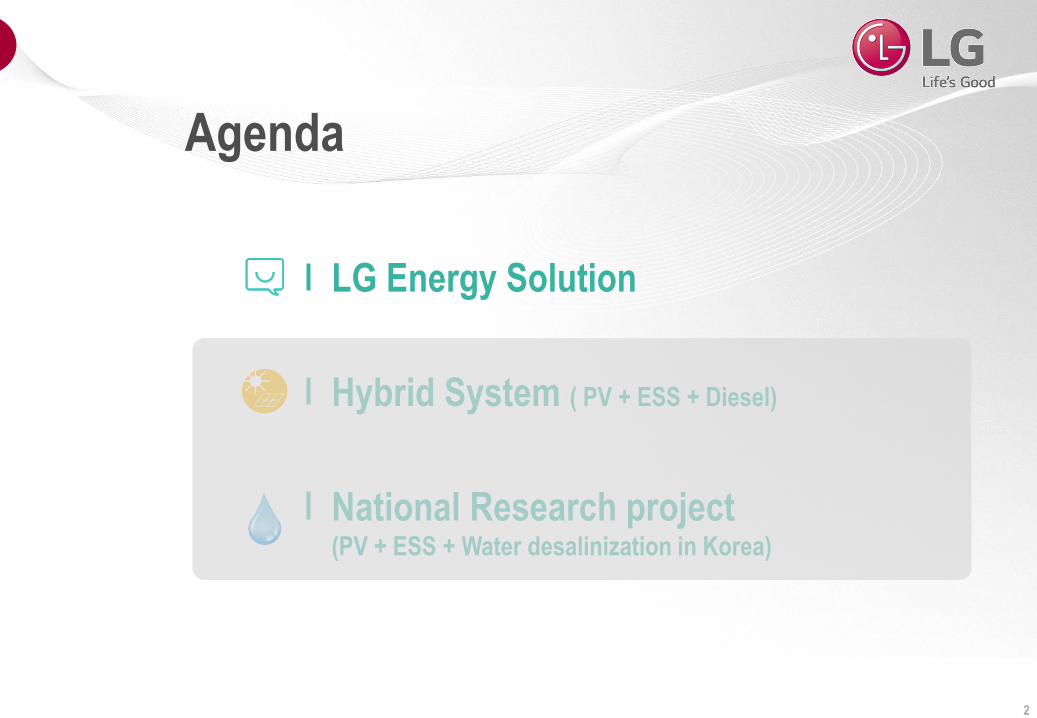
LG Reference : Jeju-Island Smart MicrogridCarbon Free Island, Renewables 50%(1GW) by 2020, 100%(1.8GW) by 2030Electric Vehicle 30% by 2020, 100% by 2030
Population : 617,038
Client : 216,000
Electricity : 1,086MW
5

PV
ESS
BECON manager / microgrid
Geo-Thermal
Lighting
HVAC
- Capacity : 2.7 MW
- Modules : 5,446 EA
- Capacity : 2 MW(0.5C)
- # of sets : 4 sets
- Points : 200,000 (Approx.)
- Clients SW : 26 EA
- Commercial Air Con. (Heat pump)
- Chillers(Turbo, Absorption),
- AHU(Smart AHU, Under Floor Ventilation)
- Capacity : 2.5 MW
- LED to support Sensor networks
- LED lamp, luminaries, Plasma etc.
DC Microgrid
LG Reference : LG Science Park MicrogridWorld Largest Eco-Friendly R&D Lab
7
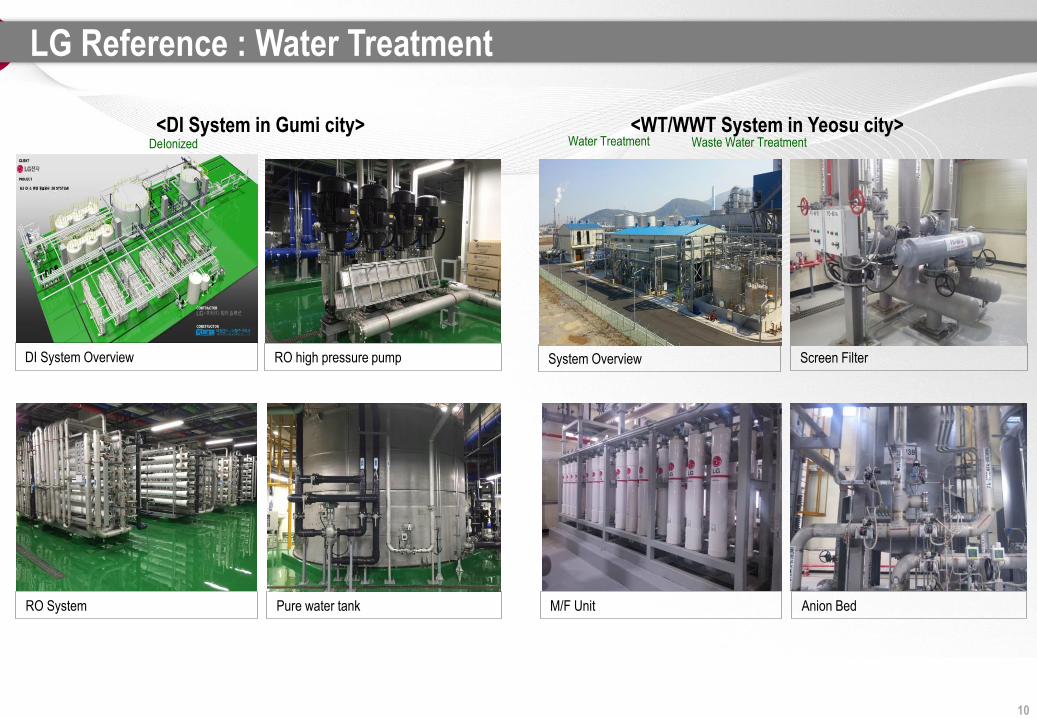
LG Reference : Water Treatment
RO System Pure water tank
DI System Overview RO high pressure pump
DeIonized
<DI System in Gumi city> <WT/WWT System in Yeosu city>Water Treatment Waste Water Treatment
M/F Unit Anion Bed
System Overview Screen Filter
10

Agenda
LG Energy Solution
National Research project(PV + ESS + Water desalinization in Korea)
Hybrid System ( PV + ESS + Diesel)
Additional 7
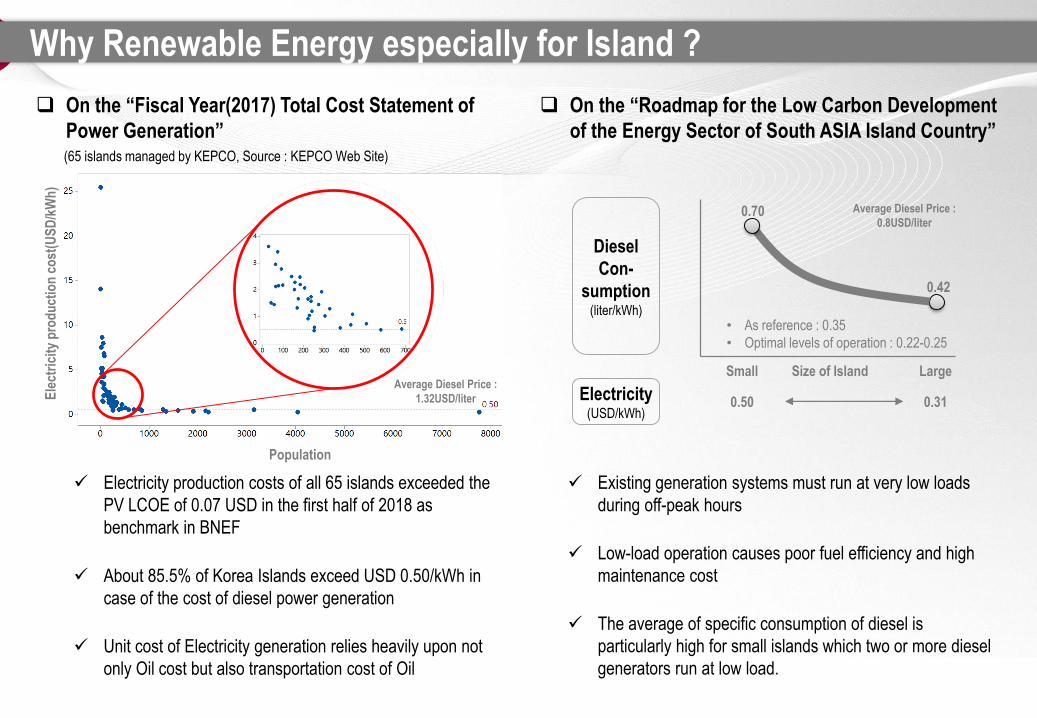
Why Renewable Energy especially for Island ?
On the “Roadmap for the Low Carbon Development
of the Energy Sector of South ASIA Island Country”
Diesel
Con-
sumption(liter/kWh)
Electricity(USD/kWh)
0.42
0.70
Small Size of Island Large
0.50 0.31
• As reference : 0.35
• Optimal levels of operation : 0.22-0.25
Existing generation systems must run at very low loads
during off-peak hours
Low-load operation causes poor fuel efficiency and high
maintenance cost
The average of specific consumption of diesel is
particularly high for small islands which two or more diesel
generators run at low load.
On the “Fiscal Year(2017) Total Cost Statement of
Power Generation”(65 islands managed by KEPCO, Source : KEPCO Web Site)
Population
Ele
ctri
city
pro
du
ctio
n c
ost
(US
D/k
Wh
)
Average Diesel Price :
1.32USD/liter
Average Diesel Price :
0.8USD/liter
Electricity production costs of all 65 islands exceeded the
PV LCOE of 0.07 USD in the first half of 2018 as
benchmark in BNEF
About 85.5% of Korea Islands exceed USD 0.50/kWh in
case of the cost of diesel power generation
Unit cost of Electricity generation relies heavily upon not
only Oil cost but also transportation cost of Oil

- CAPEXt(CAPital Expenditure), OM(Operation & Maintenance),
FC(Financial Cost), r(discount rate), d(degradation factor),
CF(capacity factor), Capacity(Install Capacity),
T(Operating period)
Calculate LCOE(Levelized cost of energy)
LCOE calculation formula
Diesel LCOE : 0.511USD/kWh
1. CAPEXt(CAPital Expenditure)
- Diesel Generator install capacity : 600kVA
- Power factor : 80%, Expected power output : 480kW
- Initial investment cost : 181,818USD(include Oil tank and EPC)
2. OM(Operation & Maintenance)
- Fuel cost + Lube Oil + Labor Cost : 0.50USD/kWh
(Operating Load 50%, 105% Fuel consumption against optimum Load)
- Overhaul cost : 45,455USD (every 5 years)
3. Others
- FC(Financial Cost) : 0 (100% Equity), r(discount rate) : 5.5%,
d(degradation factor) : 0 , CF(capacity factor) : 50%,
T(Operating period) : 15 years, No inflation factor
Power Generation cost of Diesel
YearGeneration
(MWh/year)
OPEX
(USD)
Overhaul
(USD)
CAPEX
(USD)
Present Value
of Cost
(USD)
Present Value
of Generation
(MWh)
0 181,818 181,818 -
1 2,102 1,051,200 - - 996,398 1,993
2 2,102 1,051,200 - - 944,453 1,889
.. .. .. .. … .. ..
6 2,102 1,096,655 45,455 - 795,344 1,525
7 2,102 1,051,200 - - 722,634 1,445
.. .. .. .. .. .. ..
11 2,102 1,096,655 45,455 - 608,545 1,167
.. .. .. .. .. .. ..
15 2,102 1,051,200 - - 470,867 942
Sum 31,536 5,933,369 90,910 - 10,791,513 21,103
LCOE = 21,103MWh * 1000
10,791,5130.511USD/kWh=
9
Adapted from European Wind Energy Association “Economics of Wind Energy”
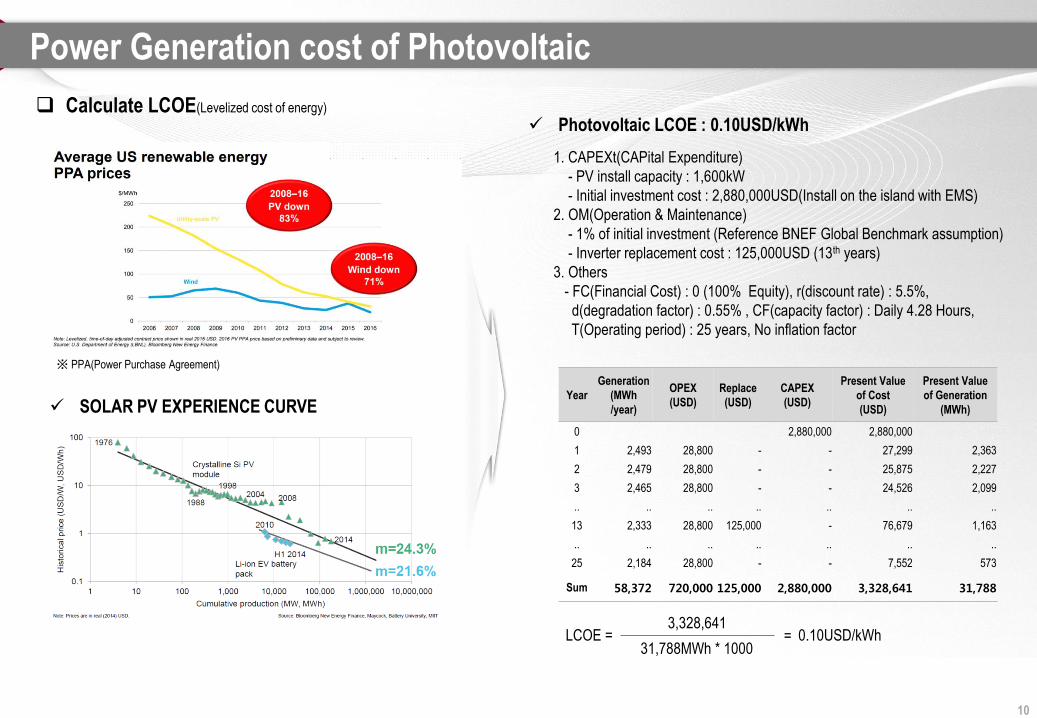
Power Generation cost of Photovoltaic
Calculate LCOE(Levelized cost of energy)
Photovoltaic LCOE : 0.10USD/kWh
1. CAPEXt(CAPital Expenditure)
- PV install capacity : 1,600kW
- Initial investment cost : 2,880,000USD(Install on the island with EMS)
2. OM(Operation & Maintenance)
- 1% of initial investment (Reference BNEF Global Benchmark assumption)
- Inverter replacement cost : 125,000USD (13th years)
3. Others
- FC(Financial Cost) : 0 (100% Equity), r(discount rate) : 5.5%,
d(degradation factor) : 0.55% , CF(capacity factor) : Daily 4.28 Hours,
T(Operating period) : 25 years, No inflation factor
Year
Generation
(MWh
/year)
OPEX
(USD)
Replace
(USD)
CAPEX
(USD)
Present Value
of Cost
(USD)
Present Value
of Generation
(MWh)
0 2,880,000 2,880,000
1 2,493 28,800 - - 27,299 2,363
2 2,479 28,800 - - 25,875 2,227
3 2,465 28,800 - - 24,526 2,099
.. .. .. .. .. .. ..
13 2,333 28,800 125,000 - 76,679 1,163
.. .. .. .. .. .. ..
25 2,184 28,800 - - 7,552 573
Sum 58,372 720,000 125,000 2,880,000 3,328,641 31,788
LCOE = 31,788MWh * 1000
3,328,6410.10USD/kWh=
※ PPA(Power Purchase Agreement)
SOLAR PV EXPERIENCE CURVE
10
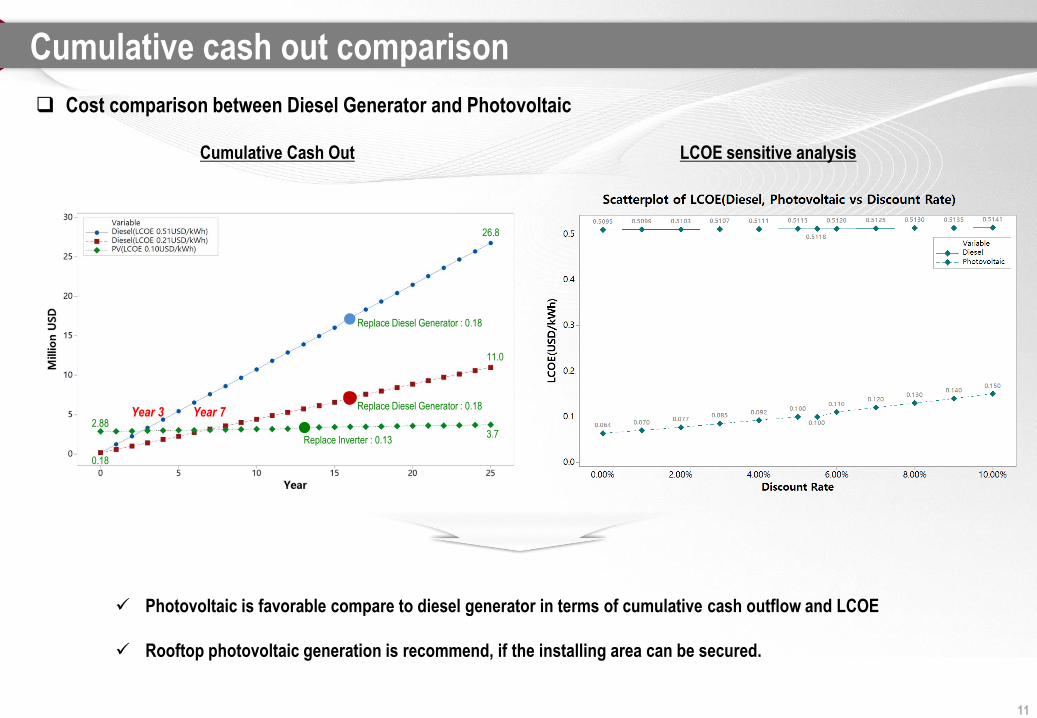
Cumulative cash out comparison
Cost comparison between Diesel Generator and Photovoltaic
Cumulative Cash Out LCOE sensitive analysis
2.88
0.18
26.8
3.7
Replace Diesel Generator : 0.18
Replace Inverter : 0.13
Photovoltaic is favorable compare to diesel generator in terms of cumulative cash outflow and LCOE
Rooftop photovoltaic generation is recommend, if the installing area can be secured.
11
Replace Diesel Generator : 0.18
11.0
Year 3 Year 7
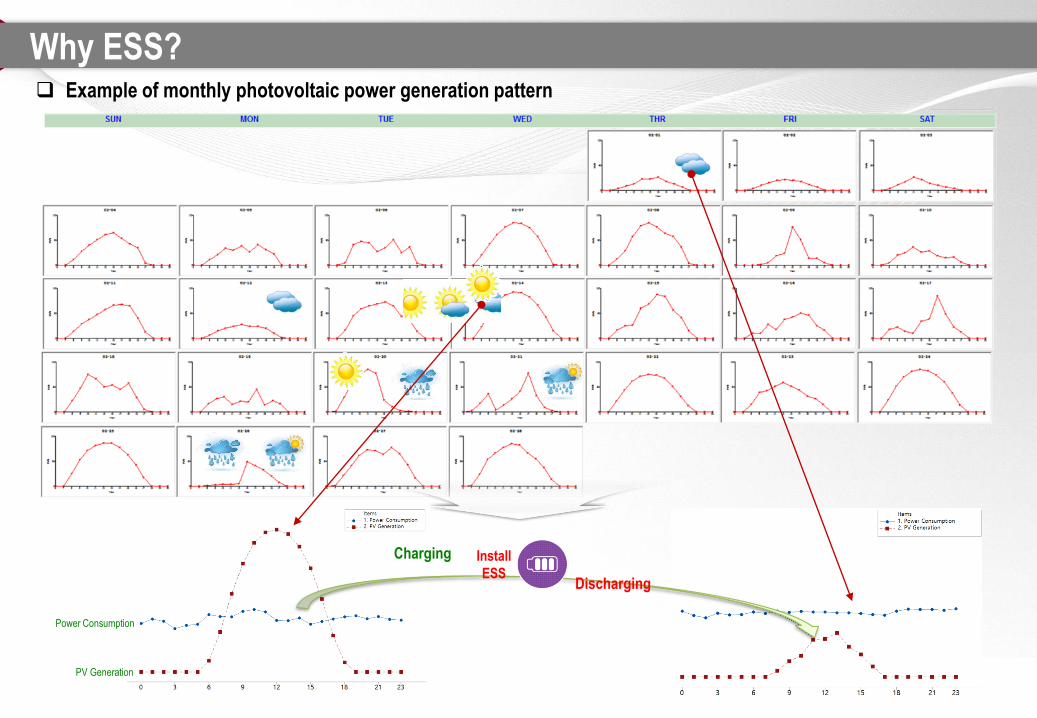
Why ESS? Example of monthly photovoltaic power generation pattern
Install
ESS
Charging
Discharging
Power Consumption
PV Generation
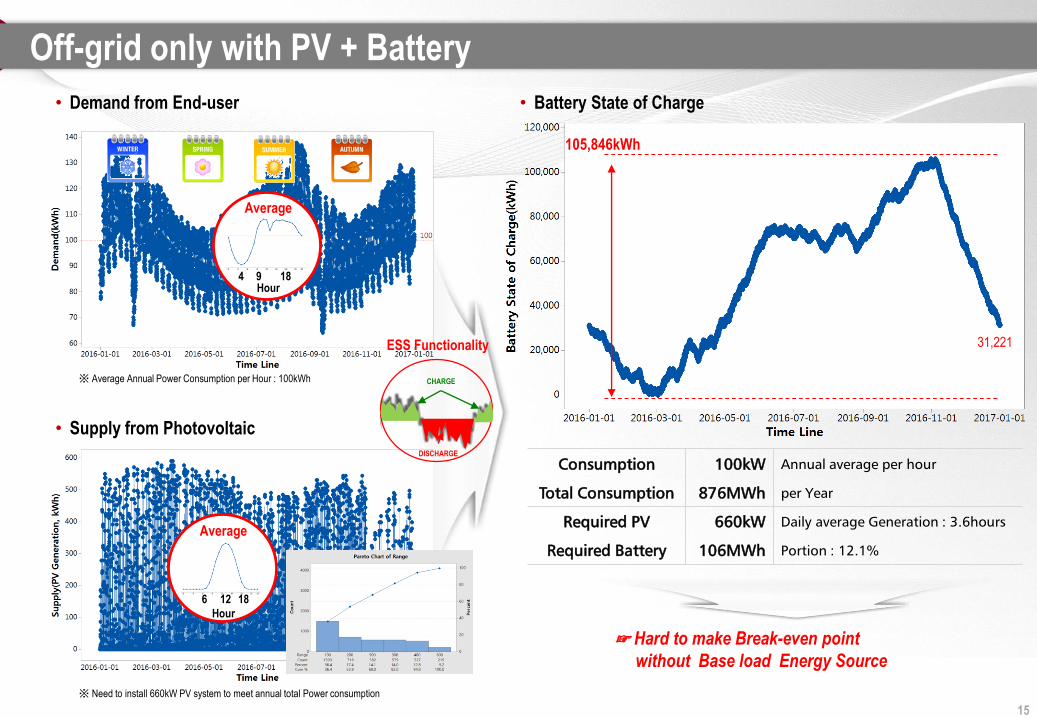
Off-grid only with PV + Battery
31,221
CHARGE
DISCHARGE
ESS Functionality
105,846kWh
Average
Average
Hour
Hour
9
12
• Demand from End-user
• Supply from Photovoltaic
※ Average Annual Power Consumption per Hour : 100kWh
※ Need to install 660kW PV system to meet annual total Power consumption
• Battery State of Charge
Consumption 100kW Annual average per hour
Total Consumption 876MWh per Year
Required PV 660kW Daily average Generation : 3.6hours
Required Battery 106MWh Portion : 12.1%
☞ Hard to make Break-even point
without Base load Energy Source
184
6 18
15
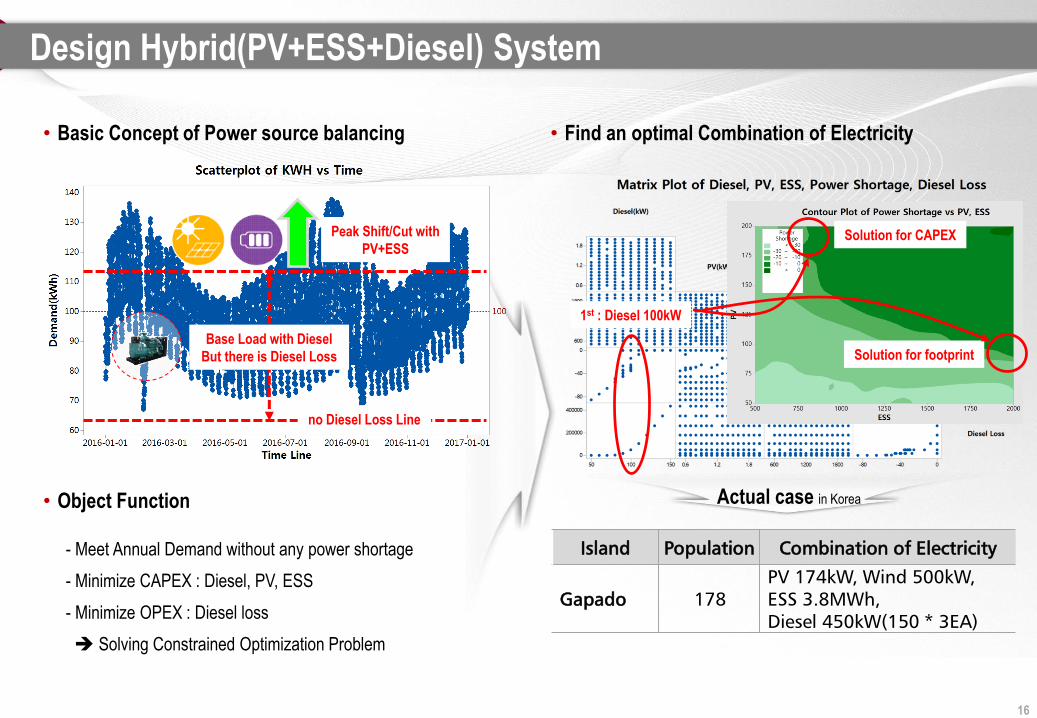
Design Hybrid(PV+ESS+Diesel) System
• Basic Concept of Power source balancing
Peak Shift/Cut with
PV+ESS
Base Load with Diesel
But there is Diesel Loss
no Diesel Loss Line
• Object Function
- Meet Annual Demand without any power shortage
- Minimize CAPEX : Diesel, PV, ESS
- Minimize OPEX : Diesel loss
Solving Constrained Optimization Problem
Island Population Combination of Electricity
Gapado 178
PV 174kW, Wind 500kW,
ESS 3.8MWh,
Diesel 450kW(150 * 3EA)
Actual case in Korea
• Find an optimal Combination of Electricity
1st : Diesel 100kW
Solution for CAPEX
Solution for footprint
16

Source : http://ps.anygate.com/common/case/case01_view.asp?idx=11&page=1&s_string=&b_search=&bm_id=1
Daily Power Combination
2016
(KEPCO)
• Power Distribution System Diagram of Gapado Island
15
Hybrid(PV+Wind+ESS+Diesel) example in Korea
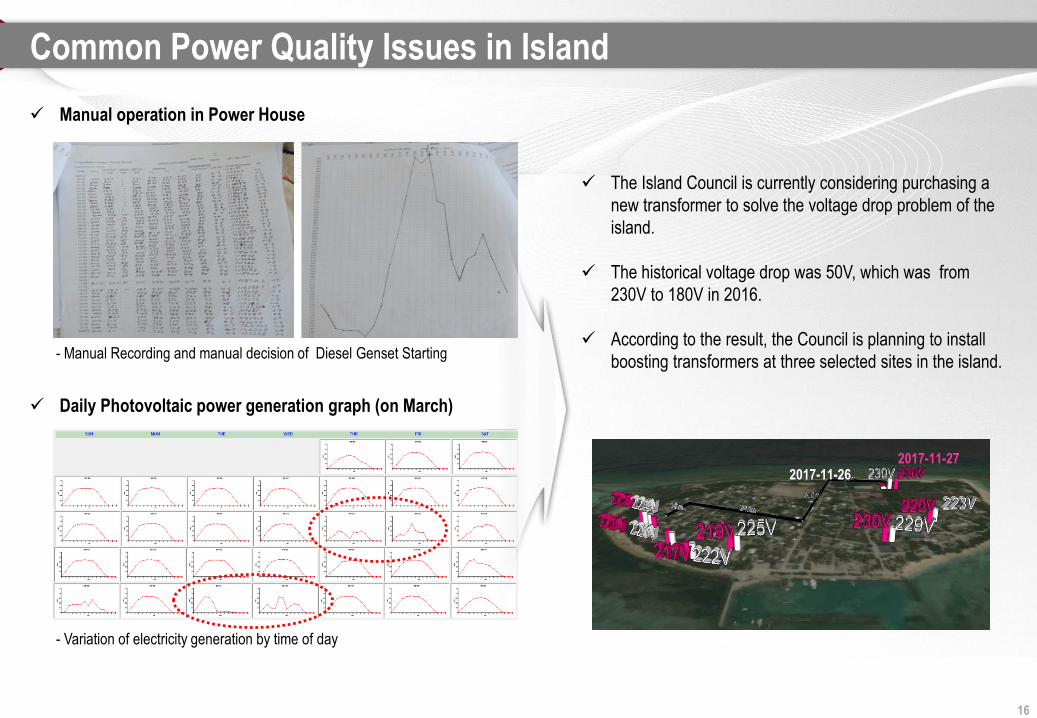
Common Power Quality Issues in Island
2017-11-262017-11-27
The Island Council is currently considering purchasing a
new transformer to solve the voltage drop problem of the
island.
The historical voltage drop was 50V, which was from
230V to 180V in 2016.
According to the result, the Council is planning to install
boosting transformers at three selected sites in the island.
Manual operation in Power House
- Manual Recording and manual decision of Diesel Genset Starting
Daily Photovoltaic power generation graph (on March)
- Variation of electricity generation by time of day
16
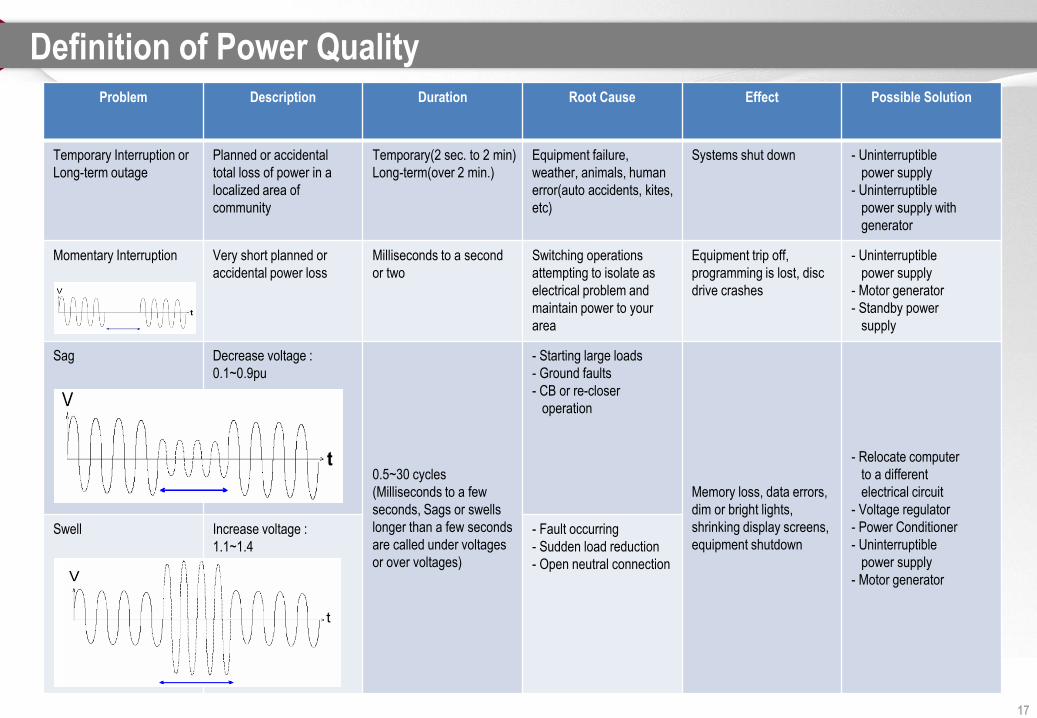
Definition of Power Quality Problem Description Duration Root Cause Effect Possible Solution
Temporary Interruption or
Long-term outage
Planned or accidental
total loss of power in a
localized area of
community
Temporary(2 sec. to 2 min)
Long-term(over 2 min.)
Equipment failure,
weather, animals, human
error(auto accidents, kites,
etc)
Systems shut down - Uninterruptible
power supply
- Uninterruptible
power supply with
generator
Momentary Interruption Very short planned or
accidental power loss
Milliseconds to a second
or two
Switching operations
attempting to isolate as
electrical problem and
maintain power to your
area
Equipment trip off,
programming is lost, disc
drive crashes
- Uninterruptible
power supply
- Motor generator
- Standby power
supply
Sag Decrease voltage :
0.1~0.9pu
0.5~30 cycles
(Milliseconds to a few
seconds, Sags or swells
longer than a few seconds
are called under voltages
or over voltages)
- Starting large loads
- Ground faults
- CB or re-closer
operation
Memory loss, data errors,
dim or bright lights,
shrinking display screens,
equipment shutdown
- Relocate computer
to a different
electrical circuit
- Voltage regulator
- Power Conditioner
- Uninterruptible
power supply
- Motor generator
Swell Increase voltage :
1.1~1.4
- Fault occurring
- Sudden load reduction
- Open neutral connection
17
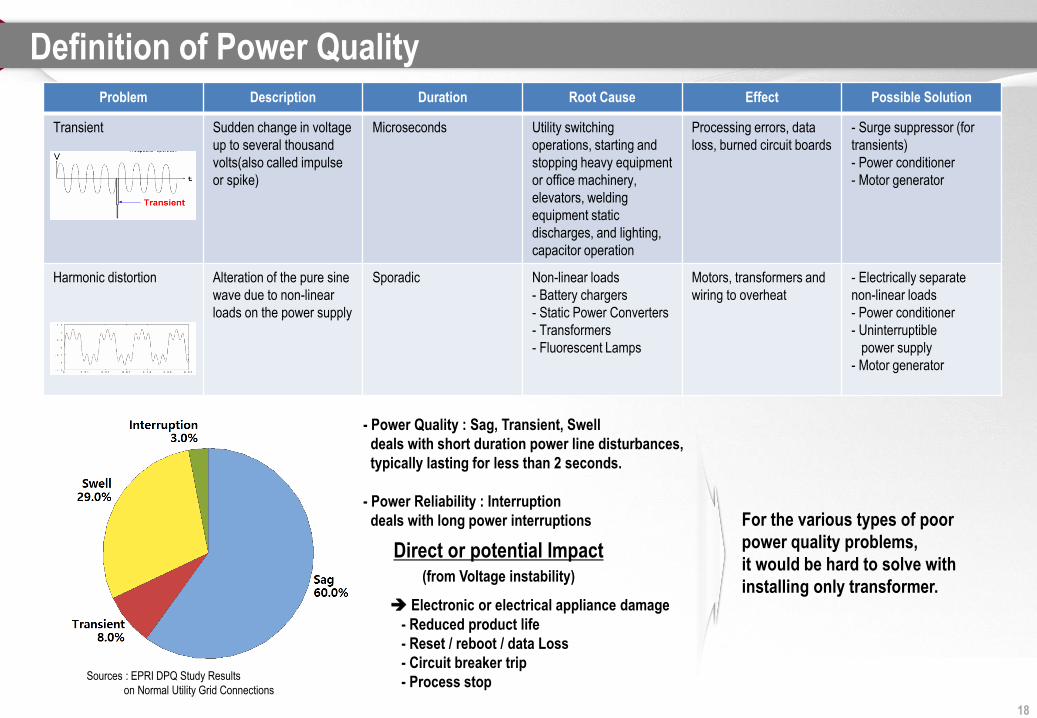
Definition of Power Quality Problem Description Duration Root Cause Effect Possible Solution
Transient Sudden change in voltage
up to several thousand
volts(also called impulse
or spike)
Microseconds Utility switching
operations, starting and
stopping heavy equipment
or office machinery,
elevators, welding
equipment static
discharges, and lighting,
capacitor operation
Processing errors, data
loss, burned circuit boards
- Surge suppressor (for
transients)
- Power conditioner
- Motor generator
Harmonic distortion Alteration of the pure sine
wave due to non-linear
loads on the power supply
Sporadic Non-linear loads
- Battery chargers
- Static Power Converters
- Transformers
- Fluorescent Lamps
Motors, transformers and
wiring to overheat
- Electrically separate
non-linear loads
- Power conditioner
- Uninterruptible
power supply
- Motor generator
- Power Quality : Sag, Transient, Swell
deals with short duration power line disturbances,
typically lasting for less than 2 seconds.
- Power Reliability : Interruption
deals with long power interruptions
Sources : EPRI DPQ Study Results
on Normal Utility Grid Connections
For the various types of poor
power quality problems,
it would be hard to solve with
installing only transformer.
Direct or potential Impact(from Voltage instability)
Electronic or electrical appliance damage
- Reduced product life
- Reset / reboot / data Loss
- Circuit breaker trip
- Process stop
18
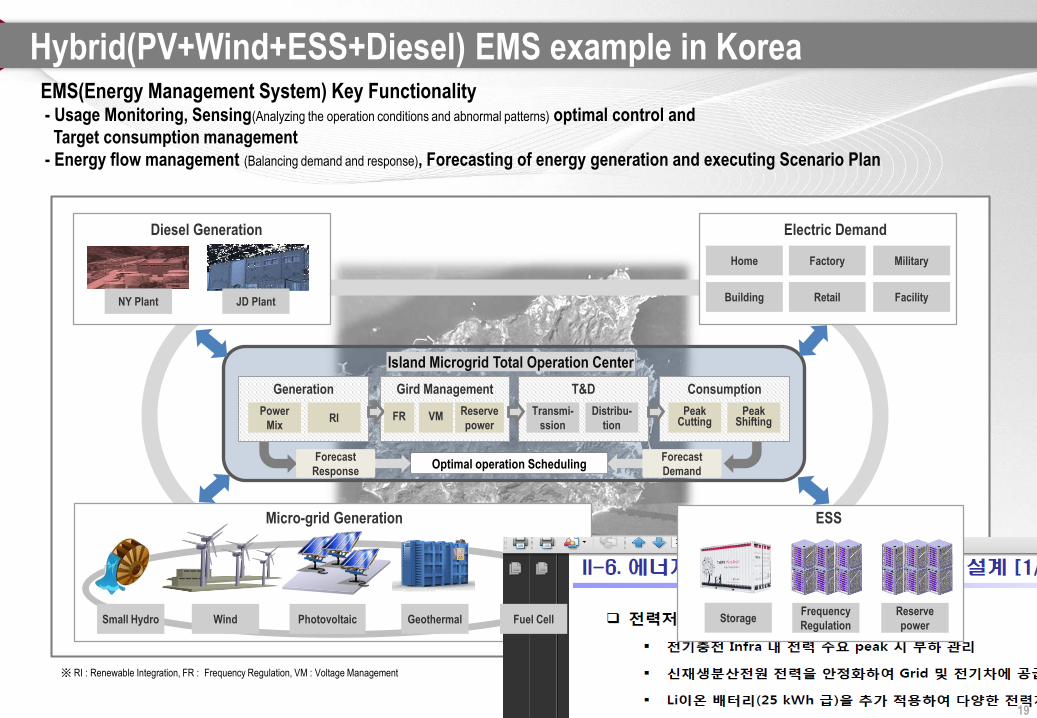
Island Microgrid Total Operation Center
Optimal operation Scheduling
※ RI : Renewable Integration, FR : Frequency Regulation, VM : Voltage Management
EMS(Energy Management System) Key Functionality- Usage Monitoring, Sensing(Analyzing the operation conditions and abnormal patterns) optimal control and
Target consumption management
- Energy flow management (Balancing demand and response), Forecasting of energy generation and executing Scenario Plan
19
Hybrid(PV+Wind+ESS+Diesel) EMS example in Korea

Commercial operation starting month
Power generation fuel savings : 77.8% (vs. same period of last year)
- As was : Diesel consumption 226 kiloliter, As is : 59 kiloliter
Improved frequency retention rate(Sampling period : 0.2second)
- As was : 57%, As is : 100%
Specification limits
AS-WAS : Only Diesel
AS-IS : Hybrid with ESS
Data Source : Korea Electric Power Corporation
Example of Hybrid System Success Story in Korea Gasado island in Korea : Population 286, Wind 400kW, PV 340kW, ESS 3MWh
20
Agenda
LG Energy Solution
National Research project(PV + ESS + Water desalinization in Korea)
Hybrid System ( PV + ESS + Diesel)
Additional 21
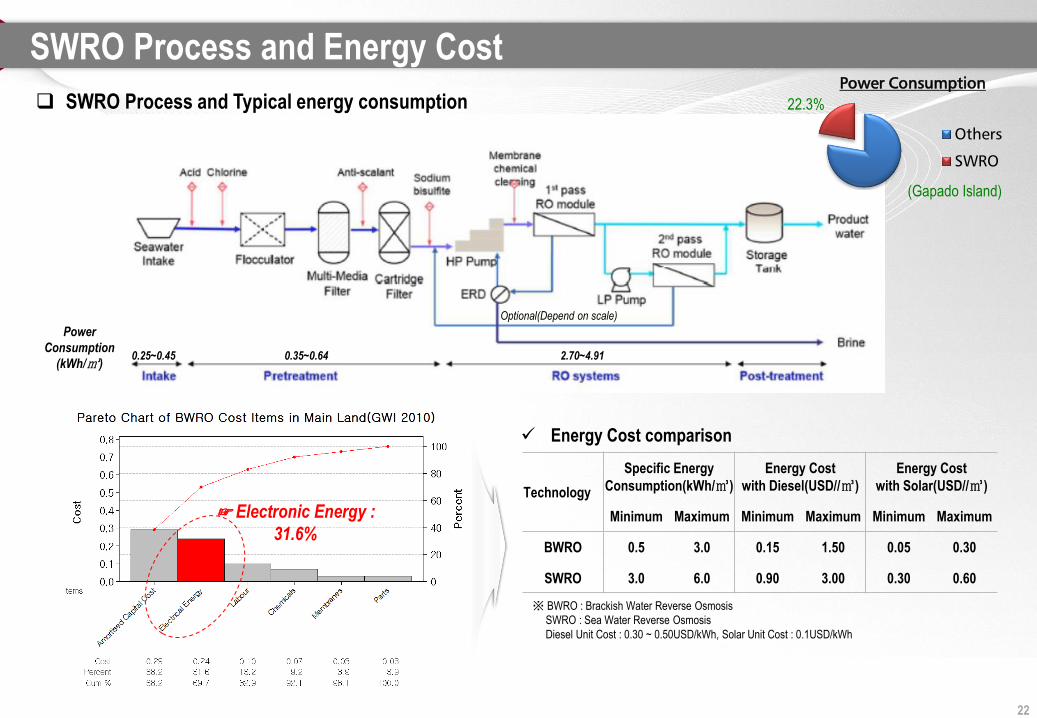
SWRO Process and Energy Cost
☞ Electronic Energy :
31.6%
SWRO Process and Typical energy consumption
Optional(Depend on scale)
Power
Consumption
(kWh/㎥)0.25~0.45 0.35~0.64 2.70~4.91
Technology
Specific Energy
Consumption(kWh/㎥)
Energy Cost
with Diesel(USD//㎥)
Energy Cost
with Solar(USD//㎥)
Minimum Maximum Minimum Maximum Minimum Maximum
BWRO 0.5 3.0 0.15 1.50 0.05 0.30
SWRO 3.0 6.0 0.90 3.00 0.30 0.60
※ BWRO : Brackish Water Reverse Osmosis
SWRO : Sea Water Reverse Osmosis
Diesel Unit Cost : 0.30 ~ 0.50USD/kWh, Solar Unit Cost : 0.1USD/kWh
Energy Cost comparison
22
Power Consumption
Others
SWRO
22.3%
(Gapado Island)

On-going National R&D Project
Containerized SWRO System
Solar Panels
SeawaterIntake Pipe
Pump House
Treated WaterTank
Elevated WaterTank
ESS
SeawaterPump House
Gen-set(Back up)
Well
RO membrane
Portable water supply solution with SWRO+Solar+ESS without commercial power resource
This project is being implemented as a National R&D in Korea by applying LG technology
via Solar Panel, ESS and SWRO Membrane.
21
MF membrane
※ SWRO(Sea Water Reverse Osmosis)
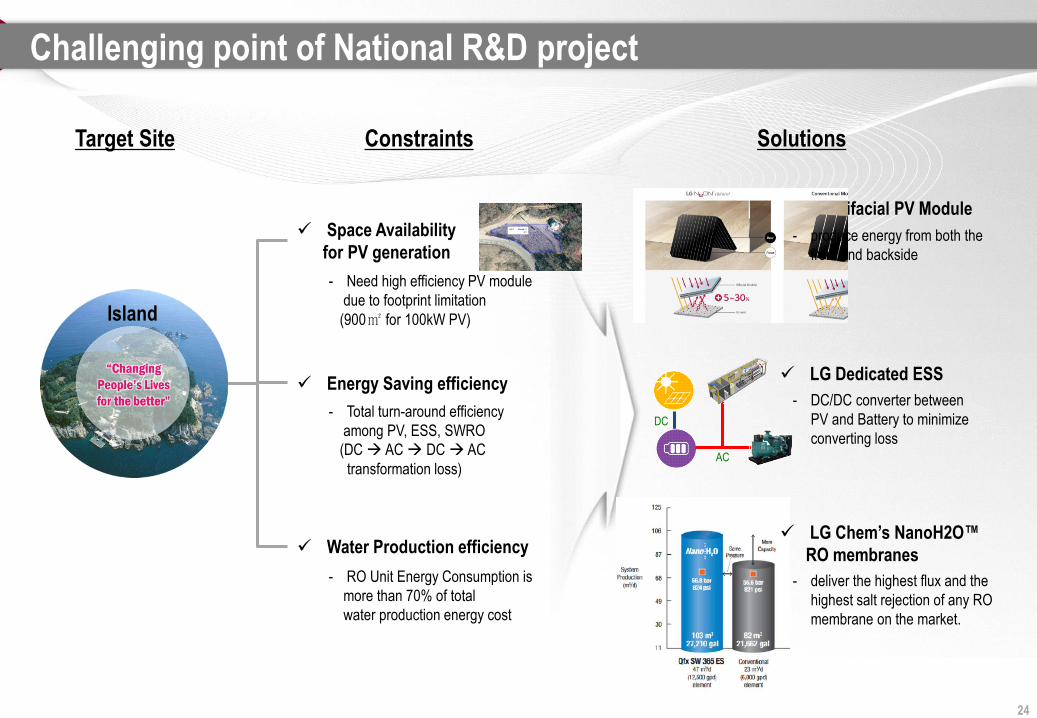
Space Availability
for PV generation
Target Site Solutions
Challenging point of National R&D project
Island
Constraints
Energy Saving efficiency
Water Production efficiency
- Need high efficiency PV module
due to footprint limitation
(900㎡ for 100kW PV)
- Total turn-around efficiency
among PV, ESS, SWRO
(DC AC DC AC
transformation loss)
- RO Unit Energy Consumption is
more than 70% of total
water production energy cost
LG Bifacial PV Module
- produce energy from both the
front and backside
LG Dedicated ESS
DC
AC
- DC/DC converter between
PV and Battery to minimize
converting loss
- deliver the highest flux and the
highest salt rejection of any RO
membrane on the market.
LG Chem’s NanoH2O™
RO membranes
24
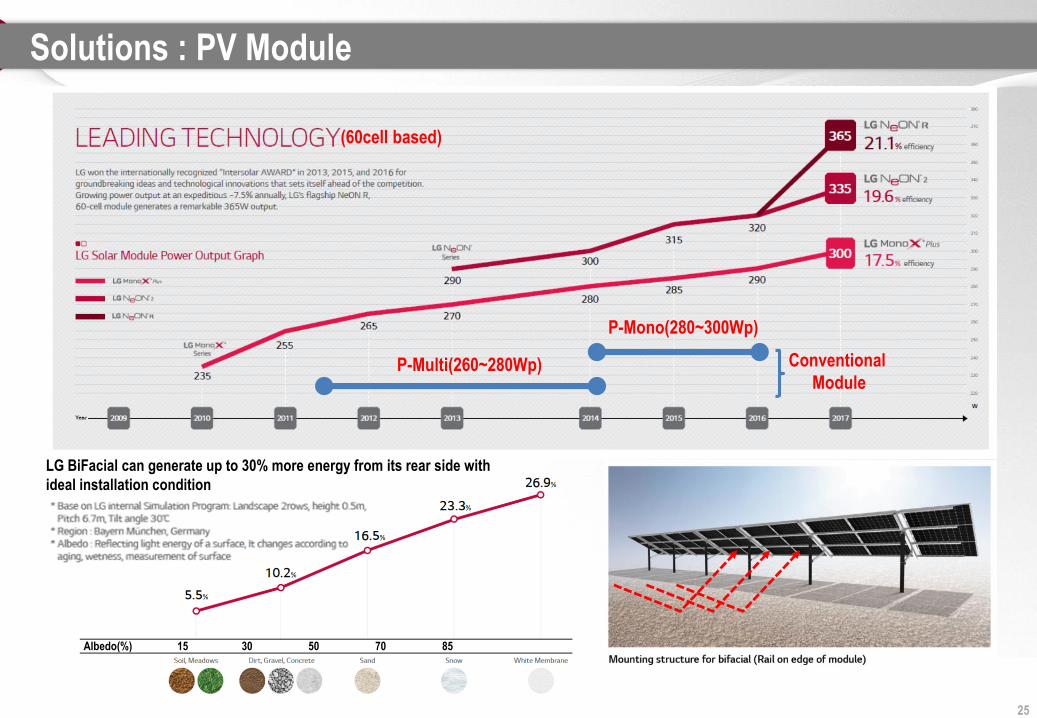
Solutions : PV Module
Albedo(%) 15 30 50 70 85
LG BiFacial can generate up to 30% more energy from its rear side with
ideal installation condition
(60cell based)
P-Multi(260~280Wp)
P-Mono(280~300Wp)
Conventional
Module
25
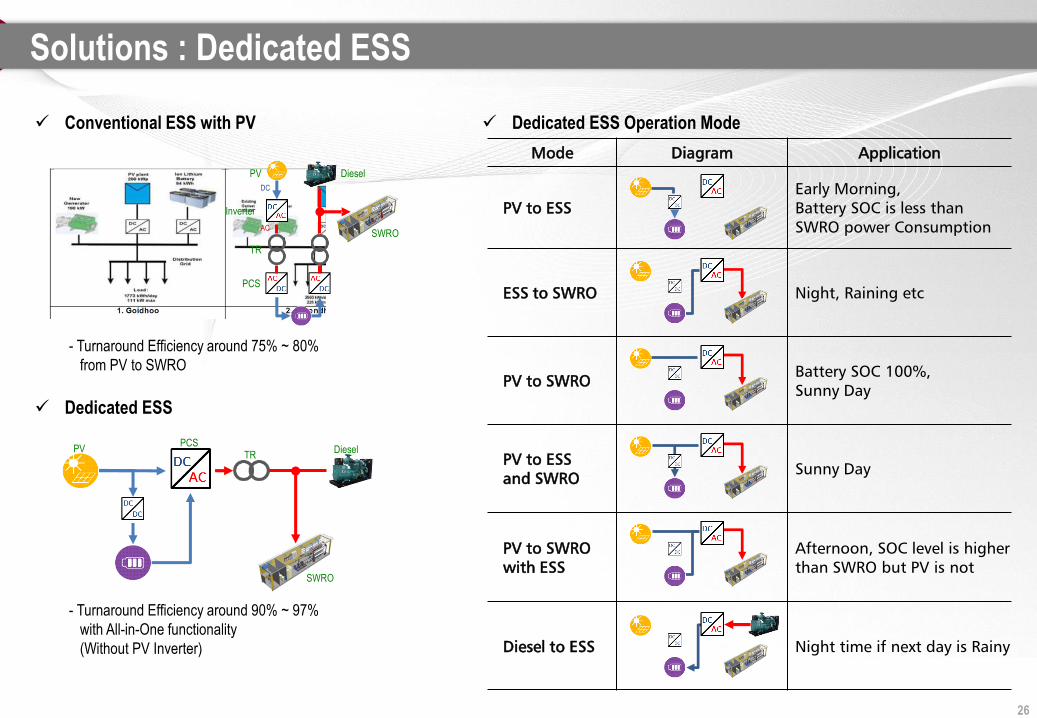
Mode Diagram Application
PV to ESS
Early Morning,
Battery SOC is less than
SWRO power Consumption
ESS to SWRO Night, Raining etc
PV to SWROBattery SOC 100%,
Sunny Day
PV to ESS
and SWROSunny Day
PV to SWRO
with ESS
Afternoon, SOC level is higher
than SWRO but PV is not
Diesel to ESS Night time if next day is Rainy
Solutions : Dedicated ESS
Conventional ESS with PV
Dedicated ESS
- Turnaround Efficiency around 75% ~ 80%
from PV to SWRO
PV
TR
PCS
Inverter
Diesel
SWRO
PVTR
PCSDiesel
SWRO
DC
AC
- Turnaround Efficiency around 90% ~ 97%
with All-in-One functionality
(Without PV Inverter)
Dedicated ESS Operation Mode
26
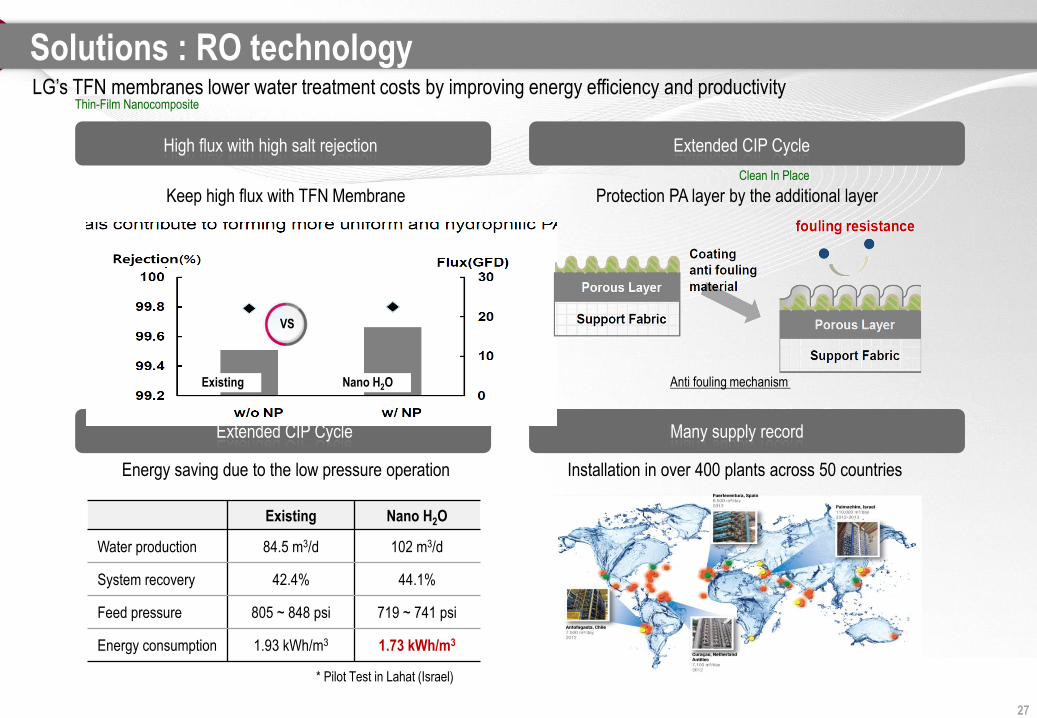
Thin-Film Nanocomposite
Clean In Place
27
Existing Nano H2O Anti fouling mechanism
Existing Nano H2O
Water production 84.5 m3/d 102 m3/d
System recovery 42.4% 44.1%
Feed pressure 805 ~ 848 psi 719 ~ 741 psi
Energy consumption 1.93 kWh/m3 1.73 kWh/m3
* Pilot Test in Lahat (Israel)
VS
Solutions : RO technology
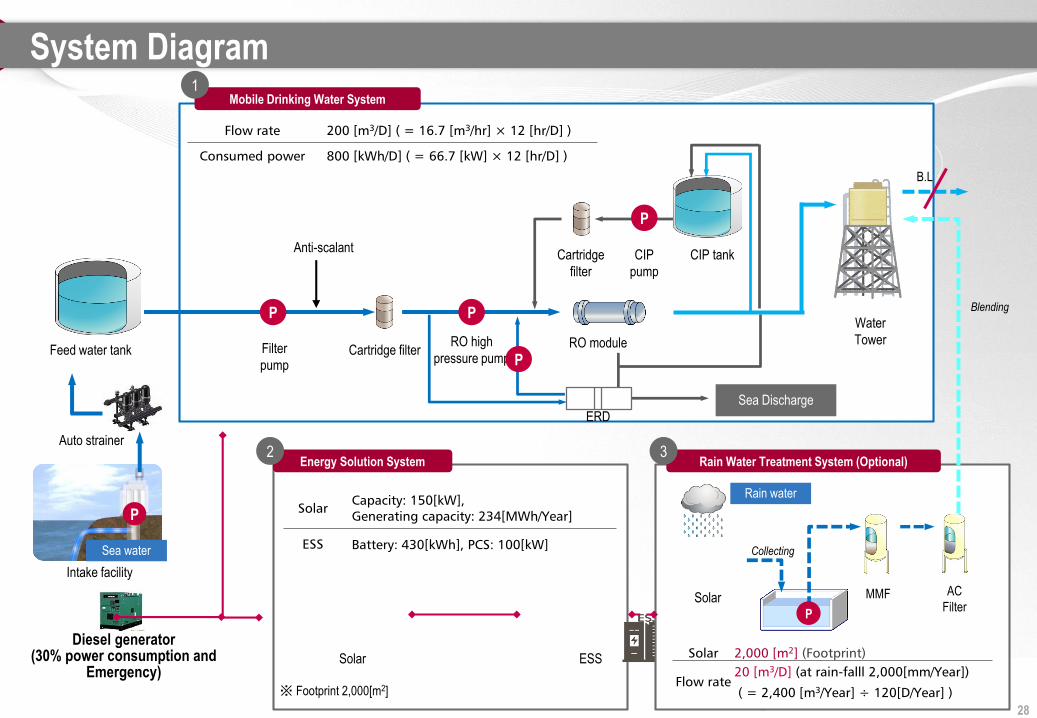
P P
RO moduleFilter
pumpFeed water tank Cartridge filter
P
CIP tankCIP
pump
Cartridge
filter
RO high
pressure pump
Anti-scalant
Flow rate 200 [m3/D] ( = 16.7 [m
3/hr] × 12 [hr/D] )
Consumed power 800 [kWh/D] ( = 66.7 [kW] × 12 [hr/D] )
Sea Discharge
※ Footprint 2,000[m2]
Solar ESS
SolarCapacity: 150[kW],
Generating capacity: 234[MWh/Year]
ESS Battery: 430[kWh], PCS: 100[kW]
Diesel generator(30% power consumption and
Emergency)
Mobile Drinking Water System
Energy Solution System
B.L
1
2
P
Intake facility
Auto strainer
ERD
Water
Tower
Solar
Solar 2,000 [m2] (Footprint)
Flow rate
20 [m3/D] (at rain-falll 2,000[mm/Year])
( = 2,400 [m3/Year] ÷ 120[D/Year] )
Rain Water Treatment System (Optional)3
Rain water
MMF AC
FilterP
Sea water
P
Collecting
Blending
28
System Diagram
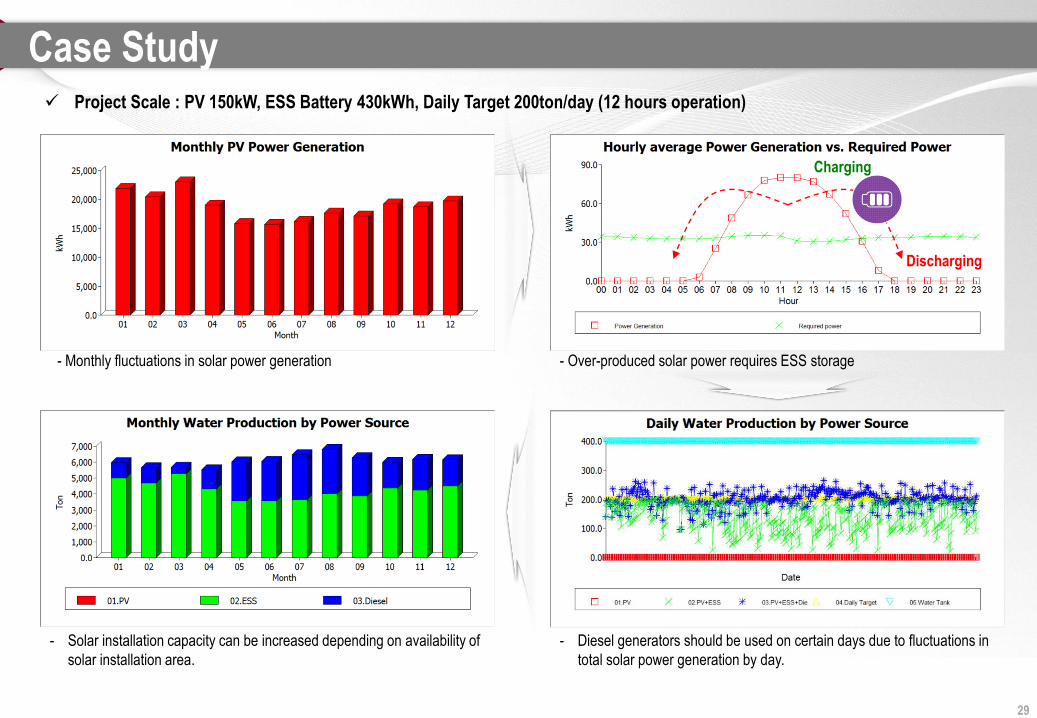
Case Study Project Scale : PV 150kW, ESS Battery 430kWh, Daily Target 200ton/day (12 hours operation)
- Monthly fluctuations in solar power generation - Over-produced solar power requires ESS storage
- Diesel generators should be used on certain days due to fluctuations in
total solar power generation by day.
- Solar installation capacity can be increased depending on availability of
solar installation area.
29
Charging
Discharging
(SWRO)
Solar
Diesel
ESS
1
2
3 4
Bi-directional
(Net-metering)
One Way
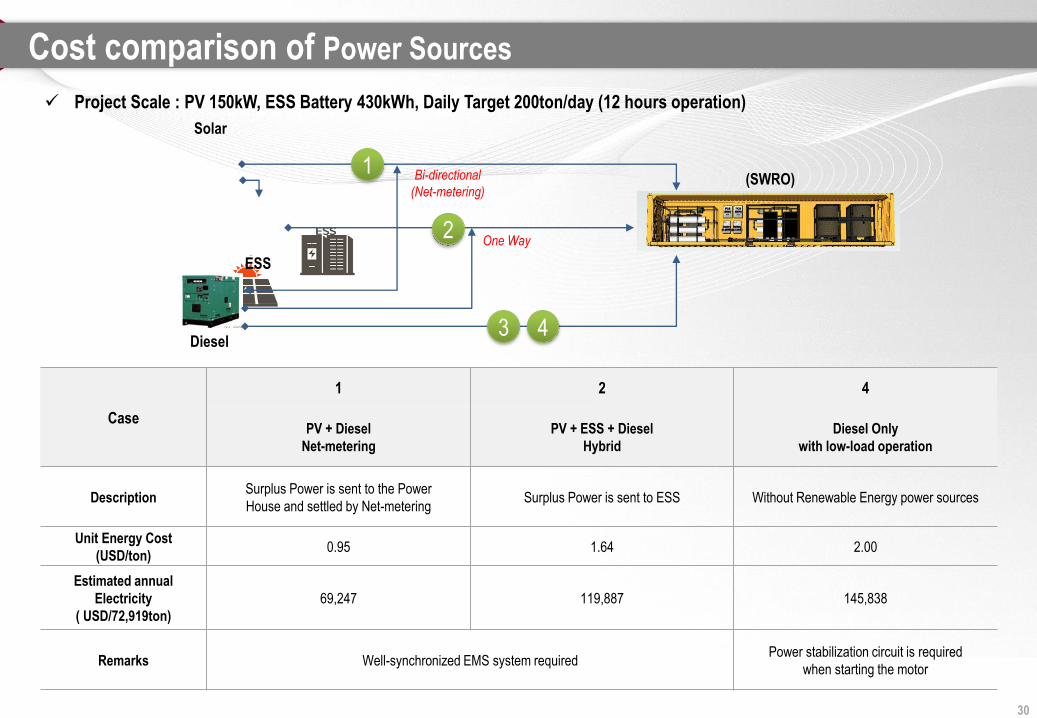
Cost comparison of Power Sources
Case
1 2 4
PV + Diesel
Net-metering
PV + ESS + Diesel
Hybrid
Diesel Only
with low-load operation
DescriptionSurplus Power is sent to the Power
House and settled by Net-meteringSurplus Power is sent to ESS Without Renewable Energy power sources
Unit Energy Cost
(USD/ton)0.95 1.64 2.00
Estimated annual
Electricity
( USD/72,919ton)
69,247 119,887 145,838
Remarks Well-synchronized EMS system requiredPower stabilization circuit is required
when starting the motor
30
Project Scale : PV 150kW, ESS Battery 430kWh, Daily Target 200ton/day (12 hours operation)
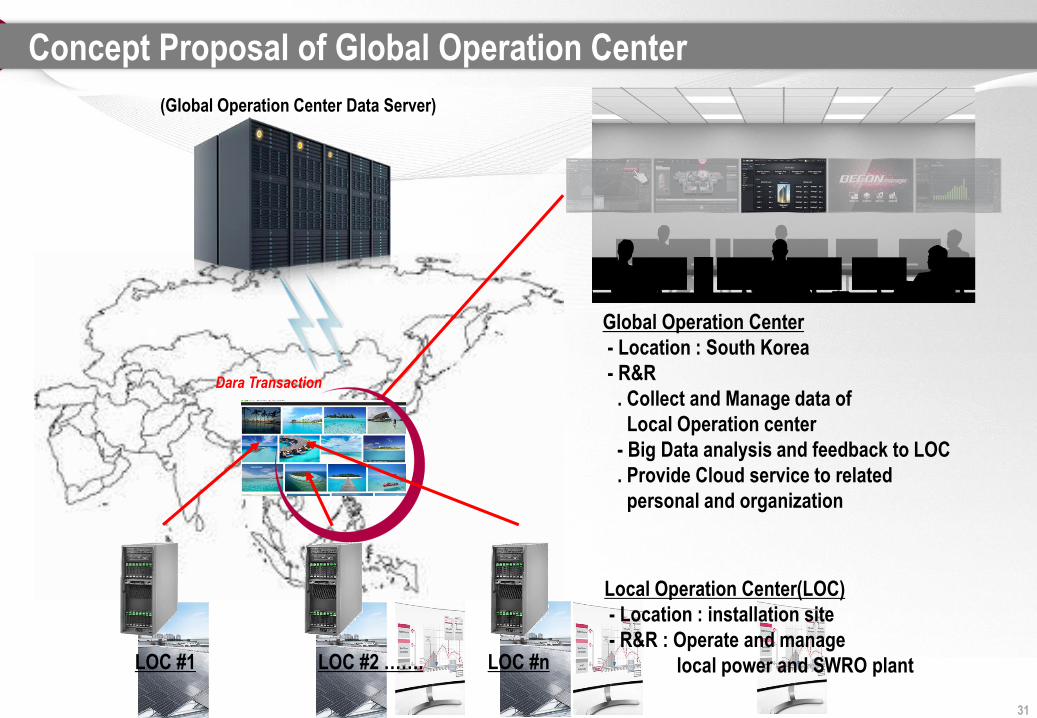
Concept Proposal of Global Operation Center
Global Operation Center
- Location : South Korea
- R&R
. Collect and Manage data of
Local Operation center
- Big Data analysis and feedback to LOC
. Provide Cloud service to related
personal and organization
Local Operation Center(LOC)
- Location : installation site
- R&R : Operate and manage
local power and SWRO plant LOC #1 LOC #2 ……. LOC #n
(Global Operation Center Data Server)
Dara Transaction
31

PV SWRO
PV : 100kW
SWRO
ESS(100/300kWh)
Water Tank
Site Information
32

Thank You
See http://www.lgenergy.com
Contact us at [email protected]
For more information about LG Energy & Water Solutions,