Embed Size (px)
Citation preview
Part of Link Group
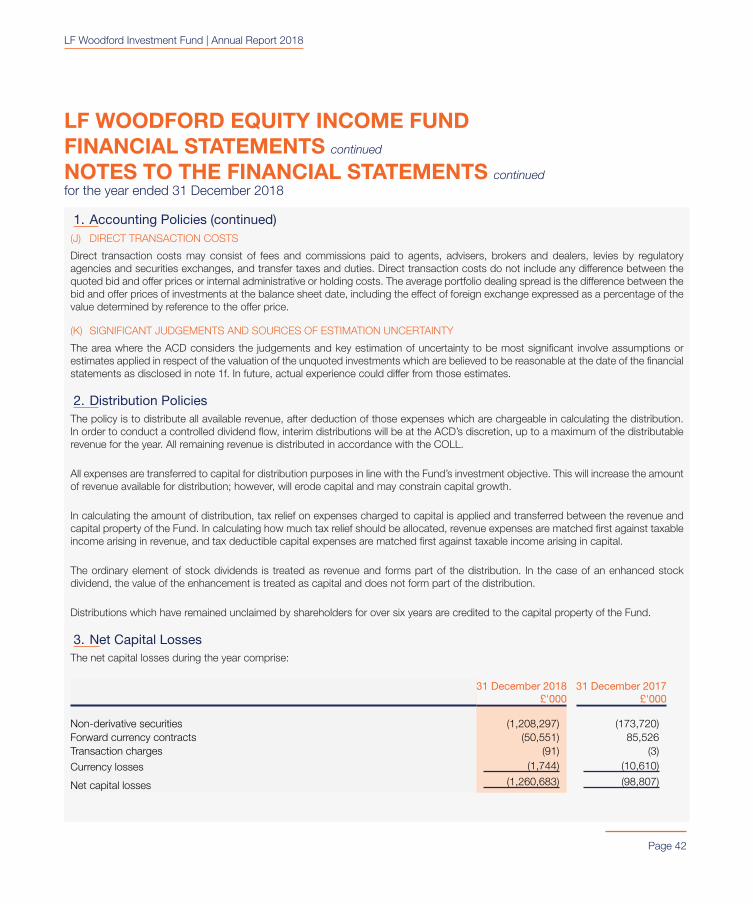
LF Woodford Investment FundLF Woodford Equity Income FundANNUAL REPORT FOR THE YEAR ENDED 31 DECEMBER 2018
LF Woodford Investment Fund | Annual Report 2018
AUTHORISED CORPORATE DIRECTOR (‘ACD’)LINK FUND SOLUTIONS LIMITEDHead Office:6th Floor65 Gresham Street London EC2V 7NQTelephone: 0870 607 2555 Fax: 0870 607 2550Email: [email protected](Authorised and regulated by the Financial Conduct Authority)
DIRECTORS OF THE ACDC. AddenbrookeN. BoylingB. HammondP. Hugh-SmithK.J. MidlA.J. Stuart
INVESTMENT MANAGERWOODFORD INVESTMENT MANAGEMENT LIMITED9400 Garsington RoadOxford OX4 2HN(Authorised and regulated bythe Financial Conduct Authority)
DEPOSITARYNORTHERN TRUST GLOBAL SERVICES SE UK BRANCH 50 Bank StreetCanary WharfLondon E14 5NT(Authorised by the Prudential RegulationAuthority and regulated by the FinancialConduct Authority and the Prudential Regulation Authority)
REGISTRAR AND ADMINISTRATORNORTHERN TRUST GLOBAL SERVICES SEUK BRANCH 50 Bank StreetCanary WharfLondon E14 5NTTelephone Number: 0333 300 0381Fax Number: 0207 643 3776Email: [email protected](Authorised by the Prudential Regulation Authority and regulated by the Financial Conduct Authority)
INDEPENDENT AUDITORGRANT THORNTON UK LLP30 Finsbury SquareLondon EC2A 1AG
LF Woodford Investment Fund | Annual Report 2018
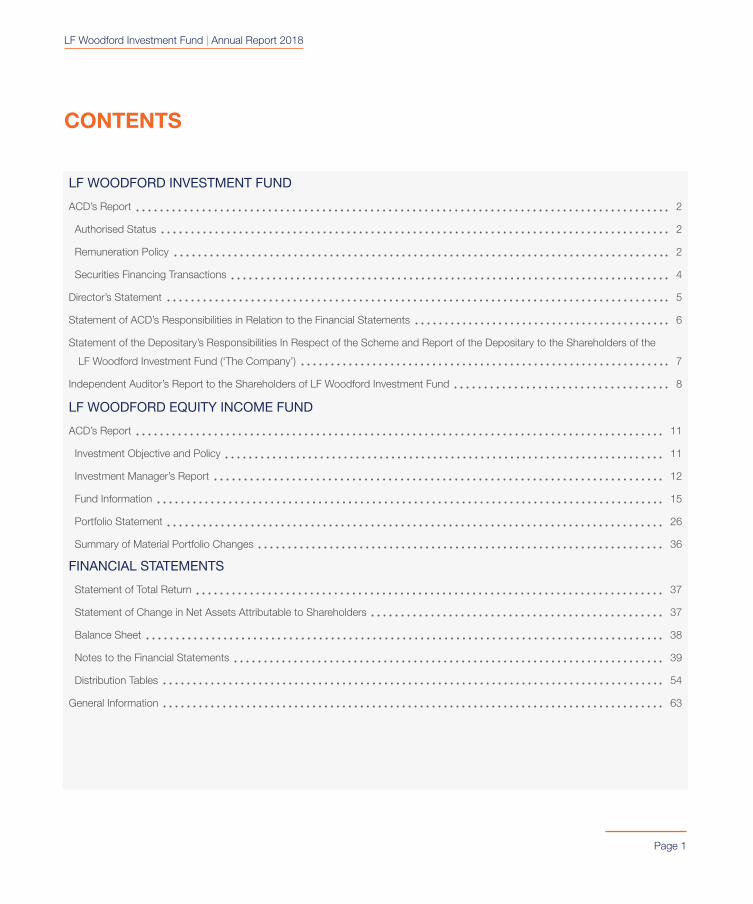
CONTENTS
Page 1
LF WOODFORD INVESTMENT FUND
ACD’s Report 2
Authorised Status 2
Remuneration Policy 2
Securities Financing Transactions 4
Director’s Statement 5
Statement of ACD’s Responsibilities in Relation to the Financial Statements 6
Statement of the Depositary’s Responsibilities In Respect of the Scheme and Report of the Depositary to the Shareholders of the
LF Woodford Investment Fund (‘The Company’) 7
Independent Auditor’s Report to the Shareholders of LF Woodford Investment Fund 8
LF WOODFORD EQUITY INCOME FUND
ACD’s Report 11
Investment Objective and Policy 11
Investment Manager’s Report 12
Fund Information 15
Portfolio Statement 26
Summary of Material Portfolio Changes 36
FINANCIAL STATEMENTS
Statement of Total Return 37
Statement of Change in Net Assets Attributable to Shareholders 37
Balance Sheet 38
Notes to the Financial Statements 39
Distribution Tables 54
General Information 63
LF Woodford Investment Fund | Annual Report 2018
Page 2
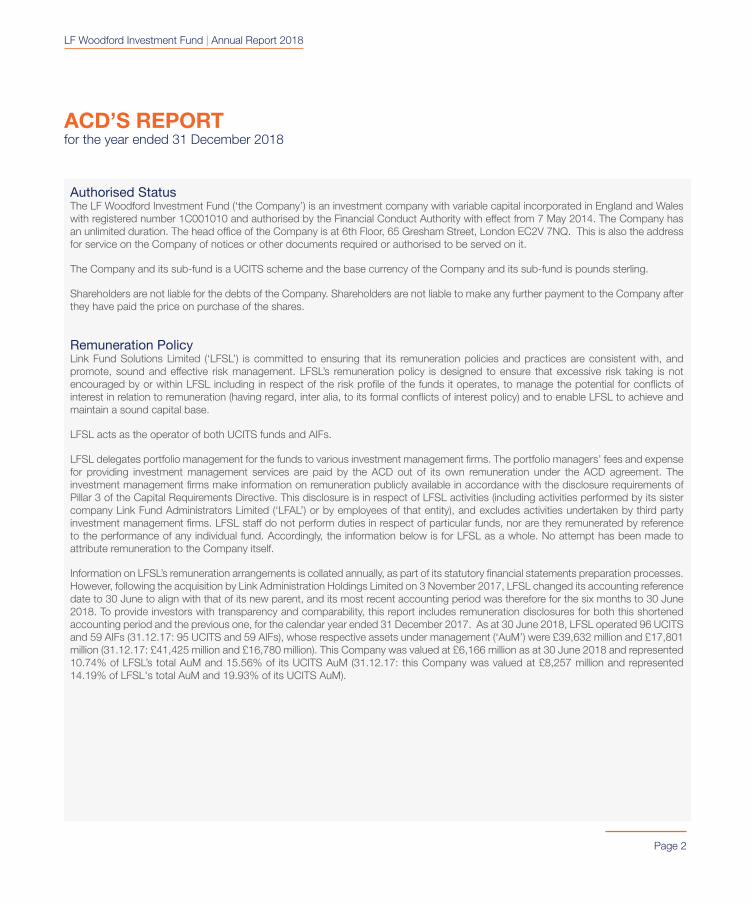
ACD’S REPORTfor the year ended 31 December 2018
Authorised StatusThe LF Woodford Investment Fund (‘the Company’) is an investment company with variable capital incorporated in England and Wales with registered number 1C001010 and authorised by the Financial Conduct Authority with effect from 7 May 2014. The Company has an unlimited duration. The head office of the Company is at 6th Floor, 65 Gresham Street, London EC2V 7NQ. This is also the address for service on the Company of notices or other documents required or authorised to be served on it.
The Company and its sub-fund is a UCITS scheme and the base currency of the Company and its sub-fund is pounds sterling.
Shareholders are not liable for the debts of the Company. Shareholders are not liable to make any further payment to the Company after they have paid the price on purchase of the shares.
Remuneration PolicyLink Fund Solutions Limited (‘LFSL’) is committed to ensuring that its remuneration policies and practices are consistent with, and promote, sound and effective risk management. LFSL’s remuneration policy is designed to ensure that excessive risk taking is not encouraged by or within LFSL including in respect of the risk profile of the funds it operates, to manage the potential for conflicts of interest in relation to remuneration (having regard, inter alia, to its formal conflicts of interest policy) and to enable LFSL to achieve and maintain a sound capital base.
LFSL acts as the operator of both UCITS funds and AIFs.
LFSL delegates portfolio management for the funds to various investment management firms. The portfolio managers’ fees and expense for providing investment management services are paid by the ACD out of its own remuneration under the ACD agreement. The investment management firms make information on remuneration publicly available in accordance with the disclosure requirements of Pillar 3 of the Capital Requirements Directive. This disclosure is in respect of LFSL activities (including activities performed by its sister company Link Fund Administrators Limited (‘LFAL’) or by employees of that entity), and excludes activities undertaken by third party investment management firms. LFSL staff do not perform duties in respect of particular funds, nor are they remunerated by reference to the performance of any individual fund. Accordingly, the information below is for LFSL as a whole. No attempt has been made to attribute remuneration to the Company itself.
Information on LFSL’s remuneration arrangements is collated annually, as part of its statutory financial statements preparation processes. However, following the acquisition by Link Administration Holdings Limited on 3 November 2017, LFSL changed its accounting reference date to 30 June to align with that of its new parent, and its most recent accounting period was therefore for the six months to 30 June 2018. To provide investors with transparency and comparability, this report includes remuneration disclosures for both this shortened accounting period and the previous one, for the calendar year ended 31 December 2017. As at 30 June 2018, LFSL operated 96 UCITS and 59 AIFs (31.12.17: 95 UCITS and 59 AIFs), whose respective assets under management (‘AuM’) were £39,632 million and £17,801 million (31.12.17: £41,425 million and £16,780 million). This Company was valued at £6,166 million as at 30 June 2018 and represented 10.74% of LFSL’s total AuM and 15.56% of its UCITS AuM (31.12.17: this Company was valued at £8,257 million and represented 14.19% of LFSL's total AuM and 19.93% of its UCITS AuM).
LF Woodford Investment Fund | Annual Report 2018
ACD’S REPORT continuedfor the year ended 31 December 2018
Page 3
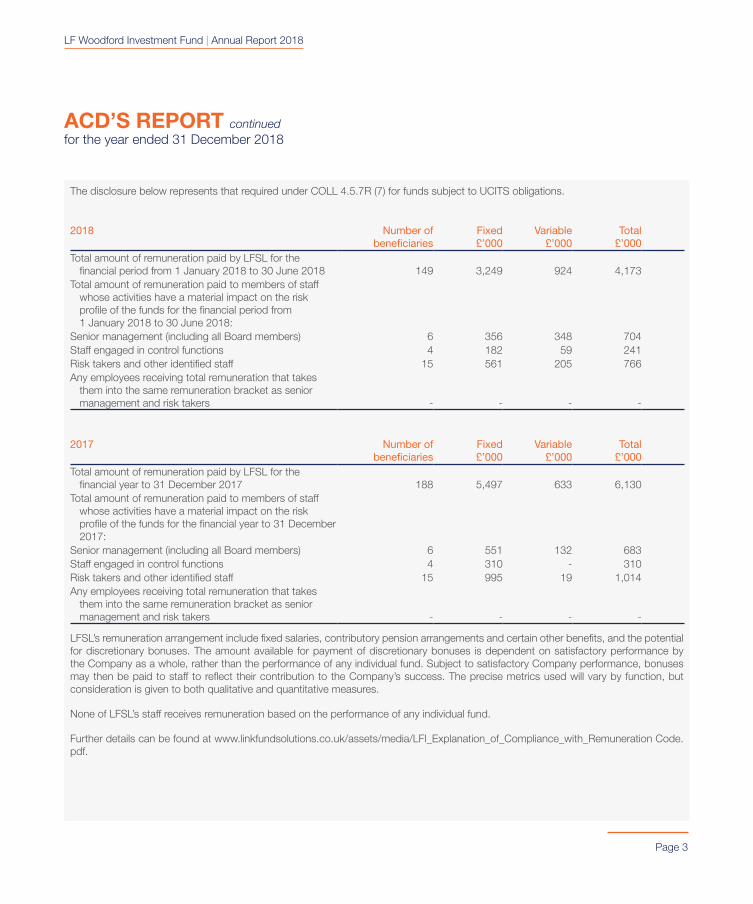
The disclosure below represents that required under COLL 4.5.7R (7) for funds subject to UCITS obligations.
2018 Number of beneficiaries
Fixed £’000
Variable £’000
Total £’000
Total amount of remuneration paid by LFSL for the financial period from 1 January 2018 to 30 June 2018 149 3,249 924 4,173
Total amount of remuneration paid to members of staff whose activities have a material impact on the risk profile of the funds for the financial period from 1 January 2018 to 30 June 2018:
Senior management (including all Board members) 6 356 348 704Staff engaged in control functions 4 182 59 241Risk takers and other identified staff 15 561 205 766Any employees receiving total remuneration that takes
them into the same remuneration bracket as senior management and risk takers - - - -
2017 Number of beneficiaries
Fixed £’000
Variable £’000
Total £’000
Total amount of remuneration paid by LFSL for the financial year to 31 December 2017 188 5,497 633 6,130
Total amount of remuneration paid to members of staff whose activities have a material impact on the risk profile of the funds for the financial year to 31 December 2017:
Senior management (including all Board members) 6 551 132 683Staff engaged in control functions 4 310 - 310Risk takers and other identified staff 15 995 19 1,014Any employees receiving total remuneration that takes
them into the same remuneration bracket as senior management and risk takers - - - -
LFSL’s remuneration arrangement include fixed salaries, contributory pension arrangements and certain other benefits, and the potential for discretionary bonuses. The amount available for payment of discretionary bonuses is dependent on satisfactory performance by the Company as a whole, rather than the performance of any individual fund. Subject to satisfactory Company performance, bonuses may then be paid to staff to reflect their contribution to the Company’s success. The precise metrics used will vary by function, but consideration is given to both qualitative and quantitative measures.
None of LFSL’s staff receives remuneration based on the performance of any individual fund.
Further details can be found at www.linkfundsolutions.co.uk/assets/media/LFI_Explanation_of_Compliance_with_Remuneration Code.pdf.
LF Woodford Investment Fund | Annual Report 2018
ACD’S REPORT continuedfor the year ended 31 December 2018
Page 4
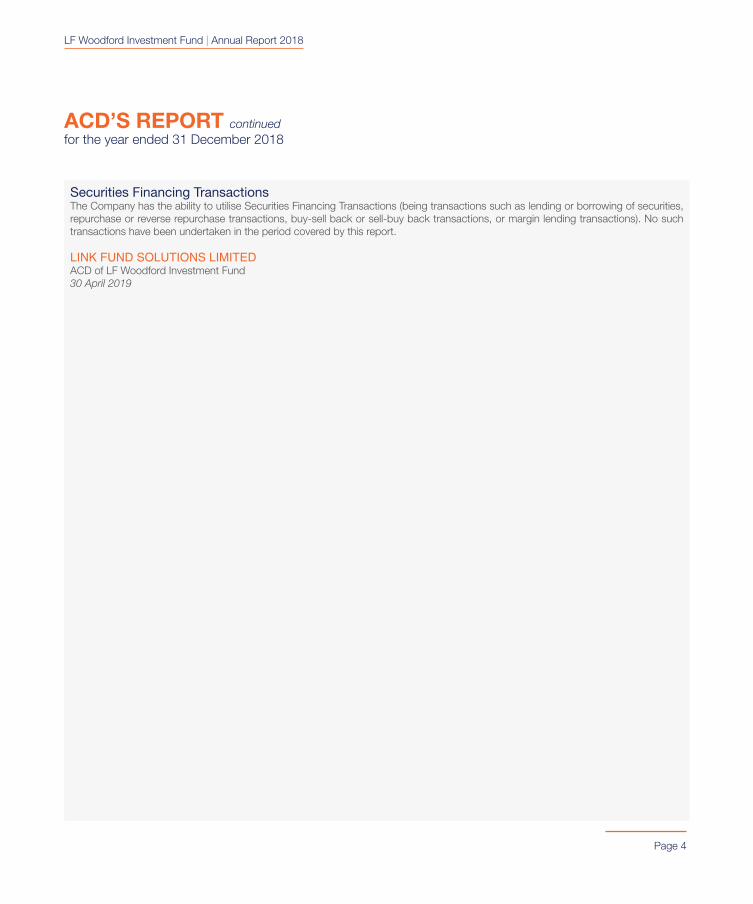
Securities Financing TransactionsThe Company has the ability to utilise Securities Financing Transactions (being transactions such as lending or borrowing of securities, repurchase or reverse repurchase transactions, buy-sell back or sell-buy back transactions, or margin lending transactions). No such transactions have been undertaken in the period covered by this report.
LINK FUND SOLUTIONS LIMITEDACD of LF Woodford Investment Fund30 April 2019
Page 5
DIRECTOR’S STATEMENT
LF Woodford Investment Fund | Annual Report 2018
This report has been prepared in accordance with the requirements of the Collective Investment Schemes Sourcebook as issued and amended by the Financial Conduct Authority.
N. BOYLING
LINK FUND SOLUTIONS LIMITEDACD of LF Woodford Equity Income Fund30 April 2019
Page 6
STATEMENT OF ACD’S RESPONSIBILITIES IN RELATION TO THE FINANCIAL STATEMENTS
LF Woodford Investment Fund | Annual Report 2018
The Collective Investment Schemes sourcebook published by the Financial Conduct Authority (‘the COLL Rules’) requires the ACD to prepare financial statements for each annual accounting year which give a true and fair view of the financial position of the Company, comprising its sub-fund, and of the net revenue and net capital gains/losses on the property of the Company’s sub-fund for the year.
In preparing the financial statements the ACD is responsible for:
• selecting suitable accounting policies and then applying them consistently;
• making judgements and estimates that are reasonable and prudent;
• following UK accounting standards, including FRS 102 The Financial Reporting Standard applicable in the UK and Republic of Ireland;
• complying with the disclosure requirements of the Statement of Recommended Practice for UK Authorised Funds issued by the Investment Association in May 2014;
• keeping proper accounting records which enable it to demonstrate that the financial statements as prepared comply with the above requirements;
• assessing the Company and its sub-funds’ ability to continue as a going concern, disclosing, as applicable, matters related to going concern;
• using the going concern basis of accounting unless they either intend to liquidate the Company or its sub-fund or to cease operations, or have no realistic alternative but to do so;
• such internal control as they determine is necessary to enable the preparation of financial statements that are free from material misstatement, whether due to fraud or error; and
• taking reasonable steps for the prevention and detection of fraud and irregularities.
The ACD is responsible for the management of the Company in accordance with its Instrument of Incorporation, the Prospectus and the COLL Rules.
Page 7
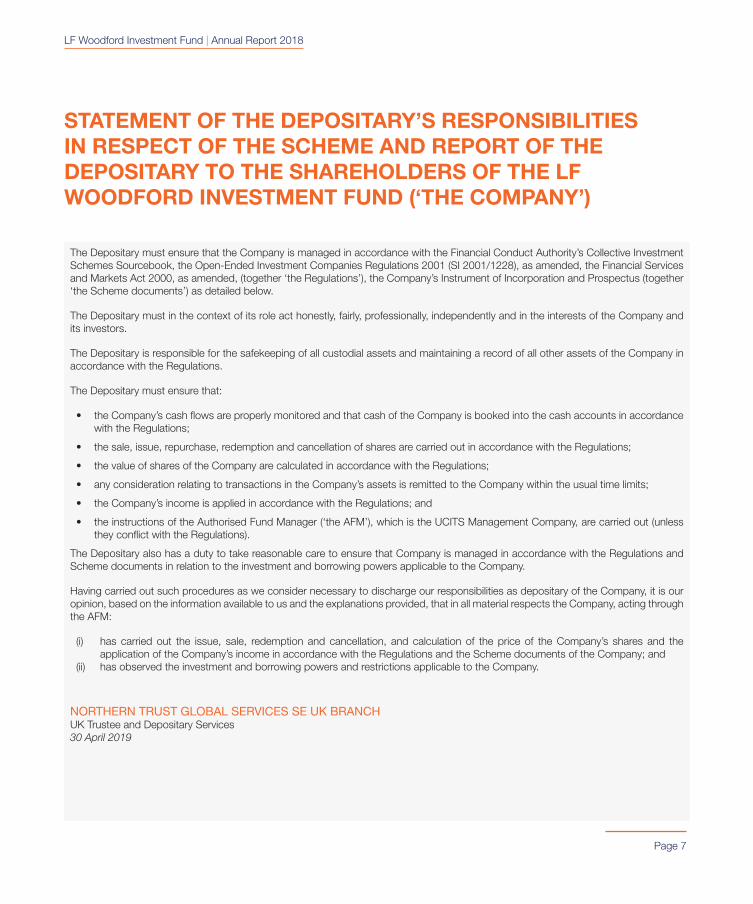
STATEMENT OF THE DEPOSITARY’S RESPONSIBILITIES IN RESPECT OF THE SCHEME AND REPORT OF THE DEPOSITARY TO THE SHAREHOLDERS OF THE LF WOODFORD INVESTMENT FUND (‘THE COMPANY’)
LF Woodford Investment Fund | Annual Report 2018
The Depositary must ensure that the Company is managed in accordance with the Financial Conduct Authority’s Collective Investment Schemes Sourcebook, the Open-Ended Investment Companies Regulations 2001 (SI 2001/1228), as amended, the Financial Services and Markets Act 2000, as amended, (together ‘the Regulations’), the Company’s Instrument of Incorporation and Prospectus (together ‘the Scheme documents’) as detailed below.
The Depositary must in the context of its role act honestly, fairly, professionally, independently and in the interests of the Company and its investors.
The Depositary is responsible for the safekeeping of all custodial assets and maintaining a record of all other assets of the Company in accordance with the Regulations.
The Depositary must ensure that:
• the Company’s cash flows are properly monitored and that cash of the Company is booked into the cash accounts in accordance with the Regulations;
• the sale, issue, repurchase, redemption and cancellation of shares are carried out in accordance with the Regulations;
• the value of shares of the Company are calculated in accordance with the Regulations;
• any consideration relating to transactions in the Company’s assets is remitted to the Company within the usual time limits;
• the Company’s income is applied in accordance with the Regulations; and
• the instructions of the Authorised Fund Manager (‘the AFM’), which is the UCITS Management Company, are carried out (unless they conflict with the Regulations).
The Depositary also has a duty to take reasonable care to ensure that Company is managed in accordance with the Regulations and Scheme documents in relation to the investment and borrowing powers applicable to the Company.
Having carried out such procedures as we consider necessary to discharge our responsibilities as depositary of the Company, it is our opinion, based on the information available to us and the explanations provided, that in all material respects the Company, acting through the AFM:
(i) has carried out the issue, sale, redemption and cancellation, and calculation of the price of the Company’s shares and the application of the Company’s income in accordance with the Regulations and the Scheme documents of the Company; and
(ii) has observed the investment and borrowing powers and restrictions applicable to the Company.
NORTHERN TRUST GLOBAL SERVICES SE UK BRANCHUK Trustee and Depositary Services30 April 2019
Page 8
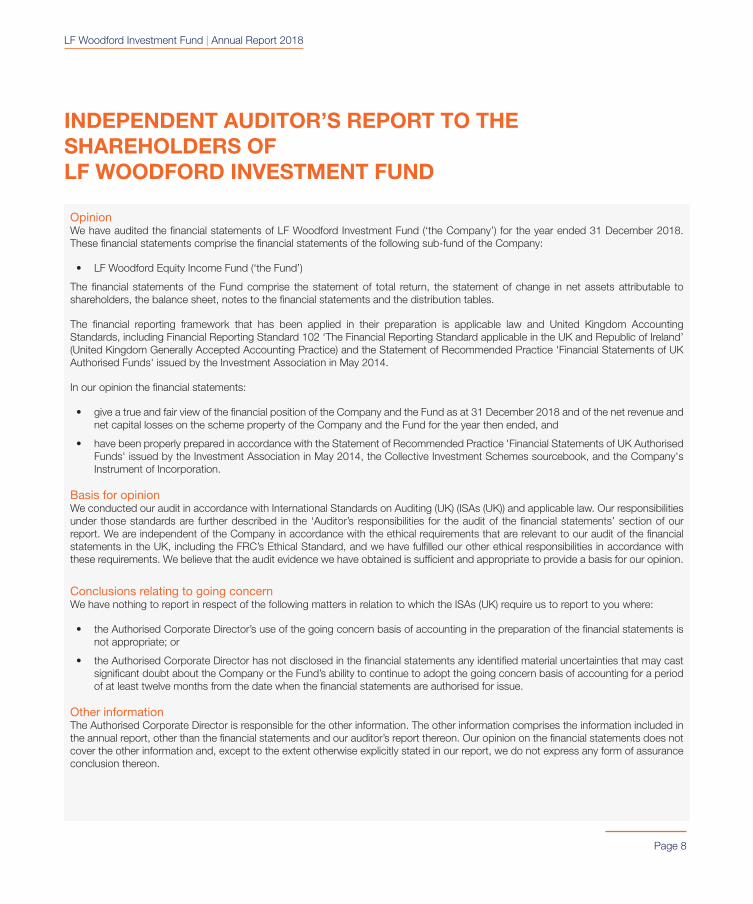
INDEPENDENT AUDITOR’S REPORT TO THESHAREHOLDERS OFLF WOODFORD INVESTMENT FUND
LF Woodford Investment Fund | Annual Report 2018
OpinionWe have audited the financial statements of LF Woodford Investment Fund (‘the Company’) for the year ended 31 December 2018. These financial statements comprise the financial statements of the following sub-fund of the Company:
• LF Woodford Equity Income Fund (‘the Fund’)
The financial statements of the Fund comprise the statement of total return, the statement of change in net assets attributable to shareholders, the balance sheet, notes to the financial statements and the distribution tables.
The financial reporting framework that has been applied in their preparation is applicable law and United Kingdom Accounting Standards, including Financial Reporting Standard 102 ‘The Financial Reporting Standard applicable in the UK and Republic of Ireland’ (United Kingdom Generally Accepted Accounting Practice) and the Statement of Recommended Practice 'Financial Statements of UK Authorised Funds' issued by the Investment Association in May 2014.
In our opinion the financial statements:
• give a true and fair view of the financial position of the Company and the Fund as at 31 December 2018 and of the net revenue and net capital losses on the scheme property of the Company and the Fund for the year then ended, and
• have been properly prepared in accordance with the Statement of Recommended Practice 'Financial Statements of UK Authorised Funds' issued by the Investment Association in May 2014, the Collective Investment Schemes sourcebook, and the Company's Instrument of Incorporation.
Basis for opinionWe conducted our audit in accordance with International Standards on Auditing (UK) (ISAs (UK)) and applicable law. Our responsibilities under those standards are further described in the ‘Auditor’s responsibilities for the audit of the financial statements’ section of our report. We are independent of the Company in accordance with the ethical requirements that are relevant to our audit of the financial statements in the UK, including the FRC’s Ethical Standard, and we have fulfilled our other ethical responsibilities in accordance with these requirements. We believe that the audit evidence we have obtained is sufficient and appropriate to provide a basis for our opinion.
Conclusions relating to going concernWe have nothing to report in respect of the following matters in relation to which the ISAs (UK) require us to report to you where:
• the Authorised Corporate Director’s use of the going concern basis of accounting in the preparation of the financial statements is not appropriate; or
• the Authorised Corporate Director has not disclosed in the financial statements any identified material uncertainties that may cast significant doubt about the Company or the Fund’s ability to continue to adopt the going concern basis of accounting for a period of at least twelve months from the date when the financial statements are authorised for issue.
Other informationThe Authorised Corporate Director is responsible for the other information. The other information comprises the information included in the annual report, other than the financial statements and our auditor’s report thereon. Our opinion on the financial statements does not cover the other information and, except to the extent otherwise explicitly stated in our report, we do not express any form of assurance conclusion thereon.
INDEPENDENT AUDITOR’S REPORT TO THESHAREHOLDERS OFLF WOODFORD INVESTMENT FUND continued
Page 9
LF Woodford Investment Fund | Annual Report 2018
In connection with our audit of the financial statements, our responsibility is to read the other information and, in doing so, consider whether the other information is materially inconsistent with the financial statements or our knowledge obtained in the audit or otherwise appears to be materially misstated. If we identify such material inconsistencies or apparent material misstatements, we are required to determine whether there is a material misstatement in the financial statements or a material misstatement of the other information. If, based on the work we have performed, we conclude that there is a material misstatement of this other information, we are required to report that fact.
We have nothing to report in this regard.
Opinion on other matters prescribed by the Collective Investment Schemes sourcebookIn our opinion:
• we have been given all the information and explanations, which, to the best of our knowledge and belief, are necessary for the purposes of our audit, and
• the information given in the Authorised Corporate Director’s Report (which comprises the information on the inside cover, the Authorised Status, the Investment Objective and Policy, the Investment Manager’s Report, the Synthetic Risk and Reward Indicator, the Portfolio Statement and the Summary of Material Portfolio Changes) is consistent with the financial statements.
Matters on which we are required to report by exceptionWe have nothing to report in respect of the following matters where the Collective Investment Schemes sourcebook requires us to report to you if in our opinion:
• proper accounting records for the Company or the Fund have not been kept, or
• the financial statements are not in agreement with those accounting records.
Responsibilities of the Authorised Corporate DirectorAs explained more fully in the Statement of the ACD’s Responsibilities on page 6, the Authorised Corporate Director is responsible for the preparation of the financial statements and for being satisfied that they give a true and fair view, and for such internal control as the Authorised Corporate Director determines is necessary to enable the preparation of financial statements that are free from material misstatement, whether due to fraud or error.
In preparing the financial statements, the Authorised Corporate Director is responsible for assessing the Company’s and the Fund’s ability to continue as a going concern, disclosing, as applicable, matters related to going concern and using the going concern basis of accounting unless the Authorised Corporate Director either intends to terminate the Fund, wind up the Company or to cease operations, or has no realistic alternative but to do so.
Auditor’s responsibilities for the audit of the financial statementsOur objectives are to obtain reasonable assurance about whether the financial statements as a whole are free from material misstatement, whether due to fraud or error, and to issue an auditor’s report that includes our opinion. Reasonable assurance is a high level of assurance, but is not a guarantee that an audit conducted in accordance with ISAs (UK) will always detect a material misstatement when it exists. Misstatements can arise from fraud or error and are considered material if, individually or in the aggregate, they could reasonably be expected to influence the economic decisions of users taken on the basis of these financial statements.
A further description of our responsibilities for the audit of the financial statements is located on the Financial Reporting Council’s website at: www.frc.org.uk/auditorsresponsibilities. This description forms part of our auditor’s report.
INDEPENDENT AUDITOR’S REPORT TO THESHAREHOLDERS OFLF WOODFORD INVESTMENT FUND continued
Page 10
LF Woodford Investment Fund | Annual Report 2018
Use of our reportThis report is made solely to the Company’s shareholders, as a body, in accordance with regulation 67(2) of the Open-Ended Investment Companies Regulations 2001, and with Rule 4.5.12 of the Collective Investment Schemes sourcebook. Our audit work has been undertaken so that we might state to the Company’s shareholders those matters we are required to state to them in an auditor's report and for no other purpose. To the fullest extent permitted by law, we do not accept or assume responsibility to anyone other than the Company and the Company’s shareholders as a body, for our audit work, for this report, or for the opinions we have formed.
GRANT THORNTON UK LLP Statutory Auditor, Chartered AccountantsLondon, United Kingdom 30 April 2019
LF Woodford Investment Fund | Annual Report 2018
Page 11
LF WOODFORD EQUITY INCOME FUNDACD’S REPORTfor the year ended 31 December 2018
Investment Objective and PolicyThe aim of the LF Woodford Equity Income Fund (‘the Fund’) is to provide a reasonable level of income together with capital growth. This will be achieved by investing primarily in UK listed companies. The Fund may also invest in unlisted companies and overseas entities. The Fund may also invest in other transferable securities, money market instruments, warrants, collective investment schemes and deposits.
The Investment Manager may also make use of derivatives for investment purposes (gaining both long and short exposure to the underlying assets) and for efficient portfolio management. It is not anticipated that such use of derivatives will have a significant adverse effect on the risk profile of this Fund.
LINK FUND SOLUTIONS LIMITEDACD of LF Woodford Investment Fund30 April 2019
LF Woodford Investment Fund | Annual Report 2018
Page 12
LF WOODFORD EQUITY INCOME FUNDINVESTMENT MANAGER’S REPORTfor the year ended 31 December 2018
The portfolio endured another challenging year in 2018 in performance terms, delivering a total return of -16.7% compared to a return of -9.5%¹ from the FTSE All Share Index.
The year commenced with financial markets in a similar frame of mind to that which had prevailed in 2017, with momentum playing a dominant role in share price movements. This is a behaviour that we have seen before in the late-stages of a bull market and it inevitably poses a problem for our fundamentally-anchored investment approach.
In the UK, this momentum manifested itself in a narrow fixation on resource-related companies and other large Asian-exposed businesses, seen as beneficiaries of a reflationary global growth scenario that we simply did not believe in. Furthermore, it came despite increasing evidence of problems in many emerging market economies, most prominently, China. The Fund has very little exposure to these parts of the market because of macroeconomic concerns and on valuation grounds. This lack of exposure to sectors such as Basic Materials, Oil & Gas and large financial groups such as HSBC, explains a significant proportion of the Fund’s under-performance in the first half of the year.
As the year progressed, macroeconomic evidence in contradiction to the market’s reflationary biases continued to mount, to the extent that momentum started to falter. The portfolio increasingly benefited from avoiding areas of valuation excess and the stocks most vulnerable to the deteriorating global economic environment. However, one other performance factor has remained a headwind to performance.
Over the course of the last two years, we have seen a very attractive investment opportunity emerging in domestically-exposed stocks, such as housebuilders, construction, property and logistics businesses. These have been increasingly out-of-favour since the UK voted to leave the European Union in June 2016. As the negotiations with Europe have progressed, uncertainty about the path of the UK’s future relationship with Europe has increased. Within the UK stock market, a significant gap has, in turn, opened up between the performance and valuation of international-facing stocks and domestically-exposed stocks. The Fund has progressively increased its exposure to the latter, selectively focusing on stocks which are pricing in an overly bleak scenario for the UK’s economic future.
The market’s persistent antipathy towards UK-exposed stocks means this part of the strategy has not yet paid off. Indeed, these stocks were the primary cause of the portfolio’s continued underperformance in the second half of 2018. The companies themselves have done very little wrong during this period – some of them have delivered excellent operational results – but this has counted for nothing given the continued negativity towards UK-exposed stocks.
By way of example, we point to the current valuation of the housebuilder, Taylor Wimpey, which released a strong set of full year financial results in February. It has reiterated its commitment to a £600m dividend return this year, which compares to a market cap of £5.8bn (source: Bloomberg as at 31 March 2019). That’s a yield of more than 10%, which means the share price could double from here and still look cheap. The same or similar applies to the share prices of many housebuilders and other companies that derive the majority of their revenues in the UK economy and that are held in the portfolio.
1 Source: FE Analytics. The Investment Manager uses the FTSE All Share Index shown above for comparison only. No benchmark is required to be disclosed per the Prospectus.
LF Woodford Investment Fund | Annual Report 2018
Page 13
LF WOODFORD EQUITY INCOME FUNDINVESTMENT MANAGER’S REPORT continuedfor the year ended 31 December 2018
Elsewhere, US biotechnology business, Prothena, was a significant detractor, following the announcement in April of the failure of its Pronto clinical trial, which was investigating NEOD001 in AL amyloidosis. The study identified a much bigger and more significant placebo effect than suggested by any previous trials. This was an extremely disappointing and surprising outcome and its shares fell heavily on the announcement. However, there is much more to Prothena than NEOD001. The company still has an attractive, albeit earlier-stage, pipeline of clinical assets, along with a technology platform and a world-leading specialism in misfolding proteins. Its research platform has been validated by ongoing partnerships with Roche and Celgene, and it also has its own, unpartnered assets and a very strong balance sheet. The shares remain well below the level at which they started the year and substantially below what we consider to be the long-term intrinsic value of this business. Indeed, they ended the year trading at a level below that of the value of cash on Prothena’s balance sheet.
More positively, litigation finance business Burford Capital, continued to deliver strong growth, which was rewarded with a progressively higher share price. Its financial results were consistently well ahead of all estimates, and the company continues to demonstrate an explosion in demand for its services globally, which we expect to continue. The business raised more capital during the year and, alongside a new strategic relationship with a long-term sovereign investor, it is very well funded to capitalise on the growth opportunity that lies ahead in an industry that it dominates.
Meanwhile, the portfolio also enjoyed a positive contribution from some of its earlier-stage unquoted investments. Autolus is a clinical-stage biotechnology business at the forefront of a revolution in cancer treatment. It focuses on developing and commercialising a novel class of immuno-oncology treatments known as CAR-T (Chimeric Antigen Receptor T-cells) therapies, which harness the power of a patient’s immune system to combat cancers. We first invested in the business in 2016, believing that it has a compelling technological advantage over other CAR-T businesses through its dual-targeting therapies, which engineer immune cells to recognise two cancer-specific features, meaning that there is less chance for the cancer to escape and recur. The business listed on the Nasdaq stock exchange in June 2018 at a significantly higher valuation and the shares have subsequently performed well, albeit over a short period thus far. Towards the end of 2018, Autolus released promising updates regarding its lead programme, AUTO3. This latest data lends even more credibility and excitement to the investment case and, with further updates due over the course of 2019, we believe there is much more to come from this exciting young company.
Meanwhile, disruptive new energy technology business, Industrial Heat, also delivered a positive contribution to performance. Over the course of the last eighteen months, there have been developments within its portfolio of technologies that have shown increasing promise. Hence, with the company raising capital from other investors to continue the path to commercialisation, the valuation of the company was adjusted to reflect this progress.
In terms of portfolio activity, much of our purchases were aimed towards further exploiting the opportunity that has emerged in domestically-focused businesses. For example, we added materially to the holdings in housebuilders Crest Nicholson, Barratt Developments and Countryside Properties as the year progressed, alongside construction company Eurocell and property business NewRiver REIT. We also participated in the rights issue of Provident Financial, as it continues to recover from the operational problems that have beset it in recent years.
In order to take advantage of the opportunities above, we reassessed the relative attractiveness of several long-held portfolio positions. Consequently, AstraZeneca, Next, Drax and Lloyds Banking were all sold as the year progressed. These are all still attractive businesses from a fundamental perspective, but we are keen to position the portfolio towards stocks where the gap between current share price and long-term intrinsic value appears the widest.
LF Woodford Investment Fund | Annual Report 2018
Page 14
LF WOODFORD EQUITY INCOME FUNDINVESTMENT MANAGER’S REPORT continuedfor the year ended 31 December 2018
Turning to the investment strategy and outlook, although the UK stock market has remained preoccupied by the ebbs and flows of the Brexit debate, the UK economy has continued to produce strong data. Towards the end of 2018, we saw further positive numbers on wage growth and employment, backed up by more good news on inflation. With the lowest unemployment since the 1970s, strong growth in employment and hours worked, combined with the fastest real wage growth since the financial crisis, we enter 2019 with strong economic momentum in the UK.
Meanwhile, the rest of the world economy is gradually looking less robust. China is very visibly slowing, emerging economies continue to struggle with dollar strength and higher dollar borrowing costs, and Europe has slowed significantly. The weak oil price that was evident in the final months of 2018 is, from our perspective a reflection of this backdrop, with much weaker demand growth than the consensus had expected, as well as more robust supply growth. The US economy is still visibly strong but the waning influence of fiscal stimulus, allied to the lagged effects of much tighter monetary policy, are beginning to challenge policymakers and financial markets. Bond investors appear to be pricing in a much more challenging economic environment and the correction that appears to have started in the equity market is another warning of more troubling times ahead.
Our strategy remains focused on avoiding the considerable risks that have built up in equity markets over the last decade of QE-fuelled exuberance and capturing the opportunity that exists in the few parts of the market that have been left behind. This results in a portfolio which has a strong but selective bias towards profoundly undervalued companies that are exposed to the slings and arrows of the UK economy.
Elsewhere, the portfolio also continues to be positioned to capture an exciting long-term opportunity across a range of earlier-stage businesses exposed to the themes of healthcare innovation and disruptive technology more broadly.
WOODFORD INVESTMENT MANAGEMENT LTDInvestment Manager18 January 2019
LF Woodford Investment Fund | Annual Report 2018
Page 15
LF WOODFORD EQUITY INCOME FUNDFUND INFORMATIONfor the year ended 31 December 2018
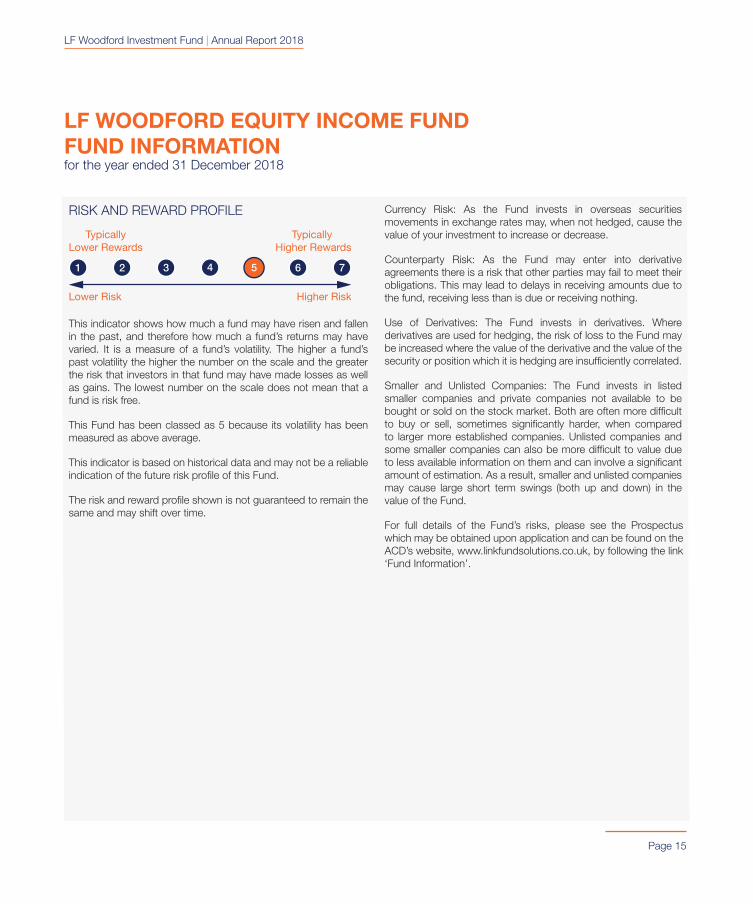
RISK AND REWARD PROFILE
Lower Risk
Typically Higher Rewards
TypicallyLower Rewards
Higher Risk
4
This indicator shows how much a fund may have risen and fallen in the past, and therefore how much a fund’s returns may have varied. It is a measure of a fund’s volatility. The higher a fund’s past volatility the higher the number on the scale and the greater the risk that investors in that fund may have made losses as well as gains. The lowest number on the scale does not mean that a fund is risk free.
This Fund has been classed as 5 because its volatility has been measured as above average.
This indicator is based on historical data and may not be a reliable indication of the future risk profile of this Fund.
The risk and reward profile shown is not guaranteed to remain the same and may shift over time.
Currency Risk: As the Fund invests in overseas securities movements in exchange rates may, when not hedged, cause the value of your investment to increase or decrease.
Counterparty Risk: As the Fund may enter into derivative agreements there is a risk that other parties may fail to meet their obligations. This may lead to delays in receiving amounts due to the fund, receiving less than is due or receiving nothing.
Use of Derivatives: The Fund invests in derivatives. Where derivatives are used for hedging, the risk of loss to the Fund may be increased where the value of the derivative and the value of the security or position which it is hedging are insufficiently correlated.
Smaller and Unlisted Companies: The Fund invests in listed smaller companies and private companies not available to be bought or sold on the stock market. Both are often more difficult to buy or sell, sometimes significantly harder, when compared to larger more established companies. Unlisted companies and some smaller companies can also be more difficult to value due to less available information on them and can involve a significant amount of estimation. As a result, smaller and unlisted companies may cause large short term swings (both up and down) in the value of the Fund.
For full details of the Fund’s risks, please see the Prospectus which may be obtained upon application and can be found on the ACD’s website, www.linkfundsolutions.co.uk, by following the link ‘Fund Information’.
LF Woodford Investment Fund | Annual Report 2018
LF WOODFORD EQUITY INCOME FUNDFUND INFORMATION continuedfor the year ended 31 December 2018
Page 16
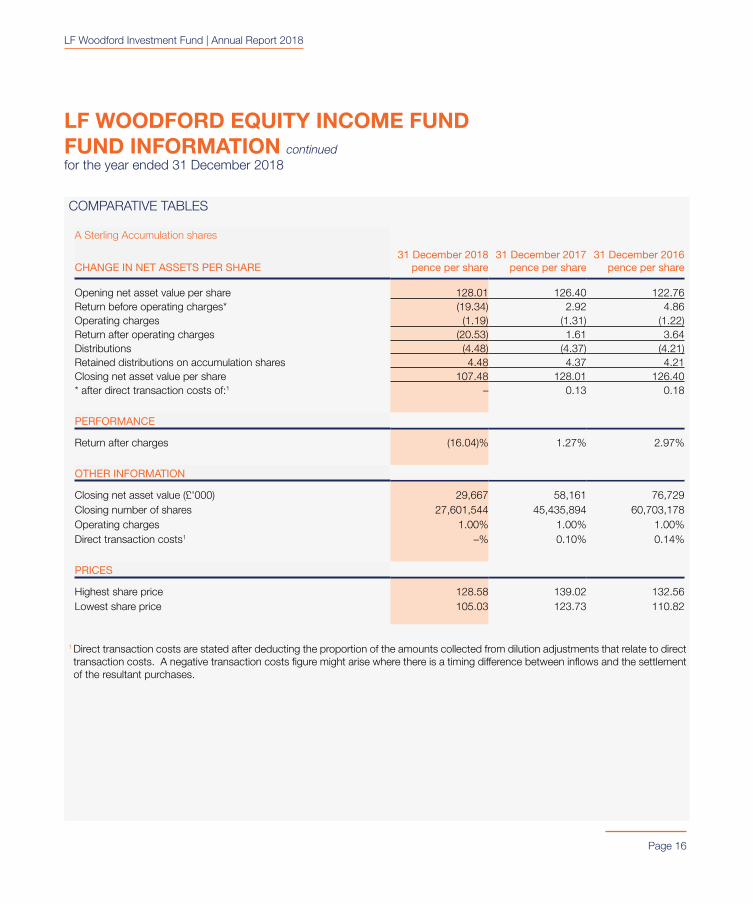
COMPARATIVE TABLES
A Sterling Accumulation shares
CHANGE IN NET ASSETS PER SHARE 31 December 2018
pence per share
31 December 2017 pence per share
31 December 2016 pence per share
Opening net asset value per share 128.01 126.40 122.76Return before operating charges* (19.34) 2.92 4.86Operating charges (1.19) (1.31) (1.22)Return after operating charges (20.53) 1.61 3.64Distributions (4.48) (4.37) (4.21)Retained distributions on accumulation shares 4.48 4.37 4.21Closing net asset value per share 107.48 128.01 126.40* after direct transaction costs of:1 – 0.13 0.18
PERFORMANCE
Return after charges (16.04)% 1.27% 2.97%
OTHER INFORMATION
Closing net asset value (£'000) 29,667 58,161 76,729Closing number of shares 27,601,544 45,435,894 60,703,178Operating charges 1.00% 1.00% 1.00%Direct transaction costs1 –% 0.10% 0.14%
PRICES
Highest share price 128.58 139.02 132.56Lowest share price 105.03 123.73 110.82
1 Direct transaction costs are stated after deducting the proportion of the amounts collected from dilution adjustments that relate to direct transaction costs. A negative transaction costs figure might arise where there is a timing difference between inflows and the settlement of the resultant purchases.
LF Woodford Investment Fund | Annual Report 2018
LF WOODFORD EQUITY INCOME FUNDFUND INFORMATION continuedfor the year ended 31 December 2018
Page 17
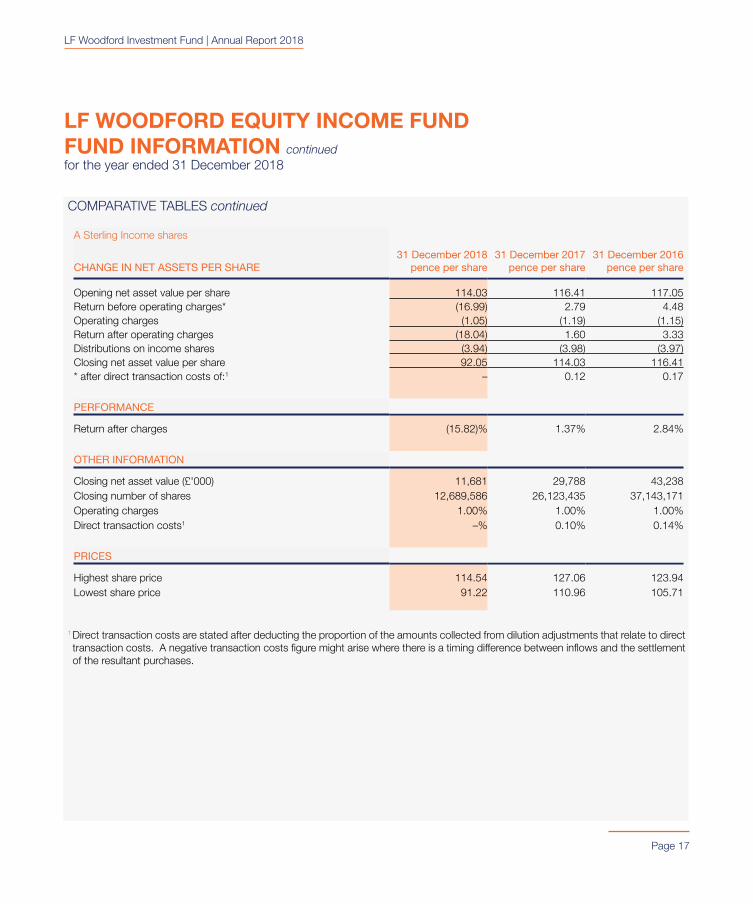
COMPARATIVE TABLES continued
A Sterling Income shares
CHANGE IN NET ASSETS PER SHARE 31 December 2018
pence per share
31 December 2017 pence per share
31 December 2016 pence per share
Opening net asset value per share 114.03 116.41 117.05Return before operating charges* (16.99) 2.79 4.48Operating charges (1.05) (1.19) (1.15)Return after operating charges (18.04) 1.60 3.33Distributions on income shares (3.94) (3.98) (3.97)Closing net asset value per share 92.05 114.03 116.41* after direct transaction costs of:1 – 0.12 0.17
PERFORMANCE
Return after charges (15.82)% 1.37% 2.84%
OTHER INFORMATION
Closing net asset value (£'000) 11,681 29,788 43,238Closing number of shares 12,689,586 26,123,435 37,143,171Operating charges 1.00% 1.00% 1.00%Direct transaction costs1 –% 0.10% 0.14%
PRICES
Highest share price 114.54 127.06 123.94Lowest share price 91.22 110.96 105.71
1 Direct transaction costs are stated after deducting the proportion of the amounts collected from dilution adjustments that relate to direct transaction costs. A negative transaction costs figure might arise where there is a timing difference between inflows and the settlement of the resultant purchases.
LF Woodford Investment Fund | Annual Report 2018
LF WOODFORD EQUITY INCOME FUNDFUND INFORMATION continuedfor the year ended 31 December 2018
Page 18
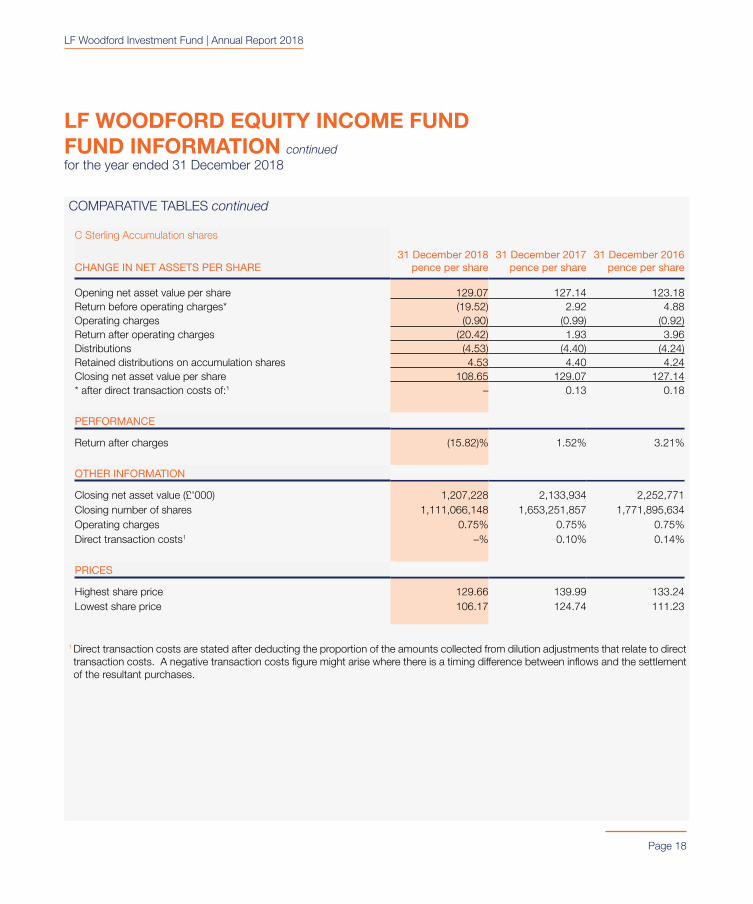
COMPARATIVE TABLES continued
C Sterling Accumulation shares
CHANGE IN NET ASSETS PER SHARE 31 December 2018
pence per share
31 December 2017 pence per share
31 December 2016 pence per share
Opening net asset value per share 129.07 127.14 123.18Return before operating charges* (19.52) 2.92 4.88Operating charges (0.90) (0.99) (0.92)Return after operating charges (20.42) 1.93 3.96Distributions (4.53) (4.40) (4.24)Retained distributions on accumulation shares 4.53 4.40 4.24Closing net asset value per share 108.65 129.07 127.14* after direct transaction costs of:1 – 0.13 0.18
PERFORMANCE
Return after charges (15.82)% 1.52% 3.21%
OTHER INFORMATION
Closing net asset value (£'000) 1,207,228 2,133,934 2,252,771Closing number of shares 1,111,066,148 1,653,251,857 1,771,895,634Operating charges 0.75% 0.75% 0.75%Direct transaction costs1 –% 0.10% 0.14%
PRICES
Highest share price 129.66 139.99 133.24Lowest share price 106.17 124.74 111.23
1 Direct transaction costs are stated after deducting the proportion of the amounts collected from dilution adjustments that relate to direct transaction costs. A negative transaction costs figure might arise where there is a timing difference between inflows and the settlement of the resultant purchases.
LF Woodford Investment Fund | Annual Report 2018
LF WOODFORD EQUITY INCOME FUNDFUND INFORMATION continuedfor the year ended 31 December 2018
Page 19
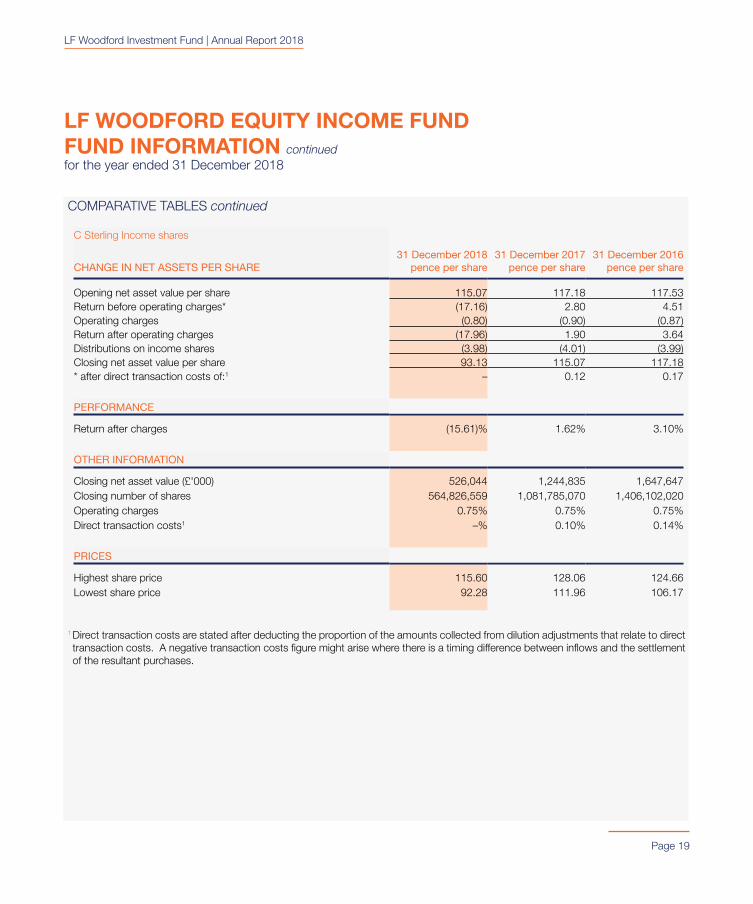
COMPARATIVE TABLES continued
C Sterling Income shares
CHANGE IN NET ASSETS PER SHARE 31 December 2018
pence per share
31 December 2017 pence per share
31 December 2016 pence per share
Opening net asset value per share 115.07 117.18 117.53Return before operating charges* (17.16) 2.80 4.51Operating charges (0.80) (0.90) (0.87)Return after operating charges (17.96) 1.90 3.64Distributions on income shares (3.98) (4.01) (3.99)Closing net asset value per share 93.13 115.07 117.18* after direct transaction costs of:1 – 0.12 0.17
PERFORMANCE
Return after charges (15.61)% 1.62% 3.10%
OTHER INFORMATION
Closing net asset value (£'000) 526,044 1,244,835 1,647,647Closing number of shares 564,826,559 1,081,785,070 1,406,102,020Operating charges 0.75% 0.75% 0.75%Direct transaction costs1 –% 0.10% 0.14%
PRICES
Highest share price 115.60 128.06 124.66Lowest share price 92.28 111.96 106.17
1 Direct transaction costs are stated after deducting the proportion of the amounts collected from dilution adjustments that relate to direct transaction costs. A negative transaction costs figure might arise where there is a timing difference between inflows and the settlement of the resultant purchases.
LF Woodford Investment Fund | Annual Report 2018
LF WOODFORD EQUITY INCOME FUNDFUND INFORMATION continuedfor the year ended 31 December 2018
Page 20
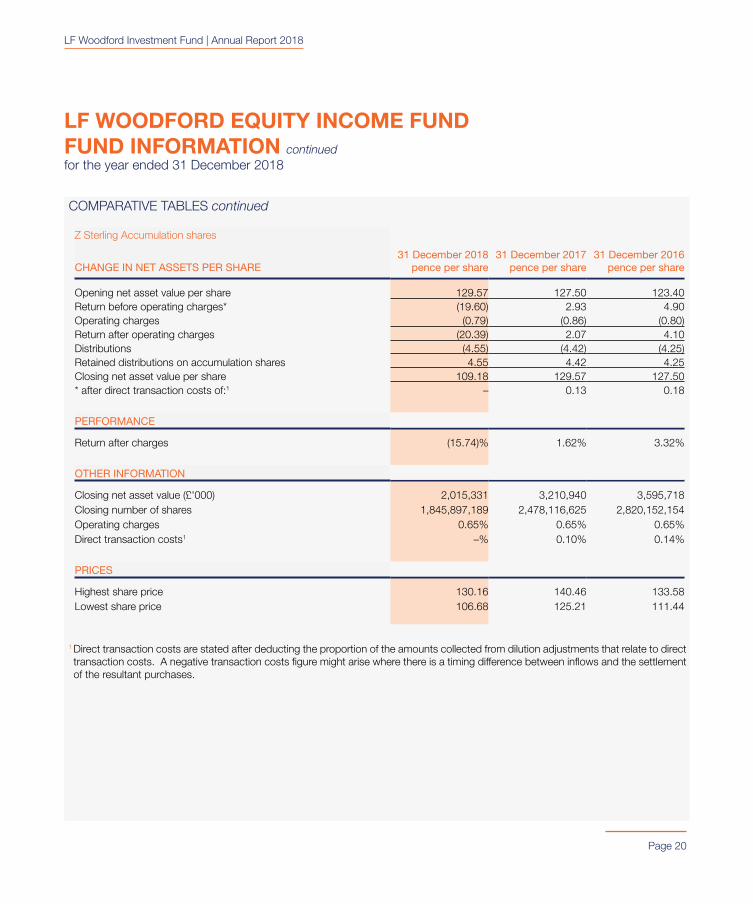
COMPARATIVE TABLES continued
Z Sterling Accumulation shares
CHANGE IN NET ASSETS PER SHARE 31 December 2018
pence per share
31 December 2017 pence per share
31 December 2016 pence per share
Opening net asset value per share 129.57 127.50 123.40Return before operating charges* (19.60) 2.93 4.90Operating charges (0.79) (0.86) (0.80)Return after operating charges (20.39) 2.07 4.10Distributions (4.55) (4.42) (4.25)Retained distributions on accumulation shares 4.55 4.42 4.25Closing net asset value per share 109.18 129.57 127.50* after direct transaction costs of:1 – 0.13 0.18
PERFORMANCE
Return after charges (15.74)% 1.62% 3.32%
OTHER INFORMATION
Closing net asset value (£'000) 2,015,331 3,210,940 3,595,718Closing number of shares 1,845,897,189 2,478,116,625 2,820,152,154Operating charges 0.65% 0.65% 0.65%Direct transaction costs1 –% 0.10% 0.14%
PRICES
Highest share price 130.16 140.46 133.58Lowest share price 106.68 125.21 111.44
1 Direct transaction costs are stated after deducting the proportion of the amounts collected from dilution adjustments that relate to direct transaction costs. A negative transaction costs figure might arise where there is a timing difference between inflows and the settlement of the resultant purchases.

LF Woodford Investment Fund | Annual Report 2018
LF WOODFORD EQUITY INCOME FUNDFUND INFORMATION continuedfor the year ended 31 December 2018
Page 21
COMPARATIVE TABLES continued
Z Sterling Income shares
CHANGE IN NET ASSETS PER SHARE 31 December 2018
pence per share
31 December 2017 pence per share
31 December 2016 pence per share
Opening net asset value per share 115.46 117.45 117.69Return before operating charges* (17.23) 2.81 4.51Operating charges (0.69) (0.78) (0.75)Return after operating charges (17.92) 2.03 3.76Distributions on income shares (4.00) (4.02) (4.00)Closing net asset value per share 93.54 115.46 117.45* after direct transaction costs of:1 – 0.12 0.17
PERFORMANCE
Return after charges (15.52)% 1.73% 3.20%
OTHER INFORMATION
Closing net asset value (£'000) 857,962 1,417,843 1,743,027Closing number of shares 917,196,155 1,227,995,028 1,484,003,136Operating charges 0.65% 0.65% 0.65%Direct transaction costs1 –% 0.10% 0.14%
PRICES
Highest share price 115.99 128.42 124.92Lowest share price 92.69 112.33 106.32
1 Direct transaction costs are stated after deducting the proportion of the amounts collected from dilution adjustments that relate to direct transaction costs. A negative transaction costs figure might arise where there is a timing difference between inflows and the settlement of the resultant purchases.
LF Woodford Investment Fund | Annual Report 2018
LF WOODFORD EQUITY INCOME FUNDFUND INFORMATION continuedfor the year ended 31 December 2018
Page 22
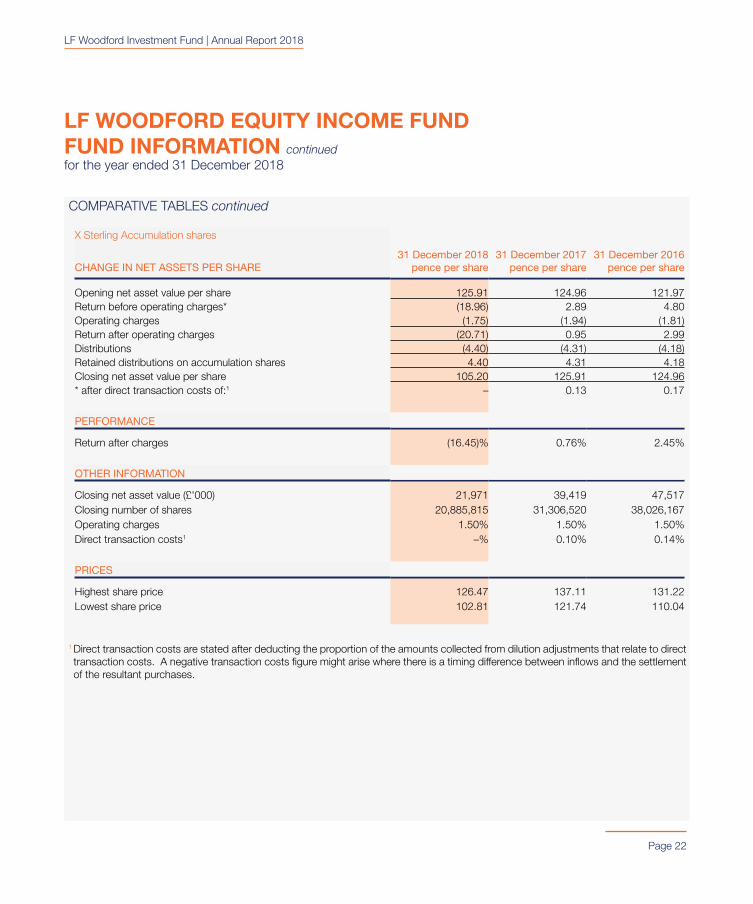
COMPARATIVE TABLES continued
X Sterling Accumulation shares
CHANGE IN NET ASSETS PER SHARE 31 December 2018
pence per share
31 December 2017 pence per share
31 December 2016 pence per share
Opening net asset value per share 125.91 124.96 121.97Return before operating charges* (18.96) 2.89 4.80Operating charges (1.75) (1.94) (1.81)Return after operating charges (20.71) 0.95 2.99Distributions (4.40) (4.31) (4.18)Retained distributions on accumulation shares 4.40 4.31 4.18Closing net asset value per share 105.20 125.91 124.96* after direct transaction costs of:1 – 0.13 0.17
PERFORMANCE
Return after charges (16.45)% 0.76% 2.45%
OTHER INFORMATION
Closing net asset value (£'000) 21,971 39,419 47,517Closing number of shares 20,885,815 31,306,520 38,026,167Operating charges 1.50% 1.50% 1.50%Direct transaction costs1 –% 0.10% 0.14%
PRICES
Highest share price 126.47 137.11 131.22Lowest share price 102.81 121.74 110.04
1 Direct transaction costs are stated after deducting the proportion of the amounts collected from dilution adjustments that relate to direct transaction costs. A negative transaction costs figure might arise where there is a timing difference between inflows and the settlement of the resultant purchases.

LF Woodford Investment Fund | Annual Report 2018
LF WOODFORD EQUITY INCOME FUNDFUND INFORMATION continuedfor the year ended 31 December 2018
Page 23
COMPARATIVE TABLES continued
X Sterling Income shares
CHANGE IN NET ASSETS PER SHARE 31 December 2018
pence per share
31 December 2017 pence per share
31 December 2016 pence per share
Opening net asset value per share 112.22 115.14 116.35Return before operating charges* (16.67) 2.77 4.45Operating charges (1.54) (1.76) (1.72)Return after operating charges (18.21) 1.01 2.73Distributions on income shares (3.87) (3.93) (3.94)Closing net asset value per share 90.14 112.22 115.14* after direct transaction costs of:1 – 0.12 0.17
PERFORMANCE
Return after charges (16.23)% 0.88% 2.35%
OTHER INFORMATION
Closing net asset value (£'000) 3,167 5,709 6,488Closing number of shares 3,513,738 5,087,641 5,635,225Operating charges 1.50% 1.50% 1.50%Direct transaction costs1 –% 0.10% 0.14%
PRICES
Highest share price 112.72 125.38 122.74Lowest share price 89.33 109.24 105.01
1 Direct transaction costs are stated after deducting the proportion of the amounts collected from dilution adjustments that relate to direct transaction costs. A negative transaction costs figure might arise where there is a timing difference between inflows and the settlement of the resultant purchases.
LF Woodford Investment Fund | Annual Report 2018
LF WOODFORD EQUITY INCOME FUNDFUND INFORMATION continuedfor the year ended 31 December 2018
Page 24
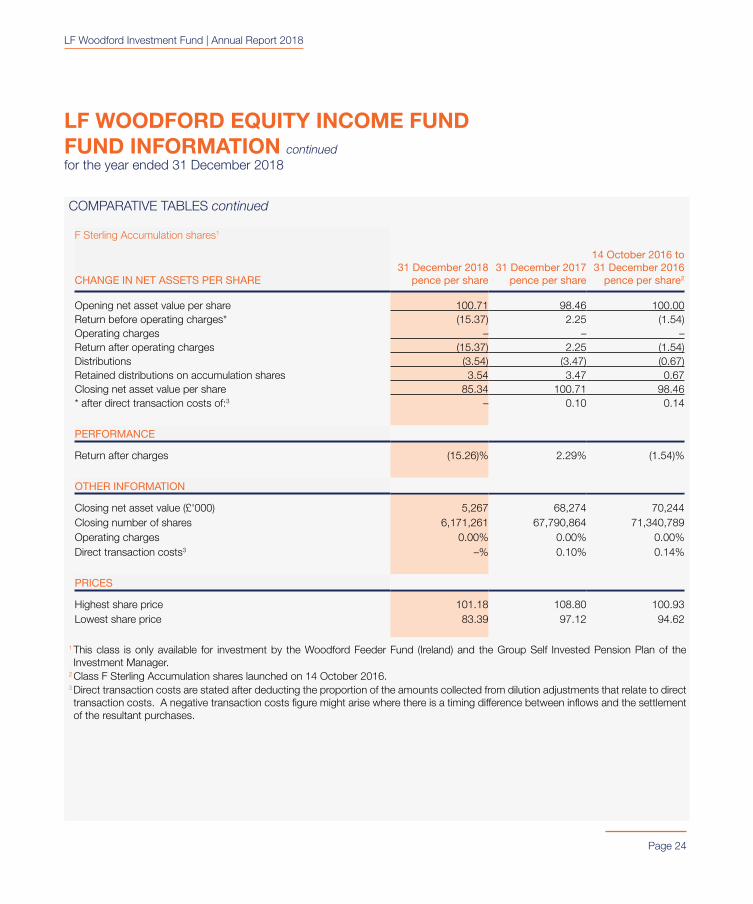
COMPARATIVE TABLES continued
F Sterling Accumulation shares1
CHANGE IN NET ASSETS PER SHARE 31 December 2018
pence per share
31 December 2017 pence per share
14 October 2016 to 31 December 2016
pence per share
2
Opening net asset value per share 100.71 98.46 100.00Return before operating charges* (15.37) 2.25 (1.54)Operating charges – – –Return after operating charges (15.37) 2.25 (1.54)Distributions (3.54) (3.47) (0.67)Retained distributions on accumulation shares 3.54 3.47 0.67Closing net asset value per share 85.34 100.71 98.46* after direct transaction costs of:3 – 0.10 0.14
PERFORMANCE
Return after charges (15.26)% 2.29% (1.54)%
OTHER INFORMATION
Closing net asset value (£'000) 5,267 68,274 70,244Closing number of shares 6,171,261 67,790,864 71,340,789Operating charges 0.00% 0.00% 0.00%Direct transaction costs3 –% 0.10% 0.14%
PRICES
Highest share price 101.18 108.80 100.93Lowest share price 83.39 97.12 94.62
1 This class is only available for investment by the Woodford Feeder Fund (Ireland) and the Group Self Invested Pension Plan of the Investment Manager.
2 Class F Sterling Accumulation shares launched on 14 October 2016.3 Direct transaction costs are stated after deducting the proportion of the amounts collected from dilution adjustments that relate to direct transaction costs. A negative transaction costs figure might arise where there is a timing difference between inflows and the settlement of the resultant purchases.
LF Woodford Investment Fund | Annual Report 2018
Page 25
LF WOODFORD EQUITY INCOME FUNDFUND INFORMATION continuedfor the year ended 31 December 2018
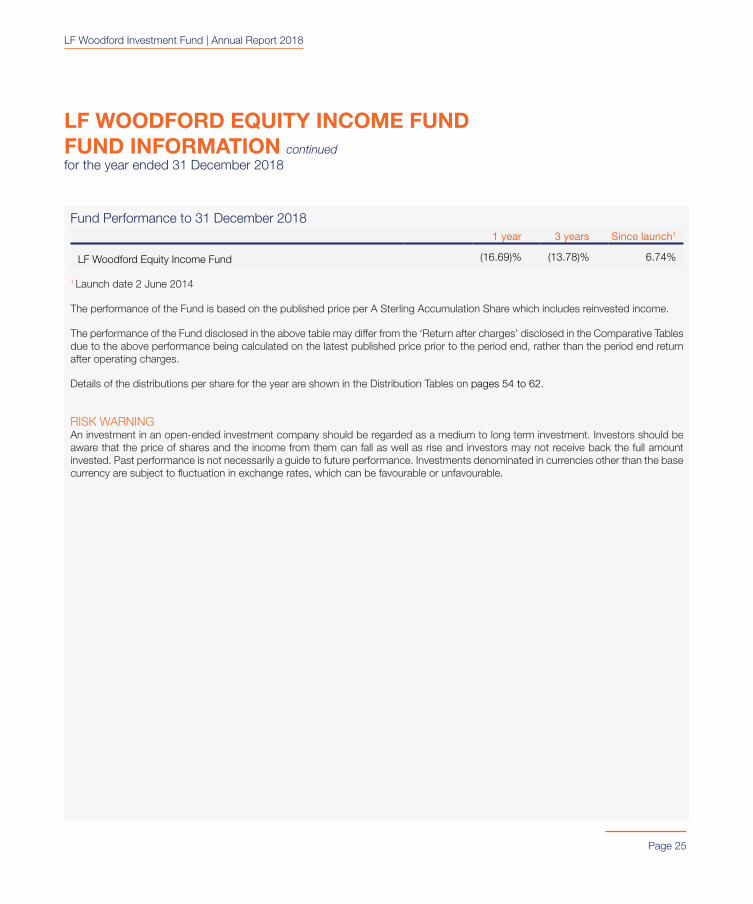
Fund Performance to 31 December 20181 year 3 years Since launch1
LF Woodford Equity Income Fund (16.69)% (13.78)% 6.74%
1 Launch date 2 June 2014
The performance of the Fund is based on the published price per A Sterling Accumulation Share which includes reinvested income.
The performance of the Fund disclosed in the above table may differ from the ‘Return after charges’ disclosed in the Comparative Tables due to the above performance being calculated on the latest published price prior to the period end, rather than the period end return after operating charges.
Details of the distributions per share for the year are shown in the Distribution Tables on pages 54 to 62.
RISK WARNINGAn investment in an open-ended investment company should be regarded as a medium to long term investment. Investors should be aware that the price of shares and the income from them can fall as well as rise and investors may not receive back the full amount invested. Past performance is not necessarily a guide to future performance. Investments denominated in currencies other than the base currency are subject to fluctuation in exchange rates, which can be favourable or unfavourable.
LF Woodford Investment Fund | Annual Report 2018
Page 26
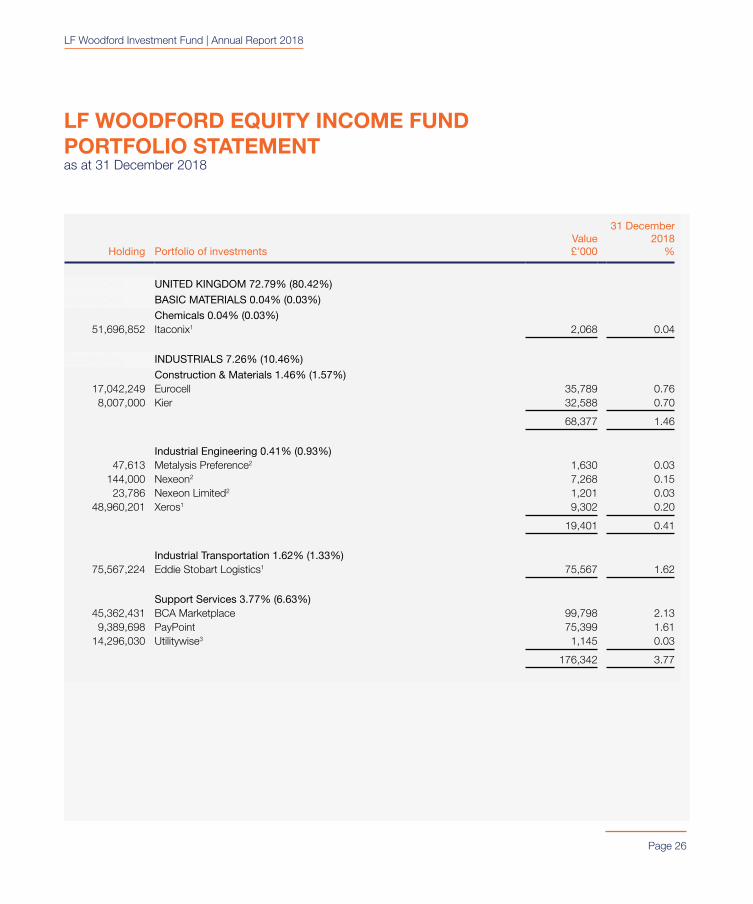
LF WOODFORD EQUITY INCOME FUNDPORTFOLIO STATEMENTas at 31 December 2018
Holding Portfolio of investmentsValue £'000
31 December 2018
%
SpacingOnly UNITED KINGDOM 72.79% (80.42%)
SpacingOnly BASIC MATERIALS 0.04% (0.03%)
SpacingOnly Chemicals 0.04% (0.03%)51,696,852 Itaconix1 2,068 0.04
SpacingOnly INDUSTRIALS 7.26% (10.46%)
SpacingOnly Construction & Materials 1.46% (1.57%)17,042,249 Eurocell 35,789 0.76
8,007,000 Kier 32,588 0.70
68,377 1.46
SpacingOnly Industrial Engineering 0.41% (0.93%)47,613 Metalysis Preference2 1,630 0.03
144,000 Nexeon2 7,268 0.1523,786 Nexeon Limited2 1,201 0.03
48,960,201 Xeros1 9,302 0.20
19,401 0.41
SpacingOnly Industrial Transportation 1.62% (1.33%)75,567,224 Eddie Stobart Logistics1 75,567 1.62
SpacingOnly Support Services 3.77% (6.63%)45,362,431 BCA Marketplace 99,798 2.13
9,389,698 PayPoint 75,399 1.6114,296,030 Utilitywise3 1,145 0.03
176,342 3.77
LF Woodford Investment Fund | Annual Report 2018
LF WOODFORD EQUITY INCOME FUNDPORTFOLIO STATEMENT continuedas at 31 December 2018
Page 27
Holding Portfolio of investmentsValue £'000
31 December 2018
%
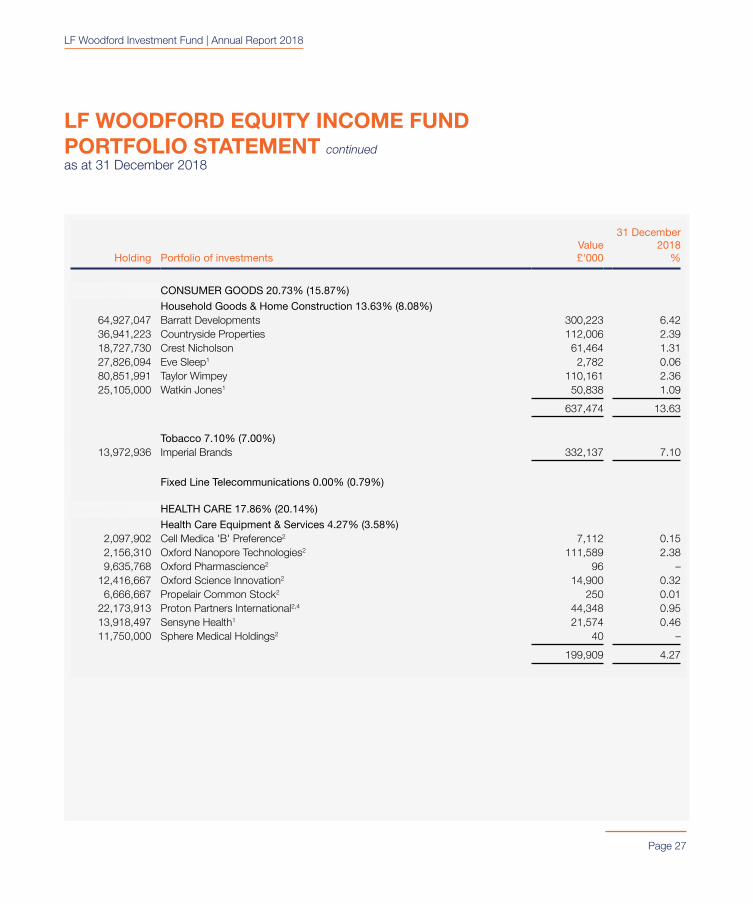
SpacingOnly CONSUMER GOODS 20.73% (15.87%)
SpacingOnly Household Goods & Home Construction 13.63% (8.08%)64,927,047 Barratt Developments 300,223 6.4236,941,223 Countryside Properties 112,006 2.3918,727,730 Crest Nicholson 61,464 1.3127,826,094 Eve Sleep1 2,782 0.0680,851,991 Taylor Wimpey 110,161 2.3625,105,000 Watkin Jones1 50,838 1.09
637,474 13.63
SpacingOnly Tobacco 7.10% (7.00%)13,972,936 Imperial Brands 332,137 7.10
SpacingOnly Fixed Line Telecommunications 0.00% (0.79%)
SpacingOnly HEALTH CARE 17.86% (20.14%)
SpacingOnly Health Care Equipment & Services 4.27% (3.58%)2,097,902 Cell Medica 'B' Preference2 7,112 0.152,156,310 Oxford Nanopore Technologies2 111,589 2.389,635,768 Oxford Pharmascience2 96 –
12,416,667 Oxford Science Innovation2 14,900 0.326,666,667 Propelair Common Stock2 250 0.01
22,173,913 Proton Partners International2,4 44,348 0.9513,918,497 Sensyne Health1 21,574 0.4611,750,000 Sphere Medical Holdings2 40 –
199,909 4.27
LF Woodford Investment Fund | Annual Report 2018
LF WOODFORD EQUITY INCOME FUNDPORTFOLIO STATEMENT continuedas at 31 December 2018
Page 28
Holding Portfolio of investmentsValue £'000
31 December 2018
%
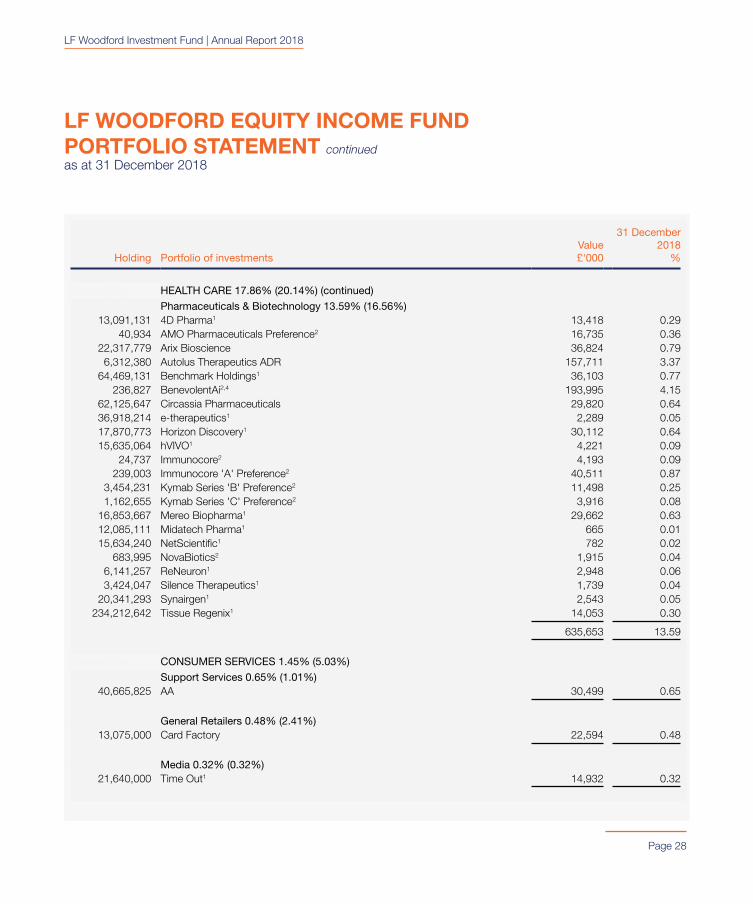
SpacingOnly HEALTH CARE 17.86% (20.14%) (continued)
SpacingOnly Pharmaceuticals & Biotechnology 13.59% (16.56%)13,091,131 4D Pharma1 13,418 0.29
40,934 AMO Pharmaceuticals Preference2 16,735 0.3622,317,779 Arix Bioscience 36,824 0.79
6,312,380 Autolus Therapeutics ADR 157,711 3.3764,469,131 Benchmark Holdings1 36,103 0.77
236,827 BenevolentAi2,4 193,995 4.1562,125,647 Circassia Pharmaceuticals 29,820 0.6436,918,214 e-therapeutics1 2,289 0.0517,870,773 Horizon Discovery1 30,112 0.6415,635,064 hVIVO1 4,221 0.09
24,737 Immunocore2 4,193 0.09239,003 Immunocore 'A' Preference2 40,511 0.87
3,454,231 Kymab Series 'B' Preference2 11,498 0.251,162,655 Kymab Series 'C' Preference2 3,916 0.08
16,853,667 Mereo Biopharma1 29,662 0.6312,085,111 Midatech Pharma1 665 0.0115,634,240 NetScientific1 782 0.02
683,995 NovaBiotics2 1,915 0.046,141,257 ReNeuron1 2,948 0.063,424,047 Silence Therapeutics1 1,739 0.04
20,341,293 Synairgen1 2,543 0.05234,212,642 Tissue Regenix1 14,053 0.30
635,653 13.59
SpacingOnly CONSUMER SERVICES 1.45% (5.03%)
SpacingOnly Support Services 0.65% (1.01%)40,665,825 AA 30,499 0.65
SpacingOnly General Retailers 0.48% (2.41%)13,075,000 Card Factory 22,594 0.48
SpacingOnly Media 0.32% (0.32%)21,640,000 Time Out1 14,932 0.32
LF Woodford Investment Fund | Annual Report 2018
LF WOODFORD EQUITY INCOME FUNDPORTFOLIO STATEMENT continuedas at 31 December 2018
Page 29
Holding Portfolio of investmentsValue £'000
31 December 2018
%
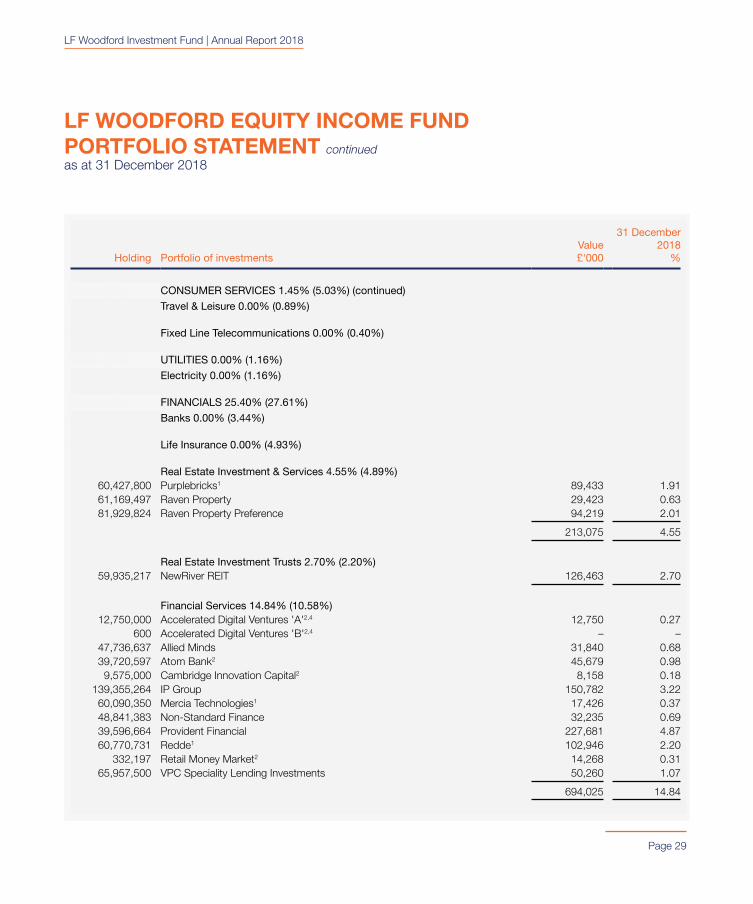
SpacingOnly CONSUMER SERVICES 1.45% (5.03%) (continued)
SpacingOnly Travel & Leisure 0.00% (0.89%)
SpacingOnly Fixed Line Telecommunications 0.00% (0.40%)
SpacingOnly UTILITIES 0.00% (1.16%)
SpacingOnly Electricity 0.00% (1.16%)
SpacingOnly FINANCIALS 25.40% (27.61%)
SpacingOnly Banks 0.00% (3.44%)
SpacingOnly Life Insurance 0.00% (4.93%)
SpacingOnly Real Estate Investment & Services 4.55% (4.89%)60,427,800 Purplebricks1 89,433 1.9161,169,497 Raven Property 29,423 0.6381,929,824 Raven Property Preference 94,219 2.01
213,075 4.55
SpacingOnly Real Estate Investment Trusts 2.70% (2.20%)59,935,217 NewRiver REIT 126,463 2.70
SpacingOnly Financial Services 14.84% (10.58%)12,750,000 Accelerated Digital Ventures 'A'2,4 12,750 0.27
600 Accelerated Digital Ventures 'B'2,4 – –47,736,637 Allied Minds 31,840 0.6839,720,597 Atom Bank2 45,679 0.98
9,575,000 Cambridge Innovation Capital2 8,158 0.18139,355,264 IP Group 150,782 3.2260,090,350 Mercia Technologies1 17,426 0.3748,841,383 Non-Standard Finance 32,235 0.6939,596,664 Provident Financial 227,681 4.8760,770,731 Redde1 102,946 2.20
332,197 Retail Money Market2 14,268 0.3165,957,500 VPC Speciality Lending Investments 50,260 1.07
694,025 14.84
LF Woodford Investment Fund | Annual Report 2018
LF WOODFORD EQUITY INCOME FUNDPORTFOLIO STATEMENT continuedas at 31 December 2018
Page 30
Holding Portfolio of investmentsValue £'000
31 December 2018
%
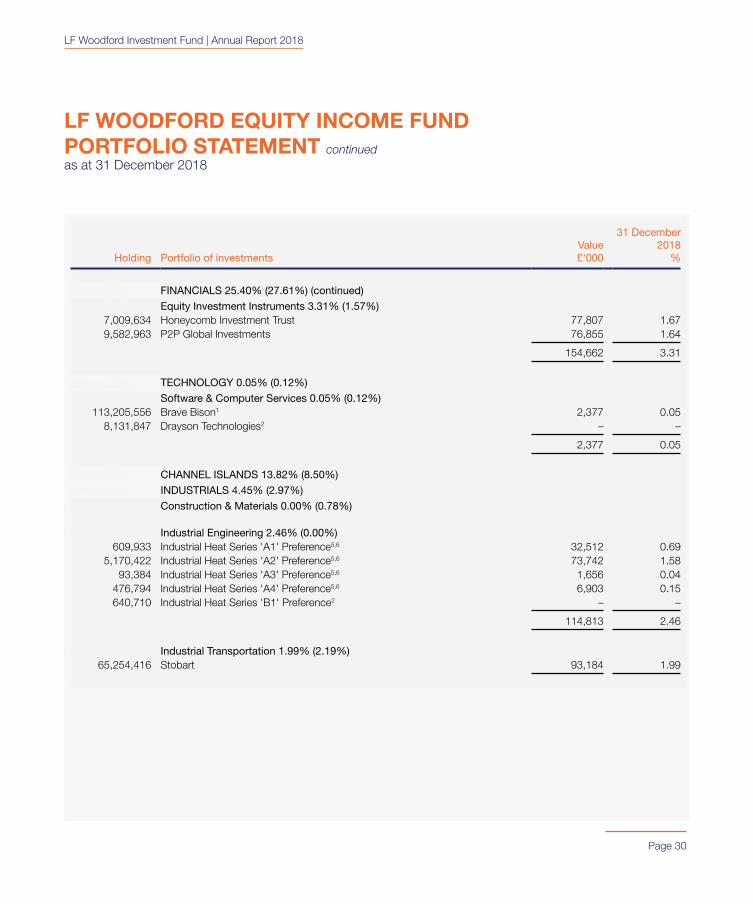
SpacingOnly FINANCIALS 25.40% (27.61%) (continued)
SpacingOnly Equity Investment Instruments 3.31% (1.57%)7,009,634 Honeycomb Investment Trust 77,807 1.679,582,963 P2P Global Investments 76,855 1.64
154,662 3.31
SpacingOnly TECHNOLOGY 0.05% (0.12%)
SpacingOnly Software & Computer Services 0.05% (0.12%)113,205,556 Brave Bison1 2,377 0.05
8,131,847 Drayson Technologies2 – –
2,377 0.05
SpacingOnly CHANNEL ISLANDS 13.82% (8.50%)
SpacingOnly INDUSTRIALS 4.45% (2.97%)
SpacingOnly Construction & Materials 0.00% (0.78%)
SpacingOnly Industrial Engineering 2.46% (0.00%)609,933 Industrial Heat Series 'A1' Preference5,6 32,512 0.69
5,170,422 Industrial Heat Series 'A2' Preference5,6 73,742 1.5893,384 Industrial Heat Series 'A3' Preference5,6 1,656 0.04
476,794 Industrial Heat Series 'A4' Preference5,6 6,903 0.15640,710 Industrial Heat Series 'B1' Preference2 – –
114,813 2.46
SpacingOnly Industrial Transportation 1.99% (2.19%)65,254,416 Stobart 93,184 1.99
LF Woodford Investment Fund | Annual Report 2018
LF WOODFORD EQUITY INCOME FUNDPORTFOLIO STATEMENT continuedas at 31 December 2018
Page 31
Holding Portfolio of investmentsValue £'000
31 December 2018
%
SpacingOnly HEALTH CARE 0.00% (0.49%)
SpacingOnly Health Care Equipment & Services 0.00% (0.49%)
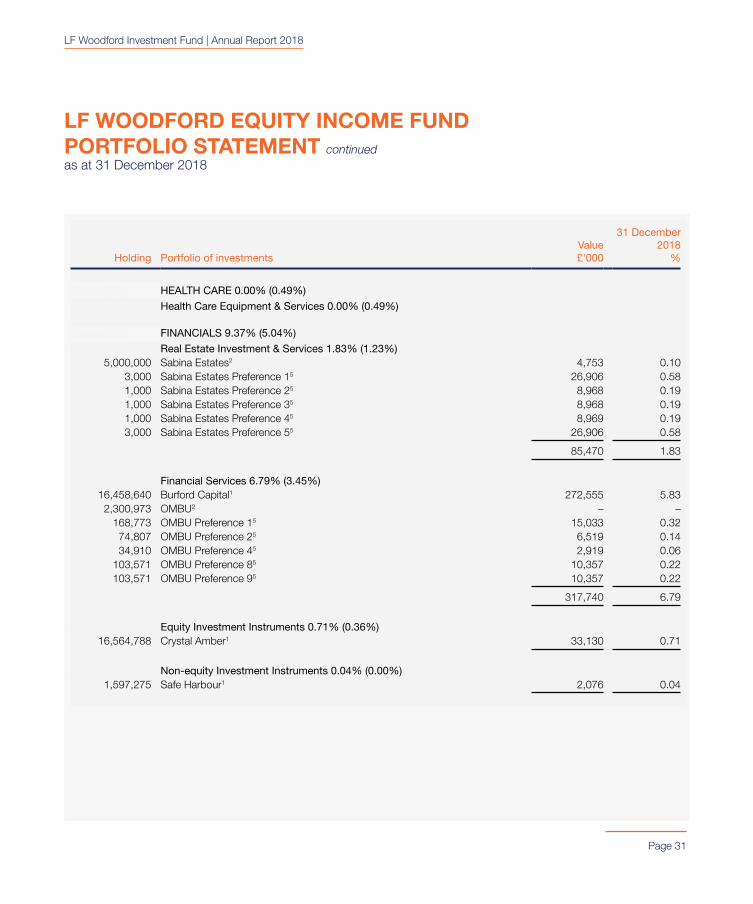
SpacingOnly FINANCIALS 9.37% (5.04%)
SpacingOnly Real Estate Investment & Services 1.83% (1.23%)5,000,000 Sabina Estates2 4,753 0.10
3,000 Sabina Estates Preference 15 26,906 0.581,000 Sabina Estates Preference 25 8,968 0.191,000 Sabina Estates Preference 35 8,968 0.191,000 Sabina Estates Preference 45 8,969 0.193,000 Sabina Estates Preference 55 26,906 0.58
85,470 1.83
SpacingOnly Financial Services 6.79% (3.45%)16,458,640 Burford Capital1 272,555 5.83
2,300,973 OMBU2 – –168,773 OMBU Preference 15 15,033 0.3274,807 OMBU Preference 25 6,519 0.1434,910 OMBU Preference 45 2,919 0.06
103,571 OMBU Preference 85 10,357 0.22103,571 OMBU Preference 95 10,357 0.22
317,740 6.79
SpacingOnly Equity Investment Instruments 0.71% (0.36%)16,564,788 Crystal Amber1 33,130 0.71
SpacingOnly Non-equity Investment Instruments 0.04% (0.00%)1,597,275 Safe Harbour1 2,076 0.04
LF Woodford Investment Fund | Annual Report 2018
LF WOODFORD EQUITY INCOME FUNDPORTFOLIO STATEMENT continuedas at 31 December 2018
Page 32
Holding Portfolio of investmentsValue £'000
31 December 2018
%
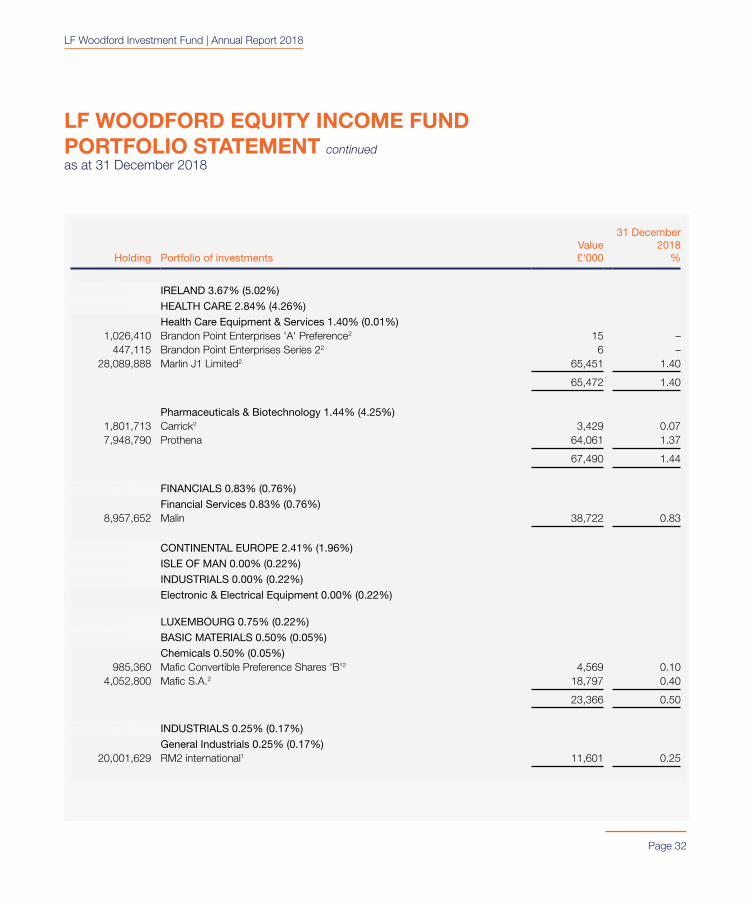
SpacingOnly IRELAND 3.67% (5.02%)
SpacingOnly HEALTH CARE 2.84% (4.26%)
SpacingOnly Health Care Equipment & Services 1.40% (0.01%)1,026,410 Brandon Point Enterprises 'A' Preference2 15 –
447,115 Brandon Point Enterprises Series 22 6 –28,089,888 Marlin J1 Limited2 65,451 1.40
65,472 1.40
SpacingOnly Pharmaceuticals & Biotechnology 1.44% (4.25%)1,801,713 Carrick2 3,429 0.077,948,790 Prothena 64,061 1.37
67,490 1.44
SpacingOnly FINANCIALS 0.83% (0.76%)
SpacingOnly Financial Services 0.83% (0.76%)8,957,652 Malin 38,722 0.83
SpacingOnly CONTINENTAL EUROPE 2.41% (1.96%)
SpacingOnly ISLE OF MAN 0.00% (0.22%)
SpacingOnly INDUSTRIALS 0.00% (0.22%)
SpacingOnly Electronic & Electrical Equipment 0.00% (0.22%)
SpacingOnly LUXEMBOURG 0.75% (0.22%)
SpacingOnly BASIC MATERIALS 0.50% (0.05%)
SpacingOnly Chemicals 0.50% (0.05%)985,360 Mafic Convertible Preference Shares 'B'2 4,569 0.10
4,052,800 Mafic S.A.2 18,797 0.40
23,366 0.50
SpacingOnly INDUSTRIALS 0.25% (0.17%)
SpacingOnly General Industrials 0.25% (0.17%)20,001,629 RM2 international1 11,601 0.25
LF Woodford Investment Fund | Annual Report 2018
LF WOODFORD EQUITY INCOME FUNDPORTFOLIO STATEMENT continuedas at 31 December 2018
Page 33
Holding Portfolio of investmentsValue £'000
31 December 2018
%
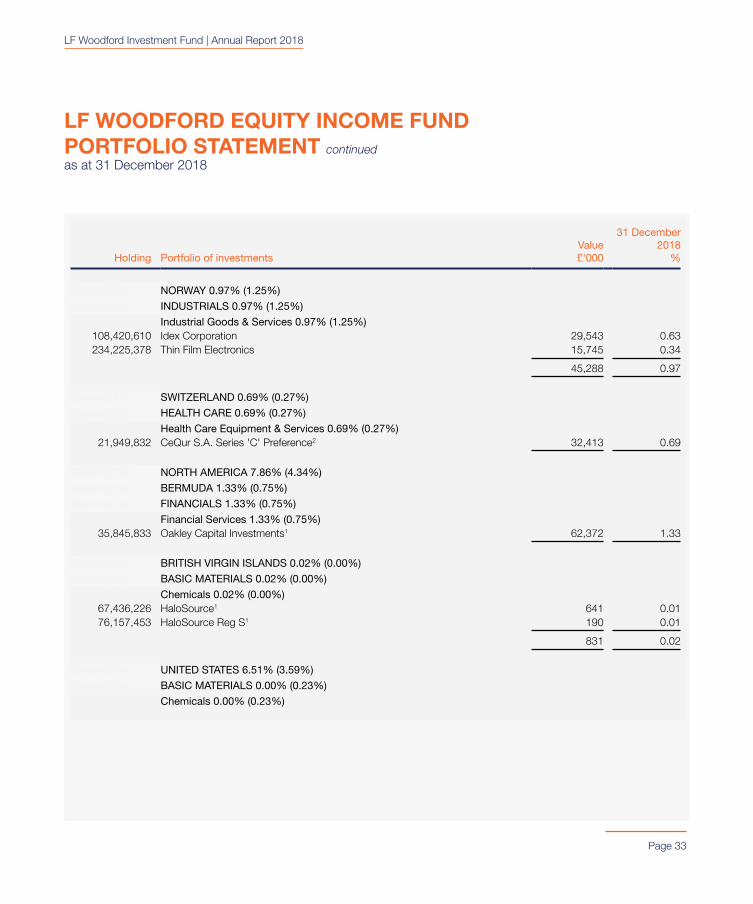
SpacingOnly NORWAY 0.97% (1.25%)
SpacingOnly INDUSTRIALS 0.97% (1.25%)
SpacingOnly Industrial Goods & Services 0.97% (1.25%)108,420,610 Idex Corporation 29,543 0.63234,225,378 Thin Film Electronics 15,745 0.34
45,288 0.97
SpacingOnly SWITZERLAND 0.69% (0.27%)
SpacingOnly HEALTH CARE 0.69% (0.27%)
SpacingOnly Health Care Equipment & Services 0.69% (0.27%)21,949,832 CeQur S.A. Series 'C' Preference2 32,413 0.69
SpacingOnly NORTH AMERICA 7.86% (4.34%)
SpacingOnly BERMUDA 1.33% (0.75%)
SpacingOnly FINANCIALS 1.33% (0.75%)
SpacingOnly Financial Services 1.33% (0.75%)35,845,833 Oakley Capital Investments1 62,372 1.33
SpacingOnly BRITISH VIRGIN ISLANDS 0.02% (0.00%)
SpacingOnly BASIC MATERIALS 0.02% (0.00%)
SpacingOnly Chemicals 0.02% (0.00%)67,436,226 HaloSource1 641 0.0176,157,453 HaloSource Reg S1 190 0.01
831 0.02
SpacingOnly UNITED STATES 6.51% (3.59%)
SpacingOnly BASIC MATERIALS 0.00% (0.23%)
SpacingOnly Chemicals 0.00% (0.23%)
LF Woodford Investment Fund | Annual Report 2018
LF WOODFORD EQUITY INCOME FUNDPORTFOLIO STATEMENT continuedas at 31 December 2018
Page 34
Holding Portfolio of investmentsValue £'000
31 December 2018
%
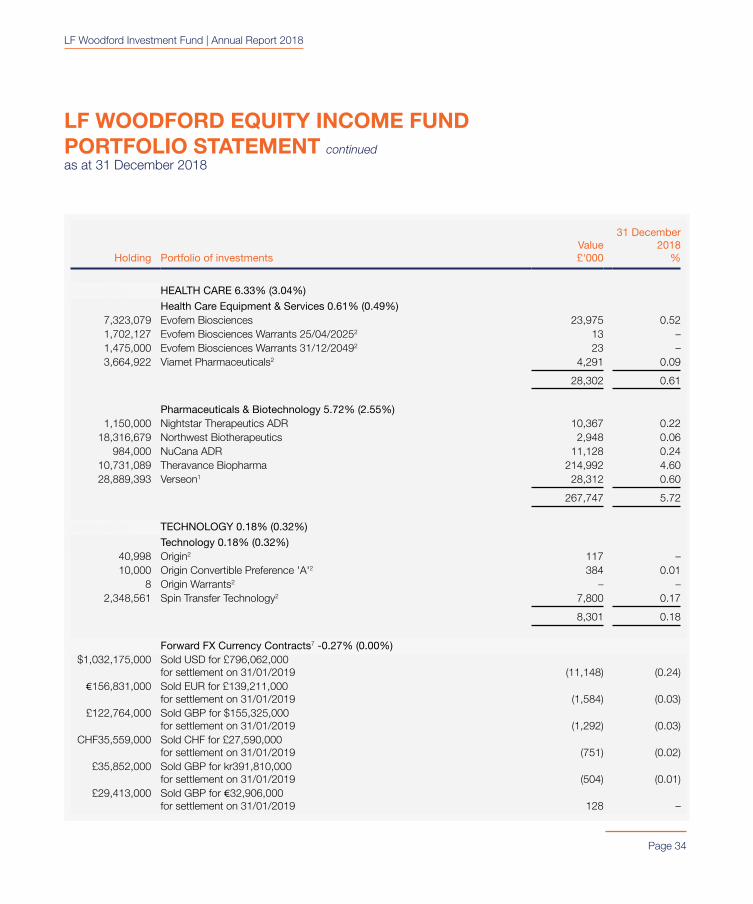
SpacingOnly HEALTH CARE 6.33% (3.04%)
SpacingOnly Health Care Equipment & Services 0.61% (0.49%)7,323,079 Evofem Biosciences 23,975 0.521,702,127 Evofem Biosciences Warrants 25/04/20252 13 –1,475,000 Evofem Biosciences Warrants 31/12/20492 23 –3,664,922 Viamet Pharmaceuticals2 4,291 0.09
28,302 0.61
SpacingOnly Pharmaceuticals & Biotechnology 5.72% (2.55%)1,150,000 Nightstar Therapeutics ADR 10,367 0.22
18,316,679 Northwest Biotherapeutics 2,948 0.06984,000 NuCana ADR 11,128 0.24
10,731,089 Theravance Biopharma 214,992 4.6028,889,393 Verseon1 28,312 0.60
267,747 5.72
SpacingOnly TECHNOLOGY 0.18% (0.32%)
SpacingOnly Technology 0.18% (0.32%)40,998 Origin2 117 –10,000 Origin Convertible Preference 'A'2 384 0.01
8 Origin Warrants2 – –2,348,561 Spin Transfer Technology2 7,800 0.17
8,301 0.18
Forward FX Currency Contracts7 -0.27% (0.00%)$1,032,175,000 Sold USD for £796,062,000
for settlement on 31/01/2019 (11,148) (0.24)€156,831,000 Sold EUR for £139,211,000
for settlement on 31/01/2019 (1,584) (0.03)£122,764,000 Sold GBP for $155,325,000
for settlement on 31/01/2019 (1,292) (0.03)CHF35,559,000 Sold CHF for £27,590,000
for settlement on 31/01/2019 (751) (0.02)£35,852,000 Sold GBP for kr391,810,000
for settlement on 31/01/2019 (504) (0.01)£29,413,000 Sold GBP for €32,906,000
for settlement on 31/01/2019 128 –
LF Woodford Investment Fund | Annual Report 2018
LF WOODFORD EQUITY INCOME FUNDPORTFOLIO STATEMENT continuedas at 31 December 2018
Page 35
Holding Portfolio of investmentsValue £'000
31 December 2018
%
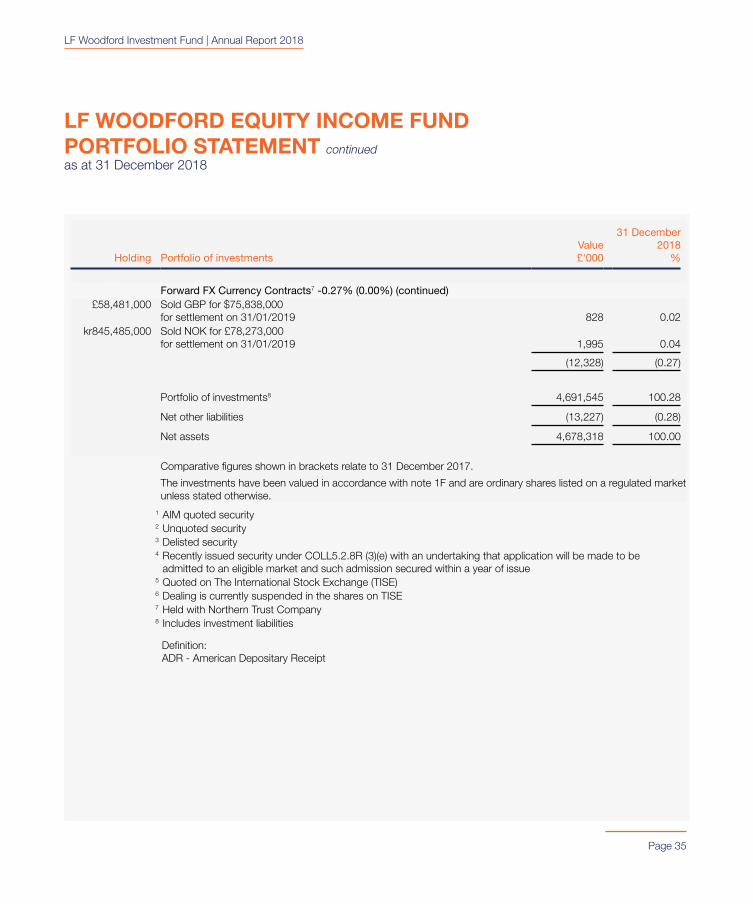
SpacingOnly Forward FX Currency Contracts7 -0.27% (0.00%) (continued)£58,481,000 Sold GBP for $75,838,000
for settlement on 31/01/2019 828 0.02kr845,485,000 Sold NOK for £78,273,000
for settlement on 31/01/2019 1,995 0.04
(12,328) (0.27)
Portfolio of investments8 4,691,545 100.28
Net other liabilities (13,227) (0.28)
Net assets 4,678,318 100.00
Comparative figures shown in brackets relate to 31 December 2017.
The investments have been valued in accordance with note 1F and are ordinary shares listed on a regulated market unless stated otherwise.
1 AIM quoted security2 Unquoted security3 Delisted security4 Recently issued security under COLL5.2.8R (3)(e) with an undertaking that application will be made to be
admitted to an eligible market and such admission secured within a year of issue5 Quoted on The International Stock Exchange (TISE)6 Dealing is currently suspended in the shares on TISE7 Held with Northern Trust Company8 Includes investment liabilities
Definition: ADR - American Depositary Receipt
LF Woodford Investment Fund | Annual Report 2018
Page 36
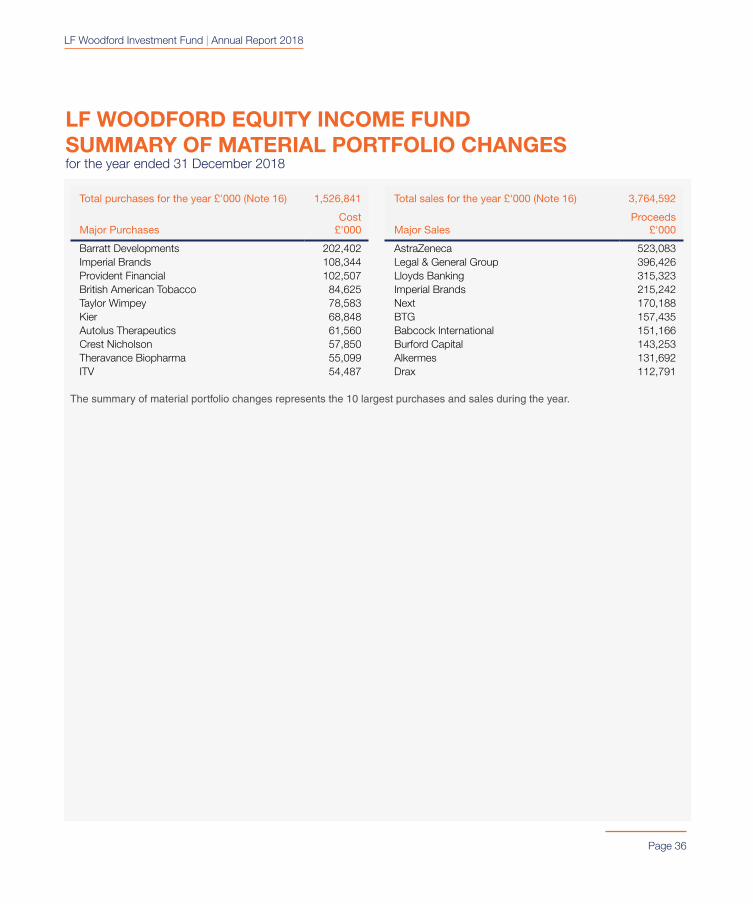
LF WOODFORD EQUITY INCOME FUNDSUMMARY OF MATERIAL PORTFOLIO CHANGESfor the year ended 31 December 2018
Total purchases for the year £'000 (Note 16) 1,526,841
Major PurchasesCost
£'000
Barratt Developments 202,402Imperial Brands 108,344Provident Financial 102,507British American Tobacco 84,625Taylor Wimpey 78,583Kier 68,848Autolus Therapeutics 61,560Crest Nicholson 57,850Theravance Biopharma 55,099ITV 54,487
Total sales for the year £'000 (Note 16) 3,764,592
Major SalesProceeds
£'000
AstraZeneca 523,083Legal & General Group 396,426Lloyds Banking 315,323Imperial Brands 215,242Next 170,188BTG 157,435Babcock International 151,166Burford Capital 143,253Alkermes 131,692Drax 112,791
The summary of material portfolio changes represents the 10 largest purchases and sales during the year.
LF Woodford Investment Fund | Annual Report 2018
Page 37
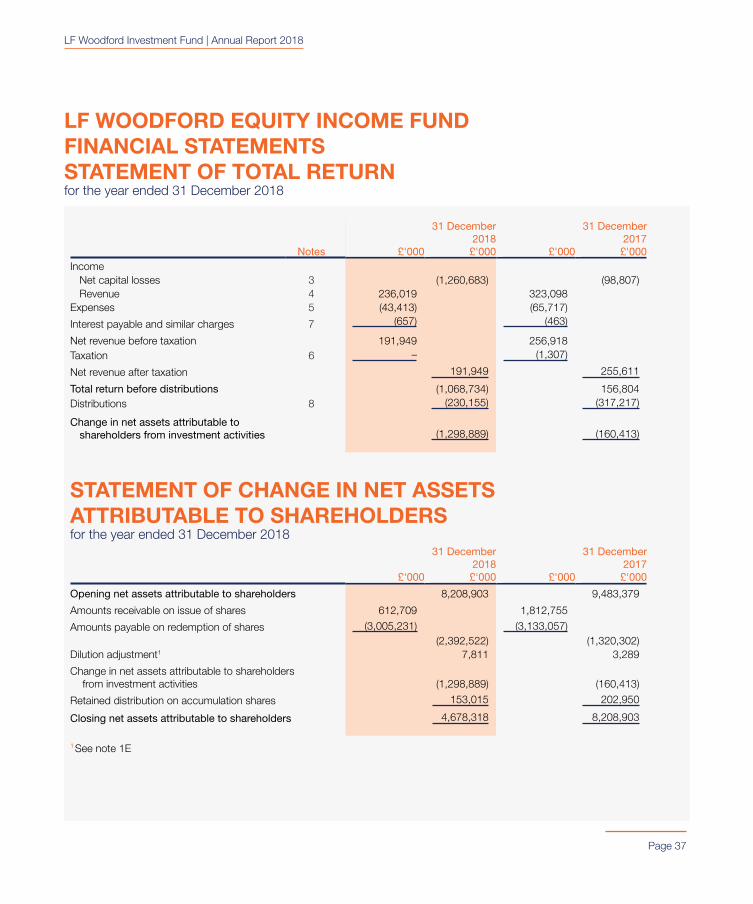
LF WOODFORD EQUITY INCOME FUNDFINANCIAL STATEMENTSSTATEMENT OF TOTAL RETURNfor the year ended 31 December 2018
Notes £'000
31 December 2018 £'000 £'000
31 December 2017 £'000
IncomeNet capital losses 3 (1,260,683) (98,807)Revenue 4 236,019 323,098
Expenses 5 (43,413) (65,717)
Interest payable and similar charges 7 (657) (463)
Net revenue before taxation 191,949 256,918Taxation 6 – (1,307)
Net revenue after taxation 191,949 255,611
Total return before distributions (1,068,734) 156,804Distributions 8 (230,155) (317,217)
Change in net assets attributable to shareholders from investment activities (1,298,889) (160,413)
STATEMENT OF CHANGE IN NET ASSETS ATTRIBUTABLE TO SHAREHOLDERSfor the year ended 31 December 2018
£'000
31 December 2018 £'000 £'000
31 December 2017 £'000
Opening net assets attributable to shareholders 8,208,903 9,483,379
Amounts receivable on issue of shares 612,709 1,812,755
Amounts payable on redemption of shares (3,005,231) (3,133,057)(2,392,522) (1,320,302)
Dilution adjustment1 7,811 3,289
Change in net assets attributable to shareholders from investment activities (1,298,889) (160,413)
Retained distribution on accumulation shares 153,015 202,950
Closing net assets attributable to shareholders 4,678,318 8,208,903
1 See note 1E
LF Woodford Investment Fund | Annual Report 2018
Page 38
LF WOODFORD EQUITY INCOME FUNDFINANCIAL STATEMENTS continued
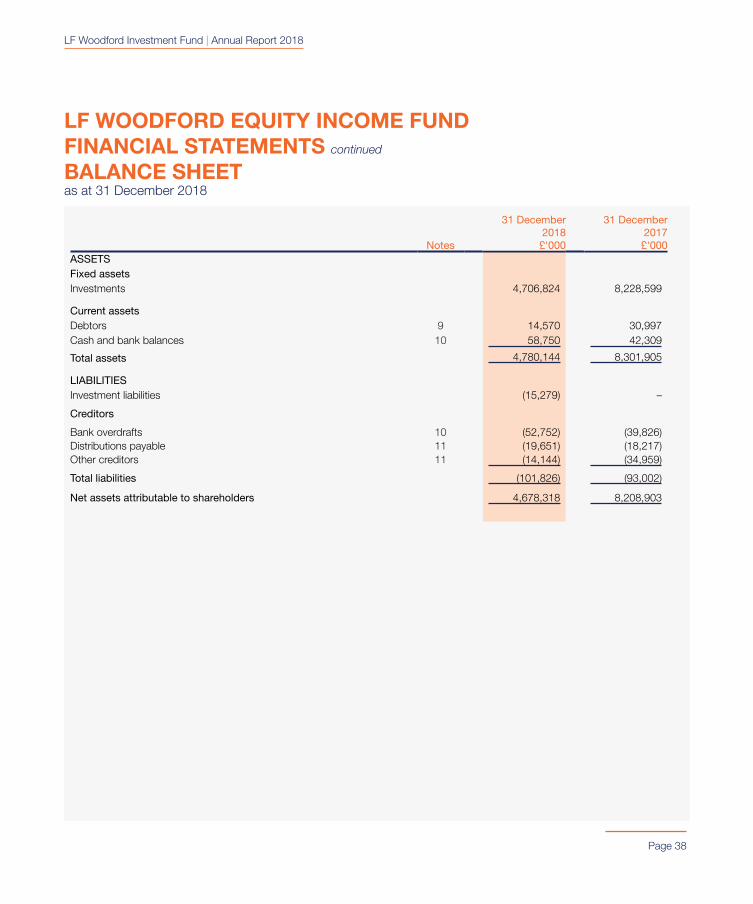
BALANCE SHEETas at 31 December 2018
Notes
31 December 2018 £'000
31 December 2017 £'000
ASSETSFixed assetsInvestments 4,706,824 8,228,599
Current assetsDebtors 9 14,570 30,997Cash and bank balances 10 58,750 42,309
Total assets 4,780,144 8,301,905
LIABILITIESInvestment liabilities (15,279) –
Creditors
Bank overdrafts 10 (52,752) (39,826)Distributions payable 11 (19,651) (18,217)Other creditors 11 (14,144) (34,959)
Total liabilities (101,826) (93,002)
Net assets attributable to shareholders 4,678,318 8,208,903
LF Woodford Investment Fund | Annual Report 2018
Page 39
LF WOODFORD EQUITY INCOME FUNDFINANCIAL STATEMENTS continued
NOTES TO THE FINANCIAL STATEMENTS for the year ended 31 December 2018
1. Accounting PoliciesThe principal accounting policies, which have been applied in both the current and prior year, are set out below:
(A) BASIS OF ACCOUNTING
The financial statements have been prepared on a going concern basis under the historical cost basis, as modified by the revaluation of investments and in accordance with FRS102 The Financial Reporting Standard applicable in the UK and Republic of Ireland, and the Statement of Recommended Practice (‘SORP’) for UK Authorised Funds issued by the Investment Association (IA) in May 2014, as amended.
(B) RECOGNITION OF REVENUE
Revenue from quoted equities and non-equity shares is recognised net of attributable tax credits when the security is quoted ex-dividend. Revenue from all equity investments is recognised when the dividend is declared.
Overseas revenue received after the deduction of withholding tax is shown gross of taxation, with the taxation consequences shown within the taxation charge.
Special dividends are reviewed on a case by case basis in determining whether the dividend is to be treated as revenue or capital. Amounts recognised as revenue will form part of the distributable revenue. Amounts recognised as capital are deducted from the cost of the investment. The tax accounting treatment follows the treatment of the principal amount.
All other revenue is recognised on an accruals basis.
(C) TREATMENT OF EXPENSES
All expenses are transferred to capital for distribution purposes in line with the Fund’s investment objective. This will increase the amount of revenue available for distribution; however, will erode capital and may constrain capital growth.
(D) ALLOCATION OF REVENUE AND EXPENSES TO MULTIPLE SHARE CLASSES
Any revenue or expense not directly attributable to a particular share class will normally be allocated pro-rata to the net assets of the relevant share classes unless a different allocation method is more appropriate.
All share classes are ranked pari passu and have no particular rights or terms attached, including rights on winding up.
(E) DILUTION ADJUSTMENT
The actual cost of purchasing or selling assets and investments in a fund may vary due to dealing charges, taxes, and any spread between buying and selling prices of the underlying investments of a fund. These costs could have an adverse effect on the value of the Fund, known as ‘dilution’. In order to mitigate the effect of dilution the ACD may at its discretion adjust the sale and purchase price of shares to take into account the possible effects of dilution to arrive at the price of shares. This practice is known as making a ‘dilution adjustment’. The power to make a dilution adjustment may only be exercised for the purpose of reducing dilution in a fund. If the price of the Shares does contain a dilution adjustment, such dilution adjustment will be paid into the Fund and will become part of the property of the Fund thus mitigating the effects of dilution that would otherwise constrain the future growth of the Fund.
The ACD reserves the right to make a dilution adjustment every Dealing Day. The dilution adjustment is calculated using the estimated dealing costs of the Fund’s underlying investments and taking into consideration any dealing spreads, commission and transfer taxes.
LF Woodford Investment Fund | Annual Report 2018
Page 40
LF WOODFORD EQUITY INCOME FUNDFINANCIAL STATEMENTS continued
NOTES TO THE FINANCIAL STATEMENTS continued for the year ended 31 December 2018
(F) BASIS OF VALUATION OF INVESTMENTS
All investments are valued at their fair value as at close of business (London time) on 31 December 2018, being the last business day of the financial year.
Quoted investments are valued at fair value which generally is the bid price, unless there is no active market in which case those investments are, for valuation purposes, treated as if they were unquoted investments and valued using the process described below.
Open forward currency contracts are valued based on the difference between the contract value and the market value adjusted by the prevailing spot rate and swap curve.
Unquoted investments in combination are a significant asset of the Fund. Such investments are held at fair value which requires significant estimation in concluding on their fair value. Whilst there is a robust and consistent valuation process undertaken by the ACD, it is recognised that in stating these assets at fair value there is a significant element of estimation uncertainty. Central to this uncertainty is the assumption that such assets will continue to progress in line with their stated business plan and will be held for the longer term until exit, generally where either the company is sold to an interested party or lists on an appropriate exchange. However, failure of any individual unquoted investment to progress in accordance with their business plan could result in material change to the fair valuation of that company.
On a monthly basis, unquoted holdings will be assessed by the ACD’s Fair Value Pricing Committee, as part of the fair value pricing process and where a material event occurs that significantly impacts the existing valuation the circumstances of that event will be documented (including an independent valuation assessment completed by IHSMarkit from publicly available information and that supplied by the investee companies), along with any valuation adjustment. In circumstances where matters are brought to the ACD’s attention as part of intra monthly assessments, the impact on the unquoted holding’s valuation is assessed and documented. Any intra month changes will be considered and adjustment if required will be made by the ACD.
In determining the fair value of the unquoted investments the ACD has done so in accordance with the following principles, which are consistent with the International Private Equity and Venture Capital Valuation (‘IPEVC’) guidelines issued in December 2015:
1. held at the price of a recent investment for an appropriate period where there is considered to have been no material change in fair value; or
2. where the basis in (1) is no longer considered appropriate, then the following factors will be considered in determining the fair value:
a. where a value is indicated by a material arms-length transaction by an independent third party in the shares of a company, this value will be used, unless the rights attributable to the shares impact the overall capital structure and rights of existing investors; or
1. Accounting Policies (continued)
LF Woodford Investment Fund | Annual Report 2018
Page 41
LF WOODFORD EQUITY INCOME FUNDFINANCIAL STATEMENTS continued
NOTES TO THE FINANCIAL STATEMENTS continued for the year ended 31 December 2018
b. in the absence of (a) and depending upon both the subsequent trading performance and investment structure of an investee company, the valuation basis will usually move to an earnings multiple basis or, if appropriate, other valuation models such as: (i) Probability-Weighted Expected Return Method (PWERM), which considers on a probability weighted basis the future outcomes for the investment; (ii) Option Priced Modelling (OPM) is used to value early stage companies where outcomes are uncertain; and (iii) Adjusted recent transaction prices (which consider the company’s performance against key milestones and the complexity of the capital structure) are also used. These valuation methods may lead to a company being valued on a suitable price-earnings ratio to that company's historic, current or forecast post-tax earnings before interest and amortisation (the ratio used being based on a comparable sector but the resulting value being adjusted to reflect points of difference identified when compared to the market sector (which the investment would reside were it listed) including, inter alia, a lack of marketability).
3. if the investment is in a fund then the valuation will be based on the net asset value of the fund (which invariably comprise of early stage unquoted investments), or on an adjusted basis to recognise the potential for a premium or discount to be applied to the share price.
At the end of 2018, 11.71% (31 December 2017: 4.16%) of the NAV is unquoted investments which are valued in accordance with (1), 0.48% (31 December 2017: 1.20%) in accordance with (2a), 6.52% (31 December 2017: 3.62%) in accordance with (2b) and 1.01% (31 December 2017: 0.43%) in accordance with (3).
Where values cannot be readily determined, the securities are valued at the ACD’s best assessment of their fair value.
(G) TAXATION
Provision is made for taxation at current rates on the excess of taxable revenue over allowable expenses.
Deferred tax is provided on all timing differences that have originated but not reversed by the balance sheet date, other than those differences that are regarded as permanent. Any liability to deferred tax is provided at the average rate of tax expected to apply. Deferred tax assets are recognised only when, on the basis of available evidence, it is more likely than not that there will be taxable profits in the future against which the deferred tax asset can be offset.
(H) FOREIGN EXCHANGE
The base and functional currency of the Fund is pounds sterling. Transactions in foreign currencies are translated at the rate of exchange ruling on the date of the transaction. Where applicable, assets and liabilities denominated in foreign currencies are translated into sterling at the rates of exchange ruling at the year end, 31 December 2018, being the last business day of the financial year.
(I) DERIVATIVE INSTRUMENTS
Financial derivative instruments may be used by the Fund for investment purposes and efficient portfolio management, for example to hedge investment exposure or to adjust exposure in a cost effective manner. Derivative instruments held within the Fund will be accounted for and taxed in accordance with the SORP. Derivative transactions will be treated as either revenue or capital depending on the motives and circumstances on acquisition.
1. Accounting Policies (continued)(F) BASIS OF VALUATION OF INVESTMENTS (continued)
LF Woodford Investment Fund | Annual Report 2018
Page 42
LF WOODFORD EQUITY INCOME FUNDFINANCIAL STATEMENTS continued
NOTES TO THE FINANCIAL STATEMENTS continued for the year ended 31 December 2018
(J) DIRECT TRANSACTION COSTS
Direct transaction costs may consist of fees and commissions paid to agents, advisers, brokers and dealers, levies by regulatory agencies and securities exchanges, and transfer taxes and duties. Direct transaction costs do not include any difference between the quoted bid and offer prices or internal administrative or holding costs. The average portfolio dealing spread is the difference between the bid and offer prices of investments at the balance sheet date, including the effect of foreign exchange expressed as a percentage of the value determined by reference to the offer price.
(K) SIGNIFICANT JUDGEMENTS AND SOURCES OF ESTIMATION UNCERTAINTY
The area where the ACD considers the judgements and key estimation of uncertainty to be most significant involve assumptions or estimates applied in respect of the valuation of the unquoted investments which are believed to be reasonable at the date of the financial statements as disclosed in note 1f. In future, actual experience could differ from those estimates.
2. Distribution PoliciesThe policy is to distribute all available revenue, after deduction of those expenses which are chargeable in calculating the distribution. In order to conduct a controlled dividend flow, interim distributions will be at the ACD’s discretion, up to a maximum of the distributable revenue for the year. All remaining revenue is distributed in accordance with the COLL.
All expenses are transferred to capital for distribution purposes in line with the Fund’s investment objective. This will increase the amount of revenue available for distribution; however, will erode capital and may constrain capital growth.
In calculating the amount of distribution, tax relief on expenses charged to capital is applied and transferred between the revenue and capital property of the Fund. In calculating how much tax relief should be allocated, revenue expenses are matched first against taxable income arising in revenue, and tax deductible capital expenses are matched first against taxable income arising in capital.
The ordinary element of stock dividends is treated as revenue and forms part of the distribution. In the case of an enhanced stock dividend, the value of the enhancement is treated as capital and does not form part of the distribution.
Distributions which have remained unclaimed by shareholders for over six years are credited to the capital property of the Fund.
3. Net Capital LossesThe net capital losses during the year comprise:
31 December 2018 £'000
31 December 2017 £'000
Non-derivative securities (1,208,297) (173,720)Forward currency contracts (50,551) 85,526Transaction charges (91) (3)
Currency losses (1,744) (10,610)
Net capital losses (1,260,683) (98,807)
1. Accounting Policies (continued)
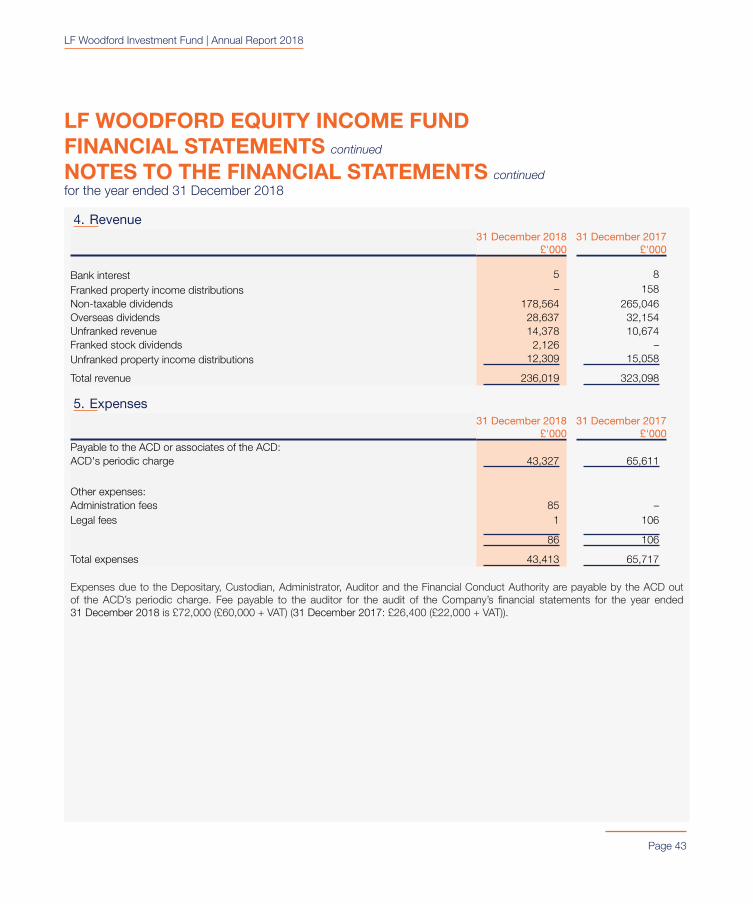
LF Woodford Investment Fund | Annual Report 2018
Page 43
LF WOODFORD EQUITY INCOME FUNDFINANCIAL STATEMENTS continued
NOTES TO THE FINANCIAL STATEMENTS continued for the year ended 31 December 2018
4. Revenue31 December 2018
£'00031 December 2017
£'000
Bank interest 5 8
Franked property income distributions – 158Non-taxable dividends 178,564 265,046Overseas dividends 28,637 32,154Unfranked revenue 14,378 10,674Franked stock dividends 2,126 –Unfranked property income distributions 12,309 15,058
Total revenue 236,019 323,098
5. Expenses31 December 2018
£'00031 December 2017
£'000Payable to the ACD or associates of the ACD:ACD's periodic charge 43,327 65,611
Other expenses:Administration fees 85 –Legal fees 1 106
86 106
Total expenses 43,413 65,717
Expenses due to the Depositary, Custodian, Administrator, Auditor and the Financial Conduct Authority are payable by the ACD out of the ACD’s periodic charge. Fee payable to the auditor for the audit of the Company’s financial statements for the year ended 31 December 2018 is £72,000 (£60,000 + VAT) (31 December 2017: £26,400 (£22,000 + VAT)).
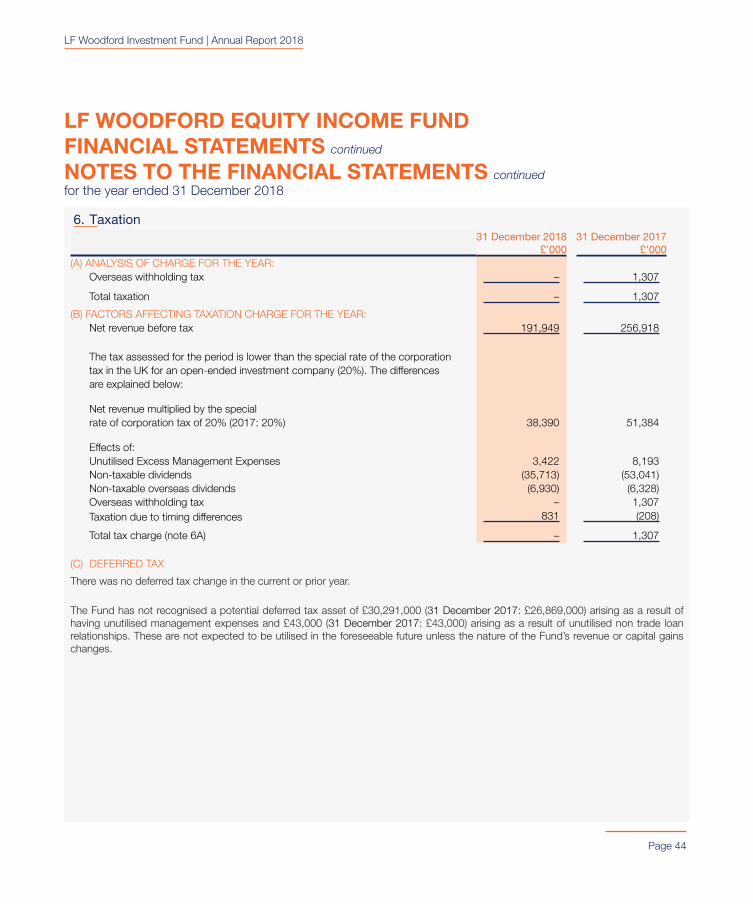
LF Woodford Investment Fund | Annual Report 2018
Page 44
LF WOODFORD EQUITY INCOME FUNDFINANCIAL STATEMENTS continued
NOTES TO THE FINANCIAL STATEMENTS continued for the year ended 31 December 2018
6. Taxation
31 December 2018
£'00031 December 2017
£'000(A) ANALYSIS OF CHARGE FOR THE YEAR:
Overseas withholding tax – 1,307
Total taxation – 1,307
(B) FACTORS AFFECTING TAXATION CHARGE FOR THE YEAR:Net revenue before tax 191,949 256,918
The tax assessed for the period is lower than the special rate of the corporationtax in the UK for an open-ended investment company (20%). The differences are explained below:
Net revenue multiplied by the specialrate of corporation tax of 20% (2017: 20%) 38,390 51,384
Effects of:Unutilised Excess Management Expenses 3,422 8,193Non-taxable dividends (35,713) (53,041)Non-taxable overseas dividends (6,930) (6,328)Overseas withholding tax – 1,307Taxation due to timing differences 831 (208)
Total tax charge (note 6A) – 1,307
(C) DEFERRED TAX
There was no deferred tax change in the current or prior year.
The Fund has not recognised a potential deferred tax asset of £30,291,000 (31 December 2017: £26,869,000) arising as a result of having unutilised management expenses and £43,000 (31 December 2017: £43,000) arising as a result of unutilised non trade loan relationships. These are not expected to be utilised in the foreseeable future unless the nature of the Fund’s revenue or capital gains changes.
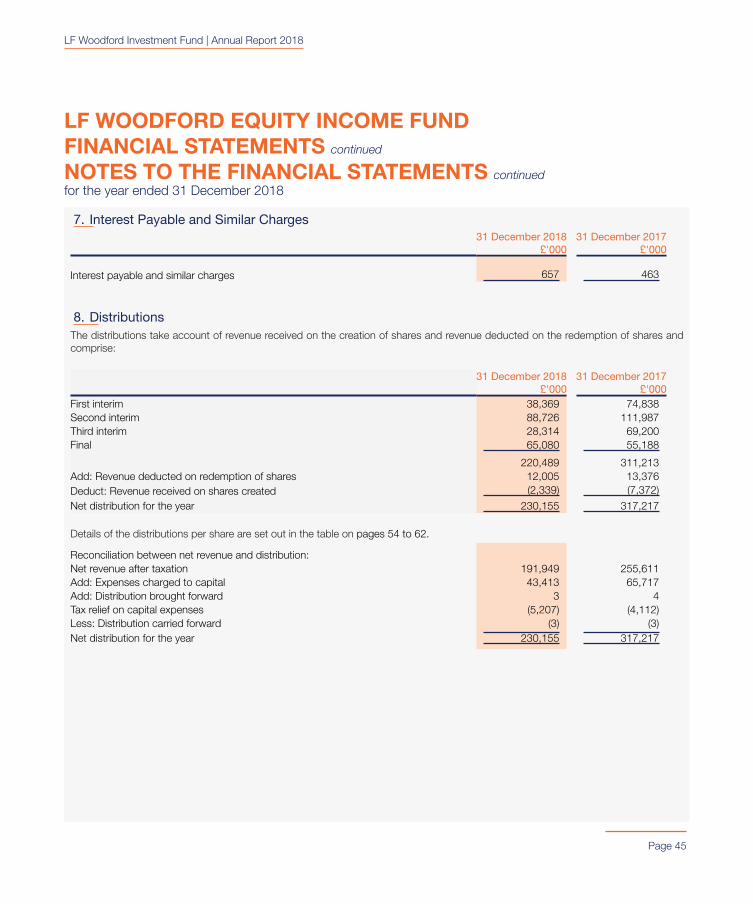
LF Woodford Investment Fund | Annual Report 2018
Page 45
LF WOODFORD EQUITY INCOME FUNDFINANCIAL STATEMENTS continued
NOTES TO THE FINANCIAL STATEMENTS continued for the year ended 31 December 2018
7. Interest Payable and Similar Charges31 December 2018
£'00031 December 2017
£'000
Interest payable and similar charges 657 463
8. DistributionsThe distributions take account of revenue received on the creation of shares and revenue deducted on the redemption of shares and comprise:
31 December 2018 £'000
31 December 2017 £'000
First interim 38,369 74,838Second interim 88,726 111,987Third interim 28,314 69,200Final 65,080 55,188
220,489 311,213Add: Revenue deducted on redemption of shares 12,005 13,376Deduct: Revenue received on shares created (2,339) (7,372)
Net distribution for the year 230,155 317,217
Details of the distributions per share are set out in the table on pages 54 to 62.
Reconciliation between net revenue and distribution: Net revenue after taxation 191,949 255,611Add: Expenses charged to capital 43,413 65,717Add: Distribution brought forward 3 4Tax relief on capital expenses (5,207) (4,112)Less: Distribution carried forward (3) (3)Net distribution for the year 230,155 317,217
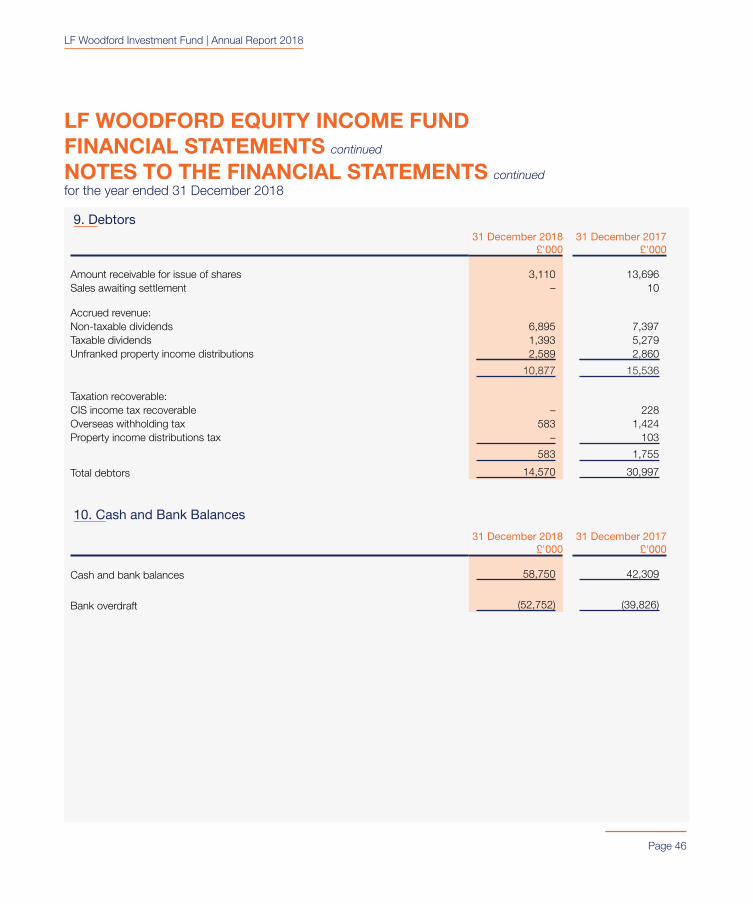
LF Woodford Investment Fund | Annual Report 2018
Page 46
LF WOODFORD EQUITY INCOME FUNDFINANCIAL STATEMENTS continued
NOTES TO THE FINANCIAL STATEMENTS continued for the year ended 31 December 2018
9. Debtors31 December 2018
£'00031 December 2017
£'000
Amount receivable for issue of shares 3,110 13,696Sales awaiting settlement – 10
Accrued revenue:Non-taxable dividends 6,895 7,397Taxable dividends 1,393 5,279Unfranked property income distributions 2,589 2,860
10,877 15,536
Taxation recoverable:CIS income tax recoverable – 228Overseas withholding tax 583 1,424Property income distributions tax – 103
583 1,755
Total debtors 14,570 30,997
10. Cash and Bank Balances
31 December 2018 £'000
31 December 2017 £'000
Cash and bank balances 58,750 42,309
Bank overdraft (52,752) (39,826)
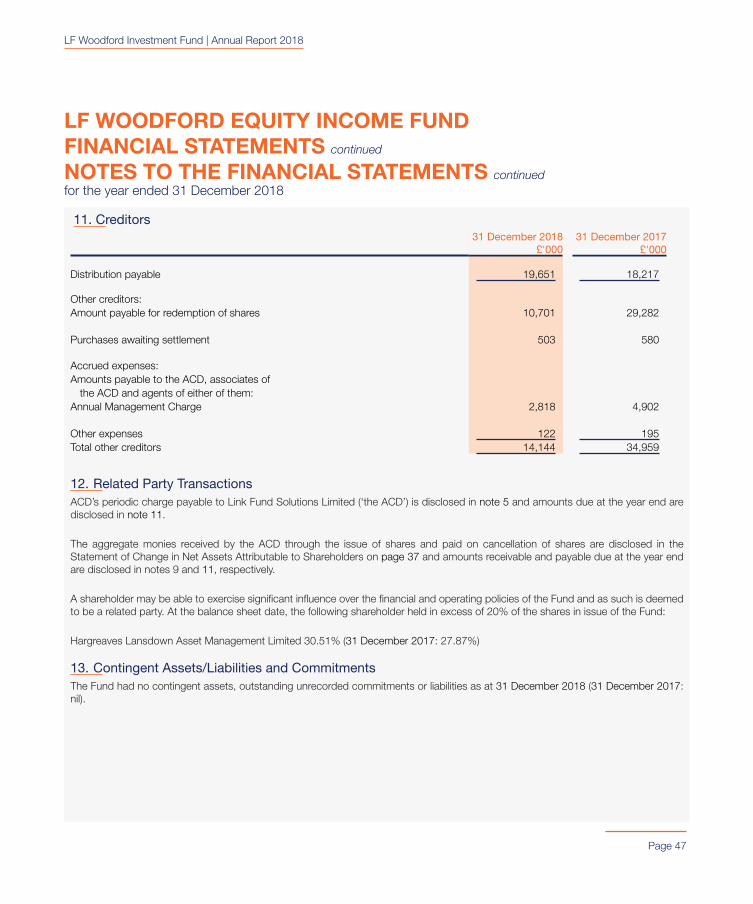
LF Woodford Investment Fund | Annual Report 2018
Page 47
LF WOODFORD EQUITY INCOME FUNDFINANCIAL STATEMENTS continued
NOTES TO THE FINANCIAL STATEMENTS continued for the year ended 31 December 2018
11. Creditors31 December 2018
£'00031 December 2017
£'000
Distribution payable 19,651 18,217
Other creditors:Amount payable for redemption of shares 10,701 29,282
Purchases awaiting settlement 503 580
Accrued expenses:Amounts payable to the ACD, associates of
the ACD and agents of either of them:Annual Management Charge 2,818 4,902
Other expenses 122 195Total other creditors 14,144 34,959
12. Related Party TransactionsACD’s periodic charge payable to Link Fund Solutions Limited (‘the ACD’) is disclosed in note 5 and amounts due at the year end are disclosed in note 11.
The aggregate monies received by the ACD through the issue of shares and paid on cancellation of shares are disclosed in the Statement of Change in Net Assets Attributable to Shareholders on page 37 and amounts receivable and payable due at the year end are disclosed in notes 9 and 11, respectively.
A shareholder may be able to exercise significant influence over the financial and operating policies of the Fund and as such is deemed to be a related party. At the balance sheet date, the following shareholder held in excess of 20% of the shares in issue of the Fund:
Hargreaves Lansdown Asset Management Limited 30.51% (31 December 2017: 27.87%)
13. Contingent Assets/Liabilities and CommitmentsThe Fund had no contingent assets, outstanding unrecorded commitments or liabilities as at 31 December 2018 (31 December 2017: nil).
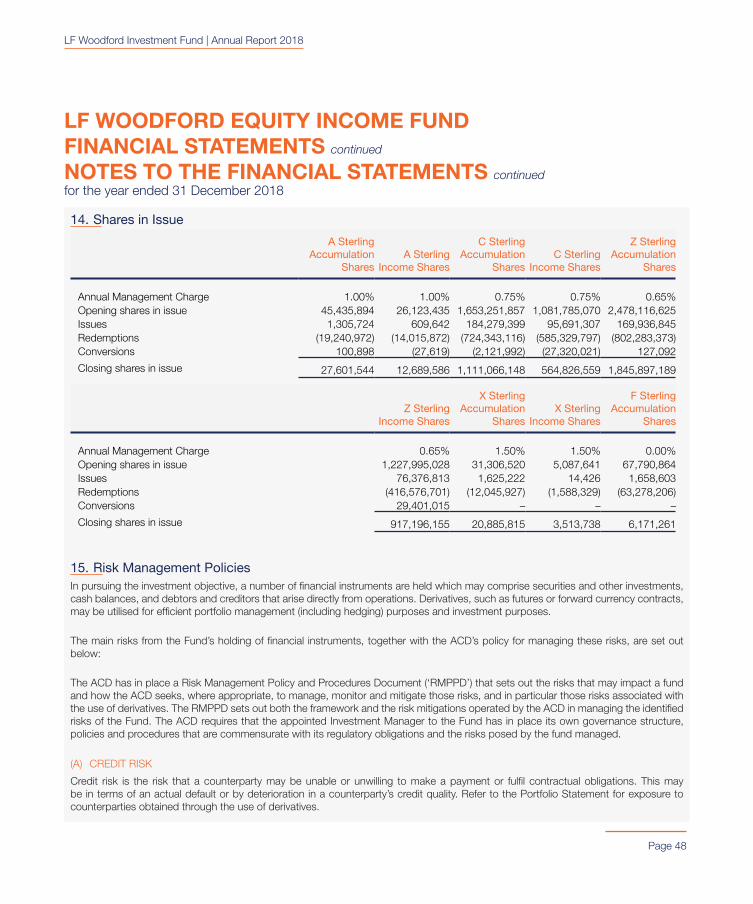
LF Woodford Investment Fund | Annual Report 2018
Page 48
LF WOODFORD EQUITY INCOME FUNDFINANCIAL STATEMENTS continued
NOTES TO THE FINANCIAL STATEMENTS continued for the year ended 31 December 2018
14. Shares in Issue
1.1A Sterling Accumulation
Shares1.2A Sterling
Income Shares
3.1C Sterling Accumulation
Shares3.2C Sterling
Income Shares
7.1Z Sterling Accumulation
Shares
Annual Management Charge 1.00% 1.00% 0.75% 0.75% 0.65%Opening shares in issue 45,435,894 26,123,435 1,653,251,857 1,081,785,070 2,478,116,625Issues 1,305,724 609,642 184,279,399 95,691,307 169,936,845Redemptions (19,240,972) (14,015,872) (724,343,116) (585,329,797) (802,283,373)Conversions 100,898 (27,619) (2,121,992) (27,320,021) 127,092
Closing shares in issue 27,601,544 12,689,586 1,111,066,148 564,826,559 1,845,897,189
7.2Z Sterling Income Shares
8.1X Sterling Accumulation
Shares8.2X Sterling
Income Shares
9.1F Sterling Accumulation
Shares
Annual Management Charge 0.65% 1.50% 1.50% 0.00%Opening shares in issue 1,227,995,028 31,306,520 5,087,641 67,790,864Issues 76,376,813 1,625,222 14,426 1,658,603Redemptions (416,576,701) (12,045,927) (1,588,329) (63,278,206)Conversions 29,401,015 – – –
Closing shares in issue 917,196,155 20,885,815 3,513,738 6,171,261
15. Risk Management PoliciesIn pursuing the investment objective, a number of financial instruments are held which may comprise securities and other investments, cash balances, and debtors and creditors that arise directly from operations. Derivatives, such as futures or forward currency contracts, may be utilised for efficient portfolio management (including hedging) purposes and investment purposes.
The main risks from the Fund’s holding of financial instruments, together with the ACD’s policy for managing these risks, are set out below:
The ACD has in place a Risk Management Policy and Procedures Document (‘RMPPD’) that sets out the risks that may impact a fund and how the ACD seeks, where appropriate, to manage, monitor and mitigate those risks, and in particular those risks associated with the use of derivatives. The RMPPD sets out both the framework and the risk mitigations operated by the ACD in managing the identified risks of the Fund. The ACD requires that the appointed Investment Manager to the Fund has in place its own governance structure, policies and procedures that are commensurate with its regulatory obligations and the risks posed by the fund managed.
(A) CREDIT RISK
Credit risk is the risk that a counterparty may be unable or unwilling to make a payment or fulfil contractual obligations. This may be in terms of an actual default or by deterioration in a counterparty’s credit quality. Refer to the Portfolio Statement for exposure to counterparties obtained through the use of derivatives.
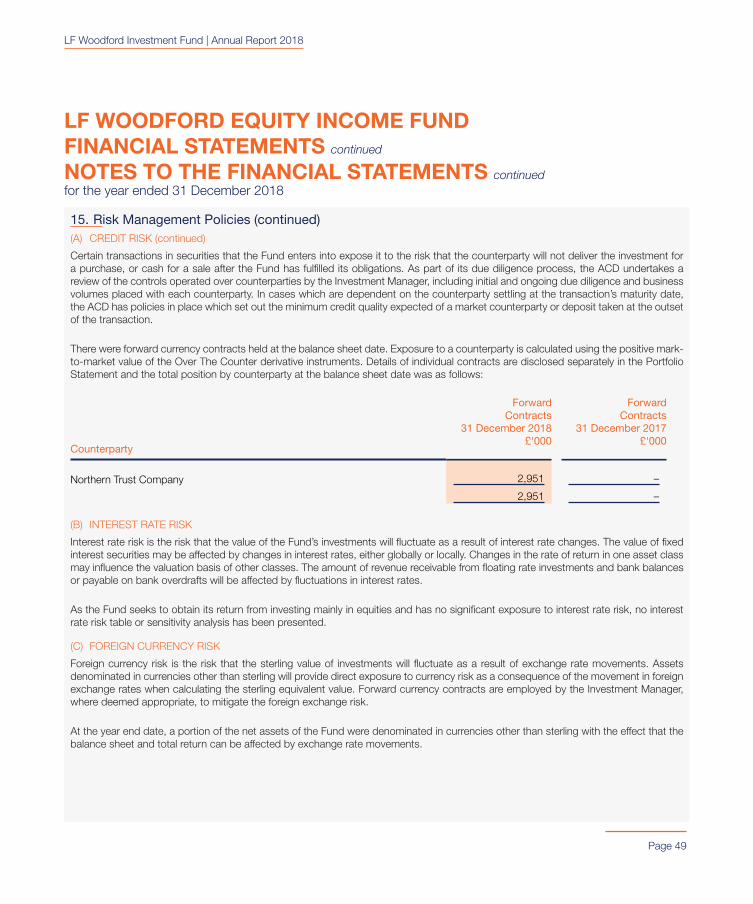
LF Woodford Investment Fund | Annual Report 2018
Page 49
LF WOODFORD EQUITY INCOME FUNDFINANCIAL STATEMENTS continued
NOTES TO THE FINANCIAL STATEMENTS continued for the year ended 31 December 2018
Certain transactions in securities that the Fund enters into expose it to the risk that the counterparty will not deliver the investment for a purchase, or cash for a sale after the Fund has fulfilled its obligations. As part of its due diligence process, the ACD undertakes a review of the controls operated over counterparties by the Investment Manager, including initial and ongoing due diligence and business volumes placed with each counterparty. In cases which are dependent on the counterparty settling at the transaction’s maturity date, the ACD has policies in place which set out the minimum credit quality expected of a market counterparty or deposit taken at the outset of the transaction.
There were forward currency contracts held at the balance sheet date. Exposure to a counterparty is calculated using the positive mark-to-market value of the Over The Counter derivative instruments. Details of individual contracts are disclosed separately in the Portfolio Statement and the total position by counterparty at the balance sheet date was as follows:
Counterparty
Forward Contracts
31 December 2018 £'000
Forward Contracts
31 December 2017 £'000
Northern Trust Company 2,951 –
2,951 –
(B) INTEREST RATE RISK
Interest rate risk is the risk that the value of the Fund’s investments will fluctuate as a result of interest rate changes. The value of fixed interest securities may be affected by changes in interest rates, either globally or locally. Changes in the rate of return in one asset class may influence the valuation basis of other classes. The amount of revenue receivable from floating rate investments and bank balances or payable on bank overdrafts will be affected by fluctuations in interest rates.
As the Fund seeks to obtain its return from investing mainly in equities and has no significant exposure to interest rate risk, no interest rate risk table or sensitivity analysis has been presented.
(C) FOREIGN CURRENCY RISK
Foreign currency risk is the risk that the sterling value of investments will fluctuate as a result of exchange rate movements. Assets denominated in currencies other than sterling will provide direct exposure to currency risk as a consequence of the movement in foreign exchange rates when calculating the sterling equivalent value. Forward currency contracts are employed by the Investment Manager, where deemed appropriate, to mitigate the foreign exchange risk.
At the year end date, a portion of the net assets of the Fund were denominated in currencies other than sterling with the effect that the balance sheet and total return can be affected by exchange rate movements.
15. Risk Management Policies (continued)(A) CREDIT RISK (continued)
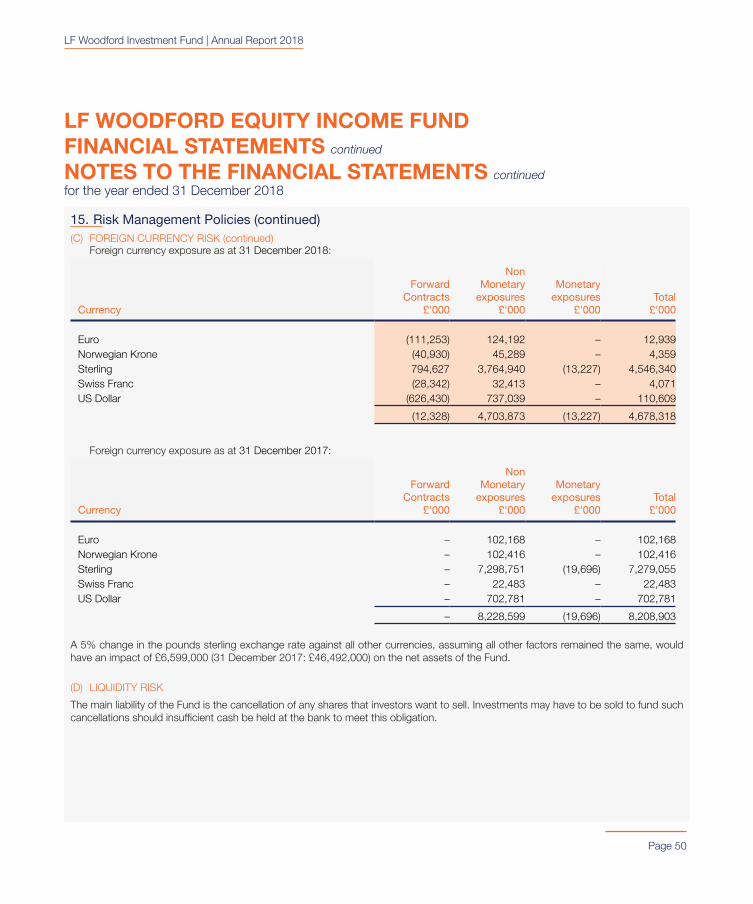
LF Woodford Investment Fund | Annual Report 2018
Page 50
LF WOODFORD EQUITY INCOME FUNDFINANCIAL STATEMENTS continued
NOTES TO THE FINANCIAL STATEMENTS continued for the year ended 31 December 2018
Foreign currency exposure as at 31 December 2018:
Currency
Forward Contracts
£'000
Non Monetary
exposures £'000
Monetary exposures
£'000Total
£'000
Euro (111,253) 124,192 – 12,939Norwegian Krone (40,930) 45,289 – 4,359Sterling 794,627 3,764,940 (13,227) 4,546,340Swiss Franc (28,342) 32,413 – 4,071US Dollar (626,430) 737,039 – 110,609
(12,328) 4,703,873 (13,227) 4,678,318
Foreign currency exposure as at 31 December 2017:
Currency
Forward Contracts
£'000
Non Monetary
exposures £'000
Monetary exposures
£'000Total
£'000
Euro – 102,168 – 102,168Norwegian Krone – 102,416 – 102,416Sterling – 7,298,751 (19,696) 7,279,055Swiss Franc – 22,483 – 22,483US Dollar – 702,781 – 702,781
– 8,228,599 (19,696) 8,208,903
A 5% change in the pounds sterling exchange rate against all other currencies, assuming all other factors remained the same, would have an impact of £6,599,000 (31 December 2017: £46,492,000) on the net assets of the Fund.
(D) LIQUIDITY RISK
The main liability of the Fund is the cancellation of any shares that investors want to sell. Investments may have to be sold to fund such cancellations should insufficient cash be held at the bank to meet this obligation.
15. Risk Management Policies (continued)(C) FOREIGN CURRENCY RISK (continued)
LF Woodford Investment Fund | Annual Report 2018
Page 51
LF WOODFORD EQUITY INCOME FUNDFINANCIAL STATEMENTS continued
NOTES TO THE FINANCIAL STATEMENTS continued for the year ended 31 December 2018
To maintain an appropriate liquidity risk profile for the Fund, the Investment Manager ensures that a substantial portion of the Fund’s assets consist of readily realisable securities and cash. The ACD monitors this position on a daily basis to ensure that the liquidity profile of the Fund is aligned to shareholder activity. The ACD also considers the impact of market shocks on the ability of the Fund to meet shareholder redemptions in periods of constrained liquidity.
All financial liabilities are payable in one year or less, or on demand.
(E) MARKET PRICE RISK
Market price risk is the risk that the value of the Fund’s financial instruments will fluctuate as a result of changes in market prices caused by factors other than interest rate or foreign currency movement. Market price risk arises primarily from uncertainty about the future prices of financial instruments that the Fund holds.
Market price risk represents the potential loss the Fund may suffer through holding market positions in the face of price movements. The Fund’s investment portfolio is exposed to price fluctuations, which are monitored by the ACD in pursuance of the investment objective and policy. The risk is generally regarded as consisting of two elements - stock specific risk and market risk. Adhering to investment guidelines and avoiding excessive exposure to one particular issuer can limit stock specific risk. Subject to compliance with the investment objective, spreading exposure across a broad range of global stocks can mitigate market risk.
A 5% increase in the value of the Fund’s portfolio, excluding forward currency contracts, would have the effect of increasing the return and assets by £235,194,000 (31 December 2017: £411,430,000). A 5% decrease would have an equal and opposite effect.
(F) FAIR VALUE OF FINANCIAL ASSETS AND FINANCIAL LIABILITIES
There is no material difference between the value of the financial assets and liabilities, as shown in the balance sheet, and their fair value.
(G) DERIVATIVE RISK
Over the past year, the Fund has used no other derivative instruments other than forward currency contracts (31 December 2017: same).
(H) LEVERAGE
Currently, the Fund uses only forward currency contracts as outlined in the foreign currency risk section (31 December 2017: same).
15. Risk Management Policies (continued)(D) LIQUIDITY RISK (continued)
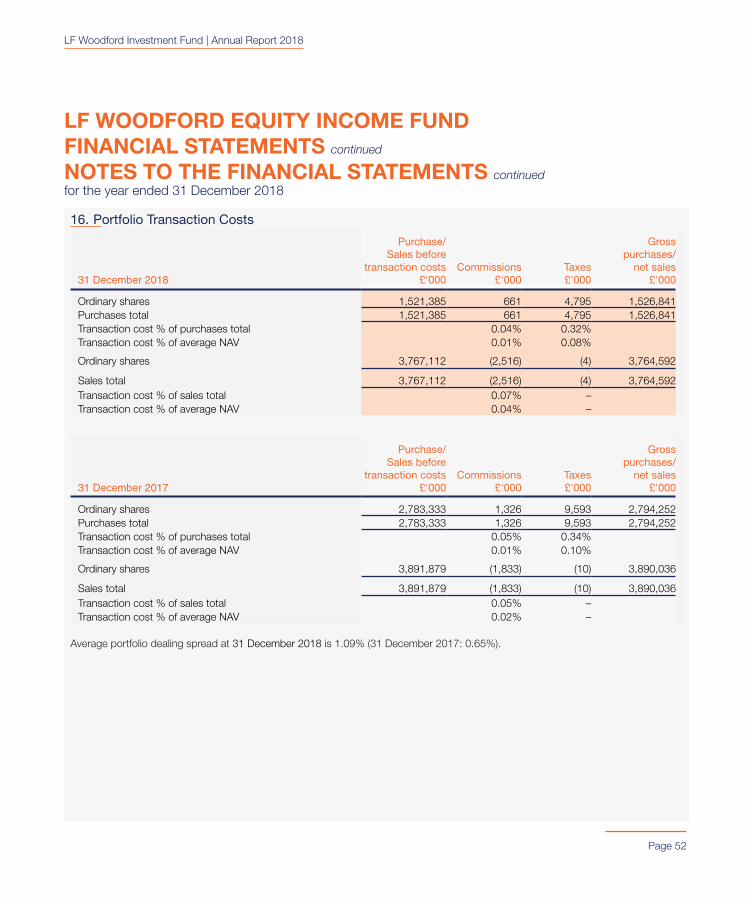
LF Woodford Investment Fund | Annual Report 2018
Page 52
LF WOODFORD EQUITY INCOME FUNDFINANCIAL STATEMENTS continued
NOTES TO THE FINANCIAL STATEMENTS continued for the year ended 31 December 2018
16. Portfolio Transaction Costs
31 December 2018
Purchase/ Sales before
transaction costs £'000
Commissions £'000
Taxes £'000
Gross purchases/
net sales £'000
Ordinary shares 1,521,385 661 4,795 1,526,841Purchases total 1,521,385 661 4,795 1,526,841Transaction cost % of purchases total 0.04% 0.32%Transaction cost % of average NAV 0.01% 0.08%
Ordinary shares 3,767,112 (2,516) (4) 3,764,592
Sales total 3,767,112 (2,516) (4) 3,764,592Transaction cost % of sales total 0.07% –Transaction cost % of average NAV 0.04% –
31 December 2017
Purchase/ Sales before
transaction costs £'000
Commissions £'000
Taxes £'000
Gross purchases/
net sales £'000
Ordinary shares 2,783,333 1,326 9,593 2,794,252Purchases total 2,783,333 1,326 9,593 2,794,252Transaction cost % of purchases total 0.05% 0.34%Transaction cost % of average NAV 0.01% 0.10%
Ordinary shares 3,891,879 (1,833) (10) 3,890,036
Sales total 3,891,879 (1,833) (10) 3,890,036Transaction cost % of sales total 0.05% –Transaction cost % of average NAV 0.02% –
Average portfolio dealing spread at 31 December 2018 is 1.09% (31 December 2017: 0.65%).
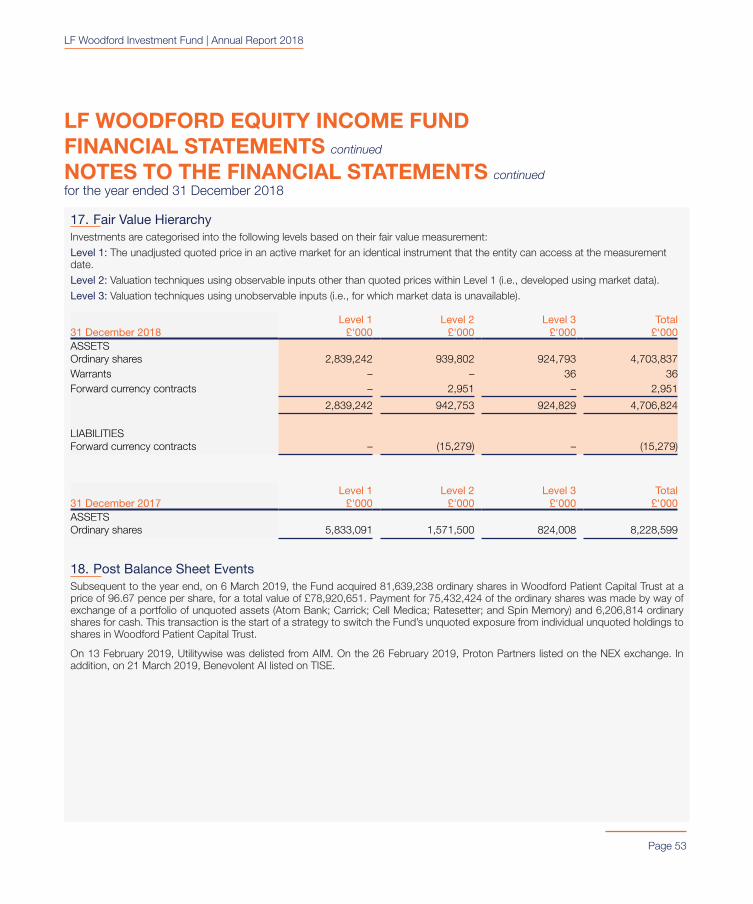
LF Woodford Investment Fund | Annual Report 2018
Page 53
LF WOODFORD EQUITY INCOME FUNDFINANCIAL STATEMENTS continued
NOTES TO THE FINANCIAL STATEMENTS continued for the year ended 31 December 2018
17. Fair Value HierarchyInvestments are categorised into the following levels based on their fair value measurement:Level 1: The unadjusted quoted price in an active market for an identical instrument that the entity can access at the measurement date.Level 2: Valuation techniques using observable inputs other than quoted prices within Level 1 (i.e., developed using market data).Level 3: Valuation techniques using unobservable inputs (i.e., for which market data is unavailable).
31 December 2018Level 1
£'000Level 2
£'000Level 3
£'000Total
£'000ASSETSOrdinary shares 2,839,242 939,802 924,793 4,703,837Warrants – – 36 36Forward currency contracts – 2,951 – 2,951
2,839,242 942,753 924,829 4,706,824
LIABILITIESForward currency contracts – (15,279) – (15,279)
31 December 2017Level 1
£'000Level 2
£'000Level 3
£'000Total
£'000ASSETSOrdinary shares 5,833,091 1,571,500 824,008 8,228,599
18. Post Balance Sheet EventsSubsequent to the year end, on 6 March 2019, the Fund acquired 81,639,238 ordinary shares in Woodford Patient Capital Trust at a price of 96.67 pence per share, for a total value of £78,920,651. Payment for 75,432,424 of the ordinary shares was made by way of exchange of a portfolio of unquoted assets (Atom Bank; Carrick; Cell Medica; Ratesetter; and Spin Memory) and 6,206,814 ordinary shares for cash. This transaction is the start of a strategy to switch the Fund’s unquoted exposure from individual unquoted holdings to shares in Woodford Patient Capital Trust.
On 13 February 2019, Utilitywise was delisted from AIM. On the 26 February 2019, Proton Partners listed on the NEX exchange. In addition, on 21 March 2019, Benevolent AI listed on TISE.
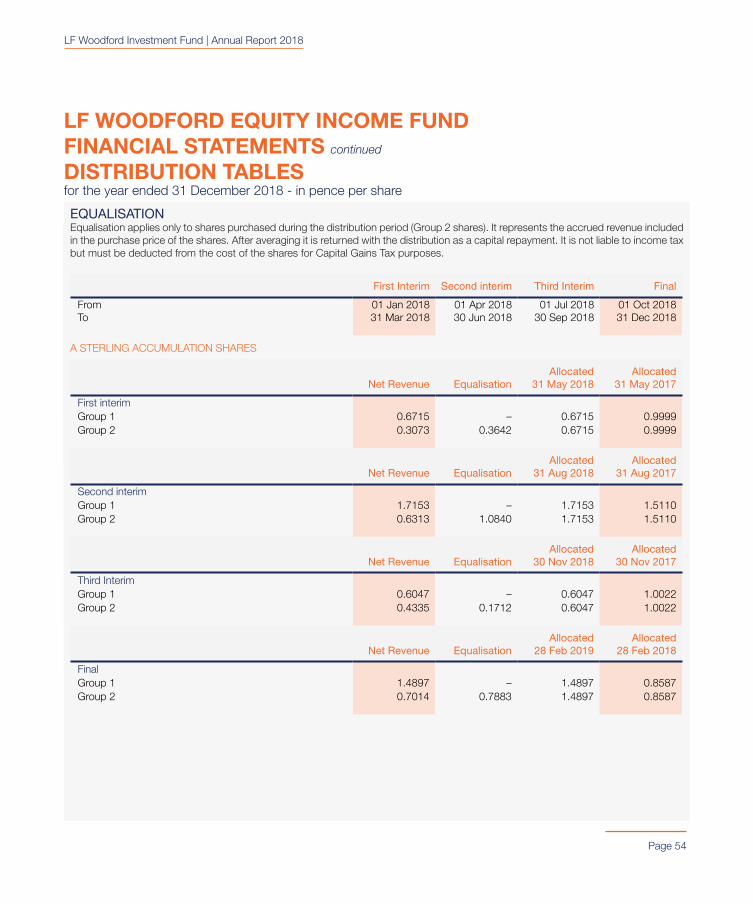
LF Woodford Investment Fund | Annual Report 2018
Page 54
LF WOODFORD EQUITY INCOME FUNDFINANCIAL STATEMENTS continued
DISTRIBUTION TABLESfor the year ended 31 December 2018 - in pence per share
EQUALISATION Equalisation applies only to shares purchased during the distribution period (Group 2 shares). It represents the accrued revenue included in the purchase price of the shares. After averaging it is returned with the distribution as a capital repayment. It is not liable to income tax but must be deducted from the cost of the shares for Capital Gains Tax purposes.
First Interim Second interim Third Interim Final
From To
01 Jan 2018 31 Mar 2018
01 Apr 2018 30 Jun 2018
01 Jul 2018 30 Sep 2018
01 Oct 2018 31 Dec 2018
A STERLING ACCUMULATION SHARES
Net Revenue EqualisationAllocated
31 May 2018Allocated
31 May 2017
First interimGroup 1 0.6715 – 0.6715 0.9999Group 2 0.3073 0.3642 0.6715 0.9999
Net Revenue EqualisationAllocated
31 Aug 2018Allocated
31 Aug 2017
Second interimGroup 1 1.7153 – 1.7153 1.5110Group 2 0.6313 1.0840 1.7153 1.5110
Net Revenue EqualisationAllocated
30 Nov 2018Allocated
30 Nov 2017
Third InterimGroup 1 0.6047 – 0.6047 1.0022Group 2 0.4335 0.1712 0.6047 1.0022
Net Revenue EqualisationAllocated
28 Feb 2019Allocated
28 Feb 2018
FinalGroup 1 1.4897 – 1.4897 0.8587Group 2 0.7014 0.7883 1.4897 0.8587

LF Woodford Investment Fund | Annual Report 2018
LF WOODFORD EQUITY INCOME FUNDFINANCIAL STATEMENTS continued
DISTRIBUTION TABLES continuedfor the year ended 31 December 2018 - in pence per share
Page 55
A STERLING INCOME SHARES
Net Revenue EqualisationPaid
31 May 2018Paid
31 May 2017
First interimGroup 1 0.5982 – 0.5982 0.9210Group 2 0.5505 0.0477 0.5982 0.9210
Net Revenue EqualisationPaid
31 Aug 2018Paid
31 Aug 2017
Second interimGroup 1 1.5192 – 1.5192 1.3810Group 2 0.7777 0.7415 1.5192 1.3810
Net Revenue EqualisationPaid
30 Nov 2018Paid
30 Nov 2017
Third InterimGroup 1 0.5260 – 0.5260 0.9056Group 2 0.3665 0.1595 0.5260 0.9056
Net Revenue EqualisationPaid
28 Feb 2019Paid
28 Feb 2018
FinalGroup 1 1.2939 – 1.2939 0.7702Group 2 0.4997 0.7942 1.2939 0.7702
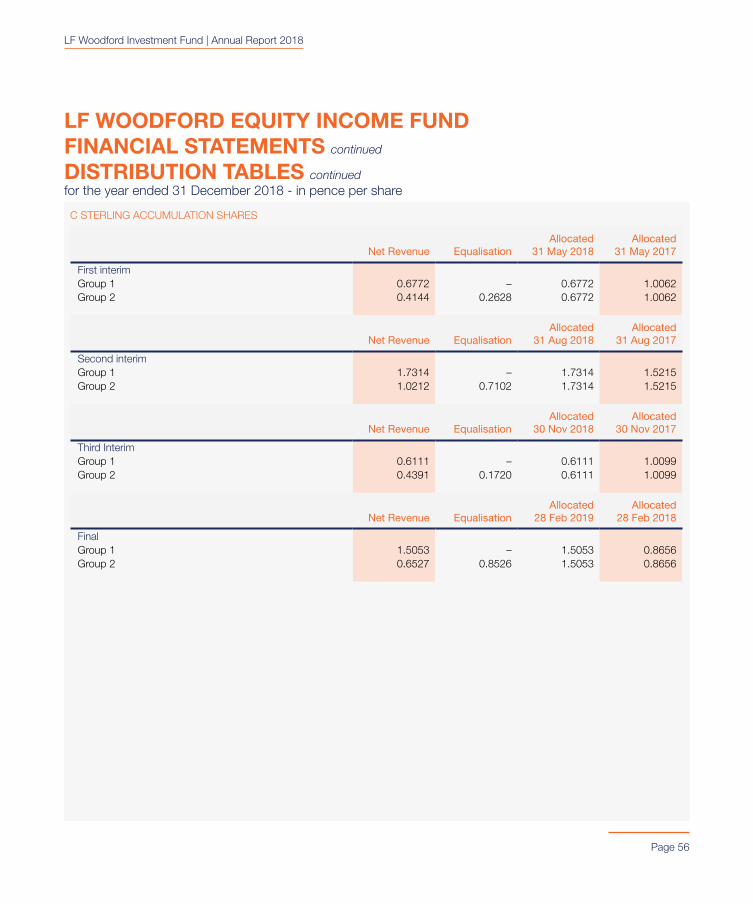
LF Woodford Investment Fund | Annual Report 2018
LF WOODFORD EQUITY INCOME FUNDFINANCIAL STATEMENTS continued
DISTRIBUTION TABLES continuedfor the year ended 31 December 2018 - in pence per share
Page 56
C STERLING ACCUMULATION SHARES
Net Revenue EqualisationAllocated
31 May 2018Allocated
31 May 2017
First interimGroup 1 0.6772 – 0.6772 1.0062Group 2 0.4144 0.2628 0.6772 1.0062
Net Revenue EqualisationAllocated
31 Aug 2018Allocated
31 Aug 2017
Second interimGroup 1 1.7314 – 1.7314 1.5215Group 2 1.0212 0.7102 1.7314 1.5215
Net Revenue EqualisationAllocated
30 Nov 2018Allocated
30 Nov 2017
Third InterimGroup 1 0.6111 – 0.6111 1.0099Group 2 0.4391 0.1720 0.6111 1.0099
Net Revenue EqualisationAllocated
28 Feb 2019Allocated
28 Feb 2018
FinalGroup 1 1.5053 – 1.5053 0.8656Group 2 0.6527 0.8526 1.5053 0.8656

LF Woodford Investment Fund | Annual Report 2018
LF WOODFORD EQUITY INCOME FUNDFINANCIAL STATEMENTS continued
DISTRIBUTION TABLES continuedfor the year ended 31 December 2018 - in pence per share
Page 57
C STERLING INCOME SHARES
Net Revenue EqualisationPaid
31 May 2018Paid
31 May 2017
First interimGroup 1 0.6039 – 0.6039 0.9274Group 2 0.3412 0.2627 0.6039 0.9274
Net Revenue EqualisationPaid
31 Aug 2018Paid
31 Aug 2017
Second interimGroup 1 1.5347 – 1.5347 1.3916Group 2 0.9351 0.5996 1.5347 1.3916
Net Revenue EqualisationPaid
30 Nov 2018Paid
30 Nov 2017
Third InterimGroup 1 0.5321 – 0.5321 0.9132Group 2 0.3818 0.1503 0.5321 0.9132
Net Revenue EqualisationPaid
28 Feb 2019Paid
28 Feb 2018
FinalGroup 1 1.3085 – 1.3085 0.7767Group 2 0.4896 0.8189 1.3085 0.7767

LF Woodford Investment Fund | Annual Report 2018
LF WOODFORD EQUITY INCOME FUNDFINANCIAL STATEMENTS continued
DISTRIBUTION TABLES continuedfor the year ended 31 December 2018 - in pence per share
Page 58
Z STERLING ACCUMULATION SHARES
Net Revenue EqualisationAllocated
31 May 2018Allocated
31 May 2017
First interimGroup 1 0.6799 – 0.6799 1.0092Group 2 0.4017 0.2782 0.6799 1.0092
Net Revenue EqualisationAllocated
31 Aug 2018Allocated
31 Aug 2017
Second interimGroup 1 1.7386 – 1.7386 1.5264Group 2 1.0705 0.6681 1.7386 1.5264
Net Revenue EqualisationAllocated
30 Nov 2018Allocated
30 Nov 2017
Third InterimGroup 1 0.6147 – 0.6147 1.0132Group 2 0.4320 0.1827 0.6147 1.0132
Net Revenue EqualisationAllocated
28 Feb 2019Allocated
28 Feb 2018
FinalGroup 1 1.5123 – 1.5123 0.8689Group 2 0.5393 0.9730 1.5123 0.8689

LF Woodford Investment Fund | Annual Report 2018
LF WOODFORD EQUITY INCOME FUNDFINANCIAL STATEMENTS continued
DISTRIBUTION TABLES continuedfor the year ended 31 December 2018 - in pence per share
Page 59
Z STERLING INCOME SHARES
Net Revenue EqualisationPaid
31 May 2018Paid
31 May 2017
First interimGroup 1 0.6057 – 0.6057 0.9298Group 2 0.4880 0.1177 0.6057 0.9298
Net Revenue EqualisationPaid
31 Aug 2018Paid
31 Aug 2017
Second interimGroup 1 1.5404 – 1.5404 1.3956Group 2 0.8746 0.6658 1.5404 1.3956
Net Revenue EqualisationPaid
30 Nov 2018Paid
30 Nov 2017
Third InterimGroup 1 0.5362 – 0.5362 0.9159Group 2 0.3583 0.1779 0.5362 0.9159
Net Revenue EqualisationPaid
28 Feb 2019Paid
28 Feb 2018
FinalGroup 1 1.3139 – 1.3139 0.7797Group 2 0.5280 0.7859 1.3139 0.7797

LF Woodford Investment Fund | Annual Report 2018
LF WOODFORD EQUITY INCOME FUNDFINANCIAL STATEMENTS continued
DISTRIBUTION TABLES continuedfor the year ended 31 December 2018 - in pence per share
Page 60
X STERLING ACCUMULATION SHARES
Net Revenue EqualisationAllocated
31 May 2018Allocated
31 May 2017
First interimGroup 1 0.6601 – 0.6601 0.9879Group 2 0.4255 0.2346 0.6601 0.9879
Net Revenue EqualisationAllocated
31 Aug 2018Allocated
31 Aug 2017
Second interimGroup 1 1.6842 – 1.6842 1.4912Group 2 1.0238 0.6604 1.6842 1.4912
Net Revenue EqualisationAllocated
30 Nov 2018Allocated
30 Nov 2017
Third InterimGroup 1 0.5932 – 0.5932 0.9877Group 2 0.4766 0.1166 0.5932 0.9877
Net Revenue EqualisationAllocated
28 Feb 2019Allocated
28 Feb 2018
FinalGroup 1 1.4593 – 1.4593 0.8453Group 2 0.4308 1.0285 1.4593 0.8453
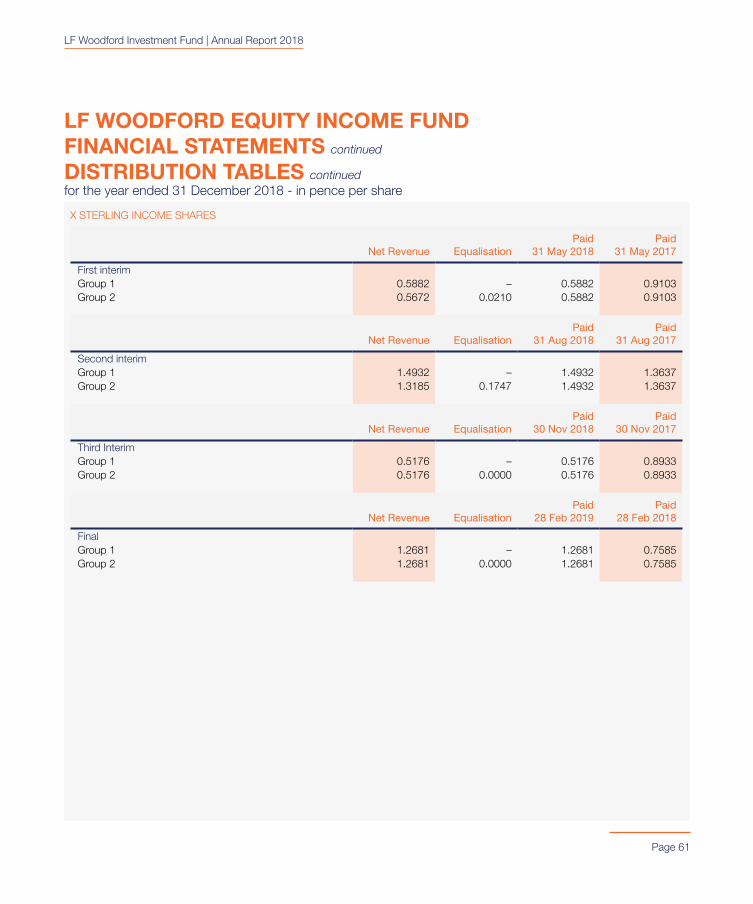
LF Woodford Investment Fund | Annual Report 2018
LF WOODFORD EQUITY INCOME FUNDFINANCIAL STATEMENTS continued
DISTRIBUTION TABLES continuedfor the year ended 31 December 2018 - in pence per share
Page 61
X STERLING INCOME SHARES
Net Revenue EqualisationPaid
31 May 2018Paid
31 May 2017
First interimGroup 1 0.5882 – 0.5882 0.9103Group 2 0.5672 0.0210 0.5882 0.9103
Net Revenue EqualisationPaid
31 Aug 2018Paid
31 Aug 2017
Second interimGroup 1 1.4932 – 1.4932 1.3637Group 2 1.3185 0.1747 1.4932 1.3637
Net Revenue EqualisationPaid
30 Nov 2018Paid
30 Nov 2017
Third InterimGroup 1 0.5176 – 0.5176 0.8933Group 2 0.5176 0.0000 0.5176 0.8933
Net Revenue EqualisationPaid
28 Feb 2019Paid
28 Feb 2018
FinalGroup 1 1.2681 – 1.2681 0.7585Group 2 1.2681 0.0000 1.2681 0.7585

LF Woodford Investment Fund | Annual Report 2018
LF WOODFORD EQUITY INCOME FUNDFINANCIAL STATEMENTS continued
DISTRIBUTION TABLES continuedfor the year ended 31 December 2018 - in pence per share
Page 62
F STERLING ACCUMULATION SHARES
Net Revenue EqualisationAllocated
31 May 2018Allocated
31 May 2017
First interimGroup 1 0.5289 – 0.5289 0.7801Group 2 0.3660 0.1629 0.5289 0.7801
Net Revenue EqualisationAllocated
31 Aug 2018Allocated
31 Aug 2017
Second interimGroup 1 1.3544 – 1.3544 1.1879Group 2 0.9567 0.3977 1.3544 1.1879
Net Revenue EqualisationAllocated
30 Nov 2018Allocated
30 Nov 2017
Third InterimGroup 1 0.4773 – 0.4773 0.8021Group 2 0.3885 0.0888 0.4773 0.8021
Net Revenue EqualisationAllocated
28 Feb 2019Allocated
28 Feb 2018
FinalGroup 1 1.1813 – 1.1813 0.6983Group 2 0.4491 0.7322 1.1813 0.6983
LF Woodford Investment Fund | Annual Report 2018
Page 63
GENERAL INFORMATION
SHARE CAPITAL The minimum share capital of the Company is £1 and the maximum is £100,000,000,000.
STRUCTURE OF LF WOODFORD INVESTMENT FUNDThe Company is structured as an umbrella Company, in that different sub-funds may be established from time to time by the ACD with the approval of the Financial Conduct Authority and the agreement of the Depositary. On the introduction of any new sub-fund or class, a revised Prospectus will be prepared setting out the relevant details on each sub-fund or class.
The assets of each sub-fund will be treated as separate from those of every other sub-fund and will be invested in accordance with the investment objective and investment policy applicable to that sub-fund. The only sub-fund currently available is:
LF Woodford Equity Income Fund
In future, there may be other sub-funds of the Company.
VALUATION POINTThe valuation point of the Fund is 12.00 noon (London time) on each business day. Valuations may be made at other times with the Depositary’s approval.
BUYING AND SELLING SHARESThe ACD will accept orders to buy or sell shares on normal business days between 9.00am and 5.00pm (London time) and transactions will be effected at prices determined by the following valuation. Instructions to buy or sell shares may be either in writing to: PO Box 3733, Royal Wootton Bassett, Swindon SN4 4BG or by telephone on 0333 300 0381.
PRICESThe prices of all shares are published on the website of the ACD: linkfundsolutions.co.uk. The prices of shares may can also be obtained by calling 0333 300 0381 during the ACD’s normal business hours.
OTHER INFORMATIONThe Instrument of Incorporation, Prospectus, Key Investor Information Document and the most recent interim and annual reports may be inspected at the office of the ACD which is also the Head Office. Copies of these may be obtained upon application and, excepting the Instrument of Incorporation, can be found on the ACD’s website, www.linkfundsolutions.co.uk, by following the link ‘Fund Information’.
Shareholders who have any complaints about the operation of the Fund should contact the Administrator in writing. In the event that a shareholder finds the response unsatisfactory, they may make their complaint direct to the Financial Ombudsman Service at Exchange Tower, London E14 9SR.
DATA PROTECTION ACTShareholders’ names will be added to a mailing list which may be used by the ACD, its associates or third parties to inform investors of other products by sending details of such products. Shareholders who do not want to receive such details should write to the ACD requesting their removal from any such mailing list.
Part of Link Group
www 65 Gresham Street London EC2V 7NQ
T 0870 607 2555
F 0870 607 2550
www.linkfundsolutions.co.uk