Embed Size (px)
Citation preview
SECURITY REIMAGINED
REPORT
LEVIATHAN: Command and Control Communications on Planet Earth Black Hat Las Vegas 2014
2 www.fireeye.com
Leviathan: Command and Control Communications on Planet Earth
CONTENTS
Abstract ................................................................................................................................................................................................................................................................................................................................................................. 3
About the Data in this Paper ......................................................................................................................................................................................................................................................................... 3
Introduction ............................................................................................................................................................................................................................................................................................................................................... 4
Definition: What Is a Malware “Callback”? ............................................................................................................................................................................................................4
C2 Techniques: How do Attackers Remain Anonymous?.................................................................................................................................................5
Domains vs. IP Addresses ......................................................................................................................................................................................................................................................................... 5
Port Numbers ......................................................................................................................................................................................................................................................................................................................... 5
Vertical Analysis: Education ................................................................................................................................................................................................................................................................ 6
Vertical Analysis: Government ..................................................................................................................................................................................................................................................... 6
Domain Analysis ............................................................................................................................................................................................................................................................................................................... 6
Interesting Vocabulary!.............................................................................................................................................................................................................................................................................................. 7
Hiding in Plain “Site”............................................................................................................................................................................................................................................................................................................. 8
Strategic Impact .............................................................................................................................................................................................................................................................................................................................. 8
Case Study: Russia/Ukraine: Malware Callbacks Rise as Conflict Deepens ...........................................................17
3 www.fireeye.com
Leviathan: Command and Control Communications on Planet Earth
Abstract Every day, computer network attackers leverage a Leviathan of compromised computer infrastructure, based in every corner of the globe, to play hide-and-seek with network security, law enforcement, and counterintelligence personnel.
This presentation draws a new map of Planet Earth, based not on traditional parameters, but on hacker command and control (C2) communications. The primary data points used in this worldwide cyber survey are more than 30 million malware callbacks to over 200 countries and territories over an 18-month period, from January 2013 to June 2014.
First, this talk covers the techniques that hackers use to communicate with compromised infrastructure across the globe. The authors analyze the domains, protocols, ports, and websites used for malicious C2. They explain how covert C2 works, and how attackers keep their communications hidden from network security personnel.
Second, this talk looks at strategic impact. The authors examine relationships between the targeted industries and countries and the first-stage malware servers communicating with them. Traffic analysis is used to deduce important relationships, patterns, and trends in the data. This section correlates C2 communications to traditional geopolitical conflicts and considers whether computer network activity can be used to predict real world events.
In conclusion, the authors consider the future of this Leviathan, including whether governments can subdue it — and whether they would even want to.
About the Data in this PaperFor this whitepaper, our team analyzed first stage command and control (C2) malware callbacks from FireEye clients around the world. Here is a brief description of our data set:
• 30+ million total callbacks
• 1+ million unique callbacks
• 20+ industry verticals targeted
This information comes from the FireEye Dynamic Threat Intelligence (DTI) cloud, which consists of attack metrics that are voluntarily shared back to FireEye from its clients, who are chiefly large corporate and government organizations.
It is important to note that these are real world data points, and this is not a theoretical analysis. These callbacks were all part of active computer network attacks in 2013 and 2014. Some of them were associated with relatively common malware, but many others were part of highly targeted attacks.
FireEye appliances are normally positioned behind firewalls, intrusion detection systems (IDS), proxies, web filters, and anti-spam technology. In other words, the malware associated with these callbacks successfully bypassed all of those other security tools, which serves to dramatically increase the reliability and credibility of our attack data. These are the types of attacks that corporations around the world are dealing with on a daily basis. None of the domains discussed in this paper were discovered by reverse engineering malware samples, domain generation algorithms, or domains suspected to have been registered by known bad actors.
4 www.fireeye.com
Leviathan: Command and Control Communications on Planet Earth
IntroductionPlanet Earth today benefits from the existence of cyberspace, which allows humans to communicate faster and farther than any previous generation could have imagined. However, malicious code, or malware, currently threatens the integrity of cyberspace. Malware is so easy to disseminate that malicious attackers have built a worldwide malware infrastructure that spans every country and territory on Planet Earth.
This Black Hat white paper analyzes millions of first-stage malware “callbacks” — the command and control (C2) communications between attacker and victim networks — over an 18-month period, from January 2013 to June 2014. The authors demonstrate that simple traffic analysis can be used to discover important patterns of activity, and significant trends in cyber security. At the tactical level, this analysis can help network security administrators to design better defenses. At the strategic level, this white paper can help national security decision makers understand the magnitude of the world’s current computer security challenges.
A map displaying the locations of all the physical crime that happens in the world during the span of one year tends to shock most people when they see how widespread the problem is. We hope that this analysis will do the same for cyber attacks by demonstrating just how common they are.
Definition: What Is a Malware “Callback”?Hello! Bonjour! 你好! Здравствуйте! Yes, that is your computer talking. It is trying to contact its new owner, to say that it was successfully infected with malicious code, and is ready to receive its new master’s commands. The first callback usually occurs as soon as a computer vulnerability has been successfully exploited by an attacker, and they will continue in some form or fashion until the computer has been disinfected or taken offline.
Put simply, a callback is a covert communication from an infected victim computer to an attacker’s command and control (C2) server, and it is one of the most reliable indicators of computer compromise.
In the first instance, a callback is likely to include basic technical information about the newly compromised system, such as Internet Protocol (IP) address, computer name, operating system, username, password, user ID, country location, security software, whether a webcam is available, etc.
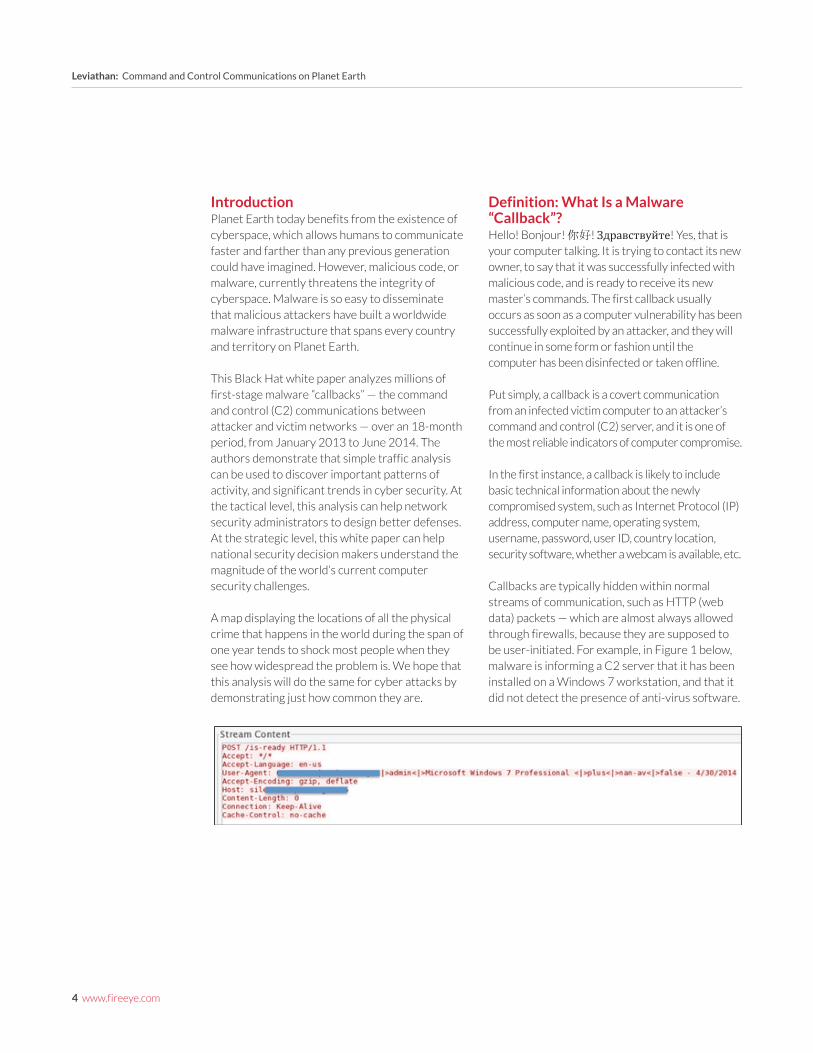
Callbacks are typically hidden within normal streams of communication, such as HTTP (web data) packets — which are almost always allowed through firewalls, because they are supposed to be user-initiated. For example, in Figure 1 below, malware is informing a C2 server that it has been installed on a Windows 7 workstation, and that it did not detect the presence of anti-virus software.
5 www.fireeye.com
Leviathan: Command and Control Communications on Planet Earth
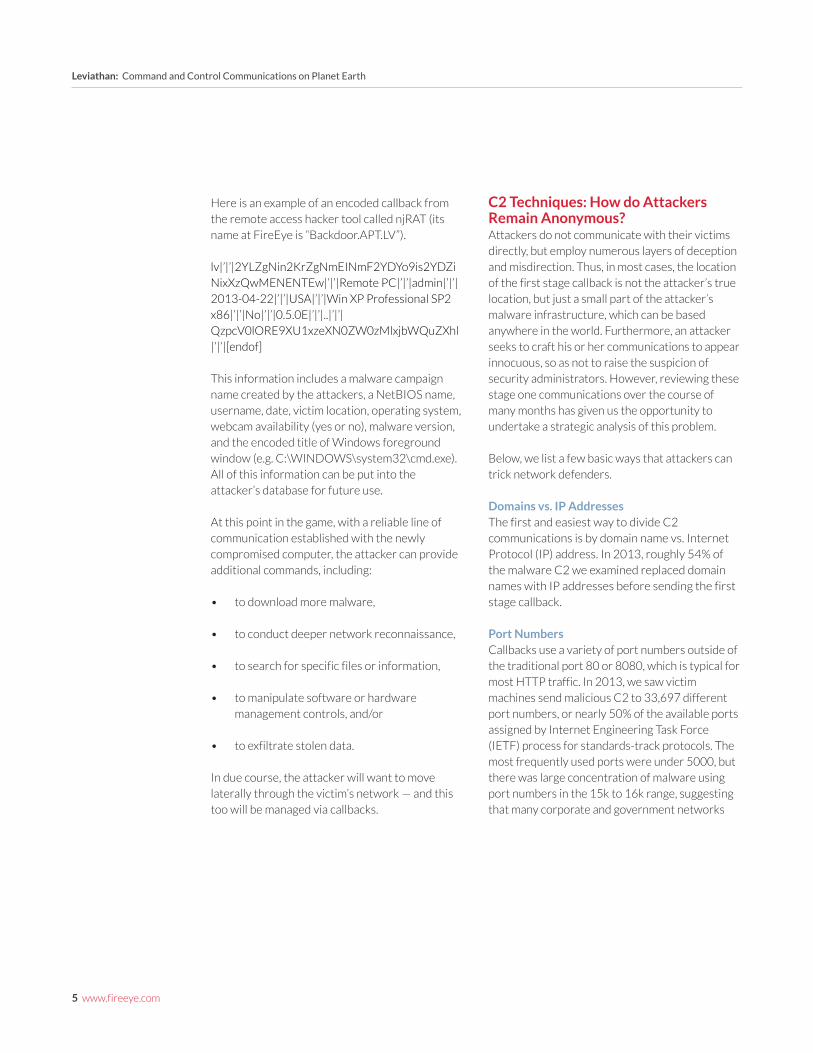
Here is an example of an encoded callback from the remote access hacker tool called njRAT (its name at FireEye is “Backdoor.APT.LV”).
lv|’|’|2YLZgNin2KrZgNmEINmF2YDYo9is2YDZi NixXzQwMENENTEw|’|’|Remote PC|’|’|admin|’|’| 2013-04-22|’|’|USA|’|’|Win XP Professional SP2 x86|’|’|No|’|’|0.5.0E|’|’|..|’|’| QzpcV0lORE9XU1xzeXN0ZW0zMlxjbWQuZXhl |’|’|[endof]
This information includes a malware campaign name created by the attackers, a NetBIOS name, username, date, victim location, operating system, webcam availability (yes or no), malware version, and the encoded title of Windows foreground window (e.g. C:\WINDOWS\system32\cmd.exe). All of this information can be put into the attacker’s database for future use.
At this point in the game, with a reliable line of communication established with the newly compromised computer, the attacker can provide additional commands, including:
• to download more malware,
• to conduct deeper network reconnaissance,
• to search for specific files or information,
• to manipulate software or hardware management controls, and/or
• to exfiltrate stolen data.
In due course, the attacker will want to move laterally through the victim’s network — and this too will be managed via callbacks.
C2 Techniques: How do Attackers Remain Anonymous?Attackers do not communicate with their victims directly, but employ numerous layers of deception and misdirection. Thus, in most cases, the location of the first stage callback is not the attacker’s true location, but just a small part of the attacker’s malware infrastructure, which can be based anywhere in the world. Furthermore, an attacker seeks to craft his or her communications to appear innocuous, so as not to raise the suspicion of security administrators. However, reviewing these stage one communications over the course of many months has given us the opportunity to undertake a strategic analysis of this problem.
Below, we list a few basic ways that attackers can trick network defenders.
Domains vs. IP AddressesThe first and easiest way to divide C2 communications is by domain name vs. Internet Protocol (IP) address. In 2013, roughly 54% of the malware C2 we examined replaced domain names with IP addresses before sending the first stage callback.
Port NumbersCallbacks use a variety of port numbers outside of the traditional port 80 or 8080, which is typical for most HTTP traffic. In 2013, we saw victim machines send malicious C2 to 33,697 different port numbers, or nearly 50% of the available ports assigned by Internet Engineering Task Force (IETF) process for standards-track protocols. The most frequently used ports were under 5000, but there was large concentration of malware using port numbers in the 15k to 16k range, suggesting that many corporate and government networks
6 www.fireeye.com
Leviathan: Command and Control Communications on Planet Earth
were infected by a malware version called ZeroAccess and using these high port numbers for peer-to-peer communications. In the <1k range, we found very limited usage in the 400s, which is often used for Secure Sockets Layer (SSL). An even smaller amount of callbacks used ports in the 50s range, which is normally reserved for Domain Name System (DNS) lookups. Below 100, the vast majority of malware used Transmission Control Protocol (TCP) port 80, most often used by Hypertext Transfer Protocol, or standard Web traffic. The heavy use of port 80 highlights the difficulty of preventing malicious C2 — no organization can adequately monitor this port, much less block it.
Vertical Analysis: EducationWe divided our callbacks into 18 industry verticals, including Education, Government, High-Tech, Finance, Energy, and more. For 2013, one of our most interesting findings was that although Education was #3 on the list of total callbacks by vertical, Education sent by far the highest number of unique callbacks – almost twice as many as Government or High-Tech (#2 and #3 on the list). We believe the reason for this could be a volatile mixture of high intellectual property value combined with a relatively open culture, collaborative culture. The Healthcare vertical was highest on the list of total callbacks, likely due to extremely “noisy” malware calling out many times in succession.
Furthermore, we discovered that the Education vertical (the .edu domain) was also the recipient of many first-stage callbacks from other verticals. As part of our analysis, we checked to see which specific academic departments received the callbacks — the most frequent was the library, and the second was computer science.
Vertical Analysis: GovernmentGovernment domains from over twenty countries were also the recipients of first-stage C2 communications. Africa, Asia, and South America were the regions that had the most government domains used by attackers for callbacks in 2013.
Domain AnalysisTo make their C2 communications appear innocuous to security administrators, attackers use “spoofed” domains in an attempt to lull network defenders into a false sense of security. Often, they seek to blend C2 data into normal corporate network traffic, which can even be sent to entirely legitimate websites for later retrieval.
For this analysis, we saw hackers use just about every trick in the book. We identified the use of spoofed domains that were similar to the top five most visited websites according to Alexa’s Top 100:
• 200+ domains spoofing Google (e.g. “gooqle”);
• 200+ domains spoofing FireFox (e.g. “fireofx”);
• 50+ domains spoofing Facebook (e.g. “faceboak”);
• 100+ domains spoofing Microsoft (e.g. “microsocft”);
• others included “yahoos”, “youtubeta”, and “windosw”;
• and don’t forget the lesson of the dingo and her baby, in which the attacker spoofed the victim’s domain.
7 www.fireeye.com
Leviathan: Command and Control Communications on Planet Earth
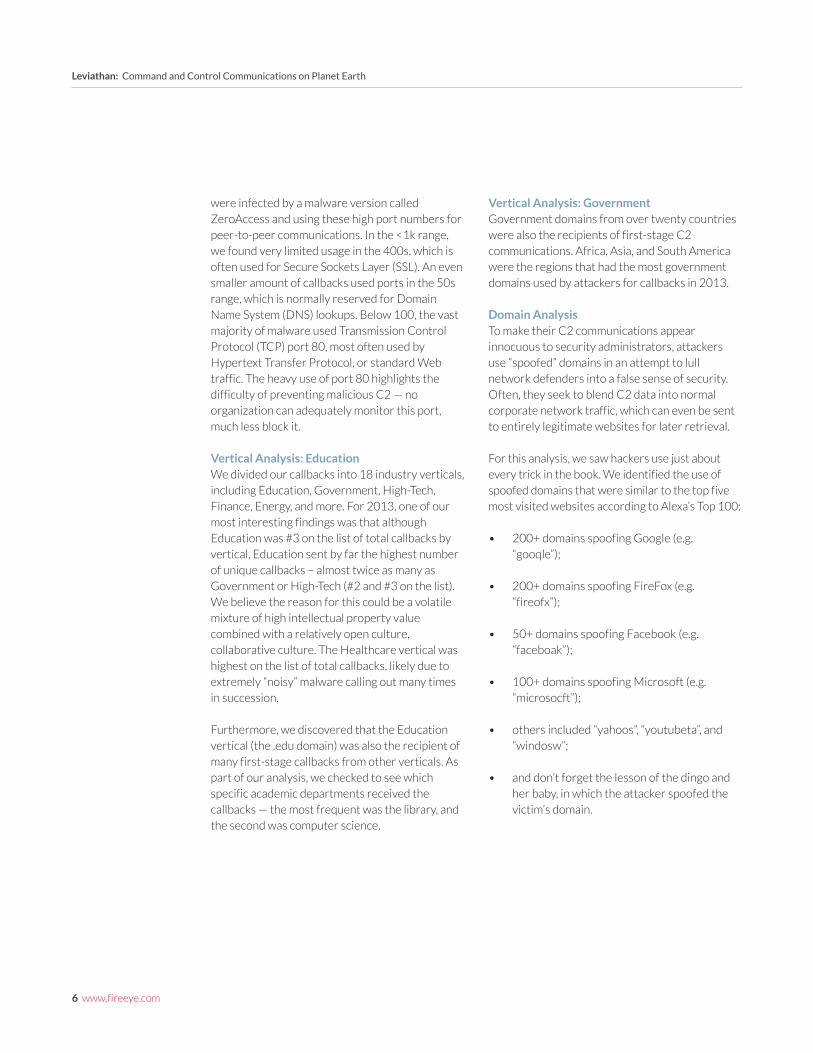
Interesting Vocabulary!The visualization below highlights some of the strange domain names that we found in our C2 data, which clearly include terms that are familiar to network security professionals, such as “heker”, “honeypot”, and “secure”.
8 www.fireeye.com
Leviathan: Command and Control Communications on Planet Earth
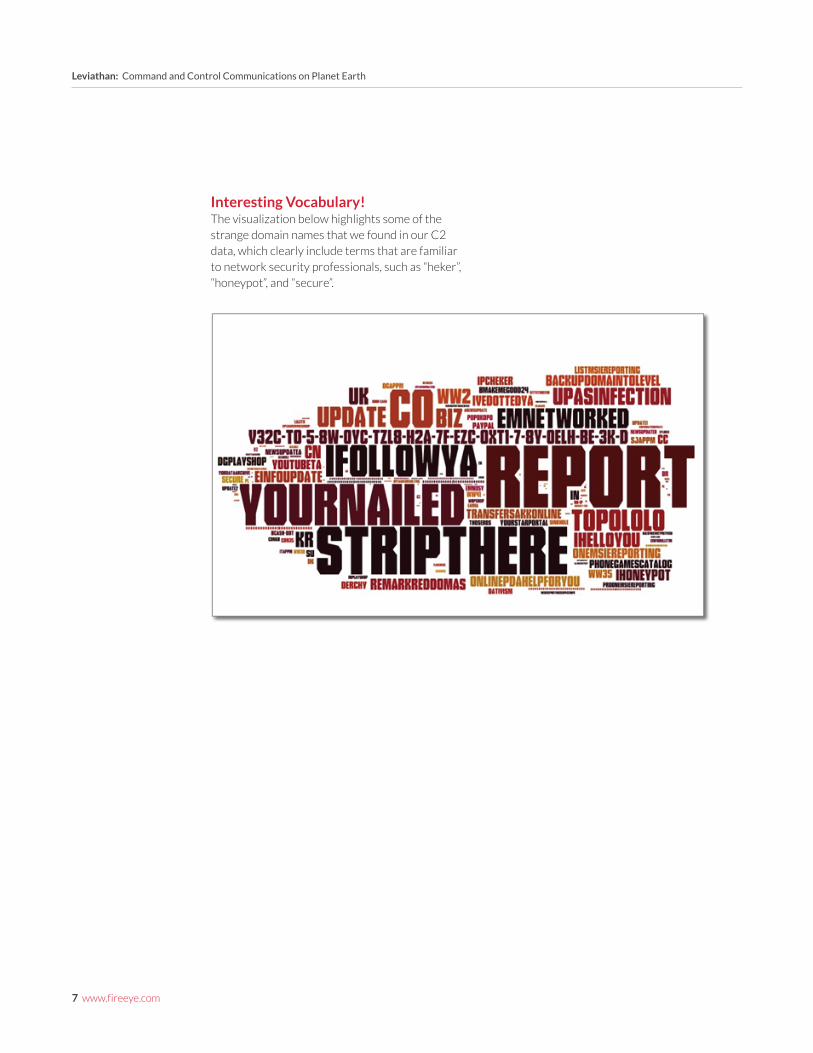
Hiding in Plain “Site”Every malware program can have its own unique way of passing secret information to a C2 server. Covert communications are not limited to Web traffic — they come in virtually any disguise, and can use any protocol or filetype for transmission.
Secret information can even be hidden (encoded and/or encrypted) within non-secret data, a practice known as steganography. For example, this image of North Korean stamps, at one time, also contained malicious, executable code.
Strategic ImpactNow that we have seen what malicious C2 traffic looks like, let’s consider the attackers and their motives. And most important for this research paper, what is the strategic impact of this malware Leviathan?
None of these questions has an easy answer. C2 servers are often merely a first “hop”, or first stage, in a longer chain of compromised computers that together form an infrastructure to anonymize attacker locations, identities, and motives.
Even the world’s most powerful law enforcement and counterintelligence agencies have a difficult time with “attribution” — especially when the attackers operate with nation-state protection.
In fact, cyber attackers range from lone thrill-seeking hackers, to financially motivated cyber criminals, to cyber spies, and even soldiers preparing the “battlespace” for future wars. However, even intrepid network defenders are usually armed with only a few ethereal, technical clues — so it is often not easy to tell the difference between these classes of attacker.
All of this means that today, our malware Leviathan is capable of having a strategic impact
not only in cyberspace, but also in traditional geopolitical space. The attribution problem means that law enforcement agencies often cannot catch criminals, counterintelligence agencies cannot catch spies, and militaries can seed the cyber battlefield with logic bombs absent any sign of traditional deterrence.
But that is not the end of the story, because there is more than one way to skin a cat. This research paper benefits from access to over 30 million C2 communications across an 18-month period (Jan 2013–Jun 2014). Such a large dataset allows for “traffic analysis”, in which it is not always necessary to know the contents of any given message, or its sender’s true name. There is still a lot to be learned from a strategic analysis of traffic volume, frequency, and direction.
9 www.fireeye.com
Leviathan: Command and Control Communications on Planet Earth
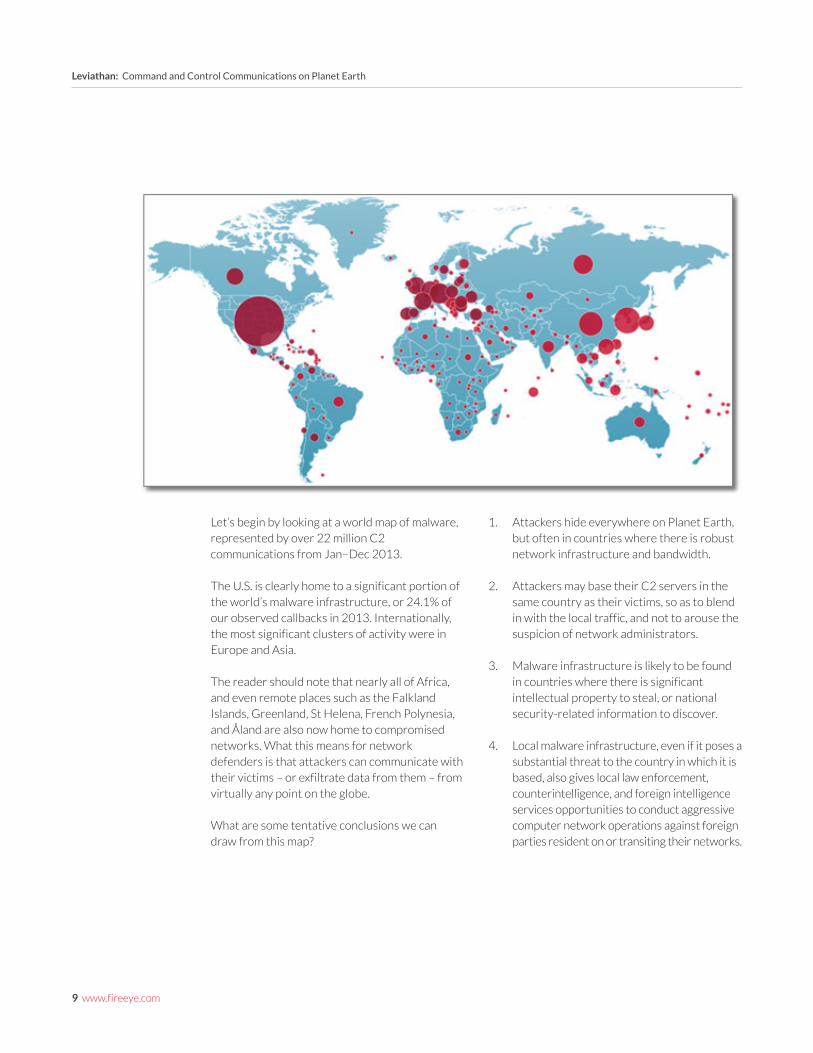
Let’s begin by looking at a world map of malware, represented by over 22 million C2 communications from Jan–Dec 2013.
The U.S. is clearly home to a significant portion of the world’s malware infrastructure, or 24.1% of our observed callbacks in 2013. Internationally, the most significant clusters of activity were in Europe and Asia.
The reader should note that nearly all of Africa, and even remote places such as the Falkland Islands, Greenland, St Helena, French Polynesia, and Åland are also now home to compromised networks. What this means for network defenders is that attackers can communicate with their victims – or exfiltrate data from them – from virtually any point on the globe.
What are some tentative conclusions we can draw from this map?
1. Attackers hide everywhere on Planet Earth, but often in countries where there is robust network infrastructure and bandwidth.
2. Attackers may base their C2 servers in the same country as their victims, so as to blend in with the local traffic, and not to arouse the suspicion of network administrators.
3. Malware infrastructure is likely to be found in countries where there is significant intellectual property to steal, or national security-related information to discover.
4. Local malware infrastructure, even if it poses a substantial threat to the country in which it is based, also gives local law enforcement, counterintelligence, and foreign intelligence services opportunities to conduct aggressive computer network operations against foreign parties resident on or transiting their networks.
10 www.fireeye.com
Leviathan: Command and Control Communications on Planet Earth
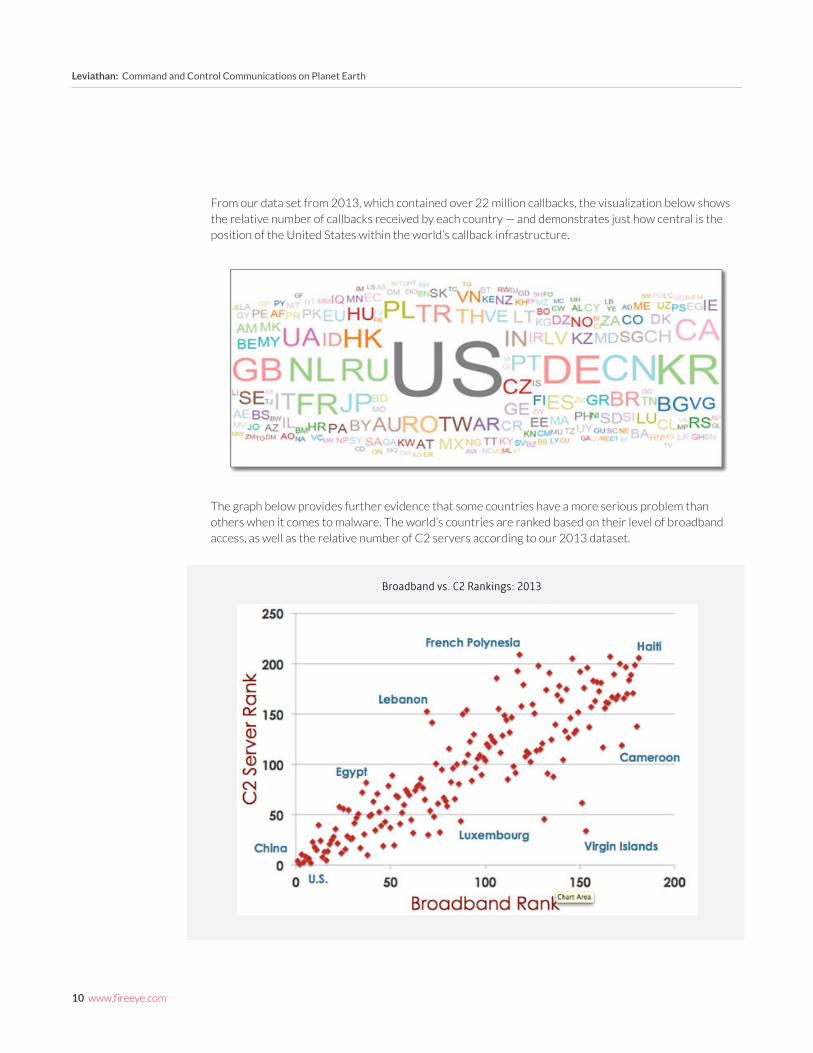
From our data set from 2013, which contained over 22 million callbacks, the visualization below shows the relative number of callbacks received by each country — and demonstrates just how central is the position of the United States within the world’s callback infrastructure.
The graph below provides further evidence that some countries have a more serious problem than others when it comes to malware. The world’s countries are ranked based on their level of broadband access, as well as the relative number of C2 servers according to our 2013 dataset.
Broadband vs. C2 Rankings: 2013
11 www.fireeye.com
Leviathan: Command and Control Communications on Planet Earth
In general, we can see a rough correlation between Internet connectivity and malware infrastructure. However, according to our data, the Virgin Islands have a bigger malware problem than French Polynesia, and Luxembourg has a bigger malware problem than Lebanon. Note that the U.S. and China are tops in malware and in connectivity, respectively.
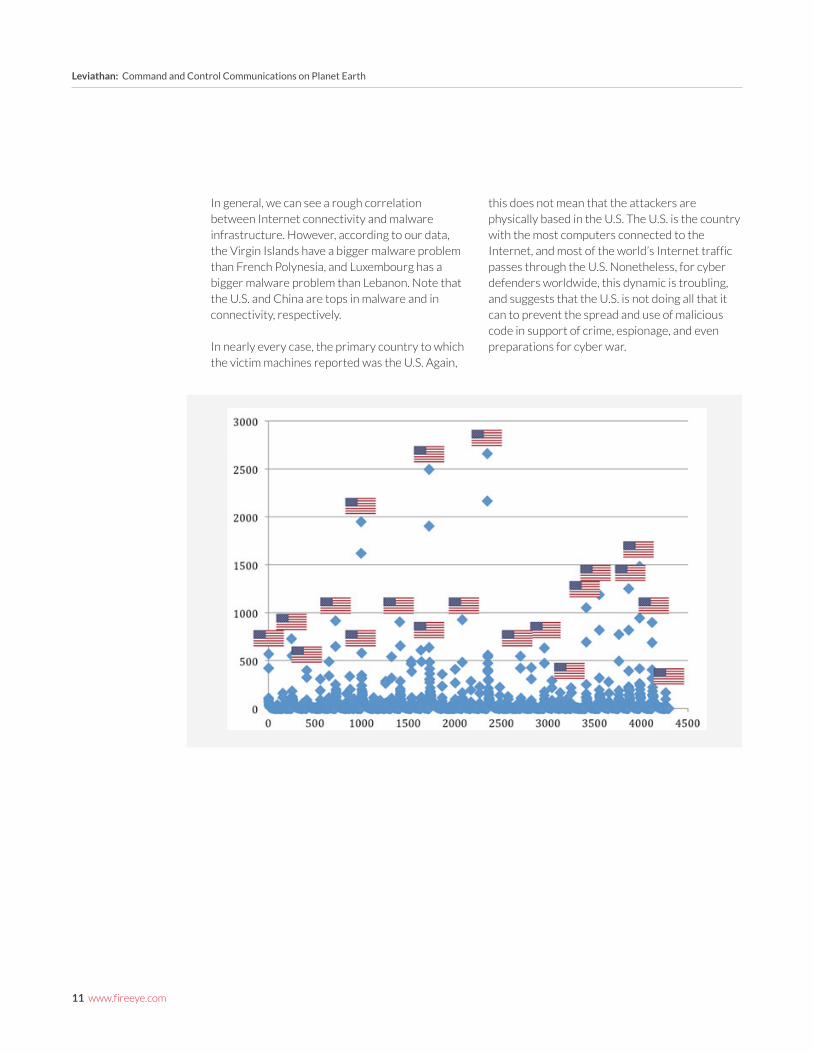
In nearly every case, the primary country to which the victim machines reported was the U.S. Again,
this does not mean that the attackers are physically based in the U.S. The U.S. is the country with the most computers connected to the Internet, and most of the world’s Internet traffic passes through the U.S. Nonetheless, for cyber defenders worldwide, this dynamic is troubling, and suggests that the U.S. is not doing all that it can to prevent the spread and use of malicious code in support of crime, espionage, and even preparations for cyber war.
12 www.fireeye.com
Leviathan: Command and Control Communications on Planet Earth
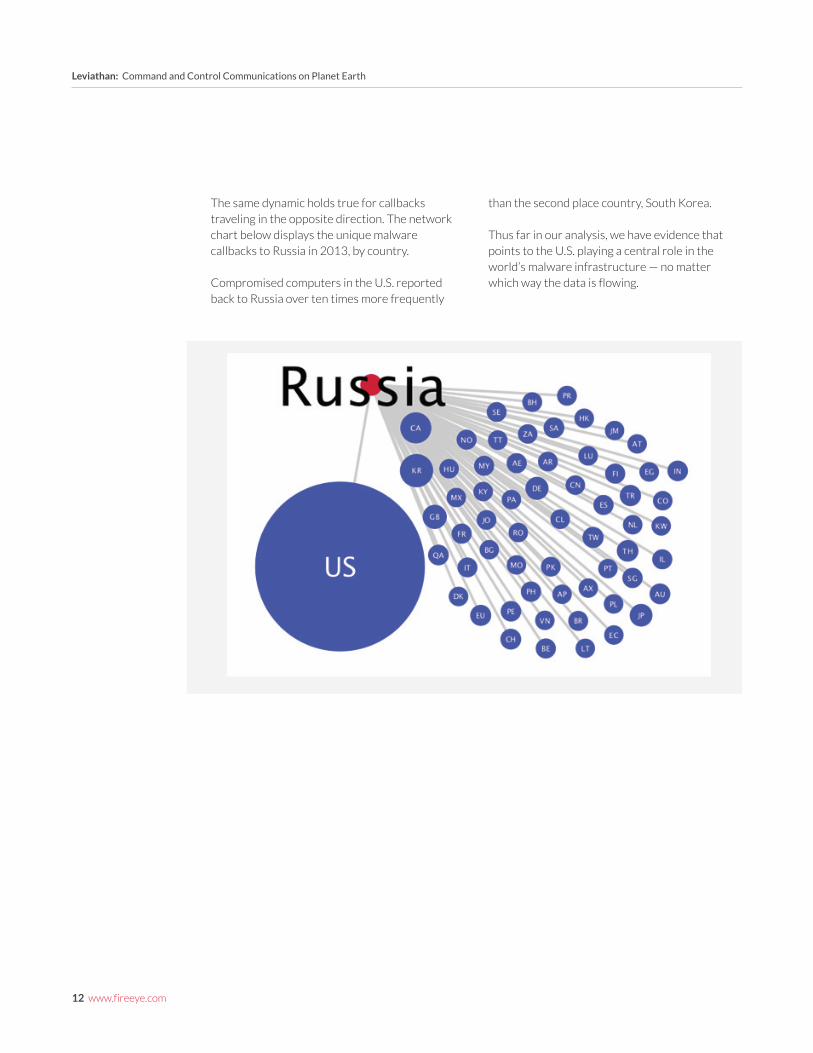
The same dynamic holds true for callbacks traveling in the opposite direction. The network chart below displays the unique malware callbacks to Russia in 2013, by country.
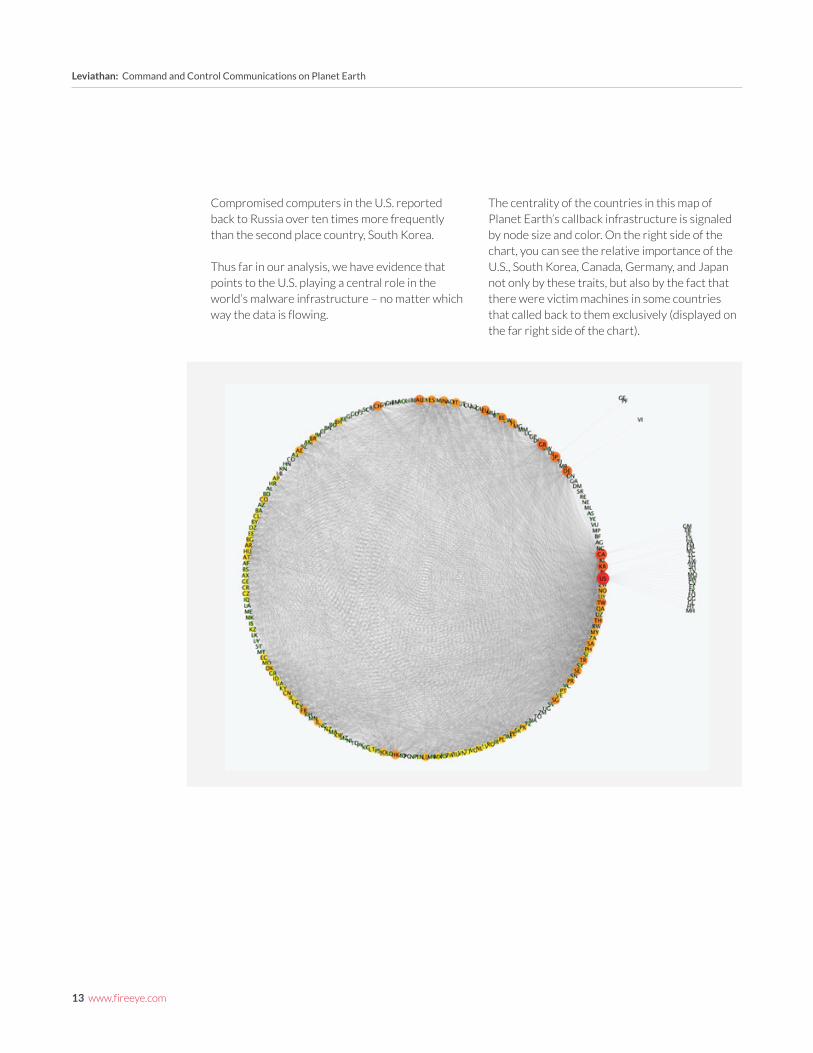
Compromised computers in the U.S. reported back to Russia over ten times more frequently
than the second place country, South Korea.
Thus far in our analysis, we have evidence that points to the U.S. playing a central role in the world’s malware infrastructure — no matter which way the data is flowing.
13 www.fireeye.com
Leviathan: Command and Control Communications on Planet Earth
Compromised computers in the U.S. reported back to Russia over ten times more frequently than the second place country, South Korea.
Thus far in our analysis, we have evidence that points to the U.S. playing a central role in the world’s malware infrastructure – no matter which way the data is flowing.
The centrality of the countries in this map of Planet Earth’s callback infrastructure is signaled by node size and color. On the right side of the chart, you can see the relative importance of the U.S., South Korea, Canada, Germany, and Japan not only by these traits, but also by the fact that there were victim machines in some countries that called back to them exclusively (displayed on the far right side of the chart).
14 www.fireeye.com
Leviathan: Command and Control Communications on Planet Earth
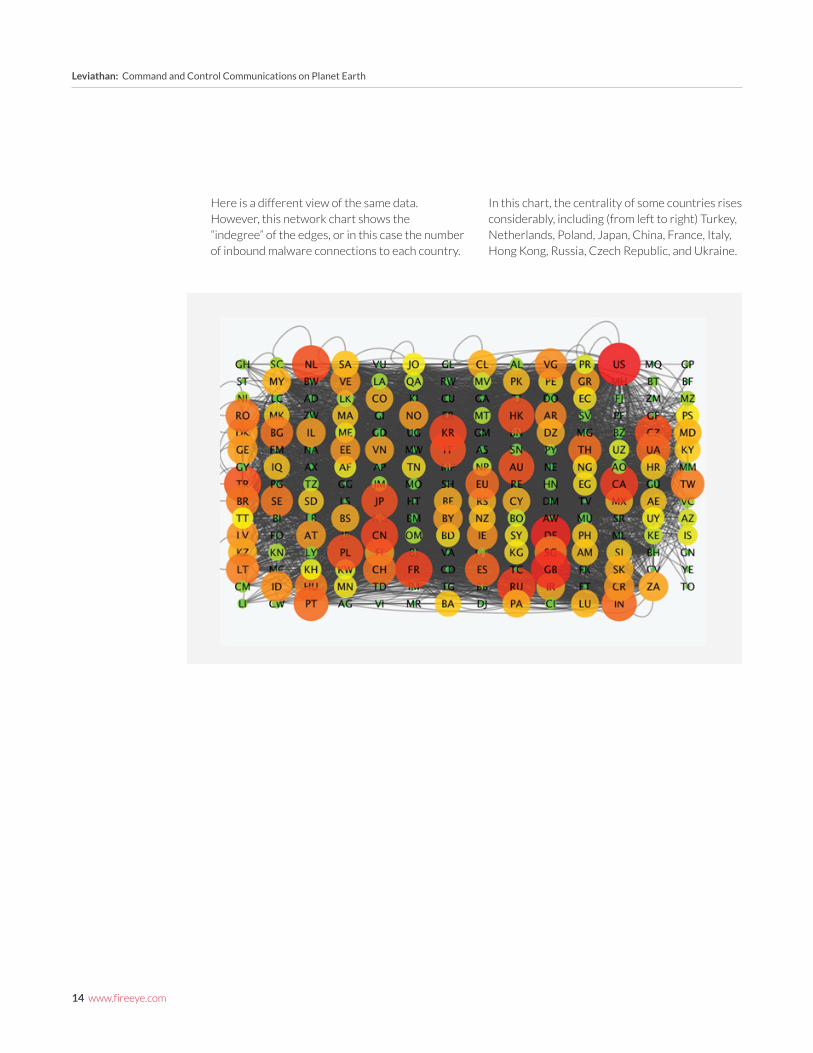
Here is a different view of the same data. However, this network chart shows the “indegree” of the edges, or in this case the number of inbound malware connections to each country.
In this chart, the centrality of some countries rises considerably, including (from left to right) Turkey, Netherlands, Poland, Japan, China, France, Italy, Hong Kong, Russia, Czech Republic, and Ukraine.
15 www.fireeye.com
Leviathan: Command and Control Communications on Planet Earth
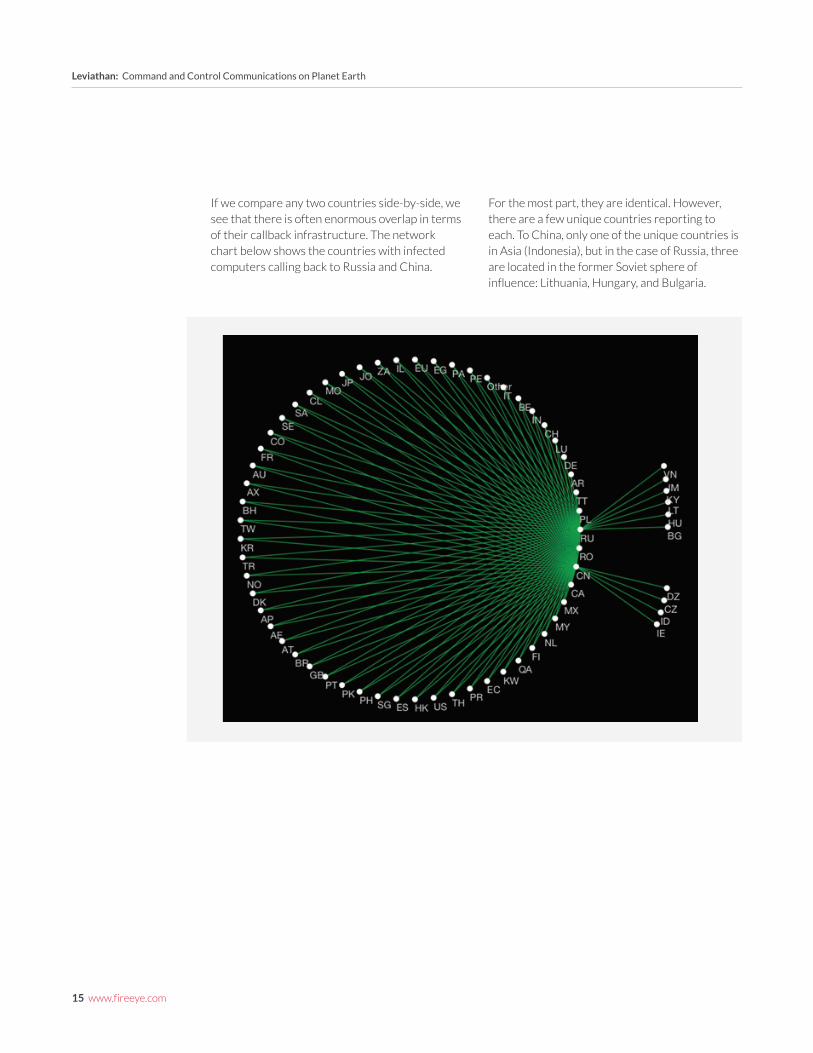
If we compare any two countries side-by-side, we see that there is often enormous overlap in terms of their callback infrastructure. The network chart below shows the countries with infected computers calling back to Russia and China.
For the most part, they are identical. However, there are a few unique countries reporting to each. To China, only one of the unique countries is in Asia (Indonesia), but in the case of Russia, three are located in the former Soviet sphere of influence: Lithuania, Hungary, and Bulgaria.
16 www.fireeye.com
Leviathan: Command and Control Communications on Planet Earth
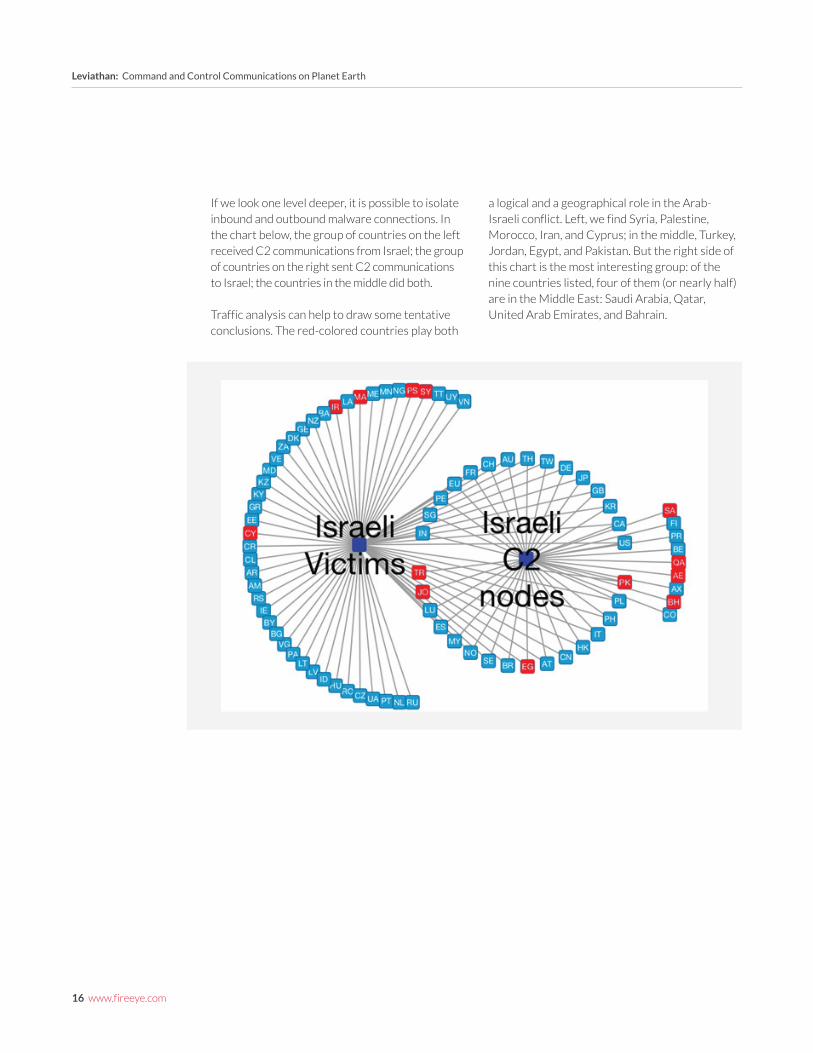
If we look one level deeper, it is possible to isolate inbound and outbound malware connections. In the chart below, the group of countries on the left received C2 communications from Israel; the group of countries on the right sent C2 communications to Israel; the countries in the middle did both.
Traffic analysis can help to draw some tentative conclusions. The red-colored countries play both
a logical and a geographical role in the Arab-Israeli conflict. Left, we find Syria, Palestine, Morocco, Iran, and Cyprus; in the middle, Turkey, Jordan, Egypt, and Pakistan. But the right side of this chart is the most interesting group: of the nine countries listed, four of them (or nearly half) are in the Middle East: Saudi Arabia, Qatar, United Arab Emirates, and Bahrain.
17 www.fireeye.com
Leviathan: Command and Control Communications on Planet Earth
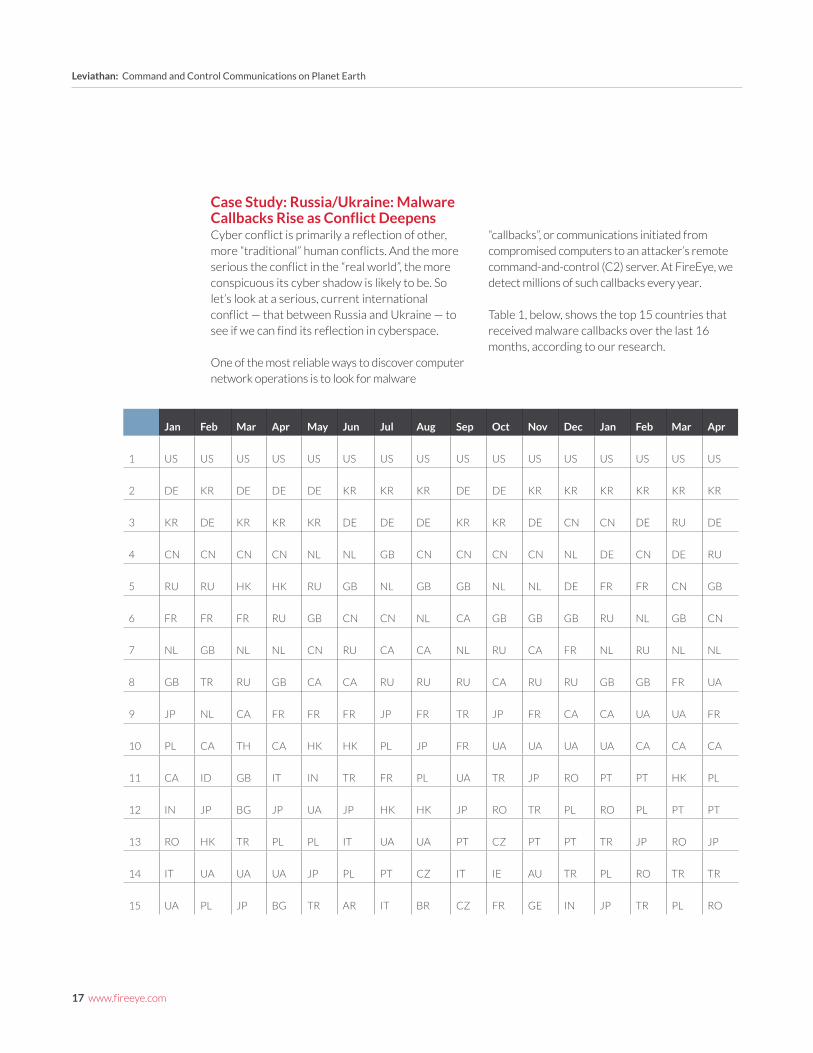
Case Study: Russia/Ukraine: Malware Callbacks Rise as Conflict DeepensCyber conflict is primarily a reflection of other, more “traditional” human conflicts. And the more serious the conflict in the “real world”, the more conspicuous its cyber shadow is likely to be. So let’s look at a serious, current international conflict — that between Russia and Ukraine — to see if we can find its reflection in cyberspace.
One of the most reliable ways to discover computer network operations is to look for malware
“callbacks”, or communications initiated from compromised computers to an attacker’s remote command-and-control (C2) server. At FireEye, we detect millions of such callbacks every year.
Table 1, below, shows the top 15 countries that received malware callbacks over the last 16 months, according to our research.
Jan Feb Mar Apr May Jun Jul Aug Sep Oct Nov Dec Jan Feb Mar Apr
1 US US US US US US US US US US US US US US US US
2 DE KR DE DE DE KR KR KR DE DE KR KR KR KR KR KR
3 KR DE KR KR KR DE DE DE KR KR DE CN CN DE RU DE
4 CN CN CN CN NL NL GB CN CN CN CN NL DE CN DE RU
5 RU RU HK HK RU GB NL GB GB NL NL DE FR FR CN GB
6 FR FR FR RU GB CN CN NL CA GB GB GB RU NL GB CN
7 NL GB NL NL CN RU CA CA NL RU CA FR NL RU NL NL
8 GB TR RU GB CA CA RU RU RU CA RU RU GB GB FR UA
9 JP NL CA FR FR FR JP FR TR JP FR CA CA UA UA FR
10 PL CA TH CA HK HK PL JP FR UA UA UA UA CA CA CA
11 CA ID GB IT IN TR FR PL UA TR JP RO PT PT HK PL
12 IN JP BG JP UA JP HK HK JP RO TR PL RO PL PT PT
13 RO HK TR PL PL IT UA UA PT CZ PT PT TR JP RO JP
14 IT UA UA UA JP PL PT CZ IT IE AU TR PL RO TR TR
15 UA PL JP BG TR AR IT BR CZ FR GE IN JP TR PL RO
18 www.fireeye.com
Leviathan: Command and Control Communications on Planet Earth
Jan Feb Mar Apr May Jun Jul Aug Sep Oct Nov Dec Jan Feb Mar Apr
16 ID RO IT TR PT UA TR IT PL PT HK JP BR CZ JP HK
17 HK IN PL IN BG RO VN TR HK PL PL ES CZ BR CZ CZ
18 TW PA ID TH IT IN RO PT ES IT RO AU IT IT ES IT
19 TR IT LT TW TH AU IN AU BR SE ES EU ES ES BR BR
20 HU TH IN CH RO BG SD TW IN HK IN HK HK HK IT TH
2013 2013 2013 2013 2013 2013 2013 2013 2013 2013 2013 2013 2014 2014 2014 2014
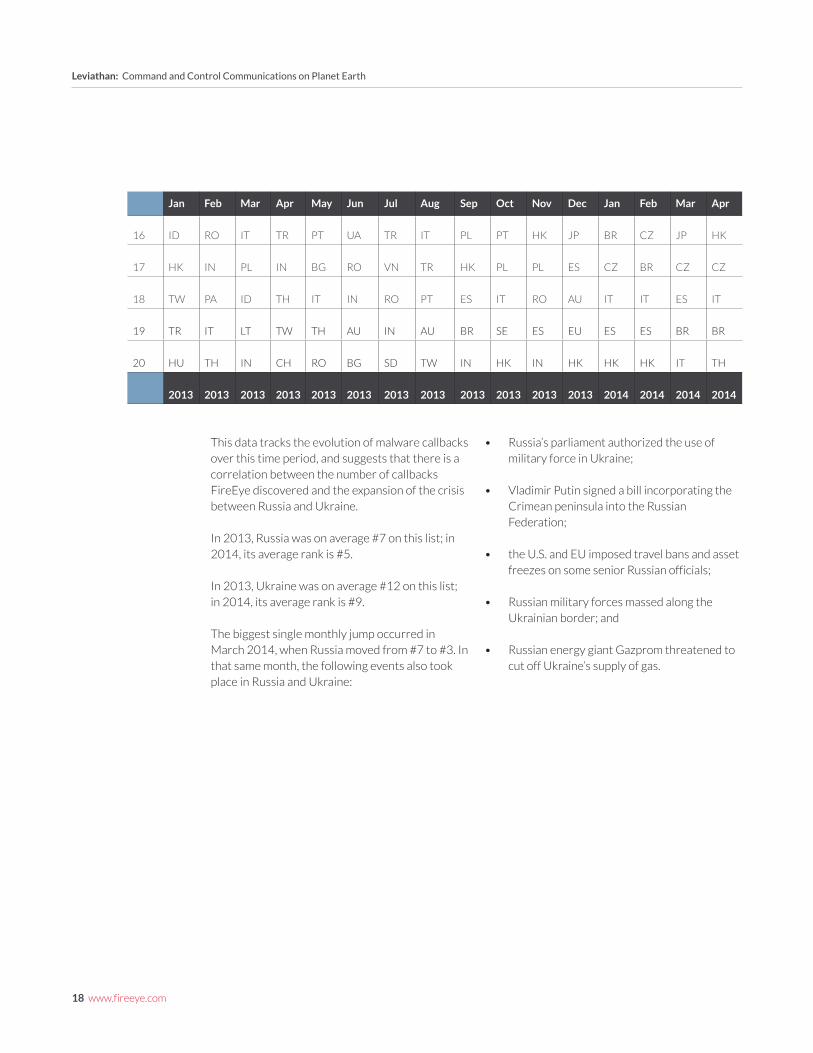
This data tracks the evolution of malware callbacks over this time period, and suggests that there is a correlation between the number of callbacks FireEye discovered and the expansion of the crisis between Russia and Ukraine.
In 2013, Russia was on average #7 on this list; in 2014, its average rank is #5.
In 2013, Ukraine was on average #12 on this list; in 2014, its average rank is #9.
The biggest single monthly jump occurred in March 2014, when Russia moved from #7 to #3. In that same month, the following events also took place in Russia and Ukraine:
• Russia’s parliament authorized the use of military force in Ukraine;
• Vladimir Putin signed a bill incorporating the Crimean peninsula into the Russian Federation;
• the U.S. and EU imposed travel bans and asset freezes on some senior Russian officials;
• Russian military forces massed along the Ukrainian border; and
• Russian energy giant Gazprom threatened to cut off Ukraine’s supply of gas.
19 www.fireeye.com
Leviathan: Command and Control Communications on Planet Earth
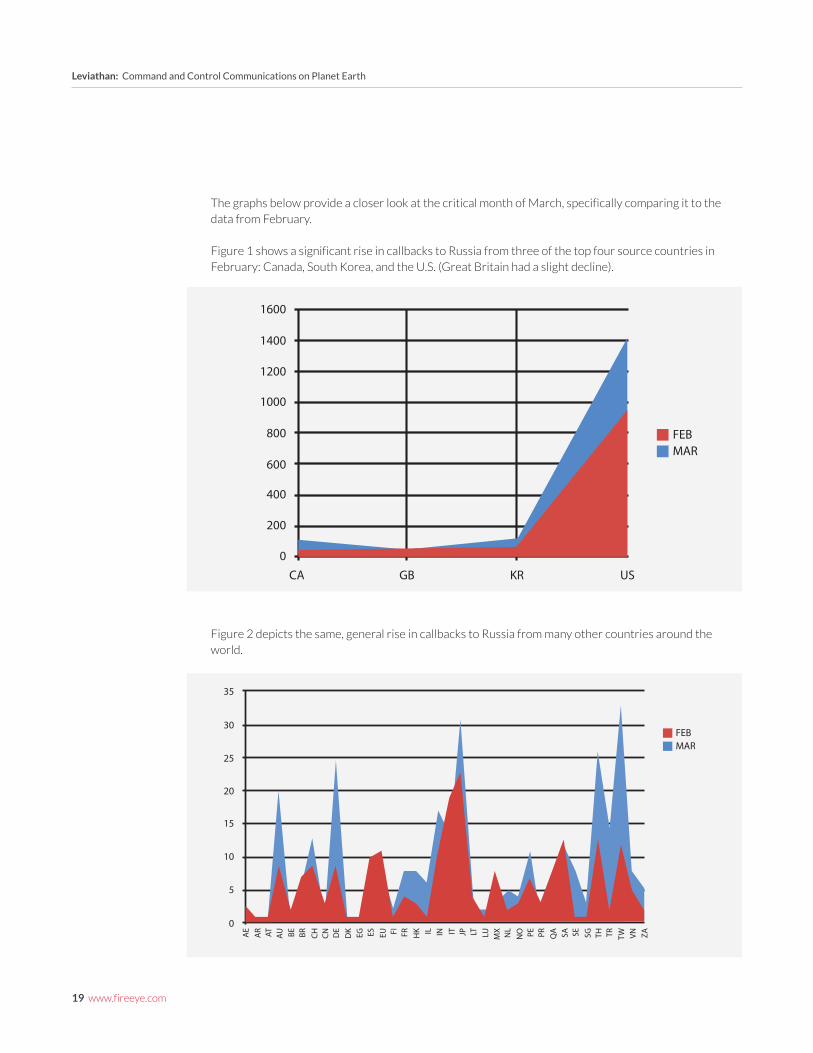
The graphs below provide a closer look at the critical month of March, specifically comparing it to the data from February.
Figure 1 shows a significant rise in callbacks to Russia from three of the top four source countries in February: Canada, South Korea, and the U.S. (Great Britain had a slight decline).
1600
1400
1200
1000
800
600
400
200
0CA GB KR US
FEBMAR
Figure 2 depicts the same, general rise in callbacks to Russia from many other countries around the world.
FEBMAR
35
30
25
20
15
10
5
0
AE
AR AT AU BE BR CH CN DE
DK EG ES EU FI FR HK IL IN IT JP LT LU MX NL
NO PE PR QA SA SE SG TH TR TW VN ZA
20 www.fireeye.com
Leviathan: Command and Control Communications on Planet Earth
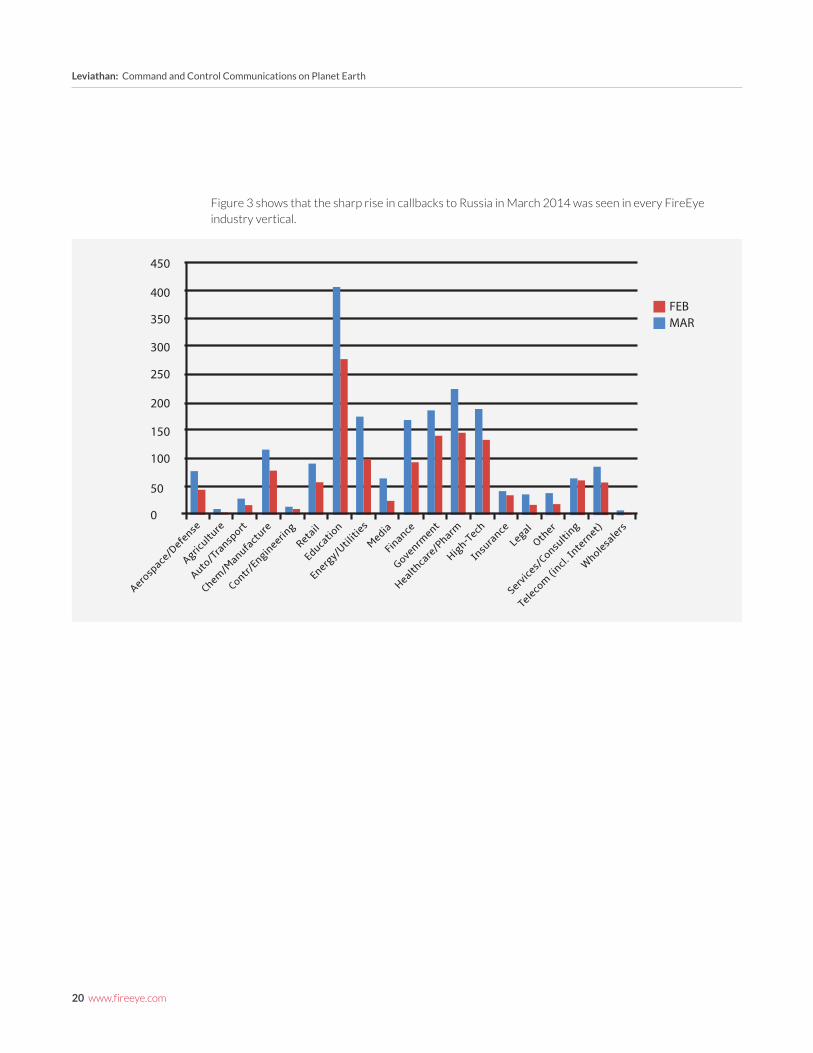
Figure 3 shows that the sharp rise in callbacks to Russia in March 2014 was seen in every FireEye industry vertical.
FEBMAR
450
400
350
300
250
200
150
100
50
0
Aerosp
ace/D
efense
Agricultu
re
Auto/T
ransp
ort
Chem/M
anufact
ure
Contr/Engin
eering
Retail
Educatio
n
Energy/
Utiliti
esMedia
Finance
Govenrm
ent
Healthca
re/P
harmHig
h-Tech
Insu
rance
Legal
Other
Service
s/Consu
lting
Telecom
(incl.
Inte
rnet)
Wholesa
lers
21 www.fireeye.com
Leviathan: Command and Control Communications on Planet Earth
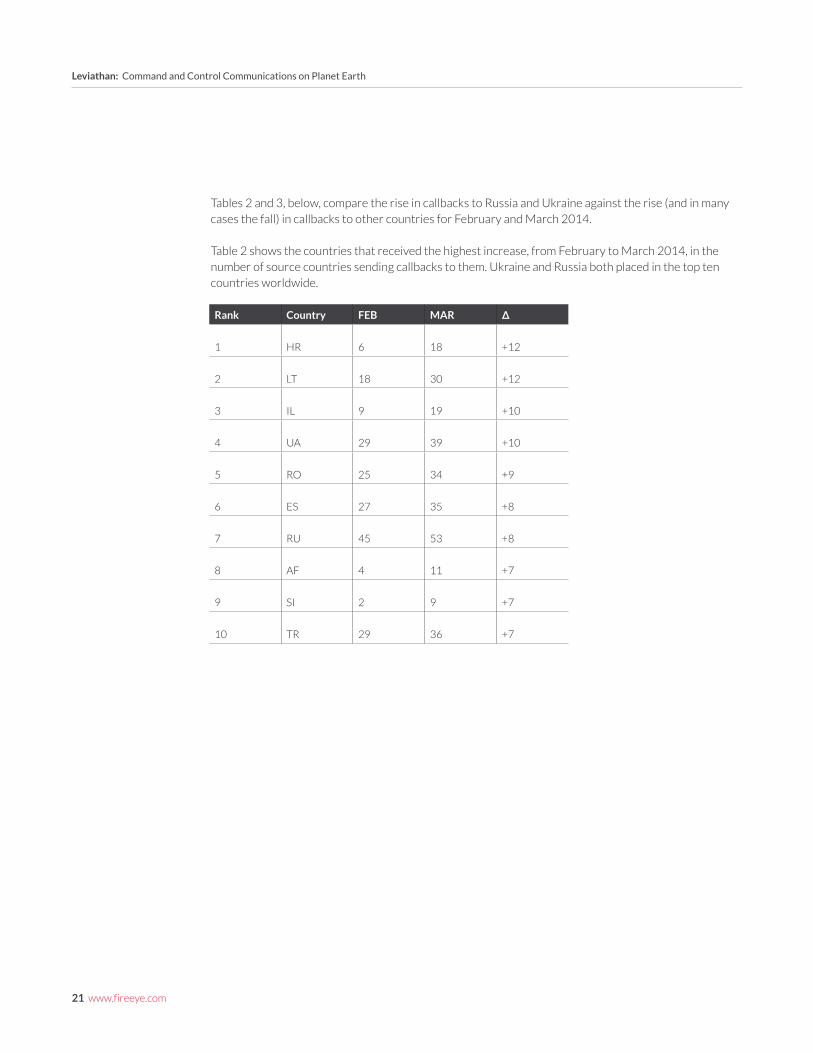
Tables 2 and 3, below, compare the rise in callbacks to Russia and Ukraine against the rise (and in many cases the fall) in callbacks to other countries for February and March 2014.
Table 2 shows the countries that received the highest increase, from February to March 2014, in the number of source countries sending callbacks to them. Ukraine and Russia both placed in the top ten countries worldwide.
Rank Country FEB MAR Δ
1 HR 6 18 +12
2 LT 18 30 +12
3 IL 9 19 +10
4 UA 29 39 +10
5 RO 25 34 +9
6 ES 27 35 +8
7 RU 45 53 +8
8 AF 4 11 +7
9 SI 2 9 +7
10 TR 29 36 +7
Leviathan: Command and Control Communications on Planet Earth
FireEye, Inc. | 1440 McCarthy Blvd. Milpitas, CA 95035 | 408.321.6300 | 877.FIREEYE (347.3393) | [email protected] | www.fireeye.com
© 2014 FireEye, Inc. All rights reserved. FireEye is a registered trademark of FireEye, Inc. All other brands, products, or service names are or may be trademarks or service marks of their respective owners. RPT.LCNC.EN-US.082014
The authors do not attempt to attribute this rise in callbacks to Russia and Ukraine to any real world actor, or to guess the precise motives of the attackers behind them. Within such a large number of callbacks, there are likely to be lone hackers, “patriotic hackers”, cyber criminals, Russian and Ukrainian government network operations, and operations initiated by other nations.
In traffic analysis, it is not always necessary to know the exact content or the original source of communications in order to understand that they are likely to be important. Sometimes, tentative conclusions can be drawn based simply on traffic volume, direction, and/or frequency.
To summarize, we believe that the rise in callbacks to Russia and Ukraine during the first four months of 2014, simultaneous to the expansion of the conflict on the ground, demonstrates that computer network operations are being used as a way to gain competitive advantage in this real world conflict — even without knowing the real world identities of the attackers in question, or their precise motives.
First stage C2 traffic is just one piece of a much larger puzzle, but the strategic analysis of millions of callbacks not only shows how widespread cyber attacks are, but that computer network operations are already playing an active role in national security affairs today.
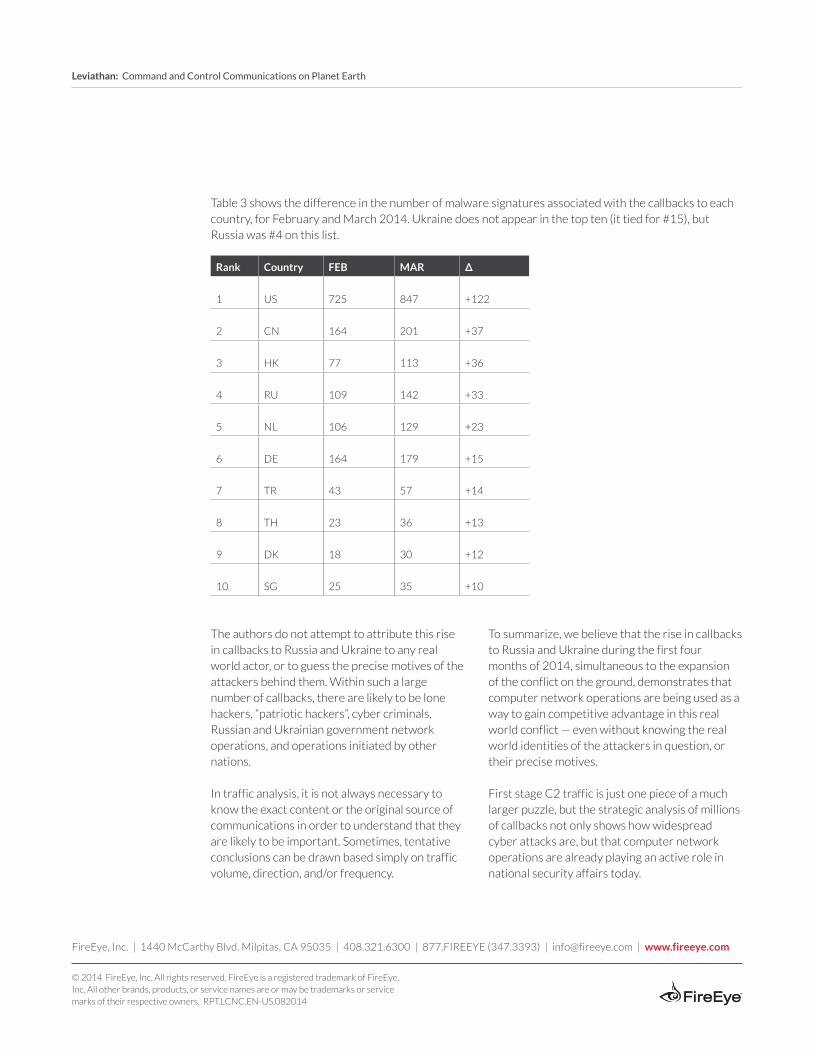
Table 3 shows the difference in the number of malware signatures associated with the callbacks to each country, for February and March 2014. Ukraine does not appear in the top ten (it tied for #15), but Russia was #4 on this list.
Rank Country FEB MAR Δ
1 US 725 847 +122
2 CN 164 201 +37
3 HK 77 113 +36
4 RU 109 142 +33
5 NL 106 129 +23
6 DE 164 179 +15
7 TR 43 57 +14
8 TH 23 36 +13
9 DK 18 30 +12
10 SG 25 35 +10