Embed Size (px)
Citation preview

Leveraging Virtual Reality Technology to Effectively
Explore 3D Graphs
A thesis submitted for the degree of Master of Science (MSc)
by
Daniel Zammit
School of Design and Informatics,
Abertay University.
August, 2020

1
Declaration
Candidate’s declarations:
I, Daniel Zammit, hereby certify that this thesis submitted in partial fulfilment of
the requirements for the award of Master of Science (MSc), Abertay University,
is wholly my own work unless otherwise referenced or acknowledged. This work
has not been submitted for any other qualification at any other academic
institution.
Signed …………………………………………………………..........................
Date………………………………….31/08/2020……………………………….
Supervisor’s declaration:
I, Dr Ruth Falconer, hereby certify that the candidate has fulfilled the conditions
of the Resolution and Regulations appropriate for the degree of Master of
Science (MSc) in Abertay University and that the candidate is qualified to
submit this thesis in application for that degree.
Signed [Principal Supervisor’s signature] …………………………………….
Date………………………………….31/08/2020……………………………….
Certificate of Approval
I certify that this is a true and accurate version of the thesis approved by the
examiners, and that all relevant ordinance regulations have been fulfilled.
Supervisor………………………………………………………………….……
Date…………………………………31/08/2020...……………………………

2
Acknowledgements
My deepest gratitude goes first and foremost to my supervisor and mentor, Dr
Ruth Falconer, without whose help this work would not have been possible. I
would also like to extend my sincere and heartfelt obligation towards Dr Kean Lee
Kang and Mr Matthew Bett who have helped me in this endeavour. Their
knowledge and insight in this research area were invaluable for the completion of
this project. They all provided me with immense encouragement throughout our
regular meetings providing continuous feedback and guiding the direction of this
work. In addition, I would also like to thank Abertay University for providing me
with the equipment to conduct this research.
I would like to thank my classmates for an unforgettable experience at Abertay
University. Special thanks go to Marco Longo who helped me out when the going
was tough. I would also like to thank Mr Adam Hastings for his continuous online
support during the development of the prototype.
Finally, I would like to thank my family for their tremendous support and
encouragement during this year but especially while writing this dissertation. I am
grateful for the time my sisters Hannah and Mariah invested in assisting me to
deliver my best work. Finally, I would like to thank my mother, Silvana who always
inspires me with her unflinching courage, faith and conviction on all facets of life.

3
Abstract
Researchers in varies fields working with 3D graphs still rely on the monitor, a
traditional output device, as the leading means of visualisation for a computer
system. The main reason for this is the fact that researchers are accustomed to
primary input devices, namely the keyboard and mouse to modify and interact
with computer generated content. The aim of this research is to create a prototype
control scheme for an existing project utilising graphs for data exploration and
representation in virtual reality. This paper proposes an alternative medium to
visualise 3D graphs, one that allows free movement and interaction in 3D space.
A virtual reality (VR) graph interaction prototype that integrated with an existing
game application making use of 3D graphs to enable visual interaction in three-
dimensional space was developed. The prototype functionality enabled graph
transformations using grammar operators and property modifiers. A
questionnaire was distributed to participants in order to gather qualitative
feedback on the prototype application after a set of tasks were completed.
The results show that it is possible to use virtual reality technology to efficiently
perform data retrieval tasks using 3D graph visualisations given that training is
provided to users who are unfamiliar with virtual reality.

4
Table of Contents
Declaration .......................................................................................................... 1
Certificate of Approval ......................................................................................... 1
Acknowledgements ............................................................................................. 2
Abstract ............................................................................................................... 3
List of Figures ..................................................................................................... 6
List of Tables....................................................................................................... 7
Acronyms & Glossary ......................................................................................... 8
1. Introduction .................................................................................................. 9
1.1 The Demand for Virtual Reality in Information Visualisation ................ 10
1.2 Research Objectives ............................................................................ 12
2. Background ................................................................................................ 14
2.1 Data Visualisation .................................................................................... 14
2.1.1 Big Data Challenges ......................................................................... 16
2.1.2 3D Graphs ........................................................................................ 18
2.2 Virtual Reality .......................................................................................... 19
2.2.1 VR Technologies .............................................................................. 21
2.2.2 DataVis Applications ......................................................................... 28
3. Methodology .............................................................................................. 30
3.1 Design and Specification ......................................................................... 30
3.1.1 System Overview .............................................................................. 30
3.1.2 Force-directed Graph ........................................................................ 32
3.1.3 Oculus SDK ...................................................................................... 34
3.1.4 Hover UI ............................................................................................ 35
3.2 Questionnaire and Task List .................................................................... 37
3.3 General Constraints ................................................................................ 38
4. Implementation ............................................................................................ 39
4.1 System Configuration .............................................................................. 39

5
4.2 VR Graph ................................................................................................ 40
4.2.1 User Control Framework ................................................................... 41
4.2.2 User Interface ................................................................................... 43
4.2.3 Graph Modifications .......................................................................... 47
5. Evaluation ..................................................................................................... 49
5.1 Application Performance ......................................................................... 49
5.2 User Evaluation ....................................................................................... 53
5.3 Other Observations ................................................................................. 57
6. Conclusion .................................................................................................... 58
6.1 Limitations ............................................................................................... 58
6.2 Future Work ............................................................................................. 59
List of References ............................................................................................. 60
Appendices ....................................................................................................... 69
Appendix A – Participant Information Letter .................................................. 69
Appendix B – Task List .................................................................................. 71
Appendix C - Questionnaire .......................................................................... 72
Appendix D – VRGraph Demonstration Video ............................................... 73

6
List of Figures
Figure 1 - System Component Diagram ............................................................ 31
Figure 2 - Force-directed graph consisting of nodes and edges ....................... 32
Figure 3 - Selecting a node using laser pointer ................................................. 33
Figure 4 - Player hands found in Oculus integration package ........................... 34
Figure 5 - Cursor positions for Oculus Touch controllers .................................. 36
Figure 6 - Oculus Quest VR Kit ......................................................................... 40
Figure 7 - Stereoscopic view showing left and right eye camera ...................... 41
Figure 8 - Oculus Touch scripting definition symbol for HoverUI ...................... 43
Figure 9 - Cursor visual on node ....................................................................... 44
Figure 10 - HoverCast interface ........................................................................ 45
Figure 11 - Operators sub-menu ....................................................................... 46
Figure 12 - Graph Transform sub-menu ........................................................... 46
Figure 13 - FPS Bar Chart ................................................................................ 50
Figure 14 - Unity Profiler ................................................................................... 51
Figure 15 - Rendering Statistics for Graph Order 50 ......................................... 51
Figure 16 - Resource profiling for Graph Order 100 .......................................... 52
Figure 17 - Most connected node results .......................................................... 55
Figure 18 - Secondary node with single connection results .............................. 56

7
List of Tables
Table 4.1 - VR Graph Software ......................................................................... 39
Table 4.2 - Graph functionality using HoverUI .................................................. 47
Table 5.1 - Graph Properties ............................................................................ 49
Table 5.2 - Task List Potential Answers ............................................................ 54

8
Acronyms & Glossary
API – Application Programming Interface
HMD – Head Mounted Display
IDE – Integrated Development Environment
SDK – Software Development Kit
UI – User Interface
VR – Virtual Reality
PCA – Principal Component Analysis
LDA – Linear Discriminant Analysis
FPS – Frames Per Second is used to measure frame rate which provides the
number of consecutive full-screen images that are displayed each second.
Game Object – The base object in Unity scenes, which can represent characters,
props, scenery, cameras, waypoints, and more. A game object’s functionality is
defined by the components attached to it.
Prefab – a special type of component that allows fully configured Game objects
to be saved in the project for reuse. These assets can then be shared between
scenes, or even other projects without having to be configured again.
Scene – contains the objects of the application. They can be used to create a
main menu, individual levels, and anything else. Each unique scene file is a
unique level. In each scene, environments, obstacles and decorations can be
placed, essentially designing and building the application with modular
components.

9
1. Introduction
In recent years, virtual reality has found its way into the mainstream consumer
market. Competition between companies who offer virtual reality (VR) solutions
such as Facebook, Sony and Microsoft drove the price down for consumers which
made virtual reality equipment more affordable. Apart from consumers,
researchers have been finding different ways of applying the emerging
technology to their respective fields. VR provides us with technology that supports
a fully immersive simulation in a virtual world where a user can interact with
objects within that environment (Lindner et al., 2019). The concept of virtual
reality originated from computer graphics in the late 1960s, where Sutherland
described how to achieve a kinetic depth effect by placing 2D images in front of
a user’s retinas (Sutherland, Dec 9, 1968). The surge in research throughout the
last decade has resulted in several patents being filed on consumer grade
equipment, also known as a virtual reality kit. The VR kits provide users with a
display and a set of input devices that are used to interface between the virtual
worlds. There have also been advancements in haptic vests, omni-directional
treadmills and multi-sensory masks to enhance the user experience (Anthes et
al., Mar 2016). Scientific research has also seen an increase in the practical
application of VR in various fields.
Business entities and private sectors rely on immeasurable amounts of
information sources to drive both daily operations and forecasts. Researchers in
various disciplines rely on actionable information extracted from large datasets.
Big data can be described as large amounts of data that requires non-
conventional methods for storing, processing and analysis techniques. While
there is no doubt that big data has several advantages when used in various
areas of research, it needs to be supported with emerging technologies.
Categorisation and visualisation are amongst other challenges with big data,
especially when data emanates from multiple sources. (Najafabadi et al., 2015).
After the data is extracted and prepared, it needs to be visualised and utilised in
data retrieval tasks. In larger companies such as social media and
pharmaceutical enterprises, data tends to be represented in a multi-dimensional

10
format. Data representation is linked to the well-established field of information
visualisation. By using information visualisation tools, intrinsic value can be
extracted from data.
Different types of graphs are used to aid researchers in biomedical engineering,
logistics, service provision and various other specialities to visualise the outcome
of their research. Typically, these take the form of bar charts, pie charts,
histograms and Cartesian graphs. These graphs and charts are ideal for two-
dimensional data representation. However, it becomes increasingly difficult to
extract information beyond this space. In graph theory, graphs are a great
visualisation tool for researchers to represent data and relationships between
objects in non-Euclidian space. Graph drawing consists of edges and vertices
that represent nodes and connections between different data (Tong, 2019).
Screens have been considered the standard medium for visual displays in order
to render all sorts of scientific data. However, when it comes to multi-dimensional
data, information visualisation can take advantage of modern visualisation
technology such as augmented or virtual reality (AR/VR). Both technologies bring
forward the possibility of understanding the spatial relationship between each
parameter in the graph (Yammine and Violato, 2015).
1.1 The Demand for Virtual Reality in Information Visualisation
With virtual reality gaining popularity in the last few years, both academic
institutions and corporations have started experimenting with different ways of
utilising the technology to their advantage. In the field of information visualisation,
virtual reality presents an opportunity that no interaction medium was able to
provide so far: the ability to interact with data in the same space where it is
represented. Information visualisation is the study of abstract data representation
for efficient and effective insight gathering. A major advantage is the
representation of 3D data within the Cartesian coordinate system, including the
z-axis for depth perception. The third axis allows for 3D data to be clearly
represented in its proper form, and with virtual reality operating in three-

11
dimensional space, it is a perfect fit for interaction with data and data retrieval
tasks (Nichols, 2019).
The literature shows that in the early 1990’s, virtual reality was not a viable
solution for interacting with scientific data (Mercurio et al., 1990). The underlying
issues at the time were related to hardware limitations, user interface design and
immature technology. However, it was noted that even with these shortcomings,
users felt that the experience was immersive, which encouraged researchers to
continue working with virtual reality as a novel interface for information
visualisation. An early prototype combining VR with information visualisation
used glyphs to graphically represent data variables (Ribarsky et al., 1994). The
chosen approach resulted in a one-to-one mapping between glyphs and data
objects. According to Ribarsky, due to technical limitations of the technology at
the time, the binding interface had to be redesigned. Similar interface issues were
encountered while creating a tool for word visualisation in three-dimensional
space (Verlinden, Bolter and Van der Mast, 1993). In order to select items in the
virtual world, a point-and-shoot selection mechanism was implemented. Both
Verlinden and Ribarsky were concerned about the ease of using a head-mounted
display (HMD), given it was quite heavy at the time, and the low image resolution,
which would have an impact on the user experience. However, a recent paper
acknowledged that it is a great time to dive back into information visualisation
efforts using virtual reality as the technological advancements have addressed
most of the issues with newer software and hardware (Thomas, 2019). VR kits
currently available are feature complete and easy to set up. Recent models of VR
equipment have addressed the shortcomings of the early prototypes and also
enhanced the holistic user experience, with better display refresh rates, accurate
tracking and input mapping.
Considering this, there is a need for employing novel techniques to leverage the
latest iterations of VR equipment, in order to support the research area with
further prototypes in the information visualisation domain. Researchers have
proposed new techniques that either build on existing solutions or are completely
innovative. The literature shows that in current applications, most interfaces use
head-mounted displays combined with console or alternative controllers (M. Sra
12
and C. Schmandt, 2016). In other research work, traditional input devices such
as keyboard and mouse are paired with head-mounted displays, to take
advantage of stereoscopic display using a familiar interface for interaction
(Sullivan, 2016). In the last few years, scientists have started to experiment and
propose new approaches for applying the full suite of virtual reality technology to
information visualisation. A full kit with head-mounted display and hand
controllers will create the desired immersion and input mapping for a VR
interface. The only limit is the amount of data such a system will be able to handle,
as is the case with big data applications. Depending on the amount of data nodes
to be rendered, visualised and interacted with, both the interface and immersion
should be considered to provide a comfortable experience for the user using the
system, making VR a suitable choice for the information visualisation.
1.2 Research Objectives
The main objective of the dissertation is to propose an interface in virtual reality
that is capable of facilitating and visualising data retrieval tasks using a complete
virtual reality kit with head-mounted display and hand controllers. This will be
required for the interaction between visual graph components in VR by binding
user input to an intuitive control scheme.
To begin with, the research conducted in this work focuses on information
visualisation techniques mentioned earlier. Challenges with big data visualisation
and proposed solutions to address these are reviewed. Moreover, many
applications and techniques researchers implemented using virtual reality
components are discussed, highlighting the main scientific contributions in this
field. Also, in the second section of the literature review, virtual reality systems
are defined. Most work in this field of research has been published in the last
decade or so. Various scientific papers are presented, where the technology has
proven to be an ideal tool for recognising and interpreting the fundamental data
present in a dataset. The last section of the literature review is dedicated on
research related to applications of information visualisation systems and an
overview of virtual reality in this field.

13
The software selection for the prototype is justified. The number of issues in
deployment should be relatively small considering the ease of setting up the
environment. A prototype architecture is devised and the setup is discussed in
more detail in the methodology. A prototype interface is designed and developed
to visualise and offer interaction options with the generated graph, in order to
extract information through data retrieval tasks built around virtual reality. The
proposed system makes use of both new and modified code. Finally, the
prototype is tested by a team of researchers working in the field of information
visualisation to ensure it is functional and that all objectives have been met.
To summarise, the objectives of this dissertation are listed below:
• Research existing data visualisation systems to understand the current
challenges
• Identify intuitive actions required to facilitate data retrieval tasks on the
proposed system
• Design of an ideal user interface in the proposed system
• Designing a proper prototype illustration using a standardised modelling
language such as UML (Unified Modelling Language) diagrams
• Implementation and testing of developed prototype followed by a
discussion on achieved results
• Evaluate whether the proposed VR system is a better alternative to
perform data analysis and retrieval tasks when compared to a traditional
approach

14
2. Background
In this section, the literature on virtual reality systems is discussed. Data
visualisation approaches using conventional media are reviewed together with
big data applications and challenges. Intertwined research is explored covering
recent advancements in both fields.
2.1 Data Visualisation
In research, a common way of depicting results is in the form of graphical
illustrations. Data visualisation is defined as the representation of information in
various formats that allow relationships between data to be revealed (Ginde,
2016). Many types of illustrations can represent data such as bar charts, pie
charts, graphs and others. Data relationships can lead to pattern discovery, which
is essential for business intelligence. In certain instances, the information that
needs to be represented is abstract, which requires meaningful and effective
ways to represent the data. Data visualisation depends on human perception to
be effective. The human brain can identify patterns and relationships depicted by
a visual stimulus. Visualisation tools are a vital aid in data visualisation, as they
reinforce the visual perception and without them certain aspects of the data are
disregarded or misread (Pathak and Pathak, 2020).
According to Fry, the computer science and graphic design elements must be
combined to enable effective data visualisation (Fry, 2008). The data visualisation
process is divided into the following steps:
• Data Acquisition
• Data Parsing
• Data Filtering
• Data Mining
• Data Representation

15
All steps in the data visualisation process have equal value, however mining and
representation are the relevant key processes related to visualisation. Data
mining revolves around the extraction of data such that patterns are revealed,
leading to knowledge discovery (Han, Pei and Kamber, 2011). Data mining
techniques fall under two categories, supervised and unsupervised. In supervised
learning, a dataset is used to train a model with the aim of making predictions on
the output based on the starting parameters (Pathak and Pathak, 2020). Linear
regression, neural networks and k-nearest neighbour are some of the supervised
models used for data mining. On the other hand, unsupervised learning does not
utilise a pre-existing dataset. Instead, the techniques employed use the input set
to identify any patterns within the data.
There are various data visualisation tools that can effectively represent data while
offering a functionality suite for data exploration. A visualisation tool for analysing
benchmark dose (BMD) datasets was developed using Java, a platform agnostic
programming language (Kuo et al., 2016). By using Google Charts and hypertext
markup language (HTML), graphs and other illustrations where displayed through
a browser. A similar tool that displays the resultant graphics in a browser provides
users with exploration and comparison functionality when sifting through MIMIC-
II, a public intensive care database (Lee, Ribey and Wallace, 2016). The design
follows an intuitive and simple approach ensuring quick familiarisation with the
tool. A group of researchers created a data visualisation saliency tool to aid
researchers with the identification of effective graphical illustrations (L. E. Matzen
et al., 2018). The results showed that the saliency maps were able to provide
nearest approximation for areas in an illustration that will most likely attract a
viewer’s attention. However, the tool is limited to static images, excluding any
interaction and motion that can affect a user’s attention. A recent paper reviewed
literature on data visualisation tools for big data, where a research gap was
identified highlighting the absence of a seamless user experience in existing tools
(Lowe and Matthee, 2020). Data visualisation tools were reviewed and
categorised by requirements. The prominent requirements for these tools were
dimensionality reduction and interactivity.

16
2.1.1 Big Data Challenges
While several definitions are present in the literature, researchers agree that Big
Data is a term that describes the collection of unstructured data in large volumes
that is useful for decision making (Gandomi and Haider, 2015). Volume, velocity
and variety are the three main characteristics associated with big data. Decision
making processes enable business decisions through the conversion of high data
volumes into actionable information. Big data originates from websites, social
media, scientific research and recently the Internet of Things (IoT). Humans can
visualise data up to the third-dimension, which strengthens the need for tools that
can reduce multi-dimensional datasets to 2D or 3D (Lowe and Matthee, 2020).
The purpose of dimensionality reduction is to map multidimensional data into a
low-dimensional space, while maintaining the structure of the original data
(Vathy-Fogarassy and Abonyi,2013). Principal component analysis (PCA) is a
popular unsupervised data analysis approach that is used to carry out
dimensional reduction (Tharwat et al., 2017). Using PCA provides an increase in
interpretability, while keeping information loss at a minimum (Feng and Ge,
2018). The result is a representation of data in a familiar 3D space. Preservation
is critical when n-dimensional data is reduced to 2D or 3D graphical
representation (Dzemyda, Kurasova and Žilinskas,2013). Multidimensional
scaling (MDS) is another approach to dimensional reduction, where datasets
containing dimensions of higher order are clustered together and represented in
two or three dimensions (Keck et al., Aug 14, 2017). Contrary to PCA, linear
discriminant analysis (LDA) is a supervised technique that tries to classify data
into classes based on distance calculations, using means and samples of each
class. There are two approaches for these calculations, class-dependent and
class-independent (Tharwat et al., 2017). The former provides a lower
dimensional space for each class, while the latter outputs a space for all data
classes. LDA is limited by the input, as it is only able to work with labelled data
given that it is a supervised approach. In literature, PCA and LDA are generally
applied together to take advantages from both techniques (Genender-
Feltheimer, 2018).

17
Interactivity is the second highest requirement for data visualisation tools (Lowe
and Matthee, 2020). A glove-based VR implementation enabled object
manipulation in a virtual world (Silanon and Suvonvorn, 2011). Hand poses were
tracked and converted to commands after hand characteristics were computed.
The system was able to identify move and click commands which were used to
control the Windows Media Center application. The limitation with hand tracking
is the lack of tactile feedback, resulting in a non-intuitive interaction approach
(Olshannikova et al., 2015). Main efforts on interaction shifted towards the user
interface, in order to provide a set of interaction possibilities that can also be used
and understood by non-professionals (Lugmayr, Grenfeld and Zhang, 2017).
In terms of scalability and readability, modern systems are required to process
raw data faster than ever before (Bikakis, 2018). These systems should offer
customisability options for data exploration within visualisation tools. In addition,
visualisation tools should dynamically adapt to the available resources on the
user’s machine. As big data continues to grow at a rapid rate, real-time
visualisation tools are expected to handle the volume of data without any
repercussions (Agrawal et al., Oct 25, 2015). These may include freezing and
application crashes, which can directly affect the interaction response time.
In most cases, the end users of the visualisation tools are statisticians or
researchers in various scientific fields (Lowe and Matthee, 2020). However, this
trend is slowly changing with modern web-based visualisation tools that are
available for novice users (Lee, Ribey and Wallace, 2016). The purpose of
visualisation tools is to aid the user in identifying data patterns and key elements
based on filtered criteria. Visual cues can be used to provide the user with the
progress, selection and relevant information of the query (M. Behrisch et al.,
2019). Straight line graphs were successful in visualising large datasets within
certain constraints that were based on cloth simulation in game development
(Chonbodeechalermroong and Hewett, 2017). Three-dimensional graph
visualisations can address these challenges while leveraging new media to
enhance the user experience.

18
2.1.2 3D Graphs
Data visualisation in 3D is becoming easier to use and more accessible to novice
users, with tools such as Charts 3D available on Microsoft platforms
(McLaughlin, 2018). Three-dimensional graphs can offer certain advantages for
data retrieval and evaluation, depending on the information the illustration tries to
convey (Siegrist, 1996). A graph is an illustration composed of nodes and edges
that depict the relationships between the represented data elements (Diestel,
2017). In graph theory, a graph can be described by order and size. The former
denotes the number of nodes while the latter represents the total number of
connections in the graph (Pandey, 2017). Neo4j, a graph database platform, was
used to visualise scraped data from Google Scholar. The software was able to
granularly represent relationships between scholarly articles and scientific
journals (Ginde, 2016). A solution was proposed where theory graph exploration
was performed using three dimensions. Using the Unity game engine, different
colours and gradients were used to denote type and direction in the force-directed
graph (Marcus, Kohlhase and Rabe, 2019).
In the visualisation domain, graph drawing is based on force-directed algorithms
to provide aesthetically pleasing visuals and enhance interaction feedback (Lu
and Si, 2020) . In the literature reviewed, 3D force-directed graphs were not as
popular when compared to their 2D counterpart. The force-directed algorithm
(FR) updates the position of graph components based on attractive and repulsive
forces between them (Xu, Yang and Gou, 2018). However, larger datasets suffer
from a computational drawback. As the force-directed algorithm continuously
calculates forces between nodes and connections, the system can be impacted
by nonresponsive symptoms. At its core, the FR algorithm is an uncomplicated
algorithm that requires O(n2) time, where n is the number of nodes or vertices
(Xu, Yang and Gou, 2018). The untouched algorithm follows two main
fundamentals to drive calculations (Fruchterman and Reingold, 1991):
1. Vertices connected by an edge should be drawn near each other
2. Vertices should not be drawn too close to each other
19
As force-directed graphs have the most simplistic approach for graph drawing,
while offering real-time visual updates and interaction, researchers are proposing
innovative ways of exploiting these advantages in modern media (N. Capece, U.
Erra and J. Grippa, 2018) (Westreich, Nattestad and Meyer, 2020). The literature
contains several papers on effective visualisations using virtual reality for graph
exploration, where researchers conclude that virtual reality can be leveraged to
improve both readability and the user experience (A. Pachas-Baños, J. De La
Cruz-Leyva and P. Shiguihara-Juárez, 2019) (Erra, Malandrino and Pepe, 2018)
(Sullivan, 2016).
2.2 Virtual Reality
Immersion systems are designed to enable interaction in various non-physical
worlds through engagements that affect the perceived environment. The two
most popular immersion experiences nowadays rely on augmented and virtual
reality (VR). These technologies have been widely used in the entertainment and
educational industries, providing unique interaction possibilities with digital
media. One of the earliest developments of an immersive system was in the
1950s, when Morton Heilig created the Sensorama, a multisensory theatre that
engaged the user’s senses through wind, sound and 3D visuals (Heilig, Mort,
1998) (Mihelj, Novak and Begus,2014). The experience was tailored around a
virtual bicycle riding experience. The concept was later extended to a multi-
viewer theatre in 1969, which was known as the Experience Theatre (Heilig,
Morton L., 1969). In 1968, Sutherland laid the foundation for viewing virtual
objects in a three-dimensional space using specialised equipment (Sutherland,
Dec 9, 1968). The equipment consisted of a head-mounted display (HMD) with
miniature cathode ray tubes (CRT) displays. This setup was able to provide 40˚
field of view (FOV) and physical room view through half-silvered mirrors located
in prisms. The ultrasonic head position sensor was mounted to the ceiling. The
prototype device offered full rotation and movement within a confined space. The
first interactive environment was developed later in the 1970s and this allowed
users to interact and move objects in VR (Krueger, Gionfriddo and Hinrichsen,
1985). The 2D environment was also the first of its kind to allow simultaneous

20
multi-user interactions. Grope I-III systems were an improvement on Krueger’s
work and allowed users to directly affect objects by simply touching them (Brooks
et al., 1990). Using a haptic device, virtual molecules could be moved around the
screen. Furthermore, users experienced force feedback between forces that
affected the molecules.
Virtual reality refers to the artificial generation of environments using computer
hardware, that enables user interaction and object manipulation in a virtual world
(Lele, 2011). The term was coined by computer scientist Jaron Lanier in 1984
while working at VPL Research, a company that he founded which specialised in
virtual reality hardware and research (Gillen, 1995). During this time, Lanier
pioneered innovative technology which acted as a foundation for modern VR
equipment. VPL Research developed the DataGlove which was a virtual reality
device that allowed interaction with virtual objects. In addition, the company also
created the EyePhone, which was an HMD that enabled a user to be visually
immersed within a virtual world (Sorene, 2014). VR technology continued to
evolve, pushed by research efforts in the scientific visualisation domains. The
Cave Automatic Virtual Environment (CAVE) prototype was first presented to the
research committee during the Showcase Research Event 1993 (Cruz-Neira,
Sandin and DeFanti, Sep 1, 1993). During this event, it was used by
approximately 9000 attendees and only two of these complained of nausea. The
display of images that represented data over time and the improved mechanism
for fast head rotation could have contributed to this small number of negatively
affected users. The CAVE system gained popularity with scientists who worked
in the high-performance computing and communications community. The system
offered high-resolution colour images, frame accurate synchronisation, user
shadow minimisation, frame sequential stereo, distortion correction and occlusion
minimisation. Recently, a paper showed that utilising HMDs can lead to better
information visualisation when compared to CAVE systems (M. Cordeil et al.,
2017). Data retrieval using a head-mounted display was more accurate and faster
when compared to using a CAVE system. With regards to the user experience,
the CAVE suffered from incorrect readings from the head-tracking viewpoint.

21
2.2.1 VR Technologies
The latest innovations in the development of VR equipment have taken the form
of head-mounted displays and CAVE setups. The former has been upgraded to
an all-in-one solution within the VR kit, that handles both position tracking and
input through specialised controllers, such as the HTC Vive (Niehorster, Li and
Lappe, 2017). On the other hand, CAVE is a fully immersive setup contained in
a room consisting of walls covered in screens which display a virtual environment.
A recent application for this setup was used to advance research in the field of
VR exposure therapy (Gromer et al., 2018). VR exposure therapy gives the
patient a simulated experience that can be used to diagnose and treat
psychological conditions such as phobias and post-traumatic stress disorders.
The concept of virtual reality revolved around telepresence and immersion
notions. Slater defined immersion as an ‘objective property of a system, and
higher and lower immersion as the extent to which a VR system can support
natural sensorimotor contingencies for perception’ (Slater, 2018). The sense of
realism would be enhanced by an environment that allowed for physical
interactions and long-lasting modifications. Telepresence was described as the
feeling that a user experienced when the coexistence of both immersion and
interactivity were present in the environment (Ryan, 1999). In literature, people
who experienced VR described the moment as a sensation of being present in
the virtual world (Schuemie et al., 2001). According to Heeter, there are three
types of presence: personal, social and environmental (Heeter, 1992). Personal
presence was described as the ‘extent to which the person feels like he/she is
part of the VE’ (Schuemie et al., 2001). Social presence refers to other objects
that coexist in the environment while the interaction within the environment itself
as a response to user interaction was defined as environmental presence.
Schloerb also construed subjective and objective presence (Schloerb, 1995).
These types of presence were tested using specialised cases to determine
whether the user experience could be classified under one of them. In the case
of subjective, the user must acknowledge their presence in the environment while

22
for objective presence, the user must be present during a task within the virtual
environment.
A user’s visual perception in VR depends on the supported vision system of the
device. In the case of smart phones, VR is most likely limited to monoscopic 2D
image projection, while stereoscopic is common in HMDs. Akin to human vision,
in stereoscopic VR, two images represent the left and right eye view (Monoscopic
vs Stereoscopic, 2019). In 360˚ videos, a sense of depth can be perceived using
different positions for viewing the same scene. On the other hand, there is no
depth in monoscopic VR as both eyes are viewing the same image twice. The
binoculars are a great example of monoscopic vision. Due to the separation
between both eyes, known as the interpupillary distance, stereoscopic VR
creates the most immersive experience (The Cinematic, 2018). The only
downside to stereoscopic recording solutions is the availability and price point
when compared to the monoscopic alternative. An early stereoscopic video
system used in a study showed that stereoscopic systems outperformed
monoscopic systems in task-based training exercises (Drascic, 1991). However,
as users became more experienced over the course of the experiment, the
performance difference between both systems decreased.
Studies indicate that stereoscopic VR was successful in the field of biology when
compared to monoscopic VR. In a study oriented towards the e-learning of the
nasal cavity’s anatomy and physiology, the results showed that stereoscopic
technology was better at representing anatomical details (Remmele, Weiers and
Martens, 2015). In both 2D and 3D visualisations presented, both interaction and
non-interaction types were used. In another paper, high school students were
taught complex biological concepts using a stereoscopic system (Ferdig et al.,
2015). Two studies were conducted; the first related to teaching brain function
and human anatomy using stereoscopic materials and the second study made
use of stereoscopic images to represent cell structure and DNA. Exam results
concluded that students forming part of the stereoscopic images group performed
better. The secondary group also showed a significant improvement in the
anatomy exam.

23
As discussed by Slater, a VR system can be categorised depending on the level
of immersion, perception, HMD technology, real-time capture and sensory
feedback (Slater, 2018). There are three categories under which virtual systems
fall into (Poetker, 2019).
2.2.1.1 Fully-Immersive Systems
A fully-immersive system provides a suite of features that when combined provide
the highest level of realism. HMD, gloves and treadmills are used to receive input
and control the state of the user in the virtual environment. Devices that have
been released in the last decade provide thermal feedback, electrostimulation
and other sensory feedback (Tsyktor, 2019). ThermoReal gives a user the
sensation of being pinched, which can be incorporated in VR applications to
provide an extra layer to haptic feedback (Lai, 2017b). The technology was
displayed at the HTC Vive demo in Shangai, where the device reacted to a video
presentation and altered the temperature at different time queues. The
temperatures varied from cold to warm. Ultrahaptics, a company that specialises
in ultrasound haptic technology, has advanced the research on haptic feedback
using touch (Takahashi, 2016b). One of the recent approaches to using hand
gestures with virtual reality originated from Leap Motion and their solution to
hand-tracking, The Orion (Takahashi, 2016a). Developers at Infinadeck have
constructed omnichannel treadmills that provide users with realistic movement
simulation (Tsyktor, 2019). The system consists of the VR treadmill and an HMD,
which enable users to move in multiple directions while physically walking or
running on the same spot, which solves the space requirement for VR setups.
The TackSuit wireless vest provides haptic feedback for the upper body, with
additional peripherals to cover arms and face (Lai, 2017a). Vibration motors like
those found in game controllers provide feedback through the 87 designated
feedback points on the suit. The future of fully-immersive VR looks bright, with
Elon Musk, a technology entrepreneur, announcing the Neuralink, a prototype
neurostimulation chip that can be surgically implanted in the human brain
(Timmer, 2020). Electrical impulses from the brain cells are analysed and
provided as feedback to the computer system.

24
2.2.1.2 Semi-Immersive Systems
Semi-immersive systems provide a hybrid solution between the real world and
virtual environment. The aim of a semi-immersive system is to provide a digital
image to the virtual world, usually using several horizontally connected displays
(Tysktor, 2019). The system utilises haptic feedback devices and high definition
sound that enhances the immersive experience. They are mostly used to run
simulations of real-world scenarios. For instance, an immersive flight simulator is
utilised by pilots during training (Parsons, 2019). The advantage of such a
system is the safety, easy setup and affordability that it provides, while keeping
a sense of realism as a result of the physical environment. Semi-immersive
systems have been around since the late 1990s, when The Perceptive
Workbench was used in a collaborative martial art fighting game (Leibe et al.,
1999). Combined with an augmented reality device (Sony Glasstron), the system
was able to capture hand gestures from the player which affected the virtual
projection of the game. Apart from education benefits, reworked versions of semi-
immersive systems have also been utilised in construction and entertainment
industries. A case study showed that the use of CAVE style VR for construction
training became more effective over time (Sacks, Perlman and Barak, 2013).
When compared to traditional methods of teaching using slide presentations, the
proposed system maintained the participants attention for a longer duration. In
the entertainment sphere, a 4-wall CAVE system was used in conjunction with a
first-person shooter game (Lugrin et al., 2013). The VR version was compared
to the desktop counterpart, to evaluate the user experience and performance
using metrics as well as questionnaires.

25
2.2.1.3 Non-Immersive Systems
The most common type of non-immersive systems are the everyday computer
visual applications that are used in various fields. The general use of software to
generate 3D images or play a video game classifies as an interaction with a
computer system to affect a virtual world. In a study focused on the feasibility of
memory assessment, immersive and non-immersive experiences were
compared (Ventura et al., 2019). An immersive task was given to the participants
where an HMD was used. A secondary task was completed using a tablet. On
both devices, two 360˚ pictures were displayed, immersive and non-immersive.
The study concluded that for memory ability the utilisation of 360˚ immersion
technology was more efficient. A physiotherapy game was developed to help
patients with neurological impairment, where a non-immersive system using
Microsoft Kinect and Thalmic Labs Myo gesture armband was implemented
(Esfahlani et al., 2018). The aim of the project was to measure the attractiveness
and effect of the non-immersive system. The results showed that physiotherapy
sessions provided during this study managed to provide a desired level of
engagement from participants.
2.2.1.4 VR Hardware
Companies are competing to provide the best affordable virtual reality solution to
their end consumers. The drive to create a light, all in one system that can offer
unprecedented immersion has advanced the research and development for VR
technology. Throughout its history, virtual reality has progressed through
considerable improvements in terms of virtual environment and sensory
feedback. Innovative input controllers and displays have made this possible.

26
Input Devices
The DataGlove was among the first input devices for virtual reality as seen in the
literature. There were several enhancements through the years in the design of
input devices that offered ergonomic improvements without hindering
functionality. For instance, the first version of the Oculus Touch controllers offered
six directions of freedom (6DOF), which enabled tracking and movement in three-
dimensional space (Introducing Oculus Quest, 2018). HTC and Valve controllers
offer similar tracking functionality with the added benefit of finger tracking in the
case of the Valve Index (Robertson, 2019a). On the console front, the top three
console brands have their own virtual reality input devices. In the case of
Microsoft, the Kinect was developed and used for both non-immersive and semi-
immersive simulation (Capece, Erra and Romaniello,2018). Sony has also
developed its own solution to VR, known as the PlayStation VR. The device is
bundled with an HMD and the PlayStation camera to enable both full and semi-
immersion simulations. Regarding input devices, the PlayStation Move’s
strongest features are precision and movement accuracy, when compared to the
Nintendo Wii controllers (Bolton, 2019). However, the Wii remote controller is
familiar, relatively cheaper and more accessible especially for research purposes
(Ringman Olsson, 2011). Specialised controllers such as Reactive Grip and Grifta
offer an additional layer of immersion. The former provides granular haptics
feedback while the latter allows for control scheme modifications and modularity
(Anthes et al., Mar 2016).
Output Devices
Research and development efforts have shifted towards HMDs and CAVE style
systems. Companies in the VR space are competing on high quality displays and
specification for all-in-one systems. This has brought an increase in refresh rate
from previous models such as the Oculus Go. The next evolution in virtual reality
devices is to get rid of attachments such as wires, and become a standalone
system, such as the Oculus Quest (Greenwald, 2019). The disadvantage with
wireless systems is the impact on quality and battery duration. The Quest offers
dual OLED panels with a resolution of 1600x1400. Both the refresh frequency

27
and panel size are lower to compensate for lack of higher processing power in
standalone mode. On the other hand, the Valve Index provides users with the
state of the art technology. Consequently, it is the most expensive consumer
grade HMD solution to date and requires an external PC to stream content
directly to the display (Robertson, 2019b). The dual 1440x1600 LCD panels have
a refresh rate of up to 144Hz, which results in more data being sent to display in
the same amount of time, effectively reducing motion sickness. Other solutions
that offer 3DOF have also been mentioned in the literature, such as Google
Cardboard and Samsung Gear VR, which are popular mobile HMDs for cost-
effective research (Yoo and Parker, 2015) (Webster and Dues, 2017).
Tracking Technology
The fundamental driving force of any immersive VR system is the positional
tracking technology. A true immersion experience depends on the ability to move
within the virtual world. Surrounding objects can move in 3D in of six ways: three
directional axes and three rotational axes. Each of these is called a direction of
freedom (DoF). In virtual reality, DoF describes the axes that are being tracked.
Hardware can monitor any change of angle or distance between different axes
and this results in tracking. This tracking ability is present in both mobile and
standalone VR headsets, such as Oculus Go and Oculus Quest. The technology
is responsible for calculating in real-time where the user is positioned within the
play area (Heaney, 2019). At the start of a VR session, the device initialisation
prompts the user to designate a room-scale area to enjoy moving around and
engage with VR experience. The two most common types of tracking approaches
are highlighted below.
Inside-Out
HMDs have several cameras placed on the front, side and bottom of the display.
The cameras look out, hence the name, to determine the relative position of the
headset within the surrounding environment (Langley, 2017). This is also known
as simultaneous localisation and mapping (SLAM). Each time the user moves,
the sensor recalculates its position to update the player’s avatar in the virtual
28
world accordingly. Both marker and markerless techniques are supported with
this approach (Weis, 2018). As the technology matures, markerless is becoming
more popular as headsets that utilise this approach are cheaper and easier to
setup than their marker counterparts. However, when utilising marker-based
HMDs, base stations need to be set up to passively relay information back to the
headset (Willings, 2019). This allows for multiple headsets to be used
simultaneously within the same play area.
Outside-In
On the contrary to base stations required by marker based inside-out tracking,
the outside-in approach solely depends on external devices to calculate the
HMD’s spatial position (Langley, 2017). The base stations placed around a room
contain cameras that are used to track the headset from an external perspective.
This approach offers the highest level of accuracy, which is normally found in
higher end systems such as the HTC Vive and Valve Index. The major limitation
with this tracking method is the visual range of the cameras. Once the user moves
out of the camera’s range, the tracking is immediately lost.
As already mentioned in the literature, body suits can be used to track individual
body parts and map them onto an avatar in the virtual world (Aguinas, Henle and
Beaty Jr, 2001). In the future, it would be also possible to include eye tracking
functionality through visual displays.
2.2.2 DataVis Applications
Throughout the literature, virtual reality has already been used successfully in
various research domains, including healthcare, entertainment and education
(Schultheis et al., 2007) (Mihelj, Novak and Begus,2014). Specialities that utilise
data visualisation tools can benefit from advantages brought by virtual reality
technology. A news reference dataset was explored using graphs to evaluate the
usability of virtual reality (A. Pachas-Baños, J. De La Cruz-Leyva and P.
Shiguihara-Juárez, 2019). It was concluded that the exploration utilities provided

29
by the system fit the application purpose for data visualisation, which was
recognised by participants as a natural interaction. In colocalisation analysis,
virtual reality offered a three-dimensional environment to interact with microscopy
data (Theart, Loos and Niesler, 2017). User trials concluded that a fully
immersive system increased intuitiveness which led to an increase in productivity.
On the other hand, technology at the time for hand tracking negatively affected
user perception. Large datasets were also explored using VR in the field of earth
science (Zhao et al., 2019). The application provided transformational
functionality and measurement tools. The developed workbench allowed
scientists to view various sights of interests which were otherwise impossible or
too costly to physically visit. Most importantly, several data streams were
consolidated into a single representation. A recent evaluation of the HTC Vive
tracking system was performed to analyse the margin of error (R. Wu et al.,
2020). The researchers conducted the study in order to provide an insight of
expected tracking errors for similar HTC Vive setups in other work. Sullivan
concluded that 3D visualisation in virtual reality can increase the user’s
engagement, if they are familiar with the technology (Sullivan, 2016). An
evaluation into navigation techniques showed that Two handed flying was the
preferred movement approach for sizeable data visualisations (Drogemuller et
al., 2018).
However, further research into this area is required to evaluate the effectiveness
and immersion advantages within 3D graph applications, given that VR
technology has drastically improved over the past few years. HMDs are now more
affordable, while also featuring high class technological components such as
finger tracking on the Valve Index and the recently announced HP Reverb G2
(Lang, 2020). The latter will provide users with state of the art technology at a
cheaper price when compared to the Index, which will improve the resolution and
refresh frequencies of the displays incorporated in the headset.

30
3. Methodology
In this section, the approach taken in the design and development of a virtual
reality prototype for graph visualisation is discussed. The rationale behind the
selection process for both the graph dataset and user interface (UI) is explained.
The VR software development kit (SDK) is identified and a visual asset for
diegetic UI is also integrated. The implementation for the VR interface, graph
information visualisation and interactions are subsequently explained.
3.1 Design and Specification
The initial step for developing a prototype is to draw illustrations that will lay out
a holistic view of the system. A well-known and accepted standard that is used to
design the architecture is explained below. A general system diagram using
unified modelling language (UML) is also presented. The prototype was built
inside the Unity game engine, utilising both Oculus SDK for VR functionality and
HoverUI (Kinstner, 2016) for diegetic user interface.
3.1.1 System Overview
The objective of the prototype was to enable researchers to explore 3D graph
visualisations in virtual reality. This was done by developing an interface that
enables integration between Oculus SDK and HoverUI. Using Unity, the
prototype was expanded on a force-directed 3D graph visualisation application
developed to visualise patterns and connections between data. The dataset that
is provided uses extensible markup language (XML) and a rule-mining machine
learning algorithm for pattern and connection identification.

31
Figure 1 - System Component Diagram
In order to focus specifically on the research scope, the functionality provided by
VR Graph interface is centred around the following key capabilities:
• Determining whether virtual reality is a viable approach to data visualisation
• Providing information on data points that are within visibility
• Providing the ability to modify node and graph properties using a virtual reality user interface
The VR graph application is independent from the dataset. By design, the
prototype application can visualise any dataset provided that the dataset given
conforms to the expected data format. Both the HoverUI and Oculus SDK are
imported as packages into the Unity project, with the latter providing access to
the Oculus Touch controllers through the Oculus application programming
interface (API). As the project seeks to evaluate whether VR can be considered
as a successor to traditional visualisation and interaction techniques related to
information visualisation, the prototype is free to use existing open-source
implementations of custom VR user interface tools. Given that the open-source
tool is widely used by developers in other projects, added value is provided as
the software matures. The functionality provided by HoverUI is compatible with
popular VR brands and their respective SDKs. In addition to hand controllers, the
tool can also take advantage of gaze input for all supported HMDs. By combining
these components together, the VR graph prototype addresses some
shortcomings identified in the literature, particularly those involving user interface
challenges found in these immersive environments.

32
3.1.2 Force-directed Graph
The application utilises a rule-mining machine learning technique that identifies
patterns and connections within a given dataset. In Unity, this is represented by
a 3D graph visualisation. The graph is made up of nodes and links, with the former
representing different pieces of data as white spheres while any associative
connection between them is represented using links. The colour of the link
represents the statistical strength ranging from the strongest association denoted
in red to the weaker association denoted in blue. Statistical metrics derived from
the machine learning process are available to colour the links.
Figure 2 - Force-directed graph consisting of nodes and edges
The graph can be explored by either moving around in the virtual space using the
analog sticks on the Oculus controllers or else by rotating the graph object
through the HoverUI interface. Using a laser pointer, nodes and links can be
identified by their name and related information on the diegetic UI. Clicking on a
node will toggle a highlight on the selected node which acts as a focus point in
the visualisation and prepares the node for logical based selection. The grammar
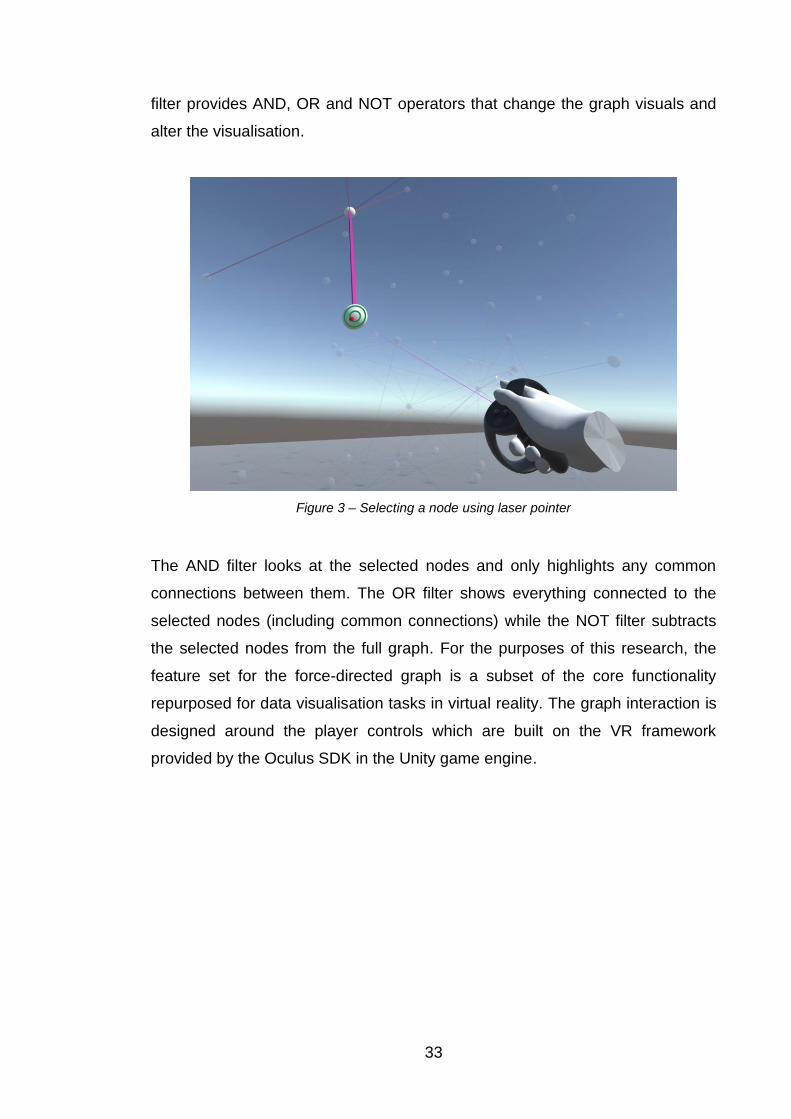
33
filter provides AND, OR and NOT operators that change the graph visuals and
alter the visualisation.
Figure 3 – Selecting a node using laser pointer
The AND filter looks at the selected nodes and only highlights any common
connections between them. The OR filter shows everything connected to the
selected nodes (including common connections) while the NOT filter subtracts
the selected nodes from the full graph. For the purposes of this research, the
feature set for the force-directed graph is a subset of the core functionality
repurposed for data visualisation tasks in virtual reality. The graph interaction is
designed around the player controls which are built on the VR framework
provided by the Oculus SDK in the Unity game engine.

34
3.1.3 Oculus SDK
In order to support virtual reality functionality in the VR graph prototype, the
Oculus SDK was deployed in Unity to set up the development environment. The
Oculus Quest is a midrange virtual reality device that provides great functionality
for researchers and early adopters. The Quest comes with two touch controllers
and an HMD. The built-in cameras provide the inside-out tracking algorithm with
positional data that allows the device to perform simultaneous localisation and
mapping (SLAM). The advantage is that the user can explore the virtual world in
either room-scale or stationary modes, which makes it ideal for researchers to
perform data retrieval tasks daily. The SDK provides integration assets such as
prefabs which are deployable game objects in Unity that contain properties and
functionality.
Figure 4 - Player hands found in Oculus integration package

35
The hand controllers allow the user to move and rotate the player avatar to a
desired position in the virtual world. By design, the movement mechanic utilised
in the prototype aims to immerse the player in the virtual environment by using
first person perspective. In addition, as mentioned in the previous section, the
user can enable selection by hovering on nodes using a laser pointer. The SDK
contains pointer prefabs that have native support with Unity’s UI system, which
is ideal for the prototype. The elements of the graph contain components that are
driven by events, which depend on the UI system. Further explanation is provided
in more detail in the implementation.
3.1.4 Hover UI
The HoverUI toolkit offers a diegetic user interface that provides interaction
options through a dynamic user interface. Designing interactions for virtual reality
applications is a challenging task that the toolkit addresses by providing a balance
between familiar and abstract mechanisms. With a more familiar approach, users
can directly interact with the user interface as it feels natural and intuitive. As the
kit is designed to work with popular VR devices in various scenarios, the interface
presented in HoverUI takes more from abstract design. The toolkit takes into
consideration the technical limitations of the input device such as visual quality
and lack of any feedback during interface interaction from the VR kits. Dynamic
interaction visualisations are aimed to address these issues for VR applications.

36
Figure 5 - Cursor positions for Oculus Touch controllers (Kinstner, 2016)
The UI kit includes interaction cues that enforce the user’s intuition. In addition,
reactive elements make interactions feel less mechanical and livelier.
Customisation options are used to tailor the elements, animations and nested
menus entry points in the radial interface. Cursors are used as an input
mechanism by hovering over different UI elements. A selection event occurs
when the cursor exceeds the timer threshold for selection on the nearby UI
element. Visual indicators provide the user with vital information such as relative
location and progress for an action. As a result, usability is improved, and the
learning curve time frame is reduced.
The interface produced for the VR graph projects a control scheme that allows
for node information and grammar filter display. In addition, graph transform
modifiers are also included in the hover interface. The toolkit allows for changes
to be applied in real time, which also includes transformations applied to the
graph. The diegetic user interface consists of a radial menu placed on the left
touch controller. The interface is designed to be visible only when the user is
directly using or looking at the elements in the radial menu, giving it a holographic
effect. For the scope of the project, the design and implementation of the HoverUI
kit required the dependency of the Oculus SDK, as illustrated in Figure 1.
Interaction capabilities are therefore designed to work with Oculus touch
controllers.

37
3.2 Questionnaire and Task List
A questionnaire was developed to obtain information about the performance and
practicality of using virtual reality for 3D graph visualisation. The questionnaire
was built up from a modified version of the Graph-based Data Visualisation in
virtual reality: A comparison of User Experiences survey (Sullivan, 2016) and
inspired by questions presented in Simulator Sickness Questionnaire (Kennedy
et al., 1993). The questionnaire was created and distributed through Microsoft
Forms. A participant information letter was also included within the form, a copy
of which can be found in Appendix A. Participants were also presented with a
short task list which they were asked to read prior putting on the VR equipment.
A copy of the task list can be found in Appendix B. A questionnaire was presented
after completion of the tasks. The questionnaire consisted of seven questions,
with the first two aimed at gathering demographic data while the remainder were
centred on feedback regarding the experience. The questionnaire can be found
in Appendix C.
The task list was designed around data extraction to evaluate the advantages
and disadvantages of 3D graph visualisations in virtual reality. Tasks 2 and 3
were created with the aim of extracting information from the 3D graph. Other
tasks also allowed for interaction with the graph through the holographic user
interface. From the questionnaire, questions 3 and 4 asked users to identify and
list specific nodes in the graph.

38
3.3 General Constraints
With the addition of a diegetic user interface, some technical challenges were
encountered and addressed in the implementation. As there is no standard to
follow for graph visualisation and interaction, the techniques described in the
implementation were tailor-made for the Oculus Quest and VR graph application.
The development approach closely follows previous work in this area, however
there were significant modifications to create an intuitive user experience for data
visualisation and retrieval tasks.
The quality of motion tracking devices can vary as the technology is constantly
being improved. An input method such as the hover action aims to provide a
simplified interaction approach that does not rely on potential inaccurate tracking
results. The operational workspace can be limited in most cases where actors
from the external environment can hinder other types of VR activities such as
movement. For users who are unfamiliar with virtual reality, certain actions such
as gestures and speed control tend to be difficult to use when compared to a
simpler alternative. As the user becomes more familiar with its use, tasks in virtual
reality become easier to accomplish and more complicated tasks become easier
to perform.
Due to the present COVID-19 safety restrictions, each participant was asked to
use their VR kit in order to prevent contamination of the provided equipment.
Although more participants were interested in this research, they could not
participate as they did not have their own equipment.

39
4. Implementation
VR Graph, the graph visualisation prototype that was developed for this work
relies on the force-directed graph developed in engine and the two additional
components which were imported in Unity. In this chapter the integration with
both components is described. Development approaches for graph visualisation
and information retrieval are justified.
4.1 System Configuration
The prototype was developed using Unity 2018 LTS in order to take advantage
of the long-term support version and the possibility of building on the existing
graph codebase. Oculus VR (OVR) development support was enabled by
importing the Oculus package from the Unity store, which included the utilities
and OVR plugin as internal dependencies. The Unity project was also configured
for VR by configuring the player settings in the editor.
Software Description
Unity v2018.4.23f1 LTS Game engine with long term support.
Oculus Utilities v1.49 Helper package that also provides access to input
API for Touch controllers.
OVRPlugin v1.49 Provides built-in engine editor support and several
core VR features.
Oculus SDK v1.51
Backbone for VR support, offering several vital SDKs
for advanced rendering, sample framework, avatar
development support and others.
HoverUI Kit v2.0.1
User interface for immersive VR/AR experiences.
Modular packages provide selective installation for
different components.
Microsoft Visual Studio 2019 Integrated Development Environment of choice for
developing the prototype.
Table 4.1 - VR Graph Software
40
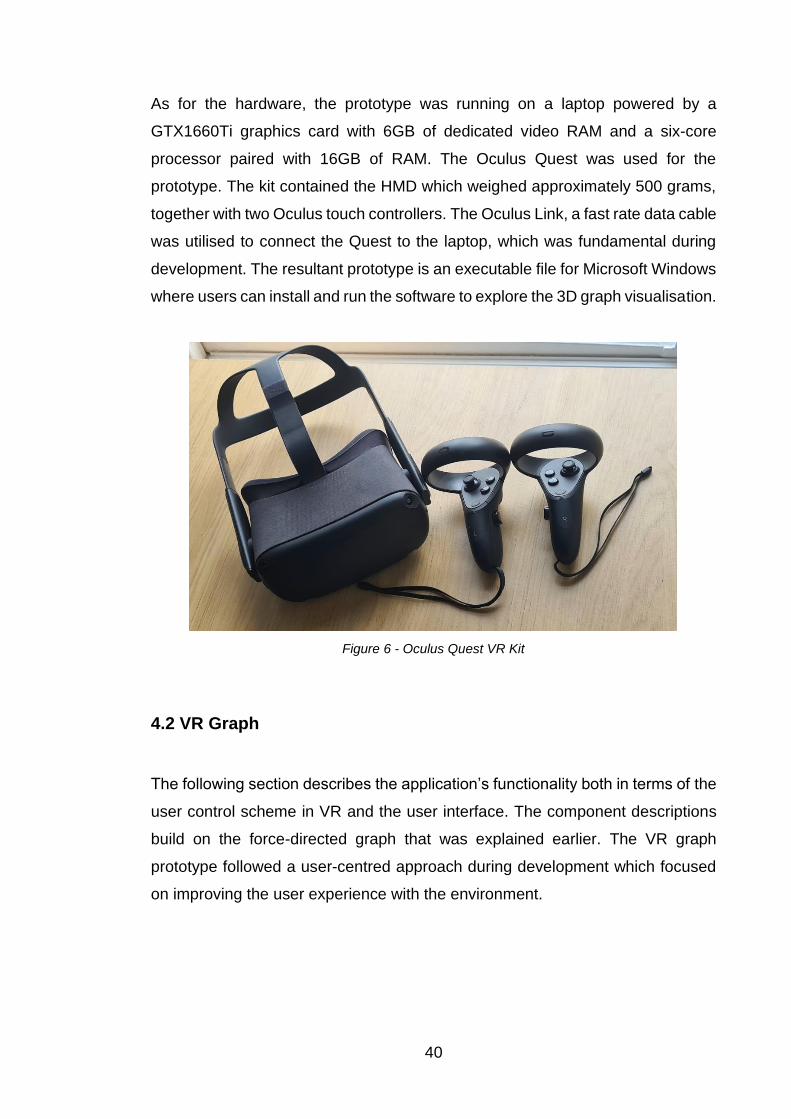
As for the hardware, the prototype was running on a laptop powered by a
GTX1660Ti graphics card with 6GB of dedicated video RAM and a six-core
processor paired with 16GB of RAM. The Oculus Quest was used for the
prototype. The kit contained the HMD which weighed approximately 500 grams,
together with two Oculus touch controllers. The Oculus Link, a fast rate data cable
was utilised to connect the Quest to the laptop, which was fundamental during
development. The resultant prototype is an executable file for Microsoft Windows
where users can install and run the software to explore the 3D graph visualisation.
Figure 6 - Oculus Quest VR Kit
4.2 VR Graph
The following section describes the application’s functionality both in terms of the
user control scheme in VR and the user interface. The component descriptions
build on the force-directed graph that was explained earlier. The VR graph
prototype followed a user-centred approach during development which focused
on improving the user experience with the environment.

41
4.2.1 User Control Framework
OVRPlayerController
Originally, the graph visualisation was designed for traditional input devices
namely the mouse and keyboard. The main camera in the Unity scene was a
dependency for various scripts that dealt with graph interaction, exploration and
selection focus points. In order to change the point of view from third person to
first person for VR porting, the main camera utilised by the 3D graph was
disabled. This was replaced by three new cameras placed under the
OVRCameraRig thus providing the game scene with three new views which
enabled stereoscopic VR. Due to depth perception, a stereoscopic approach
allowed for a more immersive and realistic experience. The OVRPlayerController
prefab, which is the game object in the Unity scene, also contained the tracking
space which handled the rotation and position of the head-mounted display in the
virtual world.
Figure 7 - Stereoscopic view showing left and right eye camera

42
Movement was also scripted and attached to the player game object. The player
script was provided as part of the core OVRPlugin packages and was modified
to allow game management functions to be called using the Oculus touch
controllers. User movement combined two methods known as cloudstep and real-
world space which resulted in the application supporting both seated and room-
scale locomotion techniques. In cloudstep, the user can move in increments at a
constant speed whereas room-scale allows the user to move physically in the
world and maps the position in the virtual environment. The control scheme
allowed for touch controller movement through the thumb stick on the left
controller and rotation on the right controller. Both seated and room-scale
movement methods were functional using this approach. In addition, a
LocalAvatar prefab was added under the tracking space for the player controller.
The LocalAvatar was a dependency for the HoverUI package. A script component
that was added to the OVRCameraRig named “Hover Input Oculus Touch”
established the connection between the virtual player object in the scene and
HoverUI. The default hand models included in the OVRPlayerController prefab
were removed as the local avatar prefab creates an additional pair of hands
during runtime. The hands were used to construct the user interface and apply
cursor renders on each finger.
HoverKit
The HoverKit prefab contained several components that handled the
management of data items imported from the HoverUI package. The prefab acted
as a starting point for HoverUI implementation. Data highlighting, selection and
cursor data providers were all monitored by managers of this component. After
the prefab was imported, the scripting definition symbol was set from the Unity
editor player settings tab.

43
Figure 8 - Oculus Touch scripting definition symbol for HoverUI
In order to link the input touch controllers with the project, the respective input
module was installed under the OVRCameraRig as an additional script
component. The input module connected the HoverKit cursor providers with the
LocalAvatar.
4.2.2 User Interface
In virtual reality, for the user interface to feel natural, it needed to be placed in
world space which meant a different setting configuration when compared to
ScreenSpaceOverlay for the traditional UI. With the new VR cameras in place,
canvases in Unity required a reference to the main centre camera for handling
events. Furthermore, a prefab for interacting with UI elements was added to the
scene.

44
UIHelpers The UIHelpers prefab was used to render a laser pointer in the scene. The prefab
was intended for debugging purposes however it was quite useful for graph
interaction. In Unity, UI interaction was toggled either when game objects had a
canvas or else an interactable shape known as a collider. Nodes had a canvas
component while edges contained colliders which allowed them to be interacted
with by a pointer. The UIHelpers was responsible for converting the standard
pointer to a virtual reality laser pointer. In order to distinguish between the graph
components and the laser pointer, a different colour was used. Furthermore, the
projected ray was only visible when it intersected with expected UI elements. In
addition, it was ensured that there was only a single EventSystem to handle the
user interface, including the cursor visual for nodes and edges. The index trigger
on the right-hand touch controller was set as the default click button.
Figure 9 - Cursor visual on node
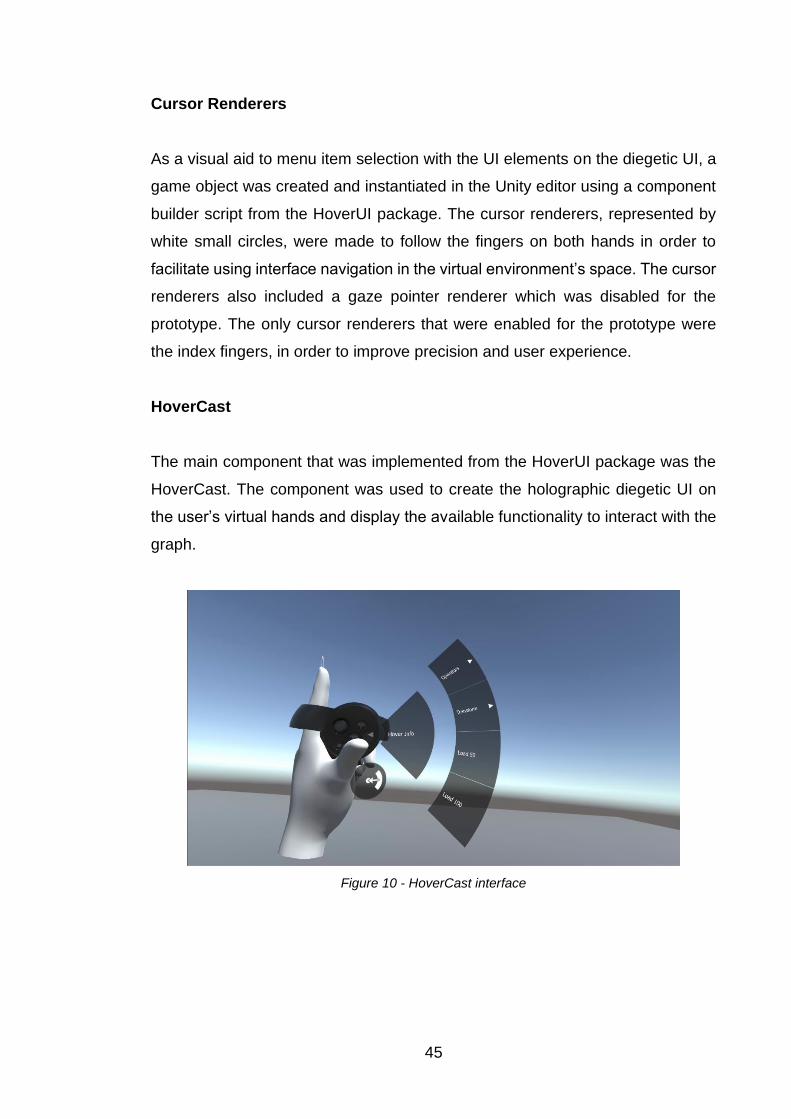
45
Cursor Renderers
As a visual aid to menu item selection with the UI elements on the diegetic UI, a
game object was created and instantiated in the Unity editor using a component
builder script from the HoverUI package. The cursor renderers, represented by
white small circles, were made to follow the fingers on both hands in order to
facilitate using interface navigation in the virtual environment’s space. The cursor
renderers also included a gaze pointer renderer which was disabled for the
prototype. The only cursor renderers that were enabled for the prototype were
the index fingers, in order to improve precision and user experience.
HoverCast
The main component that was implemented from the HoverUI package was the
HoverCast. The component was used to create the holographic diegetic UI on
the user’s virtual hands and display the available functionality to interact with the
graph.
Figure 10 - HoverCast interface

46
The HoverCast operated on two rows to separate different functionality for a
better presentation. The name of the highlighted or selected graph component
was displayed in the placeholder for the root row title. The HoverInfo placeholder
for the nested row titles was changed by listening to events on the nodes and link
prefabs, as explained in the graph modifications below. With regards to selection
handling, the HoverUI provides an interface named ItemDataSelectable which
acted as a generic type for switching between different data such as selectors,
radio buttons and sliders for the prototype.
Figure 11 - Operators sub-menu
Figure 12 - Graph Transform sub-menu

47
HoverUI Function Description
Hover Info Text field for displaying name of graph elements
Load 50 Loads a fully connected graph of order 50
Load 100 Loads a fully connected graph of order 100
Operators
AND
OR
NOT
Highlights only common connections between nodes
Displays everything connected to the selected
nodes (including common connections)
Subtracts the selected nodes from the full graph
Edge Thickness Modifies the connection thickness between nodes
Reset Selection Resets the node selection
Transform
Rotation
Reset Transform
Rotates the graph around its axis
Resets graph transformations
Table 4.2 – Graph functionality using HoverUI
4.2.3 Graph Modifications
There were some minor changes applied to the graph manager scripts which
improved the handling of game objects, exception handling and virtual reality
support. During the population of the graph, nodes and links were placed under
a parent game object for easier management, which was later used to alter the
graph’s rotation. In addition, there were changes to the node and link prefab that
the graph manager used to populate and visualise the graph. For the node prefab,
the UI canvas was scaled down in order to avoid overlap between different nodes
on the graph. Both the link and node prefab had a new Event component added,
which enabled event handling. This was a critical step to port existing functionality
from the original graph codebase to VR.

48
The approach was utilised to ensure that the same laser pointer worked across
all objects in the graph visualisation. The colliders on the nodes were used to
trigger functionality related to the current state of the pointer, whether hovering
or clicking the nodes. These changes were also reflected in scripts that handled
the updated information on the currently highlighted graph object.

49
5. Evaluation
Two different evaluation approaches were undertaken in order to evaluate the
potential of graph visualisation and interaction using virtual reality. Firstly, the
application performance was measured in the Unity engine by performing various
tests. Several components that make up the prototype were tested using built-in
debugging techniques and profiling tools in Unity. Secondly, a questionnaire
together with an application executable and a task list was sent out to several
users. By using their virtual reality equipment, participants were asked to carry
out a set of tasks centred around data retrieval and graph interaction.
5.1 Application Performance
The VRGraph prototype is configured to run at a frequency of 72Hz, to match the
native refresh rate of the Oculus Quest. During testing, the application was able
to reach the desired frequency on the development machine. A performance
measure for the application was used to determine whether the application can
handle graphs of a higher order. For the purposes of this research, two fully
connected graphs could be loaded into the application. The user interface
provided an option to load either a smaller or larger sized graph.
Graph Order Graph Size
50 93
100 232
Table 5.1 – Graph Properties
When the selected graph was loaded, the frames per second (FPS) were
recorded. FPS was used to measure performance to check whether the
application is scalable. Given that the graphs are force-directed, attractive forces
between edges and nodes were calculated on every frame update. In order to
explore the graph without constant graph transformations occurring between

50
nodes and edges, a freeze update function was introduced to stop all physics
calculations on the graph. When the functionality was enabled, the graph would
freeze in position which made it easier for a user to explore. With this functionality
in place, two FPS readings were taken; before and after the freeze function was
enabled. The expected result was to have a higher FPS value when the freeze
function was toggled.
Figure 13 - FPS Bar Chart
The bar chart above compares the FPS of the two different graphs before and
after the physics calculations were turned off. The application performed better
when a graph of a smaller order was selected. On the other hand, the
performance of the application was approximately reduced by half when the
graph of order 100 was loaded in. From these results, it can be noted that graphs
of higher order will cause the application to slow down. This can lead to an
increase in motion sickness while using the application as the game refreshes
almost two times slower. When physics were toggled on, the highest delta of 7
FPS was recorded on the Order 100 graph. However, when compared to the
smallest change in FPS for the smaller sized graph, the difference is negligible
as it did not have a significant impact on the overall performance in both cases.
36
73
29
68
0 10 20 30 40 50 60 70 80
Order 100
Order 50
FPS
Physics On Physics Off

51
Figure 14 - Unity Profiler
The Unity Profiler was used to gather detailed performance information about the
prototype. Using the profiler, information on CPU utilisation, rendering calls,
memory allocation and physics calculations were monitored. The highest spike
recorded was when a graph was loaded for the first time, caused by the Link start
method which handled connection initialisation and instantiation. In addition, for
the graph of order 50, approximately 160000 triangles (tris) were being rendered
simultaneously, which is quite high for a virtual reality application. The
development machine was able to handle the smaller graph quite well, however
there was some minor game stuttering when moving around the graph.
Figure 15 - Rendering Statistics for Graph Order 50

52
When compared to the graph of order 100, there were more than 270000 tris
being rendered, with almost triple the number of draw calls in each frame, which
brought down the application to 15FPS. This was expected as the graph size is
double the small graph. After the larger graph was loaded in, the application was
hindered for approximately ten seconds, until the framerate stabilised to 32FPS.
During this time, the application was stuttering, indicating that methods for the
graph and physics calculations were not optimised and therefore were consuming
more system resources. As a result, the application suffered from screen tearing
and freezing, which led to motion sickness.
Figure 16 – Resource profiling for Graph Order 100
These results showed that graphs between order 50 and 100 can be visualised
in virtual reality without too much stutter to cause motion sickness. However,
graphs of order 100 and higher suffered from lower FPS and screen tearing. This
may be a result of the technological limitation on the development machine. In
addition, lack of optimisation on the force-directed graph resulted in high resource

53
consumption. With better optimisation and a more powerful machine, graphs of
order 100 would stabilise and perform better during data extraction tasks.
5.2 User Evaluation
The questionnaire provided qualitative feedback on the developed graph
visualisation prototype for virtual reality. In order to increase engagement and
limit motion sickness, the combined time for both the exercise and questionnaire
was kept to less than ten minutes. The participants were requested to follow a list
of tasks during the exercise:
1. Load the graph of order 50.
2. Select the node with the most connections and record its name.
3. Select a secondary node that has only one connection (from the node in task
2 and record its name.
4. Toggle the NOT operator from the radial menu.
5. Increase the edge thickness of the graph
The tasks increased in difficulty as the exercise progressed. The objective of the
questionnaire is to determine whether information extraction in virtual reality is a
viable solution for 3D graph visualisation.

54
Expected Results
The participants were asked to retrieve information from the graph in task 2 and
3. Task 2 required participants to provide the name of the most connected node
in the graph. Task 3 required participants to provide the name of any secondary
node that has only one connection to the most connected node. The expectation
from this exercise was that participants would be able to work with the diegetic
interface while selecting and pointing at graph objects using the laser pointer in
VR. The table below represents potential answers to these two tasks.
Task Description Potential Answers
Most connected node Computer literate
Female
Secondary node with a single
connection to the most connected
node
Exercise & Activity Summary
Diet and Nutrition Summary
Simd area = 4
Ovary Cancer
Table 5.2 - Task List Potential Answers
There were only two most connected nodes in the graph, with several secondary
nodes having a single connection originating from them. The most connected
node in the graph was named Computer literate while the second most connected
node was called Female. For participants, the expected outcome from the task
list was to identify the correct nodes in virtual reality, using both the laser pointer
and radial interface menu to extract information from the graph.
Results
In total, five participants took part in the study. The average age of individual’s
participating was 26.6 years, with more than 60% of the population sample aged
26 and over. In addition, 80% of the participants were male. For the first data
extraction task, most of the participants were able to correctly identify the most
connected node, while the rest selected the second most connected node.

55
Figure 17 - Most connected node results
In the case of the secondary task, it was concluded that 40% of users could not
clearly distinguish between critical nodes and therefore provided an incorrect
answer. One of the participants was not able to remember the name of the
secondary node they had selected while another participant selected an incorrect
node. This could be the result of several connections which were cluttered
together next to the point of interest. With regards to the secondary node, 60% of
participants were able to identify one of the correct secondary nodes for task 3.
The outcome could have resulted from secondary nodes having a single
connection, which visually had less clutter when compared to the most connected
nodes.
3
2
0
0.5
1
1.5
2
2.5
3
3.5
Computer Literate Female
Most connected node
Particpants

56
Figure 18 - Secondary node with single connection results
60% of the participants found the edge thickness to be the hardest task to
complete when compared to selecting the node with the most connections.
Participants were able to perform the NOT operator task, even though no
quantitative data was recorded. In addition, 60% of the participants responded
with somewhat familiar when asked about VR familiarity while the remainder of
the population sample were categorised under the neutral point and somewhat
unfamiliar. From the results it can be concluded that most of the population
sample were familiar with similar VR environments.
When queried about recommendations to make the experience better, the
participants’ response was quite similar. Two participants mentioned that the VR
graph could be made clearer as well as the placement of tasks within the
simulation. Another two participants suggested tooltips and instructions on the
VR hand controllers within the experience to present the user with controls.
Another participant mentioned smoother rotation and a tutorial for basic
interaction in VR.
0
0.5
1
1.5
2
2.5
Ovary Cancer Diet and Nutrition simd area = 5 Unknown
Secondary node with single connection
Participants

57
The results from the task exercise were in line with expectations. Responses from
the questionnaire show that virtual reality is initially challenging to the users even
though most were already familiar with VR controls. The diegetic user interface
provided an unconventional alternative to user interactions. This resulted in users
finding it difficult to identify the connection between standard VR input controls
and the holographic radial menu.
5.3 Other Observations
In the initial testing of the prototype, it was noticed that the local avatar, which
acts as a placeholder for the user in the application was also rotating the VR
hands. In certain cases, when the user looked over their shoulder, the VR hands
would follow the head tilt and as a result intersect with the user’s local avatar in
the environment. The HMD rotation property was turned off to disable this effect
and reduce motion sickness. Originally, the user position in the environment was
fixed, with support for head rotation only. This was later removed to allow the user
to freely explore the graph and incrementally rotate the avatar for increased
mobility. There were no complaints of nausea or motion sickness during the
exercise.

58
6. Conclusion
Virtual reality is a fast growing field that is being accepted as a viable medium for
human-computer interaction. VR kits are now making their way to the mainstream
market, as competition between different vendors accelerated innovation in
technology and efficiency, bringing down the entry price point even further. As a
result, in recent years there has been a greater uptake on virtual reality kits,
consequently boosting the research applications in various disciplines. The
literature on graph visualisation showed that traditional peripherals such as a
combination of mouse and keyboard were the primary medium for data retrieval
operations. The literature also suggested that even though traditional means of
interaction with a graph were common practise, data retrieval tasks in virtual
reality have enabled faster data extraction and eased graph exploration.
The outcome of this research shows that virtual reality technology can have a
positive and new impact on 3D graph exploration. The diegetic user interface
allows users to manipulate the graph using an intuitive approach, which requires
hovering and touch based interaction on the holographic radial menu. Feedback
gathered from data retrieval tasks shows that even though several participants
were familiar with VR, there were minor struggles to understand how the UI
works.
6.1 Limitations
Further application testing using larger datasets and producing new visualizations
was unachievable due to the technology constraints of the equipment being used,
meeting only the lower tier of requirements for developing in VR. In view of the
present COVID-19 safety restrictions, the number of participants was limited as
not all those who wanted to participate in the study could do so because they did
not have all the necessary VR equipment.

59
6.2 Future Work
For the prototype to be effective, users need to be taught practical VR principles
and understanding of interacting with environments in virtual reality. Future
research to compare the response users have when using the VR prototype, both
before and after an introductory course on the application, could produce results
that can increase the uptake of VR development in the data visualisation domain.
With proper training, users would feel more comfortable in virtual reality and
working in data visualisation environments. Further optimisations to the graph will
allow users to load larger datasets without compromising on performance. The
developed prototype supports Oculus Quest through the Oculus SDK. Future
work should focus on porting to other HMDs such as HTC Vive and Valve Index,
by utilising the OpenVR SDK. In addition, search functionality using HoverKey
component found in the HoverUI package should be considered to facilitate data
extraction.

60
List of References
A. Pachas-Baños, J. De La Cruz-Leyva and P. Shiguihara-Juárez (2019) Effectiveness of Graph Data Visualization of News using VR Experience. pp. 1.
Agrawal, R., Kadadi, A., Dai, X. and Andres, F. (Oct 25, 2015) Challenges and opportunities with big data visualization. ACM, pp. 169.
Aguinas, H., Henle, C.A. and Beaty Jr, J.C. (2001) 'Virtual reality technology: A new tool for personnel selection', International Journal of Selection and Assessment, 9(1‐2), pp. 70-83.
Anthes, C., Garcia-Hernandez, R.J., Wiedemann, M. and Kranzlmuller, D. (Mar 2016) State of the art of virtual reality technology. IEEE, pp. 1.
Bikakis, N. (2018) Big Data Visualization Tools. Springer International Publishing.
Bolton, M. (2019) PlayStation Move review. Available at: https://www.techradar.com/reviews/gaming/gaming-accessories/playstation-move-713638/review (Accessed: Sep 1, 2020).
Brooks, J., Frederick, Ouhyoung, M., Batter, J. and Kilpatrick, P. (1990) Project GROPEHaptic displays for scientific visualization.
Capece, N., Erra, U. and Romaniello, G. (2018) 'A Low-Cost Full Body Tracking System in Virtual Reality Based on Microsoft Kinect: 5th International Conference, AVR 2018, Otranto, Italy, June 24–27, 2018, Proceedings, Part II', pp. 623-635.
Chonbodeechalermroong, A. and Hewett, R. (2017) 'Towards Visualizing Big Data with Large-Scale Edge Constraint Graph Drawing', Big Data Research, 10, pp. 21-32. doi: https://doi-org.libproxy.abertay.ac.uk/10.1016/j.bdr.2017.10.001.
Cruz-Neira, C., Sandin, D. and DeFanti, T. (Sep 1, 1993) Surround-screen projection-based virtual reality. ACM, pp. 135.
Diestel, R. (2017) 'The Basics', in Diestel, R. (ed.) Graph Theory Berlin, Heidelberg: Springer Berlin Heidelberg, pp. 1-34.
Drascic, D. (1991) Skill acquisition and task performance in teleoperation using monoscopic and stereoscopic video remote viewing. SAGE Publications Sage CA: Los Angeles, CA, pp. 1367.
Drogemuller, A., Cunningham, A., Walsh, J., Cordeil, M., Ross, W. and Thomas, B. (2018) Evaluating navigation techniques for 3d graph visualizations in virtual reality. IEEE, pp. 1.

61
Dzemyda, G., Kurasova, O. and Žilinskas, J. (2013) 'Multidimensional Data and the Concept of Visualization', in Dzemyda, G., Kurasova, O. and Žilinskas, J. (eds.) Multidimensional Data Visualization: Methods and Applications New York, NY: Springer New York, pp. 1-4.
Erra, U., Malandrino, D. and Pepe, L. (2018) 'A methodological evaluation of natural user interfaces for immersive 3D Graph explorations', Journal of visual languages and computing, 44, pp. 13-27. doi: 10.1016/j.jvlc.2017.11.002.
Esfahlani, S.S., Thompson, T., Parsa, A.D., Brown, I. and Cirstea, S. (2018) 'ReHabgame: A non-immersive virtual reality rehabilitation system with applications in neuroscience', Heliyon, 4(2), pp. e00526. doi: https://doi.org/10.1016/j.heliyon.2018.e00526.
Feng, E. and Ge, X. (2018) 'DataViz: visualization of high-dimensional data in virtual reality [version 1; peer review: 1 not approved]', F1000Research, 7(1687). doi: 10.12688/f1000research.16453.1.
Ferdig, R., Blank, J., Kratcoski, A. and Clements, R. (2015) 'Using stereoscopy to teach complex biological concepts', Advances in Physiology Education, 39(3), pp. 205-208. doi: 10.1152/advan.00034.2014.
Fruchterman, T.M.J. and Reingold, E.M. (1991) 'Graph drawing by force-directed placement', Software, practice & experience, 21(11), pp. 1129-1164. doi: 10.1002/spe.4380211102.
Fry, B. (2008) Visualizing data: Exploring and explaining data with the processing environment. " O'Reilly Media, Inc.".
Gandomi, A. and Haider, M. (2015) 'Beyond the hype: Big data concepts, methods, and analytics', International Journal of Information Management, 35(2), pp. 137-144. doi: https://doi.org/10.1016/j.ijinfomgt.2014.10.007.
Genender-Feltheimer, A. (2018) 'Visualizing High Dimensional and Big Data', Procedia Computer Science, 140, pp. 112-121. doi: https://doi.org/10.1016/j.procs.2018.10.308.
Gillen, M.A. (1995) 'VR becomes art in hands of creator', Billboard, 107(41), pp. 62.
Ginde, G. (2016) Visualisation of massive data from scholarly Article and Journal Database A Novel Scheme.
Greenwald, W. (2019) Oculus Quest vs. Oculus Rift S: Which VR Headset Should You Buy? Available at: https://www.pcmag.com/comparisons/oculus-quest-vs-oculus-rift-s-which-vr-headset-should-you-buy (Accessed: 31/08/2020).
Gromer, D., Madeira, O., Gast, P., Nehfischer, M., Jost, M., Müller, M., Mühlberger, A. and Pauli, P. (2018) 'Height Simulation in a Virtual Reality CAVE

62
System: Validity of Fear Responses and Effects of an Immersion Manipulation', Frontiers in Human Neuroscience, 12, pp. 372.
Han, J., Pei, J. and Kamber, M. (2011) Data mining: concepts and techniques. Elsevier.
Heaney, D. (2019) 'How VR Positional Tracking Systems Work', UploadVR, Apr 29,. Available at: https://uploadvr.com/how-vr-tracking-works/ (Accessed: Sep 1, 2020).
Heeter, C. (1992) 'Being There: The Subjective Experience of Presence', Presence: Teleoperators and Virtual Environments, 1(2), pp. 262-271. doi: 10.1162/pres.1992.1.2.262.
Heilig, M. (1998) 'Beginnings: sensorama and the telesphere mask'Digital illusion: entertaining the future with high technology, pp. 343-351.
Heilig, M.L. (1969) Experience Theathre . Authoring organisation. 533017. Available at: http://www.freepatentsonline.com/3469837.pdf (Accessed: .
Introducing Oculus Quest. (2018) 'Introducing Oculus Quest, Our First 6DOF All-in-One VR System, Launching Spring 2019', Oculus, Sep 26,. Available at: https://www.oculus.com/blog/introducing-oculus-quest-our-first-6dof-all-in-one-vr-system-launching-spring-2019/ (Accessed: .
Keck, M., Kammer, D., Gründer, T., Thom, T., Kleinsteuber, M., Maasch, A. and Groh, R. (Aug 14, 2017) Towards Glyph-based visualizations for big data clustering. ACM, pp. 129.
Kennedy, R.S., Lane, N.E., Berbaum, K.S. and Lilienthal, M.G. (1993) 'Simulator Sickness Questionnaire: An Enhanced Method for Quantifying Simulator Sickness', The International journal of aviation psychology, 3(3), pp. 203-220. doi: 10.1207/s15327108ijap0303_3.
Kinstner, Z. (2016) Hover UI Kit. Available at: https://github.com/aestheticinteractive/Hover-UI-Kit/wiki (Accessed: 14 August, 2020).
Krueger, M.W., Gionfriddo, T. and Hinrichsen, K. (1985) VIDEOPLACE—an artificial reality. pp. 35.
Kuo, B., Francina Webster, A., Thomas, R.S. and Yauk, C.L. (2016) 'BMDExpress Data Viewer ‐ a visualization tool to analyze BMDExpress datasets', Journal of Applied Toxicology; J Appl Toxicol, 36(8), pp. 1048-1059. doi: 10.1002/jat.3265.
L. E. Matzen, M. J. Haass, K. M. Divis, Z. Wang and A. T. Wilson (2018) Data Visualization Saliency Model: A Tool for Evaluating Abstract Data Visualizations.

63
Lai, R. (2017a) bHaptics' TactSuit is VR haptic feedback done right. Available at: https://www.engadget.com/2017-07-02-bhaptics-tactsuit-vr-haptic-feedback-htc-vive-x-demo-day.html (Accessed: Aug 31, 2020).
Lai, R. (2017b) ThermoReal lets you feel heat, cold and even pain in VR and AR. Available at: https://www.engadget.com/2017-07-02-thermoreal-heat-cold-pinch-vr-ar-htc-vive-x.html (Accessed: Aug 31, 2020).
Lang, B. (2020) 'Exclusive Hands-on: HP's New Reverb G2 is the King of Clarity', Road to VR, -05-28T11:59:59-04:00. Available at: https://www.roadtovr.com/hp-reverb-g2-hands-on-preview/ (Accessed: Sep 1, 2020).
Langley, H. (2017) Inside-out v Outside-in: How VR tracking works, and how it's going to change. Available at: https://www.wareable.com/vr/inside-out-vs-outside-in-vr-tracking-343 (Accessed: Sep 1, 2020).
Lee, J., Ribey, E. and Wallace, J.R. (2016) 'A web-based data visualization tool for the MIMIC-II database', BMC medical informatics and decision making, 16(1), pp. 15. doi: 10.1186/s12911-016-0256-9.
Leibe, B., Starner, T., Ribarsky, W., Wartell, Z., Krum, D., Singletary, B. and Hodges, L. (1999) 'The Perceptive Workbench: Towards Spontaneous and Natural Interaction in Semi-Immersive Virtual Environments', .
Lele, A. (2011) 'Virtual reality and its military utility', Journal of ambient intelligence and humanized computing, 4(1), pp. 17-26. doi: 10.1007/s12652-011-0052-4.
Lindner, P., Miloff, A., Hamilton, W. and Carlbring, P. (2019) 'The Potential of Consumer-Targeted Virtual Reality Relaxation Applications: Descriptive Usage, Uptake and Application Performance Statistics for a First-Generation Application', Frontiers in Psychology, 10. doi: 10.3389/fpsyg.2019.00132.
Lowe, J. and Matthee, M. (2020) Requirements of Data Visualisation Tools to Analyse Big Data: A Structured Literature Review. . Technology. Cham: Springer International Publishing, pp. 469.
Lu, J. and Si, Y. (2020) 'Clustering-based force-directed algorithms for 3D graph visualization', The Journal of Supercomputing, . doi: 10.1007/s11227-020-03226-w.
Lugmayr, A., Grenfeld, A. and Zhang, D.J. (2017) Selected Advanced Data Visualizations: " The UX-Machine", Cultural Visualisation, Cognitive Big Data, and Communication of Health and Wellness Data. pp. 247.
Lugrin, J., Cavazza, M., Charles, F., Renard, M., Freeman, J. and Lessiter, J. (2013) 'Immersive FPS games: user experience and performance', . doi: 10.1145/2512142.2512146.

64
M. Behrisch, D. Streeb, F. Stoffel, D. Seebacher, B. Matejek, S. H. Weber, S. Mittelstädt, H. Pfister and D. Keim (2019) Commercial Visual Analytics Systems–Advances in the Big Data Analytics Field.
M. Cordeil, T. Dwyer, K. Klein, B. Laha, K. Marriott and B. H. Thomas (2017) Immersive Collaborative Analysis of Network Connectivity: CAVE-style or Head-Mounted Display?.
M. Sra and C. Schmandt (2016) Bringing real objects, spaces, actions, and interactions into social VR. pp. 16.
Marcus, R., Kohlhase, M. and Rabe, F. (2019) TGView3D System Description: 3-Dimensional Visualization of Theory Graphs.
McLaughlin, M. (2018) 'Visualizing Data in 3D', Center for Data Innovation, -08-29T17:33:46-04:00. Available at: https://www.datainnovation.org/2018/08/visualizing-data-in-3d/ (Accessed: Aug 28, 2020).
Mercurio, P.J., Erickson, T., Diaper, D., Gilmore, D., Cockton, G. and Shackel, B. (1990) Interactive scientific visualization: An assessment of a virtual reality system. pp. 741.
Mihelj, M., Novak, D. and Begus, S. (2014) 'Introduction to Virtual Reality', in Mihelj, M., Novak, D. and Beguš, S. (eds.) Virtual Reality Technology and Applications Dordrecht: Springer Netherlands, pp. 1-16.
Monoscopic vs Stereoscopic. (2019) 'Monoscopic vs Stereoscopic VR | Everything you need to know', Immersion VR, . Available at: http://immersionvr.co.uk/blog/monoscopic-vs-stereoscopic-360-vr/ (Accessed: Aug 30, 2020).
N. Capece, U. Erra and J. Grippa (2018) GraphVR: A Virtual Reality Tool for the Exploration of Graphs with HTC Vive System. pp. 448.
Najafabadi, M.M., Villanustre, F., Khoshgoftaar, T.M., Seliya, N., Wald, R. and Muharemagic, E. (2015) 'Deep learning applications and challenges in big data analytics', Journal of big data, 2(1), pp. 1-21. doi: 10.1186/s40537-014-0007-7.
Nichols, G. (2019) Data visualization via VR and AR: How we'll interact with tomorrow's data. Available at: https://www.zdnet.com/article/data-visualization-via-vr-and-ar-how-well-interact-with-tomorrows-data/ (Accessed: Aug 3, 2020).
Niehorster, D.C., Li, L. and Lappe, M. (2017) 'The Accuracy and Precision of Position and Orientation Tracking in the HTC Vive Virtual Reality System for Scientific Research', i-Perception, 8(3), pp. 2041669517708205. doi: 10.1177/2041669517708205.
Olshannikova, E., Ometov, A., Koucheryavy, Y. and Olsson, T. (2015) 'Visualizing Big Data with augmented and virtual reality: challenges and

65
research agenda', Journal of big data, 2(1), pp. 1-27. doi: 10.1186/s40537-015-0031-2.
Pandey, A. (2017) D3 Graph Theory. Available at: https://d3gt.com/unit.html?order-and-size (Accessed: 28/08/2020).
Parsons, D. (2019) Full Flight Simulators Incorporate VR for Next Generation of Pilots. Available at: https://www.aviationtoday.com/2019/08/01/training-brain-mind/ (Accessed: Aug 31, 2020).
Pathak, S. and Pathak, S. (2020) 'Data Visualization Techniques, Model and Taxonomy', in Hemanth, J., Bhatia, M. and Geman, O. (eds.) Data Visualization and Knowledge Engineering: Spotting Data Points with Artificial Intelligence Cham: Springer International Publishing, pp. 249-271.
Poetker, B. (2019) What Is Virtual Reality? (+3 Types of VR Experiences). Available at: https://learn.g2.com/virtual-reality (Accessed: Aug 30, 2020).
R. Wu, J. Pandurangaiah, G. M. Blankenship, C. X. Castro, S. Guan, A. Ju and Z. Zhu (2020) Evaluation of Virtual Reality Tracking Performance for Indoor Navigation. pp. 1311.
Remmele, M., Weiers, K. and Martens, A. (2015) 'Stereoscopic 3D's impact on constructing spatial hands-on representations', Computers & Education, 85, pp. 74-83.
Ribarsky, W., Bolter, J., Op den Bosch, A. and van Teylingen, R. (1994) 'Visualization and analysis using virtual reality', (1, 14), 10-12. 10.1109/38.250911.
Ringman Olsson, M. (2011) Wiimote 3D Interaction in VR Assisted Assembly Simulation. 2011:072 Available at: http://urn.kb.se/resolve?urn=urn:nbn:se:kth:diva-130754 (Accessed: .
Robertson, A. (2019a) The Valve Index might have the most fun VR controllers I’ve ever tried. Available at: https://www.theverge.com/2019/5/28/18639084/valve-index-steamvr-headset-knuckles-controllers-preview (Accessed: Sep 1, 2020).
Robertson, A. (2019b) Valve Index review: high-powered VR at a high-end price. Available at: https://www.theverge.com/2019/6/28/19102584/valve-index-steamvr-headset-review-shipping-today (Accessed: Sep 1, 2020).
Ryan, M. (1999) 'Immersion vs. interactivity: Virtual reality and literary theory', SubStance, 28(2), pp. 110-137.
Sacks, R., Perlman, A. and Barak, R. (2013) 'Construction safety training using immersive virtual reality', Construction Management and Economics, 31, pp. 1005-1017. doi: 10.1080/01446193.2013.828844.

66
Schloerb, D.W. (1995) 'A quantitative measure of telepresence', Presence: Teleoperators & Virtual Environments, 4(1), pp. 64-80.
Schuemie, M.J., Van Der Straaten, P., Krijn, M. and Van Der Mast, Charles APG (2001) 'Research on presence in virtual reality: A survey', CyberPsychology & Behavior, 4(2), pp. 183-201.
Schultheis, M.T., Rebimbas, J., Mourant, R. and Millis, S.R. (2007) 'Examining the usability of a virtual reality driving simulator', Assistive Technology, 19(1), pp. 1-10.
Siegrist, M. (1996) 'The use or misuse of three-dimensional graphs to represent lower-dimensional data', Behaviour & Information Technology, 15(2), pp. 96-100. doi: 10.1080/014492996120300.
Silanon, K. and Suvonvorn, N. (2011) Real Time Hand Tracking as a User Input Device. . Systems. Berlin, Heidelberg: Springer Berlin Heidelberg, pp. 178.
Slater, M. (2018) 'Immersion and the illusion of presence in virtual reality', British Journal of Psychology, 109(3), pp. 431-433.
Sorene, P. (2014) 'Jaron Lanier's EyePhone: Head And Glove Virtual Reality In The 1980s', Flashbak, -11-24T21:48:55+00:00. Available at: https://flashbak.com/jaron-laniers-eyephone-head-and-glove-virtual-reality-in-the-1980s-26180/ (Accessed: Aug 29, 2020).
Sullivan, P. (2016) 'Graph-Based Data Visualization in Virtual Reality: A Comparison of User Experiences', .
Sutherland, I. (Dec 9, 1968) A head-mounted three dimensional display. ACM, pp. 757.
Takahashi, D. (2016a) 'Leap Motion introduces amazing Orion hand-tracking for virtual reality', VentureBeat, -02-17T14:00:58+00:00. Available at: https://venturebeat.com/2016/02/17/leap-motion-introduces-amazing-orion-hand-tracking-for-virtual-reality/ (Accessed: Aug 31, 2020).
Takahashi, D. (2016b) 'Ultrahaptics uses ultrasound so you can feel things in VR', VentureBeat, -11-07T15:59:53+00:00. Available at: https://venturebeat.com/2016/11/07/ultrahaptics-uses-ultrasound-so-you-can-feel-things-in-vr/ (Accessed: Aug 31, 2020).
Tharwat, A., Gaber, T., Ibrahim, A. and Hassanien, A.E. (2017) 'Linear discriminant analysis: A detailed tutorial', Ai Communications, 30, pp. 169-190,. doi: 10.3233/AIC-170729.
The Cinematic, V.R. (2018) The Cinematic VR Field Guide. Available at: https://creator.oculus.com/learn/cinematic-vr-field-guide/ (Accessed: 30/08/2020).

67
Theart, R.P., Loos, B. and Niesler, T.R. (2017) 'Virtual reality assisted microscopy data visualization and colocalization analysis', BMC bioinformatics; BMC Bioinformatics, 18, pp. 64. doi: 10.1186/s12859-016-1446-2.
Thomas, B.H. (2019) 'Virtual Reality for Information Visualization Might Just Work This Time', Frontiers in robotics and AI, 6. doi: 10.3389/frobt.2019.00084.
Timmer, J. (2020) Musk says that Neuralink implants are close to ready for human testing. Available at: https://arstechnica.com/science/2020/08/musk-says-that-neuralink-implants-are-close-to-ready-for-human-testing/ (Accessed: Aug 31, 2020).
Tong, F. (2019) Everything you need to know about Graph Theory for Deep Learning. Available at: https://towardsdatascience.com/graph-theory-and-deep-learning-know-hows-6556b0e9891b (Accessed: Jul 31, 2020).
Tsyktor, V. (2019) 'What Is Fully-Immersive Virtual Reality? - CyberPulse', Marketing Tech Blog CyberPulse, -06-08T08:55:28+00:00. Available at: https://cyberpulse.info/what-is-fully-immersive-vr-technology-explained/ (Accessed: Aug 31, 2020).
Tysktor, V. (2019) 'What Is Semi-Immersive Virtual Reality?', Marketing Tech Blog CyberPulse, -02-23T11:35:21+00:00. Available at: https://cyberpulse.info/what-is-semi-immersive-virtual-reality/ (Accessed: Aug 31, 2020).
Vathy-Fogarassy, Á and Abonyi, J. (2013) 'Graph-Based Visualisation of High Dimensional Data', in Vathy-Fogarassy, Á and Abonyi, J. (eds.) Graph-Based Clustering and Data Visualization Algorithms London: Springer London, pp. 43-91.
Ventura, S., Brivio, E., Riva, G. and Baños, R.M. (2019) 'Immersive Versus Non-immersive Experience: Exploring the Feasibility of Memory Assessment Through 360° Technology', Frontiers in Psychology, 10, pp. 2509.
Verlinden, J.C., Bolter, J.D. and Van der Mast, C. (1993) The World Processor: An interface for textual display and manipulation in Virtual Reality. Available at: https://smartech.gatech.edu/handle/1853/3648 (Accessed: 03 August, 2020).
Webster, R. and Dues, J.F. (2017) System usability scale (SUS): Oculus Rift® DK2 and Samsung Gear VR®.
Weis, S. (2018) Comprehensive overview of roomscale tracking technologies. Available at: https://packet39.com/blog/2018/10/07/roomscale-tracking-technologies/ (Accessed: Sep 1, 2020).
Westreich, S.T., Nattestad, M. and Meyer, C. (2020) 'BigTop: a three-dimensional virtual reality tool for GWAS visualization', BMC bioinformatics; BMC Bioinformatics, 21(1), pp. 39-8. doi: 10.1186/s12859-020-3373-5.

68
Willings, A. (2019) Valve Index VR headset: Everything you need to know. Available at: https://www.pocket-lint.com/ar-vr/news/steam/147913-valve-index-vr-headset-everything-you-need-to-know (Accessed: Sep 1, 2020).
Xu, T., Yang, J. and Gou, G. (2018) 'A Force-Directed Algorithm for Drawing Directed Graphs Symmetrically', Mathematical problems in engineering, 2018, pp. 1-24. doi: 10.1155/2018/6208509.
Yammine, K. and Violato, C. (2015) 'A meta-analysis of the educational effectiveness of three-dimensional visualization technologies in teaching anatomy', Anatomical sciences education, 8(6), pp. 525-538. doi: 10.1002/ase.1510.
Yoo, S. and Parker, C. (2015) Controller-less interaction methods for Google cardboard. pp. 127.
Zhao, J., Wallgrün, J.O., LaFemina, P.C., Normandeau, J. and Klippel, A. (2019) 'Harnessing the power of immersive virtual reality - visualization and analysis of 3D earth science data sets', Geo-spatial information science, 22(4), pp. 237-250. doi: 10.1080/10095020.2019.1621544.

69
Appendices
Appendix A – Participant Information Letter
Who is the researcher and how can I contact the researcher?
My name is Daniel Zammit and I am a student in the School of Design and
Informatics reading for an MSc in Computer Games Technology at Abertay
University. I am conducting research in virtual reality and would like to invite you
to take part in my study. If you require further information about this study, you
can contact me at: [email protected]
Purpose of the study:
The purpose of this study is to determine whether 3D graph visualisations
improve data retrieval tasks when using a virtual reality (VR) environment.
What will I be asked to do?
You will be asked to wear the VR headset while seated. When inside the VR
simulation you will be asked to load a 3D graph and perform a set of tasks. On
completion you will be asked to fill out a short questionnaire regarding the
experience. As part of the experiment we will also ask you to record demographic
data such as your age and gender, and familiarity with VR environments.
Time Commitment:
The study will take about 10 minutes; this will include reading this form, donning
the VR headgear and interacting with a graph in virtual reality, as well as filling in
the short questionnaire on your perception of the graph interactions and providing
demographic information.

70
Must I take part?
No, participation is entirely voluntary. You may decide to stop being a part of the
research study at any time without explanation. If you want to withdraw from the
study and have your data removed, you need to let us know immediately while in
the study, because we can no longer do so when you have left the study, as the
data are stored anonymously.
Are there any risks?
As with any VR simulation, there is a remote possibility of feeling unwell or other
symptoms of discomfort. You can, at any point ask to stop and remove the VR
headset and ask to discontinue the study, without providing any reasons.
Confidentiality/Anonymity:
The data we collect will be treated confidentially and with anonymity. Should we
publish the findings from this study, we will make no reference to your identity.
How can I take part in the study?
You can take part in the study by agreeing to be a participant in the study and
giving us your time. In order to be able to take part you need to give us informed
consent by reading and signing the form overleaf and ticking the relevant boxes.
COVID-19 Statement
Study must be conducted in line with government regulations regarding COVID-
19 lockdown. This means the study needs to be conducted without contact with
participants, for example, using online/video material that contains instructions,
data collection instruments etc. Care must be taken that data are securely
collected and stored.

71
We will not be able to give VR equipment to the users. Therefore, testing will be
restricted to people who have the VR Technology at home. This will limit the
number of users, but we will aim to have up to 5 participants.
Appendix B – Task List
You are asked to download and run an application. Afterwards, you will be asked
to complete a questionnaire which will ask about your experience with VR
interactions.
The file can be download from here – Google Drive Link
Once the file is downloaded, extract the contents of the archive into a folder.
Ensure that the VR headset and controllers are connected to your personal
computer. Run the application called "VRGraph.exe" and follow the tasks
hereunder.
1. Load the graph of order 50.
2. Select the node with the most connections and record its name.
3. Select a secondary node that has only one connection (from the node in task
2 and record its name.
4. Toggle the NOT operator from the radial menu.
5. Increase the edge thickness of the graph
When you have completed the tasks, proceed to the next section.

72
Appendix C - Questionnaire
1. What is your age?
2. What gender do you identify with?
• Male
• Female
• Non-binary
• Other
3. What is the name of the most connected node?
4. Write down the name of a secondary node.
5. Which task was harder to perform?
o Select the node with the most connection
o Modify the edge thickness
6. How familiar are you with VR environments such as the one you have
experienced in this study?
Very
familiar
Somewhat
familiar
Neither familiar
nor unfamiliar
Somewhat
unfamiliar
Very
unfamiliar
VR
familiarity
7. What feature/s would you recommend to make the experience better?

73
Appendix D – VRGraph Demonstration Video
Demonstration - https://www.youtube.com/watch?v=lS92WtaxCZ8