Embed Size (px)
Citation preview

Leveraging Parents: The Impact of High-Frequency Information onStudent Achievement∗
Peter Bergman Eric W. Chan†
September 2017
Abstract: We partner communication technology with school information systems toautomate the gathering and provision of high-frequency information on students’ academicprogress to parents. We use this technology to send weekly automated alerts to parentsabout their child’s missed assignments, grades, and class absences. The intervention reducescourse failures by 38%, increases class attendance by 17% and increases retention. Thereare no effects on state test scores, though the exams, which were new and zero stakes, werediscontinued; students used substantially less than the expected amount of time to completethem. In contrast, we find significant improvements on in-class exam scores.
JEL Codes: I20, I21, I24, I28.
∗This research is funded by the Smith Richardson Foundation and the Teachers College Provost’s In-vestment fund and received approval from the Institutional Research Board at Teachers College, ColumbiaUniversity. We thank Dr. Ron Duerring, Jon Duffy and Kanawha County Schools, as well as Spencer Kier,Alex Farivar, Jeremy Lupoli, Sam Elhag and Zach Posner. We also thank Raj Darolia, Philipp Lergetporerand Susanna Loeb for their comments, as well as those of seminar participants at the Wisconsin Institutefor Research on Poverty, IZA, and CESifo. Bergman has previously received compensation from the learningmanagement system company to advise them with respect to their school-to-parent information technologies.†Teachers College, Columbia University, 525 W. 120th Street New York, New York 10027. Email addresses:
[email protected] and [email protected]: www.columbia.edu/~psb2101
I Introduction
Families are both one of the greatest sources of inequality and a powerful determinant of
academic achievement (cf. Coleman et al. 1966; Heckman 2006; Cunha and Heckman 2007;
Todd and Wolpin 2007). While leveraging families has the potential to improve child out-
comes, many programs that do so focus on skills-based interventions, can be difficult to scale
due to high costs, and often focus on families with young children (Belfield et al., 2006;
Olds, 2006; Nores and Barnett, 2010; Heckman et al., 2010; Avvisati et al., 2013; Duncan
and Magnuson, 2013; Gertler et al., 2014; York and Loeb, 2014; Mayer et al., 2015).
However, for older children, recent research suggests it may be possible to leverage par-
ents by resolving certain intra-household information frictions around their child’s effort in
school.1 For instance, Bursztyn and Coffman (2012) conduct a lab experiment that shows
families prefer cash transfers that are conditional on their child’s school attendance over
unconditional cash transfers because this helps them monitor their child. When parents
are offered a chance to receive information about their child’s attendance via text message,
they no longer are willing to pay for conditionality. Bergman (2014) models the interaction
between parents and their children as one of strategic-information disclosure around their
child’s effort in school. He uses a small experiment providing information to parents about
their child’s academic to progress to estimate a persuasion game (Dye, 1985; Shin, 1994) in
which children strategically disclose information about their effort to parents and parents
incur costs to monitor this information. He finds that, for high school students, the ad-
ditional information reduces parents’ upwardly-biased beliefs about their child’s effort and
makes it easier for parents to monitor their child.2 There is evidence that students’ effort
and achievement improve as a result.
The idea that providing information to parents about their child’s effort can improve
outcomes is tantalizing. There a lack of interventions that can successfully improve education
1Parents also exhibit information problems about their child’s ability, attendance, and the education production function(Bonilla et al., 2005; Bursztyn and Coffman, 2012; Cunha et al., 2013; Bergman, 2014; Rogers and Feller, 2016; Dizon-Ross,2016; Rogers and Feller, 2016; Kinsler et al., 2016; Andrabi et al., 2017). Fryer Jr (2011) also finds that students may notaccurately assess the education production function as well.
2The experiment became contaminated for middle school students when the school asked an employee to call all of thesestudents’ parents about their missed assignments.
1

outcomes for children during middle and high school, especially ones that can be implemented
at a low cost (Cullen et al., 2013).3 While there is promise that providing high-frequency
information about students’ progress could impact outcomes, the current evidence comes
from small, labor-intensive interventions, some of which do not look directly at measures of
student achievement. For instance, Kraft and Dougherty (2013) randomized 14 classrooms
in a charter school with 140 students to test the effect of personalized, daily phone calls
home to parents from their child’s English teachers over two weeks. They find evidence of
improved classroom engagement during the two weeks of the intervention but they could
not estimate the effects on student achievement as they had to provide information to all
students after the experiment. Kraft and Rogers (2014) show that personalized messages,
written individually by teachers and sent by research staff to a sample of 435 parents, helped
retain students in a summer credit-recovery program. Bergman (2014) sent bi-monthly text
messages—typed by hand—and phone calls about students’ missed assignments and grades
to a sample of 279 parents. In theory, placing student information online could help resolve
these information problems, but Bergman (2016) finds that parent adoption and usage of this
technology is low, especially in schools serving lower-income and lower-achieving students,
which could exacerbate socio-economic gaps in student achievement.
We partner with a Learning Management System company to develop and test a low-cost
technology that synchronizes with Student Information Systems and teacher gradebooks to
push high-frequency information to parents about their child’s absences, missed assignments
and low grades via automated text messages.4 The intervention automates sending out
three types of alerts. First, an absence alert was sent weekly detailing the number of classes
a child missed for each course in the last week. This by-class alert contrasts with how
districts typically report absences to parents, which are typically reported in terms of full-
day absences. We show that students have a higher rate of absence for individual classes
3There are also a number of low-cost interventions that focus on the high-school-to-college transition, which have improvedcollege enrollment outcomes, such as (Bettinger et al., 2012; Castleman and Page, 2015; Hoxby et al., 2013; Carrell and Sacerdote,2017).
4Text messages have been used in several education interventions (Kraft and Rogers, 2014; Bergman, 2014; Castleman andPage, 2015, 2016; Page et al., 2016; Oreopoulos and Petronijevic, 2016; Castleman and Page, 2017).
2

than they do for full days.5 Similarly, if a student missed any assignments, a weekly alert was
sent stating the number of assignments missed in each class during the past week. Lastly, a
low-grade alert was sent once per month if the child had a class grade average below 70% at
the end of the month. Messages were randomly assigned to be delivered to either the mother
or the father, when possible.
We conduct a field experiment to evaluate the academic and behavioral effects of this
information technology in 22 middle and high schools. The intervention increases the likeli-
hood parents were contacted by schools at least once per month by 19 percentage points. In
all, we sent 32,472 messages to treatment group families in the first year, or an average of
52 messages per treated family. This contrasts with the existing amount of contact between
schools and parents, which widely varies. Our surveys indicate that nearly 50% of parents
were contacted less than one time in three months by the school about their child’s academic
progress, but roughly one quarter of parents report hearing from the school more than once
per month. We also find that parents tend to overestimate their child’s grades, on average,
and to underestimate their child’s missed assignments, though parents are more accurate
about the former than the latter.
We find that, as a result of this additional contact, there is a substantial decrease in the
number of courses students failed. In the first year, students fail one course, on average,
and the text-message intervention reduces this by nearly 40%. GPA improves by a 0.10 of
a point and a quarter of a point for high-school students. Treatment group students attend
17% more classes and district retention increases by 2 percentage points. We do not find
any improvements in state math and reading test scores. However, these exams had no
stakes for students, and students spent roughly 100 minutes less time than the test provider
said is expected to finish the exams. The district subsequently discontinued using these
standardized tests.6 In contrast, we do find significant, 0.10 standard-deviation increases on
in-class exam scores.7 Most of the positive impacts are driven by students with below-average
5The definition of a full day can vary from district to district. In this district, it constitutes 70% of the school day.6The state superintendent’s commission expressed concerns that the exams are not “an accurate gauge of student achieve-
ment” and “doesn’t give much reason for students to take it seriously.” See the Charleston Gazette-Mail.7Several recent studies have documented substantial increases in student performance in response to the stakes of the exam
(List et al., 2017) and student effort (Hitt, 2016; Zamarro et al., 2016).
3

GPAs and high school students. The latter exhibit larger impacts on grades, GPA, missed
assignments, course failures and retention while middle-school students show no significant,
positive (or negative) effects. Moreover, we find the positive effects for high school students
and students with below-average GPAs persist into the second year of the intervention.
Where possible, we randomized which parent in the household received the messages, but
we find no differential effects of alerting mothers versus fathers.
We believe our paper makes several contributions to the literature. First, we show that
pushing high-frequency information to parents can significantly improve student performance
in middle and high schools. One novel aspect of this information, which has not been
previously tested, is that we track and send information to parents about every class their
child has missed instead of full-day absences. We show that this information is particularly
important because students are more likely to miss an individual class than a full day of class
(Whitney and Liu, 2017). Prior research looking at the impact of providing information
to parents on student achievement focuses on the context of early childhood (York and
Loeb, 2014; Doss et al., 2017) or school choice (Hastings and Weinstein, 2008). Other
research providing information to parents or students often targets the high-school-to-college
transition (Bettinger et al., 2012; Hoxby et al., 2013; Castleman and Page, 2015; Page et al.,
2016; Castleman and Page, 2016, 2017; Bergman et al., 2017; Bird et al., 2017; Page and
Gehlbach, 2017), and Bergman (2014) shows impacts on student achievement from a single
school using individual-level randomization.
Second, we test a scalable, low-cost technology. The promise of automation is that,
relative to other interventions, communicating with parents via automated alerts is extremely
low cost, even at scale. The marginal cost of each text message is a fraction of a cent.
Despite sending more than 32,000 text messages, the total cost of all of these messages was
approximately $63. The entire gradebook platform and personnel training cost an additional
$7 dollars per student. This low overall and marginal cost in terms of time and effort implies
that automated messaging has a high potential to scale and impact student achievement.
Rogers and Feller (2016) also conduct a successful, scalable attendance intervention, but they
4

find (as they expected) that the attendance gains are not large enough to improve end-of-
year measures of student performance. We also complement their research by demonstrating
the value of targeting students’ by-class absences. We show by-class absences are much
more frequent than full-day absences and that information on these absences can result in
substantially higher attendance rates. This is consistent with recent research on by-class
attendance (Whitney and Liu, 2017; Liu and Loeb, 2017).
Lastly, previous research in areas such as cash transfers suggests that intra-household
divisions of labor and bargaining power could lead to heterogeneous effects of education in-
terventions if information does not flow perfectly between parents (Doepke and Tertilt, 2011;
Duflo, 2012; Yoong et al., 2012; Akresh et al., 2016). To assess this possibility, we randomize
whether a student’s mother or father received the intervention in case specialization and
intra-household information frictions impede parents’ response to the intervention.
Related to our paper is ongoing work by Berlinski et al. (2016), who are conducting a
texting intervention in eight elementary schools Chile. They are sending information to
parents about their child’s math test scores, math grades and attendance. These data are
gathered from schools and entered by their research team into a digital platform, which
is used to send the text messages to parents. In contrast, we automated this process by
scraping data that is frequently entered into district student information systems, which
includes grades, attendance and missed assignments, though not class behaviors or exam
scores.
Providing high-frequency information to parents about their child’s academic progress is
a potentially important tool in the set of effective interventions for older children, which
include high touch interventions such as high-intensity tutoring (Bloom, 1984; Cook et al.,
2015; Fryer, 2017) and may be limited by high cost.8 This intervention is not a panacea, and
automation alone it does not address other aspects of scalability, such as take up of the in-
tervention by parents or usage of the system by teachers. In Washington D.C., Bergman and
Rogers (2017) randomize whether approximately 7,000 parents can enroll in this technology
8 Cook et al. (2015) designed a novel, scalable high-intensity tutoring intervention for male 9th and 10th grade students,which reduced course failures by 50% and increased math test scores by 0.30 standard deviations.
5

via an opt-in process or an opt-out process. Take up for the latter is above 95%, with similar
effects on outcomes as in this study, and this group is more likely to opt into the technology
in the future. Another potential constraint is whether teachers supply information to the
gradebook system in a timely fashion. In this study teachers were blinded to the intervention
assignment and we discerned no impacts of the intervention on teacher logins into the sys-
tem. Some school districts contractually obligate teachers to updates grades regularly (e.g.
weekly). Our research suggests this type of policy could be an important—and potentially
monitored—input for improving education outcomes.
The rest of the paper proceeds as follows. Section II describes the background and the
experimental design. Section III describes the data collection process and outcome variables.
Section IV presents the experimental design and the empirical specifications. Section V shows
our results and Section VI concludes.
II Background and Experimental Design
The experiment took place in 22 middle and high schools during the 2015-2016 school year
in Kanawha County Schools (KCS), West Virginia. We were subsequently able to extend
the intervention through the 2016-2017 school year. As a state, West Virginia ranks last
in bachelor degree attainment and 49th in median household income among US states and
the District of Columbia. It is the only state where less than 20% of adults over 25 years
of age have a bachelors degree and households have an overall median income of $42,019.9
The state population is 93% white, 4% African-Americans, 1% Asians, and 2% Hispanic or
Latino as of 2015. Data from the 2015 NAEP showed that 73% of West Virginia students
were eligible for free or reduced lunch. Students also scored significantly below the national
average on all National Assessment of Educational Progress (NAEP) subjects tested, with
the exception of 4th grade science, which was in line with national averages.10
KCS is the largest school district in West Virginia with over 28,000 enrolled students as
9American Community Survey one-year estimates and rankings by state can be found here.10NAEP Results by state can be found here.
6

of 2016. The district’s four-year graduation rate is 71% and standardized test scores are
similar to statewide proficiency rates in 2016. In the school year previous to the study,
2014-2015, 44% of students received proficient-or-better scores in reading and 29% received
proficient-or-better scores in math. At the state level, 45% of students were proficient or
better in reading and 27% were proficient in math. 83% of district students are identified as
white and 12% are identified as Black. 79% of students receive free or reduced priced lunch
compared to 71% statewide.11
Like much of the state, the district has a gradebook system for teachers. Teachers record
by-class attendance and mark missed assignments and grades using this web-based platform.
Teachers are obliged to mark attendance, but the only obligation to update gradebook is
every six to nine weeks, when report cards go out. We worked with the Learning Management
System (LMS) provider of this gradebook to design a tool to automatically draw data from
this platform on students’ missed assignments for each class, their percent grade by class and
their class-level absences from the gradebook. This information was coupled with parents’
contact information so that the system could pull the information on academic progress from
the gradebook and push it out to families using a text-messaging API developed by Twilio.
These text messages form our parent-alert system. Each of the text messages was designed
to be a consistent weekly or monthly update to the parents of students who had at least one
absence or missing assignment during the week or who have a low course average over the
course of a month.
The gradebook application also has a “parent portal,” which is a website that parents
can log into to view their child’s grades and missed assignments. All parents in the study
could access the parent portal and any parent could turn on our alerts by logging into the
portal and turning on the alert feature. As we discuss further below, only 2% of parents in
the control group received any alert. Bergman (2016) finds that, in general, very few parents
ever use the parent portal and we find this is true in KCS as well; roughly a third of parents
had ever logged in to view their child’s grades. Moreover, usage of the parent portal tends
11These summary statistics come from the state education website, which can be found here.
7
to be higher for higher-income families and families with higher-performing students.
We tested three types of parent alerts: Missed assignment alerts, by-class attendance
alerts, and low-grade alerts. The text of the alerts are as follows, with automatically inserted
data in brackets:
· Missed Assignment Alert:“Parent Alert: [Student Name] has [X] missing assignment(s)
in [Class Name]. For more information, log in to [domain]”
· By-Class Attendance Alert: “Parent Alert: [Student Name] has [X] absence(s) in [Class
Name]. For more information, log in to [domain]”
· Low Class Average Alert: “Parent Alert: [Student Name] has a [X]% average in [Class
Name]. For more information, log in to [domain]”
On Mondays parents received a text-message alert on the number of assignments their
child was missing (if any) for each course during the past week. These assignments included
homework, classwork, projects, essays, missing exams, tests, and quizzes. On Wednesdays
parents received an alert for any class their child had missed the previous week. Lastly, and
normally on the last Friday of each month, parents received an alert if their child had a
cumulative average below 70% in any course during the current marking period. Each alert
was sent at 4:00 P.M. local time. The text messages also included a link to the website
domain of the parent portal, where the parent could obtain specific information on class
assignments and absences if necessary.
These alerts targeted lower-performing students. Based on work by Bergman (2014), we
hypothesized that information frictions between parents and their children would be greatest
for students with lower GPAs. We believed these students would have less incentive to tell
their parents about their academic performance, which, combined with infrequent school-
to-parent communication, could lead to information problems that cause parents to have
upwardly-biased beliefs about their performance. To the extent that additional information
makes it easier for parents to track their child’s performance, the intervention could cause
more accurate beliefs and the ability for parents to induce more effort from their child to do
well in school. We explore these mechanisms in our endline survey results and stratified the
randomization by baseline GPA to explore heterogeneous effects.
8

Experimental Design
The initial sample began with approximately 14,000 total students who were enrolled in
grades five through eleven during the end of the 2014-2015 school year. Recruitment was at
the household level, and, as a number of these students lived in the same households, the final
sample frame was just under 11,000 households. During the summer of 2015, one consent
letter was sent to each household in the sample frame, which was specifically addressed to one
randomly selected parent or guardian when contact information was available for more than
one parent in the data provided by the district. The letter contained the name of a randomly
selected student living in the household.12 Trained interviewers followed up the letter with
a phone call to each selected parent to confirm their participation and contact information,
as required by our Institutional Review Board. We then asked their language preference
and preferred modes of contact—text message or phone calls. As a result, the parent or
guardian of 1,137 students consented to the study and provided their contact information
for inclusion as a participant.13 Of these participants, 96% of the treatment and control
groups preferred to receive text messages. Though it deviated from our original design, to
simplify our intervention and to save on costs we chose to implement a text-message-only
intervention. Those who could only be contacted by a landline phone or did not wish to
be contacted by text did not receive the intervention even if they were randomized into
treatment.14
Random assignment was at the school-by-grade level to minimize the potential for spillovers
into the control group. The data were initially collapsed at the grade-by-school level and
randomization was subsequently stratified by indicators for below-median grade point aver-
age (GPA) and middle versus high school grades. All school employees were blinded to the
12Students were in grades 5-11 the previous year and were expected to be in grades 6-12 during the school year of the study.13Overwhelmingly the primary reason we could not consent families was because we could not reach them by phone within
three attempts—the maximum number of times we were permitted to call by our IRB. This accounted for 88% of non-consents,while active declines accounted for the remainder. Consent into the study is not significantly correlated with predictors ofstudent achievement or parental involvement: baseline GPA, absences, English Language Learner Status, IEP status, gender,an indicator for being suspended, or baseline parent logins. Consent is significantly and positively correlated with an indicatorfor the student being Black however (results available upon request). In a separate study, which did not require parentalconsent, Bergman and Rogers (2017) examine how take up of this intervention is largely determined by opt-in versus opt-outoffers to receive it. The latter results in 96% take up and effects on achievement similar to those found in this paper.
14No families are dropped from the analysis , however, and all families assigned to treatment remain so even if they neverreceived a text message.
9

randomization process.
We also randomized which parent or guardian received the text-message alerts if we had
contact information available for both the mother and father of a child, or if we had multiple
listed guardians. The selected parent was the same as the parent to whom the consent letter
was addressed and the parent who trained personnel obtained consent from on the phone.
Parents in the control group received the default level of information that the schools and
the teachers provided. This included report cards that are sent home after each marking
period every six to nine weeks along with parent-teacher conferences and any phone calls
home from teachers. As discussed above, all parents had access to the online gradebook.
Figure A.1 shows the timeline for the first year of the experiment and data collection.
Baseline data were collected from June to July 2015. We obtained demographic and enroll-
ment data for the 2014-2015 school year from KCS along with contact and address infor-
mation. Consent letters were sent out beginning August 2015 during the beginning of the
school year. Calls requesting verbal consent were completed in September. Randomization
into treatment and control was completed in early October 2015. For parents who were
selected into treatment, introductory text messages were sent late that same month. In-
cluded in the texts was the option to stop at any point by replying “stop” or any equivalent
variation.15 Over the course of the study, nine parents or guardians requested the messages
stop.16 The intervention ran between the end of October 2015 through the end of May when
the school year was expected to conclude. Officially, the academic school year ended in early
June, but varied slightly based on weather-induced make-up days at each school. After the
end of the school year we proceeded to collect endline survey data both by phone and by
mail as described below.
At the end of the 2015-2016 year, we asked KCS whether we could continue the inter-
vention for a second year. KCS agreed to continue the intervention, but limited our data
collection to outcomes originating from the gradebook.
15We manually tracked replies to ensure the service was shut off when requested.16These parents were included as “treated” families in all analyses.
10

III Data Collection
We gathered data from multiple sources: administrative data, gradebook data, survey data,
and texting data. We collected initial baseline data from administrative records on student
grades, courses, attendance, race and ethnicity, English language status, and contact infor-
mation. We also obtained data from the gradebook application, which includes student’s
grades, assignments and assignments scores, class-level attendance and parent logins into
the parent portal. These baseline data were available for all students in our sample frame.
During the intervention we obtained monitoring records on the text messages. We used these
data to track messaging stop rates, whether text messages were received by phone numbers,
and the total number of text messages that went out weekly.
After the 2015-2016 school year concluded we surveyed parents. The surveys took place
during between June and August 2016. Initially, households were sent a letter stating that
they would be called for a survey. This letter included a $5 unconditional award as an
appreciation for their participation in the study. Households were then called by trained
interviewers to conduct the survey. Around this time, West Virginian residents were afflicted
by severe flooding during several torrential storms in June 2016. Sadly, more than 1,000
people were left homeless in Kanawha County alone. During the summer, KCS had multiple
schools declared “total losses” by the Federal Emergency Management Agency because of the
flooding. As a result, we decided to mail surveys home instead of proceeding with subsequent
rounds of calling. We provided a reward of $30 for paper surveys returned postmarked by
August 8th, 2016. Our total response rate was 40%. A copy of our survey can be found
in Appendix B.10. The goal of the endline surveys was to examine parent responses to the
intervention not captured by administrative data. Parents were primarily asked about their
communication habits with the school in recent months, their perception of the child’s effort
and achievement, and their communication and motivational habits with their child.
In the summer we obtained administrative data from the district and the gradebook
application once again. These included standardized exam scores and suspension data,
11
students’ final grades and assignment scores, daily class-level attendance, alerts received by
treatment and control group, and parent and student logins into the parent portal.
Outcome Measures
Prior to obtaining outcome data, we registered our analysis plan, which specified subgroups
of interest, regression specifications and primary outcomes. Our analysis plans specified
primary outcomes to be number of classes failed, total classes attended, student retention,
and math and reading standardized test scores. Primary outcomes are derived from both the
gradebook application and the KCS administrative data. Included in the gradebook data
are outcomes related to the number of missing assignments, assignment scores, and class
grades. Administrative data contained state test scores in math and reading.
The standardized test scores are from the Smarter Balanced assessment, which is aligned
to the Common Core. We received scaled standardized test scores for Math and ELA for
2015 and 2016 examinations. These were the first two years in which the assessment was
given after the state switched from the previous standardized test in West Virginia, the
Westest. At the time, students in grades 3-11 were required to take the Smarter Balanced
assessment.
We also obtained behavior-related outcomes from the gradebook application and KCS.
These provided data on suspension rates, measured as the quantity of occurrences and the
number of days suspended as well as attendance measures at the class level. Following our
analysis plan, we convert the latter into “number of classes present” (number of classes
marked either present or tardy) because effects on retention potentially cause an increase in
absences while increasing the number of days enrolled. We code suspensions into an indicator
for ever being suspended.
Lastly, we use the assignment-level data to examine the effects on missed assignments,
assignment scores, and class test scores. We identify tests and exams by the assignment titles
containing the words “test” or “exam.” Assignment scores and test scores are standardized
according to the classroom means and standard deviations for each assignment or test. We
12

restrict the analyses to those scores three standard deviations or less away from the mean
to remove outliers.17
The survey of parents was designed to examine parent and student responses to the
intervention not captured by administrative and gradebook data. Parents were asked about
their communication with and from the school, their perceptions about how their child was
performing academically, and household behavior such as talking with their child about
their academic progress or taking privileges away as a result of their performance in school.
We use a number of these survey measures, along with other gradebook and administrative
measures, as secondary outcomes in this paper. Tables C.1 and C.2 summarize all the
secondary outcomes variables used in our analysis, their sources, and their construction.
Table C.3 summarizes the hypothesized effect on each outcome; we did not pre-specify
hypotheses for subgroups however.
IV Empirical Strategy & Experimental Validity
We use an instrumental variables strategy to estimate treatment-on-the-treated (TOT) ef-
fects, as registered in our analysis plan. In the first stage we instrument an indicator for
parent i receiving at least one text message alert with the randomly assigned treatment
indicator as follows18
alertedi = α0 + α1Treatmenti +Xiα2 + ηi
Standard errors are clustered at the level of treatment assignment, which is the grade level
in a given school. Xi is a set of pre-specified, individual-level covariates, which are fraction
of days absent in the previous year, baseline GPA, an indicator for a student identified
as Black, an indicator for English-Language Learner status, an indicator for having ever
been suspended in the previous year, an indicator for gender, and an indicator for having
17Analyses are robust to various other restrictions to handle outliers, such as excluding observations 4 or 5 standard deviationsaway from the mean, or removing all scores from a particular assignment or exam if even one score is an outlier.
18The dependent variable in the first stage is an indicator for ever being alerted post-treatment and not the number of alertsa family receives. Using the latter slightly increases precision but is less intuitive to interpret.
13

special needs. When the outcome in the second stage is test scores, the baseline test score is
included as well. Missing covariates are imputed with the mean baseline value and indicators
for missing are added to the regression. All regressions include strata indicators as controls.
The second stage then regresses an outcome on the instrumented alertedi variable. There
are 76 clusters, and standard errors are always clustered at the level of treatment assignment
as described above.
When looking at assignments and class test scores there are multiple observations—more
than 70,000 assignments and 7,000 tests across the entire sample and all courses—post
treatment. This means there are multiple observations per student. The baseline control
variables remain the same as above when we analyze these outcomes.
We analyze subgroups by restricting the sample to each subgroup and studying outcomes
in the same way as described above. We specified several subgroups of interest: students with
below-median GPA, students with male versus female parents or guardians, and students in
middle versus high school.
Finally, in our analysis plan we hypothesized the intervention will have positive treatment
effects for our primary outcomes. For each of these outcome measures all tests are one-
sided tests for improvements in outcomes, though the positive, significant results we find on
primary outcomes and class test scores would pass two-sided tests at the 5% level as well.
Since we do not always have a strong hypothesis about the direction of any potential effect
for our secondary outcomes and subgroups, we use two-sided tests. Appendix C.3 lists our
secondary outcomes and hypothesized effects.
Baseline Treatment-Control Balance
Table 1 presents baseline summary statistics for the control group, the difference in means
from the treatment group and the p-value showing the statistical significance of these differ-
ences. Demographically, the sample is 49% female, 16% black, and the majority of students
live in two-parent households. On average, students’ baseline GPA is 2.8, they have missed
6% of school days, and 20% have been suspended in the last year. The contrast between
14

by-class and full-day absences is stark: students miss 10% of all classes as opposed to 6% of
full days. As in Bergman (2016), many more students have logged into the online gradebook
portal than parents. Finally, randomization appears to have created a treatment and control
group that are similar in terms of observable variables; no treatment-controls differences are
statistically significant at the 10% level. We also regress baseline covariates on our treatment
indicator and conduct an F-test for whether these baseline covariates are jointly equal to
zero. The test cannot reject that the coefficients on these covariates are jointly equal to zero
(p-value equals 0.61).
Attrition and Non Response
There are several sources of attrition and non response in this study: missing academic
outcomes, missing behavior outcomes, and survey non response. A particular concern is
whether there is differential attrition by treatment status, which would invalidate our ability
to make causal inferences from the data.
Table B.2 shows the effect of treatment status on several measures of attrition as well
as other correlates of attrition. The first column shows there is no treatment effect on the
likelihood a parent responds to the survey: the point estimate is both small and statistically
insignificant. Academic and demographic characteristics are generally poor predictors of
survey response as well, with the exception of “percent of days missed” the previous academic
year, which is significant at the 5% level. This is encouraging because it provides some
suggestive evidence that our survey sample may be representative of many families in the
study.
This pattern generally remains true across the remaining indicators of missing data: school
suspensions, math scores and reading scores. There are no treatment effects on any of
these indicators. Only the percent of days missed the previous year is a strong predictor of
missing math and reading score, which is not surprising that attendance the previous year
predicts having measures in the current year. There are no significant predictors of missing
suspension data. Overall, there is no evidence of differential attrition or non-response by
15

treatment status. Additionally, attrition from course taking will be an outcome of retention
analyzed below. We define retention in the district as a student taking at least one course
post intervention.
V Results
Descriptive Results
We begin by describing the amount of communication between parents, children and schools
as well as parents beliefs about their child’s performance and their correlates. Figure A.2
shows the frequency of contact parents’ receive from their child’s school about their aca-
demic progress, as measured by the control group’s response to our survey. Nearly 50% of
parents hear from the school less than once every three months. On the other hand, 25% of
parents hear from their child’s school twice per month, which shows the variation in families
who are contacted frequently and those who are not. Table B.3 examines the correlates of
infrequent contact in column one. Surprisingly little predicts this infrequency. Neither GPA
nor behaviors nor demographics significantly correlate with an indicator for hearing from the
school less than once every three months. This question does not, however, assess whether
parents find this communication useful.
Figure A.3 shows how often parents talk with their child about their progress in school.
55% of parents report talking with their child every day about their schoolwork. Roughly
75% of parents talk with their child 2-3 times per week or more. At face value, it appears their
child’s schoolwork is at the top of parents’ mind. One caveat is that this communication
is self-reported, which may be subject to social-desirability bias. Parents’ conversations
about schoolwork is also demonstrated in Figure A.4, which shows how often parents talk to
another adult in the household about their child’s school work. For this behavior, no parent
reports doing so every day, but 40% of respondents say they talk with another adult 2-3
times per week about their child’s schoolwork or grades. Column two of Table B.3 shows
that, unsurprisingly, two-parent households are much more likely to have intra-household
16

communication about their child. Little else seems to correlate with this behavior however.
Figure A.5 and Figure A.6 present control group parents’ beliefs about their child’s aca-
demic performance in terms of assignment completion and math grades, respectively. Figure
A.5 shows the number of assignments parents believe their child has missed in the past
semester. More than 50% of parents believe their child has not missed any assignments.
According to administrative data, only 20% of respondents’ children have missed no as-
signments. However parents have much more accurate perceptions about their child’s math
grades: 60% accurately state their child’s grade in math and around 25% overstate their
child’s grade in math. Many fewer underestimate it. Table B.3 shows that inaccurate beliefs
strongly and negatively correlate with their child’s GPA.
The final column of Table B.3 shows a measure of the quality of communication between
parents and their children: an indicator for whether parents believe it is difficult to be in-
volved in their child’s education because their child does not tell them enough about their
academic progress. 48% of parents believe their child does not disclose enough information
about their academic progress to be easily involved in their education. This indicator neg-
atively correlates with student’s GPA and whether or not they are in high school. Parents
with older or lower performing children are more likely to perceive that their child is not
telling them enough about their schoolwork. In results not shown, parents who report that
their children do not disclose enough also report receiving significantly fewer report cards
from their child’s school as well.
Overall, these descriptives highlight how the information flow between parents, schools
and their children may be particularly impeded when the child is performing poorly in school.
While many parents frequently talk with their child and another adult in the household about
their academic progress, nearly one-half of parents believe it would be easier to be involved
in their child’s education if their child told them more about their schoolwork. The latter
correlates strongly with students’ grades and the receipt of report cards. In terms of parents’
beliefs, parents tend to have more accurate beliefs about a student output—their grades—
which is in line with what is provided on report cards. However, parents have much less
17

accurate beliefs regarding a primary input to their child’s grades: assignment completion. A
key question is whether the automated-texting intervention studied here can increase parents
access to timely, actionable information and improve academic outcomes. The next section
examines the effect of the treatment on school-to-parent communication and then looks at
the effect on academic outcomes.
School-Parent Contact
We first assess whether the intervention functioned as intended by looking at administrative
data on alerts sent and received by parents and parent self reported data on communication
received from their child’s school.
Table 2 shows the effect of treatment status on alert receipt using administrative data.
The first column shows an increase in the share of parents who received at least one alert as
a result of the treatment. Parents in the treatment group were 71 percentage points more
likely to receive an alert than the control group. Not every family had a cell phone to receive
text messages, so compliance is imperfect. As discussed above, all parents in the study could
access the platform and any parent could turn on our alerts by logging into the platform and
turning on the alert feature. However Table 2 shows that only two percent of the control
group received any alert. The second column shows the additional number of alerts that the
treatment group received over the course of the school year relative to the control group.
Treatment group families received nearly 50 text-message alerts, on average. The remaining
columns break the alerts down by the number of each type parents received. Most messages
were absence and assignment alerts because these were sent out weekly; families received
21 of each of these alerts, on average. Low-grade alerts went out monthly and so families
received about six low-grade alerts, on average.
We use survey data to examine whether parents also report receiving more contact from
the school about their child’s academic progress. Note that this includes any form of contact
including phone call, letter, email or text message from the intervention. Parents could
respond: “about twice a month,” “about once a month,” “once every two or three months,”
18

and “less than once every three months.” We specified that we would code this into an
indicator for being contacted once per month or more, but we show mutually exclusive
indicators for every possible response for completeness.
Table 3 shows the effects of treatment assignment on these parent-reported measures of
contact form the school. Aside from this first column outcome, the remaining columns show
effects on mutually-exclusive indicators of contact from the school. The control group means
at the bottom of the table indicate that 45% of parents hear from their school less than three
times per month about their child’s progress. Column one looks at the indicator for whether
parents are contacted at least once per month. 38% of the control group is contacted at least
once per month, and the treatment increases this by 19 percentage points. The remaining
columns show that much of the increase in contact comes from the likelihood parents are
contacted once per month (column three) and there is a 12 percentage point reduction in
the likelihood that a parent reports being contact less than once every three months.
Primary Academic Outcomes
In our analysis plan we specified five primary outcomes guided by the nature of the treatment,
which targeted attendance, low grades and missed assignments. These outcomes are the
number of classes students failed, the number of classes attended, retention in the district,
and math and reading standardized test scores.
Table 4 presents the effects on these outcomes based on TOT estimates. Column one
shows that students, on average, fail one course. Receiving text message alerts reduced this
by 39% or 0.38 points. The outcome in column two is class attendance. The effect of receiving
text message alerts is again large and significant: students attend roughly 50 more classes
than the control group, which is an 18% increase over the control-group mean. Column three
examines retention. 3% of students in the control group did not take at least one course in the
district in the second semester as opposed to 1% of students whose parents received alerts.
Intent-to-treat (ITT) estimates, which are shown in B.1, are more conservative yet highly
similar in direction and magnitude. ITT estimates may give a realistic sense of total effects
19

across a treated group, but TOT estimates present a more accurate treatment effect for those
who are treated. Going forward, we will present all effect estimates as TOT estimates.
The effects on test scores are small and statistically insignificant. There are several
possible reasons for this given the results discussed above. A key concern is that the exams
have zero stakes for students because they have no implications for their grades or their
likelihood of graduating. This issue is evident to district officials, who have expressed concern
that students are spending less time on the exam than is expected. Smarter Balanced, the
test provider, estimated that 9th, 10th, and 11th-grade students need approximately 210
minutes to complete the exams at each grade level. However 9th graders spent 80 minutes
to complete the exam, 10th graders spent 67 minutes, and 11th graders spent 78 minutes
to complete the exam, on average.The State Superintendent said in response that “our
students are competing with Advanced Placement exams, SAT, ACT, final exams, and then
we throw in Smarter Balanced. They have told me they’re not taking it seriously.” Of
particular concern was what he saw as a “lack of effort by high schools on the test.”19
We examine these claims empirically. We look at the correlations between students’ GPA
and the standardized test scores by regressing math and reading state test scores on students’
baseline GPAs. We can also differentiate these correlation between middle and high school
students to assess the Superintendent’s concern. Table B.7 shows the results. The disparity
in the correlations for middle and high school students is large: columns two and four show
that the correlation between GPA and test scores is roughly half as a large for high schools
as it is for middle schools. For middle school students, the correlation between GPA and
math scores and reading scores is 0.75 and 0.86, respectively. For high school students, these
correlations are 0.43 for math and 0.44 for reading and this difference between middle and
high schools statistically significant (p-value<0.0003). The state has decided to discontinue
using the test in future years.
Second, the intervention may result in additional student effort for educational inputs
that improve course grades but not learning outcomes reflected in the state test scores. The
19This made the local newspaper: Charleston Gazette-Mail.
20

outcomes discussed above show improvements in students’ coursework and attendance. How-
ever, the curricular material covered during this additional course time may not necessarily
reflect the material covered in the exams, especially as the exams were only recently imple-
mented in 2015. The superintendent stated they are “working on standards-based teaching
making sure all the standards are covered.”20 Moreover, because the exams had only re-
cently been introduced, no school-based accountability measures associated with the exams
had been released. These reasons may attenuate the potential to impact state test scores.
Secondary Academic Outcomes and Behaviors and Robustness
Table 5 presents the effects on students’ marking period course grades in more detail. Column
one shows the effects on the number of failed courses, as before, but columns two through
five show the effects on the number of D’s, C’s, B’s and A’s students received as well. The
intervention appears to shift students failing grades to C grades. Column one shows the large
and significant negative effect in the number of F’s students receive presented above. Column
three shows a large and significant positive effect—a 0.3 point increase—in the number of C’s
a student receives. The coefficients on the number of B’s and A’s are negative and positive,
respectively, but neither estimate is statistically significant. Overall, the evidence suggests
that the treatment caused students to receive fewer F’s and more C’s. This makes sense
given the nature of the intervention, one facet of which is to alert parents when their child
is getting a low grade. This is also consistent with the positive impacts on below-average
GPA students, which we discuss when we present results on heterogeneous effects.
In Table 6 we look closer at assignment scores, missed assignments and class test scores.
Column one shows that assignment scores improved by 0.09 standard deviations over the
control group. On average, the control group does not submit 12% of their assignments,
which includes both classwork, exams and homework. There is a two percent reduction in
the number of assignments completed. As we show later, the effects are driven entirely by
high school students, who do experience significant—both statistically and in magnitude—
20This quote is from the Charleston Gazette-Mail.
21

reductions in missed assignments. Not shown, all students (both treatment and control) are
much less likely to miss class tests—68% less likely—than any other type of assignment.
In contrast to the states’ standardized test scores, scores on class tests increased by 0.13
standard deviations. One important difference between class tests and the standardized
tests, among several, is that these scores count for students’ grades and will contribute to
the likelihood of a students’ parent being alerted or not. The latter may provide added
incentive for students to do well on these tests as a result of the alerts, especially as parents
are alerted about low grades.21 Comparing column one to column three, the treatment effects
are suggestively larger for tests than assignments overall, which are worth more points than
other assignments, but this difference is not statistically significant. Lastly, Table B.4 shows
that all of these results are robust to other treatments of outlier observations.
Table 7 provides the treatment effects on GPA, suspensions, and student logins. We find
a positive effect on GPA of 0.10 points, which is significant at the 10% level. The impact
on suspensions is small and insignificant. The coefficient on student log ins is positive but
not nearly significant at conventional levels. Shown below, the effect on GPA is particularly
strong for students in high school and students with below-average GPAs at baseline. Overall,
the improved assignment scores and net positive impact on GPA overall is encouraging. It
is possible for students to have held their effort constant and then reallocated it toward
their failing courses. The latter would not necessarily be negative given that it would result
in increased credit completion, but the effects on attendance, assignment scores, and GPA
provide evidence of overall net increase in student effort.
Mechanisms and Heterogeneity in Effects
We hypothesized that the intervention could improve the accuracy of parents’ beliefs about
their child’s performance. We show the effects on parents’ beliefs about the number of assign-
ments their child has missed in Table 8. We asked parents whether they thought their child
21Recent research has shown how higher stakes causes increased test scores for U.S. students (Hitt, 2016; Zamarro et al.,2016; List et al., 2017), which can occur by reducing irrelevant answers to questions, such as writing in nonsensical words forquestions with numeric answers or as using “careless” and “inconsistent” answering patterns as Hitt (2016) and Zamarro et al.(2016) find evidence of on the PISA exam.
22

missed no assignments, 1-5 assignments, 6-10 assignments, or more than 10 assignments.22
Column one shows that 53% of parents in the control group believed their child missed zero
assignments in the last semester. The treatment reduces this belief by 15 percentage points.
We can see from the remaining columns that the treatment shifts responses away from no
missed assignments across the remaining categories. There is a statistically significant, 9
percentage point increase, in the likelihood parents respond that their child has missed 6-10
assignments. Only 6% of the control group believes their child missed 6-10 assignments.
Figure A.7 compares these beliefs about missed assignments to the number of missed
assignments documented in the administrative data. This figure, which depicts the abso-
lute categorical differences in parental beliefs of missed assignments minus actual missed
assignments, makes it apparent that there is no treatment effect on the accuracy of parents’
beliefs about their assignment completion, despite the large reduction in the share of parents
who believe their child missed no assignments. Figure A.8 shows a similar representation of
parents’ beliefs about their child’s math grades relative to the grade in the administrative
data. Here, there is a more visible improvement in parents’ accuracy: the share of parents
accurately reporting their child’s grade increases by 9 percentage points and the magnitude
of their errors tends to be smaller as well. We show this difference in a regression, discussed
below, but a test of these distributions finds they are significantly different at the 5% level
as well.23
Table 9 shows several behavioral responses to the treatment by parents. Column one in
Panel A shows that parents are much more likely to contact the school as a result of the
intervention. The share of families who contacted the school more than once over the course
of the semester increased by 17 percentage points. This is in line with Bergman (2014), who
found that parents contacted the school more often in response to additional information.
While the treatment effects on parent logins to view their child’s grades the effect is not
statistically significant, parents were also asked whether they took away any privileges during
the last month of school for not doing their schoolwork, which is coded as an indicator for yes
22We found this phrasing reduces the potential for outlier responses.23We use a permutation test to compare the distributions (p-value is 0.048).
23

or no. The effect is positive and not statistically significant, though it is close to conventional
levels of marginal significance (two-sided test; p-value<0.14). The question is worded slightly
differently, but Bergman (2014) found parents were significantly more likely to take away
privileges from their children.
As reported above, column two of Panel B shows parents become significantly more
accurate about their child’s grade in math class. Lastly, the third column of Panel B asks
parents if they would like to continue the text message intervention. A high share—94%—of
the control group would like to receive the intervention. The latter is not surprising, but what
is encouraging is that the treatment causes a significant increase in parents’ demand for the
text messages of four percentage points. This suggests that what new information parents
learn from receiving the alerts increases their subsequent demand for the intervention.
Given that the intervention targeted those with low grades and attendance, we are par-
ticularly interested in the subgroup of students who began the study with below-average
GPAs. The heterogeneous effects also highlight the mechanisms. For instance, we see that
biased beliefs about students’ grades and poor parent-child communication positively corre-
late with students in high school and students with low GPAs (Table B.3), and we examine
how the treatment effects differ according to these subgroups that exhibit larger biases.
We pre-specified students with below-average grades (by grade level), students whose father
received the messages versus those whose mother received the messages, and students in
middle school compared to students in high school. Tables B.8-B.10 present analyses for
these groups.
Table B.8 shows that students with below-average GPA failed 0.9 fewer classes, attended
64 more classes, and saw retention rates improve by five percentage points. All of these
effects are significant at the 1% level. The bottom row of the table shows the p-value for
whether the effect for students with lower baseline GPAs is significantly different from those
with higher baseline GPAs. The effects are significantly larger for all of the outcomes just
listed except classes attended.
As before there are no effects on exam scores, but students’ GPA increases by 0.26 points,
24

which is also significant at the 1% level and significantly different from the effect on stu-
dents with higher baseline GPAs. Lastly, Table B.13 shows that students with below-average
GPAs missed 25% (5 percentage points) fewer assignments. As suggested above, these het-
erogeneous results are consistent with our survey findings showing a negative correlation
between parents who believe that their child does not disclose their academic progress and
their child’s GPA.
Furthermore, for this subgroup of students, the treatment effect of message receipt on
parents’ desire to continue the intervention is 11 percentage points and significant at the 1%
level (results not shown). This effect on the desire to continue is significantly different from
the effect on parents of children with above-average GPA, who express no greater desire to
continue the intervention than the control group (however the mean for the latter is already
above 90%). This is evidence of larger benefits for families who children have lower GPAs
in the sample.
Table B.9 shows that high school students were also more positively impacted than the
average student. These students failed 0.7 fewer classes, attended 43 more classes, and
were 4 percentage points more likely to remain in the district. Moreover, these effects are
substantially different from the effects on middle school students, shown in Panel C. The
effects for the latter group are nearly all smaller and statistically insignificant, with the
exception attendance. Additionally, table B.13 shows that high school students also missed
many fewer missed assignments (26% or four percentage points).
We examine several possible explanations for the lack of effects in middle school. First,
we examine the first stage of the treatment on the alerts for the middle and high school
subgroups in Table B.15. The share of parents alerted in both groups is nearly identical, but
columns two and four show how many times high school parents were alerted and middle
school parents were alerted, respectively. Parents of high school students received roughly
twice as many alerts, which is statistically different at the 1% level. This difference is
largely because middle school students perform much better in their grades than high school
students. For instance, middle school students’ GPAs is one half-standard deviation higher
25

than high school students’ GPAs (in addition to receiving fewer alerts, this also implies they
have less room to improve). Second, we find that parents of high school students have more
inaccurate beliefs. For instance, parents of middle school students are 8 percentage points
more likely to accurately recall their child’s last math grades.24 As discussed above, parents’
beliefs about their child’s math grades become significantly more accurate as a result of
the intervention. In results not shown, this effect is driven almost entirely by high school
students’ parents and is statistically different than the effect on middle school parents’ beliefs
at the 10% level.
Table B.10 shows the effects for targeting information to mothers and the fathers. While
there are slight differences in effects by gender of the treated parent, the coefficients are
similar in sign and there is no clear pattern. Targeted fathers saw their children experience
slightly better results in terms of classes failed and classes attended. In this context, we find
no clear evidence that targeting one parent versus another yields different results.
Given the lack of effect on standardized test scores, a question is whether there were effects
on these test scores for any subgroup. We conducted exploratory analyses to answer this
question. In results not shown, we find that parents who had never logged into the gradebook
system to view their child’s grades show positive effects on math scores and larger effects
in other domains. However we checked for these larger effects in a different study on the
adoption of this texting technology and there were no differential effects according to this
subgroup in that study. Parents with less than a college education also experience positive
effects on their child’s test scores, but this is a small subgroup as the measure of parents’
education is based on surveys. To corroborate this finding and expand the sample beyond
the survey respondents, we linked families to census-tract-level data on college attainment
and household income levels. Families living in tracts with below-median income or below-
median college attainment relative to the rest of the sample experience larger effects, which
are similar to the effects found for high school students, but not in terms of test scores.25
24Much of this difference is explained by high school students’ lower GPAs.25Results of income and parent educational attainment are shown in the Appendix. Table B.11 shows that students residing
in census tracts where households have below-median income in Kanawha County were more positively impacted than thosefrom census tracts with above median income households. This is especially true for the amount of classes failed and classesattended, where students from below median income households showed substantially larger effects. In terms of education
26

These results should be viewed with caution as they are exploratory. We note them here if
they prove useful in defining subgroups worthy of study in future research.
Second-Year Impacts and Alternative Explanations
The district permitted us to continue the intervention into a second year, however we were
only able to collect data from the teacher gradebooks. By that year KCS had discontinued
their standardized tests in all but the 11th grade. The flooding throughout the county
significantly disrupted student learning. For instance, students attending one middle school
and one high school only attended half days of school because flooded school sites were
closed. Middle school students attended classes in the morning and high schools students
in the afternoon. Nonetheless, our intervention tracked students even if they moved schools
within the county, though the second-year results must be interpreted within this context.
The sample is reduced to 1,031 students because 12th-grade students from the first year
graduated.
We report results for the overall sample and the subgroups that appeared to drive the
initial-year results: the high school sample, the below-average GPA sample, and the middle-
school sample. The latter appeared to experience little benefit in the first year of the inter-
vention.
Table B.14 summarizes outcomes found in the course transcripts: courses failed, classes
attended, retention, and overall GPA during the 2016-2017 school year. The reduction in
courses failed is negative, smaller in magnitude, and no longer statistically significant. The
effects on attendance are still positive and significant, the magnitude on the retention effect
is the same as year one but not statistically significant, and the effect on overall GPA is
nearly identify in magnitude and significance. The subgroup analysis by middle and high
school reveals why the effect on course failures attenuated: the effects on high school students
remains large and significant but the effects on middle school students, which was previously
levels, the differential effects were more modest, as seen in table B.12, which shows the differences between students living inhouseholds from census tracts with below and above-median bachelor’s degree attainment in Kanahwha county. The magnitudeand significance of effects in classes failed and classes attended were both substantially larger for students from below medianeducation households. Overall, the intervention seems to affect families from low socioeconomic backgrounds more so thanbetter-off families. However, there are still no substantial effects on test scores.
27

zero, is now positive, though not statistically significant at conventional levels. Overall,
the subgroups whose outcomes improved in year one continued to see beneficial effects in
year two while the middle school effects remain, overall, insignificant (either positively or
negatively).
Evidence regarding the ability for informational interventions to persist is mixed (cf.
Allcott and Rogers 2014). Parents could have become habituated and unresponsive to a
continual stream of information over a longer period of time. Though a second year of
implementation does not provide conclusive evidence on its long-run effects, that results
persist into a second year is nonetheless encouraging.
However, one concern with the outcome studied above is that teachers and students,
though blinded to the random assignment, may have changed their behaviors as well. Teach-
ers may have shifted attention or increased the frequency with which they grade assignments,
and, though the intervention was randomly assigned at the school-by-grade level so that
control students were always in a different grade than treated students in order to mitigate
spillovers, spillovers may have occurred nonetheless.
We assess these hypotheses in several ways. First, we observe teacher logins into the
gradebook, which would allow us to discern if teachers increase the frequency with which they
record grades in their classrooms. Though this would be interesting if teachers responded in
this fashion, we find no impacts of the intervention on teacher logins into the gradebook for
teachers who taught in treated grades compared to those teachers who did not.26 Second, we
can observe gradebook outcomes for students who were not randomized into the intervention
or the control group—the remainder of the initial recruitment sample frame. Among these
students, we can compare those students who were in treated school grades (but were not
treated because they were not part of the randomization process) and compare their outcomes
to students who were not in treated grades (and were also not part of the randomization
process). If there were evidence of spillovers, we could find that, among students who were
not randomized, those in treated grades have different outcomes than students in untreated
26Results available upon request.
28

grades.27 We regress these gradebook outcomes on an indicator for being in a treated grade
to look at these spillovers for the sample of students not randomized. Table B.5 shows
that, across GPA, course failures, retention and class attendance, we find no evidence of
spillovers—either positive or negative.
Teachers may also have been wary of parent complaints as a result of the increased school-
to-parent communication, and then inflated treated students’ grades to avoid this reaction.
We look at this possibility by examining the assignment data in greater detail. One easy
way teachers could inflate grades is through “participation” grades, which may be viewed
as more subjective grades relative to other assignments. Participation grades are typically
marked as full credit or not—84% of participation grades are 100% scores. We therefore
create an indicator for receiving a full participation grade (100%) or not. Column one of
Table B.6 shows the effects of the intervention on receiving a full participation score. There
is no significant effect and the point estimate is negative. Another way teachers could either
inflates grades or reduce alerts is by marking certain assignments as “excused.” We examine
whether there is a change in the share of assignments marked as excused. Column two of
Table B.6 shows the results, and again there is no significant effect and the point estimate
is zero to two decimal places.
VI Conclusion, Scalability and External Validity
We helped design and implement an automated-text messaging intervention to test whether
this technology can resolve parent-child information problems and improve student achieve-
ment at scale. Our intervention sends automated weekly and monthly text message alerts
to parents when their child misses a class or an assignment, or if they have a low course av-
erage. A unique feature of the intervention is that it targets class-level absences as opposed
to full-day absences.
We find receiving alerts significantly reduces such absences, along with course failures and
district attrition, though not state test scores. These effects are larger for lower-performing
27Among students who were not part of the randomization process, we only have outcomes from the gradebook.
29

students and students in high school, who also miss fewer assignments as a result. Notably,
the effects are negligible for middle school students. Students saw a shift in grades from F’s
to C’s. This is particularly important given the predictive power of grades on the likelihood
of dropping out (McKee and Caldarella (2016)) and college success (Belfield and Crosta
(2012), Vulperhorst et al. (2017), Olani (2009)). Parents’ beliefs about their child’s grades
become more accurate, but the evidence is more mixed regarding the accuracy of their child’s
missed assignments. We also find increases in parents’ contact with schools to discuss their
child’s academic progress, and this is concentrated among middle school parents.
This intervention is low cost relative to other education interventions aimed at student
achievement. The marginal cost of each text message is less than a fraction of one cent.
If a school were to adopt the entire system in this study and receive training for how to
use it, the cost would be $7 per student. Given this low cost and policy relevance, an
important question is whether this intervention would work in other contexts and whether
this intervention would be adopted by parents and teachers in practice. This paper does
not specifically study the adoption of the intervention by parents. However, Bergman and
Rogers (2017) worked with Washington D.C. Public Schools to examine how varying district
opt-in policies can drastically affect the adoption and, in turn, the efficacy of this particular
text-message intervention. They find that when parents are randomly assigned to opt in
parents by default, fewer than 5% of parents choose to subsequently opt out at any point
during the school year. When parents are randomly assigned to actively opt in, even when
this opt in is as easy as replying to a text message offer, adoption rates are significantly lower.
Bergman and Rogers also find significant reductions in courses failed and increases in student
GPA, especially for high school students. The latter study did not require active consent
as it was a district-initiated intervention. In the current study, less than 2% subsequently
opted out over the course of the treatment period. Another aspect to scale is that not all
districts have a unified gradebook system. For instance, Chicago Public Schools, and District
of Columbia Public Schools do have a unified system, however, New York City does not. Our
findings suggest that such a unified grade-entry system can be a valuable tool if combined
30

with “push” information to parents, as opposed to website-only, “pull” information.
There are other open questions. For instance, we do not provide evidence on varying
the frequencies, timing, and content of the information to send to parents. In our study,
we target messages to low-performing students and we do not know if tailored alerts could
reach higher-performing students along other academic margins. Nor do we study how this
intervention interacts with the amount of information parents already receive from various
sources, and how the presence of additional information may interact with the mode in which
this information is sent. Though possible, we speculate that the primary concern is not
whether there will be many, individually-successful text-message interventions inundating
parents simultaneously. Rather, an alternative scenario is that school districts begin to
recognize that text messages garner parents’ attention and proceed to send even pro forma
communications via text, and parents subsequently ignore all text messages. An important
question for future research is how information interventions interact with the mode of
communication and the existing amount of information flowing to recipients.
31

References
Akresh, Richard, Damien De Walque, and Harounan Kazianga, “Evidence from a
randomized evaluation of the household welfare impacts of conditional and unconditional
cash transfers given to mothers or fathers,” 2016.
Allcott, Hunt and Todd Rogers, “The short-run and long-run effects of behavioral
interventions: Experimental evidence from energy conservation,” The American Economic
Review, 2014, 104 (10), 3003–3037.
Andrabi, Tahir, Jishnu Das, and Asim Ijaz Khwaja, “Report Cards: The Impact
of Providing School and Child Test Scores on Educational Markets,” American Economic
Review, June 2017, 107 (6), 1535–63.
Avvisati, Francesco, Marc Gurgand, Nina Guyon, and Eric Maurin, “Getting
parents involved: A field experiment in deprived schools,” Review of Economic Studies,
2013, 81 (1), 57–83.
Belfield, Clive R and Peter M Crosta, “Predicting Success in College: The Impor-
tance of Placement Tests and High School Transcripts. CCRC Working Paper No. 42.,”
Community College Research Center, Columbia University, 2012.
, Milagros Nores, Steve Barnett, and Lawrence Schweinhart, “The High/Scope
Perry Preschool Program cost–benefit analysis using data from the age-40 followup,” Jour-
nal of Human resources, 2006, 41 (1), 162–190.
Bergman, Peter, “Parent-Child Information Frictions and Human Capital Investment:
Evidence from a Field Experiment,” Columbia University Teachers College Working Paper,
2014.
, “Technology Adoption in Education: Usage, Spillovers and Student Achievement,”
Columbia University Teachers College Working Paper, 2016.
and Todd Rogers, “Is This Technology Useless? How Seemingly Irrelevant Factors
Affect Adoption and Efficacy,” 2017.
, Jeffrey T Denning, Dayanand Manoli et al., “Broken Tax Breaks? Evidence from a
32

Tax Credit Information Experiment with 1,000,000 Students,” Technical Report, Institute
for the Study of Labor (IZA) 2017.
Berlinski, Samuel, Matias Busso, Taryn Dinkelman, and Claudia Martinez, “Re-
ducing parent-school information gaps and improving education outcomes: Evidence from
high frequency text messaging in Chile,” Unpublished Manuscript, 2016.
Bettinger, Eric P, Bridget Terry Long, Philip Oreopoulos, and Lisa Sanbon-
matsu, “The role of application assistance and information in college decisions: Results
from the H&R Block FAFSA experiment,” The Quarterly Journal of Economics, 2012,
127 (3), 1205–1242.
Bird, Kelli A, Benjamin L Castleman, Joshua Goodman, and Cait Lamberton,
“Nudging at a National Scale: Experimental Evidence from a FAFSA Completion Cam-
paign,” Technical Report, EdPolicy Works Working Paper Series No 2017.
Bloom, Benjamin S, “The 2 sigma problem: The search for methods of group instruction
as effective as one-to-one tutoring,” Educational researcher, 1984, 13 (6), 4–16.
Bonilla, Sheila, Sarah Kehl, Kenny YC Kwong, Tricia Morphew, Rital Kachru,
and Craig A Jones, “School absenteeism in children with asthma in a Los Angeles inner
city school,” The Journal of pediatrics, 2005, 147 (6), 802–806.
Bursztyn, Leonardo and Lucas C Coffman, “The schooling decision: Family prefer-
ences, intergenerational conflict, and moral hazard in the Brazilian favelas,” Journal of
Political Economy, 2012, 120 (3), 359–397.
Carrell, Scott and Bruce Sacerdote, “Why Do College-Going Interventions Work?,”
American Economic Journal: Applied Economics, July 2017, 9 (3), 124–51.
Castleman, Benjamin L and Lindsay C Page, “Summer nudging: Can personalized
text messages and peer mentor outreach increase college going among low-income high
school graduates?,” Journal of Economic Behavior & Organization, 2015, 115, 144–160.
and , “Freshman Year Financial Aid Nudges.,” Journal of Human Resources, 2016, 51
(2).
Castleman, Benjamin L. and Lindsay C. Page, “Parental Influences on Postsecondary
33
Decision Making,” Educational Evaluation and Policy Analysis, 2017, 20 (10), 1–17.
Coleman, James S, Ernest Q Campbell, Carol J Hobson, James McPartland,
Alexander M Mood, Frederic D Weinfeld, and Robert York, “Equality of educa-
tional opportunity,” Washington, dc, 1966, pp. 1066–5684.
Cook, Philip J, Kenneth Dodge, George Farkas, Roland G Fryer Jr, Jonathan
Guryan, Jens Ludwig, Susan Mayer, Harold Pollack, and Laurence Stein-
berg, “Not Too Late: Improving Academic Outcomes for Disadvantaged Youth,” Institute
for Policy Research Northwestern University Working Paper WP-15-01. http://www. ipr.
northwestern. edu/publications/papers/2015/ipr-wp-15-01. html, 2015.
Cullen, Julie Berry, Steven D Levitt, Erin Robertson, and Sally Sadoff, “What Can
Be Done To Improve Struggling High Schools?,” The Journal of Economic Perspectives,
2013, 27 (2), 133–152.
Cunha, Flavio and James Heckman, “The Technology of Skill Formation,” American
Economic Review, 2007, 97 (2), 31–47.
Cunha, Flavio, Irma Elo, and Jennifer Culhane, “Eliciting maternal expectations
about the technology of cognitive skill formation,” Technical Report, National Bureau of
Economic Research 2013.
Dizon-Ross, Rebecca, “Parents perceptions and childrens education: Experimental evi-
dence from Malawi,” Unpublished Manuscript. University of Chicago., 2016.
Doepke, Matthias and Michele Tertilt, “Does female empowerment promote economic
development?,” 2011.
Doss, Christopher, Fahle Erin, Susanna Loeb, and Ben York, “Supporting Parent-
ing through Differentiated and Personalized Text-Messaging: Testing Effects on Learning
During Kindergarten,” Technical Report, CEPA Working Paper No.16-18 2017.
Duflo, Esther, “Women empowerment and economic development,” Journal of Economic
Literature, 2012, 50 (4), 1051–1079.
Duncan, Greg J. and Katherine Magnuson, “Investing in Preschool Programs,” The
Journal of Economic Perspectives, 2013, 27 (2), 109–132.
34

Dye, Ronald A, “Disclosure of nonproprietary information,” Journal of accounting re-
search, 1985, pp. 123–145.
Fryer, Roland, “The Production of Human Capital in Developed Countries,” Handbook of
Economic Field Experiments, 2017, 2, 95 – 322.
Gertler, Paul, James Heckman, Rodrigo Pinto, Arianna Zanolini, Christel Ver-
meersch, Susan Walker, Susan M Chang, and Sally Grantham-McGregor, “La-
bor market returns to an early childhood stimulation intervention in Jamaica,” Science,
2014, 344 (6187), 998–1001.
Hastings, Justine S and Jeffrey M Weinstein, “Information, school choice, and aca-
demic achievement: Evidence from two experiments,” The Quarterly journal of Economics,
2008, 123 (4), 1373–1414.
Heckman, James J, “Skill formation and the economics of investing in disadvantaged
children,” Science, 2006, 312 (5782), 1900–1902.
, Seong Hyeok Moon, Rodrigo Pinto, Peter A Savelyev, and Adam Yavitz, “The
rate of return to the HighScope Perry Preschool Program,” Journal of public Economics,
2010, 94 (1), 114–128.
Hitt, CE, “Just filling in the bubbles: Using careless answer patterns on surveys as a
proxy measure of noncognitive skills (EDRE Working Paper 2015-06),” Fayetteville, AR:
Department of Education Reform, University of Arkansas, 2016.
Hoxby, Caroline, Sarah Turner et al., “Expanding college opportunities for high-
achieving, low income students,” Stanford Institute for Economic Policy Research Dis-
cussion Paper, 2013, (12-014).
Jr, Roland G Fryer, “Financial incentives and student achievement: Evidence from ran-
domized trials,” The Quarterly Journal of Economics, 2011, 126 (4), 1755–1798.
Kinsler, Josh, Ronni Pavan et al., “Parental Beliefs and Investment in Children: The
Distortionary Impact of Schools,” Technical Report 2016.
Kraft, Matthew A and Shaun M Dougherty, “The effect of teacher–family communi-
cation on student engagement: Evidence from a randomized field experiment,” Journal of
35

Research on Educational Effectiveness, 2013, 6 (3), 199–222.
Kraft, Matthew and Todd Rogers, “The Underutilized Potential of Teacher-to-Parent
Communication: Evidence from a Field Experiment,” 2014.
List, John, Uri Gneezy, and Sally Sadoff, “Measuring Success in Education: The Role
of Effort on the Test Itself,” Technical Report 2017.
Liu, J. and S. Loeb, “Engaging Teachers: Measuring the Impact of Teachers on Student
Attendance in Secondary School,” CEPA Working Paper, 2017, (17-1).
Mayer, Susan E, Ariel Kalil, Philip Oreopoulos, and Sebastian Gallegos, “Using
behavioral insights to increase parental engagement: The parents and children together
(PACT) intervention,” Technical Report, National Bureau of Economic Research 2015.
McKee, M Todd and Paul Caldarella, “Middle school predictors of high school perfor-
mance: a case study of dropout risk indicators,” Education, 2016, 136 (4), 515–529.
Nores, Milagros and W Steven Barnett, “Benefits of early childhood interventions
across the world:(Under) Investing in the very young,” Economics of education review,
2010, 29 (2), 271–282.
Olani, Aboma, “Predicting first year university students’ academic success,” Electronic
Journal of Research in Educational Psychology, 2009, 7 (19).
Olds, David L, “The nurse–family partnership: An evidence-based preventive interven-
tion,” Infant Mental Health Journal, 2006, 27 (1), 5–25.
Oreopoulos, Philip and Uros Petronijevic, “Student Coaching: How Far Can Technol-
ogy Go?,” Technical Report, National Bureau of Economic Research 2016.
Page, Lindsay C and Hunter Gehlbach, “How an Artificially Intelligent Virtual Assis-
tant Helps Students Navigate the Road to College,” Technical Report 2017.
, Benjamin Castleman, and Katharine Meyer, “Customized Nudging to Improve
FAFSA Completion and Income Verification,” 2016.
Rogers, Todd and Avi Feller, “Reducing student absences at scale,” Unpublished paper,
2016.
Shin, Hyun Song, “The burden of proof in a game of persuasion,” Journal of Economic
36

Theory, 1994, 64 (1), 253–264.
Todd, Petra E and Kenneth I Wolpin, “The production of cognitive achievement in
children: Home, school, and racial test score gaps,” Journal of Human capital, 2007, 1 (1),
91–136.
Vulperhorst, Jonne, Christel Lutz, Renske de Kleijn, and Jan van Tartwijk, “Dis-
entangling the predictive validity of high school grades for academic success in university,”
Assessment & Evaluation in Higher Education, 2017, 0 (0), 1–16.
Whitney, C. and J. Liu, “What We’re Missing: A Descriptive Analysis of Part-Day
Absenteeism in Secondary School,” AERA Open, 2017, 3 (2), 1–17.
Yoong, Joanne, Lila Rabinovich, and Stephanie Diepeveen, “The impact of eco-
nomic resource transfers to women versus men: A systematic review,” Technical Report,
University of London, 2012.
York, Benjamin N and Susanna Loeb, “One step at a time: the effects of an early
literacy text messaging program for parents of preschoolers,” Technical Report, National
Bureau of Economic Research 2014.
Zamarro, Gema, Collin Hitt, and Ildefonso Mendez, “When Students Don’t Care:
Reexamining International Differences in Achievement and Non-Cognitive Skills,” 2016.
37

VII Tables
Table 1: Summary Statistics and Treatment-Control Group Balance
Variable Control Mean Treat-Control Diff P-Value Obs KCS Mean KCS Obs
Female 0.49 -0.01 0.69 1137 0.49 13911Black 0.16 0.04 0.37 1137 0.12 13911ELL 0.02 0.00 0.77 1137 0.02 13911IEP 0.13 0.01 0.74 1137 0.15 13911Baseline Math 0.00 0.05 0.54 1137 – –Baseline Reading 0.00 0.01 0.84 1137 – –Suspended Last Year 0.20 0.01 0.66 1137 0.20 13911Baseline Parent Logins 15.26 -0.67 0.83 1137 12.72 13911Baseline Student Logins 93.54 -4.01 0.49 1137 86.67 13911Baseline GPA 2.82 0.01 0.78 1137 2.84 13832Baseline % of Days Missed 0.06 0.01 0.16 1137 0.07 13872Baseline % of Classes Missed 0.10 -0.01 0.52 1131 0.12 13448Parents in the Household 1.77 -0.03 0.37 1137 1.82 13911
This table shows the balance on covariates between randomized treatment and control groups. P-values are for tests of equality of meansacross the treatment and control group via a regression of the baseline covariate on an indicator for treatment status. Standard errorsclustered by student. All regressions include strata indicators. The last two columns show the means and observations for entirety ofsample frame, which included all middle and high school students at baseline. Baseline Math and Reading scores were not available forthe sample frame.
Table 2: Administrative Data on Alerts
Alerted Alerts Assignment Absence Low Grade
Treated 0.71*** 48.92*** 21.61*** 20.81*** 6.46***(0.02) (3.11) (1.19) (2.04) (0.40 )
Control Mean 0.02 0.37 0.06 0.01 0.06
Observations 1,137 1,137 1,137 1,137 1,137
This table shows the likelihood and amount of times parents are alerted due to being randomizedinto treatment. Alerted is an indicator for ever alerted. Alerts is the number of alerts received.Assignment, Absence, and Low Grade are the number of alerts received by parents by alert type.All regressions include strata indicators and a set of demographic covariates described in the text.Standard errors are clustered at the grade-school level. Outcome variables are from gradebookand administrative data. *** p<0.01, ** p<0.05, * p<0.10.
38

Table 3: School to Parent Contact about Child’s Academic Progress
≥ 1x / month 2x / month. 1x / month 1x / 2-3 month < 1x / 3 month
Alerted 0.19** 0.06 0.13** -0.07* -0.12*(0.08) (0.07) (0.06) (0.04) (0.07)
Control Mean 0.38 0.25 0.13 0.16 0.45
Observations 424 424 424 424 424
This table shows the results for how often schools contacted parents in any way about their child’s academic progressin the last semester. Results are estimated using 2SLS regressions with the instrumented alerted variable, an indicatorfor parents who received at least one text. All regressions include strata indicators and a set of demographic covariatesdescribed in the text. Standard errors are clustered at the grade-school level. The outcome variables are all from endlineparent surveys. *** p<0.01, ** p<0.05, * p<0.10
Table 4: Primary Academic Outcomes: TOT Estimates
Classes Failed Classes Attended Retained Math Score Reading Score
Alerted -0.38*** 48.46** 0.02** -0.01 -0.08(0.14) (23.08) (0.01) (0.06) (0.05)
Control Mean 0.97 277.70 0.97 0.00 0.00
Observations 1,113 1,137 1,137 927 925
This table shows treatment-on-the-treated (TOT) effect estimates on primary academic outcomes specified in the pre-registered analysis plan. Treatment effects are estimated using 2SLS regressions with the instrumented alerted variable,an indicator for parents who received at least one text. All regressions include strata indicators and a set of demographiccovariates described in the text. Standard errors are clustered at the grade-school level. Outcome variables are fromgradebook and administrative data. Classes failed are total failed courses after treatment started. Classes attended isthe numerical total of classes marked as present after treatment started. Retention is defined as taking courses afterthe intervention began. Math and Reading scores are z scores from standardized test scores. All tests for primaryoutcomes are one-sided tests. *** p<0.01, ** p<0.05, * p<0.10
Table 5: Student Grades
F D C B A
Alerted -0.38*** 0.10 0.29** -0.17 0.25(0.14) (0.10) (0.12) (0.12) (0.26)
Control Mean 0.97 0.84 1.32 1.79 3.33
Observations 1,113 1,113 1,113 1,113 1,113
This table shows treatment effects on the number of each grade studentsreceived after the treatment began. Effects are estimated using 2SLS re-gressions with the instrumented alerted variable, an indicator for parentswho received at least one text. All regressions include strata indicators anda set of demographic covariates described in the text. Standard errors areclustered at the grade-school level. Tests are two-sided tests. *** p<0.01,** p<0.05, * p<0.10.
39

Table 6: Assignment Scores, Missed Assignments, Class Exams
Assignment Scores Missed Assignments Class Exams
Alerted 0.09*** -0.02* 0.13***(0.03) (0.01) (0.04)
Control Mean 0.02 0.12 0.00
Observations 70,076 88,732 7,342
This table shows treatment effects on student assignment scores and assignment completed. Ef-fects are estimated using 2SLS regressions with the instrumented alerted variable, an indicatorfor parents who received at least one text. All regressions include strata indicators and a set ofdemographic covariates described in the text. Standard errors are clustered at the grade-schoollevel. Outcome variables are calculated from the gradebook data. Assignment and exam scoresare standardized according to the control group’s score for each assignment or exam. Outliersmore than 3 standard deviations away from the mean are excluded. Missed assignments is anindicator for a missing assignment and includes assignments and exams, including assignmentsmarked “m” for missing in the gradebook. There are multiple observations per student becausethere are multiple assignments or exams per student after the intervention began. Tests aretwo-sided tests except for missed assignments, which is one sided. *** p<0.01, ** p<0.05, *p<0.10
Table 7: Other Academic Outcomes and Behaviors
GPA Ever Suspended Student Logins
Alerted 0.10* -0.01 4.81(0.06) (0.02) (10.58)
Control Mean 2.61 0.23 210
Observations 1,137 967 1,137
This table shows treatment effects on secondary outcomes of interest. Ef-fects are estimated using 2SLS regressions with the instrumented alertedvariable, an indicator for parents who received at least one text. All re-gressions include strata indicators and a set of demographic covariates de-scribed in the text. Standard errors are clustered at the grade-school level.Outcome variables are calculated from gradebook and administrative data.Tests are one-sided tests except for student logins assignments, which istwo sided. *** p<0.01, ** p<0.05, * p<0.10
40
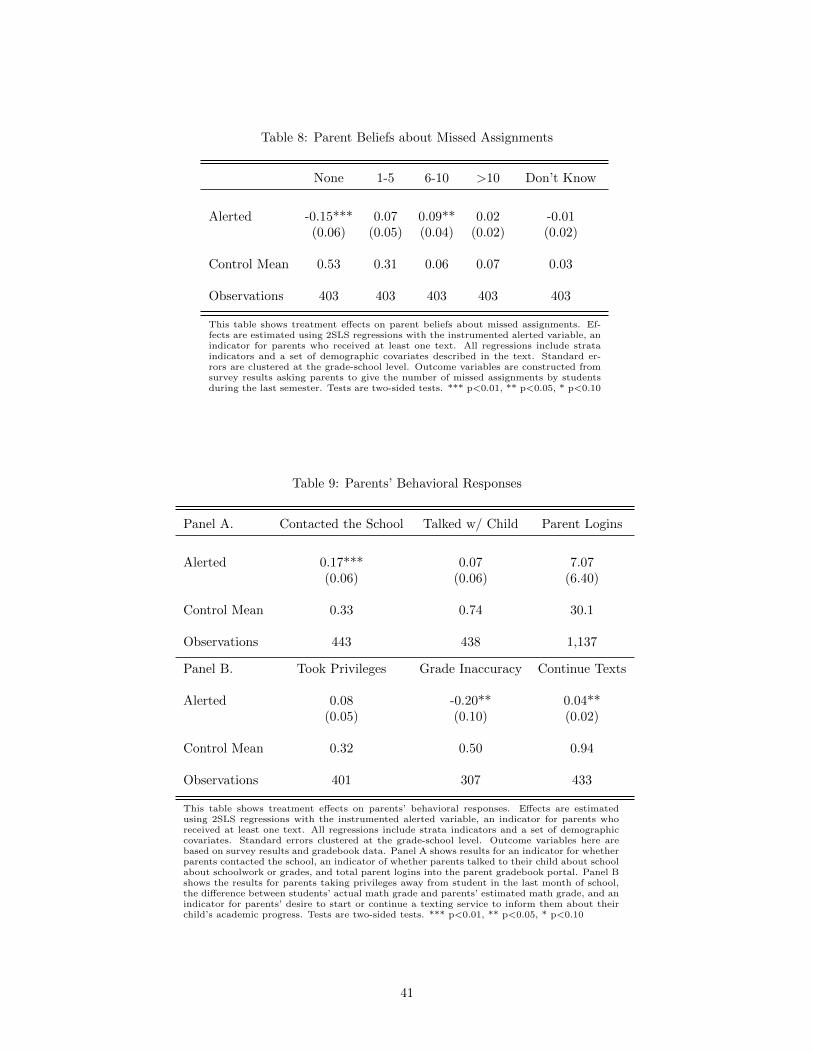
Table 8: Parent Beliefs about Missed Assignments
None 1-5 6-10 >10 Don’t Know
Alerted -0.15*** 0.07 0.09** 0.02 -0.01(0.06) (0.05) (0.04) (0.02) (0.02)
Control Mean 0.53 0.31 0.06 0.07 0.03
Observations 403 403 403 403 403
This table shows treatment effects on parent beliefs about missed assignments. Ef-fects are estimated using 2SLS regressions with the instrumented alerted variable, anindicator for parents who received at least one text. All regressions include strataindicators and a set of demographic covariates described in the text. Standard er-rors are clustered at the grade-school level. Outcome variables are constructed fromsurvey results asking parents to give the number of missed assignments by studentsduring the last semester. Tests are two-sided tests. *** p<0.01, ** p<0.05, * p<0.10
Table 9: Parents’ Behavioral Responses
Panel A. Contacted the School Talked w/ Child Parent Logins
Alerted 0.17*** 0.07 7.07(0.06) (0.06) (6.40)
Control Mean 0.33 0.74 30.1
Observations 443 438 1,137
Panel B. Took Privileges Grade Inaccuracy Continue Texts
Alerted 0.08 -0.20** 0.04**(0.05) (0.10) (0.02)
Control Mean 0.32 0.50 0.94
Observations 401 307 433
This table shows treatment effects on parents’ behavioral responses. Effects are estimatedusing 2SLS regressions with the instrumented alerted variable, an indicator for parents whoreceived at least one text. All regressions include strata indicators and a set of demographiccovariates. Standard errors clustered at the grade-school level. Outcome variables here arebased on survey results and gradebook data. Panel A shows results for an indicator for whetherparents contacted the school, an indicator of whether parents talked to their child about schoolabout schoolwork or grades, and total parent logins into the parent gradebook portal. Panel Bshows the results for parents taking privileges away from student in the last month of school,the difference between students’ actual math grade and parents’ estimated math grade, and anindicator for parents’ desire to start or continue a texting service to inform them about theirchild’s academic progress. Tests are two-sided tests. *** p<0.01, ** p<0.05, * p<0.10
41

Appendix A
Figure A.1: Timeline
This figure shows the timeline of the project, which began during the summer of 2015 and lasted through the summer of 2016,when data collection ended.
42

Figure A.2: School-to-Parent Contact - Control Group
0.1
.2.3
.4.5
Frac
tion
About
twice
a mon
th
About
once
a mon
th
Once e
very
two o
r three
mon
ths
Less
than
once
every
three
mon
ths
Parent Reported Contact from the School
This figure shows the frequency of school to parent contact regarding student academic progressfor the control group. Results are from endline parent survey.
Figure A.3: How often Parent talks to Child about Schoolwork - Control Group
0.1
.2.3
.4.5
Frac
tion
Never
Once o
r twice
last
month
About
once
a wee
k
2-3 tim
es a
week o
r more
Every
day
How often parents talk w/ their child about school
This figure shows the frequency of parents talking to their child about schoolwork for thecontrol group. Results are from endline parent survey.
43

Figure A.4: How often Parent talks to another Adult about Schoolwork - Control Group
0.1
.2.3
.4.5
.6Fr
actio
n
Never
Once o
r twice
last
month
About
once
a wee
k
2-3 tim
es a
week o
r more
How often parents talk to another adult about child's school
This figure shows the frequency of parents talking to another adult about schoolwork for thecontrol group. Results are from endline parent survey.
Figure A.5: Parent Beliefs about Missed Assignments
0.1
.2.3
.4.5
.6Fr
actio
n
None
Betwee
n 1 an
d 5
Betwee
n 6 an
d 10
More th
an 10
Parents' Beliefs on Missed Assignments
This figure shows the fraction of parents in the control group who believe their child missed zero,between one to five, between six and ten, or more than ten assignments in the last semester.Results are from endline parent survey.
44

Figure A.6: Parent Beliefs about Math Grade minus the True Grade - Control Group
0.2
.4.6
Frac
tion
-2 0 2 4Parent Beliefs Minus True Math Grade
This figure shows the inaccuracy of parental beliefs of math grade against actual grade. Cal-culations are made by subtracting actual math grade from parent’s guess of student’s mathgrade. Results to the right of zero shows the fraction of parents who overestimate a student’sgrade, and those to the left shows the fractions of parent who underestimate a student’s grade.Results are calculated from endline parent survey and gradebook data.
Figure A.7: Parent Beliefs about Missed Assignments versus True Missed Assignments
0.1
.2.3
.4.5
.6.7
Frac
tion
0 1 2 3Parents' Beliefs about Missed Assignments v. Truth
Treatment Control
This figure shows the treatment-control comparisons of parental belief of number of missedassignments versus actual number of missed assignments. The calculations are absolute valuesof the inaccuracy by categorical bins in which parents estimate their child’s missed assignments- zero (0), one to five (1), six to ten (2), and more than ten (3). For example, if a parentestimated that their child missed six to ten assignments, but they actually missed more thanten, they would be off by a category of one.
45

Figure A.8: Parent Beliefs about Math Grade versus True Grade
0.1
.2.3
.4.5
.6.7
Frac
tion
0 1 2 3Parents' Beliefs about Math Grade v. Truth
Treatment Control
This figure shows the treatment-control comparisons of parental belief of their child’s mathgrade compared to their actual grade. The calculations are absolute values of the inaccuracyby math grade GPA, based on a 4.0 scale. For example, if a child received a B, but their parentbelieved they received an A, the parent would be off by an absolute value of one.
46

Appendix B
Table B.1: Primary Academic Outcomes: ITT Estimates
Classes Failed Classes Attended Retained Math Score Reading Score
Treatment -0.26*** 33.50** 0.01** -0.01 -0.06*(0.10) (16.47) (0.01) (0.05) (0.04)
Control Mean 0.97 277.70 0.97 0.00 0.00
Observations 1,113 1,137 1,137 927 925
This table shows intent-to-treat (ITT) treatment effect estimates on primary academic outcomes specified in the pre-registered analysis plan. All regressions include strata indicators and a set of demographic covariates described in thetext. Standard errors are clustered at the grade-school level. Outcome variables are from gradebook and administrativedata. Classes failed are total failed courses after treatment started. Classes attended is the numerical total of classesmarked as present after treatment started. Retention is defined as taking courses after the intervention began. Mathand Reading scores are z scores from standardized test scores. *** p<0.01, ** p<0.05, * p<0.10
47

Table B.2: Measures of Attrition
Miss Survey Miss Suspension Miss Math Miss Reading
Treatment -0.016 -0.000 0.008 0.010(0.029) (0.010) (0.015) (0.015)
Percent of Days Missed -0.560** 0.294 0.770** 0.830**(0.26) (0.200) (0.320) (0.330)
Baseline GPA 0.016 -0.003 0.008 0.015(0.022) (0.014) (0.016) (0.016)
Black 0.024 -0.007 -0.022 -0.019(0.030) (0.015) (0.014) (0.015)
IEP -0.064 -0.008 0.040 0.042*(0.040) (0.022) (0.017) (0.023)
Female -0.014 -0.010 -0.011 -0.008(0.029) (0.009) (0.014) (0.015)
Baseline Math Score 0.034 0.004 0.026** 0.020*(0.025) (0.004) (0.011) (0.011)
Baseline Reading Score 0.012 0.004 -0.024* -0.021*(0.028) (0.006) (0.012) (0.011)
Observations 1,137 1,137 1,137 1,137
This table shows the correlates of several indicators of attrition and non response: survey non-response, missingendline GPA and missing endline test scores. Standard clustered at the grade-school level. *** p<0.01, **p<0.05, * p<0.10
48
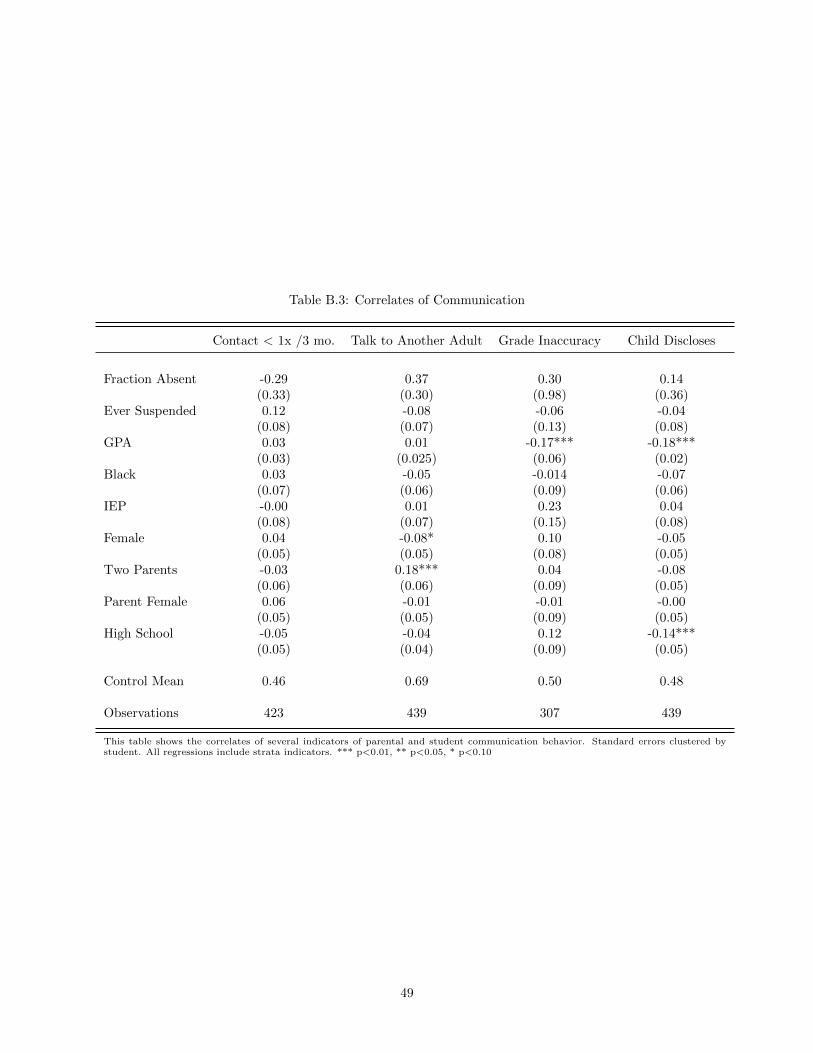
Table B.3: Correlates of Communication
Contact < 1x /3 mo. Talk to Another Adult Grade Inaccuracy Child Discloses
Fraction Absent -0.29 0.37 0.30 0.14(0.33) (0.30) (0.98) (0.36)
Ever Suspended 0.12 -0.08 -0.06 -0.04(0.08) (0.07) (0.13) (0.08)
GPA 0.03 0.01 -0.17*** -0.18***(0.03) (0.025) (0.06) (0.02)
Black 0.03 -0.05 -0.014 -0.07(0.07) (0.06) (0.09) (0.06)
IEP -0.00 0.01 0.23 0.04(0.08) (0.07) (0.15) (0.08)
Female 0.04 -0.08* 0.10 -0.05(0.05) (0.05) (0.08) (0.05)
Two Parents -0.03 0.18*** 0.04 -0.08(0.06) (0.06) (0.09) (0.05)
Parent Female 0.06 -0.01 -0.01 -0.00(0.05) (0.05) (0.09) (0.05)
High School -0.05 -0.04 0.12 -0.14***(0.05) (0.04) (0.09) (0.05)
Control Mean 0.46 0.69 0.50 0.48
Observations 423 439 307 439
This table shows the correlates of several indicators of parental and student communication behavior. Standard errors clustered bystudent. All regressions include strata indicators. *** p<0.01, ** p<0.05, * p<0.10
49

Table B.4: Robustness: Assignment Scores, Missed Assignments, Class Exams
Panel A. Assignment Scores < 2σ Class Exams < 2σ
Alerted 0.09*** 0.12***(0.02) (0.04)
Observations 67,032 7,043
Panel B. Assignment Scores < 4σ Class Exams < 4σ
Alerted 0.08*** 0.11**(0.03) (0.05)
Observations 71,063 7,407
Panel C. Assignment Scores < 5σ Class Exams < 5σ
Alerted 0.07** 0.10**(0.03) (0.05)
Observations 71,512 7,439
This table shows treatment effects on student assignment scores and assignment completed with varying exclusioncriteria for outliers. Panel A excludes all observation that are plus or minus two standard deviations from themean. Panel B excludes all observation that are plus or minus four standard deviations from the mean. Panel Cexcludes all observation that are plus or minus five standard deviations from the mean. The estimates in the maintext shows excludes outliers plus or minus three standard deviations from the mean. Effects are estimated using2SLS regressions with the instrumented alerted variable, an indicator for parents who received at least one text. Allregressions include strata indicators and a set of demographic covariates described in the text. Outcome variablesare calculated from the gradebook data. Assignment and exam scores are standardized according to the controlgroup’s score for each assignment or exam. There are multiple observations per student because there are multipleassignments or exams per student after the intervention began. Standard errors are clustered at the grade-schoollevel. *** p<0.01, ** p<0.05, * p<0.10
Table B.5: Spillover Effects
Classes Failed Classes Attended Retained GPA
Treated Grade 0.06 18.78 0.01 -0.027(0.08) (21.31) (0.01) (0.04)
Observations 9,226 9,709 9,709 9,709
This table shows treatment effects on academic outcomes for those students who were not partof the randomization process, and therefore were not treated. The Treated Grade variable is anindicator for students who were in the same grade as students who were treated. All regressionsand outcomes are constructed as described in the text for those who were randomized, andtherefore include strata indicators and a set of demographic covariates described in the text.Standard errors are clustered at the grade-school level. Outcome variables are from gradebookdata. *** p<0.01, ** p<0.05, * p<0.10
50

Table B.6: Participation Grades and Excused Assignments
Participation Excused
Alerted -0.07 0.00(0.05) (0.01)
Observations 4,932 80,643
This table shows treatment effects on participation grades andexcused assignments. Column one shows the effects on partici-pation grades, which is an indicator for receiving a full mark onparticipation grades in the gradebook. Column two shows theeffects on an indicator for an assignment being marked by theteacher as “excused.” Effects are estimated using 2SLS regres-sions with the instrumented alerted variable, an indicator forparents who received at least one text. All regressions includestrata indicators and a set of demographic covariates describedin the text. Outcome variables are calculated from the grade-book data. There are multiple observations per student becausethere are multiple scores per student after the intervention be-gan. Standard errors are clustered at the grade-school level. ***p<0.01, ** p<0.05, * p<0.10
Table B.7: Correlations with State Test Scores
Math Score Math Score Reading Score Reading Score
Baseline GPA 0.55*** 0.75*** 0.60*** 0.86***(0.05) (0.06) (0.05) (0.05)
Baseline GPA×High School -0.32*** -0.42***(0.09) (0.09)
Observations 927 927 925 925
This table shows the correlations between students’ baseline GPAs and state math and reading test scores. Columnstwo and four interact the baseline GPA variable with an indicator for whether or not a student is in high school.Robust Standard errors in parentheses. GPA is constructed from gradebook data. *** p<0.01, ** p<0.05, * p<0.10
Table B.8: Subgroup of Below Average GPA
Classes Failed GPA Classes Attended Retained Math Score Reading Score
Alerted -0.88*** 0.24*** 64.63*** -0.05*** 0.04 0.00(0.27 ) (0.10 ) (26.94 ) (0.02 ) (0.09) (0.08 )
Observations 550 566 566 566 445 444
P-value thatdifference = 0 0.08 0.01 0.55 0.04 0.61 0.15
This table shows the results by subgroups of interest, in this case students with below-average GPA at baseline. Treatment effectsare estimated using 2SLS regressions with the instrumented alerted variable, an indicator for parents who received at least onetext. All regression include strata indicators and a set of demographic covariates described in the text. The p-values are fora test of whether the coefficient on the interaction term between the low-GPA indicator and the treatment variable is equal tozero. Standard errors are clustered at the grade-school level. All regressions include strata indicators. Outcome variables arefrom gradebook and administrative data. *** p<0.01, ** p<0.05, * p<0.10
51

Table B.9: Subgroup of High School and Middle School Students
Panel A. High School
Classes Failed GPA Classes Attended Retained Math Score Reading Score
Alerted -0.68*** 0.25*** 45.51 -0.04** 0.00 -0.07(0.22) (0.09) (29.89) (0.02) (0.08) (0.07)
Observations 581 597 597 597 419 417
Panel B. Middle School
Classes Failed GPA Classes Attended Retained Math Score Reading Score
Alerted -0.06 -0.10 49.50 0.01 -0.02 -0.08(0.15) (0.09) (34.42) (0.01) (0.09) (0.08)
Observations 532 540 540 540 508 508
P-value thatdifference = 0 0.01 0.00 0.94 0.03 0.75 0.55
This table shows the results by subgroups of interest, in this case high school and middle school students. Treatment effects areestimated using 2SLS regressions with the instrumented alerted variable, an indicator for parents who received at least one text.All regression include strata indicators and a set of demographic covariates as described in the text. The p-values are for a testof whether the coefficient on the interaction term between the high-school indicator and the treatment variable is equal to zero.Standard errors are clustered at the grade-school level. All regressions include strata indicators. Outcome variables are fromgradebook and administrative data. *** p<0.01, ** p<0.05, * p<0.10
52
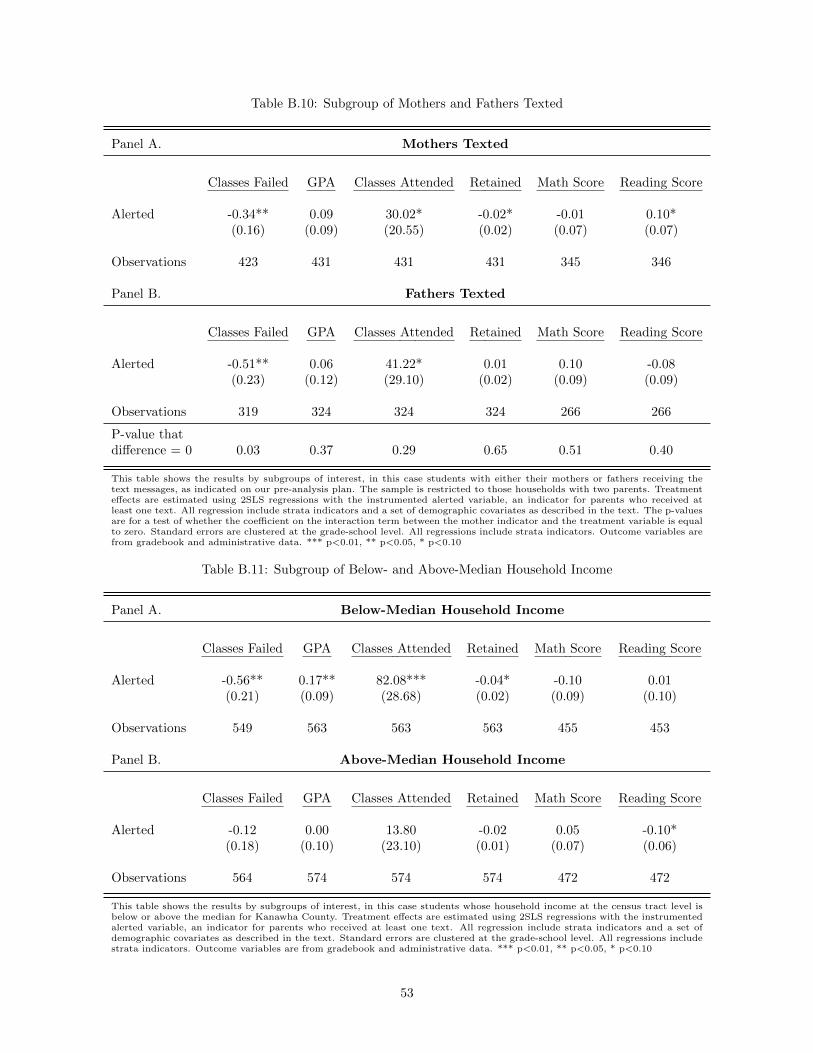
Table B.10: Subgroup of Mothers and Fathers Texted
Panel A. Mothers Texted
Classes Failed GPA Classes Attended Retained Math Score Reading Score
Alerted -0.34** 0.09 30.02* -0.02* -0.01 0.10*(0.16) (0.09) (20.55) (0.02) (0.07) (0.07)
Observations 423 431 431 431 345 346
Panel B. Fathers Texted
Classes Failed GPA Classes Attended Retained Math Score Reading Score
Alerted -0.51** 0.06 41.22* 0.01 0.10 -0.08(0.23) (0.12) (29.10) (0.02) (0.09) (0.09)
Observations 319 324 324 324 266 266
P-value thatdifference = 0 0.03 0.37 0.29 0.65 0.51 0.40
This table shows the results by subgroups of interest, in this case students with either their mothers or fathers receiving thetext messages, as indicated on our pre-analysis plan. The sample is restricted to those households with two parents. Treatmenteffects are estimated using 2SLS regressions with the instrumented alerted variable, an indicator for parents who received atleast one text. All regression include strata indicators and a set of demographic covariates as described in the text. The p-valuesare for a test of whether the coefficient on the interaction term between the mother indicator and the treatment variable is equalto zero. Standard errors are clustered at the grade-school level. All regressions include strata indicators. Outcome variables arefrom gradebook and administrative data. *** p<0.01, ** p<0.05, * p<0.10
Table B.11: Subgroup of Below- and Above-Median Household Income
Panel A. Below-Median Household Income
Classes Failed GPA Classes Attended Retained Math Score Reading Score
Alerted -0.56** 0.17** 82.08*** -0.04* -0.10 0.01(0.21) (0.09) (28.68) (0.02) (0.09) (0.10)
Observations 549 563 563 563 455 453
Panel B. Above-Median Household Income
Classes Failed GPA Classes Attended Retained Math Score Reading Score
Alerted -0.12 0.00 13.80 -0.02 0.05 -0.10*(0.18) (0.10) (23.10) (0.01) (0.07) (0.06)
Observations 564 574 574 574 472 472
This table shows the results by subgroups of interest, in this case students whose household income at the census tract level isbelow or above the median for Kanawha County. Treatment effects are estimated using 2SLS regressions with the instrumentedalerted variable, an indicator for parents who received at least one text. All regression include strata indicators and a set ofdemographic covariates as described in the text. Standard errors are clustered at the grade-school level. All regressions includestrata indicators. Outcome variables are from gradebook and administrative data. *** p<0.01, ** p<0.05, * p<0.10
53

Table B.12: Subgroup of Below- and Above-Median Proportion Households with minimum Bachelors Degree
Panel A. Below-Median Education
Classes Failed GPA Classes Attended Retained Math Score Reading Score
Alerted -0.61*** 0.17* 64.08*** -0.03 -0.02 0.03(0.24) (0.11) (27.22) (0.02) (0.10) (0.10)
Observations 543 558 558 558 446 444
Panel B. Above-Median Education
Classes Failed GPA Classes Attended Retained Math Score Reading Score
Alerted -0.26** 0.06 35.21* -0.02 -0.06 -0.12*(0.15) (0.08) (26.65) (0.01) (0.07) (0.08)
Observations 570 579 579 579 481 481
This table shows the results by subgroups of interest, in this case students whose household’s highest education is bachelors orhigher at the census tract level is below or above the median for Kanawha County. Treatment effects are estimated using 2SLSregressions with the instrumented alerted variable, an indicator for parents who received at least one text. All regression includestrata indicators and a set of demographic covariates as described in the text. Standard errors are clustered at the grade-schoollevel. All regressions include strata indicators. Outcome variables are from gradebook and administrative data. *** p<0.01, **p<0.05, * p<0.10
Table B.13: Assignment Scores, Missed Assignments, Class Exams
Missed Assignments
Sample Low GPA High School Middle School
Alerted -0.05** -0.04** 0.01(0.02) (0.02) (0.01)
Control Mean 0.20 0.15 0.09
Observations 41,089 44,614 44,118
This table shows treatment effects on assignments completed for three dif-ferent subgroups: column one shows results for students with below-averageGPA, column two shows results for high school students, and column threeshows results for middle school students. Effects are estimated using 2SLSregressions with the instrumented alerted variable, an indicator for parentswho received at least one text. All regressions include strata indicatorsand a set of demographic covariates described in the text. Standard errorsare clustered at the grade-school level. Outcome variables are calculatedfrom the gradebook data. Missed assignments is an indicator for a miss-ing assignment and include assignments and exams, including assignmentsmarked “m” in the gradebook. There are multiple observations per stu-dent because there are multiple assignments or exams per student after theintervention began. *** p<0.01, ** p<0.05, * p<0.10
54

Table B.14: Academic Outcomes: Year 2
Panel A. Entire Year 2 Sample
Classes Failed Classes Attended Retained GPA
Alerted -0.21 51.28* 0.02 0.09*(0.24) (36.14) (0.01) (0.06)
Observations 964 1,031 1,031 1,031
Panel B. High School
Classes Failed Classes Attended Retained GPA
Alerted -0.87*** 62.40 0.02 0.20**(0.34) (56.35) (0.02) (0.10)
Observations 440 492 492 492
Panel C. Middle School
Classes Failed Classes Attended Retained GPA
Alerted 0.28 40.400 0.01 -0.01(0.28) (44.25) (0.01) (0.09)
Observations 524 539 539 539
Panel D. Below-Average GPA
Classes Failed Classes Attended Retained GPA
Alerted -0.84** 54.50** -0.02 0.19**(0.44) (25.43) (0.02) (0.11)
Observations 467 513 513 513
This table shows treatment effects on academic outcomes during the second year of theintervention. Treatment effects are estimated using 2SLS regressions with the instru-mented alerted variable, an indicator for parents who received at least one text. Allregressions include strata indicators and a set of demographic covariates described inthe text. Standard errors are clustered at the grade-school level. Outcome variablesare from gradebook data. Classes failed are total failed courses during the 2016-2017academic year. Classes attended is the number of total of classes marked as presentduring the 2016-2017 academic year. Retention is defined as taking courses during the2016-2017 academic year. The sample size is smaller than the Year 1 sample becauseYear 1 12th-grade students graduated. *** p<0.01, ** p<0.05, * p<0.10
55

Table B.15: Alerts by Middle v. High School
Alerted HS Alerts HS Alerted MS Alerts MS
Treatment 0.72*** 66.10*** 0.69*** 31.21***(0.02) (3.22) (0.02) (2.19)
Control Mean 0.00 0.01 0.04 0.72
Observations 597 597 540 540
This table shows the likelihood and amount of times parents are alerted due to be-ing randomized into treatment, where HS indicates students in high school and MSindicates students in middle school. Alerted is an indicator for ever alerted. Alertsis the number of alerts received. All regressions include strata indicators and a setof demographic covariates described in the text. Standard errors are clustered at thegrade-school level. Outcome variables are from gradebook and administrative data.*** p<0.01, ** p<0.05, * p<0.10
56

Appendix C
Table C.1: Secondary outcomes and their sources
Outcome Source
Number of alerts sent Administrative DataNumber of parent logins Administrative DataNumber of student logins Administrative DataEver suspended Administrative DataGPA Administrative DataTotal number of missed assignments Administrative DataSchool-to-parent contact Survey Q3Parent-to-school contact Survey Q6Accuracy of grade beliefs Survey Q9 & Admin DataAccuracy of missed assignment beliefs Survey Q16 & Admin DataParent talks to child about schoolwork Survey Q12Parent takes privileges from child over schoolwork Survey Q14Desire to continue intervention Survey Q19
57
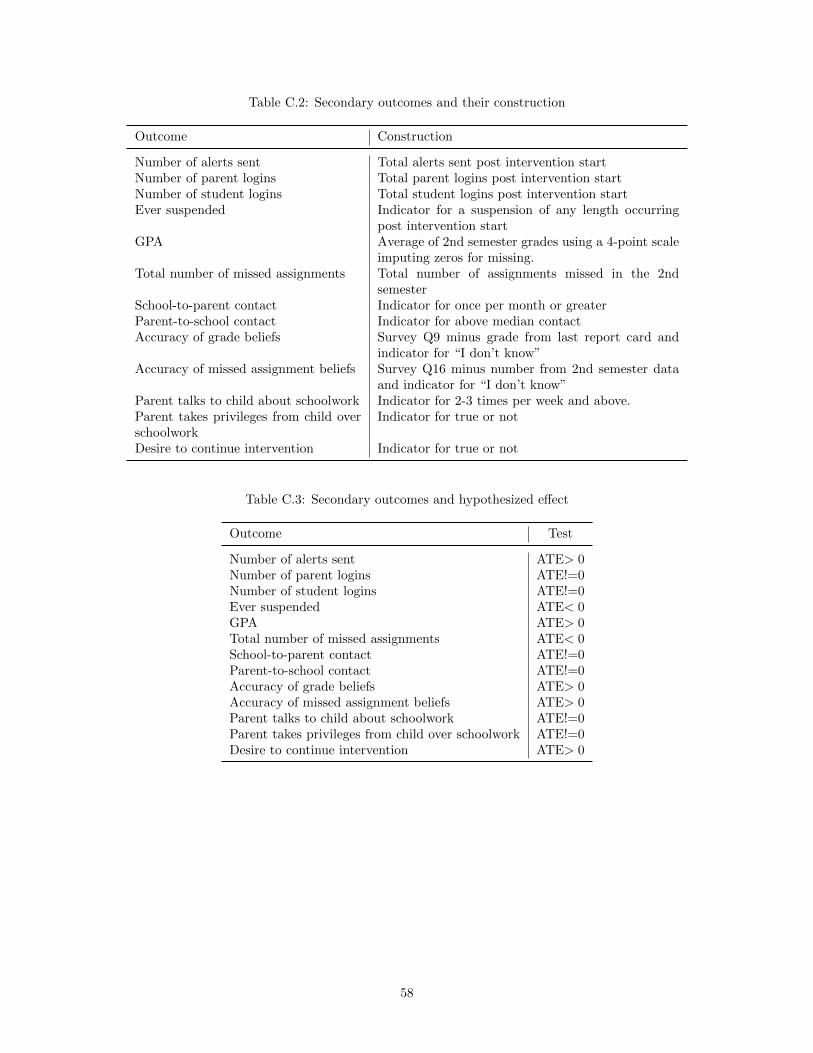
Table C.2: Secondary outcomes and their construction
Outcome Construction
Number of alerts sent Total alerts sent post intervention startNumber of parent logins Total parent logins post intervention startNumber of student logins Total student logins post intervention startEver suspended Indicator for a suspension of any length occurring
post intervention startGPA Average of 2nd semester grades using a 4-point scale
imputing zeros for missing.Total number of missed assignments Total number of assignments missed in the 2nd
semesterSchool-to-parent contact Indicator for once per month or greaterParent-to-school contact Indicator for above median contactAccuracy of grade beliefs Survey Q9 minus grade from last report card and
indicator for “I don’t know”Accuracy of missed assignment beliefs Survey Q16 minus number from 2nd semester data
and indicator for “I don’t know”Parent talks to child about schoolwork Indicator for 2-3 times per week and above.Parent takes privileges from child overschoolwork
Indicator for true or not
Desire to continue intervention Indicator for true or not
Table C.3: Secondary outcomes and hypothesized effect
Outcome Test
Number of alerts sent ATE> 0Number of parent logins ATE!=0Number of student logins ATE!=0Ever suspended ATE< 0GPA ATE> 0Total number of missed assignments ATE< 0School-to-parent contact ATE!=0Parent-to-school contact ATE!=0Accuracy of grade beliefs ATE> 0Accuracy of missed assignment beliefs ATE> 0Parent talks to child about schoolwork ATE!=0Parent takes privileges from child over schoolwork ATE!=0Desire to continue intervention ATE> 0
58

Appendix D
Figure B.9: Endline Survey Letter
This is page 1 of 4 of the endline survey letter sent to participant parents afterthe end of the treatment school year.
59

Figure B.10: Endline Survey Letter
This is page 2 of 4 of the endline survey letter sent to participant parents afterthe end of the treatment school year.
60

Figure B.11: Endline Survey Letter
This is page 3 of 4 of the endline survey letter sent to participant parents afterthe end of the treatment school year.
61
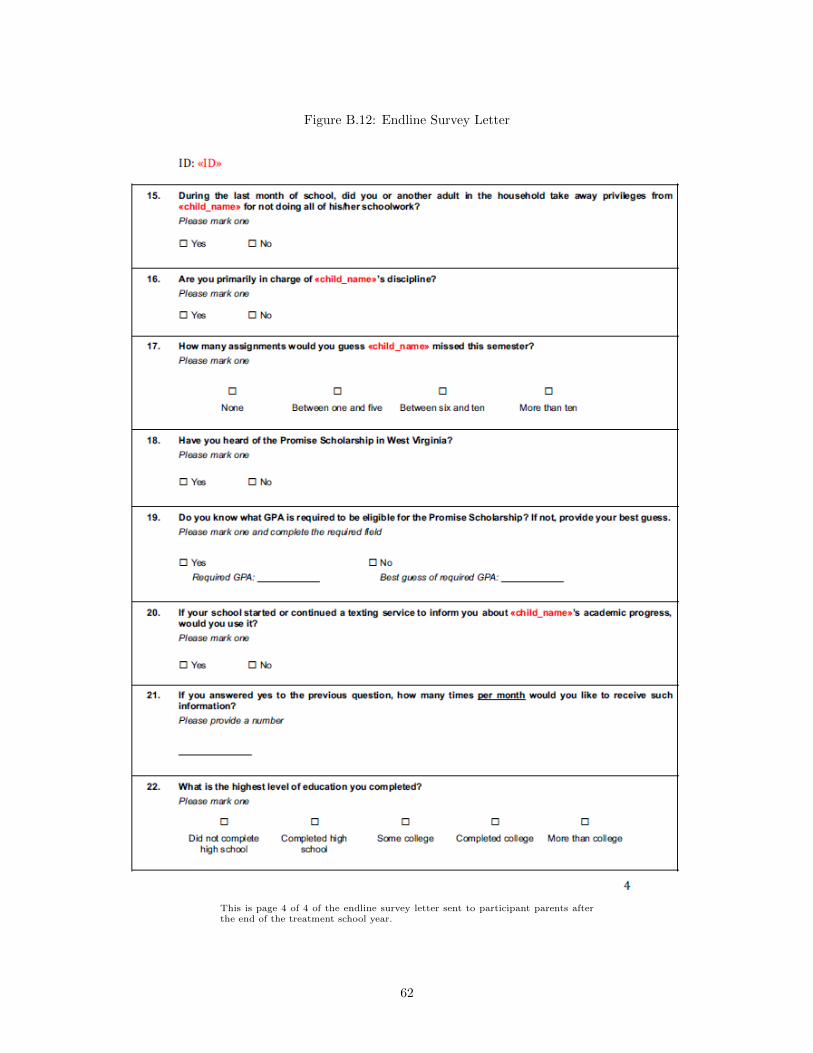
Figure B.12: Endline Survey Letter
This is page 4 of 4 of the endline survey letter sent to participant parents afterthe end of the treatment school year.
62


![Leveraging Federal Funding to Support Foster Parent Trainingterm:name]/[node... · and services (Heller, Smyke, & Boris, 2002). Studies have also indicated that foster parents often](https://img.pdfslide.us/doc/110x75/60b430dda6eb20080934d4f6/leveraging-federal-funding-to-support-foster-parent-training-termnamenode.jpg)