Embed Size (px)
Citation preview
ChemicalScience
EDGE ARTICLE
Ope
n A
cces
s A
rtic
le. P
ublis
hed
on 0
3 M
arch
202
1. D
ownl
oade
d on
1/2
4/20
22 1
:41:
33 P
M.
Thi
s ar
ticle
is li
cens
ed u
nder
a C
reat
ive
Com
mon
s A
ttrib
utio
n 3.
0 U
npor
ted
Lic
ence
.
View Article OnlineView Journal | View Issue
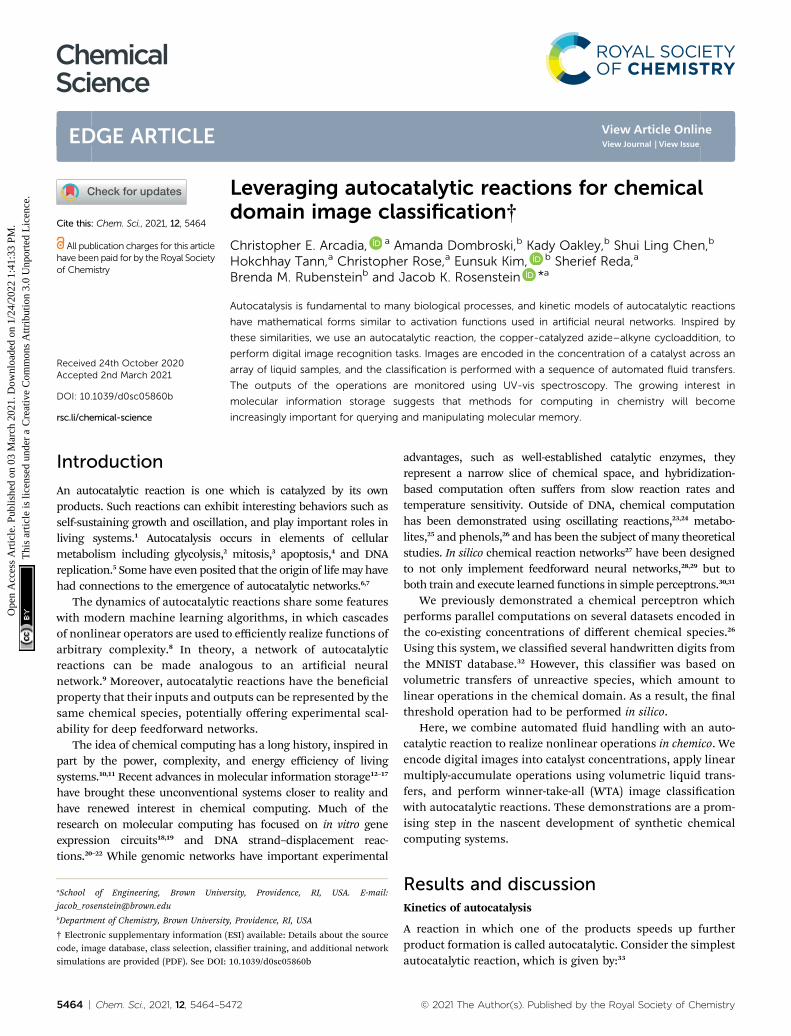
Leveraging autoc
aSchool of Engineering, Brown Unive
[email protected] of Chemistry, Brown University
† Electronic supplementary information (code, image database, class selection, classimulations are provided (PDF). See DOI:
Cite this: Chem. Sci., 2021, 12, 5464
All publication charges for this articlehave been paid for by the Royal Societyof Chemistry
Received 24th October 2020Accepted 2nd March 2021
DOI: 10.1039/d0sc05860b
rsc.li/chemical-science
5464 | Chem. Sci., 2021, 12, 5464–54
atalytic reactions for chemicaldomain image classification†
Christopher E. Arcadia, a Amanda Dombroski,b Kady Oakley,b Shui Ling Chen,b
Hokchhay Tann,a Christopher Rose,a Eunsuk Kim, b Sherief Reda,a
Brenda M. Rubensteinb and Jacob K. Rosenstein *a
Autocatalysis is fundamental to many biological processes, and kinetic models of autocatalytic reactions
have mathematical forms similar to activation functions used in artificial neural networks. Inspired by
these similarities, we use an autocatalytic reaction, the copper-catalyzed azide–alkyne cycloaddition, to
perform digital image recognition tasks. Images are encoded in the concentration of a catalyst across an
array of liquid samples, and the classification is performed with a sequence of automated fluid transfers.
The outputs of the operations are monitored using UV-vis spectroscopy. The growing interest in
molecular information storage suggests that methods for computing in chemistry will become
increasingly important for querying and manipulating molecular memory.
Introduction
An autocatalytic reaction is one which is catalyzed by its ownproducts. Such reactions can exhibit interesting behaviors such asself-sustaining growth and oscillation, and play important roles inliving systems.1 Autocatalysis occurs in elements of cellularmetabolism including glycolysis,2 mitosis,3 apoptosis,4 and DNAreplication.5 Some have even posited that the origin of lifemay havehad connections to the emergence of autocatalytic networks.6,7
The dynamics of autocatalytic reactions share some featureswith modern machine learning algorithms, in which cascadesof nonlinear operators are used to efficiently realize functions ofarbitrary complexity.8 In theory, a network of autocatalyticreactions can be made analogous to an articial neuralnetwork.9 Moreover, autocatalytic reactions have the benecialproperty that their inputs and outputs can be represented by thesame chemical species, potentially offering experimental scal-ability for deep feedforward networks.
The idea of chemical computing has a long history, inspired inpart by the power, complexity, and energy efficiency of livingsystems.10,11 Recent advances in molecular information storage12–17
have brought these unconventional systems closer to reality andhave renewed interest in chemical computing. Much of theresearch on molecular computing has focused on in vitro geneexpression circuits18,19 and DNA strand–displacement reac-tions.20–22 While genomic networks have important experimental
rsity, Providence, RI, USA. E-mail:
, Providence, RI, USA
ESI) available: Details about the sourcesier training, and additional network10.1039/d0sc05860b
72
advantages, such as well-established catalytic enzymes, theyrepresent a narrow slice of chemical space, and hybridization-based computation oen suffers from slow reaction rates andtemperature sensitivity. Outside of DNA, chemical computationhas been demonstrated using oscillating reactions,23,24 metabo-lites,25 and phenols,26 and has been the subject of many theoreticalstudies. In silico chemical reaction networks27 have been designedto not only implement feedforward neural networks,28,29 but toboth train and execute learned functions in simple perceptrons.30,31
We previously demonstrated a chemical perceptron whichperforms parallel computations on several datasets encoded inthe co-existing concentrations of different chemical species.26
Using this system, we classied several handwritten digits fromthe MNIST database.32 However, this classier was based onvolumetric transfers of unreactive species, which amount tolinear operations in the chemical domain. As a result, the nalthreshold operation had to be performed in silico.
Here, we combine automated uid handling with an auto-catalytic reaction to realize nonlinear operations in chemico. Weencode digital images into catalyst concentrations, apply linearmultiply-accumulate operations using volumetric liquid trans-fers, and perform winner-take-all (WTA) image classicationwith autocatalytic reactions. These demonstrations are a prom-ising step in the nascent development of synthetic chemicalcomputing systems.
Results and discussionKinetics of autocatalysis
A reaction in which one of the products speeds up furtherproduct formation is called autocatalytic. Consider the simplestautocatalytic reaction, which is given by:33
© 2021 The Author(s). Published by the Royal Society of Chemistry
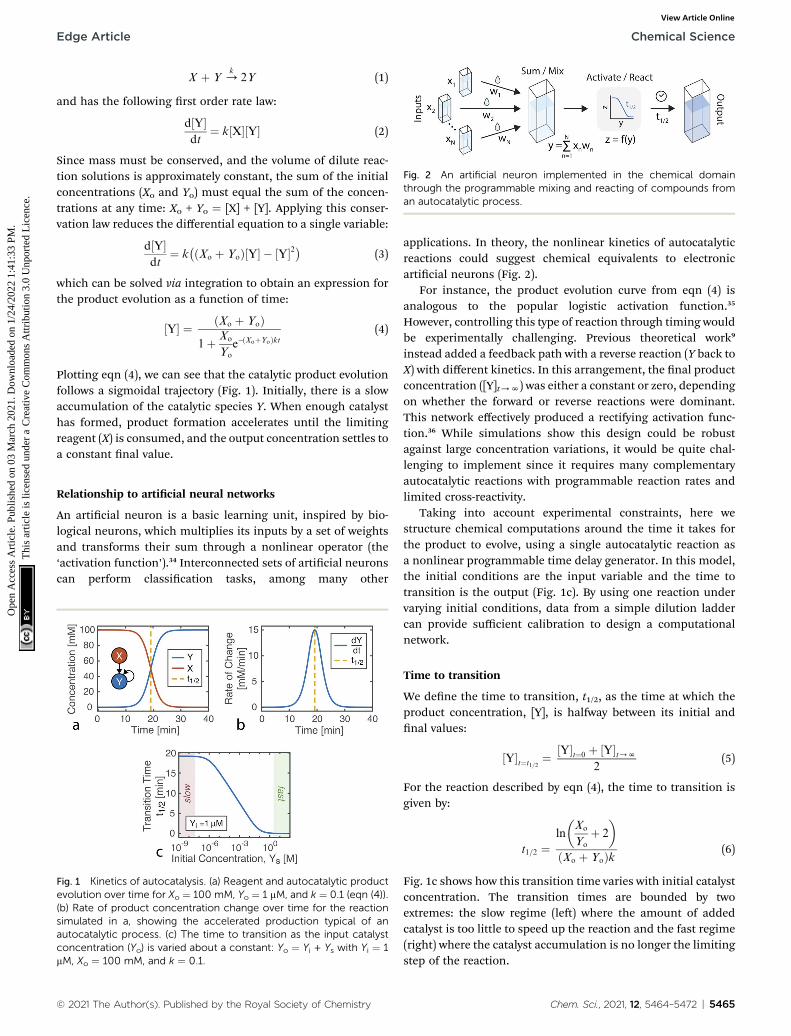
Fig. 2 An artificial neuron implemented in the chemical domainthrough the programmable mixing and reacting of compounds froman autocatalytic process.
Edge Article Chemical Science
Ope
n A
cces
s A
rtic
le. P
ublis
hed
on 0
3 M
arch
202
1. D
ownl
oade
d on
1/2
4/20
22 1
:41:
33 P
M.
Thi
s ar
ticle
is li
cens
ed u
nder
a C
reat
ive
Com
mon
s A
ttrib
utio
n 3.
0 U
npor
ted
Lic
ence
.View Article Online
X þ Y /k2Y (1)
and has the following rst order rate law:
d½Y�dt
¼ k½X�½Y� (2)
Since mass must be conserved, and the volume of dilute reac-tion solutions is approximately constant, the sum of the initialconcentrations (Xo and Yo) must equal the sum of the concen-trations at any time: Xo + Yo ¼ [X] + [Y]. Applying this conser-vation law reduces the differential equation to a single variable:
d½Y�dt
¼ k�ðXo þ YoÞ½Y� � ½Y�2� (3)
which can be solved via integration to obtain an expression forthe product evolution as a function of time:
½Y� ¼ ðXo þ YoÞ1þ Xo
Yo
e�ðXoþYoÞkt(4)
Plotting eqn (4), we can see that the catalytic product evolutionfollows a sigmoidal trajectory (Fig. 1). Initially, there is a slowaccumulation of the catalytic species Y. When enough catalysthas formed, product formation accelerates until the limitingreagent (X) is consumed, and the output concentration settles toa constant nal value.
Relationship to articial neural networks
An articial neuron is a basic learning unit, inspired by bio-logical neurons, which multiplies its inputs by a set of weightsand transforms their sum through a nonlinear operator (the‘activation function’).34 Interconnected sets of articial neuronscan perform classication tasks, among many other
Fig. 1 Kinetics of autocatalysis. (a) Reagent and autocatalytic productevolution over time for Xo ¼ 100 mM, Yo ¼ 1 mM, and k ¼ 0.1 (eqn (4)).(b) Rate of product concentration change over time for the reactionsimulated in a, showing the accelerated production typical of anautocatalytic process. (c) The time to transition as the input catalystconcentration (Yo) is varied about a constant: Yo ¼ Yi + Ys with Yi ¼ 1mM, Xo ¼ 100 mM, and k ¼ 0.1.
© 2021 The Author(s). Published by the Royal Society of Chemistry
applications. In theory, the nonlinear kinetics of autocatalyticreactions could suggest chemical equivalents to electronicarticial neurons (Fig. 2).
For instance, the product evolution curve from eqn (4) isanalogous to the popular logistic activation function.35
However, controlling this type of reaction through timing wouldbe experimentally challenging. Previous theoretical work9
instead added a feedback path with a reverse reaction (Y back toX) with different kinetics. In this arrangement, the nal productconcentration ([Y]t/N) was either a constant or zero, dependingon whether the forward or reverse reactions were dominant.This network effectively produced a rectifying activation func-tion.36 While simulations show this design could be robustagainst large concentration variations, it would be quite chal-lenging to implement since it requires many complementaryautocatalytic reactions with programmable reaction rates andlimited cross-reactivity.
Taking into account experimental constraints, here westructure chemical computations around the time it takes forthe product to evolve, using a single autocatalytic reaction asa nonlinear programmable time delay generator. In this model,the initial conditions are the input variable and the time totransition is the output (Fig. 1c). By using one reaction undervarying initial conditions, data from a simple dilution laddercan provide sufficient calibration to design a computationalnetwork.
Time to transition
We dene the time to transition, t1/2, as the time at which theproduct concentration, [Y], is halfway between its initial andnal values:
½Y�t¼t1=2¼ ½Y�t¼0 þ ½Y�t/N
2(5)
For the reaction described by eqn (4), the time to transition isgiven by:
t1=2 ¼ln
�Xo
Yo
þ 2
�
ðXo þ YoÞk (6)
Fig. 1c shows how this transition time varies with initial catalystconcentration. The transition times are bounded by twoextremes: the slow regime (le) where the amount of addedcatalyst is too little to speed up the reaction and the fast regime(right) where the catalyst accumulation is no longer the limitingstep of the reaction.
Chem. Sci., 2021, 12, 5464–5472 | 5465
Chemical Science Edge Article
Ope
n A
cces
s A
rtic
le. P
ublis
hed
on 0
3 M
arch
202
1. D
ownl
oade
d on
1/2
4/20
22 1
:41:
33 P
M.
Thi
s ar
ticle
is li
cens
ed u
nder
a C
reat
ive
Com
mon
s A
ttrib
utio
n 3.
0 U
npor
ted
Lic
ence
.View Article Online
For this reaction, the rate of increase in catalyst (d[Y]/dt) isgreatest at tp ¼ ln(Xo/Yo)/((Xo + Yo)k) which, assuming the initialconcentration ratio is large (Xo/Yo [ 2) occurs roughly at thetime to transition (tp z t1/2). Using either of these time pointsas the output parameter, instead of the nal concentration([Y]t/N), makes for more consistent computations since thenal concentration tends to be more variable than the timing ofcatalysis (see Fig. 8c).
Copper-catalyzed Azide–Alkyne cycloaddition
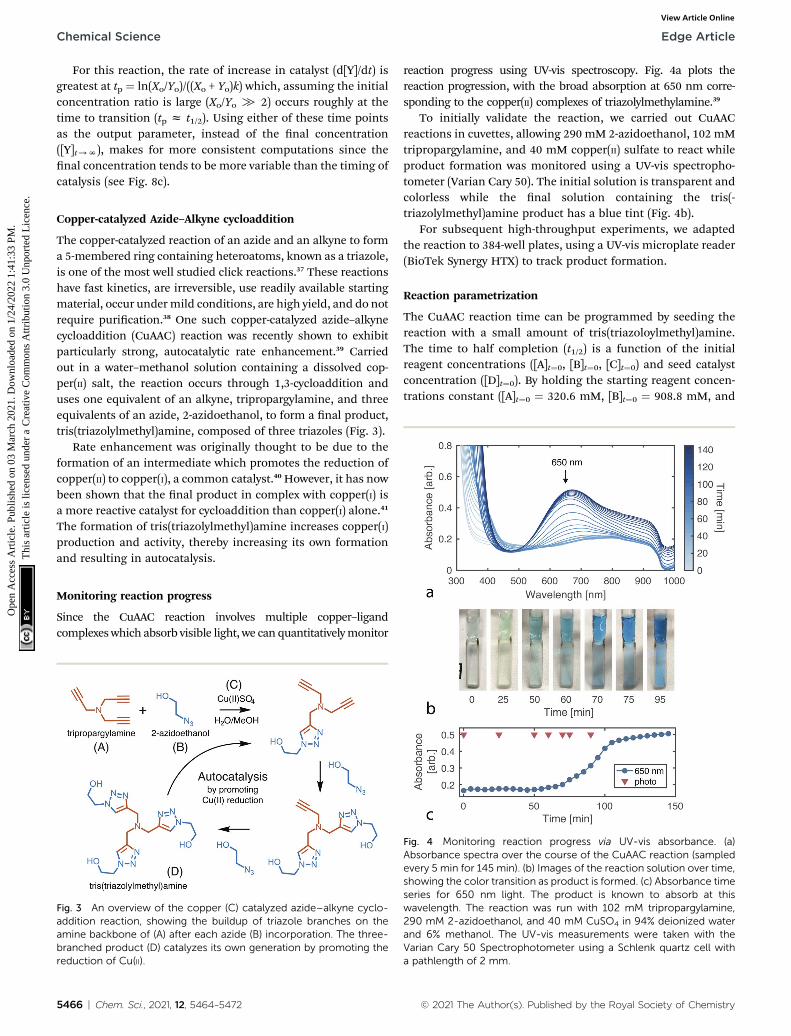
The copper-catalyzed reaction of an azide and an alkyne to forma 5-membered ring containing heteroatoms, known as a triazole,is one of the most well studied click reactions.37 These reactionshave fast kinetics, are irreversible, use readily available startingmaterial, occur undermild conditions, are high yield, and do notrequire purication.38 One such copper-catalyzed azide–alkynecycloaddition (CuAAC) reaction was recently shown to exhibitparticularly strong, autocatalytic rate enhancement.39 Carriedout in a water–methanol solution containing a dissolved cop-per(II) salt, the reaction occurs through 1,3-cycloaddition anduses one equivalent of an alkyne, tripropargylamine, and threeequivalents of an azide, 2-azidoethanol, to form a nal product,tris(triazolylmethyl)amine, composed of three triazoles (Fig. 3).
Rate enhancement was originally thought to be due to theformation of an intermediate which promotes the reduction ofcopper(II) to copper(I), a common catalyst.40 However, it has nowbeen shown that the nal product in complex with copper(I) isa more reactive catalyst for cycloaddition than copper(I) alone.41
The formation of tris(triazolylmethyl)amine increases copper(I)production and activity, thereby increasing its own formationand resulting in autocatalysis.
Monitoring reaction progress
Since the CuAAC reaction involves multiple copper–ligandcomplexes which absorb visible light, we can quantitativelymonitor
Fig. 3 An overview of the copper (C) catalyzed azide–alkyne cyclo-addition reaction, showing the buildup of triazole branches on theamine backbone of (A) after each azide (B) incorporation. The three-branched product (D) catalyzes its own generation by promoting thereduction of Cu(II).
5466 | Chem. Sci., 2021, 12, 5464–5472
reaction progress using UV-vis spectroscopy. Fig. 4a plots thereaction progression, with the broad absorption at 650 nm corre-sponding to the copper(II) complexes of triazolylmethylamine.39
To initially validate the reaction, we carried out CuAACreactions in cuvettes, allowing 290 mM 2-azidoethanol, 102 mMtripropargylamine, and 40 mM copper(II) sulfate to react whileproduct formation was monitored using a UV-vis spectropho-tometer (Varian Cary 50). The initial solution is transparent andcolorless while the nal solution containing the tris(-triazolylmethyl)amine product has a blue tint (Fig. 4b).
For subsequent high-throughput experiments, we adaptedthe reaction to 384-well plates, using a UV-vis microplate reader(BioTek Synergy HTX) to track product formation.
Reaction parametrization
The CuAAC reaction time can be programmed by seeding thereaction with a small amount of tris(triazoloylmethyl)amine.The time to half completion (t1/2) is a function of the initialreagent concentrations ([A]t¼0, [B]t¼0, [C]t¼0) and seed catalystconcentration ([D]t¼0). By holding the starting reagent concen-trations constant ([A]t¼0 ¼ 320.6 mM, [B]t¼0 ¼ 908.8 mM, and
Fig. 4 Monitoring reaction progress via UV-vis absorbance. (a)Absorbance spectra over the course of the CuAAC reaction (sampledevery 5 min for 145 min). (b) Images of the reaction solution over time,showing the color transition as product is formed. (c) Absorbance timeseries for 650 nm light. The product is known to absorb at thiswavelength. The reaction was run with 102 mM tripropargylamine,290 mM 2-azidoethanol, and 40 mM CuSO4 in 94% deionized waterand 6% methanol. The UV-vis measurements were taken with theVarian Cary 50 Spectrophotometer using a Schlenk quartz cell witha pathlength of 2 mm.
© 2021 The Author(s). Published by the Royal Society of Chemistry
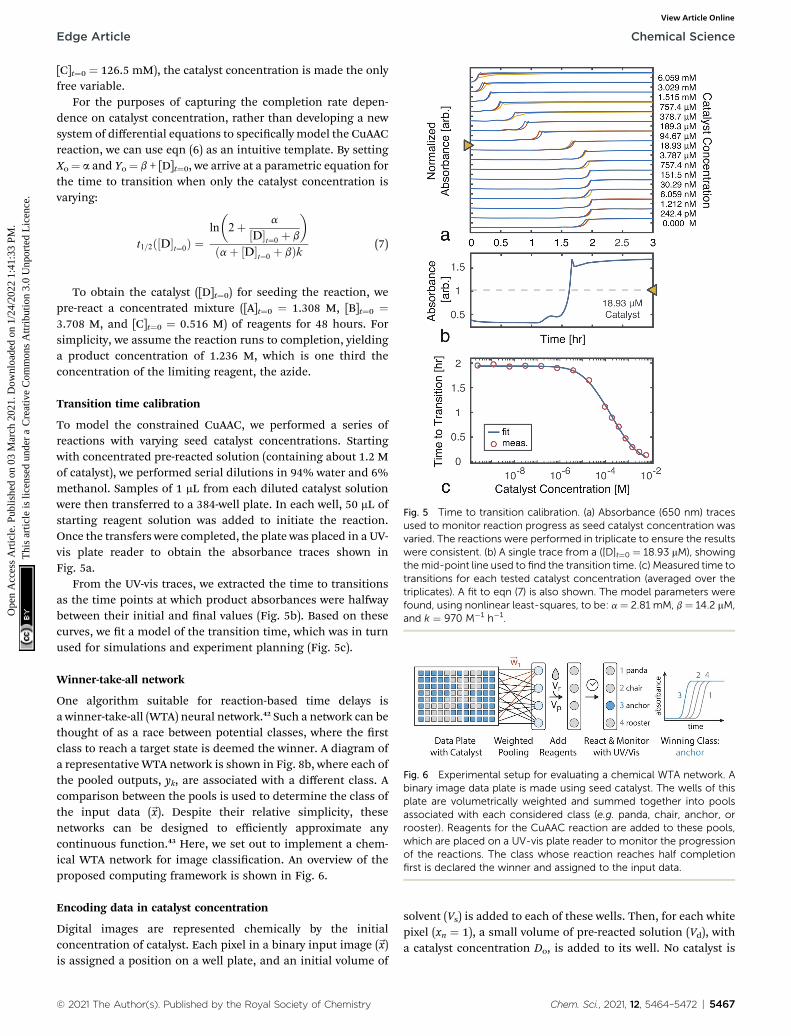
Fig. 5 Time to transition calibration. (a) Absorbance (650 nm) tracesused to monitor reaction progress as seed catalyst concentration wasvaried. The reactions were performed in triplicate to ensure the resultswere consistent. (b) A single trace from a ([D]t¼0 ¼ 18.93 mM), showingthemid-point line used to find the transition time. (c) Measured time totransitions for each tested catalyst concentration (averaged over thetriplicates). A fit to eqn (7) is also shown. The model parameters werefound, using nonlinear least-squares, to be: a ¼ 2.81 mM, b ¼ 14.2 mM,and k ¼ 970 M�1 h�1.
Fig. 6 Experimental setup for evaluating a chemical WTA network. Abinary image data plate is made using seed catalyst. The wells of thisplate are volumetrically weighted and summed together into poolsassociated with each considered class (e.g. panda, chair, anchor, orrooster). Reagents for the CuAAC reaction are added to these pools,which are placed on a UV-vis plate reader to monitor the progressionof the reactions. The class whose reaction reaches half completionfirst is declared the winner and assigned to the input data.
Edge Article Chemical Science
Ope
n A
cces
s A
rtic
le. P
ublis
hed
on 0
3 M
arch
202
1. D
ownl
oade
d on
1/2
4/20
22 1
:41:
33 P
M.
Thi
s ar
ticle
is li
cens
ed u
nder
a C
reat
ive
Com
mon
s A
ttrib
utio
n 3.
0 U
npor
ted
Lic
ence
.View Article Online
[C]t¼0 ¼ 126.5 mM), the catalyst concentration is made the onlyfree variable.
For the purposes of capturing the completion rate depen-dence on catalyst concentration, rather than developing a newsystem of differential equations to specically model the CuAACreaction, we can use eqn (6) as an intuitive template. By settingXo¼ a and Yo¼ b + [D]t¼0, we arrive at a parametric equation forthe time to transition when only the catalyst concentration isvarying:
t1=2ð½D�t¼0Þ ¼ln
�2þ a
½D�t¼0 þ b
�
ðaþ ½D�t¼0 þ bÞk (7)
To obtain the catalyst ([D]t¼0) for seeding the reaction, wepre-react a concentrated mixture ([A]t¼0 ¼ 1.308 M, [B]t¼0 ¼3.708 M, and [C]t¼0 ¼ 0.516 M) of reagents for 48 hours. Forsimplicity, we assume the reaction runs to completion, yieldinga product concentration of 1.236 M, which is one third theconcentration of the limiting reagent, the azide.
Transition time calibration
To model the constrained CuAAC, we performed a series ofreactions with varying seed catalyst concentrations. Startingwith concentrated pre-reacted solution (containing about 1.2 Mof catalyst), we performed serial dilutions in 94% water and 6%methanol. Samples of 1 mL from each diluted catalyst solutionwere then transferred to a 384-well plate. In each well, 50 mL ofstarting reagent solution was added to initiate the reaction.Once the transfers were completed, the plate was placed in a UV-vis plate reader to obtain the absorbance traces shown inFig. 5a.
From the UV-vis traces, we extracted the time to transitionsas the time points at which product absorbances were halfwaybetween their initial and nal values (Fig. 5b). Based on thesecurves, we t a model of the transition time, which was in turnused for simulations and experiment planning (Fig. 5c).
Winner-take-all network
One algorithm suitable for reaction-based time delays isa winner-take-all (WTA) neural network.42 Such a network can bethought of as a race between potential classes, where the rstclass to reach a target state is deemed the winner. A diagram ofa representative WTA network is shown in Fig. 8b, where each ofthe pooled outputs, yk, are associated with a different class. Acomparison between the pools is used to determine the class ofthe input data (~x). Despite their relative simplicity, thesenetworks can be designed to efficiently approximate anycontinuous function.43 Here, we set out to implement a chem-ical WTA network for image classication. An overview of theproposed computing framework is shown in Fig. 6.
Encoding data in catalyst concentration
Digital images are represented chemically by the initialconcentration of catalyst. Each pixel in a binary input image (~x)is assigned a position on a well plate, and an initial volume of
© 2021 The Author(s). Published by the Royal Society of Chemistry
solvent (Vs) is added to each of these wells. Then, for each whitepixel (xn ¼ 1), a small volume of pre-reacted solution (Vd), witha catalyst concentration Do, is added to its well. No catalyst is
Chem. Sci., 2021, 12, 5464–5472 | 5467
Chemical Science Edge Article
Ope
n A
cces
s A
rtic
le. P
ublis
hed
on 0
3 M
arch
202
1. D
ownl
oade
d on
1/2
4/20
22 1
:41:
33 P
M.
Thi
s ar
ticle
is li
cens
ed u
nder
a C
reat
ive
Com
mon
s A
ttrib
utio
n 3.
0 U
npor
ted
Lic
ence
.View Article Online
added to wells corresponding to black pixels (xn ¼ 0). Thus thenal catalyst concentration in data well n will be:
dn ¼ Do � xnVd
xnVd þ Vs
¼�0; xn ¼ 0
c; xn ¼ 1(8)
where c ¼ Do � Vd/(Vd + Vs) is the nonzero concentration ofcatalyst associated with white pixels. While more bits could berepresented per well by allowing intermediate concentrationlevels (e.g. c/2, c/4, c/8), for these demonstrations we elected touse a dataset of binary images.
In-solution multiply and accumulate
The network inputs are mapped to class-specic pools throughvolumetric multiply-accumulate (MAC) operations.26 A smallvolume, vkn, is sampled from each of the n data wells andtransferred to pool k. The amount taken from each well is set asvkn ¼ wkn � Vu, where Vu is the maximum volume allowed to betransferred from a well and wkn ˛ [0, 1] is a tuning factor. Byscaling the transfer volumes with weights trained on class k(~wk), the summed output pool (yk) can be made to representa single MAC operation on the catalyst-encoded input data (~d).The resulting catalyst concentration in class k's pool is given by:
pk ¼PNn¼1
vkndn
Vk
¼PNn¼1
wkndn
PNn¼1
wkn
(9)
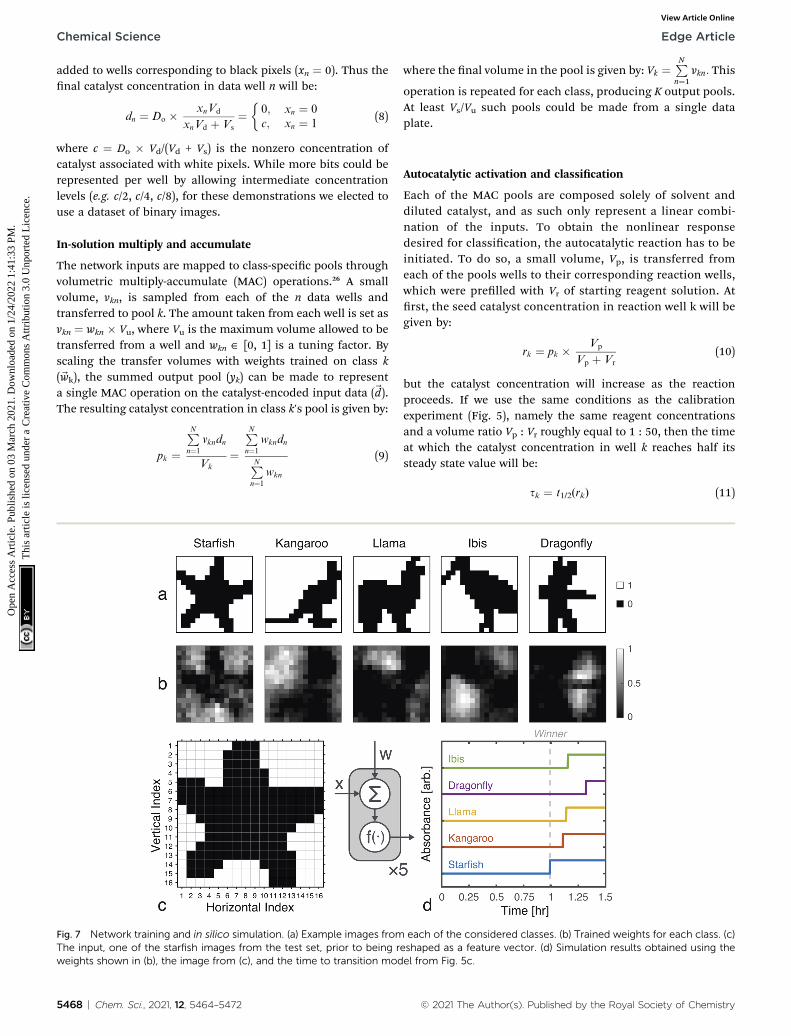
Fig. 7 Network training and in silico simulation. (a) Example images fromThe input, one of the starfish images from the test set, prior to being rweights shown in (b), the image from (c), and the time to transition mod
5468 | Chem. Sci., 2021, 12, 5464–5472
where the nal volume in the pool is given by: Vk ¼PNn¼1
vkn: This
operation is repeated for each class, producing K output pools.At least Vs/Vu such pools could be made from a single dataplate.
Autocatalytic activation and classication
Each of the MAC pools are composed solely of solvent anddiluted catalyst, and as such only represent a linear combi-nation of the inputs. To obtain the nonlinear responsedesired for classication, the autocatalytic reaction has to beinitiated. To do so, a small volume, Vp, is transferred fromeach of the pools wells to their corresponding reaction wells,which were prelled with Vr of starting reagent solution. Atrst, the seed catalyst concentration in reaction well k will begiven by:
rk ¼ pk � Vp
Vp þ Vr
(10)
but the catalyst concentration will increase as the reactionproceeds. If we use the same conditions as the calibrationexperiment (Fig. 5), namely the same reagent concentrationsand a volume ratio Vp : Vr roughly equal to 1 : 50, then the timeat which the catalyst concentration in well k reaches half itssteady state value will be:
sk ¼ t1/2(rk) (11)
each of the considered classes. (b) Trained weights for each class. (c)eshaped as a feature vector. (d) Simulation results obtained using theel from Fig. 5c.
© 2021 The Author(s). Published by the Royal Society of Chemistry

Edge Article Chemical Science
Ope
n A
cces
s A
rtic
le. P
ublis
hed
on 0
3 M
arch
202
1. D
ownl
oade
d on
1/2
4/20
22 1
:41:
33 P
M.
Thi
s ar
ticle
is li
cens
ed u
nder
a C
reat
ive
Com
mon
s A
ttrib
utio
n 3.
0 U
npor
ted
Lic
ence
.View Article Online
where t1/2 is the time to transition model from eqn (7) andFig. 5c. If the pooling weights are tuned such that the rstreaction well to run to half completion represents the class mostsimilar to the input data (see Methods), then we can assign classi to the input when:
si < sj, ci s j (12)
where the transition times can be found by monitoring thereaction wells with a UV-vis plate reader.
Experimental demonstration
Using the proposed approach, we built an autocatalytic WTAnetwork for classifying binary images from the CalTech 101 16
Fig. 8 Experimental demonstration of chemical image classification. (aresented in the presence (blue, 200 nL added) or absence (transparent, 0wells (9.5 mL of 94% deionized water and 6% methanol). High pixels (xn ¼pixels (xn ¼ 0) have 0 mM of catalyst. (b) Diagram of the winner-takechemistry. (c) Pooled well absorbance traces (each repeated in triplicateeach class' first pool, showing the winner to correctly be the “Starfish.” (epooled wells. Simulated data was offset by�12.162minutes, which was ththe start of plate monitoring.
© 2021 The Author(s). Published by the Royal Society of Chemistry
� 16 Silhouettes dataset44 (Fig. S1 and S2†). The network wasspecically designed to identify ve (K ¼ 5) of the more recog-nizable image classes: ‘starsh’, ‘kangaroo’, ‘llama’, ‘dragony’,and ‘ibis’ (68–86 images per class, shown in Fig. S3–S7†).
Network weights were iteratively trained over 700 epochs,using a 70–30% train-test split (Fig. S8†). The training algorithmis described in the Methods, and the resulting weights areshown graphically in Fig. 7, alongside an example image fromeach class. Using these weights and the time to transitionmodelfrom Fig. 5, we simulated the outputs of the network for oneinput image (Fig. 7c and d). Extending these simulations to thefull train and test sets (398 images in total), the network wasfound to have a classication accuracy of 81.16% (Fig. S9†).
) Image of the data plate, containing a binary image of a starfish rep-nL added) of pre-reacted catalyst (nominally 618 mM) in solvent filled1) contain a presumed catalyst concentration of 12.742 mM, while low-all classification network implemented in liquid-phase autocatalytic) for the 5-class WTA network. (d) Overlay of the absorbance traces for) The mean measured and simulated times to transition for each of thee amount of time it took between introducing the reagent solution and
Chem. Sci., 2021, 12, 5464–5472 | 5469

Chemical Science Edge Article
Ope
n A
cces
s A
rtic
le. P
ublis
hed
on 0
3 M
arch
202
1. D
ownl
oade
d on
1/2
4/20
22 1
:41:
33 P
M.
Thi
s ar
ticle
is li
cens
ed u
nder
a C
reat
ive
Com
mon
s A
ttrib
utio
n 3.
0 U
npor
ted
Lic
ence
.View Article Online
A 256-pixel binary image of a starsh, shown in Fig. 7c, waswritten to a 384-well plate using catalyst presence/absenceencoding. The data plate preparation began by rstdispensing Vs ¼ 9.5 mL of solvent (6% methanol in water) to allwells. Wells corresponding to white pixels (xn ¼ 1) received anadditional Vd ¼ 200 nL of 2�-diluted pre-reacted solution,nominally containing Do ¼ 618 mM of catalyst. Wells corre-sponding to black pixels (xn ¼ 0) had no catalyst added. Animage of the resulting data plate is shown in Fig. 8a, wherea faint blue color can be seen in the wells that contain catalyst (c¼ 12.742 mM).
The weights for each considered class were applied to thestarsh image, resulting in 5 separate pools. A small volume (Vp¼ 1 mL) from each output pool was transferred, in triplicate, towells on a new 384-well plate. To begin the CuAAC reactions, Vr¼ 50 mL of starting reagent solution was added to each well. Theplate was promptly loaded into a UV-vis reader to track theprogression of the reactions.
Absorbance measurements were taken every 60 seconds overthe course of 8 hours. Themeasured signals are shown in Fig. 8cand compared in Fig. 8d. Consistent with the simulation, the‘starsh’ pool was the rst reaction to complete. The runner up,kangaroo, was 6.5 minutes behind. On average, measuredtransition times deviated from simulations by 2% (Fig. 8e).
Perspectives for chemical computing
DNA has oen been the chemistry of choice for many devel-opments in chemical computing,10,21,22,45–50 and it will continueto provide a powerful foundation for molecular-scale compu-tation. DNA reaction networks benet from the sequence-specicity of hybridization reactions and the availability ofnumerous catalytic enzymes. Strand displacement reactions, forinstance, have been used to perform winner-take-all classica-tion of 10 � 10 pixel binary images.22 However, because theoperations rely on specic DNA sequences, a relatively largenumber of reagents must be designed and synthesized a priori.In contrast, the CuAAC reaction requires only three inputs,allowing for rapid re-conguration. Furthermore, DNA is oenconstrained to biologically relevant conditions (e.g. pH,temperature, salinity). Opportunities to utilize a broader rangeof catalytic reactions, which use fewer reagents or operateoutside of physiological conditions, may open up new avenuesfor chemical computing.
Autocatalytic processes, with their nonlinear response andinput–output self-similarity, represent an attractive substratefor chemical based computing. In this work, we have shown,with a simple single-layer WTA network, how the kinetics of anautocatalytic reaction could be exploited for in chemico imageclassication. In the future, autocatalytic computation could beextended to more complicated architectures, such as a multi-layered WTA network that uses multiple rounds of volumetricpooling. Because the CuAAC reaction progress can be moni-tored through visible color changes there is no need for addi-tional reporter molecules. Additionally, since the CuAACreaction involves a reactive copper species (Cu(I)), it could becoupled to other reactions which would inuence triazole
5470 | Chem. Sci., 2021, 12, 5464–5472
production, potentially allowing for more complex and dynamicoperations.
Conclusions
In summary, we designed and implemented a simple neuralnetwork using an array of autocatalytic reactions. This researchextends previous chemical computing efforts which utilizednon-reactive mixtures and were limited to linear mathematicaloperations.26Here, we adapted the autocatalytic CuAAC reactionto serve as the nonlinear activation function needed for WTAclassication. This work represents unique experimental prog-ress towards a fully liquid-phase chemical classier, in a non-biological chemistry. We anticipate that autocatalytic reactionnetworks will play a critical role in the future development ofadvanced chemical-domain computing systems.
MethodsMaterials and reagents
All solutions were prepared using in-house deionized water(Millipore Milli-Q), having a resistivity of 18.2 MU cm at 25 �C,and HPLC-grade methanol (>99%, Fisher Scientic, Waltham,MA). The CuAAC reaction was done, in a solvent comprised of6%methanol and 94% water, using 2-azidoethanol (98%, SantaCruz Biotechnology Inc, Dallas, TX) as the azide, tripropargyl-amine (98%, Sigma Aldrich, Natick, MA) as the alkyne, andcopper(II) sulfate (>99%, Sigma Aldrich, Natick, MA) as thesource of copper ions. The reactions were conducted at roomtemperature, in sealed well plates and cuvettes to preventevaporation. Low dead volume 384-well microplates made ofcyclic olen copolymer (LP-0200, Labcyte Echo) and 384-wellmicroplates made of polypropylene were used for highthroughput experiments (PP-0200, Labcyte Echo).
Instrumentation and analysis
An Echo 550 (Labcyte) acoustic uid handler was used toperform the volume transfers for the high throughput experi-ments. Custom Python scripts were used to generate uidhandling instructions. Individual UV-vis measurements weretaken with the Cary 50 (Varian), while the Synergy HTX (BioTek)platereader was used for arrayed measurements. CustomMATLAB scripts were used for network design, data analysis,and visualization.
Network training
The objective of training is to produce amatrix of weights whichmaximize the accuracy of theWTA network. In order to correctlyidentify an image, the pool for its associated class shouldtransition before that of any other class. Because volumetricmultiply-accumulate operations correspond to positiveweights26 and since there is an imposed upper limit (Vu) on thetransfer volume, weight values can be specied relative to thetransfer limit, such that they fall between 0 and 1.
To accommodate these constraints, the network is trainedsimilarly to a self-organizing map,51 where weights are
© 2021 The Author(s). Published by the Royal Society of Chemistry

Edge Article Chemical Science
Ope
n A
cces
s A
rtic
le. P
ublis
hed
on 0
3 M
arch
202
1. D
ownl
oade
d on
1/2
4/20
22 1
:41:
33 P
M.
Thi
s ar
ticle
is li
cens
ed u
nder
a C
reat
ive
Com
mon
s A
ttrib
utio
n 3.
0 U
npor
ted
Lic
ence
.View Article Online
iteratively tuned to be more similar to input data. A benet oftraining the weights on the inputs, rather than on the outputs ofthe activation function, is that the weights are independent ofspecic chemical conditions and only require the time totransition to be monotonic in initial catalyst concentration.
If a weight vector (~wi) is trained to identify class i, it shouldlookmore like the data (~x) from class i than a weight vector fromany other class:
k~wi � ~xk2 < k~wj � ~xk2, cj s i (13)
where similarity is measured by the L2-norm: k~qk ¼ffiffiffiffiffiffiffiffiffiffiffiffiPnqn2
r:
This inequality can be summed across the remaining K � 1classes to yield:
ðK � 1Þ � k~wi �~xk2\Xjsi
k~wj �~xk2 (14)
which can be rearranged to form the following loss function:
Lð~x; i;WÞ ¼ k~wi �~xk2� 1
K � 1�Xjsi
k~wj �~xk2 (15)
where W is the K � N matrix of all class weight vectors and~x isdata from class i. Averaging the losses over the training data, wearrive at the following objective:
FðX ;W Þ ¼ 1
M
XMm¼1
L�~xm; im;W
�(16)
where X is the M � N matrix of training data and im is the classof the mth training example (~xm).
We want to nd the weight matrix (W) that minimizes thisobjective (F). Taking the partial derivative of the objective, forfeature n and class k, yields:
vFðX ;W Þvwkn
¼ 1
M
XMm¼1
vL�~xm; im;W
�vwkn
(17)
where
vLð~x; i;WÞvwkn
¼8<:
2� ðwkn � xnÞ; for k ¼ i
�2K � 1
� ðwkn � xnÞ; for k ¼ jsi
9=; (18)
Using these derivatives, the optimal weights for each class arelearned through gradient descent.52 Aer each descent step, theweights are constrained to the range of wkn ˛ [0, 1] by clippingnegative values to 0 and normalizing the remaining values bythe class maximum. Since the weights are implemented asvolume transfers, carried out on a uid handler with a resolu-tion of Vd ¼ 2.5 nL and a chosen transfer volume limit of 200 nL(Vu), their experimental precision is approximately 6 bits (Vd/Vu¼ 80 levels).
A MATLAB implementation of the training routine isprovided in the ESI (Listing S1†) and is also available on Github:github.com/Chris3Arcadia/AutocatalyticWTA. In addition to theexperimentally tested network, one hundred 5-class WTAnetworks (see Fig. S10 and Table S1†) and one 9-class WTA
© 2021 The Author(s). Published by the Royal Society of Chemistry
network (see Fig. S11 and S12†) were trained and evaluated insilico to test the proposed classication scheme.
Author contributions
C. E. A., A. D., K. O., and S.-L. C. performed experiments. C. E. A.and K. O. analyzed data. C. E. A and H. K. performed simula-tions. C. R., E. K., S. R., B. M. R., and J. K. R. provided directionand oversight. C. E. A., A. D., K. O., and J. K. R. draed the paper.All authors provided notes and edits to the paper.
Conflicts of interest
The authors declare that they have no conicts of interest.
Acknowledgements
This research was supported by funding from the DefenseAdvanced Research Projects Agency (DARPA W911NF-18-2-0031). The views, opinions and/or ndings expressed arethose of the authors and should not be interpreted as repre-senting the official views or policies of the Department ofDefense or the U.S. Government. This work was also supportedin part by the National Science Foundation under Grant No.1941344.
Notes and references
1 R. Plasson, A. Brandenburg, L. Jullien and H. Bersini, J. Phys.Chem. A, 2011, 115, 8073–8085.
2 P. Richard, FEMS Microbiol. Rev., 2003, 27, 547–557.3 C. Thron, Biophys. Chem., 1996, 57, 239–251.4 N. A. Thornberry and Y. Lazebnik, Science, 1998, 281, 1312–1316.
5 P. v. Nies, I. Westerlaken, D. Blanken, M. Salas, M. Mencıaand C. Danelon, Nat. Commun., 2018, 9, 1583.
6 D. H. Lee, K. Severin and M. R. Ghadiri, Curr. Opin. Chem.Biol., 1997, 1, 491–496.
7 W. Hordijk, J. Hein and M. Steel, Entropy, 2010, 12, 1733–1742.
8 A. M. Zador, Nat. Neurosci., 2000, 3, 1167.9 F. Simini, 2016, arXiv:1602.09070.10 L. Adleman, Science, 1994, 266, 1021–1024.11 F. L. Carter, Phys. D, 1984, 10, 175–194.12 G. M. Church, Y. Gao and S. Kosuri, Science, 2012, 337, 1628.13 L. Organick, S. D. Ang, Y.-J. Chen, R. Lopez, S. Yekhanin,
K. Makarychev, M. Z. Racz, G. Kamath, P. Gopalan,B. Nguyen, C. N. Takahashi, S. Newman, H.-Y. Parker,C. Rashtchian, K. Stewart, G. Gupta, R. Carlson,J. Mulligan, D. Carmean, G. Seelig, L. Ceze and K. Strauss,Nat. Biotechnol., 2018, 36, 242–248.
14 L. Anavy, I. Vaknin, O. Atar, R. Amit and Z. Yakhini, Nat.Biotechnol., 2019, 37, 1229–1236.
15 N. F. Konig, A. A. Ouahabi, L. Oswald, R. Szweda, L. Charlesand J.-F. Lutz, Nat. Commun., 2019, 10, 3774.
16 C. E. Arcadia, E. Kennedy, J. Geiser, A. Dombroski, K. Oakley,S.-L. Chen, L. Sprague, M. Ozmen, J. Sello, P. M. Weber,
Chem. Sci., 2021, 12, 5464–5472 | 5471
Chemical Science Edge Article
Ope
n A
cces
s A
rtic
le. P
ublis
hed
on 0
3 M
arch
202
1. D
ownl
oade
d on
1/2
4/20
22 1
:41:
33 P
M.
Thi
s ar
ticle
is li
cens
ed u
nder
a C
reat
ive
Com
mon
s A
ttrib
utio
n 3.
0 U
npor
ted
Lic
ence
.View Article Online
S. Reda, C. Rose, E. Kim, B. M. Rubenstein andJ. K. Rosenstein, Nat. Commun., 2020, 11, 691.
17 J. K. Rosenstein, A. Dombroski, K. Oakley, S. L. Chen,H. Tann, B. M. Rubenstein, C. Rose, S. Reda, P. M. Weber,E. Kim, J. Sello, J. Geiser, E. Kennedy and C. Arcadia, IEEETrans. Nanobiosci., 2020, 1.
18 J. Hasty, D. McMillen and J. J. Collins, Nature, 2002, 420,224–230.
19 H. Kim, D. Bojar and M. Fussenegger, Proc. Natl. Acad. Sci. U.S. A., 2019, 116, 201821740.
20 L. Qian, E. Winfree and J. Bruck, Nature, 2011, 475, 368–372.21 X. Song, A. Eshra, C. Dwyer and J. Reif, RSC Adv., 2017, 7,
28130–28144.22 K. M. Cherry and L. Qian, Nature, 2018, 559, 370–376.23 N. G. Rambidi, Biosystems, 1995, 35, 195–198.24 J. Gorecki, K. Gizynski, J. Guzowski, J. N. Gorecka,
P. Garstecki, G. Gruenert and P. Dittrich, Philos. Trans. R.Soc., A, 2015, 373, 20140219.
25 A. Pandi, M. Koch, P. L. Voyvodic, P. Soudier, J. Bonnet,M. Kushwaha and J.-L. Faulon, Nat. Commun., 2019, 10,3880.
26 C. E. Arcadia, H. Tann, A. Dombroski, K. Ferguson,S. L. Chen, E. Kim, C. Rose, B. M. Rubenstein, S. Reda andJ. K. Rosenstein, IEEE International Conference on RebootingComputing, 2018, 1–9.
27 R. Brijder, Nat. Comput., 2019, 18, 119–137.28 D. Blount, P. Banda, C. Teuscher and D. Stefanovic, Artif.
Life, 2017, 23, 295–317.29 C. Rose, S. Reda, B. Rubenstein and J. Rosenstein, 2018 IEEE
International Symposium on Information Theory (ISIT), 2018,pp. 2236–2240.
30 P. Banda, C. Teuscher and M. R. Lakin, Artif. Life, 2013, 19,195–219.
31 P. Banda and C. Teuscher, Articial Life ConferenceProceedings, 2014, vol. 14, pp. 482–489.
32 Y. LeCun, L. Bottou, Y. Bengio and P. Haffner, Proc. IEEE,1998, 86, 2278–2324.
5472 | Chem. Sci., 2021, 12, 5464–5472
33 J. I. Steinfeld, J. S. Francisco and W. L. Hase, Chemicalkinetics and dynamics, Prentice Hall Englewood Cliffs, NewJersey, 1989, vol. 3.
34 B. Kia, J. F. Lindner and W. L. Ditto, Philos. Trans. R. Soc., A,2017, 375, 20160222.
35 G. Hinton, L. Deng, D. Yu, G. E. Dahl, A. Mohamed, N. Jaitly,A. Senior, V. Vanhoucke, P. Nguyen, T. N. Sainath andB. Kingsbury, IEEE Signal Process. Mag., 2012, 29, 82–97.
36 V. Nair and G. E. Hinton, ICML, 2010, 807–814.37 R. A. Evans, Aust. J. Chem., 2007, 60, 384–395.38 H. C. Kolb, M. G. Finn and K. B. Sharpless, Angew. Chem., Int.
Ed., 2001, 40, 2004–2021.39 S. N. Semenov, L. Belding, B. J. Cafferty, M. P. Mousavi,
A. M. Finogenova, R. S. Cruz, E. V. Skorb andG. M. Whitesides, J. Am. Chem. Soc., 2018, 140, 10221–10232.
40 T. R. Chan, R. Hilgraf, K. B. Sharpless and V. V. Fokin, Org.Lett., 2004, 6, 2853–2855.
41 D. Dohler, P. Michael and W. H. Binder, Macromolecules,2012, 45, 3335–3345.
42 S. Kaski and T. Kohonen, Neural Network., 1994, 7, 973–984.43 W. Maass, Neural Comput., 2006, 12, 2519–2535.44 B. Marlin, K. Swersky, B. Chen and N. Freitas, Proceedings of
the Thirteenth International Conference on ArticialIntelligence and Statistics, Chia Laguna Resort, Sardinia,Italy, 2010, pp. 509–516.
45 R. Lipton, Science, 1995, 268, 542–545.46 B. Yurke, A. J. Turbereld, A. P. Mills, F. C. Simmel and
J. L. Neumann, Nature, 2000, 406, 605–608.47 D. Woods, D. Doty, C. Myhrvold, J. Hui, F. Zhou, P. Yin and
E. Winfree, Nature, 2019, 567, 366–372.48 N. Mamet, G. Harari, A. Zamir and I. Bachelet, Comput. Biol.
Chem., 2019, 107122.49 R.-R. Gao, T.-M. Yao, X.-Y. Lv, Y.-Y. Zhu, Y.-W. Zhang and
S. Shi, Chem. Sci., 2017, 8, 4211–4222.50 X. Lin, S. Yang, D. Huang, C. Guo, D. Chen, Q. Yang and F. Li,
Chem. Sci., 2020, 11, 9617–9622.51 T. Kohonen, Proc. IEEE, 1990, 78, 1464–1480.52 S. Ruder, 2016, arXiv:1609.04747.
© 2021 The Author(s). Published by the Royal Society of Chemistry