Embed Size (px)
Citation preview
Leveraged Municipal Bond Arbitrage: What Went Wrong?1
by
Geng Deng PhD and Craig McCann, PhD
Substantial losses suffered by several multi-billion dollar fixed income hedge funds have brought attention to risks involved in what was advertised as a leveraged municipal bond arbitrage strategy. The purported arbitrage strategy involved trades of municipal bonds, short-term notes, and interest-rate derivatives employed by some hedge funds.2
The published literature documents a persistent difference in after-tax yields on municipal bonds and on Treasury securities. This persistent difference would be an arbitrage opportunity if municipal bonds and Treasury securities were identical in all material ways except for their tax treatment. However, the securities are not identical and the persistent difference in after-tax yields is mainly due to the call features in municipal bonds - call features which are absent in the taxable benchmarks. Thus much of what the brokerage firms marketed as an arbitrage opportunity was merely compensation for well known call option risk. In addition, the published literature documents that compensation for liquidity and credit risk in municipal bonds explains the remaining difference in after-tax yields the brokerage firms sold as an arbitrage opportunity.
Brokerage firms marketed these hedge funds to investors as higher yielding alternatives to conventional municipal bond portfolios with little, if any, additional risk. In this article we explain what the strategy really was, why it was not an arbitrage, and why it failed.
Fundamentally, the strategy was simply a highly leveraged bet on the value of short call options, on interest rates, and on liquidity and credit risk. Those risks are priced into municipal securities and since the hedge funds’ had extraordinary fees, the expected returns were predictably inadequate to compensate for the strategy’s risks.
I. Introduction The leveraged municipal bond arbitrage strategy was the primary investment
strategy for dozens of hedge funds. The funds were marketed based entirely on the false claim that yields on long-term municipal bonds are typically greater than after-tax yields 1 © 2011 Securities Litigation and Consulting Group, Inc., 3998 Fair Ridge Drive, Suite 250, Fairfax, VA 22033. www.slcg.com. This paper benefitted greatly from the collaborative effort of many SLCG employees. The primary authors are Geng Deng and Craig McCann. Dr. Deng can be reached at 703-890-0741or [email protected] and Dr. McCann can be reached at 703-246-9381 or [email protected]. 2 Six highly leveraged municipal bond funds were marketed to investors by Citigroup under the ASTA and MAT brand names. Another set of Citigroup’s hedge funds, Falcon Strategies funds, also employed municipal bond arbitrage, but included other investment strategies such as mortgage-backed securities arbitrage, opportunistic mortgage-backed securities investments, banks loans, and relative value plays. See, Eric Dash, “Citigroup Acts to Bolster Hedge Funds,” New York Times March 11, 2008 and David Enrich, “Inside Citi, A Hedge-Fund Push Blows Up,” The Wall Street Journal, April 29, 2008. More than 35 similar leveraged municipal arbitrage funds were marketed, including by funds such as Aravali Fund, Havell Capital Enhanced Municipal Income Fund, TW Tax Advantaged Fund, Stone & Youngberg Municipal Advantage Fund, 1861 Capital Management, Gem Capital, Rockwater Hedge Fund, LLC, Blue River Asset Management Main Muni Fund and many others.

Securities Litigation and Consulting Group, Inc. © 2011.
2
on long-term Treasury securities or swap contracts because of structural imbalances in these markets, not because of greater risks in long-term municipal bonds than in taxable bonds. Leverage was used to magnify the arbitrage profits which the funds claimed could be earned from this strategy.
Published academic research shows that the claimed market inefficiency underlying the leveraged municipal arbitrage strategy was not an inefficiency at all.3
The remaining difference in yields touted by the brokerage firms as an arbitrage opportunity is explained by the liquidity risk and credit risk in long-term municipal bonds.
The observed difference in yields is partly the result of inaptly comparing yields on callable municipal bonds to yields on non-callable taxable bonds without adjusting for the value of the embedded call options. The firms promoting this strategy did not explain in their marketing materials that a significant portion of the difference in yields the firms touted as an arbitrage opportunity was compensation for the short call option attached to most municipal bonds but absent from the taxable bonds.
4
In late 2007 and early 2008, many leveraged municipal bond arbitrage funds suffered catastrophic losses as municipal bond prices declined without offsetting gains on swap contracts. While funds launched in the 2002-2006 period had the same fundamental flaws as later funds, the earlier funds benefited temporarily from especially favorable market conditions. By 2006 the market conditions under which the earlier hedge funds’ misrepresented strategy had been masked changed sufficiently that all vintages of funds suffered significant losses. The municipal bonds declined in value because of the market-wide decline in liquidity and the deteriorating credit quality of companies that had insured the credit quality of many (most) municipal bonds – precisely the risks that were known to exist in long-term municipal bonds and for which investors in long-term municipal bonds demanded higher yields.
In particular, the liquidity risk in long-term municipal bonds is both substantial and systematic. Municipal bond investors buying long-term callable municipal bonds are compensated for bearing the call risk and the increased liquidity and credit risk with higher promised yields than earned on Treasury securities or swap contracts.
We conducted extensive simulations to test the relative riskiness of the leveraged municipal bond strategy. The simulation results demonstrate that the strategy had much higher downside risk than investing in Treasury bonds, municipal bonds, or stocks and this risk increased significantly before the funds’ collapse in 2007 and 2008.
Finally, we show that market conditions that caused large losses in leveraged municipal bond arbitrage funds in the 2007-2008 time period were far from 3 See Green (1993) and Chalmers (1998, 2006) for a discussion of the embedded call option. 4 See Hempel (1973), Gordon and Malkiel (1981), Trzcinka (1982), Wu (1991) and Wang, Wu, and Zhang (2008) for a discussion of credit risk, See Chakravarty and Sarkar (2003) Harris and Piwowar (2004), and Wang, Wu, and Zhang(2008)for a discussion of liquidity risk.

Geng Deng and Craig McCann Leveraged Municipal Bond Arbitrage: What Went Wrong?
3
unprecedented. Prior to 2007, there were two periods of distress in municipal bond markets during which funds would have exhibited even larger losses than they did in 2007-2008, had they existed during those two periods.
II. Leveraged Municipal Bond Arbitrage Strategy in an Idealized Environment i. Arbitrage
An arbitrage opportunity arises when the prices of the same asset in two markets differ by more than the trading costs of buying in the low-price market and simultaneously selling in the high-price market. For example, if Yahoo! stock is being quoted in one market at $11.00 “bid”, $11.25 “ask” in one market and at $11.50 bid, $11.75 ask in another market, investors who can simultaneously buy in the first market at $11.25 and sell in the second market at $11.50 will make a riskless profit of $0.25.5
ii. Yield Curves and Term Spreads – the “muni-puzzle”
The net purchases in the low price market will push the price quotes up and the net sales in the high price market will cause the price quotes to fall. Arbitragers will continue to profit from the difference in price quotes in the two markets until the bid-ask spreads overlap – $11.25 bid, $11.50 ask in both markets, for example.
Yield curves are graphs that plot the relationship between yields-to-maturity and terms-to-maturity. Figure 1 is an illustration of the muni bond puzzle. We plot the average yield to maturity on municipal bonds and the tax-adjusted LIBOR swap6 rates using weekly observations of published yield indexes from January 1, 2001 to December 31, 2009. 7
5 Of course, market makers or other professional investors have better information and incentives to capture potential arbitrage profits so retail investors are unlikely to ever observe an arbitrage opportunity.
We adjust the LIBOR swap rate by an assumed 35% marginal tax rate. Although there is considerable variation during this nine-year period, Figure 1 captures a persistent qualitative relationship: yields on AAA-rated municipal bonds are consistently higher than tax-adjusted LIBOR swap term spread and this difference in after-tax yields increases at longer maturities despite the low observed default rates on AAA-rated municipal bonds.
6 LIBOR is the London Interbank Offer Rate which is the interest rate banks charge each other for loans and is usually interpreted to be the interest rate paid by AA/A rated banks. An interest-rate swap is an agreement between two parties to swap interest payments for a specified period of time. The swap rate is the fixed interest rate exchanged for floating interest rate payments in an interest rate swap; the floating rate is typically LIBOR. A term is specified for the swap, meaning that the fixed rate is paid in exchange for the floating rate for a specified number of years – the term of the swap. The fixed interest rate paid in exchange for LIBOR for various terms makes up the swap curve. If a swap is unwound, the contract is cash settled with a payment of the market value of the net future cash flows. A swaption is an option giving a buyer a right to enter into a specified swap at a specified future date. For an accessible introduction to interest rate swaps see “Bond Basics: What are Interest Rate Swaps and How Do They Work?” available at www.pimco.com/LeftNav/Bond+Basics/2008/Interest+Rate+Swaps+Basics+1-08.htm 7 25 year swap data is only available from April 20, 2001.

Securities Litigation and Consulting Group, Inc. © 2011.
4
The municipal term spread is consistently greater than the after-tax LIBOR swap
term spread. That is, municipal yield curves like the solid (blue) line in Figure 1 are consistently steeper than after-tax LIBOR swap rate curves like the dashed (red) line in Figure 1. This widening of the gap between the yield curves is what the brokerage firms misrepresented as an arbitrage opportunity.
iii. Differences in Term Spreads Figure 2 plots the difference between the term spread for municipal bonds and the
after-tax term spread for LIBOR swaps from 2001 to 2008.8
This difference between the term spreads in the tax exempt and taxable markets was sold by brokerage firms to investors as an “inefficiency” resulting from structural imbalances in the municipal bond market. Brokerage firms claimed that structural flaws prevented traders from bidding up the prices of long-term municipal bonds so that their yields were no more than the after-tax yields on taxable securities. That is, brokerage firms claimed that long-term municipal bond prices were too low compared to prices of taxable bonds because there was a chronic excess supply of long-term municipal bonds,
The municipal term spread is greater than the after-tax LIBOR swap term spread throughout the entire time period although there is considerable variation over time.
8 Source: Bloomberg, MMAI20Y, MMAI01Y, USSW20 and USSW1 data series.
Figure 1: Average Yield Curves from 2001 to 2009 LIBOR swaps are taxable securities, so we reduce their yields by an assumed tax rate of 35% t o compare to yields on tax-free securities like municipal bonds on an after-tax basis. Taxable yield curves typically slope up, with longer maturity securities paying higher yields to maturity than shorter-term securities; yield curves for callable municipal bonds always slope up and are always steeper than LIBOR swap rate curves.
1.5%
2.0%
2.5%
3.0%
3.5%
4.0%
4.5%
5.0%
1 2 3 4 5 6 7 8 9 10 11 12 13 14 15 16 17 18 19 20 21 22 23 24 25
Yie
ld to
Mat
urity
Maturity (in Years)
AAA Municipal Yield
Tax-Efficient Muni Curve (65% LIBOR)

Geng Deng and Craig McCann Leveraged Municipal Bond Arbitrage: What Went Wrong?
5
which artificially depressed their prices. The hedge funds proposed to circumvent the structural imbalances and capture this arbitrage opportunity by leveraging up portfolios of these “cheap” long-term municipal bonds.
iv. The Strategy
The leveraged municipal bond strategy is conceptually simple. Long-term municipal bonds paid higher yields than short-term bonds. By investing long-term and borrowing short-term, the hedge funds were supposed to generate a positive net cash flow after fees. The viability of the leveraged portfolio was highly susceptible to interest rate and market risk and these risks were imperfectly hedged in the taxable market. Some but not all of the positive net cash flow on the municipal bonds was given up in the hedging transactions. Table 1 provides an example of income before fees given the yield curves illustrated in Figure 1.
Figure 2: 1-20 Year Municipal Term Spread Minus 1-20 Year After-Tax LIBOR Swap Term Spread A positive difference between the municipal term spread and the after-tax LIBOR swap term spread means the municipal yield curve is steeper than the after-tax LIBOR swap rate curve.
0.0%
0.2%
0.4%
0.6%
0.8%
1.0%
1.2%
1.4%
1.6%
1.8%
2.0%
Mun
icip
al T
erm
Spr
ead
- Afte
r-Ta
x LI
BO
R S
wap
Te
rm S
prea
d
Date

Securities Litigation and Consulting Group, Inc. © 2011.
6
Fund managers increased the small net cash flow in Table 1 by leveraging up the
portfolio. For example, by leveraging the equity investment 10 times, the stylized fund could provide a tax-exempt gross annual return of 5.90% over 10 years. See Table 2.
v. The Funds Described “Arbitrage Opportunities” Using Long Ratios
While we have used differences in yields or differences in term spreads in our discussion so far, discussions of the leveraged municipal bond strategy in the firms’ marketing materials were frequently expressed in terms of “Long Ratios.”9
9 The Long Ratio has also been called the TEXT for Tax-Exempt to Taxable by Kalotay and Dorigan (2009). They explain the observation that the Long Ratio or TEXT is higher for longer maturities by pointing out that the municipal bonds are callable while Treasury securities and swap contracts are not. While the authors claim this as an original insight, the importance of accounting for embedded in municipal bonds is ubiquitous in the published literature on municipal bonds over the prior 30 years. See Dwek (2002) for a partial review of this literature.
A Long Ratio is the ratio of a municipal bond yield to the yield of a taxable security – either a Treasury security or a LIBOR swap of the same maturity. The ratio is identified by the maturity of
Table 2: Stylized Leveraged Municipal Bond Arbitrage Leveraging up the difference in term spreads illustrated in Table 2 generates a 5.90% annualized return.
Municipal Market Initial Value
Annual Return
Value After 10 Years
Buy long-term bonds $100.00 4.12%1 $149.74 (4.47% gross) Issue notes $(90.00) 3.60% $(128.19) Treasury Market Short sell long-term bonds $(65.00) 5.43% $(110.29) Buy notes $65.00 5.06% $106.48 Net Asset Value $10.00 5.90% $17.75
1Includes 0.35% annual fee on acquisition cost of long municipal bonds
Table 1: Stylized Difference in Term Spreads on August 31, 2007 20-year municipal bonds yield .87% more than 1-year municipal bonds. This .87% term spread is more than the .24% difference in the after tax rates on 20-year and 1-year LIBOR swaps.
Yield Term Spread
20-year AAA-rated municipal bond 4.47% 1-year AAA-rated municipal note 3.60%. 0.87%
After tax 20-year swap rate 3.53% After tax 1-year swap rate 3.29% 0.24%
Difference in Term Spreads 0.63%
Geng Deng and Craig McCann Leveraged Municipal Bond Arbitrage: What Went Wrong?
7
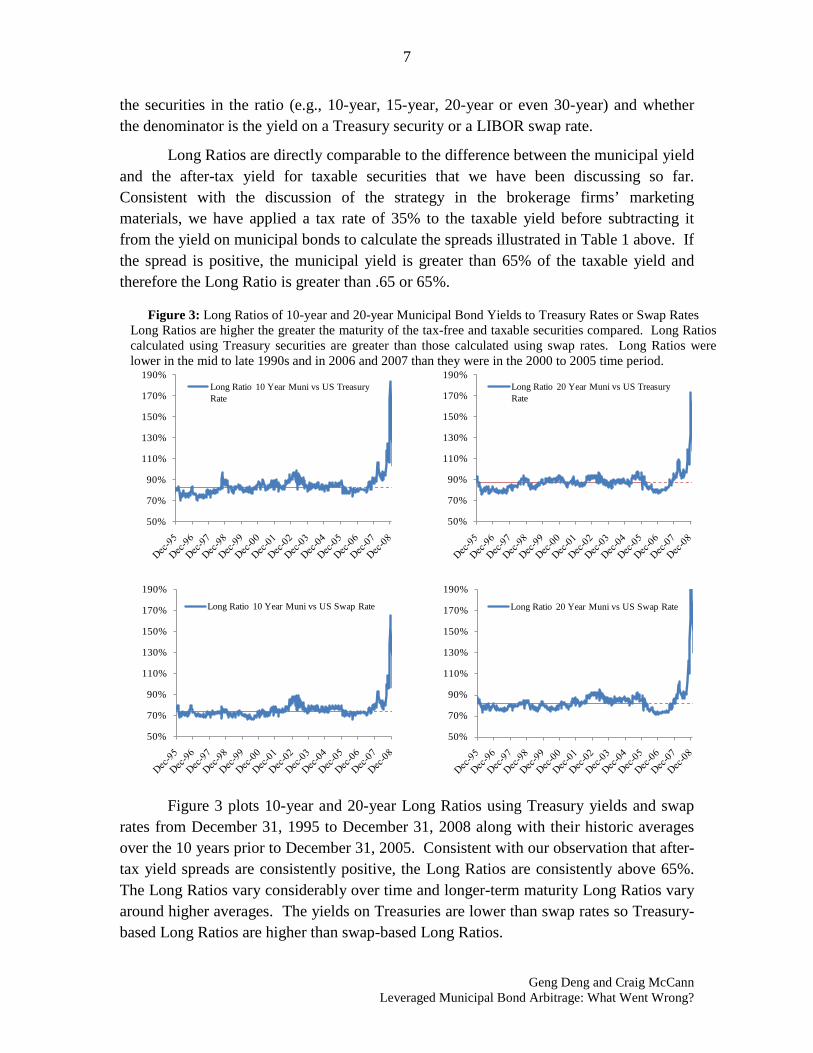
the securities in the ratio (e.g., 10-year, 15-year, 20-year or even 30-year) and whether the denominator is the yield on a Treasury security or a LIBOR swap rate.
Long Ratios are directly comparable to the difference between the municipal yield and the after-tax yield for taxable securities that we have been discussing so far. Consistent with the discussion of the strategy in the brokerage firms’ marketing materials, we have applied a tax rate of 35% to the taxable yield before subtracting it from the yield on municipal bonds to calculate the spreads illustrated in Table 1 above. If the spread is positive, the municipal yield is greater than 65% of the taxable yield and therefore the Long Ratio is greater than .65 or 65%.
Figure 3 plots 10-year and 20-year Long Ratios using Treasury yields and swap
rates from December 31, 1995 to December 31, 2008 along with their historic averages over the 10 years prior to December 31, 2005. Consistent with our observation that after-tax yield spreads are consistently positive, the Long Ratios are consistently above 65%. The Long Ratios vary considerably over time and longer-term maturity Long Ratios vary around higher averages. The yields on Treasuries are lower than swap rates so Treasury-based Long Ratios are higher than swap-based Long Ratios.
Figure 3: Long Ratios of 10-year and 20-year Municipal Bond Yields to Treasury Rates or Swap Rates Long Ratios are higher the greater the maturity of the tax-free and taxable securities compared. Long Ratios calculated using Treasury securities are greater than those calculated using swap rates. Long Ratios were lower in the mid to late 1990s and in 2006 and 2007 than they were in the 2000 to 2005 time period.
50%
70%
90%
110%
130%
150%
170%
190%Long Ratio 10 Year Muni vs US Treasury Rate
50%
70%
90%
110%
130%
150%
170%
190%Long Ratio 20 Year Muni vs US Treasury Rate
50%
70%
90%
110%
130%
150%
170%
190%
Long Ratio 10 Year Muni vs US Swap Rate
50%
70%
90%
110%
130%
150%
170%
190%
Long Ratio 20 Year Muni vs US Swap Rate

Securities Litigation and Consulting Group, Inc. © 2011.
8
III. The Leveraged Municipal Strategy as Implemented i. Long-term Municipal Bonds Are Bought With Short-term Debt
At initiation of the strategy a fund manager invests contributed capital in high-quality assets pledged as collateral to a dealer who forms a trust and issues two classes of securities: senior short-term floating-rate notes, known as variable-rate demand obligations (VRDOs), and junior notes called residual certificates. The proceeds from the sale of the short-term notes are used to purchase additional long-term municipal bonds thus leveraging the residual certificate holders’ exposure to the long-term municipal bonds held in the trust.10
The interest rate paid by the trust on the short-term notes is reset weekly and is equal to the short-term municipal yield benchmark rate less a market-determined spread. The short-term notes also include a put option, which allows the holders of the notes to sell their bonds back to the trust at par on any reset date. The hedge funds retains the junior residual certificates and pays an interest rate equal to the difference between the interest rate on the underlying long-term municipal bonds and the interest paid to the short-term, senior note holders, less the trust’s expenses.
11
ii. The Leveraged Strategy Was Imperfectly Hedged With Interest Rate Swaps
Once the portfolio manager has leveraged up the investors’ capital by financing it with short-term debt, the fund is exposed to tremendous interest rate risk. This is the classic Savings & Loan problem: borrowing short-term at variable rates to fund long-term, fixed-rate investments. If long-term municipal bond yields increase, the value of the municipal bonds held will fall and the fund will become insolvent. Moreover, if short-term borrowing costs increase, the net interest received will decline or even become negative.
Hedge funds used interest-rate swaps to hedge both the long-term and short-term interest-rate risk. Since the hedge fund has financed an investment in long-term, fixed-rate bonds with a series of short-term floating-rate notes, it enters into a swap agreeing to pay a fixed interest rate in exchange for receiving floating-rate cash flows.12
Ideally, the hedge fund would pay a fixed rate that is slightly less than (but perfectly correlated with) the yield it receives on the municipal bond portfolio and would receive a floating interest rate that is slightly higher than (but perfectly correlated with) the interest rate paid on the floating rate notes sold to the money market funds for a term
10 The dealer is typically a large investment bank like Citigroup, JP Morgan or Morgan Stanley. 11 In some instances, hedge funds purchase residual certificates from Tender Option Bond programs in which the hedge funds do not own the underlying collateral. 12 The fixed rate is typically the 20-year swap rate or a percentage of the 20-year swap rate and the floating-rate cash flow is usually 3-month LIBOR, some percentage of 3-month LIBOR, or the BMA swap rate. The BMA swap rate is the Securities Industry and Financial Markets Association swap index, which is a 7-day high-grade market index comprised of tax-exempt VRDOs compiled by Municipal Market Data.

Geng Deng and Craig McCann Leveraged Municipal Bond Arbitrage: What Went Wrong?
9
equal to the average maturity of the municipal bonds held. If the hedge fund could enter into such an idealized swap it would be very close to a true arbitrage opportunity; the hedge fund would receive positive net cash flows and any change in the market value of the leveraged municipal bond portfolio would be exactly offset by changes in the mark-to-market value of the interest rate swap.
iii. The Leveraged Strategy Was Extremely Sensitive to Yield Changes The use of leverage in the strategy made the NAV extremely sensitive to changes
in the difference between municipal bond yields and after-tax swap rates. For example, if the duration of the underlying bond portfolio is 10 years and the portfolios is leveraged 10-to-1, an increase of 0.50% in the difference between the long-term municipal bond yields and the swap rates would cause the NAV to drop by 50%. Swap contracts were a useful hedge for the interest rate risk arising out of the funding mismatch in the leveraged municipal bond portfolio if and only if changes in LIBOR were highly correlated with changes in borrowing costs and swap rates were highly correlated with long-term municipal bond yields. Historically, swap rates and municipal bond yields have been correlated, but the correlation was not nearly perfect and there were periods of time when changes in yields on municipal bonds would deviate significantly from changes in swap rates used to hedge the NAV of the leveraged municipal bond portfolios.
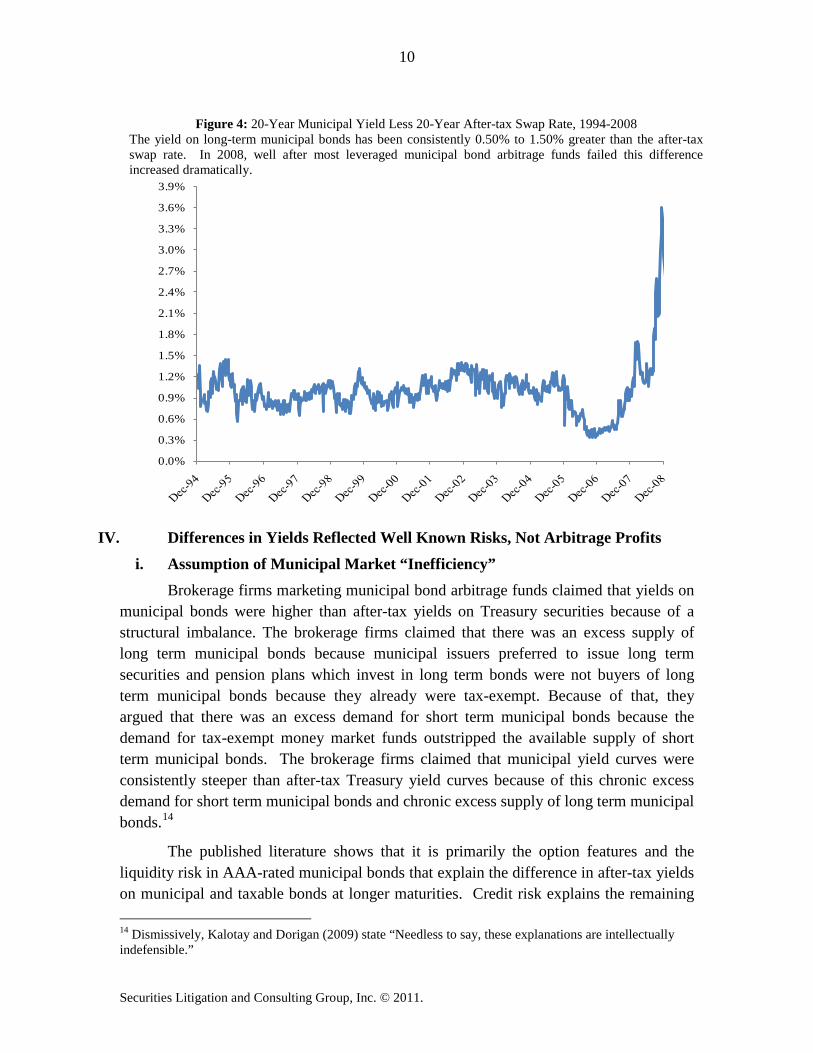
Figure 4 plots the difference between the yield on the 20-year municipal bonds and the after-tax 20-year swap rates from 1994 to 2008.13
Leveraged municipal bond funds’ NAVs dropped significantly in 2007 as the yield spreads plotted in Figure 4 increased. The sharp increase in differences in yields at the end of Figure 4 occurred in 2008 after the leveraged municipal bond funds had effectively collapsed.
If the difference increases, the value of the long municipal bond portfolio falls relative to the mark-to-market value of the swap contract and the hedge fund’s NAV declines. If the spread plotted in Figure 4 decreases, the value of the long municipal bond portfolio increases relative to the mark-to-market value of the swap contract and the hedge fund’s NAV increases.
13 Source: Bloomberg, USSW20 and MMBAAAA2 indices.
Securities Litigation and Consulting Group, Inc. © 2011.
10
IV. Differences in Yields Reflected Well Known Risks, Not Arbitrage Profits i. Assumption of Municipal Market “Inefficiency”
Brokerage firms marketing municipal bond arbitrage funds claimed that yields on municipal bonds were higher than after-tax yields on Treasury securities because of a structural imbalance. The brokerage firms claimed that there was an excess supply of long term municipal bonds because municipal issuers preferred to issue long term securities and pension plans which invest in long term bonds were not buyers of long term municipal bonds because they already were tax-exempt. Because of that, they argued that there was an excess demand for short term municipal bonds because the demand for tax-exempt money market funds outstripped the available supply of short term municipal bonds. The brokerage firms claimed that municipal yield curves were consistently steeper than after-tax Treasury yield curves because of this chronic excess demand for short term municipal bonds and chronic excess supply of long term municipal bonds.14
The published literature shows that it is primarily the option features and the liquidity risk in AAA-rated municipal bonds that explain the difference in after-tax yields on municipal and taxable bonds at longer maturities. Credit risk explains the remaining
14 Dismissively, Kalotay and Dorigan (2009) state “Needless to say, these explanations are intellectually indefensible.”
Figure 4: 20-Year Municipal Yield Less 20-Year After-tax Swap Rate, 1994-2008 The yield on long-term municipal bonds has been consistently 0.50% to 1.50% greater than the after-tax swap rate. In 2008, well after most leveraged municipal bond arbitrage funds failed this difference increased dramatically.
0.0%
0.3%
0.6%
0.9%
1.2%
1.5%
1.8%
2.1%
2.4%
2.7%
3.0%
3.3%
3.6%
3.9%

Geng Deng and Craig McCann Leveraged Municipal Bond Arbitrage: What Went Wrong?
11
difference in yields, especially for lower quality bonds.15
ii. Embedded Options
Thus, extensive published literature predating the marketing of the leveraged municipal bond funds demonstrated that there was no arbitrage opportunity. The pre-existing literature clearly established that leveraged municipal bond funds were merely a highly leveraged bet on call option, liquidity and credit risk.
Most long-term municipal bonds are callable at or slightly above par after 10 years; swaps and Treasury securities are not callable.16
Put more precisely, the embedded option in a callable bond is a liability of the investor and an asset of the issuer. This reduces the value of the bond below what it would be if it were a non-callable bond with the same coupon and stated maturity from the same issuer.
Yields to maturity on bonds with embedded options, such as callable municipal bonds, cannot be directly compared to yields on option-free bonds because the bonds will be redeemed or “called” before maturity if the municipal issuer can refinance the bonds at lower interest rates once the bonds become callable. The issuer’s right to call the bond makes the bond less valuable to investors than an otherwise equivalent bond that can’t be called away at the discretion of the issuer. The lower price on the callable bond compared to the otherwise identical non-callable bond is reflected in the higher stated yield to maturity on the callable bond. This higher yield to maturity on the callable bond though is a mirage since there is a good chance the bond will not exist to maturity.
Brokerage firms ignored the embedded options in municipal bonds in their marketing materials despite more than 30 years’ of published research explaining the need to account for embedded options when comparing yields on securities.
The embedded call option in municipal bonds has been discussed in the literature for more than 30 years. For example, Hendershott and Kidwell (1978) show that the call provision on long-term municipal bonds issues of Indiana State significantly explains the yield spread of municipal bonds over US Treasury index. Kidwell and Koch (1982) use a dummy variable to control for the call provision in general obligation bonds and finds that the required yield is higher if a bond issue has a call provision. Yawitz and Marshall (1981) measure the effect of a call option on corporate bond yield spread over non-callable US Treasuries for long-term bonds that have 5-year call provisions and find that
15 Wang, Wu, and Zhang (2008) develop a model to explain the yield difference between municipal bonds and Treasury bonds using default risk and liquidity risk and found that the tax rates implied in their model are very close to the marginal statutory tax rate of high-income individuals and corporations after controlling for default and liquidity risk. They also control for the cost of embedded call options by using yield data from only non-callable municipal bonds. 16 According to SIFMA, 90% of the municipal bonds issued in 2006 and 2007 were callable. http://www.sifma.org/research/pdf/Municipal_Callable_NonCallable.pdf

Securities Litigation and Consulting Group, Inc. © 2011.
12
embedded call options have a significant positive impact on the yield spread between callable corporate and non-callable government bonds.
Yawitz, Maloney, and Ederington (1985) state the issue plainly,
“Since the call provision reduces the price of a bond to which it is attached, the yield on a callable municipal bond will be higher than the yield on an otherwise identical, noncallable bond. …… Differences in callability and marketability between government and municipal bonds would have the effect of increasing observed municipal bond yields relative to Treasury yields.”
The 1970s and early 1980s literature demonstrated that call options in municipal bonds led to an overstatement of the difference between tax-exempt municipal bond yields and taxable US Treasury yields. The later literature on the municipal bond “puzzle” controlled for the municipal bonds’ call provisions by studying non-callable municipal bonds. For example, Kochin and Parks (1988) find study high-grade general obligation municipal bonds that are not callable. Green (1993) develops a theoretical model that accounts for callability. Chalmers (1998, 2006) uses pre-refunded municipal bonds in order to eliminate the embedded call risk because when the bonds are pre-refunded, embedded options are extinguished at the refunding date. The pre-refunded bonds are also effectively default-free since they are secured by the US Treasury securities. Wang, Wu and Zhang (2008) exclude callable municipal bonds from the data set they used to explain the difference between after-tax yields on municipal bonds and Treasury securities.
There is a well developed set of analytical tools to calculate option-adjusted spreads or option-adjusted yields on callable bonds to make them comparable to option-free bonds. See Gurwitz, Knez and Wadhwani (1992) and Kalotay, Williams and Fabozzi (1993). The difference between the yield to maturity on a callable bond and on an otherwise identical but non-callable bond depends on four primary factors: 1) the call price – typically par for municipal bonds, 2) the schedule of dates on which the bond can be called, 3) the current term structure of interest rates for similar non-callable bonds, and 4) the volatility of interest rates. Adjusting the yield to maturity on municipal bonds for the value of the embedded call option flattens the municipal yield curve and eliminates a great deal of the difference in after-tax yields which the brokerage firms claimed reflected an arbitrage opportunity.17
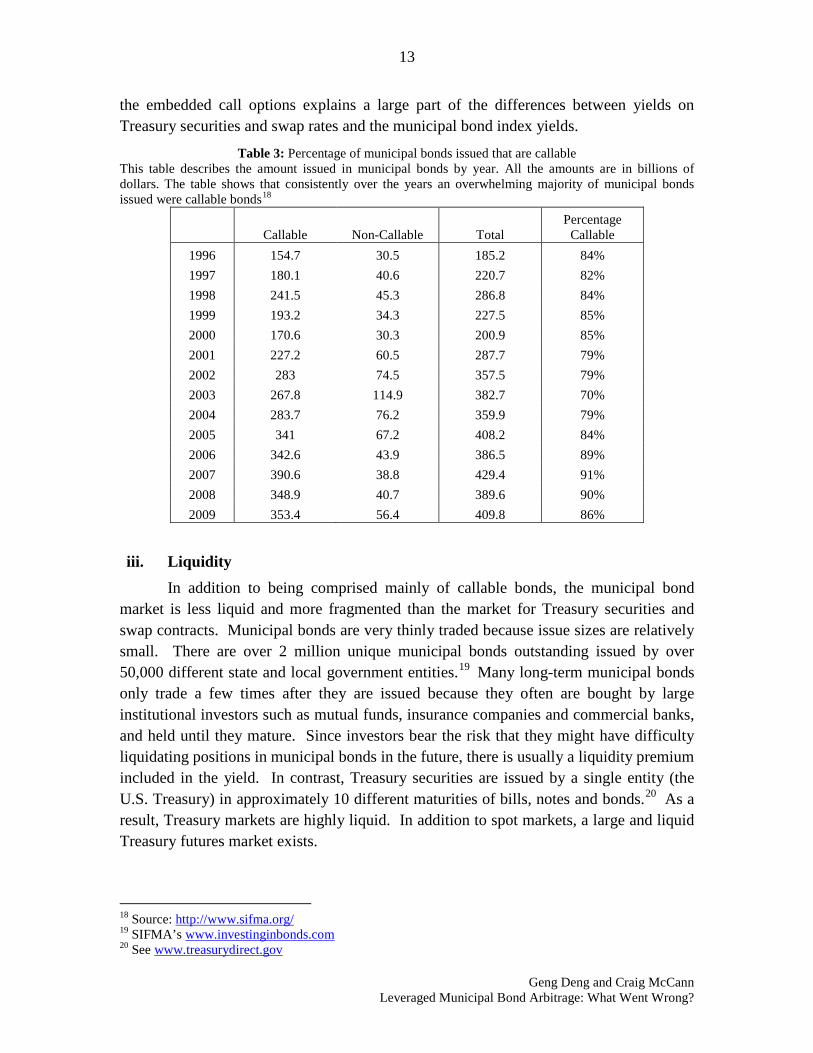
Table 3 shows the amount of municipal bonds issued in billions of dollars over the past 15 years. Persistently, more than 70% and at times more than 90% of all these issuances were callable bonds. Published indexes are based on mostly callable bonds, and
17 See Kalotay and Dorigan (2009).
Geng Deng and Craig McCann Leveraged Municipal Bond Arbitrage: What Went Wrong?
13
the embedded call options explains a large part of the differences between yields on Treasury securities and swap rates and the municipal bond index yields.
Table 3: Percentage of municipal bonds issued that are callable This table describes the amount issued in municipal bonds by year. All the amounts are in billions of dollars. The table shows that consistently over the years an overwhelming majority of municipal bonds issued were callable bonds18
Callable Non-Callable Total Percentage
Callable 1996 154.7 30.5 185.2 84% 1997 180.1 40.6 220.7 82% 1998 241.5 45.3 286.8 84% 1999 193.2 34.3 227.5 85% 2000 170.6 30.3 200.9 85% 2001 227.2 60.5 287.7 79% 2002 283 74.5 357.5 79% 2003 267.8 114.9 382.7 70% 2004 283.7 76.2 359.9 79% 2005 341 67.2 408.2 84% 2006 342.6 43.9 386.5 89% 2007 390.6 38.8 429.4 91% 2008 348.9 40.7 389.6 90% 2009 353.4 56.4 409.8 86%
iii. Liquidity In addition to being comprised mainly of callable bonds, the municipal bond
market is less liquid and more fragmented than the market for Treasury securities and swap contracts. Municipal bonds are very thinly traded because issue sizes are relatively small. There are over 2 million unique municipal bonds outstanding issued by over 50,000 different state and local government entities.19 Many long-term municipal bonds only trade a few times after they are issued because they often are bought by large institutional investors such as mutual funds, insurance companies and commercial banks, and held until they mature. Since investors bear the risk that they might have difficulty liquidating positions in municipal bonds in the future, there is usually a liquidity premium included in the yield. In contrast, Treasury securities are issued by a single entity (the U.S. Treasury) in approximately 10 different maturities of bills, notes and bonds.20
18 Source:
As a result, Treasury markets are highly liquid. In addition to spot markets, a large and liquid Treasury futures market exists.
http://www.sifma.org/ 19 SIFMA’s www.investinginbonds.com 20 See www.treasurydirect.gov

Securities Litigation and Consulting Group, Inc. © 2011.
14
Published literature has documented that liquidity risk is priced into corporate and municipal bond yields. For example, De Jong and Driessen (2005) show that the liquidity risk premium is around 45 basis points for long-term investment grade corporate bonds and 100 basis points for lower grade bonds. Perraudin and Taylor (2003) find that liquidity premiums account for a significant portion in dollar-denominated Eurobond spreads. Jacoby, Theocharides and Zheng (2007) show that the most illiquid corporate bond portfolio has a yield spread over US Treasuries that is 54 basis points higher than the yield spread of most liquid bond portfolio for AAA-rated bonds, at 5-year average maturity. Chen, Lesmond and Wei (2007) confirm the significant relationship between corporate bond yield spread and liquidity risk using several different liquidity measures in the literature.
Municipal bonds are even less liquid than corporate bonds. Investors require a high risk premium for holding municipal bonds rather than US Treasury securities of the same maturity term to compensate them for this increased liquidity risk. Wang, Wu and Zhang (2008) find that on average between July 2000 and June 2004 the liquidity risk premium accounts for 67 basis points of the yield to maturity on 20-year AAA-rated non-callable municipal bonds. Wang Wu and Zhang (2008) found liquidity risk effectively explains all the difference in after tax yields on high-quality municipal bonds and Treasury securities after controlling for embedded options.21
iv. Build America Bonds
Another example of the impact of liquidity on municipal bond yield can be seen in Build America Bonds (BABs). Build America Bonds were created by the American Recovery and Reinvestment Act that U.S. President Barack Obama signed into law on February 17, 2009. BABs are taxable municipal bonds where the issuer receives a subsidy from the federal government. Their purpose is to open municipal bonds to the tax-exempt market such as pension funds. Ang, Bhansali and Xing (2010a) analyze this market. Ang, Bhansali and Xing (2010b) show that BABs have a yield that is 54bp lower than equivalent tax-free municipal bonds. They argue that the reason could be that “Enhanced liquidity of BABs relative to regular municipal bonds would make BABs less risky and hence holders of BABs require lower yields compared to municipal bonds”.
21 Municipal bonds are not risk-free and therefore municipal issuers must pay higher yields than the after-tax Treasury rate. How large the credit risk premium is a function of the credit quality of the issuer, any supplemental credit insurance provided by private bond insurance companies and the term to maturity of the bonds. Many of the same companies that insured municipal bonds also insured subprime mortgage backed securities. In 2007 and 2008, ratings companies downgraded several bond insurance companies due to concerns about the potential impact of subprime related defaults on their capital and the prices of municipal bonds dropped as a result.

Geng Deng and Craig McCann Leveraged Municipal Bond Arbitrage: What Went Wrong?
15
v. Analysis of an Apparent Example Arbitrage Opportunity We conducted a simple empirical test to determine whether the spread between
stated municipal yields to maturity and after-tax Treasury yields from January 2005 through March 2008 could be explained by embedded call options and liquidity risk premium consistent with the prior 30 years of published literature. We first selected all U.S. AAA municipal bonds issued from January 2000 to January 2007 maturing between 2030 and 2040 available on Bloomberg. From those 900 bonds, we selected 50 bonds to create a portfolio that mimicked the MMAI index in 2005, another portfolio of 50 bonds that mimicked the MMAI index in 2006 and a third portfolio for 2007 and early 2008. For each month, we applied Bloomberg’s callable bond valuation analytic “OAS1” to calculate the option-adjusted spread for each bond in the three 50-bond portfolios using the implied volatility from LIBOR caps.
Figure 5 plots the stated yield to maturity and the option-adjusted yield for the 50-municipal bond portfolios and the after-tax yield on Treasury securities with the same maturity at each month-end from January 31, 2005 to March 31, 2008.
Yields to maturity on our 50-bond portfolios between January 31, 2005 and
March 31, 2008 averaged 4.58% and ranged from a low of 4.36% on February 28, 2007
Figure 5: Embedded Call Options in Municipal Bonds 2005-2008 Stated yields on our 50-bond portfolio increased from 4.36% on February 28, 2007 to 4.98% on March 31, 2008. As of February 28, 2007 the embedded call options accounted for 0.58% of the 1.27% difference between municipal yields and the after-tax yields on Treasury securities. As municipal yields increased and became more volatile, the portion of the difference in yields that was compensation for the embedded call options declined.
0%
1%
2%
3%
4%
5%
6%
Yie
lds
Date
Stated Yield to Maturity on callable municipal bonds
Option Adjusted Yield on Municipal Bonds
After Tax Yield to Maturity on Matched Treasury Securities

Securities Litigation and Consulting Group, Inc. © 2011.
16
to 4.98% on March 31, 2008. Between January 31, 2005 and April 30, 2007 the embedded call options accounted for 63.3 basis points of the 147.6 basis point average difference between municipal yields and the after-tax yields on Treasury securities. Thus roughly 43% of the difference in yields brokerage firms claimed was an arbitrage opportunity during this period was simply the brokerage firms’ overstatement of the comparable yields on municipal bonds.22
Figure 6: Embedded Call Options and Liquidity Risk Premium Explain the Difference in Yields
The remaining difference between the option-adjusted yield on municipal bonds and the after-tax yield on Treasury securities averaged 84.3 basis points.
Between January 2005 and April 2007 the naïve difference in yields averaged 147.6 basis points. 63.3 basis points of this difference is compensation for embedded options leaving 84.3 basis points to be explained by liquidity premium and credit risk. The average liquidity risk premium during 2000-2004 was 74.7 basis points. The small remaining difference in yields closely tracks the pattern of credit default swap premiums on mono-line insurance carriers.
Figure 6 plots the naïve difference between municipal bond yields and the after-
tax Treasury yields marketed as an arbitrage opportunity along with the required adjustment for embedded options and the liquidity risk premium for our three 50-bond portfolios based on Wang, Wu and Zhang (2008). Our average estimated liquidity risk premium for January 2005 through April 30, 2007 is 74.7 basis points. From January 2005 to April 2007 option costs and average liquidity risk explain 138 basis points of the 147.6 basis points the brokerage firms marketed as an arbitrage opportunity. Thus 22 As municipal yields increased and became more volatile in 2007, the portion of the difference in yields that was compensation for the embedded call options declined. The increase in volatility of interest rates tended to increase the cost of the embedded short call options but increasing municipal yields made it less likely that the bonds would be called. These two opposing effects tended to offset each other, with the effect of the higher yields dominating toward the end of the period.
0.0%
0.5%
1.0%
1.5%
2.0%
2.5%
Yie
lds
Date
Naïve Yield Spread
Liquidity Risk Plus Option Adjustment

Geng Deng and Craig McCann Leveraged Municipal Bond Arbitrage: What Went Wrong?
17
effectively all the claimed arbitrage opportunity resulting is an overstatement of the yields on the municipal bonds and as compensation for liquidity risk.23
V. The Leveraged Municipal Arbitrage Strategy Was Much Riskier Than Municipal Bond Portfolios
Many brokerage firms marketed leveraged municipal arbitrage strategies as high-yielding alternatives to conventional municipal bond portfolios. However, using historical market data, we show that not only was the leveraged municipal arbitrage strategy more volatile than municipal bond portfolios, it was sometimes more risky than an investment in the stock market. The leveraged municipal arbitrage strategy did not suddenly become more risky than the stock market or a municipal bond fund as a result of the subprime mortgage crisis. It had been more risky than these alternatives prior to the crisis – during a period when the strategy was being heavily marketed as low risk.
To estimate the volatility of the leveraged municipal strategy, we confine our attention to the difference between the 20-year municipal bond yield and the 20-year after-tax swap rate as this spread is the primary driver of the strategy’s returns. For each month from December 1997 through December 2007, we used weekly data from the previous three years to estimate the spread volatility (standard deviation) over the following year.
Since fixed-income spreads are mean reverting, 24
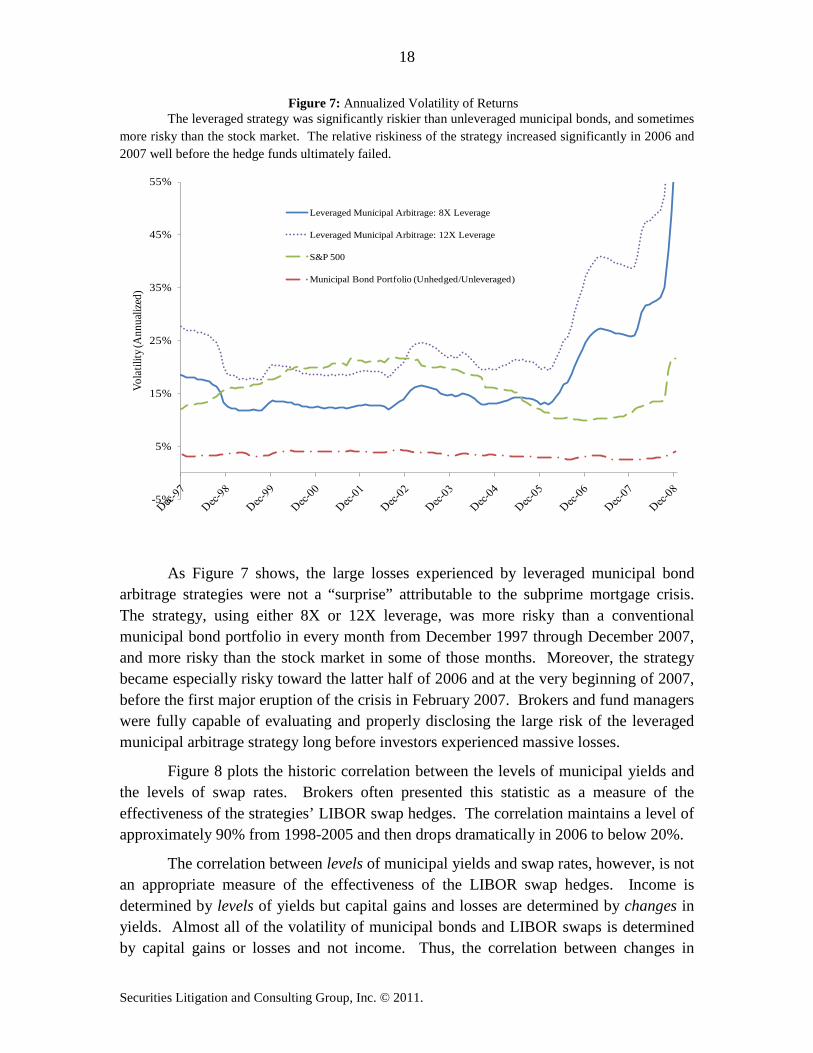
Figure 7 illustrates the results of our analysis. Each point on the graph represents the forecasted one-year volatility at a given point in time. For example, the volatility estimate for the leveraged municipal bond strategy (with 8X leverage) in January 2004 is 14.4%. This means that using weekly spread data from the three years prior to January 2004, the return volatility over the following 12 months was projected to be 14.4%. Only data available prior to each volatility forecast is used to make the forecast and so brokerage firms could have made the same forecasts at the beginning of each month shown on the graph.
autoregressive time series models are used to forecast spread volatility. The resulting spread volatility is converted to a return volatility using a duration estimate and an assumed leverage ratio. We also estimated the volatility of an unleveraged and unhedged portfolio of 20-year municipal bonds using an autoregressive time series model to adjust for mean reversion. The volatility of the S&P 500 is calculated assuming the index follows a random walk.
23 Credit default swap premiums on mono-line insurance carriers were higher in 2005 and in late 2007 and early 2008. As the perceived credit quality of the companies who had rented their creditworthiness to the municipal issuers declined, yields on these bonds began to reflect compensation for credit risk. 24 The mean-reverting properties of fixed income spreads are well documented. See, for example, Joseph R. Prendergast (2000). Also, see Angelo Arvanitis, J. Gregory, and J. Laurent (1999).
Securities Litigation and Consulting Group, Inc. © 2011.
18
Figure 7: Annualized Volatility of Returns The leveraged strategy was significantly riskier than unleveraged municipal bonds, and sometimes
more risky than the stock market. The relative riskiness of the strategy increased significantly in 2006 and 2007 well before the hedge funds ultimately failed.
As Figure 7 shows, the large losses experienced by leveraged municipal bond
arbitrage strategies were not a “surprise” attributable to the subprime mortgage crisis. The strategy, using either 8X or 12X leverage, was more risky than a conventional municipal bond portfolio in every month from December 1997 through December 2007, and more risky than the stock market in some of those months. Moreover, the strategy became especially risky toward the latter half of 2006 and at the very beginning of 2007, before the first major eruption of the crisis in February 2007. Brokers and fund managers were fully capable of evaluating and properly disclosing the large risk of the leveraged municipal arbitrage strategy long before investors experienced massive losses.
Figure 8 plots the historic correlation between the levels of municipal yields and the levels of swap rates. Brokers often presented this statistic as a measure of the effectiveness of the strategies’ LIBOR swap hedges. The correlation maintains a level of approximately 90% from 1998-2005 and then drops dramatically in 2006 to below 20%.
The correlation between levels of municipal yields and swap rates, however, is not an appropriate measure of the effectiveness of the LIBOR swap hedges. Income is determined by levels of yields but capital gains and losses are determined by changes in yields. Almost all of the volatility of municipal bonds and LIBOR swaps is determined by capital gains or losses and not income. Thus, the correlation between changes in
-5%
5%
15%
25%
35%
45%
55%
Vola
tility
(Ann
ualiz
ed)
Leveraged Municipal Arbitrage: 8X Leverage
Leveraged Municipal Arbitrage: 12X Leverage
S&P 500
Municipal Bond Portfolio (Unhedged/Unleveraged)

Geng Deng and Craig McCann Leveraged Municipal Bond Arbitrage: What Went Wrong?
19
municipal yields and changes in swap rates is the correct measure of the effectiveness of the LIBOR hedge – not the correlation between levels of municipal yields and levels of swap rates.
Figure 8: Correlation Between Levels of 20-Year Muni Yields and 20-Year Swap Rates 1994-2008 Brokers often used this correlation to represent the effectiveness of the leveraged municipal arbitrage bond strategies’ LIBOR swap hedges even though correlation between changes in 20-year municipal
yields and changes in 20-year swap rates is the correct measure.
Accordingly, Figure 9 plots the correlation between weekly changes in 20-year
municipal yields and weekly changes in 20-year LIBOR swap rates.25
25 Source Bloomberg MMBAAAA2, MUNIPSA, USSW20 and US0003M Indices.
As in Figure 8, the correlation dropped sharply in 2006. However, comparing Figure 9 to Figure 8 shows that analyzing yield changes results in much lower correlations overall than analyzing yield levels. Correlations based on yield levels often exceeded 90% while those based on yield changes did not exceed 50% and were substantially lower for much of the period examined. In the late 1990s, the correlations based on yield changes were sometimes even negative. Funds or brokers that represented the effectiveness of hedging strategies using correlations based on levels of yields substantially overstated the effectiveness of the LIBOR hedges.
-80%
-60%
-40%
-20%
0%
20%
40%
60%
80%
100%

Securities Litigation and Consulting Group, Inc. © 2011.
20
VI. Unusual Fees and Leverage Definitions Created Poor Incentives
i. Typical Hedge Fund Fees are “2 + 20” Hedge funds charge two types of fees: 1) base management fees which are
typically defined as a specified percentage of a fund’s Net Asset Value (NAV) and 2) performance fees or incentive fees which are specified as a percentage of a fund’s net profits. A typical fee structure is a 2% base management fee and a 20% performance fee, leading to the common shorthand expression “2 + 20.” 26
Many funds use “high water mark” provisions which tie a fund’s performance fees to its past history, by restricting the application of these fees to profits in excess of the funds highest NAV previously used to calculate a performance fee. Thus, fund managers are only allowed to charge the performance fee after previous losses have been recouped. To illustrate, if a fund’s NAV drops from $90 to $70 in year 1 and then rises to $100 in year 2, the year 2 performance fees (per share) will be 20% of only $10, not of $30. Many funds also specify hurdle rates for purposes of performance fee calculations.
26 Mark Hulbert, “2 + 20, and Other Hedge Fund Math,” New York Times, March 4, 2007.
Figure 9: Correlation Between Weekly Changes in 20-year Municipal Bond Yields and Changes in 20-Year Swap Rates. The leveraged funds’ hedge effectiveness and therefore their risk depended primarily on the correlation of changes in municipal bonds yields with changes in LIBOR swap rates. True arbitrage implies a correlation of 1.0. The correlation was always much less than 1.0 and was sometimes even negative.
-20%
0%
20%
40%
60%
80%
100%

Geng Deng and Craig McCann Leveraged Municipal Bond Arbitrage: What Went Wrong?
21
To illustrate, if the hurdle rate is 5.5%, the fund manager will only earn performance fees on profits (net of base management fees) in excess of 5.5%.27
ii. Traditional Hedge Fund Fees Make Investors’ Returns Asymmetric and Create Managerial Incentives to Take Excessive Risk
In one sense, both pieces of the “2 + 20” fee structure align managers’ interests with those of their investors: The base fee is large when the fund’s NAV is high and the performance fee is large when the fund is highly profitable. The performance fee however creates a conflict between fund managers and their investors because fund managers only participate in gains whereas investors participate in losses as well as gains. Effectively, the investor is forced to provide a free call option to the fund manager: the option has a positive payoff to the hedge fund manager when the fund has significant positive profits and it expires worthless when the fund has only modest profits or suffers losses. As with any option, the performance fee option is more valuable when the underlying asset (in this case the hedge fund’s portfolio) is more volatile. Thus, the fund manager is encouraged by the performance fees to make risky portfolio choices which are harmful to investors.
iii. Leveraged Municipal Bond Fees Were Extraordinary and Created Incentives Which Help Explain the Lack of Risk Management The leveraged municipal bond arbitrage funds assessed both base management
fees and performance fees. In contrast to the typical fee structure outlined above where the base management fee was a percentage of a fund’s NAV, the base management fee for leveraged municipal bond arbitrage funds was a percentage of the face value of the long municipal bond portfolio – typically 0.25% to 0.35%.28
iv. Economic Leverage
Thus, for a portfolio with 10-1 economic leverage, the management fee would initially be 2.5% to 3.5% of NAV. The municipal arbitrage funds’ atypical management fee structure encouraged fund managers to leverage up their portfolios more rapidly and to maintain the size of their portfolios in the face of falling market values longer than was prudent, because higher book value leverage resulted in higher base fees even if it lowered NAV.
Economic leverage is the market value of an account’s or portfolio’s assets divided by the market value of its equity. This is the concept of leverage usually employed in investment management – and for good reason. Economic leverage gauges how close a leveraged portfolio is to being unable to pay off its debts if all of its assets are liquidated at realizable prices. For example, a hedge fund that observes an economic leverage limit of 10:1 would always be able to pay off its debt by liquidating assets and
27 This is an illustration of a “hard” hurdle rate. If 5.5% were a “soft” hurdle rate, the fund would earn a fee based on all of the profits, if the profits exceed 5.5%. 28 See, for example, Rene Stulz (2007), William Goetzmann, J. Ingersoll and S. Ross (2003) and Carl Ackermann, R. McEnally and D. Ravenscraft (1999)

Securities Litigation and Consulting Group, Inc. © 2011.
22
still have at least 10% of its asset value left over as a cushion. The use of economic leverage limits imposes market discipline on a fund’s risk management process. When a fund comes close to not having enough assets to cover all of its debts, it must reduce economic leverage by either 1) selling assets to pay down debt, or 2) raising additional capital.
Many leveraged municipal bond funds’ leverage limits were expressed in terms of an accounting or book value leverage. Book value leverage divides the original purchase price of the municipal bonds by the book value of the fund’s contributed capital. A drop in the market value of the municipal bonds may cause the fund to become insolvent (i.e., to be unable to pay off its liabilities by liquidating its assets at market prices) while not impacting the book value leverage.
Consider a portfolio started with $100 million in contributed capital, $900 million in debt and a $1 billion long municipal bond portfolio. On the first day, both the economic and book leverage are 10:1. If the bonds’ prices decline by 5%, the NAV declines to $50 million, and economic leverage increases to 19:1. Traditional leverage limits would require the portfolio manager to sell some of the bonds and to use the proceeds to pay off debt in order to reduce the portfolio’s leverage back to 10:1. But since the municipal arbitrage funds defined their limits in terms of book leverage, which remains unchanged as the bonds’ prices decline and the NAV gets perilously close to $0, the portfolio manager is not required to reduce the size of the municipal bond portfolio. In fact, when these funds did become insolvent in early 2008 and were unable to meet margin calls, there was no meaningful increase in their reported leverage. Had the hedge funds applied traditional leverage limits, the funds would have been forced to sell municipal bonds to pay down debt and would probably have avoided insolvency.
VII. The Funds Appear to Have Acted Counter to Their Claimed Strategy The brokerage firms indicated that they would increase exposure to municipal
bonds when the Long Ratio was above historical averages and decrease exposure when the ratio was below historical averages. Leveraged municipal arbitrage funds appear to have doing the opposite of their advertised strategy - increasing their exposure to municipal bonds when the Long Ratio was below historical averages – or, equivalently, when spreads were narrow – in 2006 and 2007. Figure 10 plots the time series of two Long Ratios constructed from two widely used municipal bond yield indexes with 20-year maturities. Both ratios fell below their long-term means at the beginning of 2006 and continued to fall for the rest of the year. The ratios each stayed well below their historical averages until the end of 2007. During 2006 and 2007, however, leveraged municipal bond funds increased their leverage ratio or left it unchanged from 2005 and failed to reduce their municipal bond holdings.

Geng Deng and Craig McCann Leveraged Municipal Bond Arbitrage: What Went Wrong?
23
Thus, at a time when their stated strategies called for reducing exposure to municipal bonds and deleveraging, the funds appear to have been maintaining or even increasing exposure through additional leverage.
VIII. Market Conditions Which Led to Large Losses in Funds Were Not
Unprecedented or Even Unusual
Many of the brokerage firms that marketed leveraged municipal bond arbitrage funds to investors claimed that the funds’ large losses in 2007 and 2008 were the result of highly unusual market conditions - a “perfect storm” or a “once in a century event.” One way to analyze such a claim is to develop a measure of the market conditions that caused the funds’ losses and to then determine if these conditions had ever been present prior to 2007-2008.
Changes in the spread between the 20-year municipal bond yield and 20-year LIBOR swap rate are directly related to capital gains and losses in the funds. Increases in
Figure 10: Long Ratios Were Well Below Historical Averages in 2006 and 2007. Many leveraged municipal bond funds were launched between 2002 and 2005 when long ratios were above historical averages. This made the funds initially profitable since yield spreads were high and capital gains were realized. This experience was used when marketing later offerings. Funds launched in 2006 and 2007 though were offered when spreads were low suggesting low net cash flows and likely capital losses.
50%
55%
60%
65%
70%
75%
80%
85%
90%
95%
100%
MMAI Long Ratio
Average MMAI Long Ratio 2001-2007
Moody's Long Ratio
Average Moody's Long Ratio 1994-2007

Securities Litigation and Consulting Group, Inc. © 2011.
24
the spread generate losses and decreases in the spread generate gains. 29
Figure 11 illustrates that the spread increased by 1.24% from September 28, 2007 through February 29, 2008, a period during which many of these funds collapsed. The spread, however, increased by much more than 1.4% in earlier (but still recent) periods of financial distress. For example, the bond market experienced a large selloff in 1994-1995 which caused the bankruptcy of Orange County. From May 9, 1994 through December 12, 1995 the spread between the 20-year municipal bond yield and 20-year LIBOR swap rate increased by 1.97 percent: .73% more than the spread increase associated with the funds’ large losses in 2007-2008. During the 2000-2003 timeframe, technology shares dropped sharply in value, Enron declared bankruptcy and a recession ensued. From May 8, 2000 through May 22, 2003 the spread between the 20-year municipal bond yield and 20-year LIBOR swap rate increased by 1.93 percent: .69% more than the spread increase associated with the funds’ large losses in 2007-2008.
29 The 20-year long ratio is the ratio (rather than the difference) between the 20-year municipal bond yield and the 20-year LIBOR swap rate. Thus, the spread and the long ratio behave similarly. When the spread increases the long ratio increases and when the spread decreases the long ratio decreases.
Figure 11: Changes in the Spread Between the 20-Year Municipal Yield and 20-Year LIBOR Swap Rate Many Leveraged Municipal Arbitrage Bond Funds suffered large losses from September 28, 2007 through February 29, 2008. There are at least two other times in the recent past when the funds would have suffered even larger losses had they then existed.
Start Date 5/9/1994 -2.74
5/8/2000 -2.05
9/28/2007 -1.23
End Date 12/12/1995 -0.77
5/22/2003 -0.11
2/29/2008 0.01 Spread Change 1.97
1.93
1.24
-3
-2.5
-2
-1.5
-1
-0.5
0
0.5
Perc
ent

Geng Deng and Craig McCann Leveraged Municipal Bond Arbitrage: What Went Wrong?
25
Figure 11 shows that a leveraged municipal bond arbitrage fund that existed during 1994-1995 or 2000-2003 would have suffered even greater losses than these funds experienced in 2007-2008. Although broker-dealers had engaged in proprietary leveraged municipal bond arbitrage strategies prior to 2001, the first hedge fund to use this strategy was the Blue River Advantaged Muni Fund, which was not introduced until April 2001. Thus, this fund was not in existence during the first volatile time period identified in Figure 11 and existed only during the latter part of the second volatile time period. Nevertheless, as shown in Figure 12 this fund experienced significant volatility prior to July 2007; that is, prior to the time when leveraged municipal bond arbitrage funds experienced their recent large losses. Over the period from April 2001 through July 2007, the Blue River Advantaged Muni Fund experience an annual volatility of almost 21% compared to approximately 13% for the S&P 500 Index and approximately 5% for a portfolio of municipal bonds. This provides more evidence that the 2007-2008 period was not a “perfect storm” or a “once in a century event” that caused a heretofore stable strategy to experience massive volatility and large losses.
IX. Conclusion
The leveraged municipal arbitrage bond strategy has been marketed as a low-risk, high-yield alternative to municipal bonds. The strategy introduced additional risk by leveraging investments in long-term municipal bonds in an attempt to generate enough gross returns from the perceived arbitrage opportunity to cover the brokerage firms’ fees and to net a marketable return to investors.
Figure 12: Volatility of Blue River Asset Management Main Muni Fund versus the S&P 500 and municipal bonds April 2001 through July 2007
Even prior to the late 2007-early 2008 time period Leveraged Municipal Bond Arbitrage Funds were considerably more volatile than equities and unlevered municipal bond portfolios.
Blue River 20.88%
S&P 12.88%
Bond 4.82%
0%
5%
10%
15%
20%
25%

Securities Litigation and Consulting Group, Inc. © 2011.
26
Published academic research shows that the claimed market inefficiency underlying the leveraged municipal arbitrage strategy was not an inefficiency at all. The observed difference in yields is partly the result of inaptly comparing yields on callable municipal bonds to yields on non-callable taxable bonds without adjusting for the value of the embedded call options. The firms promoting this strategy did not explain in their marketing materials that a significant portion of the difference in yields the firms touted as an arbitrage opportunity was compensation for the short call option attached to most municipal bonds but absent from the taxable bonds. The remaining difference in yields is primarily explained by the well recognized liquidity risk in municipal bonds.
The municipal arbitrage strategy was dependent on hedging large, leveraged, long-term municipal bond positions with taxable interest rate swaps. The correlation between these hedges was quite low making it likely that they would fail. As long-term municipal yields increased more rapidly than the swap rates over many months, the hedging strategy in fact did fail. In February 2008, the municipal bond prices fell further and leveraged municipal bond portfolios were liquidated. Much of the losses though had occurred earlier during relatively routine interest rate environments.
Many broker-dealers have blamed the failure of the strategy in 2007 and 2008 on unprecedented market conditions. An examination of past municipal bond and LIBOR swap data shows that there were two periods in the recent past when leveraged municipal arbitrage funds would have suffered even greater losses than they did in 2007 and 2008: once during the 1994-1995 bond market selloff and the other during the 2000-2003 period when the technology equity bubble burst and the U.S. experienced a recession.
In addition to the inherent riskiness of the leveraged municipal bond arbitrage strategy, the strategy locked investors up for as long as two years even if it turned out to be riskier than the investors expected or wanted. A less complex investment would have allowed these investors to exit before the catastrophic losses occurred.

Geng Deng and Craig McCann Leveraged Municipal Bond Arbitrage: What Went Wrong?
27
Bibliography
Ackermann, Carl, R. McEnally and D. Ravenscraft, 1999, “The Performance of Hedge Funds: Risk, Return, and Incentives”, Journal of Finance, vol. 54, no. 3: 833-874.
Amin, Gaurav S. and Harry M. Kat, 2003, “Stocks, Bonds, and Hedge Funds”, Journal of Portfolio Management, vol. 29, no. 4: 113-120.
Ang, Andrew, Vineer Bhansali and Yuhang Xing, 2010a,"Taxes on Tax-Exempt Bonds", Journal of Finance, 65(2), 565-601.
Ang, Andrew, Vineer Bhansali and Yuhang Xing, 2010b, "Build America Bonds", Journal of Fixed Income, 20(1), 67-73.
Anson, Mark J.P., 2001, “Hedge fund incentive fees and the ‘free option’”, Journal of Alternative Investments, vol. 4, no. 2: 43-48.
Arvanitis, Angelo, Jonathan Gregory, and Jean-Paul Laurent, 1999, “Building Models for Credit Spreads”, Journal of Derivatives, vol. 6, no. 3: 27-43.
Beckers, Stan, Ross Curds, and Simon Weinberger, 2007, “Funds of Hedge Funds Take the Wrong Risks”, Journal of Portfolio Management, vol. 33, no. 3: 108-12.
Chacko, George, 2006, “Liquidity Risk in the Corporate Bond Markets”, working paper, Harvard Business School.
Chakravarty, Sugato and Asani Sarkar, 2003, “A Comparison of Trading Costs in the U.S. Corporate, Municipal and Treasury Bond Markets,” Journal of Fixed Income, 13, 39-48.
Chalmers, J.M.R., 1998, “Default Risk Cannot Explain the Muni-Puzzle: Evidence from Bonds that are Secured by U.S. Treasury Obligation”, The Review of Financial Studies, 11, 281-308.
Chalmers, John M.R., 2006, “Systematic Risk and the Muni Puzzle”, 2006, National Tax Journal, 54(4), 833-848.
Chen, Long, David A. Lesmond and Jason Wei, 2007, “Corporate Yield Spreads and Bond Liquidity”, Journal of Finance, 62(2): 119-149
De Jong, Frank, and Josst Driessen, 2005, “Liquidity Risk Premia in Corporate Bond Markets”, working paper, University of Amsterdam.
Downing, C. and F. Zhang, 2004, “Trading Activity and Price Volatility in the Municipal Bond Market”, Journal of Finance 59, 899-931.
Dwek, Julian, “The Municipal Puzzle: A Review of the Literature,” MIT, June 2002 http://dspace.mit.edu/bitstream/handle/1721.1/28245/50655908.pdf?sequence=1

Securities Litigation and Consulting Group, Inc. © 2011.
28
Ennis, Richard M., and Michael D. Sebastian, 2003, “A Critical Look at the Case for Hedge Funds”, Journal of Portfolio Management, vol. 29, no. 4: 103-112.
Erickson, Merle, Ausan Goolsbee, and Edward Maydew, 2003, “How Prevalent is Tax Arbitrage? Evidence from the Market for Municipal Bonds”, National Tax Journal, vol. 56, no. 1: 259-270.
Fabozzi, Frank J., 2007, “Valuing Bonds With Embedded Options, Chapter 9”, Fixed Income Analysis, Second Edition, CFA Institute Investment Books, January 2007.
Goetzmann, William N., Jonathan E. Ingersoll, and Stephen A. Ross, 2003, “High-Water Marks and Hedge Fund Management Contracts”, Journal of Finance, vol. 58, no.4: 1685-1717.
Gordon, Roger H. and Burton Malkiel, 1981.” Corporate Finance”. In: Aaron, H.J. Pechman, J.A. (Eds.), How Taxes Affect Economic Behavior. Brookings Institution, Washington, DC.
Green, Richard C. 1993, “A Simple Model of the Taxable and Tax-Exempt Yield Curves”, The Review of Financial Studies, vol. 6, no.2: 233-264.
Gurwitz, Aaron S., Peter Knez, and Suresh Wadhwani, 1992, “A Valuation Model for Embedded Options in Municipal Bonds”, Journal of Fixed Income, June 1992, 102-111.
Harris, Lawrence and Michael S. Piwowar, 2004, “Municipal Bond Liquidity”, working paper, SEC.
Hempel, George H., 1973, “An evaluation of municipal “bankruptcy” laws and procedures”, Journal of Finance, 28(5), 1339-1351.
Hendershott, Patric H., and David S. Kidwell, 1978, "The Impact of Relative Security Supplies: A Test with Data from a Regional Tax-Exempt Market." Journal of Money, Credit, and Banking (August 1978), pp. 337-347.
Houweling, Patrick, Albert Mentink, and Ton Vorst, 2004, “Comparing Possible Proxies of Corporate Bond Liquidity”, Journal of Banking and Finance, 29, 1331-1358
Hulbert, Mark, 2007, “2 + 20, and Other Hedge Fund Math,” New York Times, March 4, 2007. Jacoby, Gady, George Theocharides, and Steven X. Zheng, 2007, “Liquidity Risk in the
Corporate Bond Market”, working paper, Seton Hall University.
Jarrow, Robert A., 2002, “Modeling Fixed-Income Securities and Interest Rate Options”,2nd Edition, Stanford University Press
Kalotay, Andrew J., George O. Williams, and Frank J. Fabozzi, 1993, “A Model for Valuing Bonds and Embedded Options”, Financial Analysts Journal, May-June 1993, 35-46
Geng Deng and Craig McCann Leveraged Municipal Bond Arbitrage: What Went Wrong?
29
Kalotay, Andrew J. and Michael P. Dorigan, 2009, “What Makes the Municipal Yield Curve Rise?” Journal of Fixed Income, vol. 18, no.3: 65-71.
Kat, Harry M., 2003, “Taking the Sting out of Hedge Funds”, Journal of Wealth Management, vol. 6, no. 3: 67-76.
Kidwell, David S. and Timothy W. Koch, 1982, "The Behavior of the Interest Rate Differential Between Tax-Exempt Revenue and General Obligation Bonds: A Test of Risk Preferences and Market Segmentation." Journal of Finance, 37 (March 1982), 73-85.
Kochin, Levis A. and Richard W. Parks, 1988, “Was the Tax-Exempt Bond Market Inefficient or Were Future Expected Tax Rates Negative?”, Journal of Finance, 43, 913-931.
Kritzman, Mark and Don Rich, The Mismeasurement of Risk” Financial Analysts Journal, May/June 2002, Vol. 58, No. 3:91-99.
Liang, Bing 1999, “On the Performance of Hedge Funds”, Financial Analysts Journal, vol. 55, no. 4: 72-85.
Managed Fund Association, 2007, “Sound Practices for Hedge Fund Managers”.
Malkiel, Burton G., and Atanu Saha, 2005, “Hedge Funds: Risk and Return”, Financial Analysts Journal, 2005, vol. 61, no. 6: 80-88.
Miller, Tom, Introduction to Option-adjusted Spread Analysis, 3rd Edition. New York: Bloomberg Press, 2007.
Perraudin, William and A. Taylor, 2003, “Liquidity and Bond Market Spreads”, working paper, Bank of England.
Prendergast, Joseph R., 2000, “Predicting the 10-Year LIBOR Swap Spread: The Role and Limitations of Rich/Cheap Analysis”, Journal of Fixed Income, vol. 10, no. 3: 86-99.
Stulz, Rene ,2007, “Hedge Funds: Past, Present, and Future”, Journal of Economic Perspectives, vol. 21, no.2: 175-194.
Trzcinka, C., 1982, “The pricing of tax-exempt bonds and the Miller hypothesis” Journal of Finance 37(3), 907–923.
Wang, Junbo, Chunchi Wu, and Frank Zhang, 2008, “Liquidity, Default, Taxes and Yields on Municipal Bonds”, Journal of Banking and Finance, vol. 32, no. 6: 1133-1149.
Wu, Chunchi., 1991. “A certainty equivalent approach to municipal bond default risk estimation”, Journal of Financial Research 14, 241–247.

Securities Litigation and Consulting Group, Inc. © 2011.
30
Report of The President’s Working Group on Financial Markets, 1999, “Hedge Funds, Leverage, and the Lessons of Long-Term Capital Management”, April 1999, Department of the Treasury, Board of Governors of the Federal Reserve System, Securities and Exchange Commission, and Commodity Futures Trading Commission.
Yawitz, Jess B., Kevin J. Maloney, and Louis H. Ederington, 1985, “Taxes, Default Risk, and Yield Spreads”, Journal of Finance, September 1985, No.4, 1127-1140.
Yawitz, Jess B. and William J. Marshall, 1981, “Measuring the Effect of Callability on Bond Yields”, Journal of Money, Credit, and Banking, Vol. 13, No. 1, 60-71.