Embed Size (px)
Citation preview
BACKGROUND REPORT i
Leverage Points for Reducing Single-use Plastics
Background Research
Chris Sherrington
Chiarina Darrah
Steven Watson
Joss Winter
30th March 2017
ii 31/03/2017
Report for Seas at Risk
Prepared by Chiarina Darrah
Approved by
Chris Sherrington
(Project Director)
Eunomia Research & Consulting Ltd 37 Queen Square Bristol BS1 4QS
United Kingdom
Tel: +44 (0)117 9172250 Fax: +44 (0)8717 142942
Web: www.eunomia.co.uk
Disclaimer
Eunomia Research & Consulting has taken due care in the preparation of this report to ensure that all facts and analysis presented are as accurate as possible within the scope of the project. However no guarantee is provided in respect of the information presented, and Eunomia Research & Consulting is not responsible for decisions or actions taken on the basis of the content of this report.
Seas At Risk gratefully acknowledges EU funding support. The content of this website is the sole responsibility of Seas At Risk. It should not be regarded as reflecting the position of the Executive Agency for small and medium sized enterprises.
BACKGROUND REPORT iii
Version Control Table
Version Date Authorised by Description
V0.1 24/03/17 Chiarina Darrah
First draft (internal)
V1.0 30/03/17 Chiarina Darrah
Second draft (sent to client)
V2.0 19/05/17 Emma Priestland
Client comments
V3.0 12/07/17 Chiarina Darrah
Draft final (sent to client)
V4.0 28/07/17 Emma Priestland
Client comments
V5.0 06/09/17 Chiarina Darrah
Final version
4
Contents
1.0 Introduction .............................................................................................................. 7
2.0 Item Specific Consumption Estimates ....................................................................... 8
2.1 Methodology ....................................................................................................... 8
2.2 Plastic Bottles ...................................................................................................... 9
2.3 Coffee Cups and Lids .......................................................................................... 12
2.4 Drinking Straws .................................................................................................. 15
2.5 Other Disposable Cups ....................................................................................... 18
2.6 Coffee Stirrers .................................................................................................... 18
2.7 Takeaway Packaging .......................................................................................... 19
2.8 Cigarette Butts ................................................................................................... 21
2.9 Eurostat – Prodcom Data ................................................................................... 23
2.10 Plastic Production .............................................................................................. 26
3.0 Prevalent Plastic Items on Beaches ......................................................................... 30
3.1 Single-use plastic found as beach litter .............................................................. 30
3.2 Review of the International Coastal Clean-up data ............................................. 30
3.3 Review of Arcadis Data ...................................................................................... 34
3.4 Review of Marine Litter Watch Data .................................................................. 37
3.5 Regional Sea: North Eastern Atlantic .................................................................. 38
3.6 Regional Sea: Black Sea ...................................................................................... 40
3.7 Regional Sea: Baltic Sea...................................................................................... 40
3.8 Regional Sea: Mediterranean ............................................................................. 42
3.9 Conclusions ........................................................................................................ 43
4.0 Attitudes towards single-use plastic consumption, litter and reduction measures 44
4.1 Public Attitude towards Litter and its Prevention ............................................... 45
4.2 Cigarette Litter ................................................................................................... 50
4.3 Perceptions around measures to reduce use or increase capture of single-use items 51
4.3.1 Public Attitudes Towards Different Litter Reduction Measures.................... 51
5
4.3.2 Plastic Bag Charge and Associated Perceptions Before and After Implementation ...................................................................................................... 52
4.3.3 Public Acceptance of Deposit Return Schemes ............................................ 53
4.4 Quality of Deposit Return Scheme Materials ...................................................... 54
5.0 Legislative Leverage Points ..................................................................................... 55
5.1 Role of Green Public Procurement ..................................................................... 55
5.1.1 Green Public Procurement for Food and Catering Services .......................... 56
5.1.2 Use of Licencing Laws to Require the Use of Reusables ............................... 60
5.2 Environmental Management and Audit Scheme (EMAS) .................................... 61
5.3 Extended Producer Responsibility and Proposed Minimum Requirements......... 63
5.3.1 Implementation of Producer Responsibility in the European Union ............. 64
5.3.2 Cost-effectiveness of EPR Schemes for Packaging ....................................... 64
5.3.3 Revised Circular Economy Package ............................................................. 67
5.4 Extending the Provisions around Plastic Bags ..................................................... 70
5.5 Cutlery and Straws – Are they Packaging? .......................................................... 71
5.6 Requirement for Waste Producers to Implement the Waste Hierarchy .............. 72
5.6.1 UK Situation ............................................................................................... 72
5.6.2 Situation in other Member States ............................................................... 73
5.6.3 Conclusion .................................................................................................. 77
6.0 Best Practice Case Studies ....................................................................................... 78
6.1 “Münchner Einwegverbot” ................................................................................ 78
6.2 Copenhagen Water Fountains ............................................................................ 78
6.3 French Disposables Ban ..................................................................................... 78
6.4 The Last Straw.................................................................................................... 78
6.5 Beverage Container Deposit Refund System ...................................................... 78
6.6 ReThink Disposable ............................................................................................ 79
6.7 Bottled Water Ban ............................................................................................. 79
6.8 The Freiburg Cup................................................................................................ 79
6.9 Refill Revolution, Tennessee .............................................................................. 79
6.10 The Mobile Water Station, Illinois ...................................................................... 80
7.0 Conclusions ............................................................................................................. 80

6
7
1.0 Introduction
The poor management of plastic waste, including its intentional discard in the environment, leads to the annual emission to the sea of an estimated 54,000–145,000 tonnes of plastic from coastal land areas in EU countries.1 The European Commission has proposed a headline target of
“reducing marine litter by 30 % by 2020 for the ten most common types of litter found on beaches, as well as for fishing gear found at sea, with the list adapted to each of the four marine regions in the EU”
under the auspices of the Circular Economy Package,2 and the European Parliament have proposed a non-binding target of 30% by 2025 and 50% by 2030 (compared to a 2014 baseline).
Because of the enormous range of sources of marine litter, discussions to determine how marine litter reduction can be achieved become very broad. Given the prevalence of single-use plastic items found on beaches, and the great potential for dealing with them at source, Seas at Risk determined this issue to be a good focal point for action.
While packaging waste is addressed by the Packaging Waste Directive (94/62/EC), there is a lack of legislation that focusses on single-use items, some of which do not come under the definition of packaging. Similarly, although waste prevention does feature in the Waste Framework Directive (2008/98/EC) and the Packaging Waste Directive, because such provisions are not strong enough, there has not been sufficient movement towards tackling single-use items.
Therefore Eunomia was commissioned by Seas at Risk to research the consumption of single-use on-the-go plastic items, and leverage points for reducing their use.
In this report, we present the findings of desk-based research into the numbers of items consumed in Europe and different European countries; the most prevalent items found
1 Jambeck, J.R., Geyer, R., Wilcox, C., et al. (2015) Plastic waste inputs from land into the ocean, Science, Vol.347, No.6223, pp.768–771 2 European Commission (2014) Towards a Circular Economy: A zero Waste Programme for Europe.
COM(2014)398 http://eur-lex.europa.eu/legal-content/EN/TXT/?uri=celex%3A52014DC0398
On-the-go plastic items are those consumed while on the move in public spaces, rather than in the home or at cafes and restaurants.
Single-use plastic items are those designed to be used once and then thrown away.
8
on beaches; European legislation that can be used to tackle the issue; and a variety of research questions related to attitudes towards single-use plastic consumption, litter and reduction measures. We also present ten case studies of initiatives to reduce the consumption of single-use plastics and/or prevent their escape into the environment.
2.0 Item Specific Consumption Estimates
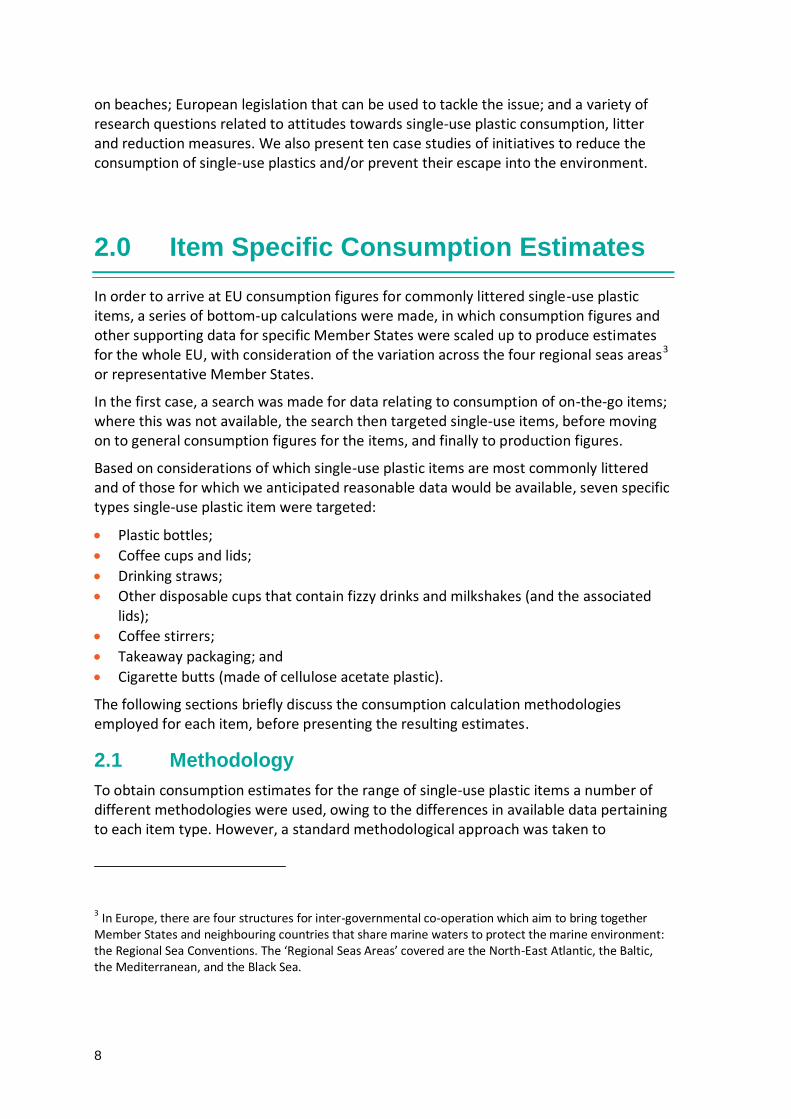
In order to arrive at EU consumption figures for commonly littered single-use plastic items, a series of bottom-up calculations were made, in which consumption figures and other supporting data for specific Member States were scaled up to produce estimates for the whole EU, with consideration of the variation across the four regional seas areas3 or representative Member States.
In the first case, a search was made for data relating to consumption of on-the-go items; where this was not available, the search then targeted single-use items, before moving on to general consumption figures for the items, and finally to production figures.
Based on considerations of which single-use plastic items are most commonly littered and of those for which we anticipated reasonable data would be available, seven specific types single-use plastic item were targeted:
Plastic bottles;
Coffee cups and lids;
Drinking straws;
Other disposable cups that contain fizzy drinks and milkshakes (and the associated lids);
Coffee stirrers;
Takeaway packaging; and
Cigarette butts (made of cellulose acetate plastic).
The following sections briefly discuss the consumption calculation methodologies employed for each item, before presenting the resulting estimates.
2.1 Methodology
To obtain consumption estimates for the range of single-use plastic items a number of different methodologies were used, owing to the differences in available data pertaining to each item type. However, a standard methodological approach was taken to
3 In Europe, there are four structures for inter-governmental co-operation which aim to bring together Member States and neighbouring countries that share marine waters to protect the marine environment: the Regional Sea Conventions. The ‘Regional Seas Areas’ covered are the North-East Atlantic, the Baltic, the Mediterranean, and the Black Sea.
9
identifying sources of information, and similar extrapolation techniques were used to move from country specific to EU-wide figures.
For each item type, in the first instance an internet search was made to determine the extent of European consumption data available for that item. In some cases data was available for multiple countries, whereas in others it was only available for a few or just a single country, or even just part of the market in a single country.
The scope of the consumption data available then determined the research needed to build up the picture of consumption and scale up to an EU level. For example, when data was only available on specific market areas, further economic data was researched in order to scale up to country level before scaling up to EU level. Where good data was immediately available at country level, scaling to EU level was more straightforward.
Once consumption figures were established for single countries, scaling up to EU level was done in two ways: firstly, by national population (aged 15 and over, where appropriate) and secondly, by gross domestic product purchase power parity (GDP PPP). The latter is a more nuanced measure, which takes into account economic factors absent from simple considerations of population size. Roughly speaking, it is a better measure of ‘spending power’, taking into account both wealth and how much money can buy in different countries. This is likely to be better correlated with the consumption of consumer goods, especially things that aren’t ‘necessities’.
Although GDP PPP factors in economic considerations, it should be noted that the estimates made in this report do not take account of cultural factors which influence consumption rates in different countries. This is less of a concern where consumption data for specific items was available for many countries when giving total EU estimates, but where extrapolations have been made based on consumption figures for one or a few countries there is more uncertainty around the EU-wide estimate.
In terms of how consumption rates are related to littering and marine litter, we can only make the assumption that there is a positive correlation. We can not take into account existing waste management practices and litter abatement measures already in place; or different attitudes and hence propensities to litter in different countries. Research conducted in Section 4.1 on public attitudes to littering was not able to obtain enough data to provide country by country estimates for littering rates or any proxies of that.
2.2 Plastic Bottles
The consumption calculation for single-use plastic bottles is based on the number of PET beverage bottles placed on the market (in terms of total sales) under the Norwegian deposit refund system (DRS) in 2015, as published by the company which manages the scheme, Infinitum. 4
4 Infinitum annual report 2015, Infinitum, 2015
10
The Norwegian figure is 613 million bottles, all of which are single-use and many of which will have been consumed on-the-go in public spaces, with an associated risk of being littered, rather than being recycled or disposed of at home. This figure applies to bottles of between 200 millilitre and 3.5 litre sizes, because of the limits of detection of the return vending machines from which the data are obtained. If a further breakdown by size were available, we would be able to make a concrete estimate of how many of the bottles were consumed on-the-go, as we would assume that bottles between 200 and 500ml would be the ones to which this applies. At present this breakdown is not available, however.
The Norwegian data was chosen because Norway publicly provides clear data on the number of PET bottles placed on the market under the DRS. As each unit placed on the market under a DRS is registered and accounted for this provides a reliable data set. Although Norway is not the only EU Member State with a DRS, it was the only one for which such a figure could be found.
This figure has been scaled up for the whole of the EU in two different ways. Firstly, based on national population, and secondly, based on a measure of gross domestic product purchase power parity (GDP PPP). This later approach is more nuanced, as it takes into account the fact that different Member States display different levels of economic activity and consumption. However, it should be noted that as mentioned above in Section 2.1 this approach does not account for cultural differences between countries, such as that some may be more aware of the impacts of plastic pollution than others and so consuming less in response; or, the popularity of different products in different countries.
The population figures used for the EU28 and Norway are of 1st January 2015, and come from Eurostat.5 The GDP PPP measures used are for 2015, and are also taken from Eurostat.6
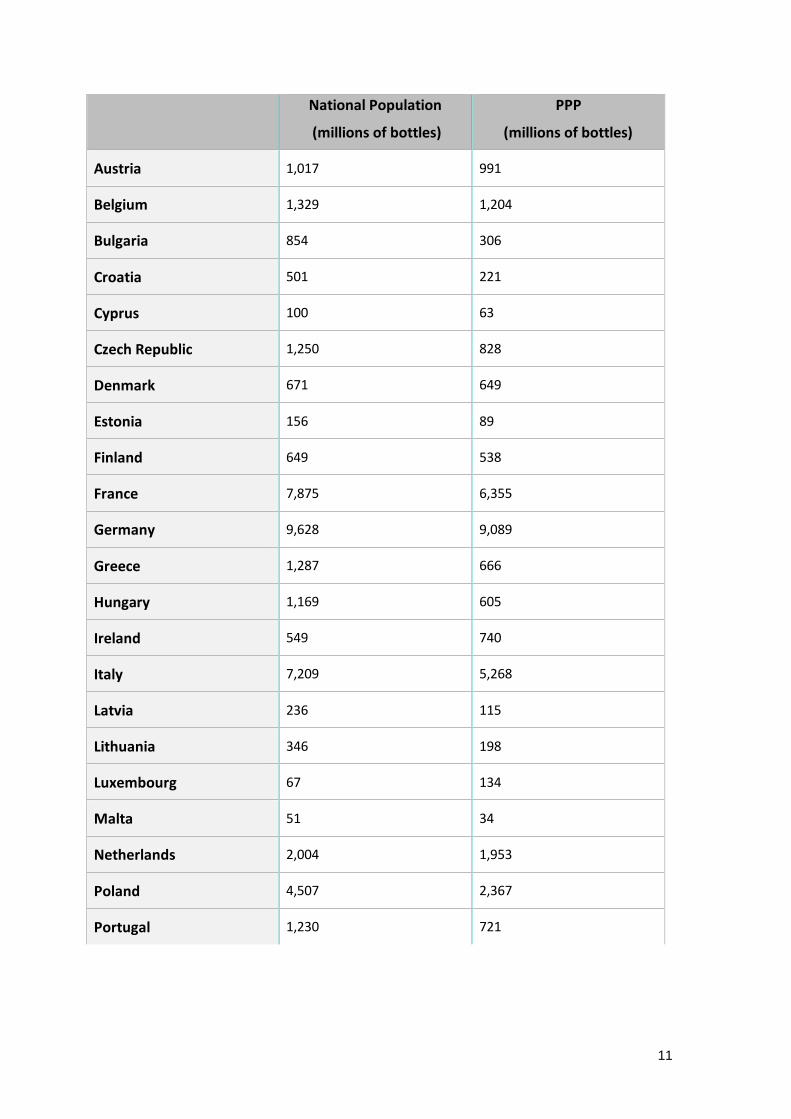
The results of the consumption calculations for single-use plastic bottles are presented in Table 2-1.
Table 2-1: Estimates for Single-use Plastic Bottles Consumed in the EU per Year
Member State Estimate Based on Estimate Based on GDP
5 File:Demographic balance, 2015 (thousands) YB16.png - Statistics Explained, accessed 8 March 2017,
http://ec.europa.eu/eurostat/statistics-explained/index.php/File:Demographic_balance,_2015_(thousands)_YB16.png 6 Statistics illustrated - Eurostat, accessed 21 March 2017, http://ec.europa.eu/eurostat/web/purchasing-
power-parities
11
National Population
(millions of bottles)
PPP
(millions of bottles)
Austria 1,017 991
Belgium 1,329 1,204
Bulgaria 854 306
Croatia 501 221
Cyprus 100 63
Czech Republic 1,250 828
Denmark 671 649
Estonia 156 89
Finland 649 538
France 7,875 6,355
Germany 9,628 9,089
Greece 1,287 666
Hungary 1,169 605
Ireland 549 740
Italy 7,209 5,268
Latvia 236 115
Lithuania 346 198
Luxembourg 67 134
Malta 51 34
Netherlands 2,004 1,953
Poland 4,507 2,367
Portugal 1,230 721
12
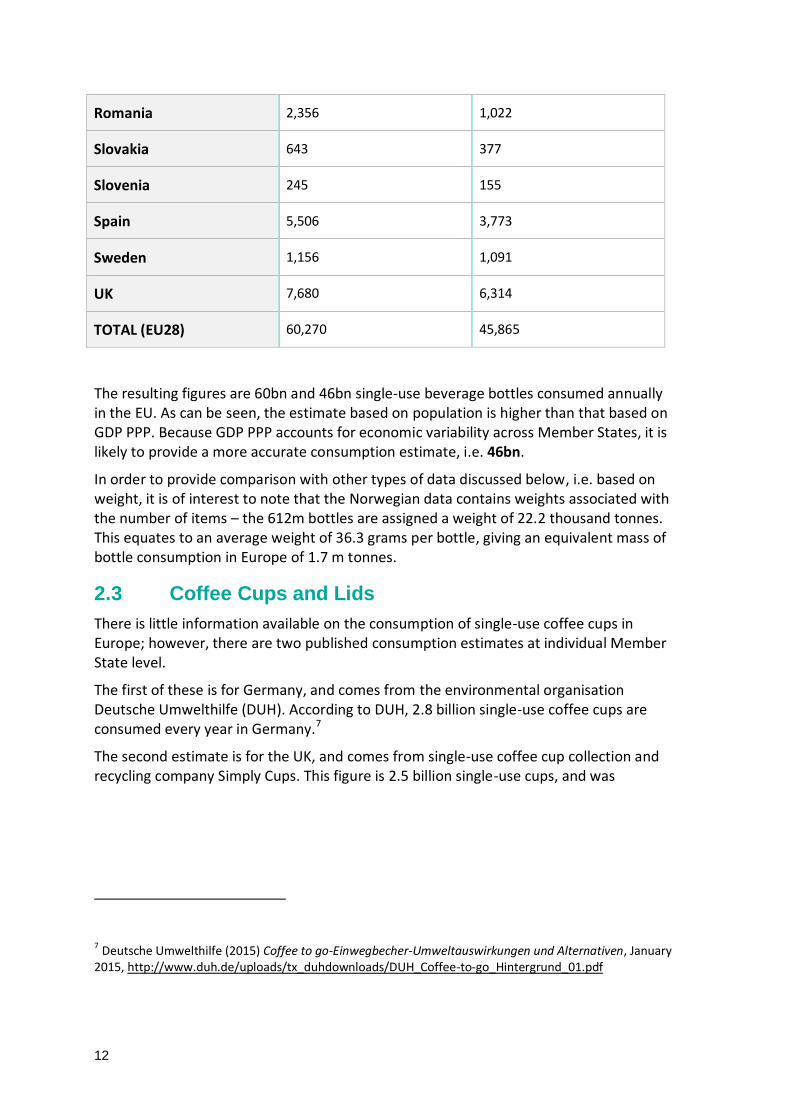
Romania 2,356 1,022
Slovakia 643 377
Slovenia 245 155
Spain 5,506 3,773
Sweden 1,156 1,091
UK 7,680 6,314
TOTAL (EU28) 60,270 45,865
The resulting figures are 60bn and 46bn single-use beverage bottles consumed annually in the EU. As can be seen, the estimate based on population is higher than that based on GDP PPP. Because GDP PPP accounts for economic variability across Member States, it is likely to provide a more accurate consumption estimate, i.e. 46bn.
In order to provide comparison with other types of data discussed below, i.e. based on weight, it is of interest to note that the Norwegian data contains weights associated with the number of items – the 612m bottles are assigned a weight of 22.2 thousand tonnes. This equates to an average weight of 36.3 grams per bottle, giving an equivalent mass of bottle consumption in Europe of 1.7 m tonnes.
2.3 Coffee Cups and Lids
There is little information available on the consumption of single-use coffee cups in Europe; however, there are two published consumption estimates at individual Member State level.
The first of these is for Germany, and comes from the environmental organisation Deutsche Umwelthilfe (DUH). According to DUH, 2.8 billion single-use coffee cups are consumed every year in Germany.7
The second estimate is for the UK, and comes from single-use coffee cup collection and recycling company Simply Cups. This figure is 2.5 billion single-use cups, and was
7 Deutsche Umwelthilfe (2015) Coffee to go-Einwegbecher-Umweltauswirkungen und Alternativen, January
2015, http://www.duh.de/uploads/tx_duhdownloads/DUH_Coffee-to-go_Hintergrund_01.pdf
13
calculated when Simply Cups started operations in 2014; since then, the 2.5 billion figure has been reported frequently in the UK media (sometimes reported as 3 billion).8
The UK estimate of 2.5 billion was -checked by calculating per capita consumption for the UK population aged 15 and over. At a national consumption rate of 2.5 billion cups, UK residents would on average be drinking 46 cups of takeaway coffee per year, at an average rate of a cup every eight days. This seems sensible, given that many people will not be consuming any takeaway coffees. Furthermore, it is reasonably comparable with the slightly higher figure of 2.8 billion cups for Germany, which has an adult population 25% larger and a GDP PPP measure 19% higher (128 to the UK’s 108).
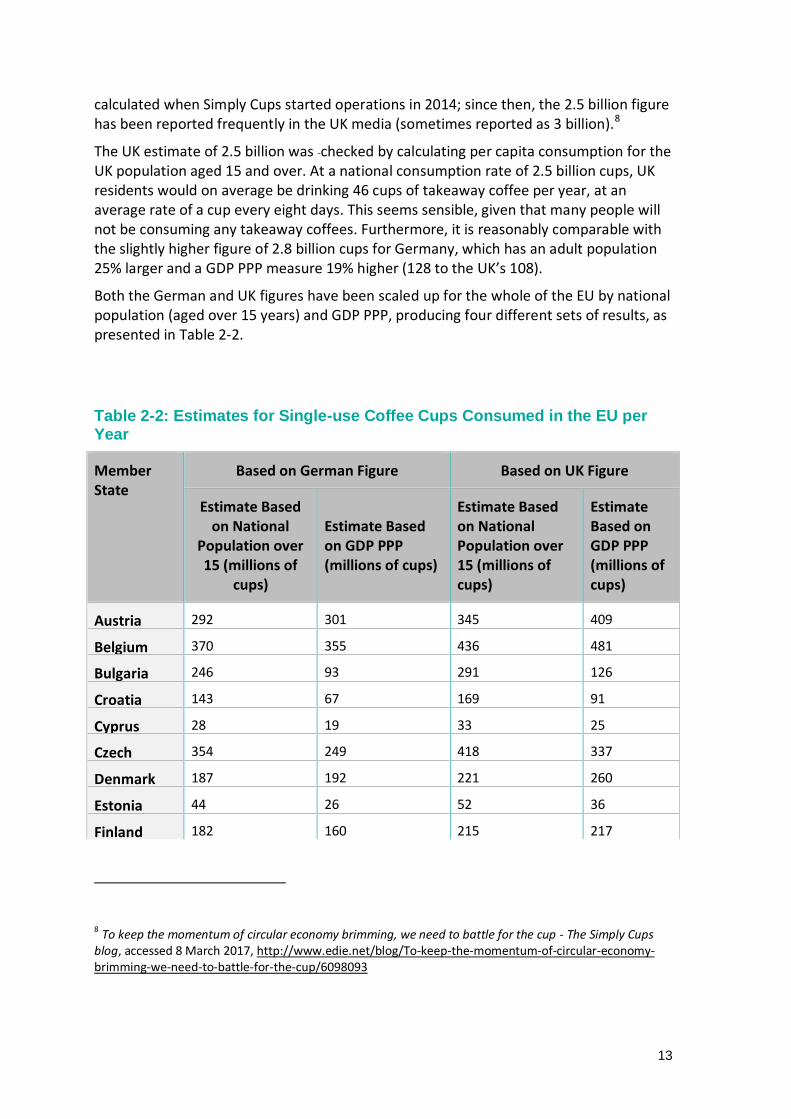
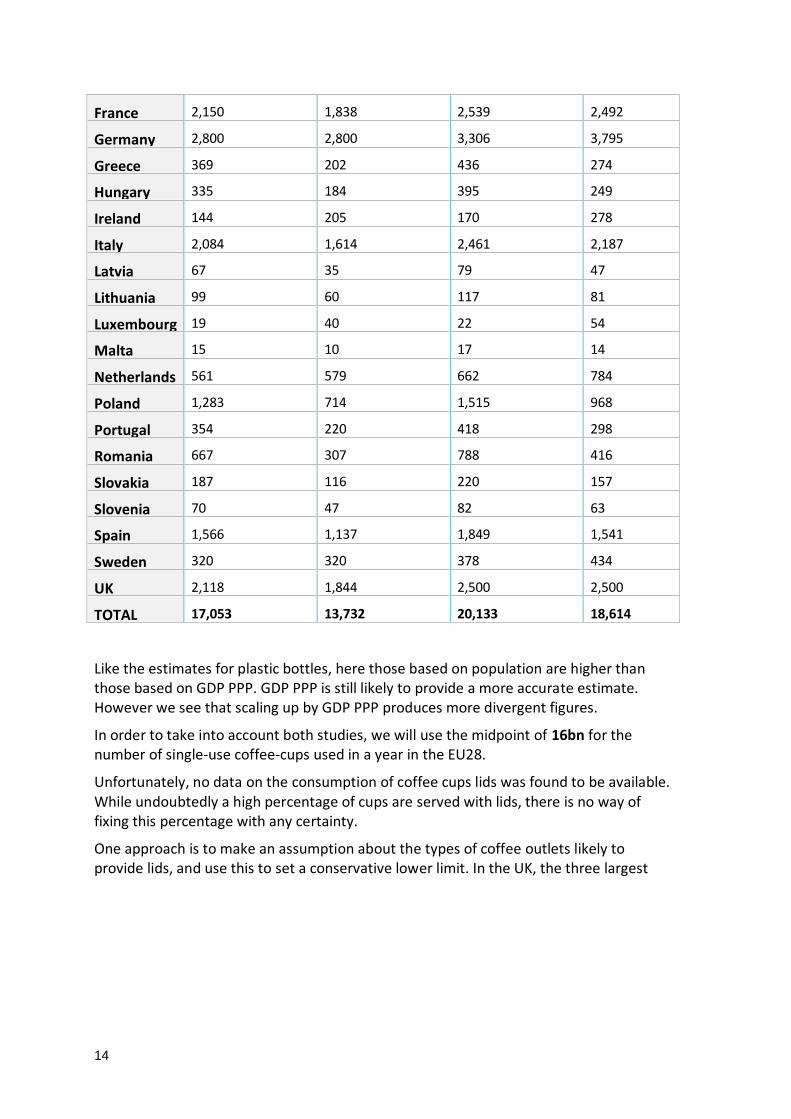
Both the German and UK figures have been scaled up for the whole of the EU by national population (aged over 15 years) and GDP PPP, producing four different sets of results, as presented in Table 2-2.
Table 2-2: Estimates for Single-use Coffee Cups Consumed in the EU per Year
Member State
Based on German Figure Based on UK Figure
Estimate Based on National
Population over 15 (millions of
cups)
Estimate Based on GDP PPP (millions of cups)
Estimate Based on National Population over 15 (millions of cups)
Estimate Based on GDP PPP (millions of cups)
Austria 292 301 345 409
Belgium 370 355 436 481
Bulgaria 246 93 291 126
Croatia 143 67 169 91
Cyprus 28 19 33 25
Czech Republic
354 249 418 337
Denmark 187 192 221 260
Estonia 44 26 52 36
Finland 182 160 215 217
8 To keep the momentum of circular economy brimming, we need to battle for the cup - The Simply Cups
blog, accessed 8 March 2017, http://www.edie.net/blog/To-keep-the-momentum-of-circular-economy-brimming-we-need-to-battle-for-the-cup/6098093
14
France 2,150 1,838 2,539 2,492
Germany 2,800 2,800 3,306 3,795
Greece 369 202 436 274
Hungary 335 184 395 249
Ireland 144 205 170 278
Italy 2,084 1,614 2,461 2,187
Latvia 67 35 79 47
Lithuania 99 60 117 81
Luxembourg 19 40 22 54
Malta 15 10 17 14
Netherlands 561 579 662 784
Poland 1,283 714 1,515 968
Portugal 354 220 418 298
Romania 667 307 788 416
Slovakia 187 116 220 157
Slovenia 70 47 82 63
Spain 1,566 1,137 1,849 1,541
Sweden 320 320 378 434
UK 2,118 1,844 2,500 2,500
TOTAL (EU28)
17,053 13,732 20,133 18,614
Like the estimates for plastic bottles, here those based on population are higher than those based on GDP PPP. GDP PPP is still likely to provide a more accurate estimate. However we see that scaling up by GDP PPP produces more divergent figures.
In order to take into account both studies, we will use the midpoint of 16bn for the number of single-use coffee-cups used in a year in the EU28.
Unfortunately, no data on the consumption of coffee cups lids was found to be available. While undoubtedly a high percentage of cups are served with lids, there is no way of fixing this percentage with any certainty.
One approach is to make an assumption about the types of coffee outlets likely to provide lids, and use this to set a conservative lower limit. In the UK, the three largest
15
coffee shops account for around 77% of the market9, and these large retailers customarily provide lids as a matter of course. Many of the shops comprising the remaining 23% will also provide lids, but of course there will also be cups given out without lids on both sides. Therefore, a 77% limit on the number of cups provided with lids may be reasonable. Using this approach, we reach an EU wide figure of 12bn lids per year.
However, owing to the uncertain nature of this figure, it may be preferable in the context of messaging and campaigning to take a simpler estimate. For example, it could be stated that over 16bn coffee cups are consumed per year and ‘the number of lids could be as many’ or ‘at most matched by the same number of lids'.
2.4 Drinking Straws
The consumption estimate for single-use plastic drinking straws is based on an estimate of the number of straws provided by McDonalds every day in the UK made by the campaign group Straw Wars10. This estimate – of 3.5 million straws per day – was the only figure available on the consumption of drinking straws in the EU, but by using supplementary data it was possible to scale up to total straw consumption figures for the EU28.
One supplementary dataset comprised numbers of McDonald’s restaurants by country from statistics portal Statista11, and fast food market share figures for McDonald’s by country from market research company Euromonitor12. Based on the number of McDonald’s restaurants in the UK, it was possible to calculate a per restaurant figure for straw consumption which could be used as an average straws-per-restaurant figure for other countries. Then, using the market share data, it was possible to calculate the numbers of straws provided by McDonalds in 13 Member States (i.e. those for which market share data was available. These member states were those where McDonald’s was the market leader). Working on the assumption that other businesses in the fast food sector distribute straws in the same manner as McDonalds, this could then be scaled up to represent the total numbers of straws provided across the fast food sector annually.
The consumption calculation for single-use plastic drinking straws in each Member State can thus be summarised as:
9 Starbucks Trails Costa in Booming U.K. Coffee-Shop Market: Chart - Bloomberg, accessed 22 March 2017, https://www.bloomberg.com/news/articles/2016-02-04/starbucks-trails-costa-in-booming-u-k-coffee-shop-market-chart 10
Straw Wars, accessed 22 March 2017, http://strawwars.org/ 11 McDonald’s: restaurants by country Europe 2016 | Statistic, accessed 22 March 2017, https://www.statista.com/statistics/256044/mcdonalds-restaurants-in-europe/ 12
Fast food restaurant industry market research, trends, statistics, accessed 22 March 2017, http://www.euromonitor.com/fast-food
16
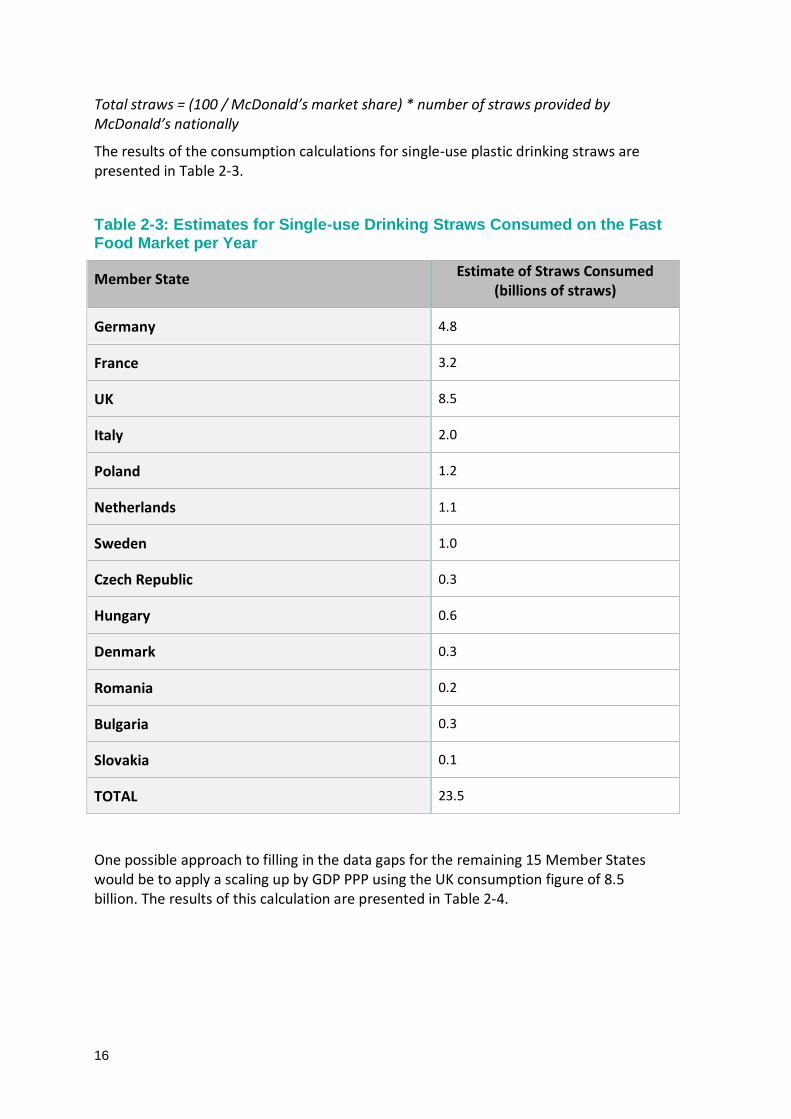
Total straws = (100 / McDonald’s market share) * number of straws provided by McDonald’s nationally
The results of the consumption calculations for single-use plastic drinking straws are presented in Table 2-3.
Table 2-3: Estimates for Single-use Drinking Straws Consumed on the Fast Food Market per Year
Member State Estimate of Straws Consumed (billions of straws)
Germany 4.8
France 3.2
UK 8.5
Italy 2.0
Poland 1.2
Netherlands 1.1
Sweden 1.0
Czech Republic 0.3
Hungary 0.6
Denmark 0.3
Romania 0.2
Bulgaria 0.3
Slovakia 0.1
TOTAL 23.5
One possible approach to filling in the data gaps for the remaining 15 Member States would be to apply a scaling up by GDP PPP using the UK consumption figure of 8.5 billion. The results of this calculation are presented in Table 2-4.
17
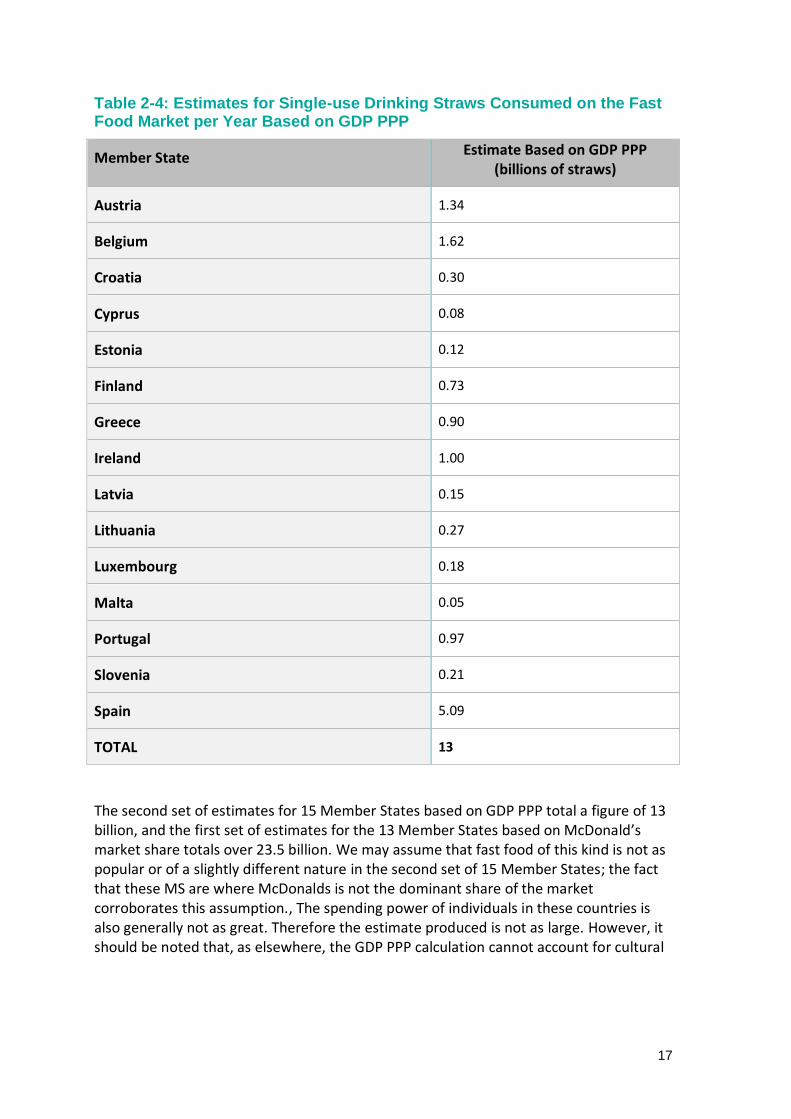
Table 2-4: Estimates for Single-use Drinking Straws Consumed on the Fast Food Market per Year Based on GDP PPP
Member State Estimate Based on GDP PPP
(billions of straws)
Austria 1.34
Belgium 1.62
Croatia 0.30
Cyprus 0.08
Estonia 0.12
Finland 0.73
Greece 0.90
Ireland 1.00
Latvia 0.15
Lithuania 0.27
Luxembourg 0.18
Malta 0.05
Portugal 0.97
Slovenia 0.21
Spain 5.09
TOTAL 13
The second set of estimates for 15 Member States based on GDP PPP total a figure of 13 billion, and the first set of estimates for the 13 Member States based on McDonald’s market share totals over 23.5 billion. We may assume that fast food of this kind is not as popular or of a slightly different nature in the second set of 15 Member States; the fact that these MS are where McDonalds is not the dominant share of the market corroborates this assumption., The spending power of individuals in these countries is also generally not as great. Therefore the estimate produced is not as large. However, it should be noted that, as elsewhere, the GDP PPP calculation cannot account for cultural
18
factors which may play a part here, for example the motivation for some consumers with more purchase power to choose more expensive healthy eating options, and so spend less on fast food, which would lead to an overestimation of consumption for the countries with higher GDP PPP and underestimation for countries with lower GDP PPP.
This gives a total EU figure of 36.5 billion plastic drinking straws consumed annually. While not all of these straws will be consumed on-the-go (some will be consumed in restaurants) they will nevertheless all be single-use items.
2.5 Other Disposable Cups
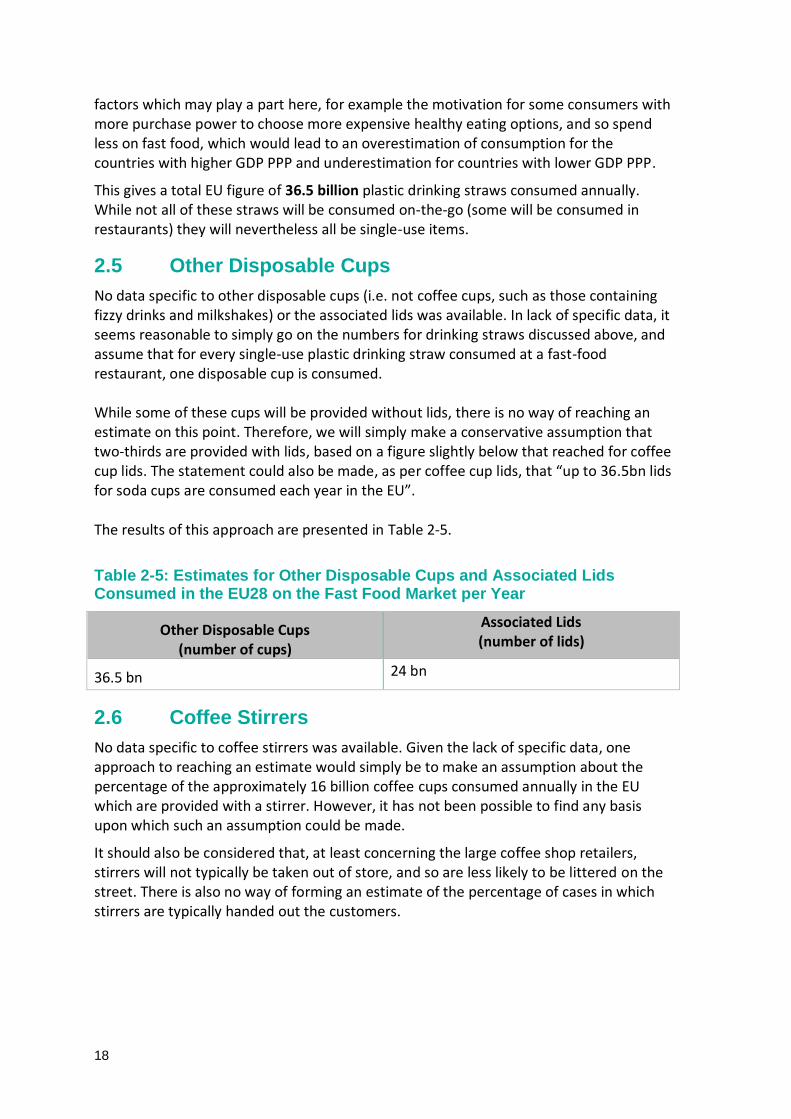
No data specific to other disposable cups (i.e. not coffee cups, such as those containing fizzy drinks and milkshakes) or the associated lids was available. In lack of specific data, it seems reasonable to simply go on the numbers for drinking straws discussed above, and assume that for every single-use plastic drinking straw consumed at a fast-food restaurant, one disposable cup is consumed. While some of these cups will be provided without lids, there is no way of reaching an estimate on this point. Therefore, we will simply make a conservative assumption that two-thirds are provided with lids, based on a figure slightly below that reached for coffee cup lids. The statement could also be made, as per coffee cup lids, that “up to 36.5bn lids for soda cups are consumed each year in the EU”. The results of this approach are presented in Table 2-5.
Table 2-5: Estimates for Other Disposable Cups and Associated Lids Consumed in the EU28 on the Fast Food Market per Year
Other Disposable Cups (number of cups)
Associated Lids (number of lids)
36.5 bn 24 bn
2.6 Coffee Stirrers
No data specific to coffee stirrers was available. Given the lack of specific data, one approach to reaching an estimate would simply be to make an assumption about the percentage of the approximately 16 billion coffee cups consumed annually in the EU which are provided with a stirrer. However, it has not been possible to find any basis upon which such an assumption could be made.
It should also be considered that, at least concerning the large coffee shop retailers, stirrers will not typically be taken out of store, and so are less likely to be littered on the street. There is also no way of forming an estimate of the percentage of cases in which stirrers are typically handed out the customers.
19
2.7 Takeaway Packaging
The consumption estimate for single-use plastic takeaway packaging assumes that this kind of packaging (e.g. polystyrene ‘clamshells’ and polypropylene containers) is primarily provided by small fast food businesses. The big players on the European fast food market (McDonalds, Subway, KFC13) and similar large businesses typically do not provide their food in plastic packaging, but instead use branded packaging made of paper and card. The kinds of businesses responsible for providing plastic takeaway packaging are rather the small and independent business such as kebab houses, chip shops, and other takeaways serving global cuisines to go. Data on small and medium sized enterprises (SMEs) from the DATA.GOV.UK website was used to estimate the percentage of these fast food meals and takeaways provided by small takeaway businesses14. This was done by calculating the percentage of UK restaurant turnover for 2009 accounted for by businesses with between one and nine employees (29.3%). It should be noted, however, that the standard industrial classification (SIC) code under which restaurants are grouped in UK Government data also includes hotels, and there is unfortunately no way of separating out the two sectors in the data. However, simply based on the size of staff, utilising the SME grouping would rule out a large number of such establishments.
It is also important to note that this approach leaves out plastic packaging provided by large retailers such as EAT and Pret A Manger for food items such as sandwiches and salads. Although making a sizable contribution to plastic packaging consumption, as there is no way of determining the market share of these ‘healthy’ take-away retailers among UK restaurants, it has unfortunately not been possible to include them.
A 2015 report from Cancer Research puts the number of fast food meals and takeaways consumed in the UK every week at 22 million.15 This small business turnover share was then applied to a yearly consumption figure of 1.14 bn (scaled up from the weekly figure) to reach a figure for the number of fast food meals and takeaways provided every year by small businesses – many of which will be consumed off premises and on-the-go.
At this point, a figure for the number of fast food meals and takeaways consumed from small business per person per year in the UK was calculated in order to provide a multiplication factor which with to reach consumption estimates for the rest of the EU based on population size. In addition, a comparable figure for UK consumption relative
13 Daily chart: Fast-food nations | The Economist, accessed 22 March 2017, http://www.economist.com/fastfood 14
2009 edition tables - Resources, accessed 21 March 2017, https://data.gov.uk/dataset/small_and_medium_sized_enterprise_statistics_sme_for_the_uk_and_regions/resource/8cad0444-9ce7-4614-87d7-6d192767b72a 15
Cancer Research UK (2015) A Weighty Issue, A Study of UK Adult’s Consumption Behaviours, Knowledge of Calorie and Added Sugar Guidelines and Physical Activity Levels, March 2015, https://www.cancerresearchuk.org/sites/default/files/a_weighty_issue_full_report.pdf
20
to UK GDP PPP was also calculated to allow for EU estimates based on national GDP PPP to be made.
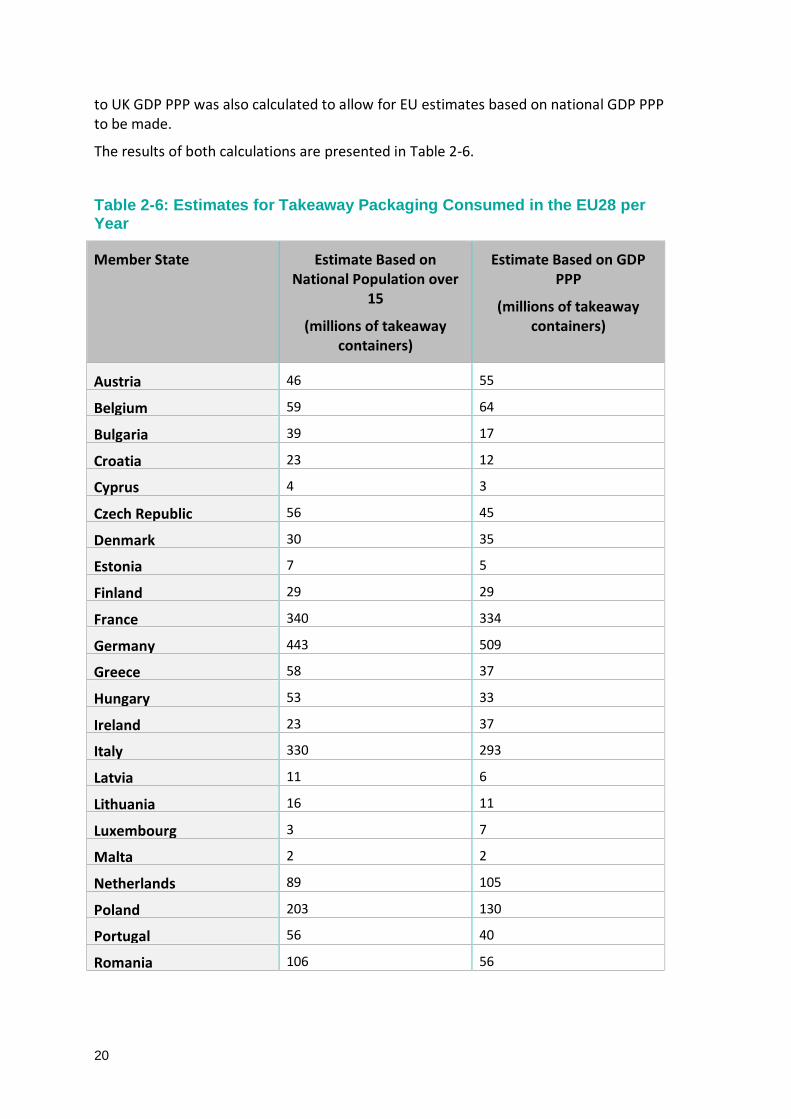
The results of both calculations are presented in Table 2-6.
Table 2-6: Estimates for Takeaway Packaging Consumed in the EU28 per Year
Member State Estimate Based on National Population over
15
(millions of takeaway containers)
Estimate Based on GDP PPP
(millions of takeaway containers)
Austria 46 55
Belgium 59 64
Bulgaria 39 17
Croatia 23 12
Cyprus 4 3
Czech Republic 56 45
Denmark 30 35
Estonia 7 5
Finland 29 29
France 340 334
Germany 443 509
Greece 58 37
Hungary 53 33
Ireland 23 37
Italy 330 293
Latvia 11 6
Lithuania 16 11
Luxembourg 3 7
Malta 2 2
Netherlands 89 105
Poland 203 130
Portugal 56 40
Romania 106 56
21
Slovakia 30 21
Slovenia 11 8
Spain 248 207
Sweden 51 58
UK 335 335
TOTAL 2,699 2,496
As can be seen, the results based on GDP PPP are quite similar to those based on population. The final estimate is of the consumption of 2.5 bn plastic takeaway containers per year in the EU28.
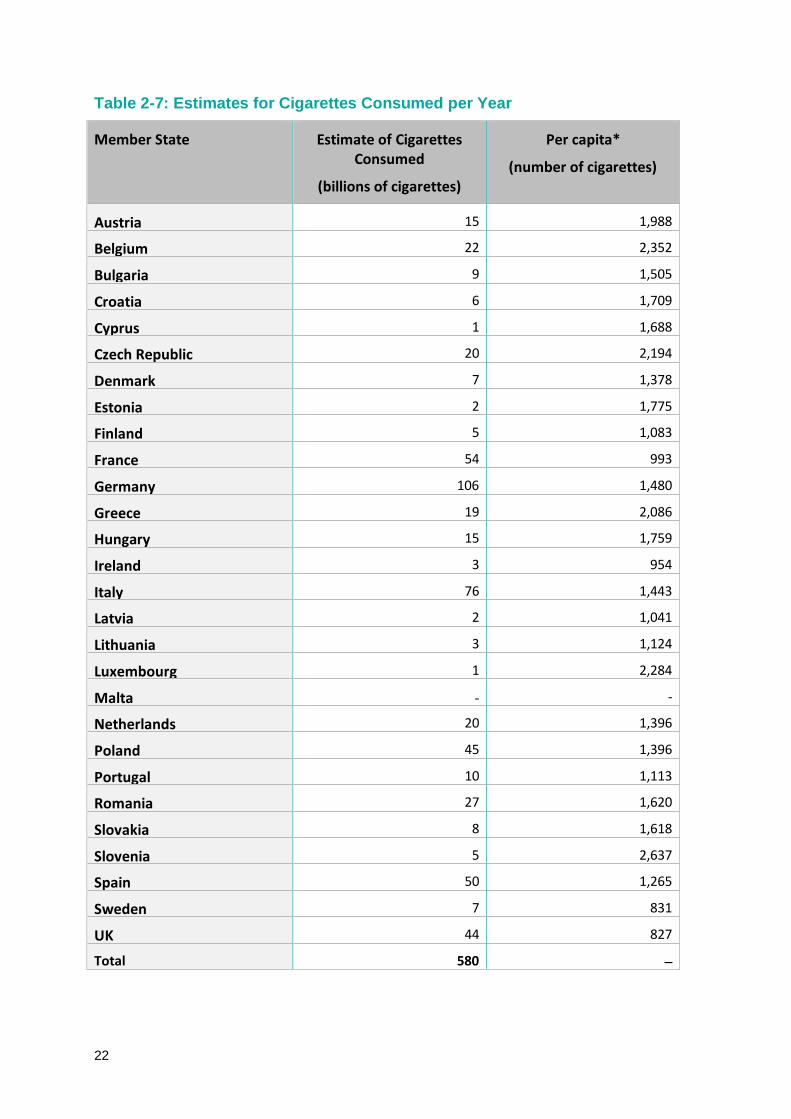
2.8 Cigarette Butts
Cigarette butts are made from a synthetic plastic fibre called cellulose acetate. One consumption estimate for cigarettes is based on Eurostat data for the population aged 15 and over, 16 combined with data from campaign group Tobacco Atlas on the average number of cigarettes smoked per person over 15 years of age per year by country.17
The results of this calculation are presented in Table 2-7.
16
Population and population change statistics - Statistics Explained, accessed 20 March 2017, http://ec.europa.eu/eurostat/statistics-explained/index.php/Population_and_population_change_statistics 17
Cigarette Use Globally | The Tobacco Atlas, accessed 20 March 2017, http://www.tobaccoatlas.org/topic/cigarette-use-globally/
22
Table 2-7: Estimates for Cigarettes Consumed per Year
Member State Estimate of Cigarettes Consumed
(billions of cigarettes)
Per capita*
(number of cigarettes)
Austria 15 1,988
Belgium 22 2,352
Bulgaria 9 1,505
Croatia 6 1,709
Cyprus 1 1,688
Czech Republic 20 2,194
Denmark 7 1,378
Estonia 2 1,775
Finland 5 1,083
France 54 993
Germany 106 1,480
Greece 19 2,086
Hungary 15 1,759
Ireland 3 954
Italy 76 1,443
Latvia 2 1,041
Lithuania 3 1,124
Luxembourg 1 2,284
Malta - -
Netherlands 20 1,396
Poland 45 1,396
Portugal 10 1,113
Romania 27 1,620
Slovakia 8 1,618
Slovenia 5 2,637
Spain 50 1,265
Sweden 7 831
UK 44 827
Total 580 –
23
*Per capita amongst the total population over 15
A second source of information is the number of cigarettes released from bonded warehouses for sale across the European Union. Country by country data is not as relevant here as the figures do not fully reflect consumption, as they do not take cross-border movement into account. The total number of cigarettes according to this is 493 bn.18 The lower figure perhaps goes some way to reveal the extent of illegal trade in tobacco products; already the consumption figures might be expected to be underestimated by smokers who may not be completely honest about their consumption. Therefore we will use the consumption figures.
While cigarettes are single-use items, not all of them will be consumed on-the-go, and therefore these figures relate only to single-use consumption. A conservative estimate of the proportion of cigarette butts consumed on the go which are discarded as litter would be around 60%.19 However, because we do not know what proportion of cigarettes are consumed on the go (and this would vary widely country to country based on climate and implementation of smoking bans, for example), we are not able to estimate the number of cigarette butts discarded as litter.
Country by country, we see a wide range of variation in cigarette consumption per capita, with Slovenia and Belgium scoring the highest with 2,637 and 2,352 per capita per year; and Sweden and the UK coming at the bottom of the league with 831 and 827 respectively. We can expect the littering risk for these items to be proportionate.
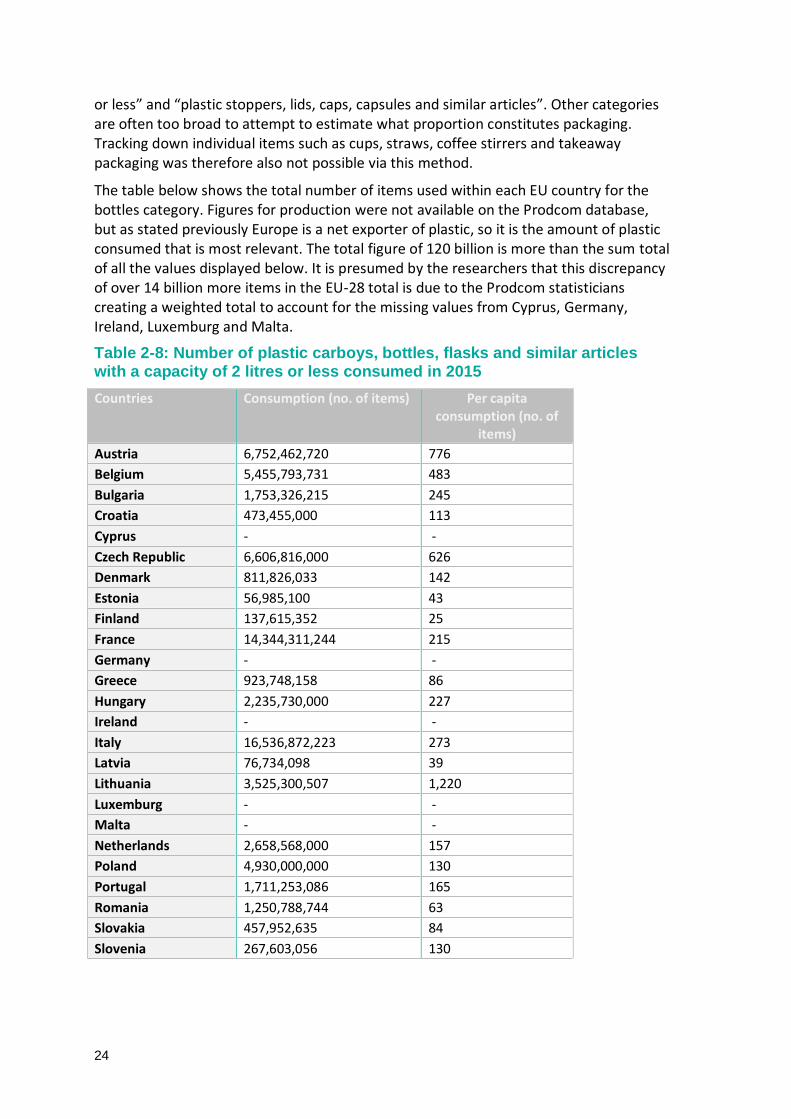
2.9 Eurostat – Prodcom Data
The EU publishes lists of materials and products that are produced and traded within Europe via the Prodcom database.20 The most recent Prodcom data is from 2015. As stated on the website, the majority of product codes correspond to a combination of products that have been grouped together. This presents a challenge when attempting to obtain statistics with the correct scope from the data. As reported above, packaging is the main driver of plastics demand in Europe but unfortunately the Prodcom data does not differentiate plastic items on this basis.
Searching for plastic within the Prodcom database returns over 140 different coded items. Only two of these are particularly relevant to single use items: these two are defined as “plastic carboys,21 bottles, flasks and similar articles with a capacity of 2 litres
18
http://ec.europa.eu/taxation_customs/sites/taxation/files/resources/documents/taxation/excise_duties/tobacco_products/tobacco_products_releases-consumption.pdf
20 Available here: http://ec.europa.eu/eurostat/web/prodcom/data/database 21
A carboy is a container for liquids
24
or less” and “plastic stoppers, lids, caps, capsules and similar articles”. Other categories are often too broad to attempt to estimate what proportion constitutes packaging. Tracking down individual items such as cups, straws, coffee stirrers and takeaway packaging was therefore also not possible via this method.
The table below shows the total number of items used within each EU country for the bottles category. Figures for production were not available on the Prodcom database, but as stated previously Europe is a net exporter of plastic, so it is the amount of plastic consumed that is most relevant. The total figure of 120 billion is more than the sum total of all the values displayed below. It is presumed by the researchers that this discrepancy of over 14 billion more items in the EU-28 total is due to the Prodcom statisticians creating a weighted total to account for the missing values from Cyprus, Germany, Ireland, Luxemburg and Malta.
Table 2-8: Number of plastic carboys, bottles, flasks and similar articles with a capacity of 2 litres or less consumed in 2015
Countries Consumption (no. of items) Per capita consumption (no. of
items)
Austria 6,752,462,720 776
Belgium 5,455,793,731 483
Bulgaria 1,753,326,215 245
Croatia 473,455,000 113
Cyprus - -
Czech Republic 6,606,816,000 626
Denmark 811,826,033 142
Estonia 56,985,100 43
Finland 137,615,352 25
France 14,344,311,244 215
Germany - -
Greece 923,748,158 86
Hungary 2,235,730,000 227
Ireland - -
Italy 16,536,872,223 273
Latvia 76,734,098 39
Lithuania 3,525,300,507 1,220
Luxemburg - -
Malta - -
Netherlands 2,658,568,000 157
Poland 4,930,000,000 130
Portugal 1,711,253,086 165
Romania 1,250,788,744 63
Slovakia 457,952,635 84
Slovenia 267,603,056 130
25
Spain 15,280,557,000 329
Sweden 191,111,900 19
United Kingdom 19,071,831,000 292
EU28TOTALS 120,000,000,000 Average: 207
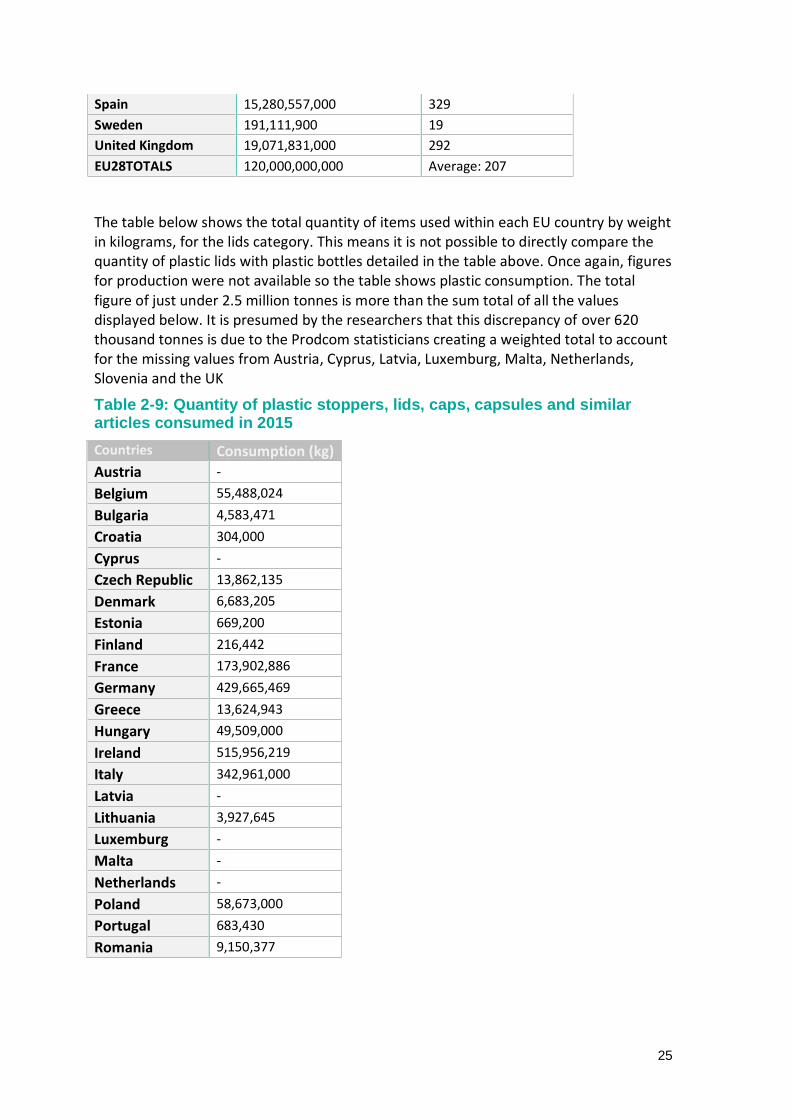
The table below shows the total quantity of items used within each EU country by weight in kilograms, for the lids category. This means it is not possible to directly compare the quantity of plastic lids with plastic bottles detailed in the table above. Once again, figures for production were not available so the table shows plastic consumption. The total figure of just under 2.5 million tonnes is more than the sum total of all the values displayed below. It is presumed by the researchers that this discrepancy of over 620 thousand tonnes is due to the Prodcom statisticians creating a weighted total to account for the missing values from Austria, Cyprus, Latvia, Luxemburg, Malta, Netherlands, Slovenia and the UK
Table 2-9: Quantity of plastic stoppers, lids, caps, capsules and similar articles consumed in 2015
Countries Consumption (kg)
Austria -
Belgium 55,488,024
Bulgaria 4,583,471
Croatia 304,000
Cyprus -
Czech Republic 13,862,135
Denmark 6,683,205
Estonia 669,200
Finland 216,442
France 173,902,886
Germany 429,665,469
Greece 13,624,943
Hungary 49,509,000
Ireland 515,956,219
Italy 342,961,000
Latvia -
Lithuania 3,927,645
Luxemburg -
Malta -
Netherlands -
Poland 58,673,000
Portugal 683,430
Romania 9,150,377
26
Slovakia 10,241
Slovenia -
Spain 175,223,000
Sweden 16,842,400
United Kingdom -
EU28TOTALS 2,495,907,354
The extent to which we are able to utilise this data is limited, firstly because the groupings are so broad; while we might be happy to assume that most of these containers and lids would be single use, we cannot make a judgement about what proportion might be consumed on-the-go. Secondly, where units are in weight, they do not allow us to compare them easily to the figures obtained from industry estimates on ‘number of items’. For this reason, we have not looked at the historic data set.
However an interesting comparison may be made by taking the bottles figure (120bn) provided by the Prodcom database and the figure we have extrapolated for the EU from Norway’s deposit return system data – 46 bn. This helps us to sense-check the figure obtained and provide an indication of what proportion of bottles, approximately, are likely to be beverage containers, and hence more likely to be both single use and on-the-go items – about 40%.
For the ‘bottles’ category, we calculated per capita consumption, so that country by country variation could be assessed – with a view to revealing differing attitudes. From a low of 19 for Sweden and 1,220 for Lithuania, and an average of 207 EU-wide, the wide variation is probably more indicative of the places where manufacturing/bottling takes place in the European Union.
2.10 Plastic Production
In order to understand future trends in the production of single-use items, data on historic plastic production, the contribution of packaging demand to this, and future trends, are assessed and presented.
Plastics Europe have been producing annual reports on the state of the plastics market within Europe since 2010. The quantity of plastic produced in Europe has fluctuated over the last 6 years, largely due to the recession that hit in 2009. This was particularly notable between 2011 and 2012 which saw a decrease of 3% in plastics production.22 As a net exporter of plastic and plastic products Europe accounted for 18.5% of the world’s total production in 2015; which is a reduction on the 20.4% it contributed in 2011. In the period from 2010-15 Europe has exported an average of 11 million tonnes of plastic to the rest of the world per year; and an average of 47 million tonnes is consumed within Europe (The figures on plastic demand for packaging included in the table are useful to
22
Plastics – the Facts 2013 An analysis of European latest plastics production, demand and waste data - http://www.plasticseurope.org/Document/plastics-the-facts-2013.aspx
27
consider here, as it includes single-use items such as plastic beverage bottles, cups and takeaway boxes. It gives an indication of the large extent to which packaging is contributing to plastic demand and in turn, consumption of plastic items.
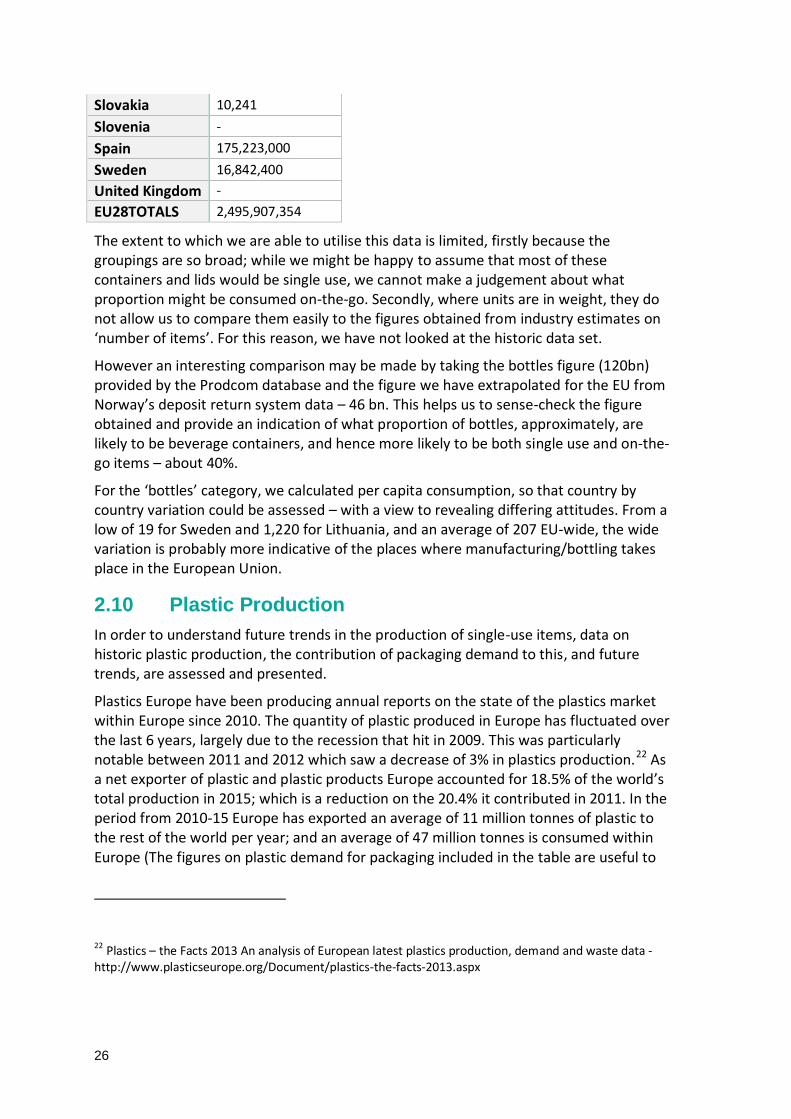
Table 2-10). The table below shows the changing levels of plastic production and consumption within Europe since 2010, in more detail.
The figures on plastic demand for packaging included in the table are useful to consider here, as it includes single-use items such as plastic beverage bottles, cups and takeaway boxes. It gives an indication of the large extent to which packaging is contributing to plastic demand and in turn, consumption of plastic items.
Table 2-10: Plastic production and use within the EU
Year Plastic Production (million tonnes)
Plastic Consumption (million tonnes)
Plastic demand that is packaging
2010 57 46.4 39%
2011 59 47.0 39.4%
2012 59 45.9 39.4%
2013 57 46.3 39.6%
2014 59 47.8 39.5%
2015 58 49.0 39.9%
Each report Plastics Europe publishes shows figures for the previous year, so the most recent 2016 report gives figures for 2015. Some figures are subsequently revised so may be marginally different to those originally reported.
28
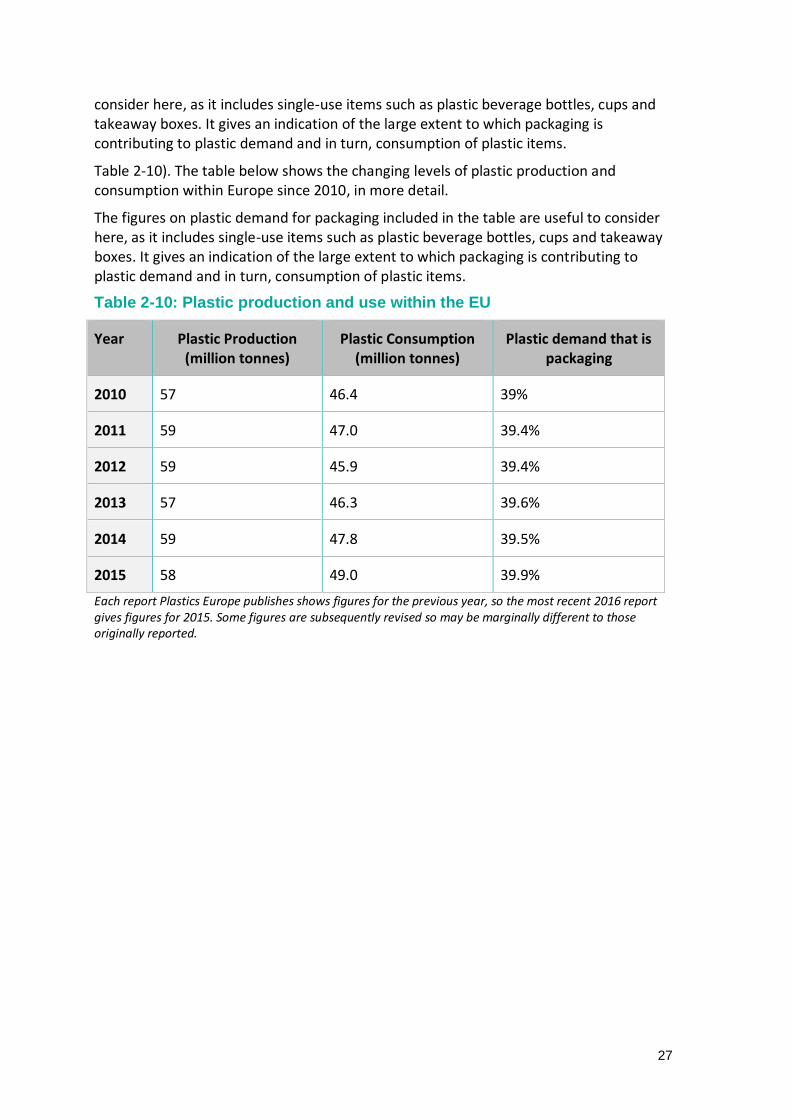
Figure 1: Plastic production and consumption within Europe
The six biggest consumers of plastic within Europe are Germany (24.6%), Italy (14.3%), France (9.6%), Spain (7.7%), the UK (7.5%) and Poland (6.3%) which make up 70% of total demand.23 Plastic consumption in different countries is likely to be a reflection of the manufacturing base; we do not think that Germany’s dominance in terms of plastic consumption according to these statistics reflects a similar prevalence in terms of single-use, on-the-go plastic consumption, because it includes the plastic used by manufacturers of plastic items. However, it is useful to understand that consistently, around 40% of consumption is used for packaging, equating to around 19 million tonnes per year. Given our estimate of 46 bn single-use, (mostly) on-the-go bottles consumed in the EU per year, weighing a total of 1.7 m tonnes, this accounts for approximately 9% of packaging production.
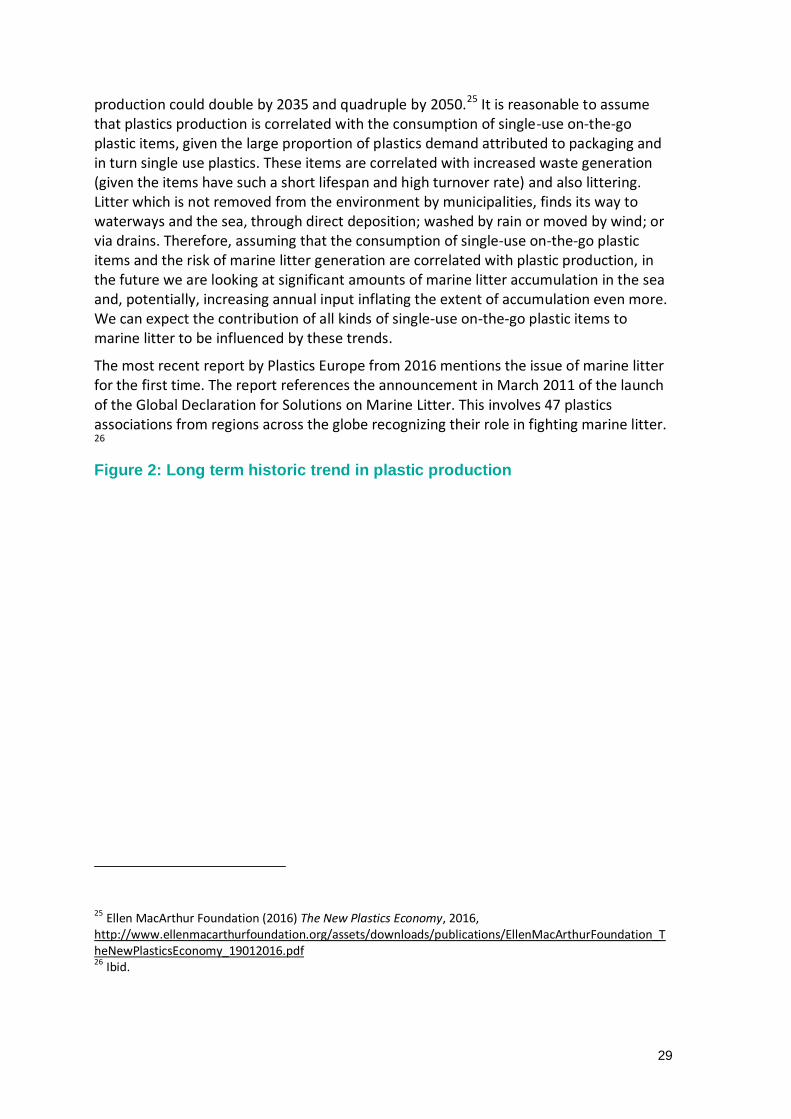
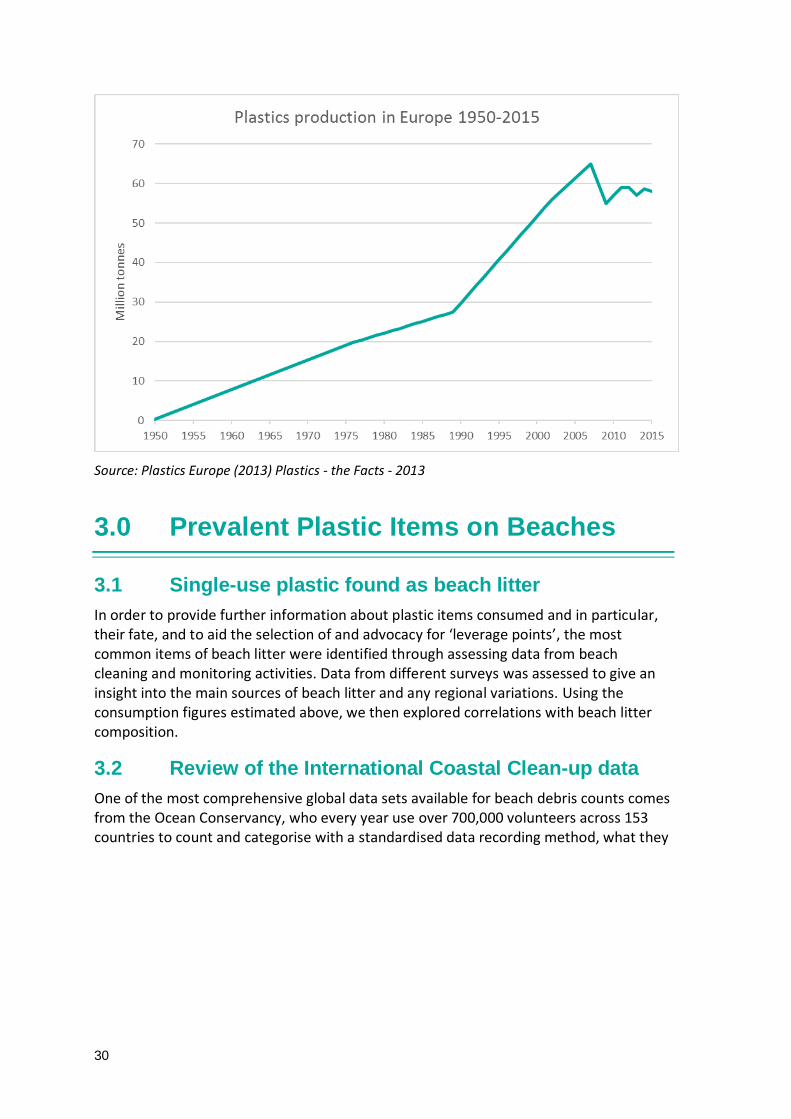
The trend with respect to the last few years is relatively stable despite some fluctuations – however, if we look at a longer time series (Figure 2) we can see that plastics production increased by a huge amount since the material’s initial years of use (plastics entered into general mass use around the 1950s).24 After year on year increase in production, we only see a decrease in 2008, attributable to the reduction in demand caused by the global economic crisis of 2007–2008.
Its use is not expected to decrease and, by extrapolating the data shown here, we can predict that it could reach 76 m tonnes by 2025; other industry estimates state plastics
23 Plastics – the Facts 2016 An analysis of European latest plastics production, demand and waste data http://www.plasticseurope.org/Document/plastics---the-facts-2016-15787.aspx?Page=DOCUMENT&FolID=2 24
Plastics Europe (2013) Plastics - the Facts - 2013
29
production could double by 2035 and quadruple by 2050.25 It is reasonable to assume that plastics production is correlated with the consumption of single-use on-the-go plastic items, given the large proportion of plastics demand attributed to packaging and in turn single use plastics. These items are correlated with increased waste generation (given the items have such a short lifespan and high turnover rate) and also littering. Litter which is not removed from the environment by municipalities, finds its way to waterways and the sea, through direct deposition; washed by rain or moved by wind; or via drains. Therefore, assuming that the consumption of single-use on-the-go plastic items and the risk of marine litter generation are correlated with plastic production, in the future we are looking at significant amounts of marine litter accumulation in the sea and, potentially, increasing annual input inflating the extent of accumulation even more. We can expect the contribution of all kinds of single-use on-the-go plastic items to marine litter to be influenced by these trends.
The most recent report by Plastics Europe from 2016 mentions the issue of marine litter for the first time. The report references the announcement in March 2011 of the launch of the Global Declaration for Solutions on Marine Litter. This involves 47 plastics associations from regions across the globe recognizing their role in fighting marine litter.
26
Figure 2: Long term historic trend in plastic production
25 Ellen MacArthur Foundation (2016) The New Plastics Economy, 2016, http://www.ellenmacarthurfoundation.org/assets/downloads/publications/EllenMacArthurFoundation_TheNewPlasticsEconomy_19012016.pdf 26
Ibid.
30
Source: Plastics Europe (2013) Plastics - the Facts - 2013
3.0 Prevalent Plastic Items on Beaches
3.1 Single-use plastic found as beach litter
In order to provide further information about plastic items consumed and in particular, their fate, and to aid the selection of and advocacy for ‘leverage points’, the most common items of beach litter were identified through assessing data from beach cleaning and monitoring activities. Data from different surveys was assessed to give an insight into the main sources of beach litter and any regional variations. Using the consumption figures estimated above, we then explored correlations with beach litter composition.
3.2 Review of the International Coastal Clean-up data
One of the most comprehensive global data sets available for beach debris counts comes from the Ocean Conservancy, who every year use over 700,000 volunteers across 153 countries to count and categorise with a standardised data recording method, what they
31
find as part of their “International Coastal Clean-Up27” (ICC). The full dataset is available for 2015 and displays the top ten most common items found worldwide, with totals from each participating country.
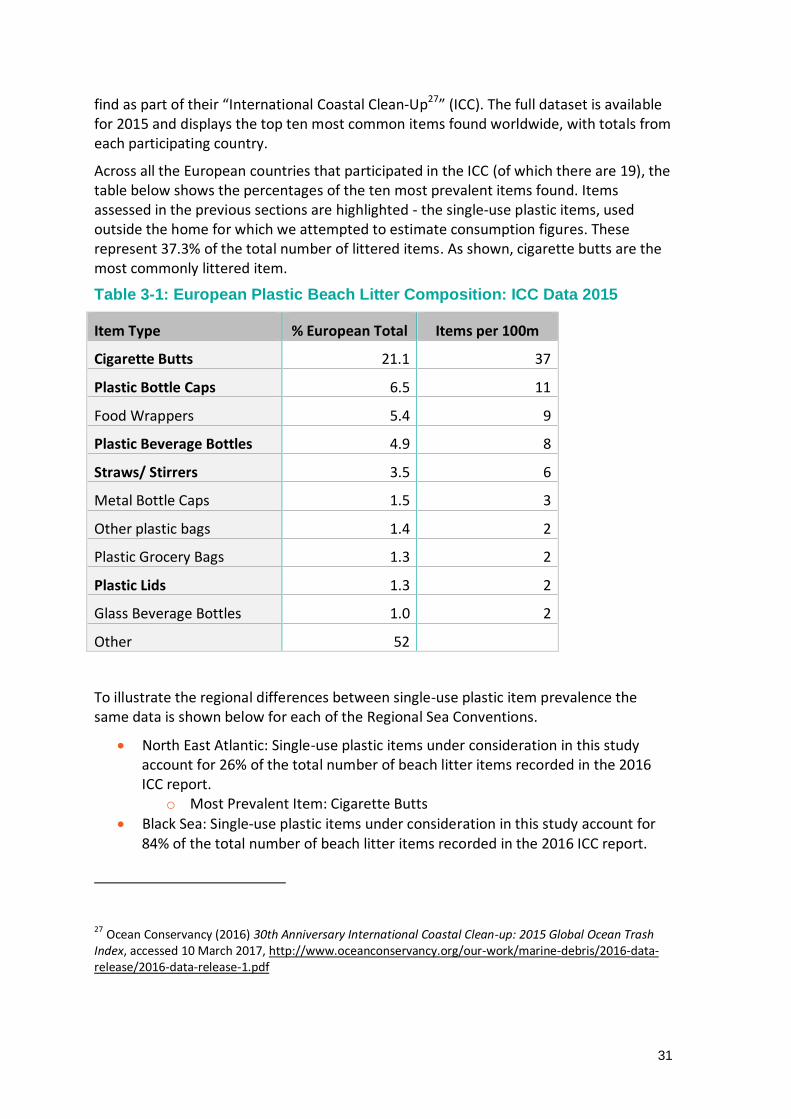
Across all the European countries that participated in the ICC (of which there are 19), the table below shows the percentages of the ten most prevalent items found. Items assessed in the previous sections are highlighted - the single-use plastic items, used outside the home for which we attempted to estimate consumption figures. These represent 37.3% of the total number of littered items. As shown, cigarette butts are the most commonly littered item.
Table 3-1: European Plastic Beach Litter Composition: ICC Data 2015
Item Type % European Total Items per 100m
Cigarette Butts 21.1 37
Plastic Bottle Caps 6.5 11
Food Wrappers 5.4 9
Plastic Beverage Bottles 4.9 8
Straws/ Stirrers 3.5 6
Metal Bottle Caps 1.5 3
Other plastic bags 1.4 2
Plastic Grocery Bags 1.3 2
Plastic Lids 1.3 2
Glass Beverage Bottles 1.0 2
Other 52
To illustrate the regional differences between single-use plastic item prevalence the same data is shown below for each of the Regional Sea Conventions.
North East Atlantic: Single-use plastic items under consideration in this study account for 26% of the total number of beach litter items recorded in the 2016 ICC report.
o Most Prevalent Item: Cigarette Butts
Black Sea: Single-use plastic items under consideration in this study account for 84% of the total number of beach litter items recorded in the 2016 ICC report.
27
Ocean Conservancy (2016) 30th Anniversary International Coastal Clean-up: 2015 Global Ocean Trash Index, accessed 10 March 2017, http://www.oceanconservancy.org/our-work/marine-debris/2016-data-release/2016-data-release-1.pdf
32
o Most Prevalent Item: Cigarette Butts
Mediterranean: Single-use plastic items under consideration in this study account for 43% of the total number of beach litter items recorded in the 2016 ICC report.
o Most Prevalent Item: Cigarette Butts
Baltic Sea: Single-use plastic items under consideration in this study account for 57% of the total number of beach litter items recorded in the 2016 ICC report.
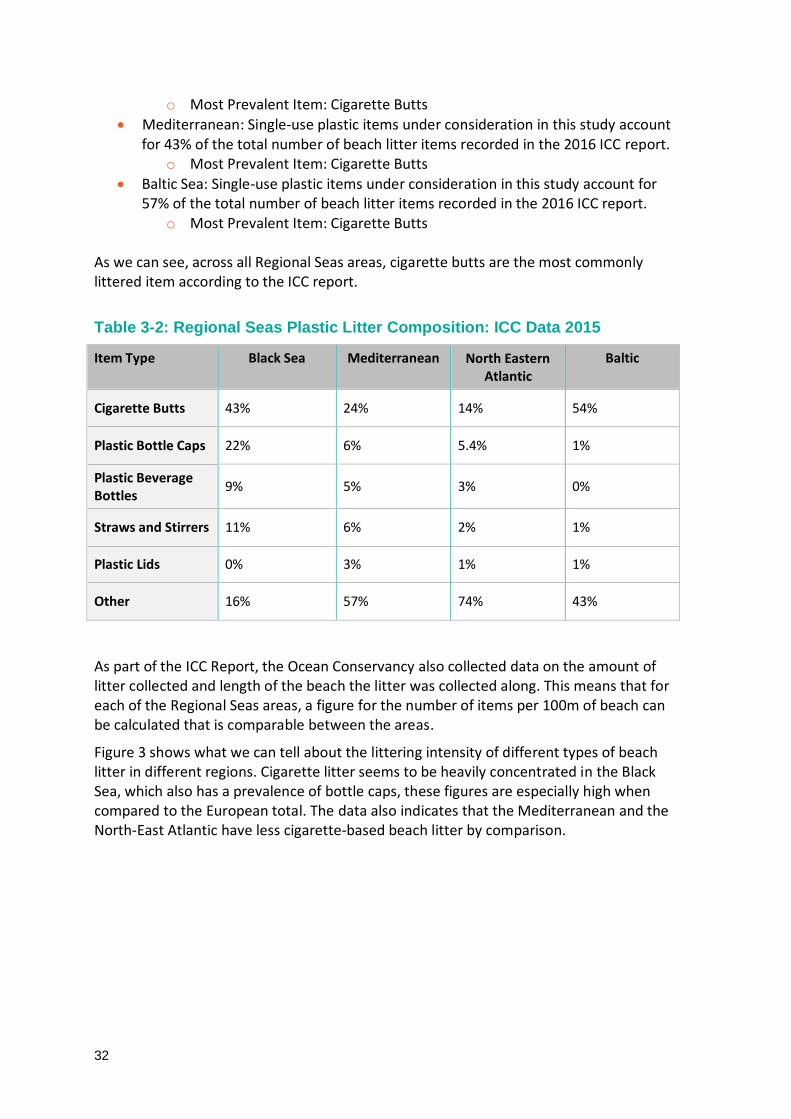
o Most Prevalent Item: Cigarette Butts As we can see, across all Regional Seas areas, cigarette butts are the most commonly littered item according to the ICC report.
Table 3-2: Regional Seas Plastic Litter Composition: ICC Data 2015
Item Type Black Sea Mediterranean North Eastern Atlantic
Baltic
Cigarette Butts 43% 24% 14% 54%
Plastic Bottle Caps 22% 6% 5.4% 1%
Plastic Beverage Bottles
9% 5% 3% 0%
Straws and Stirrers 11% 6% 2% 1%
Plastic Lids 0% 3% 1% 1%
Other 16% 57% 74% 43%
As part of the ICC Report, the Ocean Conservancy also collected data on the amount of litter collected and length of the beach the litter was collected along. This means that for each of the Regional Seas areas, a figure for the number of items per 100m of beach can be calculated that is comparable between the areas.
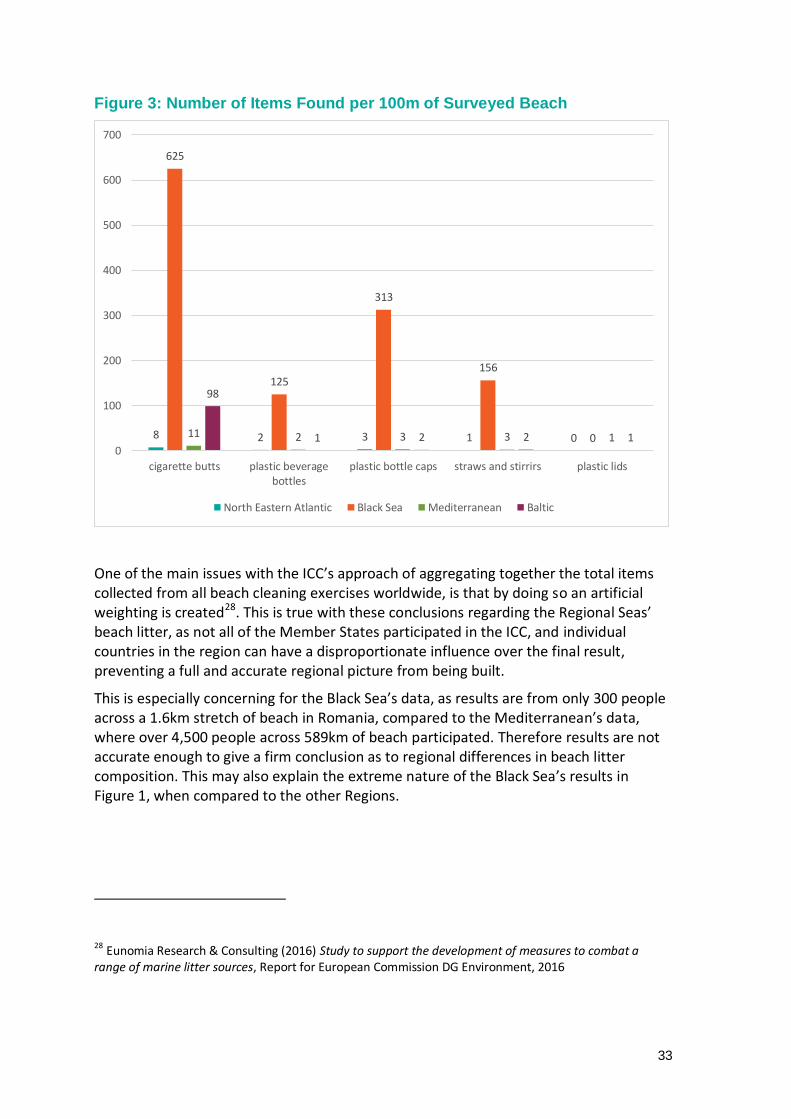
Figure 3 shows what we can tell about the littering intensity of different types of beach litter in different regions. Cigarette litter seems to be heavily concentrated in the Black Sea, which also has a prevalence of bottle caps, these figures are especially high when compared to the European total. The data also indicates that the Mediterranean and the North-East Atlantic have less cigarette-based beach litter by comparison.
33
Figure 3: Number of Items Found per 100m of Surveyed Beach
One of the main issues with the ICC’s approach of aggregating together the total items collected from all beach cleaning exercises worldwide, is that by doing so an artificial weighting is created28. This is true with these conclusions regarding the Regional Seas’ beach litter, as not all of the Member States participated in the ICC, and individual countries in the region can have a disproportionate influence over the final result, preventing a full and accurate regional picture from being built.
This is especially concerning for the Black Sea’s data, as results are from only 300 people across a 1.6km stretch of beach in Romania, compared to the Mediterranean’s data, where over 4,500 people across 589km of beach participated. Therefore results are not accurate enough to give a firm conclusion as to regional differences in beach litter composition. This may also explain the extreme nature of the Black Sea’s results in Figure 1, when compared to the other Regions.
28
Eunomia Research & Consulting (2016) Study to support the development of measures to combat a range of marine litter sources, Report for European Commission DG Environment, 2016
8 2 3 1 0
625
125
313
156
0 11 2 3 3 1
98
1 2 2 1 0
100
200
300
400
500
600
700
cigarette butts plastic beveragebottles
plastic bottle caps straws and stirrirs plastic lids
North Eastern Atlantic Black Sea Mediterranean Baltic
34
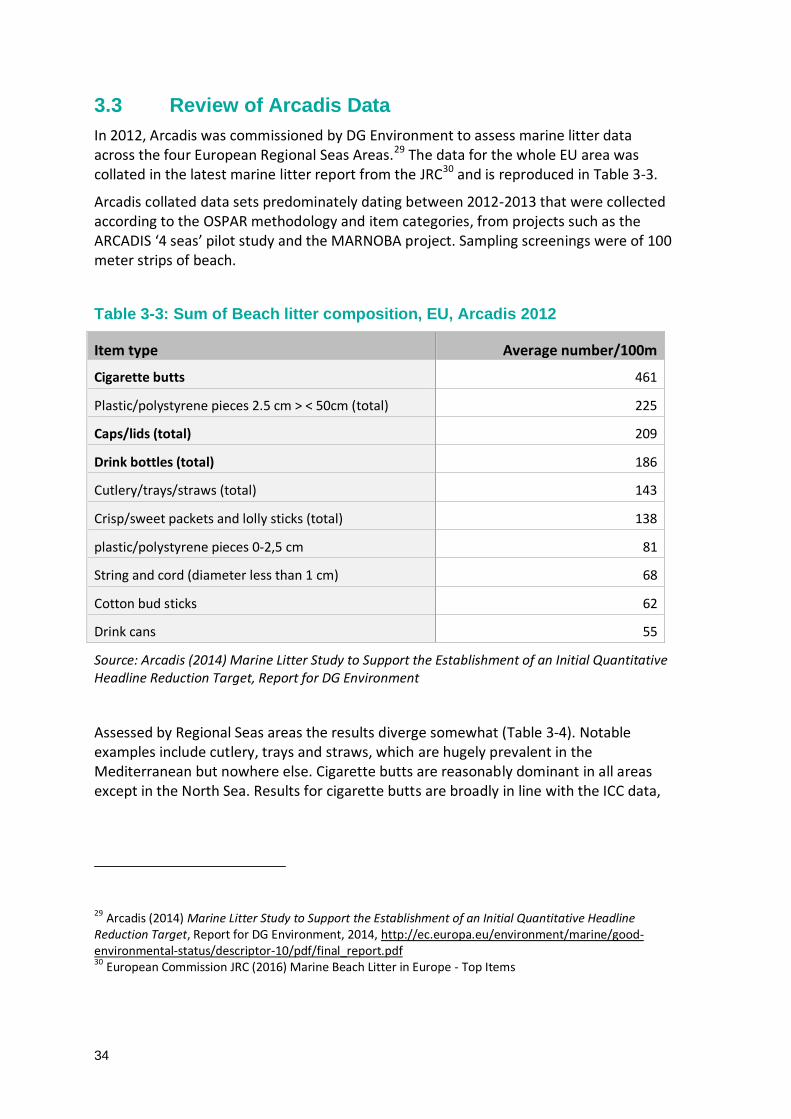
3.3 Review of Arcadis Data
In 2012, Arcadis was commissioned by DG Environment to assess marine litter data across the four European Regional Seas Areas.29 The data for the whole EU area was collated in the latest marine litter report from the JRC30 and is reproduced in Table 3-3.
Arcadis collated data sets predominately dating between 2012-2013 that were collected according to the OSPAR methodology and item categories, from projects such as the ARCADIS ‘4 seas’ pilot study and the MARNOBA project. Sampling screenings were of 100 meter strips of beach.
Table 3-3: Sum of Beach litter composition, EU, Arcadis 2012
Item type Average number/100m
Cigarette butts 461
Plastic/polystyrene pieces 2.5 cm > < 50cm (total) 225
Caps/lids (total) 209
Drink bottles (total) 186
Cutlery/trays/straws (total) 143
Crisp/sweet packets and lolly sticks (total) 138
plastic/polystyrene pieces 0-2,5 cm 81
String and cord (diameter less than 1 cm) 68
Cotton bud sticks 62
Drink cans 55
Source: Arcadis (2014) Marine Litter Study to Support the Establishment of an Initial Quantitative Headline Reduction Target, Report for DG Environment
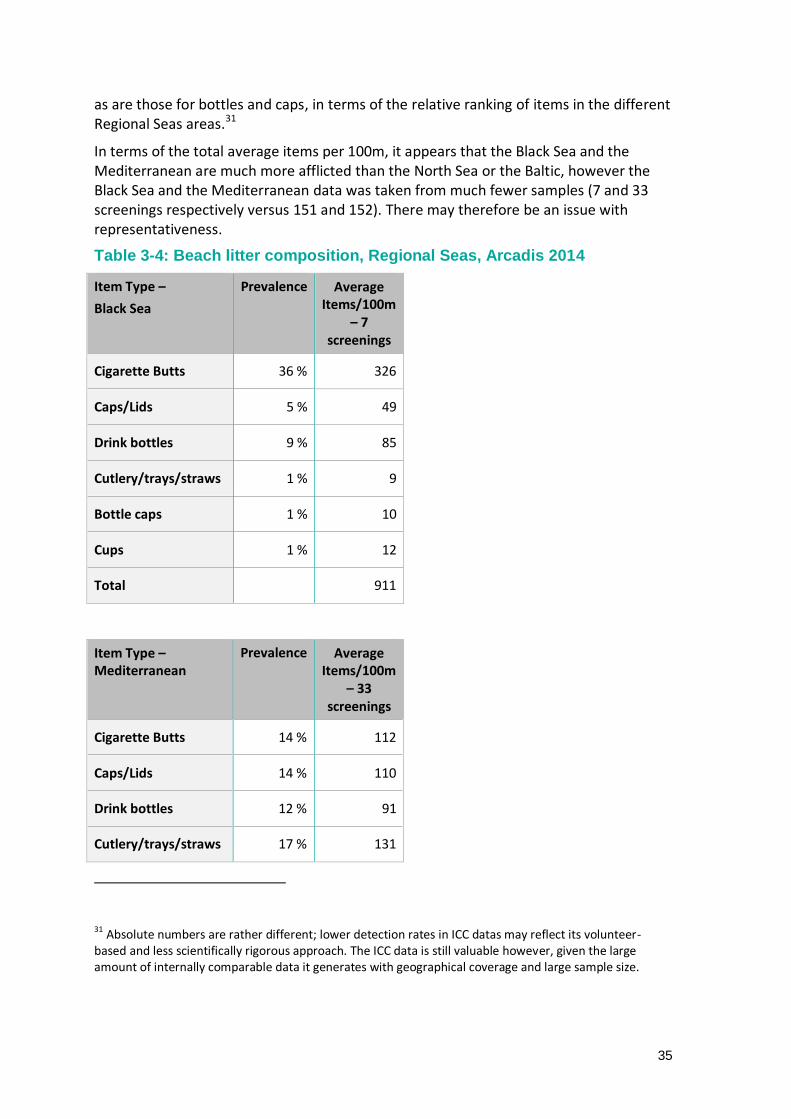
Assessed by Regional Seas areas the results diverge somewhat (Table 3-4). Notable examples include cutlery, trays and straws, which are hugely prevalent in the Mediterranean but nowhere else. Cigarette butts are reasonably dominant in all areas except in the North Sea. Results for cigarette butts are broadly in line with the ICC data,
29 Arcadis (2014) Marine Litter Study to Support the Establishment of an Initial Quantitative Headline Reduction Target, Report for DG Environment, 2014, http://ec.europa.eu/environment/marine/good-environmental-status/descriptor-10/pdf/final_report.pdf 30
European Commission JRC (2016) Marine Beach Litter in Europe - Top Items
35
as are those for bottles and caps, in terms of the relative ranking of items in the different Regional Seas areas.31
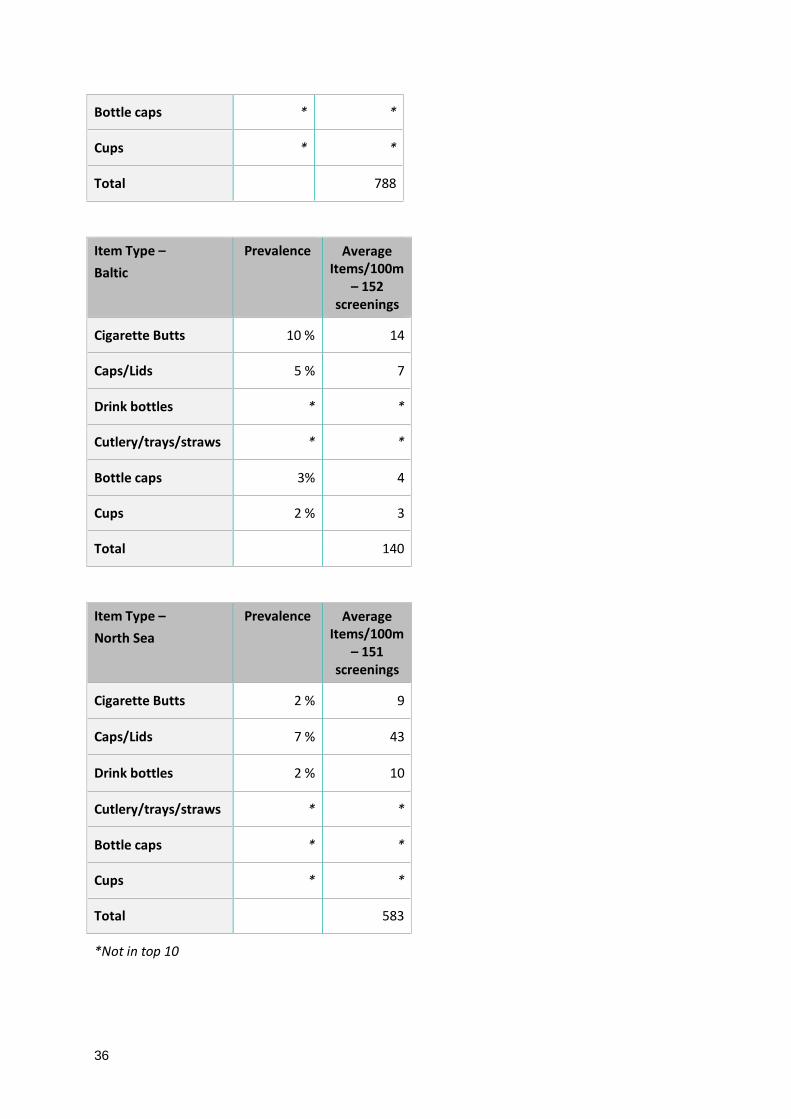
In terms of the total average items per 100m, it appears that the Black Sea and the Mediterranean are much more afflicted than the North Sea or the Baltic, however the Black Sea and the Mediterranean data was taken from much fewer samples (7 and 33 screenings respectively versus 151 and 152). There may therefore be an issue with representativeness.
Table 3-4: Beach litter composition, Regional Seas, Arcadis 2014
Item Type –
Black Sea
Prevalence Average Items/100m
– 7 screenings
Cigarette Butts 36 % 326
Caps/Lids 5 % 49
Drink bottles 9 % 85
Cutlery/trays/straws 1 % 9
Bottle caps 1 % 10
Cups 1 % 12
Total 911
Item Type – Mediterranean
Prevalence Average Items/100m
– 33 screenings
Cigarette Butts 14 % 112
Caps/Lids 14 % 110
Drink bottles 12 % 91
Cutlery/trays/straws 17 % 131
31
Absolute numbers are rather different; lower detection rates in ICC datas may reflect its volunteer-based and less scientifically rigorous approach. The ICC data is still valuable however, given the large amount of internally comparable data it generates with geographical coverage and large sample size.
36
Bottle caps * *
Cups * *
Total 788
Item Type –
Baltic
Prevalence Average Items/100m
– 152 screenings
Cigarette Butts 10 % 14
Caps/Lids 5 % 7
Drink bottles * *
Cutlery/trays/straws * *
Bottle caps 3% 4
Cups 2 % 3
Total 140
Item Type –
North Sea
Prevalence Average Items/100m
– 151 screenings
Cigarette Butts 2 % 9
Caps/Lids 7 % 43
Drink bottles 2 % 10
Cutlery/trays/straws * *
Bottle caps * *
Cups * *
Total 583
*Not in top 10
37
3.4 Review of Marine Litter Watch Data
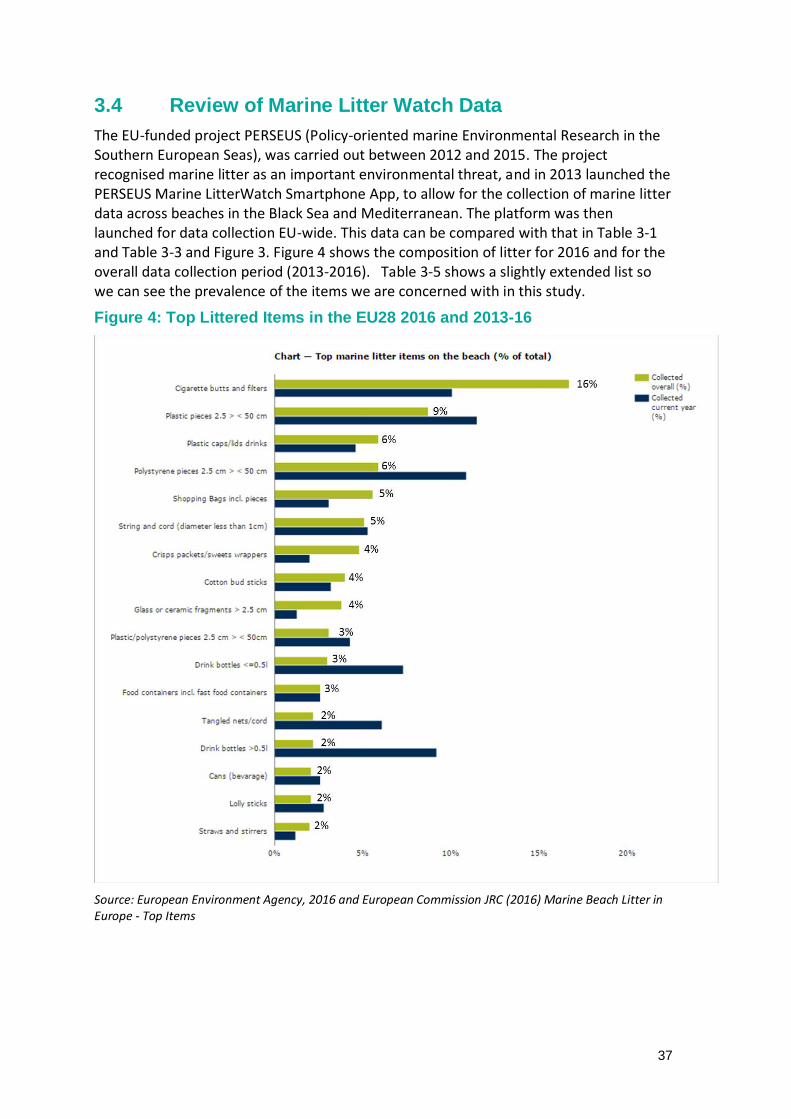
The EU-funded project PERSEUS (Policy-oriented marine Environmental Research in the Southern European Seas), was carried out between 2012 and 2015. The project recognised marine litter as an important environmental threat, and in 2013 launched the PERSEUS Marine LitterWatch Smartphone App, to allow for the collection of marine litter data across beaches in the Black Sea and Mediterranean. The platform was then launched for data collection EU-wide. This data can be compared with that in Table 3-1 and Table 3-3 and Figure 3. Figure 4 shows the composition of litter for 2016 and for the overall data collection period (2013-2016). Table 3-5 shows a slightly extended list so we can see the prevalence of the items we are concerned with in this study.
Figure 4: Top Littered Items in the EU28 2016 and 2013-16
Source: European Environment Agency, 2016 and European Commission JRC (2016) Marine Beach Litter in Europe - Top Items
38
Table 3-5 Top Littered Items in the EU28 2016 and 2013-16
Item label
%
Cigarette butts and filters 16.7
Plastic pieces 2.5 > < 50 cm 8.7
Polystyrene pieces 2.5 cm > < 50 cm 5.9
Plastic caps/lids drinks 5.9
Shopping Bags incl. pieces 5.6
String and cord (diameter less than 1cm)
5.1
Crisps packets/sweets wrappers 4.8
Cotton bud sticks 4
Glass or ceramic fragments > 2.5 cm 3.8
Plastic/polystyrene pieces 2.5 cm > < 50cm
3.1
Drink bottles <=0.5l 3
Food containers incl. fast food containers
2.6
Drink bottles >0.5l 2.2
Tangled nets/cord 2.2
Lolly sticks 2.1
Cans (beverage) 2.1
Straws and stirrers 2
Cups and cup lids 1.5
Source: European Environment Agency, 2016 and European Commission JRC (2016) Marine Beach Litter in Europe - Top Items
At a European level across the different methodologies, there are similarities in results of single use plastic items. Notably, cigarette litter is the most frequent form across the ICC, European Commission and Arcadis report. Plastic bottle caps and plastic bottles follow close behind.
In the following sections we review data on a region by region basis for the Regional Seas areas. For independently conducted beach monitoring studies, methods do vary – particularly with respect to categorisation of item types - which makes comparisons difficult at times. We will look at the individual efforts concerning beach litter across the Regional Seas below.
3.5 Regional Sea: North Eastern Atlantic
The OSPAR Commission was set up by the 1992 OSPAR Convention for the Protection of the Marine Environment of the North-East Atlantic, and a Regional Action Plan for the Prevention and Management of Marine Litter in the North-East Atlantic was produced. Included in this Regional Action Plan was to a commitment to monitor beaches across the Member States to assess the impact of marine litter. They established guidelines to ensure countries can participate with standardised methodology and results are
39
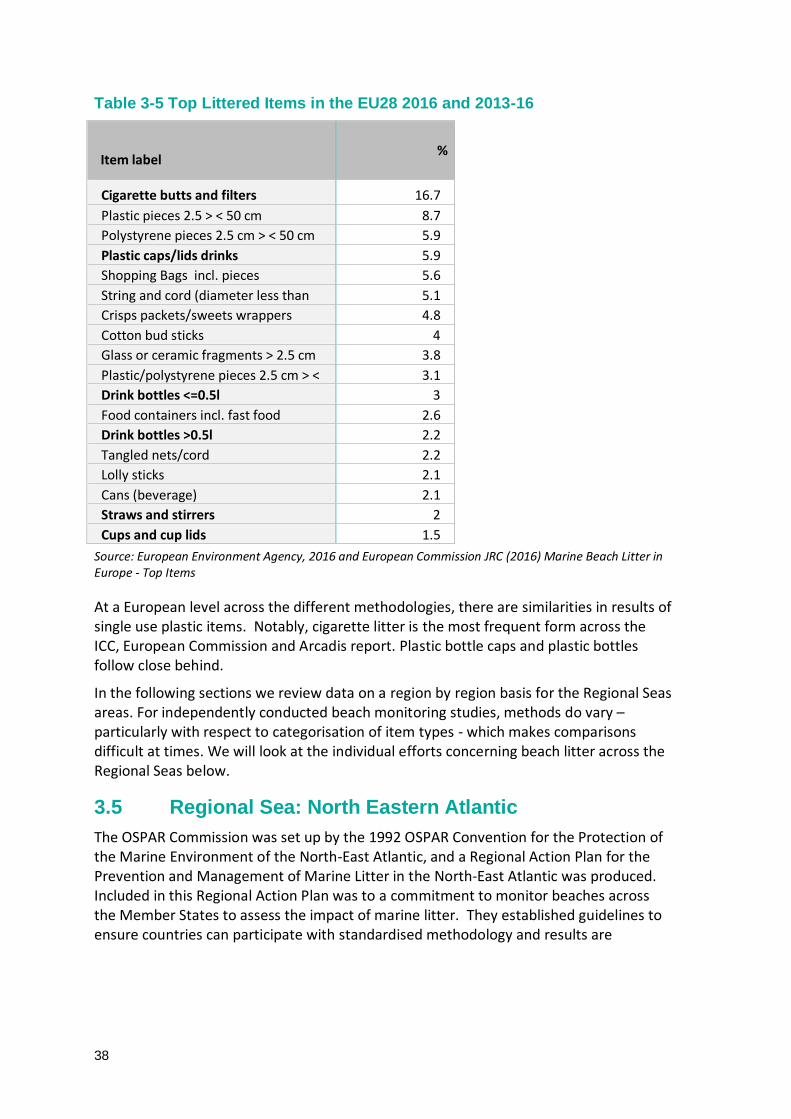
comparable32. Their 2015 beach surveys indicate that plastic makes up nearly 80% of beach litter in the North Eastern Atlantic 33, as shown in Figure 5.
Figure 5: Material Types of Beach Litter
Source: Ospar
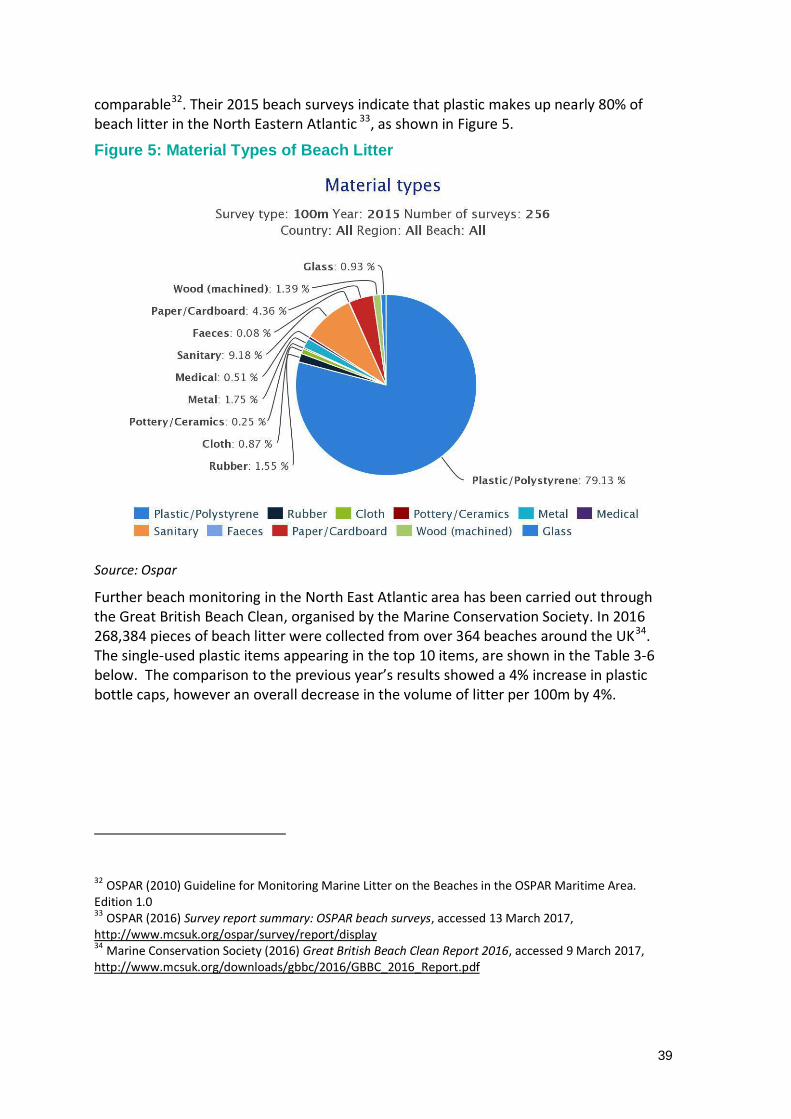
Further beach monitoring in the North East Atlantic area has been carried out through the Great British Beach Clean, organised by the Marine Conservation Society. In 2016 268,384 pieces of beach litter were collected from over 364 beaches around the UK34. The single-used plastic items appearing in the top 10 items, are shown in the Table 3-6 below. The comparison to the previous year’s results showed a 4% increase in plastic bottle caps, however an overall decrease in the volume of litter per 100m by 4%.
32
OSPAR (2010) Guideline for Monitoring Marine Litter on the Beaches in the OSPAR Maritime Area. Edition 1.0 33 OSPAR (2016) Survey report summary: OSPAR beach surveys, accessed 13 March 2017, http://www.mcsuk.org/ospar/survey/report/display 34
Marine Conservation Society (2016) Great British Beach Clean Report 2016, accessed 9 March 2017, http://www.mcsuk.org/downloads/gbbc/2016/GBBC_2016_Report.pdf
40
Table 3-6: Single-Use Plastic Items Collected during the 2016 Great British Beach Clean
Source: Marine Conservation Society, 2016
When we compare the figures in Table 3-6 with those for the North Eastern Atlantic from the ICC (Figure 3), the Great British Beach Clean results are much greater. This could be due to the latter’s larger sample size, or the fact that the ICC method scores fewer categories of items (e.g. it doesn’t score plastic fragments). The ICC North Eastern Atlantic results include other countries than the UK, meaning results are not truly comparable.
3.6 Regional Sea: Black Sea
There are few sources of data regarding beach litter composition in the Black Sea area; the data from Arcadis and the ICC is the most detailed. In the one other study available, beverage packaging was found to constitute 19% of items.35
3.7 Regional Sea: Baltic Sea
35
Topçu, E.N., Tonay, A.M., Dede, A., Öztürk, A.A., and Öztürk, B. (2013) Origin and abundance of marine litter along sandy beaches of the Turkish Western Black Sea Coast, Marine Environmental Research, Vol.85, pp.21–28
Item Amount (items/100m) % of total items (UK average)
Plastic/ Polystyrene pieces (0-50cm)
204.4 31.5
Cigarette Stubs 49.2 7.6
Packets 43.9 6.8
Caps and lids 35.3 5.4
String/Cord 27.0 4.2
Cotton bud sticks 23.7 3.7
Glass 23.3 3.6
Wet Wipes 14.1 2.2
Fishing line 12.9 2
Plastic drinks bottles 12.5 1.9
41
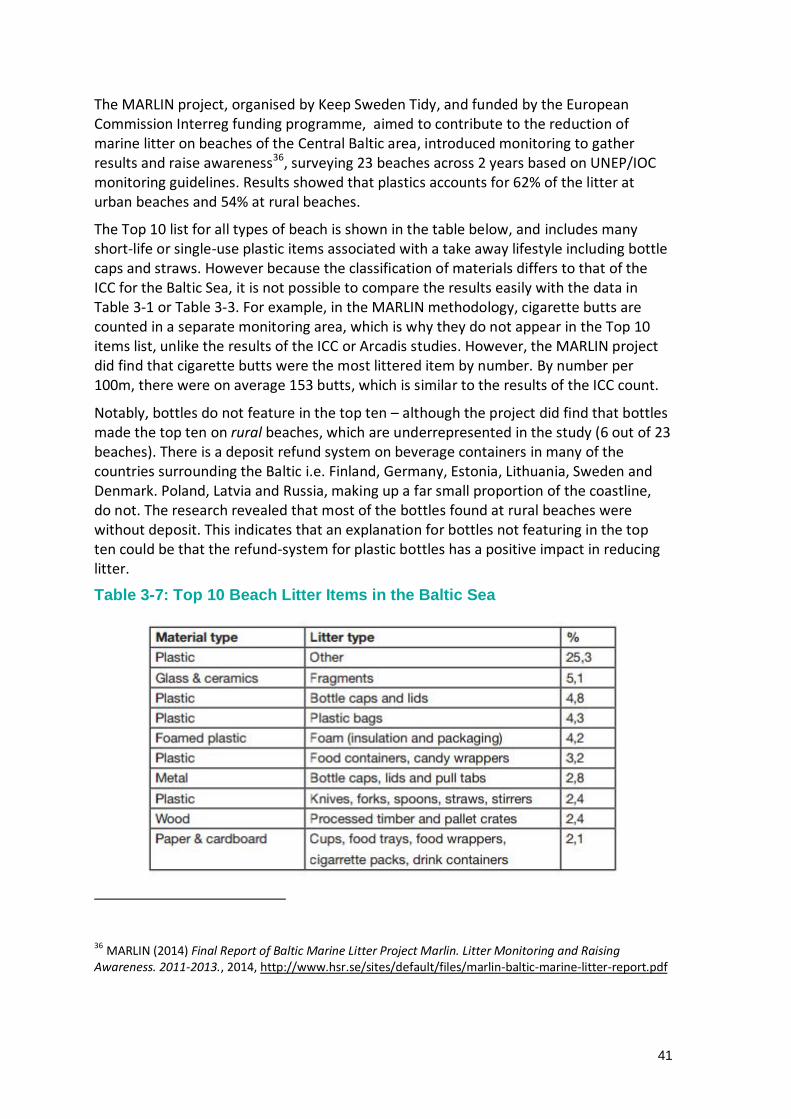
The MARLIN project, organised by Keep Sweden Tidy, and funded by the European Commission Interreg funding programme, aimed to contribute to the reduction of marine litter on beaches of the Central Baltic area, introduced monitoring to gather results and raise awareness36, surveying 23 beaches across 2 years based on UNEP/IOC monitoring guidelines. Results showed that plastics accounts for 62% of the litter at urban beaches and 54% at rural beaches.
The Top 10 list for all types of beach is shown in the table below, and includes many short-life or single-use plastic items associated with a take away lifestyle including bottle caps and straws. However because the classification of materials differs to that of the ICC for the Baltic Sea, it is not possible to compare the results easily with the data in Table 3-1 or Table 3-3. For example, in the MARLIN methodology, cigarette butts are counted in a separate monitoring area, which is why they do not appear in the Top 10 items list, unlike the results of the ICC or Arcadis studies. However, the MARLIN project did find that cigarette butts were the most littered item by number. By number per 100m, there were on average 153 butts, which is similar to the results of the ICC count.
Notably, bottles do not feature in the top ten – although the project did find that bottles made the top ten on rural beaches, which are underrepresented in the study (6 out of 23 beaches). There is a deposit refund system on beverage containers in many of the countries surrounding the Baltic i.e. Finland, Germany, Estonia, Lithuania, Sweden and Denmark. Poland, Latvia and Russia, making up a far small proportion of the coastline, do not. The research revealed that most of the bottles found at rural beaches were without deposit. This indicates that an explanation for bottles not featuring in the top ten could be that the refund-system for plastic bottles has a positive impact in reducing litter.
Table 3-7: Top 10 Beach Litter Items in the Baltic Sea
36
MARLIN (2014) Final Report of Baltic Marine Litter Project Marlin. Litter Monitoring and Raising Awareness. 2011-2013., 2014, http://www.hsr.se/sites/default/files/marlin-baltic-marine-litter-report.pdf
42
Source: MARLIN Project: Final Report 2014
3.8 Regional Sea: Mediterranean
The data from the ICC in Table 3-2 and Figure 3, did not represent Italy, a large contracting party to the Barcelona Convention, the regional seas convention adopted in 1976 to prevent and abate pollution in the Mediterranean Sea and improve the marine environment. This reduces the representativeness of the data for the region as a whole. Data used by the Mediterranean Regional Sea area and provided to the JRC for their recent summary of top ten items derives from the ICC data.
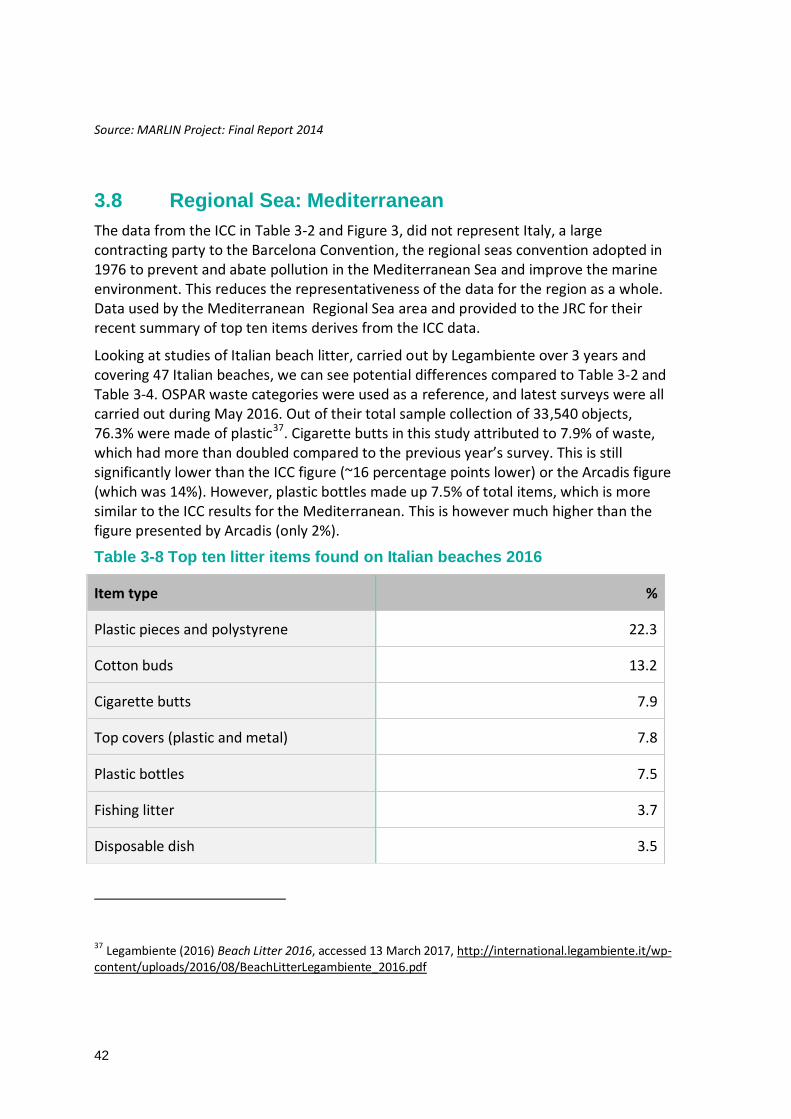
Looking at studies of Italian beach litter, carried out by Legambiente over 3 years and covering 47 Italian beaches, we can see potential differences compared to Table 3-2 and Table 3-4. OSPAR waste categories were used as a reference, and latest surveys were all carried out during May 2016. Out of their total sample collection of 33,540 objects, 76.3% were made of plastic37. Cigarette butts in this study attributed to 7.9% of waste, which had more than doubled compared to the previous year’s survey. This is still significantly lower than the ICC figure (~16 percentage points lower) or the Arcadis figure (which was 14%). However, plastic bottles made up 7.5% of total items, which is more similar to the ICC results for the Mediterranean. This is however much higher than the figure presented by Arcadis (only 2%).
Table 3-8 Top ten litter items found on Italian beaches 2016
Item type %
Plastic pieces and polystyrene 22.3
Cotton buds 13.2
Cigarette butts 7.9
Top covers (plastic and metal) 7.8
Plastic bottles 7.5
Fishing litter 3.7
Disposable dish 3.5
37
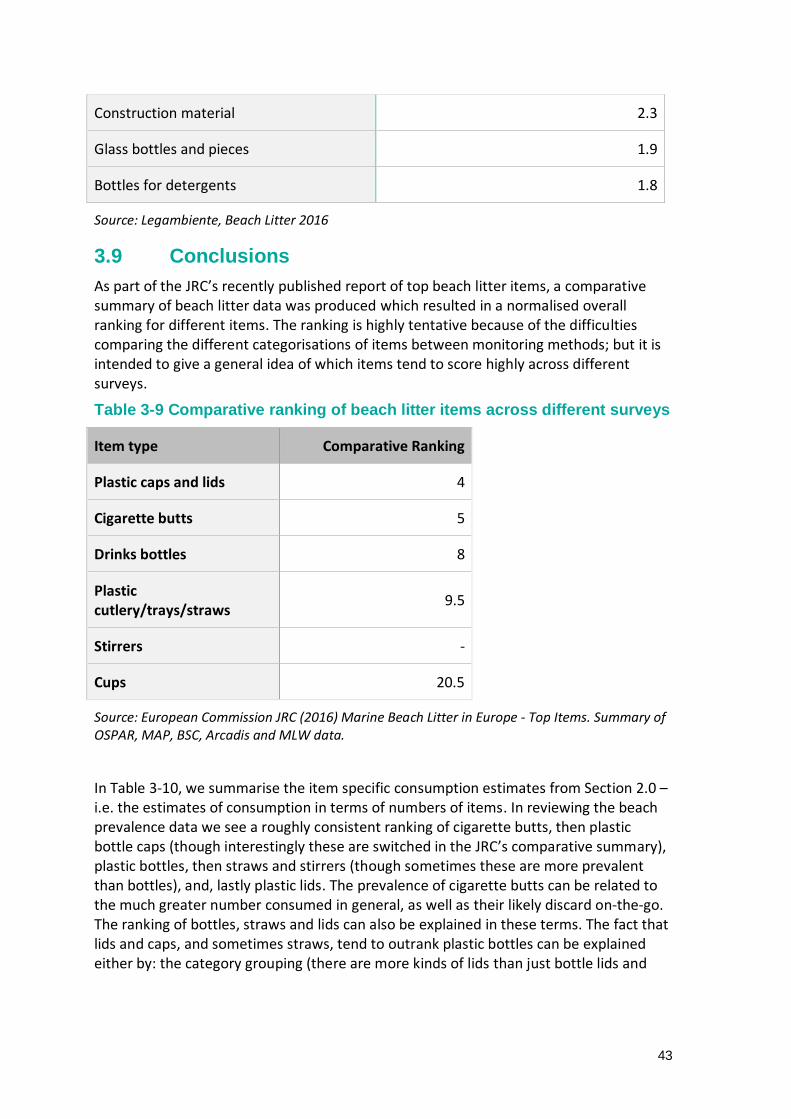
Legambiente (2016) Beach Litter 2016, accessed 13 March 2017, http://international.legambiente.it/wp-content/uploads/2016/08/BeachLitterLegambiente_2016.pdf
43
Construction material 2.3
Glass bottles and pieces 1.9
Bottles for detergents 1.8
Source: Legambiente, Beach Litter 2016
3.9 Conclusions
As part of the JRC’s recently published report of top beach litter items, a comparative summary of beach litter data was produced which resulted in a normalised overall ranking for different items. The ranking is highly tentative because of the difficulties comparing the different categorisations of items between monitoring methods; but it is intended to give a general idea of which items tend to score highly across different surveys.
Table 3-9 Comparative ranking of beach litter items across different surveys
Item type Comparative Ranking
Plastic caps and lids 4
Cigarette butts 5
Drinks bottles 8
Plastic cutlery/trays/straws
9.5
Stirrers -
Cups 20.5
Source: European Commission JRC (2016) Marine Beach Litter in Europe - Top Items. Summary of OSPAR, MAP, BSC, Arcadis and MLW data.
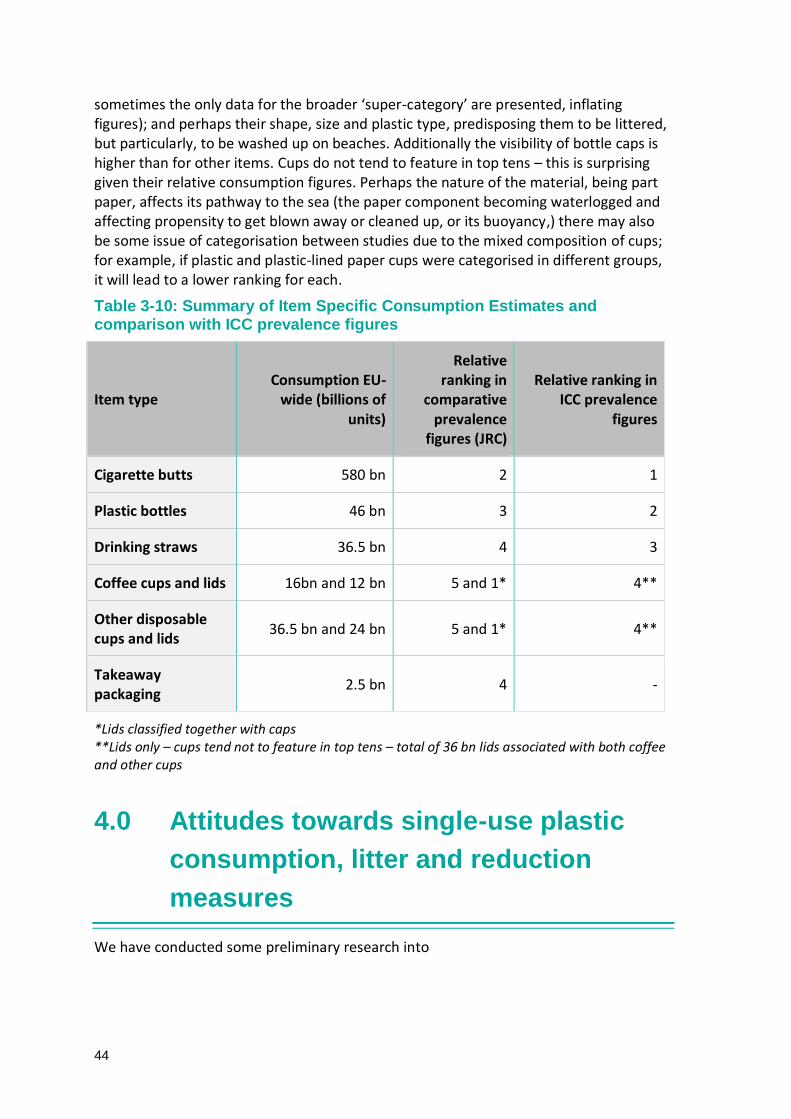
In Table 3-10, we summarise the item specific consumption estimates from Section 2.0 – i.e. the estimates of consumption in terms of numbers of items. In reviewing the beach prevalence data we see a roughly consistent ranking of cigarette butts, then plastic bottle caps (though interestingly these are switched in the JRC’s comparative summary), plastic bottles, then straws and stirrers (though sometimes these are more prevalent than bottles), and, lastly plastic lids. The prevalence of cigarette butts can be related to the much greater number consumed in general, as well as their likely discard on-the-go. The ranking of bottles, straws and lids can also be explained in these terms. The fact that lids and caps, and sometimes straws, tend to outrank plastic bottles can be explained either by: the category grouping (there are more kinds of lids than just bottle lids and
44
sometimes the only data for the broader ‘super-category’ are presented, inflating figures); and perhaps their shape, size and plastic type, predisposing them to be littered, but particularly, to be washed up on beaches. Additionally the visibility of bottle caps is higher than for other items. Cups do not tend to feature in top tens – this is surprising given their relative consumption figures. Perhaps the nature of the material, being part paper, affects its pathway to the sea (the paper component becoming waterlogged and affecting propensity to get blown away or cleaned up, or its buoyancy,) there may also be some issue of categorisation between studies due to the mixed composition of cups; for example, if plastic and plastic-lined paper cups were categorised in different groups, it will lead to a lower ranking for each.
Table 3-10: Summary of Item Specific Consumption Estimates and comparison with ICC prevalence figures
Item type Consumption EU-
wide (billions of units)
Relative ranking in
comparative prevalence
figures (JRC)
Relative ranking in ICC prevalence
figures
Cigarette butts 580 bn 2 1
Plastic bottles 46 bn 3 2
Drinking straws 36.5 bn 4 3
Coffee cups and lids 16bn and 12 bn 5 and 1* 4**
Other disposable cups and lids
36.5 bn and 24 bn 5 and 1* 4**
Takeaway packaging
2.5 bn 4 -
*Lids classified together with caps **Lids only – cups tend not to feature in top tens – total of 36 bn lids associated with both coffee and other cups
4.0 Attitudes towards single-use plastic
consumption, litter and reduction
measures
We have conducted some preliminary research into
45
Public perceptions of litter, including cigarette litter
Public attitudes towards consumption of plastic
The relationship between waste management and people’s perception of the consumption of single-use plastic items
Public attitudes towards different litter reduction measures, including deposit return schemes
The effect of deposit return systems on the quality of material streams.
We were unable to find information with respect to:
Littering rates in (many) different EU countries and social norms in different countries with respect to littering
Behaviour change in response to litter reduction measures in different countries The research conducted is summarised below.
4.1 Public Attitude towards Litter and its Prevention
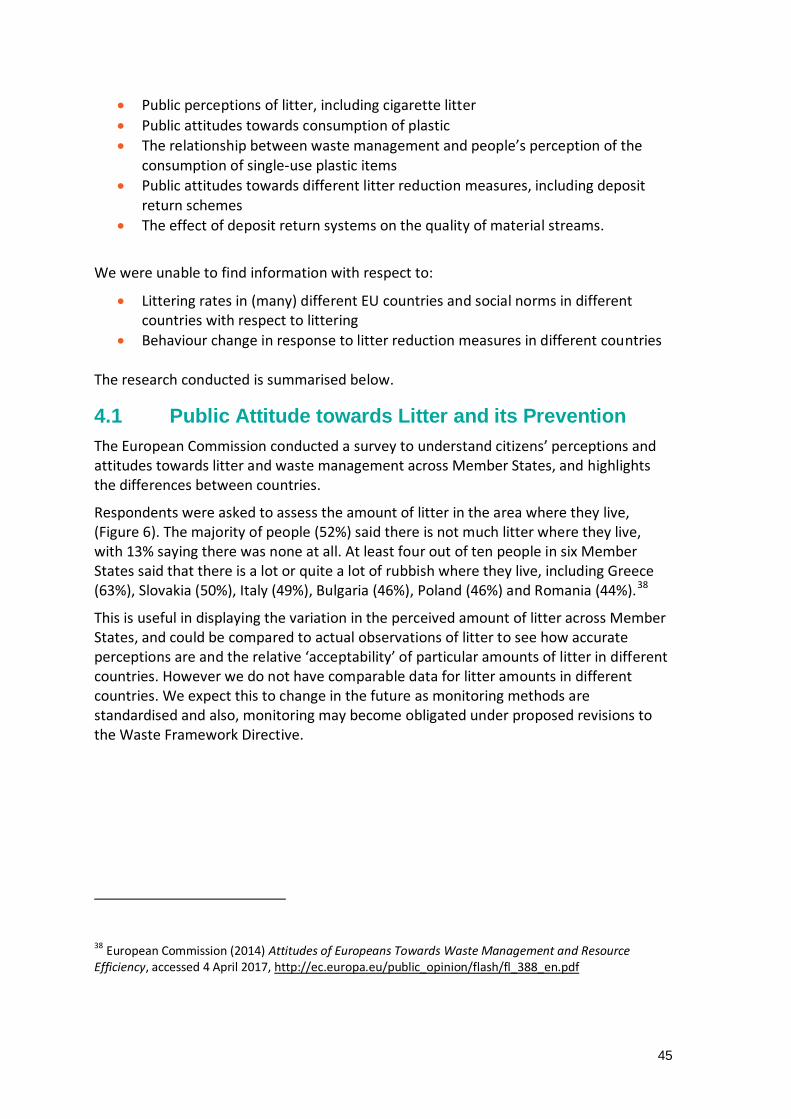
The European Commission conducted a survey to understand citizens’ perceptions and attitudes towards litter and waste management across Member States, and highlights the differences between countries.
Respondents were asked to assess the amount of litter in the area where they live, (Figure 6). The majority of people (52%) said there is not much litter where they live, with 13% saying there was none at all. At least four out of ten people in six Member States said that there is a lot or quite a lot of rubbish where they live, including Greece (63%), Slovakia (50%), Italy (49%), Bulgaria (46%), Poland (46%) and Romania (44%).38
This is useful in displaying the variation in the perceived amount of litter across Member States, and could be compared to actual observations of litter to see how accurate perceptions are and the relative ‘acceptability’ of particular amounts of litter in different countries. However we do not have comparable data for litter amounts in different countries. We expect this to change in the future as monitoring methods are standardised and also, monitoring may become obligated under proposed revisions to the Waste Framework Directive.
38
European Commission (2014) Attitudes of Europeans Towards Waste Management and Resource Efficiency, accessed 4 April 2017, http://ec.europa.eu/public_opinion/flash/fl_388_en.pdf
46
Figure 6: Assessment of Litter in Respondents’ Areas
Source: European Commission, 2014
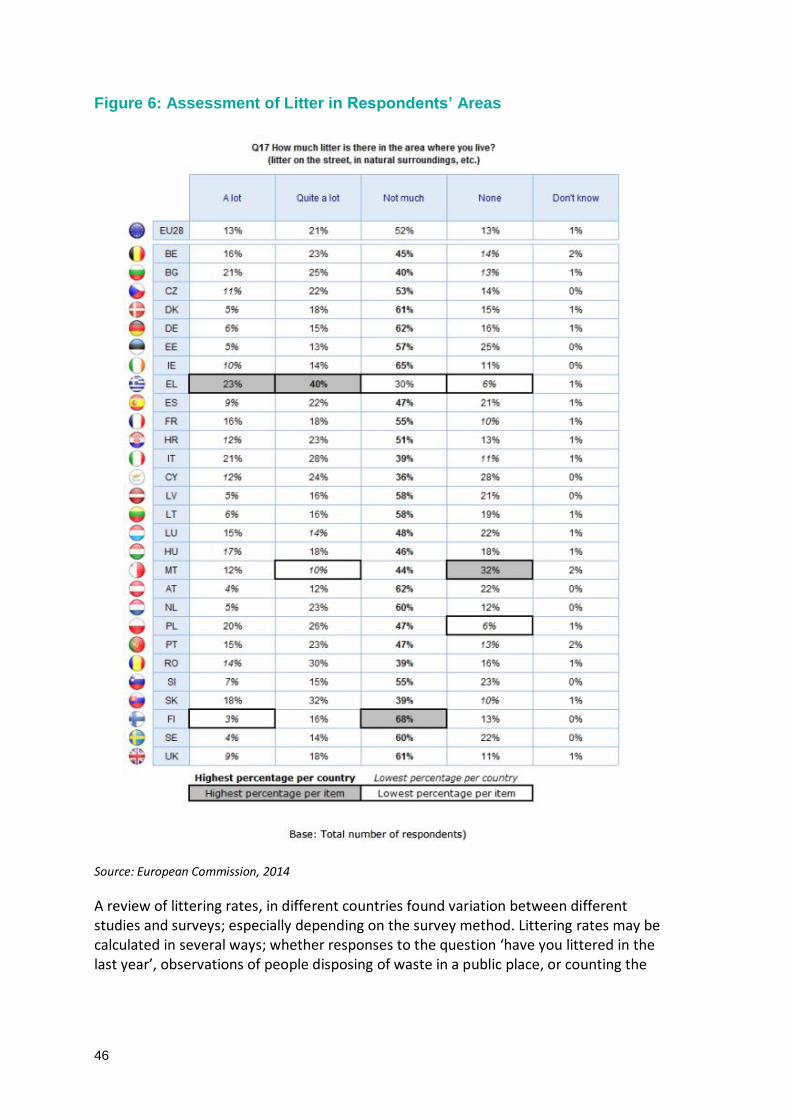
A review of littering rates, in different countries found variation between different studies and surveys; especially depending on the survey method. Littering rates may be calculated in several ways; whether responses to the question ‘have you littered in the last year’, observations of people disposing of waste in a public place, or counting the
47
number of items on the floor versus in the bin in a public place, accumulating within a specific time frame.39 The general range falls however within between 20-50% and we note with interest that despite the reputation for cleanliness, the littering rate in Switzerland that can be inferred from the proportion of litter found on the floor versus in the bin from a study in Winterthur, is within this range. It is often stated that it is not possible to distinguish between low littering rates and effective cleaning regimes without proper enquiry. We are unable to find littering rates from other European countries.
Country Littering rate Method Reference
Scotland 54% ever
46% occasionally Self-reported; survey
Keep Scotland Beautiful (2007)
Wales 50% in last year Self-reported; survey Keep Wales Tidy (2010)
Great Britain 48% Self-reported; survey ENCAMS (2007)
England 20% Self-reported; survey Lewis et al (2009)
England 20% from car in last 6
months
7% from car in last day
Self-reported; survey Keep Britain Tidy (2009)
Switzerland 33% Ground litter versus bin litter
https://stadt.winterthur.ch40
Singapore 36% Self-reported; survey Singapore National Environment Agency
US 40-50% Self-reported; survey Alice Ferguson Foundation (2011)
US 17% Observation of disposal actions
Keep America Beautiful (2009)
Australia 23% Observation of disposal actions
Curnow et al (1997)
Australia 35% Observation of disposal actions
Sustainability Victoria (2010)
New Zealand 20% Observation of disposal actions
Sibley et al (2003)
Source: Brook Lyndhurst (2013) Rapid Evidence Review of Littering Behaviour and Anti-Litter Policies
The attitudes towards the prevention of plastic consumption and its associated waste were also estimated within the European Commission survey.
39
Brook Lyndhurst (2013) Rapid Evidence Review of Littering Behaviour and Anti-Litter Policies, Report for Zero Waste Scotland, 2013, http://www.zerowastescotland.org.uk/sites/files/zws/Rapid%20Evidence%20Review%20of%20Littering%20Behaviour%20and%20Anti-Litter%20Policies.pdf 40
https://stadt.winterthur.ch/themen/leben-in-winterthur/abfall/fuer-eine-saubere-stadt/littering
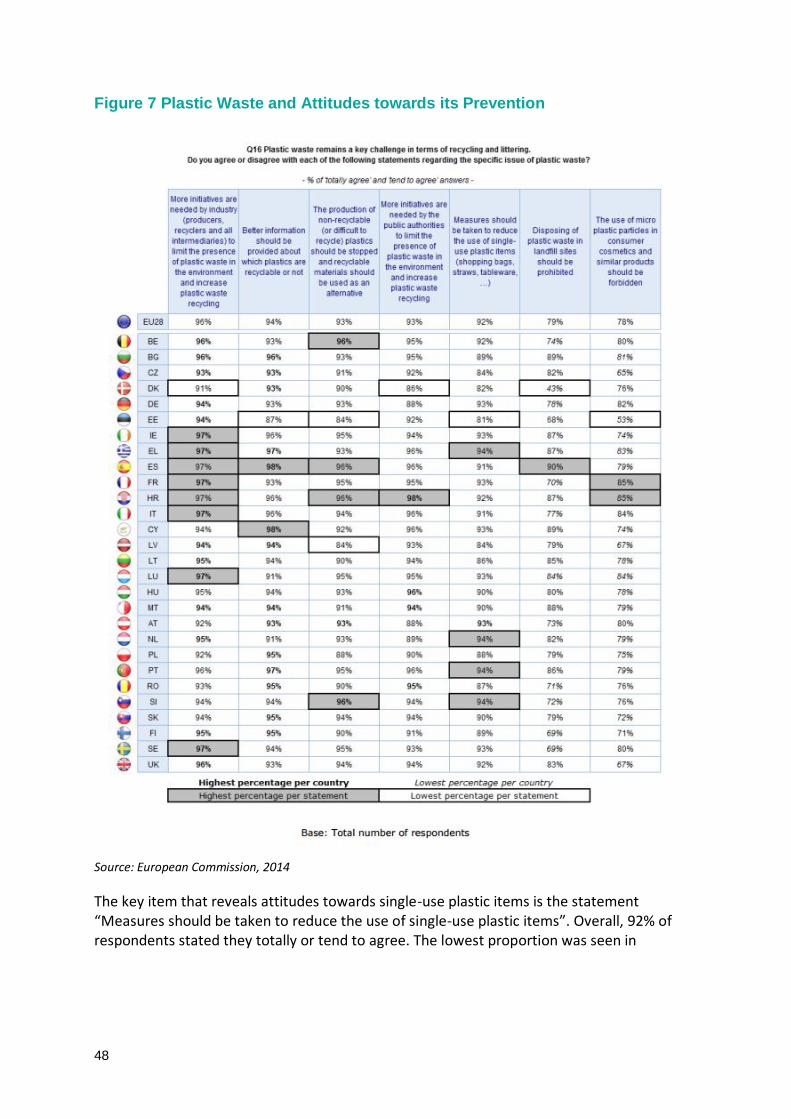
48
Figure 7 Plastic Waste and Attitudes towards its Prevention
Source: European Commission, 2014
The key item that reveals attitudes towards single-use plastic items is the statement “Measures should be taken to reduce the use of single-use plastic items”. Overall, 92% of respondents stated they totally or tend to agree. The lowest proportion was seen in
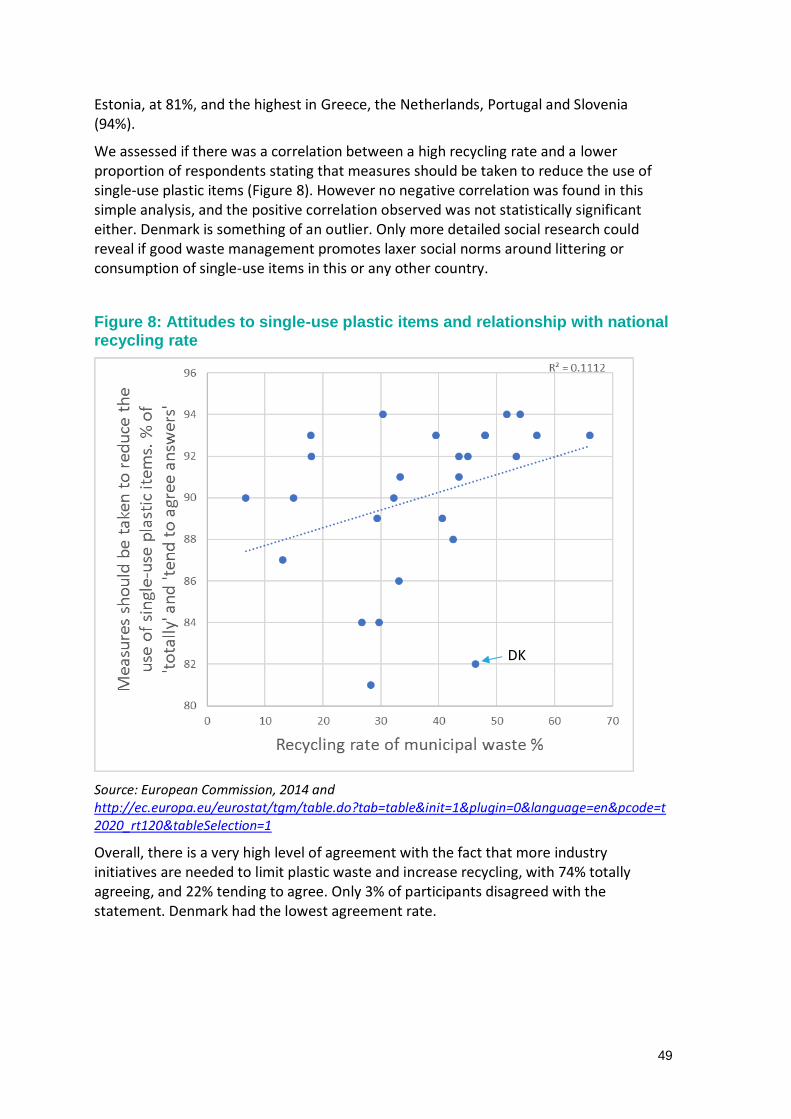
49
Estonia, at 81%, and the highest in Greece, the Netherlands, Portugal and Slovenia (94%).
We assessed if there was a correlation between a high recycling rate and a lower proportion of respondents stating that measures should be taken to reduce the use of single-use plastic items (Figure 8). However no negative correlation was found in this simple analysis, and the positive correlation observed was not statistically significant either. Denmark is something of an outlier. Only more detailed social research could reveal if good waste management promotes laxer social norms around littering or consumption of single-use items in this or any other country.
Figure 8: Attitudes to single-use plastic items and relationship with national recycling rate
Source: European Commission, 2014 and http://ec.europa.eu/eurostat/tgm/table.do?tab=table&init=1&plugin=0&language=en&pcode=t2020_rt120&tableSelection=1
Overall, there is a very high level of agreement with the fact that more industry initiatives are needed to limit plastic waste and increase recycling, with 74% totally agreeing, and 22% tending to agree. Only 3% of participants disagreed with the statement. Denmark had the lowest agreement rate.
DK
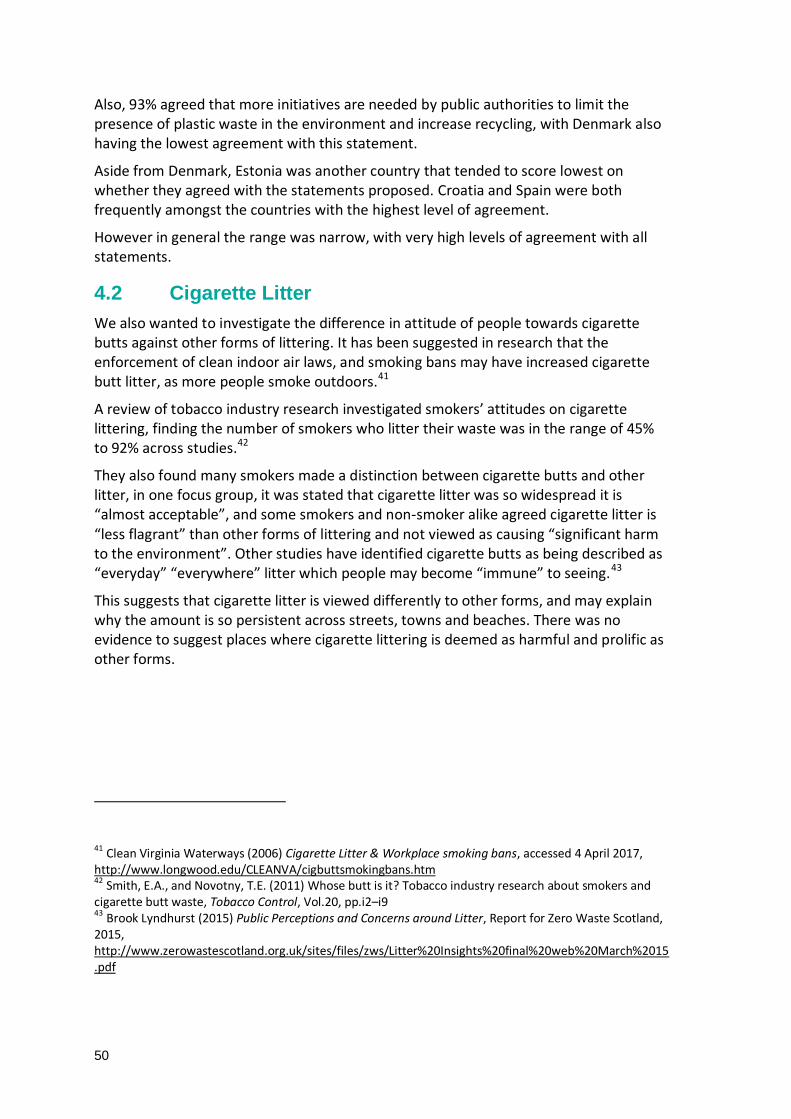
50
Also, 93% agreed that more initiatives are needed by public authorities to limit the presence of plastic waste in the environment and increase recycling, with Denmark also having the lowest agreement with this statement.
Aside from Denmark, Estonia was another country that tended to score lowest on whether they agreed with the statements proposed. Croatia and Spain were both frequently amongst the countries with the highest level of agreement.
However in general the range was narrow, with very high levels of agreement with all statements.
4.2 Cigarette Litter
We also wanted to investigate the difference in attitude of people towards cigarette butts against other forms of littering. It has been suggested in research that the enforcement of clean indoor air laws, and smoking bans may have increased cigarette butt litter, as more people smoke outdoors.41
A review of tobacco industry research investigated smokers’ attitudes on cigarette littering, finding the number of smokers who litter their waste was in the range of 45% to 92% across studies.42
They also found many smokers made a distinction between cigarette butts and other litter, in one focus group, it was stated that cigarette litter was so widespread it is “almost acceptable”, and some smokers and non-smoker alike agreed cigarette litter is “less flagrant” than other forms of littering and not viewed as causing “significant harm to the environment”. Other studies have identified cigarette butts as being described as “everyday” “everywhere” litter which people may become “immune” to seeing.43
This suggests that cigarette litter is viewed differently to other forms, and may explain why the amount is so persistent across streets, towns and beaches. There was no evidence to suggest places where cigarette littering is deemed as harmful and prolific as other forms.
41 Clean Virginia Waterways (2006) Cigarette Litter & Workplace smoking bans, accessed 4 April 2017, http://www.longwood.edu/CLEANVA/cigbuttsmokingbans.htm 42
Smith, E.A., and Novotny, T.E. (2011) Whose butt is it? Tobacco industry research about smokers and cigarette butt waste, Tobacco Control, Vol.20, pp.i2–i9 43 Brook Lyndhurst (2015) Public Perceptions and Concerns around Litter, Report for Zero Waste Scotland, 2015, http://www.zerowastescotland.org.uk/sites/files/zws/Litter%20Insights%20final%20web%20March%2015.pdf
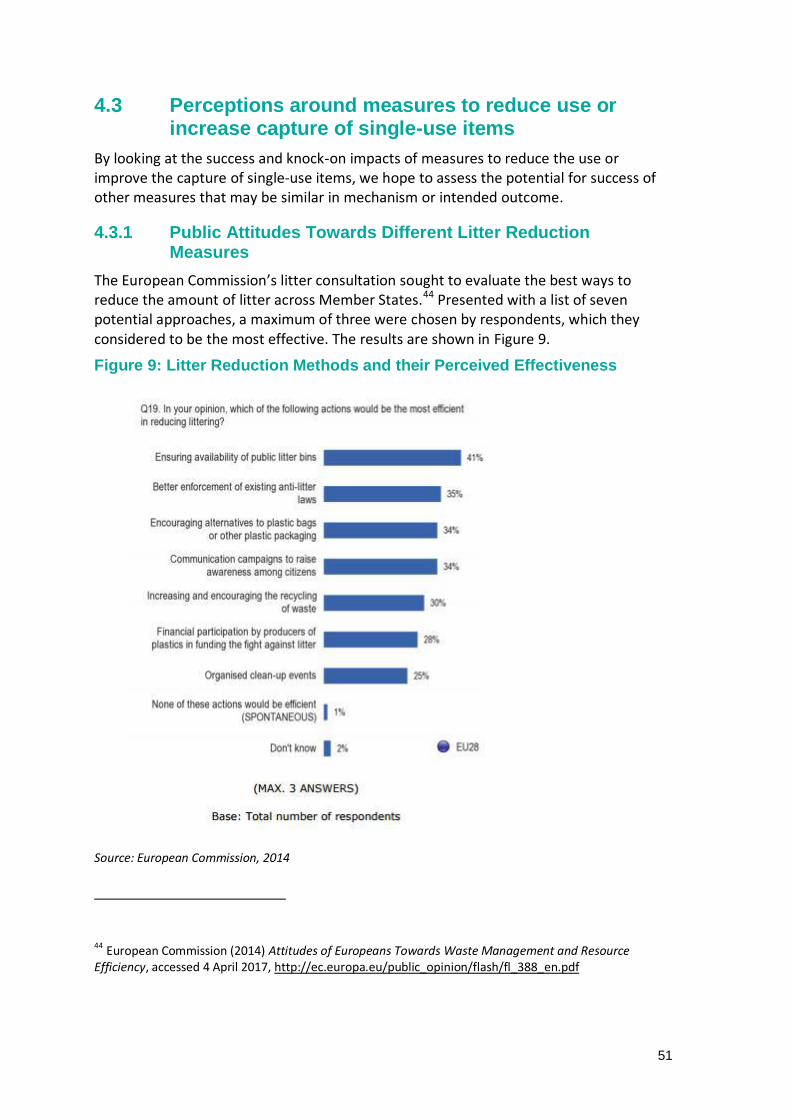
51
4.3 Perceptions around measures to reduce use or increase capture of single-use items
By looking at the success and knock-on impacts of measures to reduce the use or improve the capture of single-use items, we hope to assess the potential for success of other measures that may be similar in mechanism or intended outcome.
4.3.1 Public Attitudes Towards Different Litter Reduction Measures
The European Commission’s litter consultation sought to evaluate the best ways to reduce the amount of litter across Member States.44 Presented with a list of seven potential approaches, a maximum of three were chosen by respondents, which they considered to be the most effective. The results are shown in Figure 9.
Figure 9: Litter Reduction Methods and their Perceived Effectiveness
Source: European Commission, 2014
44
European Commission (2014) Attitudes of Europeans Towards Waste Management and Resource Efficiency, accessed 4 April 2017, http://ec.europa.eu/public_opinion/flash/fl_388_en.pdf
52
The responses varied across Member States.
It is interesting to note that “Encouraging alternatives to plastic bags and other plastic packaging”, though potentially covering a number of options, from bans to charges to promoting alternative materials or even re-usables, had a similar amount of support to most of the other measures. It was estimated to be the most effective way to reduce littering in Austria (55%) and Germany (52%). It was thought to be effective by the fewest people in Romania (16%) and Hungary (18%)
Estonia (62%) and Sweden (61%) had the highest proportion of respondents who thought the most efficient way to reduce litter would be through the availability of public litter bins, whereas only 28% responded that they thought this would be effective in Spain and Slovenia.
There were similar differences in response to enforcing anti-litter laws, with Malta having 68% of participants rating this as the most effective measure, in their opinion, whereas only 15% in Estonia and 17% in Latvia saw this as an effective method for reducing litter.
This shows that if public support is deemed to be a key component of successfully implementing litter reduction measures, different actions may be easier to implement in different Member States.
4.3.2 Plastic Bag Charge and Associated Perceptions Before and After Implementation
A research project which aimed to examine behavioural and attitude changes towards the English plastic bag charge was conducted in October 2015. Its results suggest how other policy introductions on single use plastic items could be implemented, and their expected effects.
A sample of the general public across the UK were surveyed one month before and one month and six months after the introduction of the charge. They found an immediate change in plastic bag usage after the charge: before 1 in 4 participants said they used plastic bags provided when doing their main food shop, which fell to 1 in 10 one month after the charge. Further, before the charge 70% of respondents from England “Often/Always” took their own shopping bags, which increased to 83% of respondents one month after the charge, and to 93% of respondents six months after the charge was introduced45.
These results indicate that the introduction of a statutory charge led to a substantial behavioural change, and was shown to be independent of age and gender. The study also suggests that participants were more supportive of the charge after its introduction (60% one month on and 62% six months on, compared with 52% before), and also
45
Poortinga et al., (2016) The English Plastic Bag Charge: Attitudes and Behaviour, accessed 15 March 2017, https://orca.cf.ac.uk/94652/1/Cardiff_University_Plastic_Bag_Report_A4%20(final%20proof).pdf
53
towards other charges for waste. The study reported that post implementation of a charge in Scotland and Wales, support was also high (61% and 80% respectively). Interestingly, the perception of effectiveness of the charge was high both before and after the charge was introduced in England – 76% and 80% of respondents agreed the charge would encourage people to use fewer plastic bags. This could provide support for further plastic charges or bans.
4.3.3 Public Acceptance of Deposit Return Schemes
Data on the public acceptance of beverage container deposit return schemes around the world were reviewed between 1970 and 2011. Deposit return schemes are those where a deposit is paid on top of the price of a bottled beverage, which is fully refundable once the empty bottle is returned.
In Belgium, a poll published by the newspaper L’Avenir, found support in favour of a deposit on beverage cans at 62%, if it helped decrease the amount littered on roads46.
Similarly, in Germany, over 7300 people were polled by Der Spiegel to see their opinion on the future deposit on cans and beverage containers, and 76% thought it was a good idea47. This was conducted prior to the introduction of the country’s one-way deposit system on beverage containers, which saw a success rate of 98.5% of bottles returned by consumers in 2003 48, with estimates that this helped remove 1-2 billion single-use containers from Germany’s bins and streets49.
The introduction of a beverage container deposit system in the Netherlands was also widely supported by the public, with one study showing that nearly 75% of the Dutch population supported the idea50.
In the UK, a public poll by Ipsos MORI found 60% would support a deposit return scheme of 10p for drink containers51, and 9/10 people thought this would have a positive impact on reducing the amount of litter.
Across all countries, amount of support varied between 62% and 92% of respondents, with an overall average 80% support52. This also demonstrates that the public see and support the advantages of implementing legislation relating to plastic. The positive
46 L’Avenir (2011) Canettes, accessed 29 March 2017, http://www.lavenir.net/Polls/index.aspx?pageName=report&surveyid=703 47 Thomas Morgenstern (2011) Opinion Polls on a Global Scale: Review 48 Guardian Online (2017) Coca-Cola U-turn could help UK catch up on can and bottle recycling, accessed 29 March 2017, https://www.theguardian.com/sustainable-business/2017/feb/28/coca-cola-u-turn-can-and-bottle-recycling-europe 49
Zero Waste Europe (2010) Beverage packaging and Zero Waste 50
Thomas Morgenstern (2011) Opinion Polls on a Global Scale: Review 51 Ipsos MORI (2011) Public Support for a Deposit Fefund Scheme on Drinks containers is Strong, accessed 29 March 2017, https://www.ipsos-mori.com/researchpublications/researcharchive/2734/Public-support-for-a-deposit-refund-scheme-on-drinks-containers-is-strong.aspx 52
Thomas Morgenstern (2011) Opinion Polls on a Global Scale: Review
54
results across the countries studied, suggests that the implementation of further plastic restricting schemes could gain significant support from the public, and contribute to their success.
In Norway a DRS scheme has been in place since 1999, and has reverse vending machines in place where the public can return bottles for their deposit, or send them back to supermarkets. In 2012 the recovery rates of container return was 95%, showing the acceptance, as well as the success, of the scheme, suggesting implementation made DRS the “norm” in Norway, and provides support for similar schemes to be introduced across Europe.
4.4 Quality of Deposit Return Scheme Materials
The value of recycled materials depends on quality. This will vary depending on the type of collection system used to recover it, and the nature of any sorting system used to separate the material.
A 2011 study from PwC reporting on the German one-way deposit (Einwegpfand - in which bottles/ cans, that have a refundable deposit placed on them, are used by the consumer once, and then sent back to the producer or directly to a recycling facility), stated that the system leads to very high rates of collection and also subsequent recycling, due to the high quality of the collected packaging:
“While the return and recycling rates for PET bottles in the deposit system stand at ca. 98.5%, the collection rate for PET bottles in the dual systems [household co-mingled recycling] is estimated to range between 43% to 54% and the recycling rate between 25% to 31%”
Generally, reprocessors view materials collected through Deposit Return Schemes (DRS) very favourably because of the high quality (low level of non-target materials) of the stream, and because it is generally a well-defined stream (in terms of the materials present). 53
The financial reward given for material return also increases the amount of material collected. There is a general understanding that DRS increase the total tonnages of materials collected, and also capture some of the hard-to-reach material streams, particularly ‘on the go’ food and drink packaging which is of particular concern.54
For example, in Sweden, prior to the introduction of the deposit scheme, non-refillable beverage containers ended up in the general household waste stream. By introducing a dedicated collection system for beverage containers the quality of the collected
53
Eunomia Research & Consulting Ltd (2015) A Scottish Deposit Refund System, Report for Zero Waste Scotland, 2015 54
ERM (2008) Review of Packaging Deposits System for the UK, December 2008
55
materials has significantly improved55, and the Swedish scheme achieved recycling rates of 85%.56
5.0 Legislative Leverage Points
In the following section, various legislative avenues for reducing the consumption or decreasing the emissions of single-use plastic items to the environment are explored. Legislation at the EU level has been chosen mainly as a focus; however any of these could be implemented at a Member State level. We also look at some laws and regulations that have been implemented on a Member State or municipality level.
5.1 Role of Green Public Procurement
Public authorities in the EU spend around 13% of GDP annually on works, goods and services, totalling over €2 trillion in 2015.57 By using their considerable purchasing power they can therefore assist in the shift towards more sustainable procurement.
The European Union Green Public Procurement (EU GPP) initiative is a voluntary instrument, defined by the European Commission as:58
A process whereby public authorities seek to procure goods, services and works with a reduced environmental impact throughout their life cycle when compared to goods, services and works with the same primary function that would otherwise be procured
The EU GPP criteria comprises two key parts, the ‘core’ and ‘comprehensive’ criteria:
Core - Suitable for use by any contracting authority across the Member States and which address the key environmental impacts. They are designed to be used with minimum additional verification effort or cost increases; and
Comprehensive - For those wishing to purchase the best environmental products available on the market. These may require additional verification effort or a slight increase in cost compared to the other products with the same functionality.
55 ERM (2008) Review of Packaging Deposits System for the UK, December 2008 56
CIWM (2017) Deposit Return Scheme On Plastic Bottles ‘Unlikely’ 57
European Commission (2015) Public Procurement Indicators 2015, DG GROW, available at http://ec.europa.eu/DocsRoom/documents/20679/attachments/1/translations/en/renditions/native 58 European Commission (2008) COMMUNICATION FROM THE COMMISSION TO THE EUROPEAN PARLIAMENT, THE COUNCIL, THE EUROPEAN ECONOMIC AND SOCIAL COMMITTEE AND THE COMMITTEE OF THE REGIONS, Public Procurement for a Better Environment, 16.7.2008, available at http://eur-lex.europa.eu/legal-content/EN/TXT/PDF/?uri=CELEX:52008DC0400&from=EN
56
5.1.1 Green Public Procurement for Food and Catering Services
The Joint Research Centre (JRC) of the European Commission is currently revising the European Green Public Procurement criteria for Food and Catering Services. This covers both the direct procurement of food by public authorities and the procurement of catering services. Catering services may be defined in a number of ways. The UK’s Royal Institute of Chartered Surveyors applies the following definition:59
Catering may vary from the provision of automated vending (e.g. hot/cold drinks, hot/cold snacks, confectionery), through drinks and snack counters, cafés, deli bars, canteens and staff restaurants to a full silver-service dining room for directors and clients, and may additionally include hospitality for occasional or regular events and conferences
Meanwhile, DG SANCO applies a broader definition:60
The preparation, storage and, where appropriate, delivery of food for consumption by the consumer at the place of preparation or at a satellite unit
The JRC’s Preliminary Report on the revision of GPP criteria for Food and Catering Services covers packaging, but does not explicitly mention waste prevention except briefly in the context of preventing food waste.61 Littering of single-use (or any other items) also escapes mention. However, Section 4.4.4.3 on page 223 of the report does cover reuse of packaging. The authors specifically refer to an LCA study from Canada that compared reusable and single-use coffee cups.62 The study included:
A reusable stainless steel travel mug with a polypropylene handle (hand washed after one use);
A reusable ceramic mug (washed in a commercial dishwasher after one use); and
A disposable paper cup which was lined with polyethylene and with a lid of polystyrene (disposed to landfill after use).
Five environmental impact categories were considered: human health, eco-system quality, climate change, resource depletion and water consumption. The ceramic cup was reported as being best in all impact categories and the travel mug in stainless steel was as good in the climate change and resource depletion category (when they were
59
Royal Institute of Chartered Surveyors (2013) RICS Draft Guidance Note – Catering Services 60 European Commission DG SANCO (1993) Code of Hygienic Practice for Pre-cooked and Cooked Foods in Mass Catering 61 European Commission (2016) Revision of European Green Public procurement criteria for Food and Catering Services. JRC Science for Policy Report, Preliminary Report (Draft) Working Document, available at http://susproc.jrc.ec.europa.eu/Food_Catering/docs/EU%20GPP%20Food%20Catering%20services_Preliminary%20report.pdf 62 CIRAIG (2014) Life cycle assessment (LCA) of reusable and single-use coffee cups, short English summary available at: http://www.recyc-quebec.gouv.qc.ca/upload/publications/ACV_tasses_cafe_anglais.pdf , full French report: http://www.ciraig.org/pdf/CIRAIG_RapportACVtassesetgobelets_public.pdf ((Centre interuniversitaire de recherché sur le cycle de vie des produits, proceeds et services)
57
used at least 200-300 times). It was reported that the travel mug would score almost as well as the ceramic mug if it were only rinsed in cold water between uses. The disposable paper cup exhibited ‘significantly worse’ environmental performance, and was also more expensive for the restaurant. The authors of the JRC study note that:63
This highlights that in certain situations it is more environmentally beneficial to have reusable tableware rather than disposable.
However, reusable cutlery and crockery is scarcely mentioned. An exception to this is a case study from the Municipality of Rome on sustainable food procurement in schools, which states that:
Single use items (e.g. napkins) must be recyclable and biodegradable. Use stainless steel cutlery, glass and ceramic tableware and plates.
Elsewhere there is mention of the benefits of compostable single-use cutlery versus non-compostable single use cutlery.
Significantly, at no point in the report is the waste hierarchy mentioned in the context of preventing waste other than food waste. There is no indication in the report that the presumption, for cutlery, crockery and tableware, should be towards the use of reusables, in line with the priority to prevent waste. The Waste Framework Directive notes that when applying the waste hierarchy:64
Member States shall take measures to encourage the options that deliver the best overall environmental outcome. This may require specific waste streams departing from the hierarchy where this is justified by life-cycle thinking on the overall impacts of the generation and management of such waste.
There appears to be no such strong encouragement in the JRC’s study. Notably, however, there have been a number of comments from stakeholders, reported in the document, on the topic of reusable versus non-reusable items:65
“re-usable items should be the first option and renewable (non-reusable) the second”
“re-usable glassware and cutlery etc. is only sustainable if it is washed conservatively”
63
European Commission (2016) Revision of European Green Public procurement criteria for Food and Catering Services. JRC Science for Policy Report, Preliminary Report (Draft) Working Document, available at http://susproc.jrc.ec.europa.eu/Food_Catering/docs/EU%20GPP%20Food%20Catering%20services_Preliminary%20report.pdf 64
Directive 2008/98/EC of the European Parliament and of the Council of 19 November 2008 on waste and repealing certain Directives, available at http://eur-lex.europa.eu/legal-content/EN/TXT/PDF/?uri=CELEX:32008L0098&from=EN 65 European Commission (2016) Revision of European Green Public procurement criteria for Food and Catering Services. JRC Science for Policy Report, Preliminary Report (Draft) Working Document, available at http://susproc.jrc.ec.europa.eu/Food_Catering/docs/EU%20GPP%20Food%20Catering%20services_Preliminary%20report.pdf
58
“optimal type of glassware and cutlery to be used depends on the type of business it is for”
“if the crockery and cutlery is non-reusable, it should be made from biodegradable sources, so that it can be composted and hence create no ‘waste’”
The arguments here still seem to be focused on LCA studies which, by their very nature, fail to capture the wider impacts of single-use plastic items when they escape formal waste management routes and become littered. While the focus of the report is on catering – much of which may take place inside – there is every chance that disposable items may also be taken away from public sector cafeterias, for example, or consumed in outdoor locations. Therefore, while not specifically ‘on-the-go’ focused, the preliminary report should place greater emphasis on preventing waste and litter.
The preliminary report is accompanied by a Technical Report which includes draft proposals for EU GPP criteria for catering services.66 This includes, under Selection Criteria 1 (SC1), Staff Training:
Staff shall be trained to minimise the procurement of single use crockery and cutlery and, where possible, to use returnable / refillable packaging, e.g. secondary packaging for frequent deliveries
However, under Award Criteria 8 (AC8) on consumable goods (e.g. paper products, tableware and cleaning products), the following text is included in respect of reusable and non-reusable tableware:
The scientific evidence suggests that the use of reusable and biodegradable tableware (cutlery and crockery) is preferable to the use of disposables from an environmental perspective, at least in some settings (section 4.4.4.3., Preliminary Report).
This is confusing, as it lumps together both reusable and biodegradable as being preferable to disposables, whereas biodegradable tableware is almost always single-use. This should be revised to indicate a clear preference for reusables. Furthermore, the qualifying statement ‘at least in some settings’ should be explained more fully, to note that this is also when certain assumptions are applied. It would also be important to note that litter and its impacts are not included in the LCA studies that the JRC has reviewed in order to come to this view. Furthermore, the terms ‘biodegradable’ and ‘compostable’ can be hugely problematic, and indeed confusing to consumers and those responsible for procurement alike.
Under Award Criteria 8 the report then goes on to say:67
66 European Commission (2016) Revision of European Green Public procurement criteria for Food and Catering Services. Technical Report for the 1at AHWG meeting, February 2016, available at http://susproc.jrc.ec.europa.eu/Food_Catering/docs/EU%20GPP%20Food%20Catering%20services_Technical%20Report.pdf
59
Conversely, items that are disposable and used for convenience or sanitary reasons cannot always be replaced by reusable items due to the nature of the catering service. This is the case where food is not consumed in a dedicated dining area or in unstaffed facilities (as in the 24/7 vending). Temporary events in places that do not have access to a kitchen are an example of when single use items may be the best environmental option. To reduce emissions, the disposable items can be recyclable, have recycled content, or be compostable (Baldwin et al., 2011). For reusable cutlery and crockery the washing process represents the most significant environmental burden and hence efficient dishwashers and efficient use of dishwashers is critical, i.e. operate dishwashers with full loads (section 4.1.1.4., Preliminary Report).
To read this as someone seeking to procure a whole range of catering items and services, the impression is strongly conveyed that washing of reusable items can have a strongly negative environmental impact, while biodegradable items are good from an environmental perspective, and have the added benefit of avoiding the need for washing.
Under the specific award criteria the technical report does then go on to say that:
Reusable tableware should be used in all situations where it is feasible to do so
Where it is deemed necessary to use disposable tableware: o Points shall be awarded to tenders that prove that a minimum of 70% of
the material of which the disposable is composed of (by weight) must be produced from sustainably sourced fibres.
o Points will be awarded to tenders that prove that a minimum of 50% of the cutlery units is certified according to EN 13432, EN 14995 or equivalent and 90% biodegradability in 6 months has been demonstrated in a single or combined composting and/or anaerobic digestion process.
However, it would seem in many cases all too easy for the judgement to be made in favour of biodegradable or compostable items, which of course do nothing to prevent the negative effects associated with littering. Notably the technical report, in common with the preliminary report, says nothing about littering.
The European Commission or national governments could mandate the use of GPP guidance, once revised, in appropriate contexts – e.g. in public buildings or meetings of above certain size.
67 European Commission (2016) Revision of European Green Public procurement criteria for Food and Catering Services. Technical Report for the 1at AHWG meeting, February 2016, available at http://susproc.jrc.ec.europa.eu/Food_Catering/docs/EU%20GPP%20Food%20Catering%20services_Technical%20Report.pdf
60
5.1.2 Use of Licencing Laws to Require the Use of Reusables
A number of European cities have obligations on event organisers to use reusable items at events. Since its introduction in 1991, the City of Munich has banned the use of disposable cutlery and crockery at large-scale public events that take place on land owned by the city and retail spaces owned by the city.68 The event organisers instead use reusable items which are made available using a deposit-refund system. The deposit is normally only applied to cups, bottles and plates, but not to cutlery, but when people return cups and plates, any cutlery used is usually returned as well. Moreover, it is stated that the kind of food that is often served at events in Munich, for example sausages in a roll or pizza, is eaten without the use of cutlery.69
Vienna also implemented measures, from 1st January 2011, to reduce the environmental impact of events through reducing the use of disposable items.70,71
The first of these changes required events expecting more than 2,000 people to attend to draw up waste management plans. The second was an obligation to use reusable items at events:72
Where more than 1,000 people can take part; or
Where more than 500 people can take part in venues recognised as ‘permanent’ venues by the Viennese Government; or
Which are held on property owned by the Viennese Government
Drinks being served at events should be served from reusable bulk containers (e.g. barrels, reusable bottles) where these are available in Vienna, and the containers (cups/glasses) must be reusable. When distributing food, reusable tableware and cutlery (e.g. made of glass, ceramic, metal or plastic) must be used. Exceptions can be made for safety reasons. Under such circumstances, items should be made from renewable materials, e.g. wood or cardboard.
In Germany, the city of Freiburg requires the use of reusable containers at events.73 The city of Nürnberg also imposes a similar obligation for events in public buildings and on land owned by the city.74 The city of Kiel likewise requires the use of reusable containers
68 Pre-waste (2011) Ban on disposal drink containers and tableware in Munich, Germany (Munchner Einwegverbot). 69 Personal communication with Frederic Weihberg, Abfallwirtschaftsbetrieb München, June 2012. 70 Landesgesetzblatt für Wien, Section 10d, 24 September 2010, available at http://www.wien.gv.at/recht/landesrecht-wien/landesgesetzblatt/jahrgang/2010/pdf/lg2010048.pdf 71
Personal communication, Johanna Leutgöb, Umweltberatung Wien, March 2012. 72
Landesgesetzblatt für Wien, Section 10d, 24 September 2010, available at http://www.wien.gv.at/recht/landesrecht-wien/landesgesetzblatt/jahrgang/2010/pdf/lg2010048.pdf 73 Abfallwirtschaftssatzung of 21 October 2008, Article 2, available at http://www.freiburg.de/servlet/PB/show/1153784/OrtsR_14_02.pdf 74
Abfallwirtschaftssatzung of 19 March 2009, ABl.2009, p.85, Article 7, available at http://www.nuernberg.de/imperia/md/presse/dokumente/inhalt/090318_amtsblatt_06_09.pdf
61
at events on public land and buildings.75 Finally, the city of Weimar requires the use of reusable containers in municipal buildings and on their land.76 In none of these cases has there been a legal challenge.
In a 2012 study for Bruxelles Environment Eunomia explored the potential for the application of a similar measure in the Brussels Capital Region.77 It was found that there were no significant barriers to the implementation of such a scheme covering a range of items at a number of different types of events.
In addition, there appears to be clear potential for municipalities to require, under licensing laws that hospitality venues that serve alcoholic and other drinks in outside places, e.g. terraces, pavements, be obliged to use reusable (glass or durable plastic) containers rather than disposable containers. Returns could be secured through the implementation of a deposit-refund system.
Municipalities should be supported to create licensing laws obligating the use of reusables at public events.
5.2 Environmental Management and Audit Scheme (EMAS)
The European Commission’s Environmental Management and Audit Scheme is a tool for companies or organisations to evaluate, report and improve their environmental performance. Sectoral Reference Documents (SRDs) and Best Environmental Management Practice (BEMP) Reports (‘Best Practice Reports’) have been developed or are in development for the guidance of different sectors as to what constitutes good environmental practice. Participation is voluntary, but there is a register of organisations certified as registered users of the scheme. EMAS covers the following sectors of relevance to single-use plastic items; the scope of the guidance of relevance is also summarised: Retail Trade
Waste prevention is recommended (though few practices are suggested and few of specific relevance to single-use items); exceptions are:
Prevention of single-use plastic bags (removal from checkouts, responsible advertising and guidance for customers)
Return rate for packaging (e.g. bottles) is suggested as an indicator of good practice.
Tourism
75
Abfallsatzung of 14 December 2010, version of 19 December 2011, Article 2(3), available at http://www.abki.de/downloads/satzungen/Abfallsatzung_2012.pdf 76
Abfallsatzung of 12 October 2011, Article 8, available at http://sw-weimar.de/fileadmin/user_upload/swi/pdf/Abfallsatzung011211.pdf 77
Eunomia Research & Consulting (2012) A Feasibility Study on a Legal Obligation Aimed at the Systematic Use of Reusable Containers for Drinks and Food Served at Events Held in Public Places in the Brussels-Capital Region, Final Report to Bruxelles Environnement
62
Prevention of waste generation is suggested through e.g. the avoidance of single-use items (food, toiletries)
Food and Beverage Manufacturing
BEMP is to minimise the environmental impact of packaging e.g. by bulk packaging of ingredients delivered by suppliers to the company, refills, e.g. refillable packaging to be returned to the food and beverage
manufacturer, returnable secondary and tertiary packaging
Public Administration (in development) The Best Practice Report includes guidelines on minimising the environmental
impact of canteens and coffee bars e.g. “a reduction in catering related packaging and consumables such as disposable cutlery and single-use containers can reduce waste even further
Waste management (in development) The Draft Best Practice Report identifies many actions relevant to single-use
items as best practice for local waste prevention, many for individuals; but there are some for municipalities and businesses e.g.
Supporting use of reusables in canteens Providing mobile dishwashers for events Providing school children with reusable lunch boxes
The report notes that where actions are relevant to individuals, economic incentives are more effective than public awareness campaigns.
Most significantly, the waste hierarchy is not clearly recommended in the documents for retail, tourism and food and beverage manufacturing – no clear priority is given for choosing different types of action, with recycling and waste prevention actions presented on a level. Much clearer guidance could be given so that the preferred order of priority for actions according to the waste hierarchy is clearly identified as best practice. EMAS SRD and BEMP documents could also be improved by including more explicit recommendations of relevance to single-use items. In addition, a notable omission for sectors that guidance is available for is the food service sector (whether catering or independent establishments). The single-use items in this report are predominantly sold or provided by these kinds of businesses. SRD and BEMP documents should be developed for the food service sector. A major feature of EMAS is that the scheme is voluntary. A target could be set/incentives increased to drive up the number of businesses adopting EMAS.
63
5.3 Extended Producer Responsibility and Proposed Minimum Requirements
Extended Producer Responsibility (EPR), is defined by the OECD as:78
‘An environmental policy approach in which a producer’s responsibility for a product is extended to the post-consumer stage of a product’s life cycle’.
The practical implications of this approach are that responsibility for collecting or taking back used goods, and for sorting and treating for their eventual recycling, lie with producers. Such responsibility may be simply financial, or, additionally, organisational.79 The approach was first implemented in a number of European Union (EU) Member States in the early 1980s, especially for packaging waste, and has since become more widely applied both within and beyond the EU.
Recently published guidance from DG Environment of the European Commission states that:80
‘EPR should aim at internalising environmental externalities and should provide an incentive for producers to take into account environmental considerations along the products’ life, from the design phase to their end-of-life. As such, EPR is to be considered as a major instrument in support of the implementation of the European Waste Hierarchy, and therefore for the increase of, by priority: prevention, reuse and recycling’.
EPR is introduced as a policy approach in three EU Directives:
The ELV Directive 2000/53/EC;
The new WEEE Directive 2012/19/EU; and
The Batteries Directive 2006/66/EC.
EPR is also applied in support of the implementation of the Packaging and Packaging Waste Directive (94/62/EC), although the Directive itself does not impose the principle. In addition, Article 8 of the Waste Framework Directive 2008/98/EC outlines some principles in respect of the implementation of EPR by European Member States. 81
78
OECD (2001) Extended Producer Responsibility: A Guidance Manual for Governments 79
Bio by Deloitte (2014) Development of Guidance on Extended Producer Responsibility, Final Report to DG Environment of the European Commission 80 Bio by Deloitte (2014) Development of Guidance on Extended Producer Responsibility, Final Report to DG Environment of the European Commission 81
Bio by Deloitte (2014) Development of Guidance on Extended Producer Responsibility, Final Report to DG Environment of the European Commission
64
5.3.1 Implementation of Producer Responsibility in the European Union
While European waste legislation provides a framework, individual Member States are responsible for the implementation of EPR, including regulatory and operational aspects. A recently published study for the European Commission notes that:82
‘EPR policies have been designed and implemented in a very heterogeneous manner across Europe’.
While EPR is, in theory, an individual obligation, in many cases responsibility is discharged via a Producer Responsibility Organisation (PRO).83 Across Europe, PROs potentially exert three main functions:84
Financing the collection and treatment of the product at the end of its life (targeted waste stream) by collecting fees and redistributing the corresponding financial amounts;
Managing the corresponding data; and
Organising and/or supervising these activities.
The Commission report notes that in the last ten years, EPR has evolved in two key ways:
1) While the initial fees paid by producers represented only a partial contribution to solid waste management costs, the operational costs coverage by producers’ fees has gradually increased, sometimes reaching 100%; and
2) While PROs were initially created as entities whose role was merely to aggregate the producers’ financial contribution, their role has been drifting towards more operational interventions and a broader scope of action (e.g. data management, organising operations, launching bids, communication campaigns).
The authors of the Commission study sought to provide a comparison of the effectiveness and efficiency of different EPR schemes across the EU. They noted wide discrepancies in performance. For packaging, they identified that recycling rates vary from 29% in Malta, to 84% in Denmark, and that average fees charged to producers per tonne of packaging (household only) vary from less than €20 in the UK, to nearly €200 in Austria.
5.3.2 Cost-effectiveness of EPR Schemes for Packaging
As part of the Commission study on EPR, a number of case studies were selected for more in-depth analysis. Packaging EPR schemes were reviewed in the following countries:
82
Bio by Deloitte (2014) Development of Guidance on Extended Producer Responsibility, Final Report to DG Environment of the European Commission 83
In the UK PROs are called Compliance Schemes. 84
Bio by Deloitte (2014) Development of Guidance on Extended Producer Responsibility, Final Report to DG Environment of the European Commission

65
Austria;
Belgium;
Czech Republic;
France;
Germany;
Netherlands; and
United Kingdom.
The quantities of packaging covered by an EPR scheme vary from around 75kg/capita/year (France, Belgium) to around 165kg/capita/year (Netherlands, UK). Most of this difference is due to the varying scopes of EPR schemes – in some Member States EPR only covers household packaging waste, whereas in others it can also cover commercial and industrial packaging.
As can be seen in Figure 5-1, the recycling rate is lowest in the UK (all packaging, 61%) and highest in Belgium (household packaging, 85%). As also shown in Figure 5-1, fees paid by producers range from €1.1/capita/year (UK) to €19.7/capita/year (Austria).
The Commission study notes that this very wide range is notably due to the different levels of cost coverage. In the UK, it is estimated that the fee covers only 10% of the total cost of the system, whereas in most other schemes, 100% of net costs are covered.
Figure 5-1: Cost-effectiveness of EPR Schemes for Packaging (2010 or 2011)
Source: European Commission (2014)
The UK has chosen to implement producer responsibility for packaging waste in a way that is quite different from that practised elsewhere in Europe – by introducing the concept without extending financial responsibility, in full, to producers.
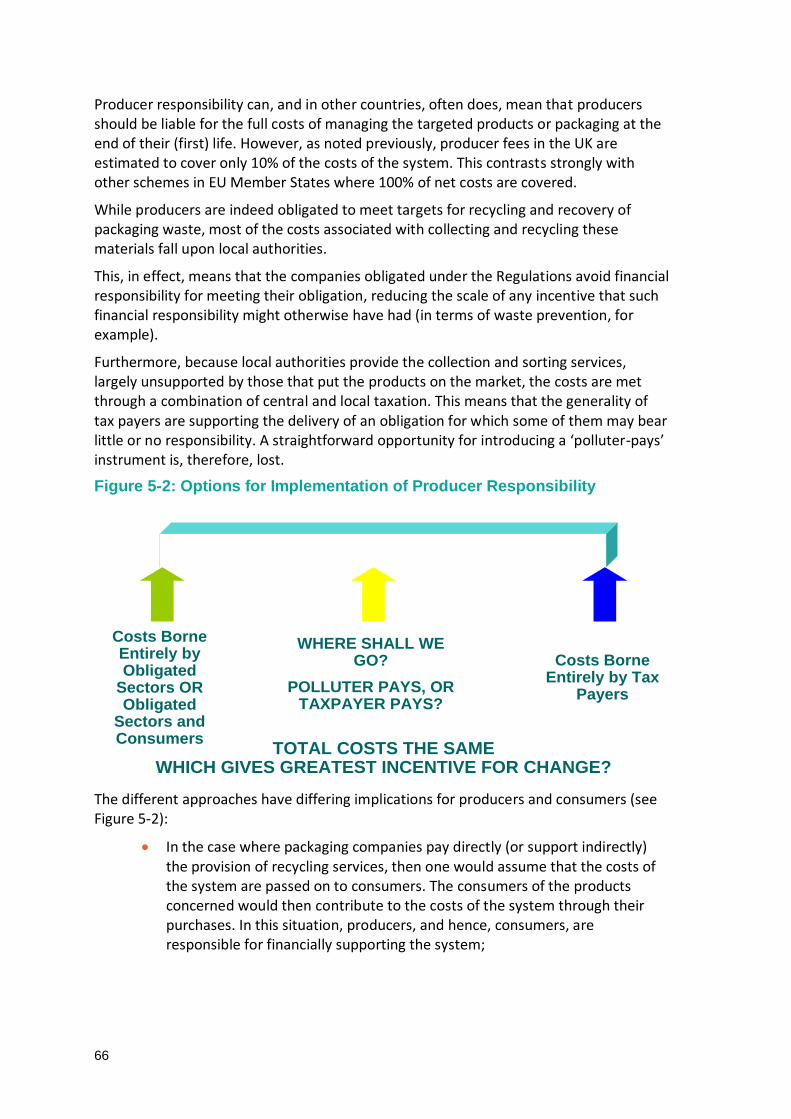
66
Producer responsibility can, and in other countries, often does, mean that producers should be liable for the full costs of managing the targeted products or packaging at the end of their (first) life. However, as noted previously, producer fees in the UK are estimated to cover only 10% of the costs of the system. This contrasts strongly with other schemes in EU Member States where 100% of net costs are covered.
While producers are indeed obligated to meet targets for recycling and recovery of packaging waste, most of the costs associated with collecting and recycling these materials fall upon local authorities.
This, in effect, means that the companies obligated under the Regulations avoid financial responsibility for meeting their obligation, reducing the scale of any incentive that such financial responsibility might otherwise have had (in terms of waste prevention, for example).
Furthermore, because local authorities provide the collection and sorting services, largely unsupported by those that put the products on the market, the costs are met through a combination of central and local taxation. This means that the generality of tax payers are supporting the delivery of an obligation for which some of them may bear little or no responsibility. A straightforward opportunity for introducing a ‘polluter-pays’ instrument is, therefore, lost.
Figure 5-2: Options for Implementation of Producer Responsibility
The different approaches have differing implications for producers and consumers (see Figure 5-2):
In the case where packaging companies pay directly (or support indirectly) the provision of recycling services, then one would assume that the costs of the system are passed on to consumers. The consumers of the products concerned would then contribute to the costs of the system through their purchases. In this situation, producers, and hence, consumers, are responsible for financially supporting the system;
Costs Borne Entirely by Obligated
Sectors OR Obligated
Sectors and Consumers
Costs Borne Entirely by Tax
Payers
WHERE SHALL WE GO?
POLLUTER PAYS, OR TAXPAYER PAYS?
TOTAL COSTS THE SAME WHICH GIVES GREATEST INCENTIVE FOR CHANGE?
67
In the case where local authorities provide the collection service unsupported by obligated entities, then the collection service is supported, at least in the UK, by a combination of central and local taxation, which bears no clear relationship whatsoever to the consumption or disposal of the products which are the subject of producer responsibility. In this case, the generality of tax payers supports the delivery of an obligation for which some of them may bear no responsibility.
5.3.3 Revised Circular Economy Package
The European Commission’s recently adopted Circular Economy Package could mean changes for the delivery of producer responsibility.85 The new Article 8a of the proposal for a revised Waste Framework Directive would introduce general requirements for extended producer responsibility schemes, including the following:86
4. Member States shall take the necessary measures to ensure that the financial contributions paid by the producer to comply with its extended producer responsibility obligations:
(a) cover the entire cost of waste management for the products it puts on the Union market, including all the following:87
- costs of separate collection, sorting and treatment operations required to meet the waste management targets referred to in paragraph 1, second indent, taking into account the revenues from re-use or sales of secondary raw material from their products;
- costs of providing adequate information to waste holders in accordance with paragraph 2;
- costs of data gathering and reporting in accordance with paragraph 1, third indent
At first glance, the 2015 version of the Circular Economy Package, would appear to have removed the threat (to producers) that they might also have to contribute to the costs of litter prevention and clean-up initiatives. Annex VII to the 2014 proposal set out minimum requirements for extended producer responsibility, which included the following:88
85 Adopted in December 2015 86 European Commission (2015) Proposal for a Directive of the European Parliament and of the Council amending Directive 2008/98/EC on waste 87
Emphasis added 88
European Commission (2014) Annex to the Proposal for a Directive of the European Parliament and of the Council amending Directives 2008/98/EC on waste, 94/62/EC on packaging and packaging waste, 1999/31/EC on the landfill of waste, 2000/53/EC on end-of-life vehicle, 2006/66/EC on batteries and accumulators and waste batteries and accumulators, and 2012/19/EU on waste electrical and electronic equipment.
68
Ensure that financial contributions into extended producer responsibility schemes by producers or importers of products put on the Union market:
o Cover the entire cost of waste management, including separate collection and treatment, adequate information to waste holders, data gathering and reporting;
o Take into account the revenues from the sales of secondary raw materials originating from waste;
o Are calculated in function of the true cost of the end-of-life management of individual products placed on the Union market which are covered by the scheme; and
o Support litter prevention and clean-up initiatives.89
However, this may not necessarily be the case. Under the 2015 proposal for a revised Waste Framework Directive, the amended definition of municipal waste under Article 3(1a(c)) includes:90
Market cleansing waste and waste from street cleaning services, including street sweepings, the content of litter containers, waste from park and garden maintenance
The inclusion of litter in the proposed definition of municipal waste is the significant element.
5.3.3.1 Recent Revisions in the European Parliament
On the 14th March 2017 the European Parliament adopted a number of amendments relating to the ongoing revision of the Waste Framework Directive.91 This included the following change in respect of Article 8a on minimum requirements for EPR.
Amendment 139 relates to Article 8a - paragraph 4 – point a. The text proposed by the Commission in relation to the financial contributions by producers was that they should:
a) cover the entire cost of waste management for the products it puts on the Union market, including all the following:
- costs of separate collection, sorting and treatment operations required to meet the waste management targets referred to in paragraph 1, second indent, taking into account the revenues from re-use or sales of secondary raw material from their products;
89 Emphasis added 90
European Commission (2015) Proposal for a Directive of the European Parliament and of the Council amending Directive 2008/98/EC on waste 91
European Parliament (2017) Amendments adopted by the European Parliament on 14 March 2017 on the proposal for a directive of the European Parliament and of the Council amending Directive 2008/98/EC on waste (COM(2015)0595 – C8-0382/2015 – 2015/0275(COD)), available at http://www.europarl.europa.eu/sides/getDoc.do?pubRef=-//EP//NONSGML+TA+P8-TA-2017-0070+0+DOC+PDF+V0//EN
69
The Parliament’s amendment is as follows:
a) cover the entire cost of waste management for the products it puts on the Union market, as follows:
- costs of separate collection, sorting, transport and treatment operations required to ensure the proper management of waste, taking into account the revenues from re-use or sales of secondary raw material from their products;
The change from ‘including’ to ‘as follows’ would seem to exclude the costs of managing litter. However, the additional change, by removing reference to costs of actions required to meet the waste management targets to ensuring ‘the proper management of waste’ would appear to open up this possibility once again. This is because, as defined in Article 3 – point 1 a, ‘street sweepings and the content of litter containers’ is defined as municipal waste. This definition remains in the Parliament’s amendments.
To be clear, the greatest incentive for producers to seek the highest possible levels of recycling would be for them to be financially responsible for all of their waste at end of life – not simply the fraction that is to be recycled. Financial responsibility for litter would also significantly increase their focus on litter prevention.
We therefore recommend that Seas at Risk continue to push for financial responsibility, via the EPR minimum requirements, for all waste at end of life including litter. However, even if full cost coverage were implemented for EPR, it would not necessarily lead to waste prevention. Accordingly, there would still be a need for targeted economic instruments such as charges to reduce consumption of single-use plastic items.
5.3.3.2 The Plastics Strategy
The Plastics Strategy is due to be release by the end of 2017. The Roadmap to the Plastics Strategy states that the strategy aims to
(1) decouple plastics production from virgin fossil feedstock and reduce its life-cycle greenhouse gas impacts
(2) improve the economics, quality and uptake of plastic recycling and reuse, and
(3) reduce plastic leakage into the environment.92
The Strategy is intended to seek to improve framework conditions for investments and innovations that enable the plastic and related industries and the entire value chain using plastics to become more circular, resource-efficient and reduce its carbon footprint. The plastics strategy is intended to support and complement the implementation of the Circular Economy action plan through the Waste Framework Directive and its daughter Directives like the Packaging Waste Directive, by providing a
92
http://ec.europa.eu/smart-regulation/roadmaps/docs/plan_2016_39_plastic_strategy_en.pdf
70
systemic perspective focussed on plastics, and creating synergies with other actions, such as those on prevention, eco-design, work on the interface between waste, chemicals and product policies, measures to boost markets for secondary raw materials, and use of economic instruments, etc.
In preparation of the strategy, a number of different actions will be explored with a view to identifying those with the strongest EU-added value and highest impact in tackling the problems identified.
In the development of the Plastics Strategy, there is the opportunity to support the strengthening of the requirements around EPR, economic incentives for waste prevention, and other approaches targeting specific single-use plastic items.
5.4 Extending the Provisions around Plastic Bags
The Directive on consumption of lightweight plastic carrier bags (2015/720) amends the Directive 94/62/EC of 20 December 1994 on packaging and packaging waste, on the basis that:
“(1) European Parliament and Council Directive 94/62/EC (4) was adopted in order to prevent or reduce the impact of packaging and packaging waste on the environment. Although plastic carrier bags constitute packaging within the meaning of that Directive, it does not contain specific measures on the consumption of such bags”
(2) The current consumption levels of plastic carrier bags result in high levels of littering and an inefficient use of resources, and are expected to increase if no action is taken. Littering of plastic carrier bags results in environmental pollution and aggravates the widespread problem of litter in water bodies, threatening aquatic eco-systems worldwide
(3) Furthermore, the accumulation of plastic carrier bags in the environment has a clearly negative impact on certain economic activities.
….
(20) The measures provided for by this Directive are consistent with the Commission Communication on the Roadmap to a Resource Efficient Europe and they should contribute to actions against marine littering, undertaken in accordance with Directive 2008/56/EC of the European Parliament and of the Council”
All of these reasons are applicable to single-use plastic items consumed on the go, especially those that can be demonstrated to be prevalent in the environment.
The Directive requires Member States to either:
adopt measures that ensure that annual consumption on lightweight plastic carrier bags does not exceed 90 bags per person by 31st December 2019 and 40 bags by 31st December 2015 (or equivalent targets set in weight); or
71
adopt instruments to ensure that by 31st December 2018 lightweight plastic carrier bags are not provided free of charge at the point of sale of goods or products (unless equally effective instruments are implemented).
Where a target is chosen, the types of measure to implement are left to the discretion of Member States, which may set national reduction targets, maintain or introduce economic instruments as well as marketing restrictions (i.e. outright bans), provided that such restrictions are proportionate and non-discriminatory. The alternative course of action, a charge on bags, provides a clear signal and economic incentive for the reduction of consumption and has been shown to be effective in many countries (e.g. Northern Ireland, Wales, Scotland), with reduction rates of 71%, 76% and 80%, in the first year after establishment.93 A reporting requirement is also included.
The Packaging Waste Directive and the Plastic Bag Directive are currently founded on TFEU (Treaty on the Functioning of the European Union) Article 114. This gives the power to legislate and harmonise regulation to prevent harm to human health and the environment, even where this restricts the free movement of goods (guaranteed by TFEU Article 26), as long as hazard is demonstrably present, as assessed on a case by case basis. This makes measures targeting specific items more difficult to implement as it provides grounds for them to be challenged in court, particularly over the stipulation that hazard has to be demonstrated. If the Packaging Waste Directive and/or future amendments were cast on an environmental basis (TFEU Article 192), it would facilitate implementation of measures to reduce the consumption of single-use plastic items, as they would be less open to legal challenge.
In conclusions, other similar amendments setting targets for reduction of consumption could be tabled for selected items, with an environmental legal basis, to make implementation less susceptible to legal challenge.
5.5 Cutlery and Straws – Are they Packaging?
Plates and cups constitute “packaging” in the sense of Directive 94/62/EC, when they are disposable. 94,95 Otherwise, plates and cups are just considered “products”, and the EU legislation on packaging does not apply to them. Directive 2004/12 classifies “disposable cutlery” and “stirrers” as not being “packaging”. The UK interpretation is also that straws are also not regarded as packaging.96
However, as products rather than packaging, there is no reason why the waste hierarchy should not be applied and an economic instrument such as a charge be implemented on the grounds of environmental protection. Even though the rationale provided would not
93 http://www.bbc.co.uk/news/science-environment-36917174 94
Directive 94/62/EC on packaging and packaging waste, OJ 1994, L 365 p.10. 95
Directive 2004/12/EC amending Directive 94/62/EC, OJ 2004, L 47 p.26, annex. It should be pointed out, though, that this classification as “packaging” is illustrative only, and thus not legally binding. Available at http://eur-lex.europa.eu/resource.html?uri=cellar:f8128bcf-ee21-4b9c-b506-e0eaf56868e6.0004.02/DOC_1&format=PDF 96
Environment Agency (2015) Agreed positions and technical interpretations - Producer Responsibility for Packaging
72
be identical to that given for implementing the plastic bag Directive, a similar rationale could be drafted to amend, for example, the Waste Framework Directive.
5.6 Requirement for Waste Producers to Implement the Waste Hierarchy
Article 4 of the Waste Framework Directive97 states that
The following waste hierarchy shall apply as a priority order in waste prevention and management legislation and policy: a) prevention, b) preparing for re-use, c) recycling; d) other recovery, e.g. energy recovery and e) disposal.
Member States are required to transpose the Articles of the Directive into national law. In the following sections, we review the transposition of Article 4 in different countries and discuss its potential to drive down the consumption of single-use plastic items. Waste Framework Directive Implementation Reports have been completed for most EU countries, most recently in 2016. These describe how Member States are implementing the various elements of the WFD, including Article 4.
5.6.1 UK Situation
The transposition of the waste hierarchy into UK law (Reg 12 of the Waste (England and Wales) Regs 2011)98 is perhaps the piece of waste legislation with the greatest potential to drive change in how waste – and especially commercial waste is managed.99 The requirement is that
“An establishment or undertaking which imports, produces, collects, transports, recovers or disposes of waste, or which as a dealer or broker has control of waste must, on the transfer of waste, take all such measures available to it as are reasonable in the circumstances to apply the […] waste hierarchy as a priority order”
Every business must, as part of its Waste Transfer Note, confirm that it has properly applied the hierarchy to its waste, i.e.:
“confirm that the transferor has discharged the duty in regulation 12.”
Applying the hierarchy is a duty on businesses that produce or handle waste, and the regulator has the duty to enforce compliance.
The hierarchy has the potential to support Government policy and prevent waste and boost recycling, particularly if its implications can be made clear to business. However, the Defra (Department for Environment, Food and Rural Affairs) guidance available to
97 http://eur-lex.europa.eu/legal-content/EN/TXT/?uri=celex%3A32008L0098 98
http://www.legislation.gov.uk/uksi/2011/988/contents/made 99
The Waste (England and Wales) Regulations 2011, available at http://www.legislation.gov.uk/uksi/2011/988/pdfs/uksi_20110988_en.pdf
73
business is quite technical and to date there has been no enforcement action by regulators to highlight that there are implications to a failure to comply. The hierarchy is therefore widely ignored, and reasonable measures that businesses could take to reduce, reuse or recycle material are not implemented. One only has to consider the number of businesses that one sees use plastic cutlery when they could employ reusables; or the number of food businesses that do not have a separate food waste collection.
Some high-profile action could help to create significant news regarding the waste hierarchy, and increase understanding and compliance. For example, some substantial chain restaurants provide only single-use cutlery. If this practice is to be found, it would give rise to an opportunity for the regulator to write to the relevant organisations and ask them to introduce reusables, or incentives for customers to use reusables/disincentives to use disposables, or provide evidence that it was not reasonable for them to do so.
If the producer complies, positive press coverage could be generated regarding the regulator’s intervention and the benefits that it is bringing.
If the producer does not comply, it could give rise to enforcement action, leading to the same effect.
If the producer challenges the decision to enforce, it could give rise to a profoundly important court case that could clarify the interpretation of the waste hierarchy in the law in England and Wales.
5.6.2 Situation in other Member States
5.6.2.1 Mediterranean
In Croatia, the waste hierarchy principle is transposed in Article 7 of the Sustainable Waste Management Act, with respect to ‘waste prevention and management legislation and policy’.100 Article 11.5 goes on to state that
“Waste shall be managed in a manner which facilitates further waste management in accordance with Article 7, paragraph 1 and Article 9, paragraph 1 of this Act.”
This suggests the responsibilities of waste producers are with respect to the onward treatment of waste and although waste transfer notes are obligated by Article 44, they do not require certification of compliance with the waste hierarchy.
In Greece, the waste hierarchy is transposed in Article 29 of the Law 4042/2012 (OJG 24 A), with respect to “waste prevention and management legislation and policy”.101 Article 24 also states that
100
http://mzoip.hr/doc/act_on_sustainable_waste_management.pdf 101
http://www.ypeka.gr/LinkClick.aspx?fileticket=7Z1up05Xrto%3D&
74
“1. Initial producers or other waste holders carry out their own treatment or assign the treatment to a person or organization, or to an undertaking carrying out waste treatment operations or by arranging for a public or private waste collection organization in accordance with Articles 14 and 29.
2. Where the waste is transported by the original producer or holder to one or more legal persons referred to in paragraph 1, for pre-treatment, this does not imply, as a general rule, exemption from responsibility for carrying out a full recovery or disposal operation”
However see also Article 37.
“Any natural or legal person, such as an undertaking or organization whose activities involve the production, holding or carrying out of waste management operations within the meaning of Article 11, causes or is likely to cause damage to the By an act or omission contrary to the provisions of this Law, in particular Articles 14 and 29, and of the acts adopted pursuant thereto, which are punishable by the penalties provided for in Article 28 of the Convention 1650/1986, as amended by article 7 hereof.”
“Any natural or legal person, such as an undertaking or organization, whose activities involve the production, possession or management of waste within the meaning of Article 16 and causes harm to human health and the environment in violation of the provisions of this Act, and in particular Articles 14 and 29, and the regulatory acts adopted pursuant thereto, shall be imposed, irrespective of the criminal liability of the preceding paragraph , as administrative sanctions, alternatives or cumulative, fine or temporary or definitive cessation of the activity concerned, depending on the seriousness of the offense, the recidivism and the benefit of the infringer. The amount and the procedure for imposing the above mentioned administrative sanctions are determined in accordance with article 30 of Law 1650/1986, as amended by Law no. 3010/2003”
This could provide some basis for enforcing the requirements to prevent waste with respect to waste producers.
In Spain, the principle of the waste hierarchy was transposed Article 8 of Law 22/2011, again with respect to ‘waste prevention and management legislation and policy’.102 The requirement to respect the waste hierarchy in full is not passed on to waste producers; they are instructed to comply with local ordinances with respect to the treatment of waste (Article 17).
5.6.2.2 North-East Atlantic
In Belgium (Flanders), the hierarchy is transposed in the Decree of 23 December 2011 on Sustainable Management of Material Cycles and Waste (Materials Decree) (Article 4.3),
102
https://www.boe.es/buscar/act.php?id=BOE-A-2011-13046&p=20121220&tn=1
75
with respect to ‘measures’ contained within the Decree.103 The relevant Authority has power to obligate adherence to the hierarchy for granting of waste disposal and treatment permits, but we do not know if this has been carried out in practice. It does not seem to be intended to apply to producers of waste.
“Article 11. §1. The disposal of waste, and any preparatory operations preceding such disposal, shall be subject to a licence obligation. The recovery of waste, and any preparatory operations preceding such recovery, shall be subject to a licence or reporting obligation. The Government of Flanders may subject the use of materials to a licence or notification obligation in accordance with the objectives mentioned in Article 4.”
We also note that Article 16 contains a green public procurement requirement:
“The tender specifications of authorities of the Flemish Region and of local authorities shall include provisions aimed at promoting the purchase of:
1° - products or services which, taking into account the entire life cycle, contribute to a better closure of material cycles or have a lower environmental impact than similar alternatives;
2° - raw materials obtained from waste or products made therefrom.”
Belgium (Brussels region) – The hierarchy is transposed in Article 6, as usual, with respect to waste prevention and management legislation and policy.104 Article 23 states:
“A waste producer or other waste holder must undertake waste treatment themselves, or delegate waste treatment to a waste treatment business, facility or company; or to waste collection services; they must be in accordance with Articles 6 and 17”
Again, this appears to be referring to waste treatment and implicitly excludes the process of waste prevention.
5.6.2.3 Baltic
In Poland, Article 17 of the Act of 14 December 2012 (Journal of Laws 2013 item 21) transposes the principle of the waste hierarchy; this time, with respect to “waste handling methods”.105 Article 18 makes clear that
“Anyone who undertakes activities that cause or are likely to cause waste should plan, design and conduct such activities by means of production methods or forms of service and raw materials and materials in order to prevent waste as a first
103
https://navigator.emis.vito.be/mijn-navigator?woId=41773, https://navigator.emis.vito.be/htmlServlet?woId=41707&woLang=en&version=2017-04-13&lang=nl 104 http://www.ejustice.just.fgov.be/cgi_loi/change_lg.pl?language=fr&la=F&table_name=loi&cn=2012061402 105
http://dziennikustaw.gov.pl/DU/2013/21/1
76
step, or to reduce waste and their negative impact on life and human health and the environment, including the manufacture of products, during and after their use.”
In general sanctions appear to be applicable in the broader case where harm to the environment or human health can be demonstrated (i.e. contravention of Article 16, that the management of waste should be carried out in a way that protects human life and health and the environment, rather than Article 17); as specified in Article 171.
In Finland, the hierarchy is transposed in Section 8 of the Waste Act 646/2011, and does apply directly to the waste holder and waste operations.106 The reporting regime appears to apply only to waste operators, with records requiring to be maintained only in the case that over 100 tonnes of waste are handled per year. Penalties are however applied to any individual who violates the Waste Act, but serious environmental harm must be demonstrated. Section 11 of the Waste Act obliges authorities, institutions and bodies governed by public law, to use in their operations, as far as possible, durable, reparable, re-usable or recyclable products and products made of recycled raw materials, as well as services that generate the minimum, least harmful waste possible.
Sweden: The hierarchy is transposed in Chapter 2, Section 5 and Chapter 15, Section 10 of the Environmental Code.107 The provision in Chapter 2 applies to any activity that may cause harm or disadvantage to human health or the environment:
“Section 5. Everyone who conducts an activity or undertakes a measure shall conserve raw materials and energy and take advantage of the possibility of 1. reduce the amount of waste, 2. reduce the amount of harmful substances in materials and products; 3. Reduce the negative effects of waste, and 4. Recycle waste.”
Under Chapter 30, Section 1, a penalty can be applied to anyone that disregards provisions in the code.
5.6.2.4 Black Sea Area
In Bulgaria, the waste hierarchy is transposed in the Waste Management Act (ZUO) 2012. We were unable to find specific measures relevant to obligation for waste producers to prevent waste; measures seem aimed at moving management away from lower tiers of the hierarchy.108 They have produced a National Waste Management Plan (NPUO) for
106
https://translate.google.co.uk/translate?sl=fi&tl=en&js=y&prev=_t&hl=en&ie=UTF-8&u=http%3A%2F%2Ffinlex.fi%2Ffi%2Flaki%2Fajantasa%2F2011%2F20110646&edit-text= 107
http://www.riksdagen.se/sv/dokument-lagar/dokument/svensk-forfattningssamling/miljobalk-1998808_sfs-1998-808 108
http://www5.moew.government.bg/wp-content/uploads/filebase/Waste/Legislation/Zakoni/ZUO.pdf
77
the period 2014-2020 which contains the first National Waste Prevention Programme.109 The implementation report states that the nation favours ‘softer’ waste prevention instruments (voluntary measures, self-restraint, and awareness) because legislative measures (e.g. bans), are too difficult to implement.
5.6.3 Conclusion
We can see that the way in which the waste hierarchy has been transposed in different Member States varies with respect to:
Whether the hierarchy is applicable to the drafting of waste management policy versus the management of waste directly. The obligation that the hierarchy should be applied to policy rather than waste management derives from the wording of the original EU Directive and this has led to weaker implementation of the waste hierarchy
Whether the responsibility of applying the hierarchy is given to the waste producer or subsequent waste holders
Whether the hierarchy is introduced with respect to requirements for ‘waste treatment’ rather than, more comprehensively, all the activities of waste producers/holders.
Whether there are provisions for applying sanctions to individuals or organisations who do not respect the waste hierarchy in their activities, not just with regards to waste treatment.
There is scope for improvement of the wording of the Directive and with respect to national waste legislation which transposes it. In some countries (of those reviewed – the UK, Greece and Sweden), because of the provisions for the hierarchy to be applied by waste producers, and/or enforcement for this requirement, there is scope for campaigning for the hierarchy to be applied and enforced. There may be more countries for which these two conditions are met.
Either the Waste Framework Directive or national waste legislation should state that the responsibility for applying the waste hierarchy should lie with waste producers and handlers (waste holders) as well as legislators; and that enforcement should be applied.
109
http://www5.moew.government.bg/wp-content/uploads/filebase/Waste/NACIONALEN_PLAN/_/NPUO_2014-2020.pdf
78
6.0 Best Practice Case Studies
We have collated a series of ten case studies from across the globe which demonstrate successful and initiatives and legislation to tackle the consumption of single-use plastic items and their littering.
6.1 “Münchner Einwegverbot”
In Munich, Germany, a ban on disposable drink containers and tableware for large scale public events on land owned by the authority has been in place since 1990. The City offers rental of mobile dishwashers and crockery sets. It is estimated that between enforcement and 2004, 50% less waste has been generated by events, and the higher investment of purchasing reusable cups in recovered after 7 to 11 reuses, when washing, street cleaning and disposal is taken into account.
6.2 Copenhagen Water Fountains
In Copenhagen, Denmark, 60 drinking fountains have been installed across the city to encourage the use of refillable bottles. HOFOR Utilities Company, who installed the fountains, estimate 1 litre of water from the fountain as a 0.0002 kg CO2 eq. compared to 0.18 kg CO2 eq. from 1 litre of bottles water.
6.3 French Disposables Ban
France is to implement a ban on plastic food wares sold in supermarkets from 2020 as part of the country’s Energy Transition for Green Growth. The proposal has seen some friction between plastic manufacturers who argue the ban infringes the right of free movement of goods. It also will not prevent caterers buying plastic tableware from wholesalers. This demonstrates the complexity and loop-holes around implementing national laws.
6.4 The Last Straw
The Last Straw Movement in Hong Kong, funded by Sea Shepard Asia, has taken the approach of replacing plastic straws with sustainably produced eucalyptus pulp straws in venues across the city. They sell the straws to venues at cost price, although they cost more to produce than plastic ones, the movement encourages their sale through awareness campaigns. So far they have been sold to 26 venues, preventing 303000 plastic straws being used. The aim is to scale this up across Asia.
6.5 Beverage Container Deposit Refund System
A Deposit Refund System (DRS) for plastic beverage bottles and cans has been in place in Norway since 1994. 500ml standard drinks bottles have a 1 Kroner (10p) deposit, with larger bottles carrying more. Money from unclaimed bottles is used to fund the scheme. In 2012 Norway saw 95% recovery rates. the estimated carbon emissions reduction from recycling bottles and cans was 185,000 tonnes in 2015.Producers who do not sign up to
79
the Norsk Resirk AS operates system scheme pay a fixed environmental fee per can/ bottle. Those signed up can receive a discount to environmental fees if return rate is 25-95% and becomes 0 when greater than 95%. The high return rates demonstrate the public acceptance of the DRS, and that returning bottles is now considered a “norm”. This should give support to DRS implementation in the UK and other countries.
6.6 ReThink Disposable
In California, Clean Water Action is running a “ReThink Disposable” program in which they give advice to restaurants and food outlets in the area, as to how switching from using single-use disposable food wares, reusable crockery or environmentally friendly options can both save them money and reduce plastic waste. This cost-benefit approach has been successful in gaining support and case studies demonstrate savings in one instance of $9000 a year whilst preventing 50,000 disposable item usage and 3600 pounds of waste.
6.7 Bottled Water Ban
In 2016 San Francisco became the first US city to ban the sale of bottled water on city property. The San Francisco Board of Supervisors passed Ordinance 28-14 which amends its Environmental Code to execute the ban on bottles containing 21 ounces or less. The aim is to fulfil targets of no waste to landfill by 2020. Sport events are excluded from the ban, but new and existing permits and leases on City property need to include language prohibiting the sale of bottled water. The Government is also taking action to increase access to water in public places, through fountains and hook-ups.
6.8 The Freiburg Cup
The Freiburg Cup is an incentive started by the Council and University of Freiburg, Germany in 2016. The reusable cup has replaced one-use disposable coffee cups in cafes and bakeries across the city, and can be bought for a €1 deposit, and is washed and redistributed by the participating stores.
6.9 Refill Revolution, Tennessee
Starting in 2016, the Refill Revolution at Bonnaroo Festival, Tennessee aims to reduce plastic waste by offering festival goers alternative to plastic, by installing water-refill stations and selling reusable bottles and steel cups with carrying straps with incentives such as a free beer. In 2016, 300,000 fewer beer cups were used, and the organisers estimated 800,000 fewer water bottles were used. It would be interesting to consider the potential benefits if this idea could be integrated into the Green Public Procurement (GPP) to make reusable cups and bottles mandatory at large public events such as festivals.
80
6.10 The Mobile Water Station, Illinois
In Evanston, Illinois, the City Council has developed a Mobile Water Station, which provides clean tap water at events and can be hired for $100. In 2014 it supplied water at 55 events, reducing disposable 12-ounce bottle use by 99,000.
7.0 Conclusions
There is an extremely high rate of consumption of single-use plastic items in Europe. Of the items considered here, cigarette butts are by far the greatest in number, at 580 billion per year. It is no coincidence that cigarette butts are the most common item of beach litter found in most regions of Europe. The other items under consideration, for which we were able to make an estimate (bottles, cups and lids, straws, and takeaway packaging), total 173.5 billion items per year – equivalent to approximately 230 items per year for every adult and child.
These items are also prominent in lists of top items found polluting our beaches. This is hardly surprising, given that as well as being consumed in such large quantities, all of these items are low value (so likely to be discarded) and lightweight (therefore easily transported through various pathways to the sea).
Packaging drives a considerable proportion (around 40%) of plastics demand; single-use items will account for a significant proportion of this. Our estimate is around 40% for bottles, for example. This constitutes a lot of items and a lot of material expressly designed to be taken, made and thrown away after one use.
As Europe makes efforts to transition to a circular economy in which resources are used efficiently and materials are captured for reprocessing into new products, the high consumption of single-use plastic items stands in antithesis to the ambitions of EU policy. Moreover, using items just once before discarding them does not only represent a thoughtless waste of resources, but also contributes to climate change through the greenhouse gas emissions associated with the use of virgin materials.
Therefore, efforts to reduce plastic consumption bring multiple environmental benefits in addition to helping to protect the marine environment.
There are many points at which incentives can be provided to manufacturers, producers and consumers to prevent waste and litter. Several pieces of EU legislation, from the Waste Framework Directive and the Packaging Waste Directive, to strategy documents like the Circular Economy Package and the Plastics Strategy, are in the process of being revised at this very moment. Incentives to improve design for preventing waste and litter, incentives to sell and choose reusables, and incentives to return items rather than litter them, can be mandated.
81
Surveys show that measures to enact these principles are popular with the public and the research available shows that they are effective in producing high quality material streams for recycling and pushing up capture rates to high levels.
There are many successful initiatives that have been implemented both with the support of national and local legislation, or as independent initiatives, to reduce the consumption of single-use items. There is huge potential for their roll-out across Europe. With the right support from the European Commission, national and local government, the resulting increase in co-ordination will yield the maximum impact and the maximum protection of the oceans.