Embed Size (px)
Citation preview
ASIAN DEVELOPMENT BANK
AsiAn Development BAnk6 ADB Avenue, Mandaluyong City1550 Metro Manila, Philippineswww.adb.org
Leverage and Capital Structure Determinants of Chinese Listed Companies
We assess the financial fragility of the Chinese economy by looking at risk factors in the nonfinancial sector. Quantile regressions applied to financial data of Chinese listed companies find increasing sensitivity over time of corporate leverage to some of its key determinants. In particular, profitability increasingly acts as a curb on corporate leverage during recent years. At this time of low profitability across the Chinese nonfinancial corporate sector, this may contribute to further increases in corporate leverage over time.
About the Asian Development Bank
ADB’s vision is an Asia and Pacific region free of poverty. Its mission is to help its developing member countries reduce poverty and improve the quality of life of their people. Despite the region’s many successes, it remains home to a large share of the world’s poor. ADB is committed to reducing poverty through inclusive economic growth, environmentally sustainable growth, and regional integration.
Based in Manila, ADB is owned by 67 members, including 48 from the region. Its main instruments for helping its developing member countries are policy dialogue, loans, equity investments, guarantees, grants, and technical assistance.
adb economicsworking paper series
NO. 509
January 2017
LeverAge AND CApitAL StruCture DetermiNANtS Of ChiNeSe LiSteD COmpANieSBenno Ferrarini, Marthe Hinojales, and Pasquale Scaramozzino
ADB Economics Working Paper Series
Leverage and Capital Structure Determinants of Chinese Listed Companies Benno Ferrarini, Marthe Hinojales, and Pasquale Scaramozzino
No. 509 | January 2017
Benno Ferrarini ([email protected]) is a senior economist and Marthe Hinojales ([email protected]) is an economics officer at the Economic Research and Regional Cooperation Department, Asian Development Bank. Pasquale Scaramozzino ([email protected]) is professor of Economics, School of Finance and Management at SOAS, University of London and Dipartimento di Economia e Finanza, Università di Roma Tor Vergata.
Creative Commons Attribution 3.0 IGO license (CC BY 3.0 IGO)
© 2017 Asian Development Bank6 ADB Avenue, Mandaluyong City, 1550 Metro Manila, PhilippinesTel +63 2 632 4444; Fax +63 2 636 2444www.adb.org
Some rights reserved. Published in 2017. Printed in the Philippines.
ISSN 2313-6537 (Print), 2313-6545 (e-ISSN)Publication Stock No. WPS178640-2DOI: http://dx.doi.org/10.22617/WPS178640-2
Cataloging-In-Publication Data
Asian Development Bank.Leverage and capital structure determinants of chinese listed companies.
Mandaluyong City, Philippines: Asian Development Bank, 2017.
1. Corporate debt. 2. Debt sustainability. 3. Panel quantile regression. 4. People’s Republic of China. I. Asian Development Bank.
The views expressed in this publication are those of the authors and do not necessarily reflect the views and policies of the Asian Development Bank (ADB) or its Board of Governors or the governments they represent.
ADB does not guarantee the accuracy of the data included in this publication and accepts no responsibility for any consequence of their use. The mention of specific companies or products of manufacturers does not imply that they are endorsed or recommended by ADB in preference to others of a similar nature that are not mentioned.
By making any designation of or reference to a particular territory or geographic area, or by using the term “country” in this document, ADB does not intend to make any judgments as to the legal or other status of any territory or area.
This work is available under the Creative Commons Attribution 3.0 IGO license (CC BY 3.0 IGO) https://creativecommons.org/licenses/by/3.0/igo/. By using the content of this publication, you agree to be bound by the terms of this license.
This CC license does not apply to non-ADB copyright materials in this publication. If the material is attributed to another source, please contact the copyright owner or publisher of that source for permission to reproduce it. ADB cannot be held liable for any claims that arise as a result of your use of the material.
Attribution—You should always acknowledge ADB as the source using the following format:[Author]. [Year of publication]. [Title of the work in italics]. [City of publication]: [Publisher]. © ADB. [URL or DOI]
[license].
Translations—Any translations you create should carry the following disclaimer:Originally published by ADB in English under the title [title in italics]. © ADB. [URL or DOI] [license]. The quality
of the translation and its coherence with the original text is the sole responsibility of the translator. The English original of this work is the only official version.
Adaptations—Any adaptations you create should carry the following disclaimer:This is an adaptation of an original work titled [title in italics]. © ADB. [URL or DOI][license]. The views expressed
here are those of the authors and do not necessarily reflect the views and policies of ADB or its Board of Governors or the governments they represent. ADB does not endorse this work or guarantee the accuracy of the data included in this publication and accepts no responsibility for any consequence of their use.
Please contact [email protected] if you have questions or comments with respect to content, or if you wish to obtain copyright permission for your intended use that does not fall within these terms, or for permission to use the ADB logo.
Notes:1. In this publication, “$” refers to US dollars.2. ADB recognizes “China” as the People’s Republic of China and “South Korea” as the Republic of Korea.3. Corrigenda to ADB publications may be found at http://www.adb.org/publications/corrigenda
CONTENTS TABLES AND FIGURES iv ABSTRACT v I. INTRODUCTION 1 II. CORPORATE LEVERAGE AND GROWING FINANCIAL RISK 2 III. DETERMINANTS OF CORPORATE DEBT 8 A. Panel Fixed Effects 9 B Quantile Regression Panel Data 10 C. Simultaneous Panel Quantile Regressions 13 IV. CONCLUSIONS 16 V. APPENDIX 17 REFERENCES 25
TABLES AND FIGURES TABLES 1 Capital Structure of Nonfinancial Firms, Panel Fixed Effects 9 2 Capital Structure of Nonfinancial Firms, Quantile Regression Panel Data 12 3 Capital Structure of Nonfinancial Corporations: Simultaneous Panel Quantile Regressions 14 A1 The S&P Capital IQ Database and Regression Variables 17 A2.1 Regression Variables—Summary by Years 18 A2.2 Regression Variables—Summary by Leverage Quantiles 19 A3 Interest Coverage Ratio and Nonfinancial Corporate Sector Leverage 19 A4.1 Capital Structure of Nonfinancial Corporations—SQR for Long-term Leverage 20 A4.2 Capital Structure of Nonfinancial Corporations—SQR for Short-term Leverage 21 A4.3 Capital Structure of Nonfinancial Corporations—SQR for the Inverse of ICR 22 A4.4 Capital Structure of Nonfinancial Corporations—SQR for Debt-earnings Ratio 23 A4.5 Capital Structure of Nonfinancial Corporations—SQR for the Inverse of Altman Z-score 24 FIGURES 1 People’s Republic of China—Total Debt 2 2 People’s Republic of China—Benchmark Lending Rate 3 3 Nonfinancial Corporate Debt at Risk 4 4 Nonfinancial Sector ICR Quantiles 5 5 Nonfinancial Sector Profitability 5 6 Total Assets 6 7 Return on Assets 6 8 Total Capital Ratios 7 9 Coverage Ratio 7 10 Simultaneous Panel Quantile Regressions 15
ABSTRACT Total debt in the People’s Republic of China has increased significantly in recent years, mostly on account of nonfinancial corporate debt. Earning and the financial performance of corporate firms have weakened, and so has the asset quality of the financial sector. This paper assesses the financial fragility of the Chinese economy by looking at risk factors in the nonfinancial sector. We apply quantile regressions to a rich dataset of Chinese listed companies contained in Standard & Poor’s IQ Capital database. We find higher sensitivity over time of corporate leverage to some of its key determinants, particularly for firms at the upper margin of the distribution. In particular, profitability increasingly acts as a curb on corporate leverage. At a time of falling profitability across the Chinese nonfinancial corporate sector, this eases the brake on leverage and may contribute to its continuing increase. Keywords: corporate debt, debt sustainability, panel quantile regression, People’s Republic of China JEL codes: G01, G21, H30, H60
I. INTRODUCTION Corporate leverage in the People’s Republic of China (PRC) accelerated in the aftermath of the global financial crisis, accentuating industrial overcapacity in traditional sectors and fueling asset bubbles in the property, stock, and bond markets. Earnings and financial performance of companies have deteriorated, and with them the asset quality of the Chinese financial sector holding the bulk of the corporate debt. Warnings about the dangers of excessive corporate leverage and financial sector vulnerability have been a staple of the international press since at least 2015, and also the Chinese authorities have recognized the problem.
Much of the debate on debt and financial sustainability in the PRC has centered on aggregate data and indicators, which suggest a marked rise in corporate debt and nonperforming loans held by the domestic banking system. However, a macro focus tends to overlook heterogeneity and vulnerabilities at the micro level, which are relevant to policy formulation (Bernanke and Campbell 1988). For example, recent market analysis associates the energy sector with the lowest return on capital and the largest increase in nonperforming loan ratios among Chinese industries, suggesting that it should be a prime focus of authorities’ monitoring efforts (S&P Global Market Intelligence 2016).
Additional and more systematic insights can be gained from regression analysis of corporate
balance sheet data. Early attempts, predating the recent credit surge, can be found in the literature assessing the determinants of capital structure in the PRC (e.g. Chen 2004, Huang and Song 2006). It shows that the insights from modern finance theory of capital structure are borne out in the Chinese corporate data, notwithstanding institutional differences compared to the United States (US) and European markets and the presence of financial constraints in the Chinese banking sector.1
This paper builds on this strain of literature to determine the drivers of nonfinancial corporate
debt in the PRC during the credit surge since 2009. Focus is on the margins of the corporate distribution and on variations in the determinants of corporate leverage that could signal rising risk of financial distress particularly in these segments of the Chinese corporate landscape. This is accomplished through the use of panel and simultaneous quantile analysis, beyond the mean-based ordinary least squares regression analysis of previous approaches. The empirical investigation relies on Standard & Poor’s (S&P) IQ Capital database, which contains richly detailed historical balance sheet data and key financial indicators of Chinese companies up until 2015 at this time of writing. The dataset is summarized in Appendix Tables A1, A2.1, and A2.2.
We find that, over time, corporate leverage has become more sensitive to changes in some of its key determinants, particularly for firms at the upper margin of the distribution. In particular, profitability appears to have increased over time its impact as a curb on corporate leverage. Among the underlying reasons is the government-induced massive stimulus to stem the global financial crisis, which caused a significant decline in lending rates and incentivizes companies to borrow instead of relying on retained earnings as a source of funding. This eases the brake on leverage at a time when corporate profitability is falling, and likely contributes to further rises of corporate debt.
The paper is structured to provide a brief overview of rising leverage and financial risk in the
PRC’s corporate sector, in section II. This is followed, in section III, by a presentation of the empirical
1 In particular, the state exerts vast control over the state-owned enterprises and the financial system, which reduces the
likelihood and costs of financial distress compared to those facing the private corporate sector (Chen 2004, Borst and Lardy 2015).
2 | ADB Economics Working Paper Series No. 509
framework and the data used, and a discussion of the results achieved. The paper closes with lessons for policy and broader conclusions, in section IV.
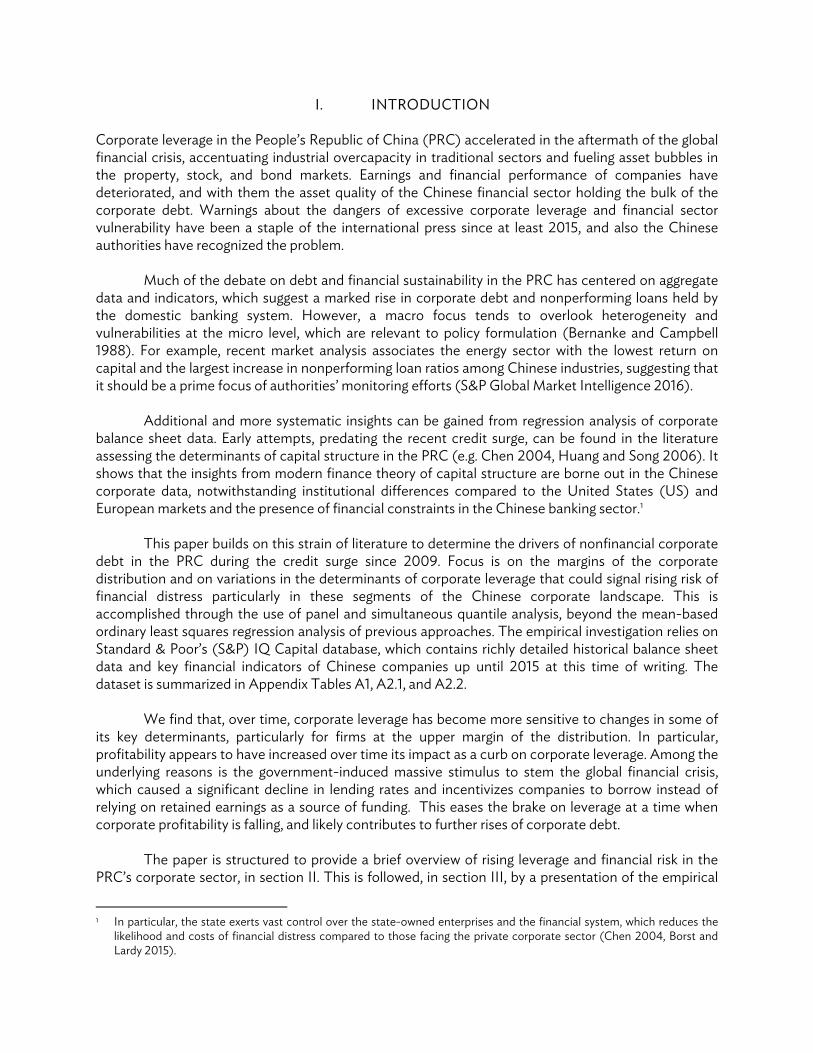
II. CORPORATE LEVERAGE AND GROWING FINANCIAL RISK Stable at roughly 40% of gross domestic product (GDP) in 2015, general government debt in the PRC is not particularly large compared to other emerging economies.2 However, total debt across all sectors ballooned to nearly 290% by the second quarter of 2016 (Figure 1). The massive buildup of debt—mostly domestic—accelerated from the end of 2008 onward, when the government enacted unprecedented monetary and fiscal stimulus to stem the impact of the global financial crisis.3 Fiscal stimulus alone amounted to nearly CNY6 trillion—or 18.5% of GDP—between 2008 and 2010 (Ferrarini, Jha, and Ramayandi 2012).
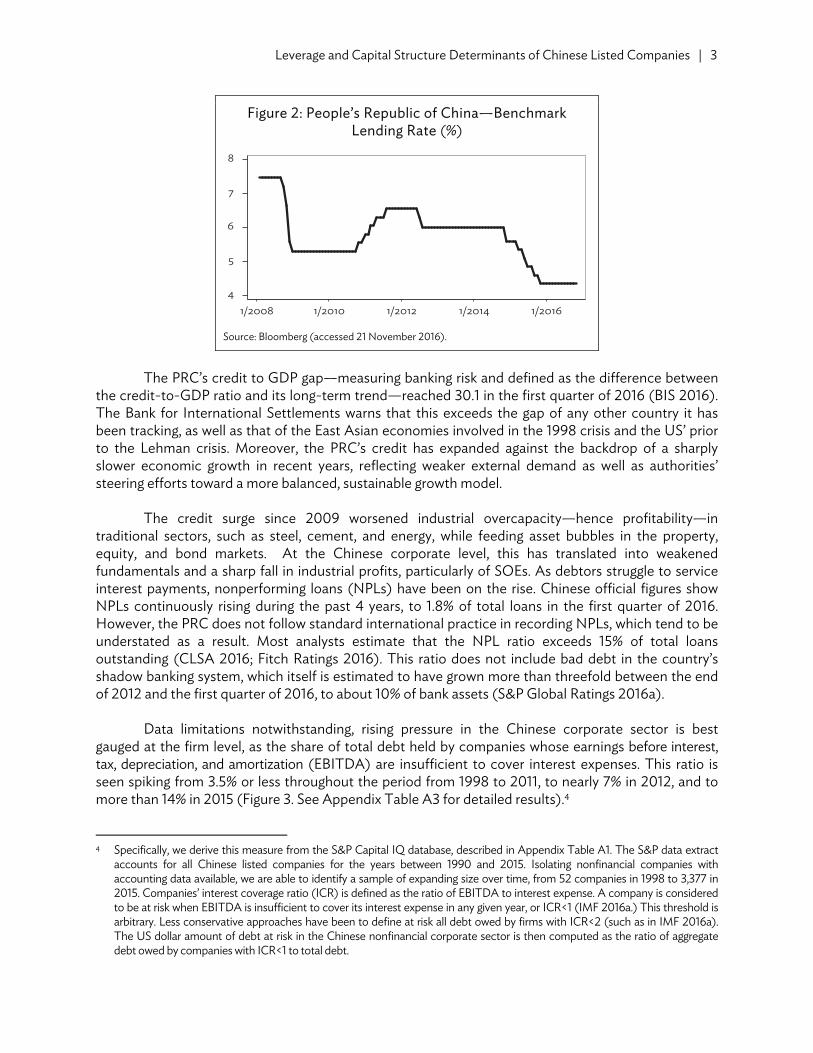
Stimulus often was directed to the state-owned enterprises (SOEs) whose liabilities grew to 115% of GDP in 2015, or funneled through the policy and state-controlled commercial banks. The net effect of intervention was a significant though discontinuous fall in the benchmark lending rate, from nearly 7.5% in January 2008 to 5.3% by 2010, and 4.3% by the end of 2015 (Figure 2). The decline in the lending rate is likely to have altered the relative opportunity cost of the alternative funding sources for firms, and in particular between retained earnings and external debt.
Figure 1: People’s Republic of China—Total Debt (% of GDP)
GDP = gross domestic product. Note: Q2 2016 is an estimate. Source: International Institute of Finance. 2016. Emerging Market Debt Monitor, June 2016. Washington, DC.
2 Accounting for both explicit and contingent off-budget liabilities incurred by local governments through their financing
platforms, the International Monetary Fund estimates that the PRC’s public debt ratio is substantially higher, at 56% in 2015, and will rise to nearly 74% of GDP by 2021 (IMF 2016b).
3 And grow it did: the PRC’s real GDP expanded on average by nearly 9.2% each year between 2009 and 2013, while the US, Japan, and the euro area were struggling with 0.3% growth on average (ADB 2011, 2013).
0
100
200
300
Q4
1996
Q4
1997
Q4
1998
Q4
1999
Q4
2000
Q4
2001
Q4
2002
Q4
2003
Q4
2004
Q4
2005
Q4
2006
Q4
2007
Q4
2008
Q4
2009
Q4
2010
Q4
2011
Q4
2012
Q4
2013
Q4
2014
Q4
2015
Q2
2016
Government HouseholdsNonfinancial corporations Financial corporations
Leverage and Capital Structure Determinants of Chinese Listed Companies | 3
Figure 2: People’s Republic of China—Benchmark Lending Rate (%)
Source: Bloomberg (accessed 21 November 2016).
The PRC’s credit to GDP gap—measuring banking risk and defined as the difference between
the credit-to-GDP ratio and its long-term trend—reached 30.1 in the first quarter of 2016 (BIS 2016). The Bank for International Settlements warns that this exceeds the gap of any other country it has been tracking, as well as that of the East Asian economies involved in the 1998 crisis and the US’ prior to the Lehman crisis. Moreover, the PRC’s credit has expanded against the backdrop of a sharply slower economic growth in recent years, reflecting weaker external demand as well as authorities’ steering efforts toward a more balanced, sustainable growth model.
The credit surge since 2009 worsened industrial overcapacity—hence profitability—in
traditional sectors, such as steel, cement, and energy, while feeding asset bubbles in the property, equity, and bond markets. At the Chinese corporate level, this has translated into weakened fundamentals and a sharp fall in industrial profits, particularly of SOEs. As debtors struggle to service interest payments, nonperforming loans (NPLs) have been on the rise. Chinese official figures show NPLs continuously rising during the past 4 years, to 1.8% of total loans in the first quarter of 2016. However, the PRC does not follow standard international practice in recording NPLs, which tend to be understated as a result. Most analysts estimate that the NPL ratio exceeds 15% of total loans outstanding (CLSA 2016; Fitch Ratings 2016). This ratio does not include bad debt in the country’s shadow banking system, which itself is estimated to have grown more than threefold between the end of 2012 and the first quarter of 2016, to about 10% of bank assets (S&P Global Ratings 2016a).
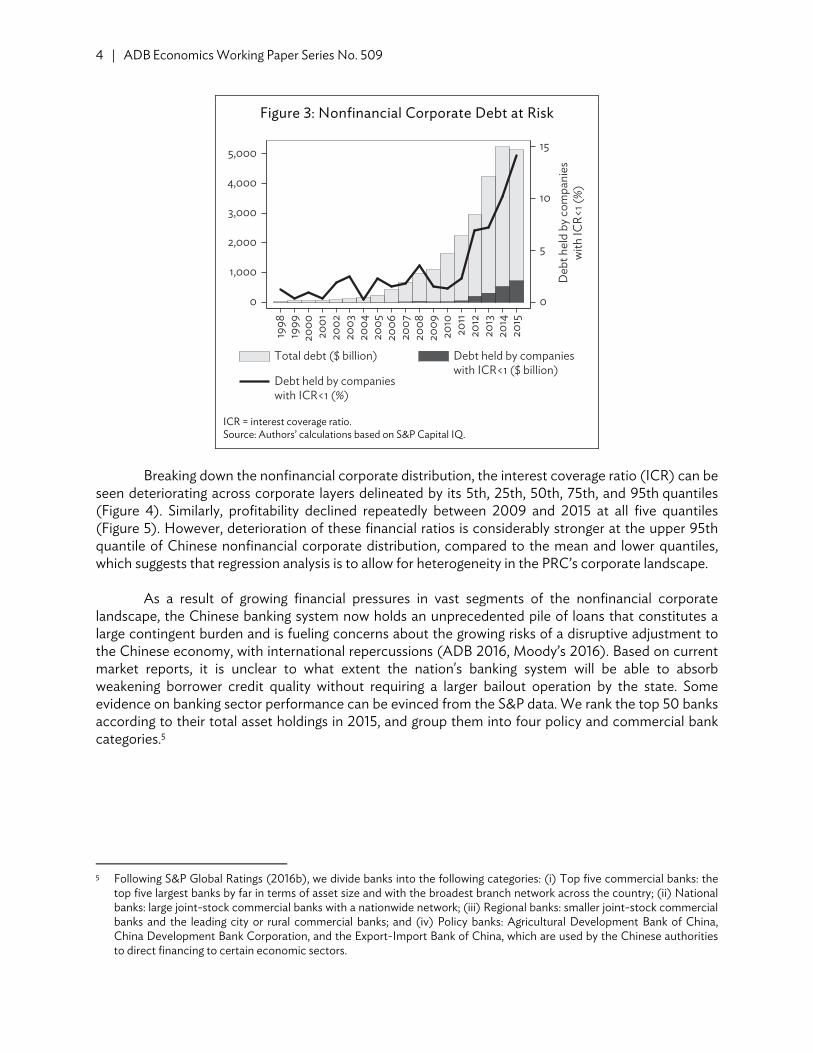
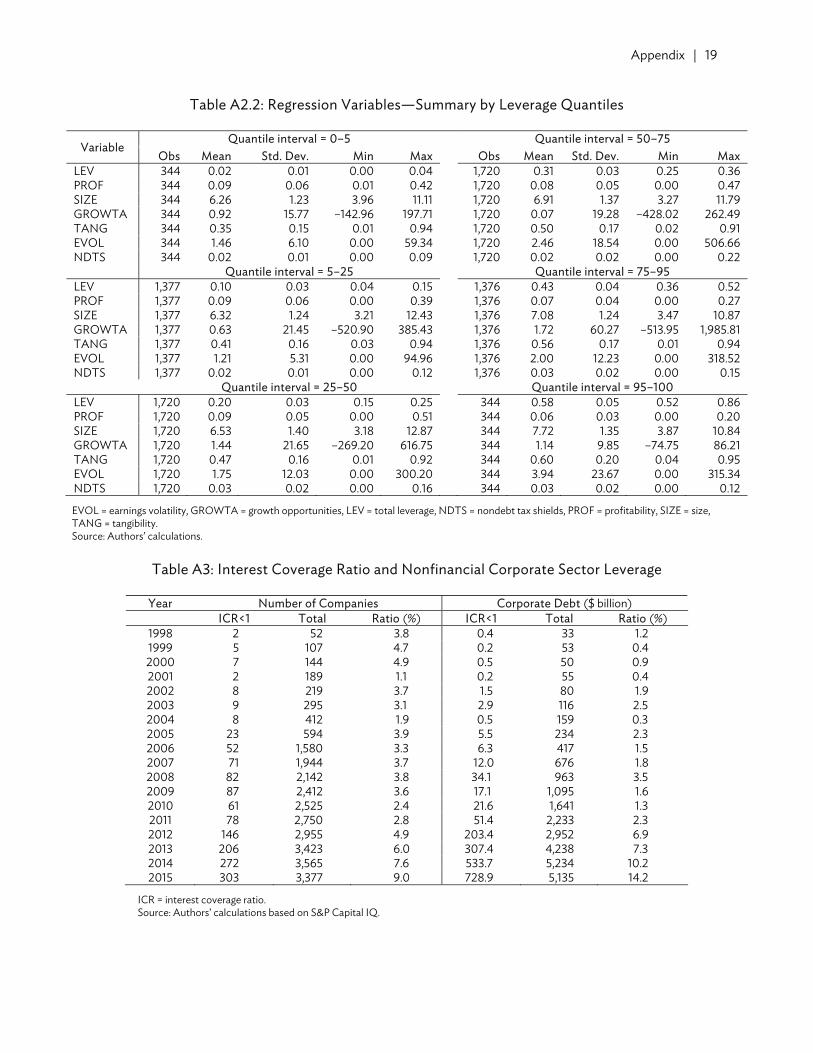
Data limitations notwithstanding, rising pressure in the Chinese corporate sector is best gauged at the firm level, as the share of total debt held by companies whose earnings before interest, tax, depreciation, and amortization (EBITDA) are insufficient to cover interest expenses. This ratio is seen spiking from 3.5% or less throughout the period from 1998 to 2011, to nearly 7% in 2012, and to more than 14% in 2015 (Figure 3. See Appendix Table A3 for detailed results).4
4 Specifically, we derive this measure from the S&P Capital IQ database, described in Appendix Table A1. The S&P data extract
accounts for all Chinese listed companies for the years between 1990 and 2015. Isolating nonfinancial companies with accounting data available, we are able to identify a sample of expanding size over time, from 52 companies in 1998 to 3,377 in 2015. Companies’ interest coverage ratio (ICR) is defined as the ratio of EBITDA to interest expense. A company is considered to be at risk when EBITDA is insufficient to cover its interest expense in any given year, or ICR<1 (IMF 2016a.) This threshold is arbitrary. Less conservative approaches have been to define at risk all debt owed by firms with ICR<2 (such as in IMF 2016a). The US dollar amount of debt at risk in the Chinese nonfinancial corporate sector is then computed as the ratio of aggregate debt owed by companies with ICR<1 to total debt.
4
5
6
7
8
1/2008 1/2010 1/2012 1/2014 1/2016
4 | ADB Economics Working Paper Series No. 509
Figure 3: Nonfinancial Corporate Debt at Risk
ICR = interest coverage ratio. Source: Authors’ calculations based on S&P Capital IQ.
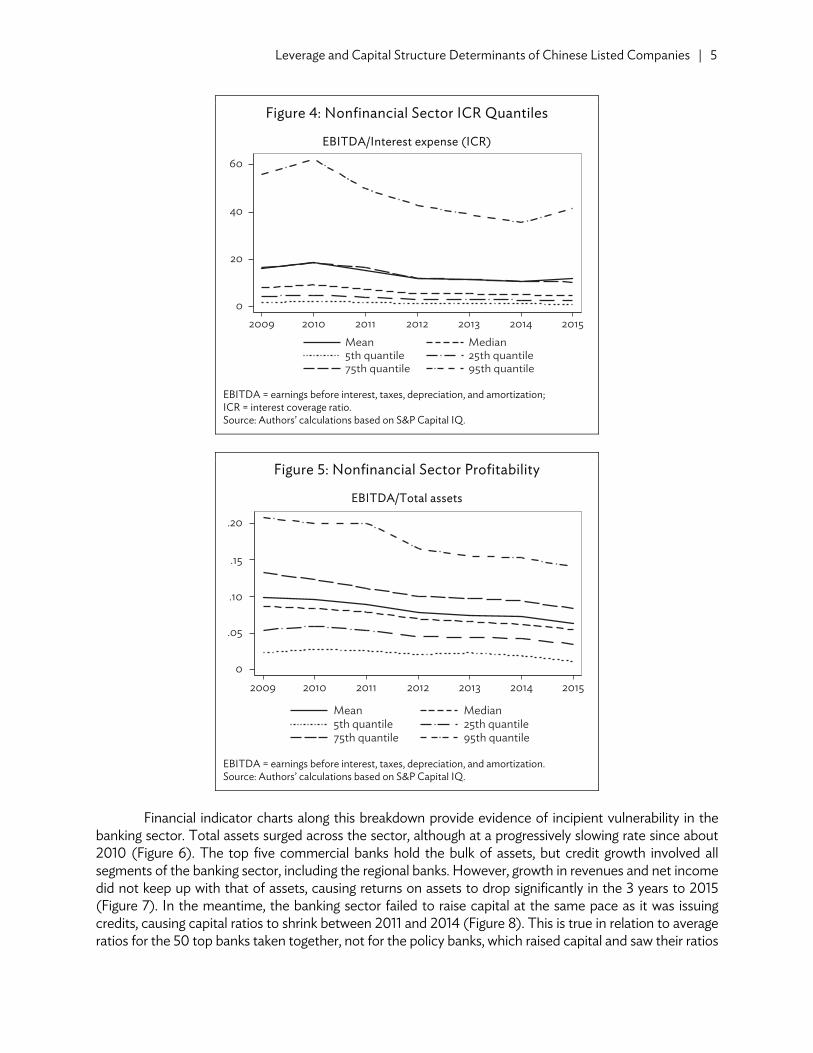
Breaking down the nonfinancial corporate distribution, the interest coverage ratio (ICR) can be
seen deteriorating across corporate layers delineated by its 5th, 25th, 50th, 75th, and 95th quantiles (Figure 4). Similarly, profitability declined repeatedly between 2009 and 2015 at all five quantiles (Figure 5). However, deterioration of these financial ratios is considerably stronger at the upper 95th quantile of Chinese nonfinancial corporate distribution, compared to the mean and lower quantiles, which suggests that regression analysis is to allow for heterogeneity in the PRC’s corporate landscape.
As a result of growing financial pressures in vast segments of the nonfinancial corporate landscape, the Chinese banking system now holds an unprecedented pile of loans that constitutes a large contingent burden and is fueling concerns about the growing risks of a disruptive adjustment to the Chinese economy, with international repercussions (ADB 2016, Moody’s 2016). Based on current market reports, it is unclear to what extent the nation's banking system will be able to absorb weakening borrower credit quality without requiring a larger bailout operation by the state. Some evidence on banking sector performance can be evinced from the S&P data. We rank the top 50 banks according to their total asset holdings in 2015, and group them into four policy and commercial bank categories.5
5 Following S&P Global Ratings (2016b), we divide banks into the following categories: (i) Top five commercial banks: the
top five largest banks by far in terms of asset size and with the broadest branch network across the country; (ii) National banks: large joint-stock commercial banks with a nationwide network; (iii) Regional banks: smaller joint-stock commercial banks and the leading city or rural commercial banks; and (iv) Policy banks: Agricultural Development Bank of China, China Development Bank Corporation, and the Export-Import Bank of China, which are used by the Chinese authorities to direct financing to certain economic sectors.
0
5
10
15
Deb
t hel
d by
com
pani
esw
ith IC
R<1 (
%)
0
1,000
2,000
3,000
4,000
5,000
Total debt ($ billion) Debt held by companieswith ICR<1 ($ billion)
Debt held by companieswith ICR<1 (%)
1998
1999
2000
2001
2002
2003
2004
2005
2006
2007
2008
2009
2010
2011
2012
2013
2014
2015
Leverage and Capital Structure Determinants of Chinese Listed Companies | 5
Figure 4: Nonfinancial Sector ICR Quantiles
EBITDA/Interest expense (ICR)
EBITDA = earnings before interest, taxes, depreciation, and amortization; ICR = interest coverage ratio. Source: Authors’ calculations based on S&P Capital IQ.
Figure 5: Nonfinancial Sector Profitability
EBITDA/Total assets
EBITDA = earnings before interest, taxes, depreciation, and amortization. Source: Authors’ calculations based on S&P Capital IQ.
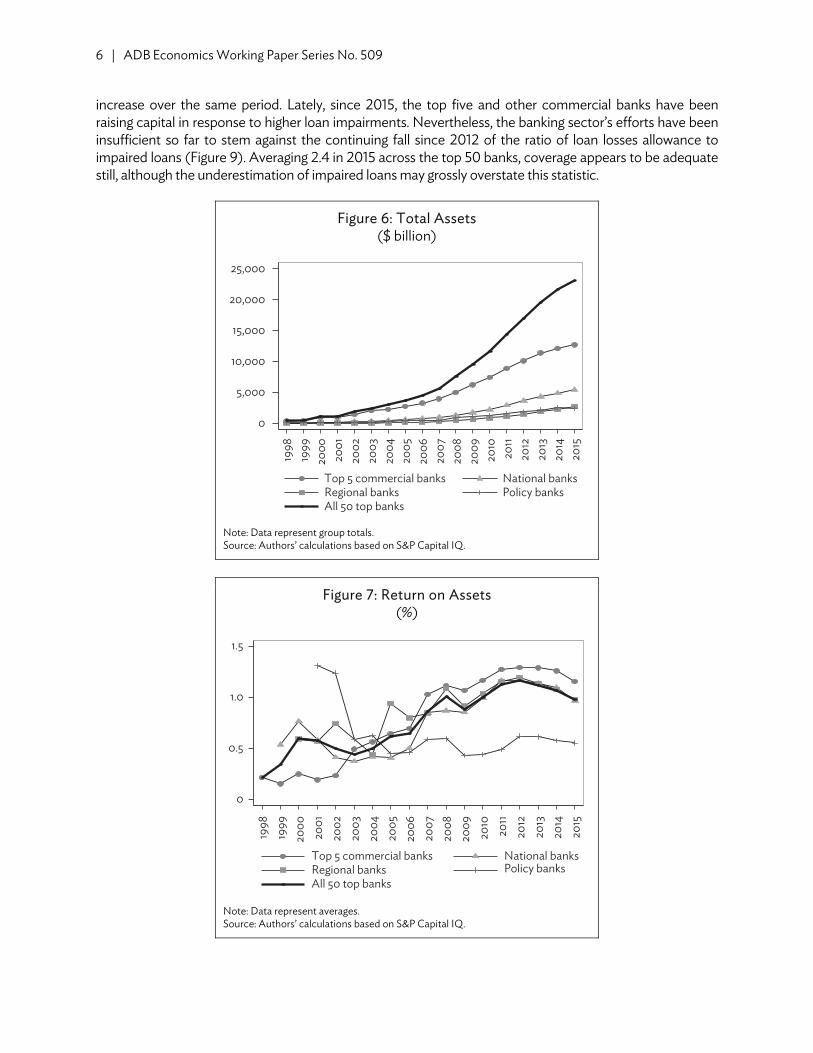
Financial indicator charts along this breakdown provide evidence of incipient vulnerability in the
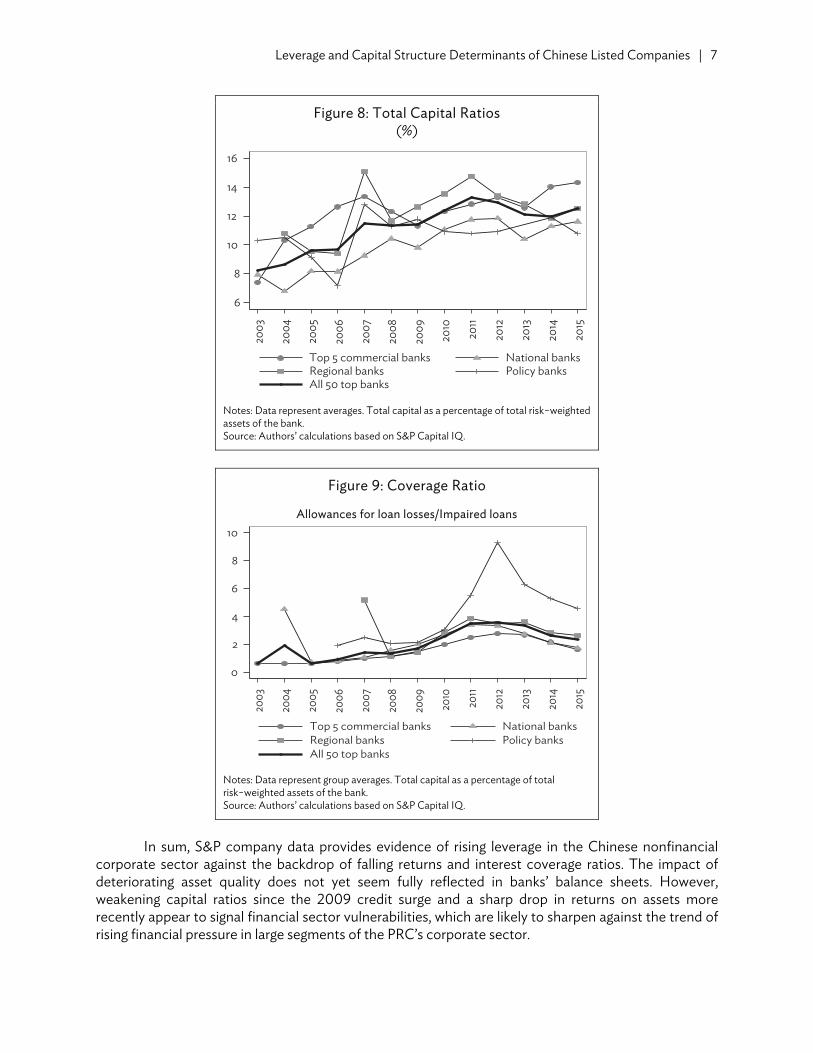
banking sector. Total assets surged across the sector, although at a progressively slowing rate since about 2010 (Figure 6). The top five commercial banks hold the bulk of assets, but credit growth involved all segments of the banking sector, including the regional banks. However, growth in revenues and net income did not keep up with that of assets, causing returns on assets to drop significantly in the 3 years to 2015 (Figure 7). In the meantime, the banking sector failed to raise capital at the same pace as it was issuing credits, causing capital ratios to shrink between 2011 and 2014 (Figure 8). This is true in relation to average ratios for the 50 top banks taken together, not for the policy banks, which raised capital and saw their ratios
0
20
40
60
Mean Median5th quantile 25th quantile75th quantile 95th quantile
2009 2010 2011 2012 2013 2014 2015
0
.05
.10
.15
.20
2009 2010 2011 2012 2013 2014 2015
Mean Median5th quantile 25th quantile75th quantile 95th quantile
6 | ADB Economics Working Paper Series No. 509
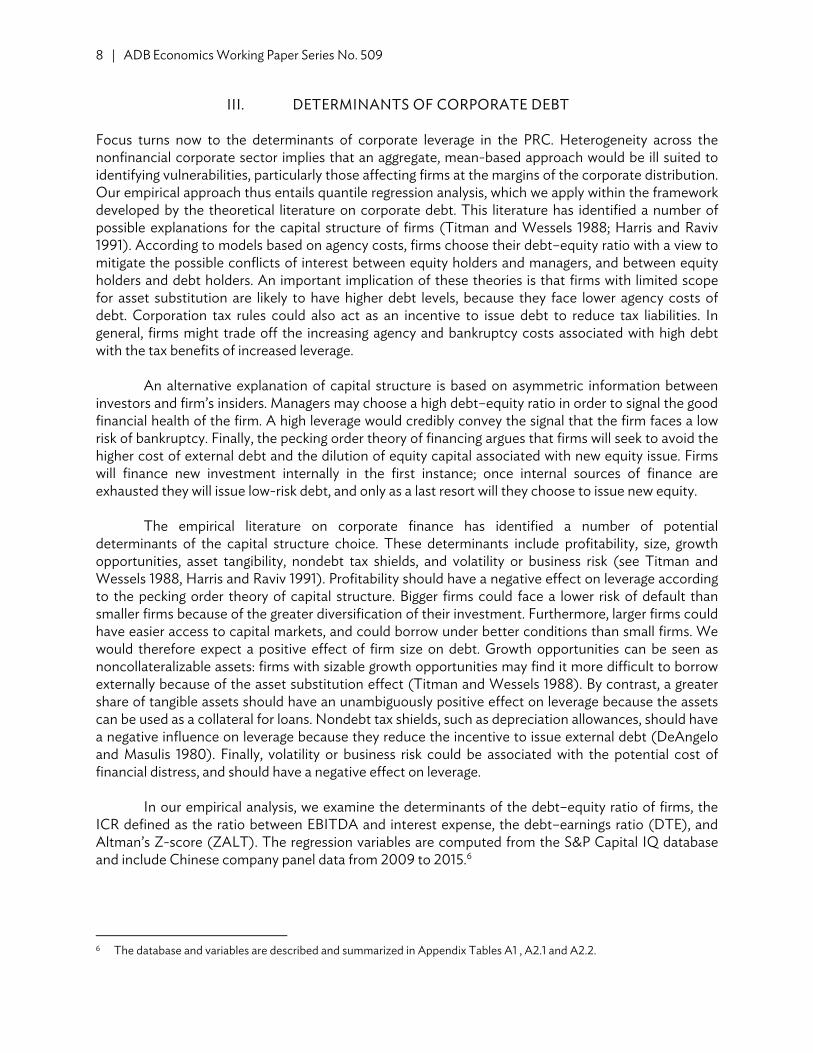
increase over the same period. Lately, since 2015, the top five and other commercial banks have been raising capital in response to higher loan impairments. Nevertheless, the banking sector’s efforts have been insufficient so far to stem against the continuing fall since 2012 of the ratio of loan losses allowance to impaired loans (Figure 9). Averaging 2.4 in 2015 across the top 50 banks, coverage appears to be adequate still, although the underestimation of impaired loans may grossly overstate this statistic.
Figure 6: Total Assets ($ billion)
Note: Data represent group totals. Source: Authors’ calculations based on S&P Capital IQ.
Figure 7: Return on Assets (%)
Note: Data represent averages. Source: Authors’ calculations based on S&P Capital IQ.
0
5,000
10,000
15,000
20,000
25,00019
9819
9920
0020
0120
0220
0320
0420
0520
0620
0720
0820
0920
1020
1120
1220
1320
1420
15
Top 5 commercial banks National banksRegional banks Policy banksAll 50 top banks
0
0.5
1.5
1998
1999
2000
2001
2002
2003
2004
2005
2006
2007
2008
2009
2010
2011
2012
2013
2014
2015
Top 5 commercial banks National banksRegional banks Policy banksAll 50 top banks
1.0
Leverage and Capital Structure Determinants of Chinese Listed Companies | 7
Figure 8: Total Capital Ratios (%)
Notes: Data represent averages. Total capital as a percentage of total risk−weighted assets of the bank. Source: Authors’ calculations based on S&P Capital IQ.
Figure 9: Coverage Ratio
Allowances for loan losses/Impaired loans
Notes: Data represent group averages. Total capital as a percentage of total risk−weighted assets of the bank. Source: Authors’ calculations based on S&P Capital IQ.
In sum, S&P company data provides evidence of rising leverage in the Chinese nonfinancial
corporate sector against the backdrop of falling returns and interest coverage ratios. The impact of deteriorating asset quality does not yet seem fully reflected in banks’ balance sheets. However, weakening capital ratios since the 2009 credit surge and a sharp drop in returns on assets more recently appear to signal financial sector vulnerabilities, which are likely to sharpen against the trend of rising financial pressure in large segments of the PRC’s corporate sector.
6
8
10
12
14
16
2003
2004
2005
2006
2007
2008
2009
2010
2011
2012
2013
2014
2015
Top 5 commercial banks National banksRegional banks Policy banksAll 50 top banks
0
2
4
6
8
10
2003
2004
2005
2006
2007
2008
2009
2010
2011
2012
2013
2014
2015
Top 5 commercial banks National banksRegional banks Policy banksAll 50 top banks
8 | ADB Economics Working Paper Series No. 509
III. DETERMINANTS OF CORPORATE DEBT Focus turns now to the determinants of corporate leverage in the PRC. Heterogeneity across the nonfinancial corporate sector implies that an aggregate, mean-based approach would be ill suited to identifying vulnerabilities, particularly those affecting firms at the margins of the corporate distribution. Our empirical approach thus entails quantile regression analysis, which we apply within the framework developed by the theoretical literature on corporate debt. This literature has identified a number of possible explanations for the capital structure of firms (Titman and Wessels 1988; Harris and Raviv 1991). According to models based on agency costs, firms choose their debt–equity ratio with a view to mitigate the possible conflicts of interest between equity holders and managers, and between equity holders and debt holders. An important implication of these theories is that firms with limited scope for asset substitution are likely to have higher debt levels, because they face lower agency costs of debt. Corporation tax rules could also act as an incentive to issue debt to reduce tax liabilities. In general, firms might trade off the increasing agency and bankruptcy costs associated with high debt with the tax benefits of increased leverage.
An alternative explanation of capital structure is based on asymmetric information between investors and firm’s insiders. Managers may choose a high debt–equity ratio in order to signal the good financial health of the firm. A high leverage would credibly convey the signal that the firm faces a low risk of bankruptcy. Finally, the pecking order theory of financing argues that firms will seek to avoid the higher cost of external debt and the dilution of equity capital associated with new equity issue. Firms will finance new investment internally in the first instance; once internal sources of finance are exhausted they will issue low-risk debt, and only as a last resort will they choose to issue new equity.
The empirical literature on corporate finance has identified a number of potential
determinants of the capital structure choice. These determinants include profitability, size, growth opportunities, asset tangibility, nondebt tax shields, and volatility or business risk (see Titman and Wessels 1988, Harris and Raviv 1991). Profitability should have a negative effect on leverage according to the pecking order theory of capital structure. Bigger firms could face a lower risk of default than smaller firms because of the greater diversification of their investment. Furthermore, larger firms could have easier access to capital markets, and could borrow under better conditions than small firms. We would therefore expect a positive effect of firm size on debt. Growth opportunities can be seen as noncollateralizable assets: firms with sizable growth opportunities may find it more difficult to borrow externally because of the asset substitution effect (Titman and Wessels 1988). By contrast, a greater share of tangible assets should have an unambiguously positive effect on leverage because the assets can be used as a collateral for loans. Nondebt tax shields, such as depreciation allowances, should have a negative influence on leverage because they reduce the incentive to issue external debt (DeAngelo and Masulis 1980). Finally, volatility or business risk could be associated with the potential cost of financial distress, and should have a negative effect on leverage.
In our empirical analysis, we examine the determinants of the debt–equity ratio of firms, the ICR defined as the ratio between EBITDA and interest expense, the debt–earnings ratio (DTE), and Altman’s Z-score (ZALT). The regression variables are computed from the S&P Capital IQ database and include Chinese company panel data from 2009 to 2015.6 6 The database and variables are described and summarized in Appendix Tables A1 , A2.1 and A2.2.
Leverage and Capital Structure Determinants of Chinese Listed Companies | 9
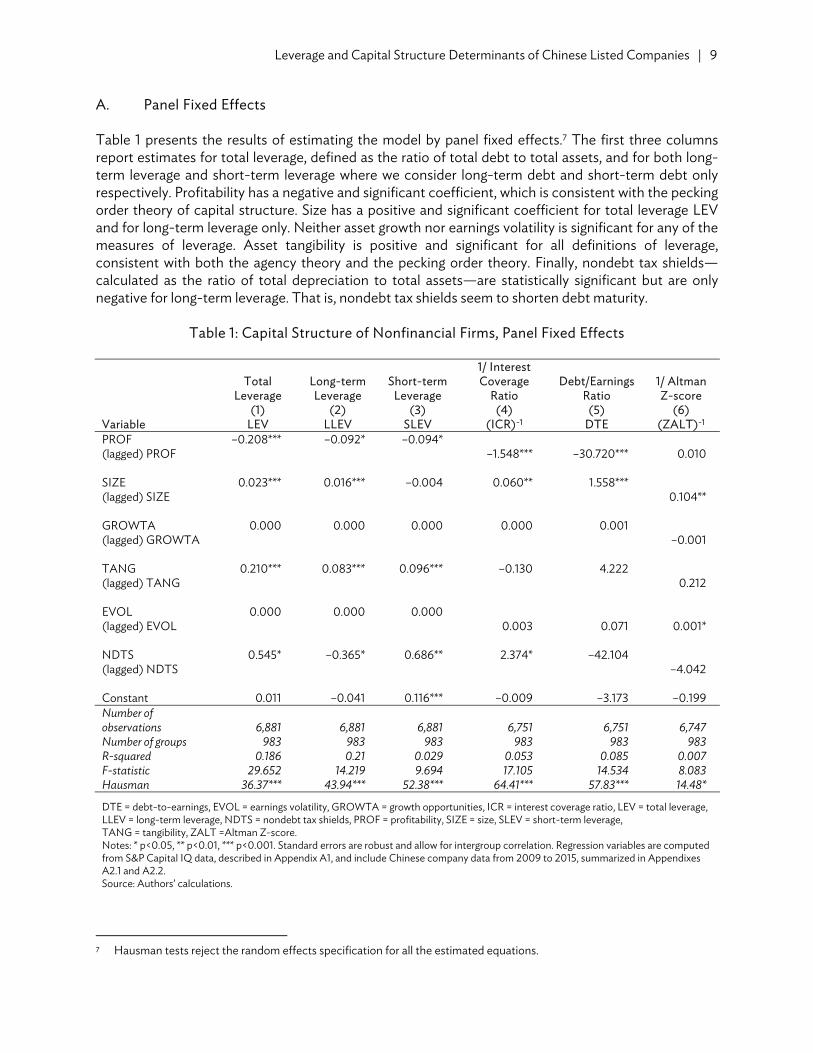
A. Panel Fixed Effects Table 1 presents the results of estimating the model by panel fixed effects.7 The first three columns report estimates for total leverage, defined as the ratio of total debt to total assets, and for both long-term leverage and short-term leverage where we consider long-term debt and short-term debt only respectively. Profitability has a negative and significant coefficient, which is consistent with the pecking order theory of capital structure. Size has a positive and significant coefficient for total leverage LEV and for long-term leverage only. Neither asset growth nor earnings volatility is significant for any of the measures of leverage. Asset tangibility is positive and significant for all definitions of leverage, consistent with both the agency theory and the pecking order theory. Finally, nondebt tax shields—calculated as the ratio of total depreciation to total assets—are statistically significant but are only negative for long-term leverage. That is, nondebt tax shields seem to shorten debt maturity.
Table 1: Capital Structure of Nonfinancial Firms, Panel Fixed Effects
Total Leverage
Long-term Leverage
Short-term Leverage
1/ Interest Coverage
Ratio Debt/Earnings
Ratio 1/ Altman Z-score
(1) (2) (3) (4) (5) (6)Variable LEV LLEV SLEV (ICR)-1 DTE (ZALT)-1
PROF –0.208*** –0.092* –0.094* (lagged) PROF –1.548*** –30.720*** 0.010 SIZE 0.023*** 0.016*** –0.004 0.060** 1.558*** (lagged) SIZE 0.104** GROWTA 0.000 0.000 0.000 0.000 0.001 (lagged) GROWTA –0.001 TANG 0.210*** 0.083*** 0.096*** –0.130 4.222 (lagged) TANG 0.212 EVOL 0.000 0.000 0.000 (lagged) EVOL 0.003 0.071 0.001* NDTS 0.545* –0.365* 0.686** 2.374* –42.104 (lagged) NDTS –4.042 Constant 0.011 –0.041 0.116*** –0.009 –3.173 –0.199 Number of observations 6,881 6,881 6,881 6,751 6,751 6,747 Number of groups 983 983 983 983 983 983R-squared 0.186 0.21 0.029 0.053 0.085 0.007F-statistic 29.652 14.219 9.694 17.105 14.534 8.083Hausman 36.37*** 43.94*** 52.38*** 64.41*** 57.83*** 14.48*
DTE = debt-to-earnings, EVOL = earnings volatility, GROWTA = growth opportunities, ICR = interest coverage ratio, LEV = total leverage, LLEV = long-term leverage, NDTS = nondebt tax shields, PROF = profitability, SIZE = size, SLEV = short-term leverage, TANG = tangibility, ZALT =Altman Z-score. Notes: * p<0.05, ** p<0.01, *** p<0.001. Standard errors are robust and allow for intergroup correlation. Regression variables are computed from S&P Capital IQ data, described in Appendix A1, and include Chinese company data from 2009 to 2015, summarized in Appendixes A2.1 and A2.2. Source: Authors’ calculations.
7 Hausman tests reject the random effects specification for all the estimated equations.
10 | ADB Economics Working Paper Series No. 509
Our findings so far are broadly supportive of the agency and the pecking order theory of capital structure, and weakly also of the signaling theory, although they would not be able to discriminate conclusively between these alternative theories.
Columns (4) to (6) of Table 1 examine potential determinants of key indicators of financial fragility of firms. Column (4) reports the results of estimating the equation for the inverse of the ICR (ICR)-1. Values of ICR less than one indicate that current earnings fall short of the interest expenses which are due, and therefore low values of ICR (or high values of its inverse) are an indicator of financial distress. Profitability and earnings volatility have been lagged to avoid potential endogeneity with the dependent variable. The fixed-effects estimates show that lagged profitability has a negative effect and nondebt tax shield a positive effect as expected. Size has a positive effect, which is consistent with its positive influence on leverage.
Column (5) of Table 1 looks at the DTE as the dependent variable. This ratio too is used as an indicator of the potential financial distress of companies. Profitability and earning volatility have again been lagged to avoid endogeneity. The only significant variables are profitability and size, with a negative and a positive coefficient, respectively, as expected.
Finally, column (6) gives the results of estimating the determinants of the inverse Altman’s Z-score, (ZALT)-1. The Z-score is a weighted average of five ratios: (i) working capital/total assets; (ii) retained earnings/total assets; (iii) earnings before interest and taxes/total assets; (iv) the market value of equity/the book value of total liabilities; and (v) sales/total assets (Altman 1968). It is usually interpreted as a predictor of the probability that the company will go into bankruptcy within 2 years. High values of the inverse Z-score can thus be read as indicating low bankruptcy risk. All the regressors are lagged one period in the fixed effect regressions to avoid simultaneity bias. Among the statistically significant variables, size has a large and positive coefficient, which indicates that size is associated with a lower probability of bankruptcy. Earnings volatility also has a positive and significant coefficient, but its effect is relatively modest in absolute value. B. Quantile Regression Panel Data The estimates in Table 1 allow for firm-specific, time-invariant fixed effects to capture the unobserved heterogeneity across firms in the response of the dependent variable to the conditioning variables. A potential shortcoming of this approach is that it assumes a common response of the dependent variable to the explanatory variables for all firms. This can be a strong assumption, since the response of the dependent variable could be different across the distribution of firms. For example, variables such as the size of the firm or the share of tangible assets could play a different role depending on whether the firm is already highly leveraged or not. In this case, a more suitable approach to estimating the response of the dependent variables to the conditioning variables across the whole distribution of firms is to estimate the model by quantile regression (Koenker and Basset 1978). Quantile regression estimation allows for different values of the regression coefficients across the different quantiles of the distribution of firms, and is therefore able to capture nonlinearities in the response of the dependent variable to its determinants.8
Quantile regressions with fixed effects for panel data presents however the difficulty that quantile estimators with additive fixed effects may not have the same interpretation as cross-sectional
8 Fattouh, Harris, and Scaramozzino (2005, 2008) use quantile regression to study capital structure in the Republic of
Korea and in the United Kingdom, respectively.
Leverage and Capital Structure Determinants of Chinese Listed Companies | 11
regressions. The reason for this is that, using conventional notation, the distribution of | is not order-isomorphic to the distribution of | : an observation which lies in one of the low quantiles of the distribution with respect to may lie in one of the top quantiles of the distribution with respect to , and vice versa. This creates difficulties for the interpretation of panel quantile regressions with additive fixed effects, since the results cannot be understood in the same manner as cross-sectional regressions.
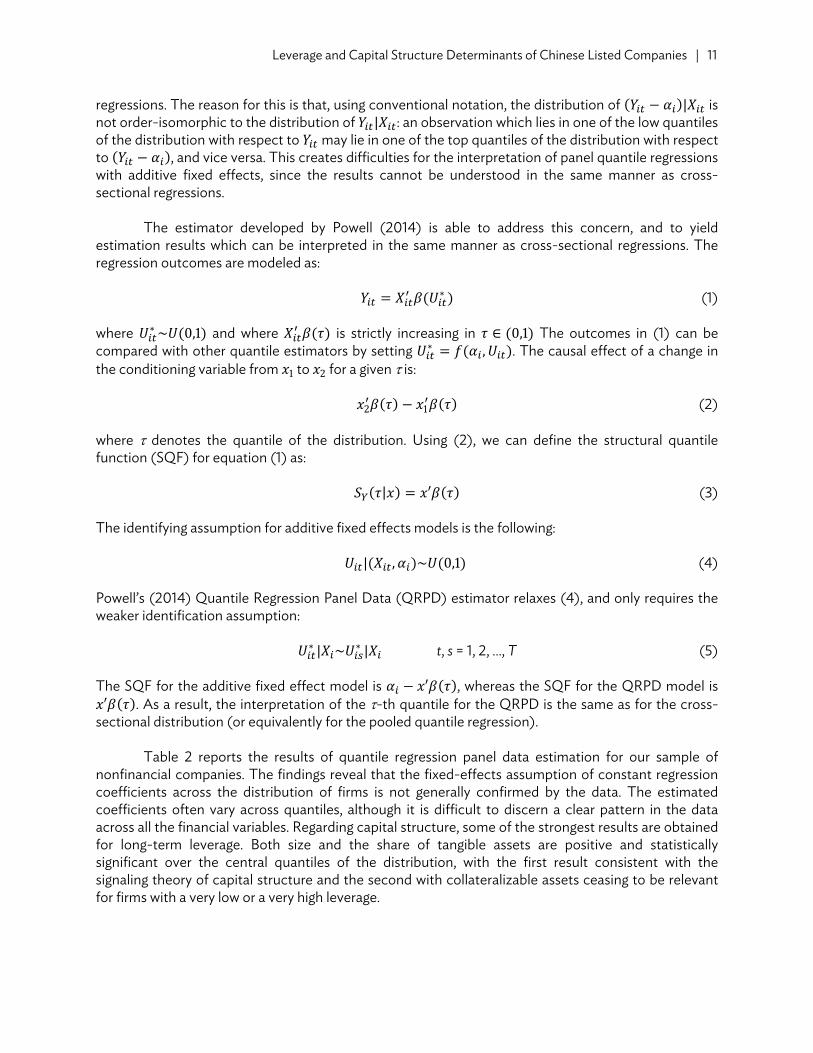
The estimator developed by Powell (2014) is able to address this concern, and to yield estimation results which can be interpreted in the same manner as cross-sectional regressions. The regression outcomes are modeled as: ∗ (1) where ∗ ~ , and where is strictly increasing in ∈ , The outcomes in (1) can be compared with other quantile estimators by setting ∗ , . The causal effect of a change in the conditioning variable from to for a given is: (2) where denotes the quantile of the distribution. Using (2), we can define the structural quantile function (SQF) for equation (1) as: | ′ (3) The identifying assumption for additive fixed effects models is the following: | , ~ , (4) Powell’s (2014) Quantile Regression Panel Data (QRPD) estimator relaxes (4), and only requires the weaker identification assumption: ∗ | ~ ∗ | t, s = 1, 2, …, T (5) The SQF for the additive fixed effect model is ′ , whereas the SQF for the QRPD model is ′ . As a result, the interpretation of the -th quantile for the QRPD is the same as for the cross-
sectional distribution (or equivalently for the pooled quantile regression).
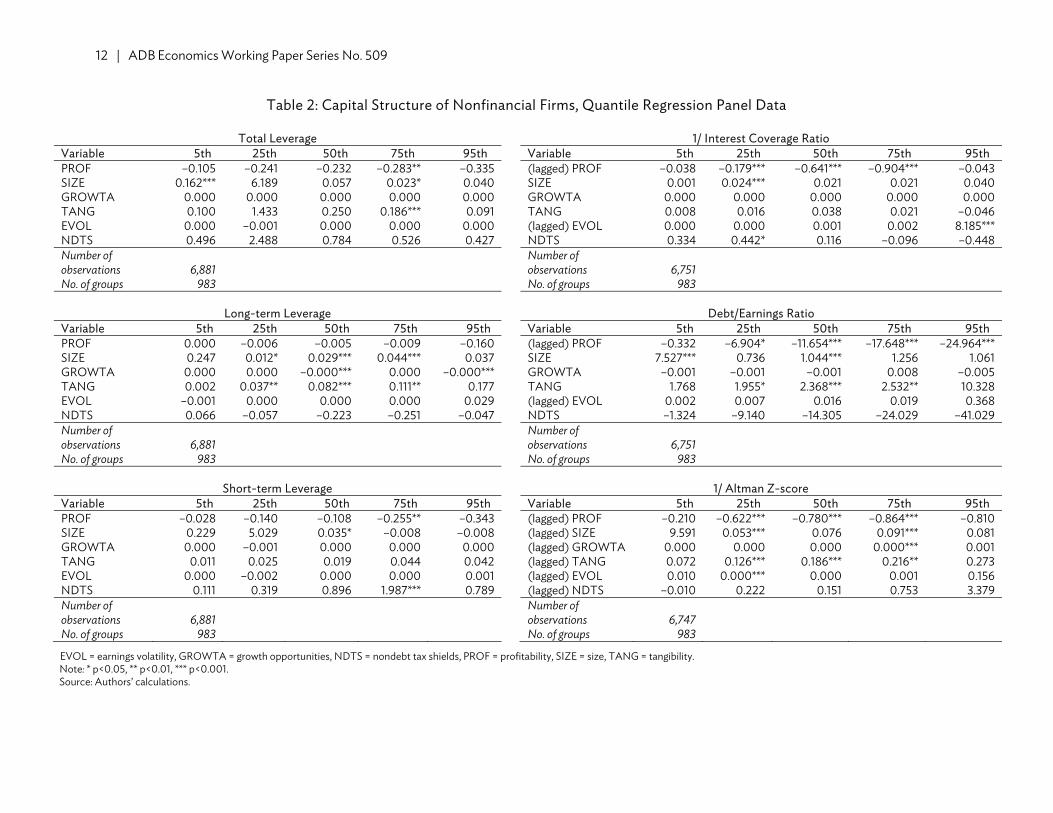
Table 2 reports the results of quantile regression panel data estimation for our sample of nonfinancial companies. The findings reveal that the fixed-effects assumption of constant regression coefficients across the distribution of firms is not generally confirmed by the data. The estimated coefficients often vary across quantiles, although it is difficult to discern a clear pattern in the data across all the financial variables. Regarding capital structure, some of the strongest results are obtained for long-term leverage. Both size and the share of tangible assets are positive and statistically significant over the central quantiles of the distribution, with the first result consistent with the signaling theory of capital structure and the second with collateralizable assets ceasing to be relevant for firms with a very low or a very high leverage.
12 | ADB Economics Working Paper Series No. 509
Table 2: Capital Structure of Nonfinancial Firms, Quantile Regression Panel Data
Total Leverage 1/ Interest Coverage RatioVariable 5th 25th 50th 75th 95th Variable 5th 25th 50th 75th 95th PROF –0.105 –0.241 –0.232 –0.283** –0.335 (lagged) PROF –0.038 –0.179*** –0.641*** –0.904*** –0.043 SIZE 0.162*** 6.189 0.057 0.023* 0.040 SIZE 0.001 0.024*** 0.021 0.021 0.040 GROWTA 0.000 0.000 0.000 0.000 0.000 GROWTA 0.000 0.000 0.000 0.000 0.000 TANG 0.100 1.433 0.250 0.186*** 0.091 TANG 0.008 0.016 0.038 0.021 –0.046 EVOL 0.000 –0.001 0.000 0.000 0.000 (lagged) EVOL 0.000 0.000 0.001 0.002 8.185*** NDTS 0.496 2.488 0.784 0.526 0.427 NDTS 0.334 0.442* 0.116 –0.096 –0.448 Number of observations 6,881
Number of observations 6,751
No. of groups 983 No. of groups 983
Long-term Leverage Debt/Earnings RatioVariable 5th 25th 50th 75th 95th Variable 5th 25th 50th 75th 95th PROF 0.000 –0.006 –0.005 –0.009 –0.160 (lagged) PROF –0.332 –6.904* –11.654*** –17.648*** –24.964*** SIZE 0.247 0.012* 0.029*** 0.044*** 0.037 SIZE 7.527*** 0.736 1.044*** 1.256 1.061 GROWTA 0.000 0.000 –0.000*** 0.000 –0.000*** GROWTA –0.001 –0.001 –0.001 0.008 –0.005 TANG 0.002 0.037** 0.082*** 0.111** 0.177 TANG 1.768 1.955* 2.368*** 2.532** 10.328 EVOL –0.001 0.000 0.000 0.000 0.029 (lagged) EVOL 0.002 0.007 0.016 0.019 0.368 NDTS 0.066 –0.057 –0.223 –0.251 –0.047 NDTS –1.324 –9.140 –14.305 –24.029 –41.029 Number of observations 6,881
Number of observations 6,751
No. of groups 983 No. of groups 983
Short-term Leverage 1/ Altman Z-scoreVariable 5th 25th 50th 75th 95th Variable 5th 25th 50th 75th 95th PROF –0.028 –0.140 –0.108 –0.255** –0.343 (lagged) PROF –0.210 –0.622*** –0.780*** –0.864*** –0.810 SIZE 0.229 5.029 0.035* –0.008 –0.008 (lagged) SIZE 9.591 0.053*** 0.076 0.091*** 0.081 GROWTA 0.000 –0.001 0.000 0.000 0.000 (lagged) GROWTA 0.000 0.000 0.000 0.000*** 0.001 TANG 0.011 0.025 0.019 0.044 0.042 (lagged) TANG 0.072 0.126*** 0.186*** 0.216** 0.273 EVOL 0.000 –0.002 0.000 0.000 0.001 (lagged) EVOL 0.010 0.000*** 0.000 0.001 0.156 NDTS 0.111 0.319 0.896 1.987*** 0.789 (lagged) NDTS –0.010 0.222 0.151 0.753 3.379 Number of observations 6,881
Number of observations 6,747
No. of groups 983 No. of groups 983
EVOL = earnings volatility, GROWTA = growth opportunities, NDTS = nondebt tax shields, PROF = profitability, SIZE = size, TANG = tangibility. Note: * p<0.05, ** p<0.01, *** p<0.001. Source: Authors’ calculations.
Leverage and Capital Structure Determinants of Chinese Listed Companies | 13
Lagged profits exert a strong and significance influence on financial ratios. The estimated coefficients are negative and significant for the inverse of ICR and for DTE, and increase in size for the upper quantiles of the distribution: higher profits therefore reduce the financial fragility of firms. They however increase the overall risk of bankruptcy as measured by the Z-score, which may also be consistent with signaling theory. Size tends to be associated with high debt–earnings ratios for firms in the left tail of the distribution and with lower Z-scores for firms in the central quantiles of the distribution. A higher share of tangible assets tends to be associated with larger debt–earnings ratios but with lower Z-scores.
The QRPD estimations illustrate that the assumption that regression coefficients are constant
across the distributions of firms may not be valid. The effects of the regressors on the debt–equity ratios or on financial ratios can be different in the middle ranges of the distributions of firms and on the tails. The findings from QRPD tend to be more supportive of signaling theories of capital structure than the fixed-effects estimates would suggest. C. Simultaneous Panel Quantile Regressions The Quantile Regression Panel Data approach of section III.B has the advantage of being directly comparable to cross-sectional quantile regression estimations in the interpretation of the regression coefficients, because of the weaker identifying assumption (5). Estimation by QRPD however still requires that the coefficients remain constant over time. DeAngelo and Roll (2015) recently found evidence that firm leverage exhibits significant variability over time. It is important therefore to investigate whether the responses of the dependent variables to their determinants vary along the economic cycle or over time. If this proves to be the case, then the assumption of constant coefficients would not be valid.
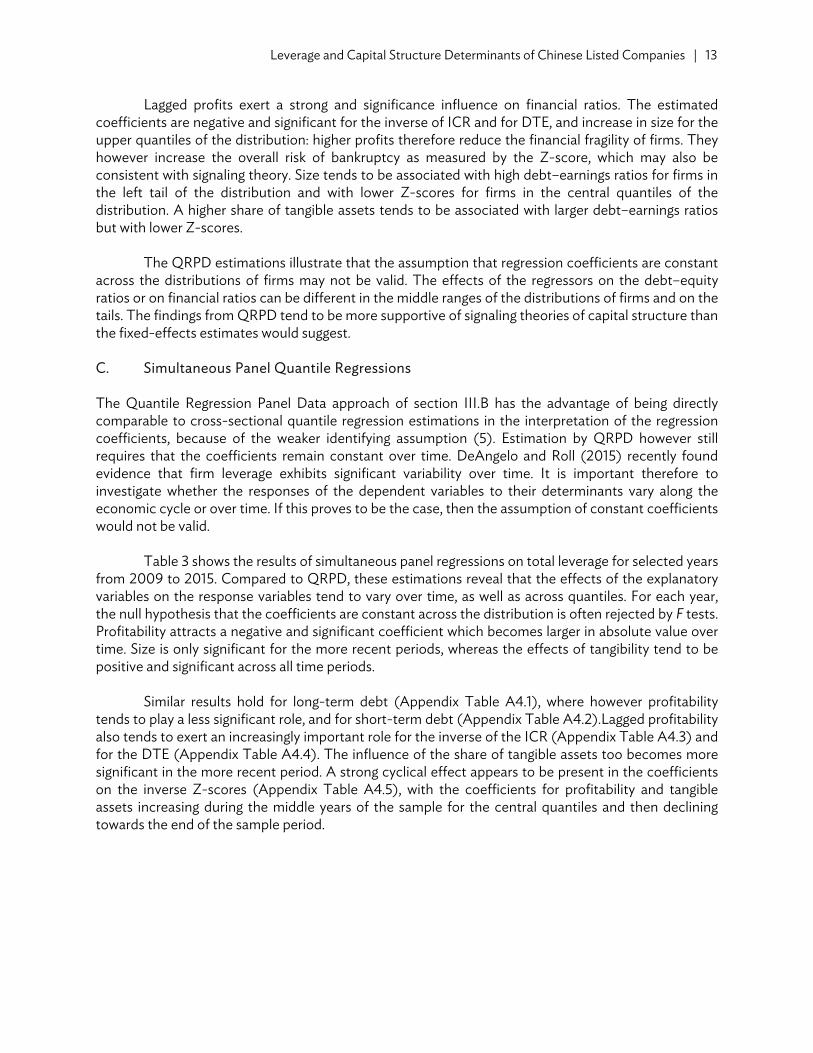
Table 3 shows the results of simultaneous panel regressions on total leverage for selected years from 2009 to 2015. Compared to QRPD, these estimations reveal that the effects of the explanatory variables on the response variables tend to vary over time, as well as across quantiles. For each year, the null hypothesis that the coefficients are constant across the distribution is often rejected by F tests. Profitability attracts a negative and significant coefficient which becomes larger in absolute value over time. Size is only significant for the more recent periods, whereas the effects of tangibility tend to be positive and significant across all time periods.
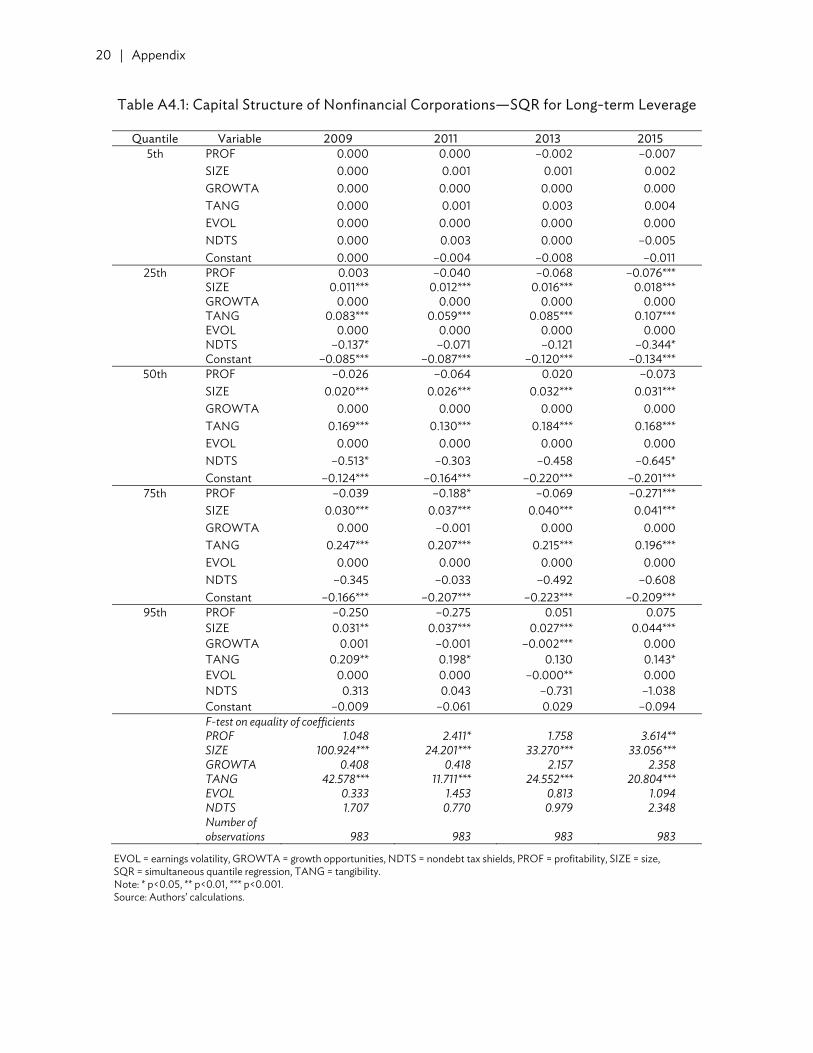
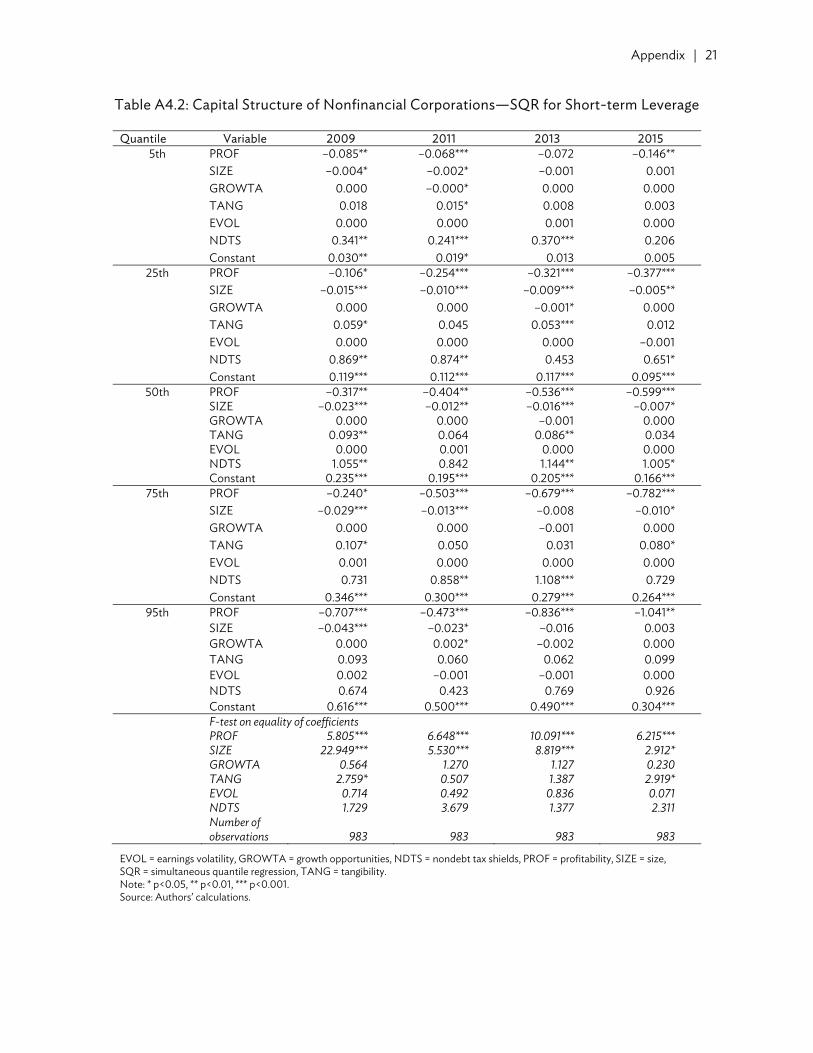
Similar results hold for long-term debt (Appendix Table A4.1), where however profitability
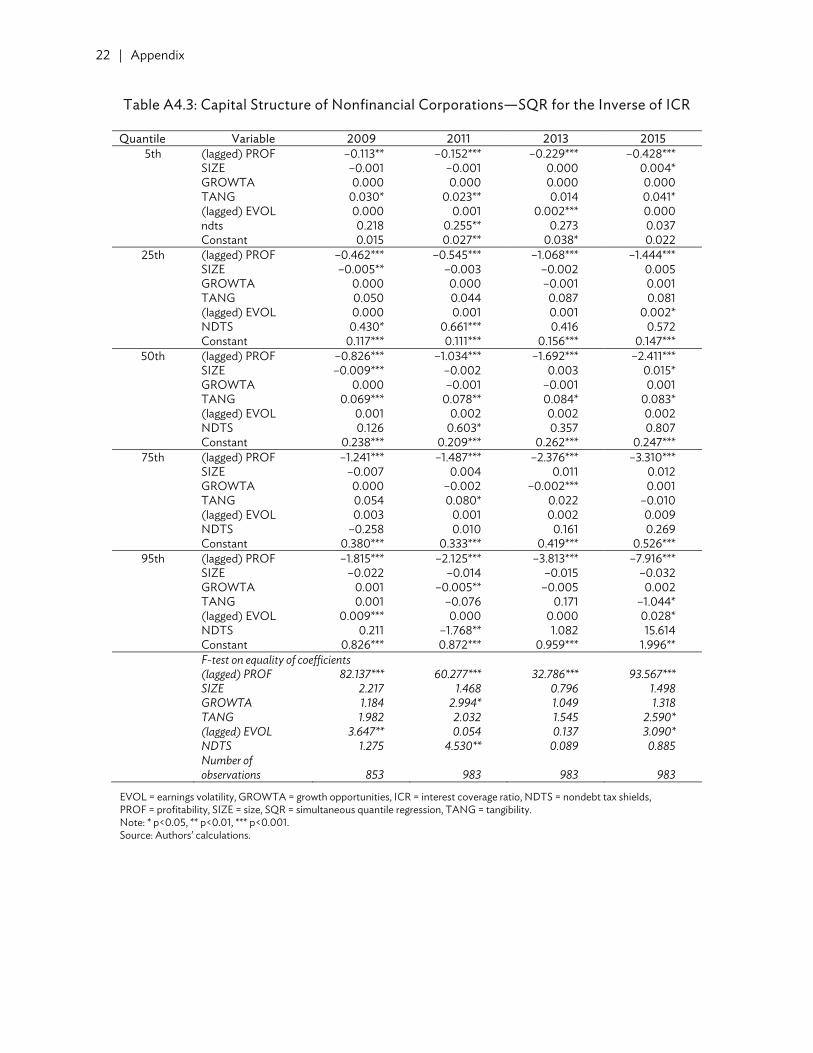
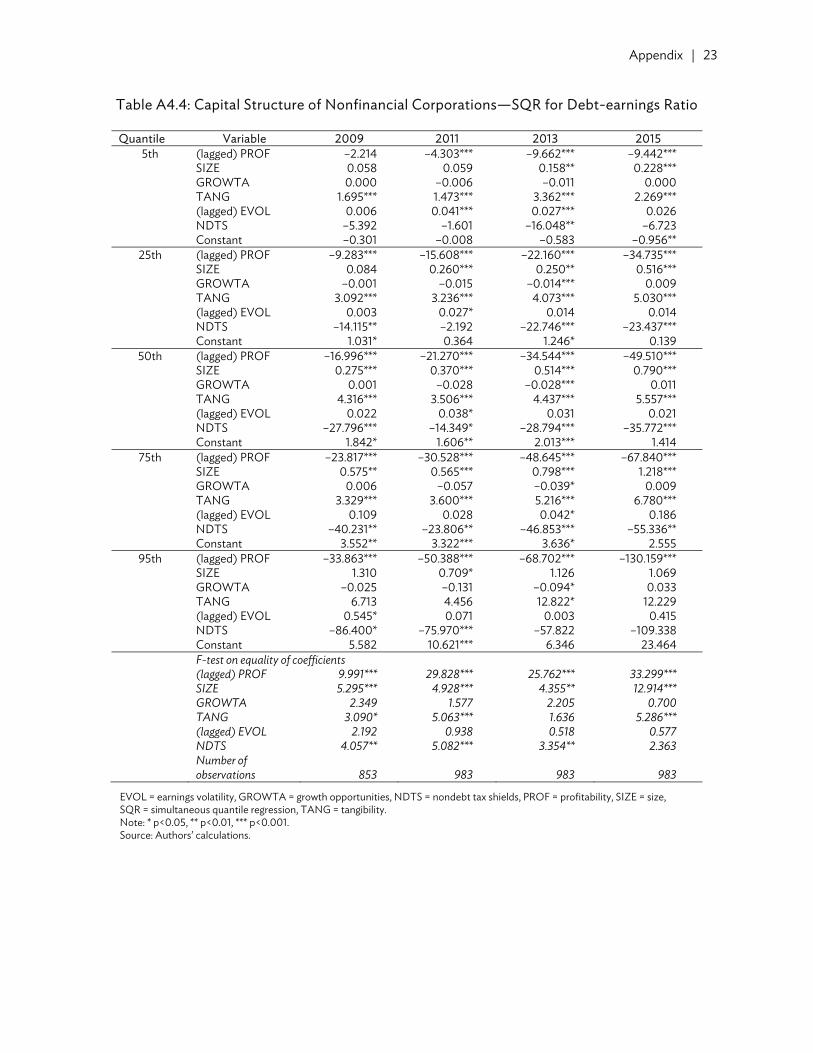
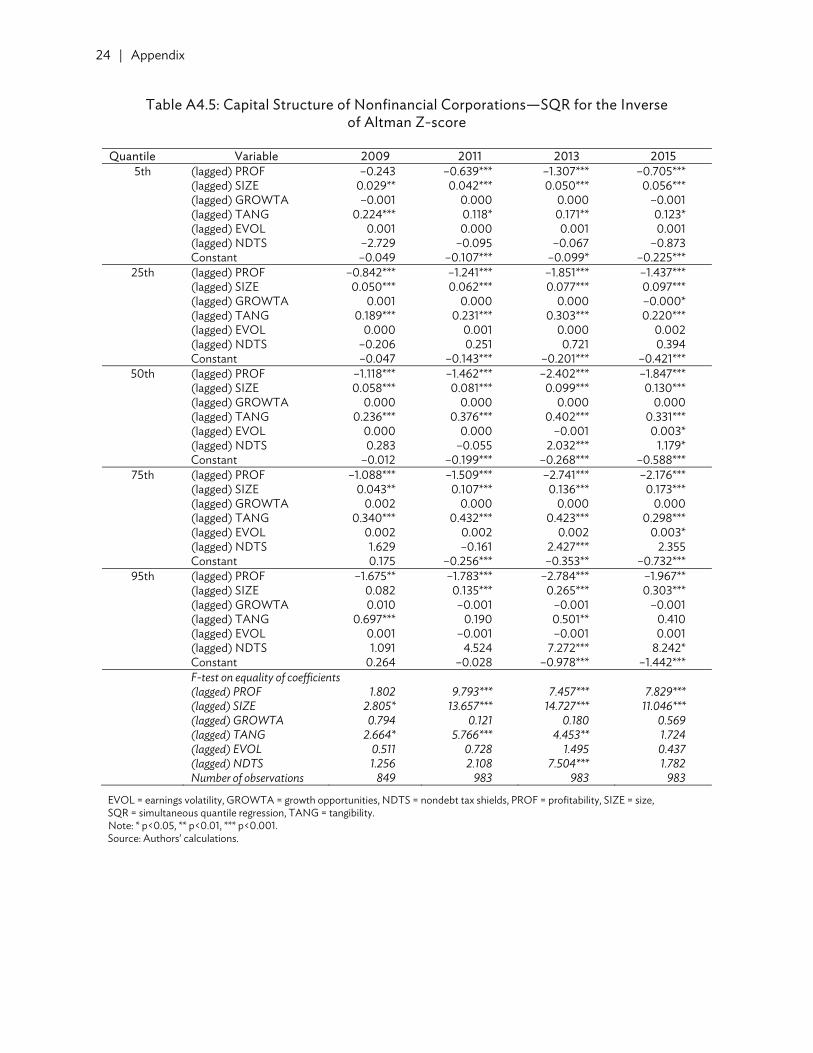
tends to play a less significant role, and for short-term debt (Appendix Table A4.2).Lagged profitability also tends to exert an increasingly important role for the inverse of the ICR (Appendix Table A4.3) and for the DTE (Appendix Table A4.4). The influence of the share of tangible assets too becomes more significant in the more recent period. A strong cyclical effect appears to be present in the coefficients on the inverse Z-scores (Appendix Table A4.5), with the coefficients for profitability and tangible assets increasing during the middle years of the sample for the central quantiles and then declining towards the end of the sample period.
14 | ADB Economics Working Paper Series No. 509
Table 3: Capital Structure of Nonfinancial Corporations: Simultaneous Panel Quantile Regressions
Quantile Variable 2009 2011 2013 2015
5th PROF 0.014 –0.178* –0.285 –0.428*** SIZE 0.002 0.012** 0.013*** 0.014*** GROWTA 0.000 0.000 0.000 0.000 TANG 0.161*** 0.168*** 0.185*** 0.141*** EVOL 0.000 0.001 0.001 0.000 NDTS 0.088 –0.099 0.481 0.294 Constant –0.039 –0.082** –0.099*** –0.090**
25th PROF –0.281** –0.461*** –0.620** –0.722*** SIZE 0.000 0.021** 0.021*** 0.026*** GROWTA 0.000 –0.001 0.000 0.000 TANG 0.329*** 0.282*** 0.269*** 0.282*** EVOL 0.000 0.000 0.000 –0.001 NDTS 0.404 0.164 0.100 –0.135 Constant 0.020 –0.075* –0.060 –0.103*
50th PROF –0.391*** –0.546*** –0.506*** –0.868*** SIZE 0.002 0.035*** 0.036*** 0.039*** GROWTA 0.000 0.000 –0.001* 0.000 TANG 0.372*** 0.294*** 0.295*** 0.279*** EVOL 0.000 0.000 0.000 0.000 NDTS 0.394 0.858 0.229 0.159 Constant 0.088* –0.094*** –0.093** –0.104*
75th PROF –0.429** –0.578*** –0.829*** –0.781*** SIZE 0.003 0.026*** 0.035*** 0.050*** GROWTA 0.000 –0.001 –0.002* 0.000 TANG 0.339*** 0.272*** 0.244*** 0.260*** EVOL 0.001 0.000 0.000 –0.001 NDTS 0.978 1.248** 1.102 0.710 Constant 0.173*** 0.055 0.033 –0.100*
95th PROF –0.678*** –0.731*** –1.117** –1.051*** SIZE 0.006 0.029*** 0.033*** 0.041*** GROWTA 0.000 0.000 0.001 0.000 TANG 0.229* 0.097 0.150*** 0.062 EVOL 0.001 –0.001 0.000 –0.001 NDTS 0.447 1.733*** 1.154*** 0.462 Constant 0.386*** 0.272*** 0.246*** 0.233** F-test on equality of coefficients PROF 7.119*** 4.598** 2.874* 2.711* SIZE 0.247 4.537** 17.779*** 13.064*** GROWTA 0.628 0.495 1.883 0.331 TANG 5.971*** 6.174*** 2.546* 4.168 EVOL 0.850 7.059*** 3.223* 0.104 NDTS 0.918 3.030* 1.675 0.358 Number of
observations 983 983 983 983
EVOL = earnings volatility, GROWTA = growth opportunities, NDTS = nondebt tax shields, PROF = profitability, SIZE = size, TANG = tangibility. Note: * p<0.05, ** p<0.01, *** p<0.001. Source: Authors’ calculations.
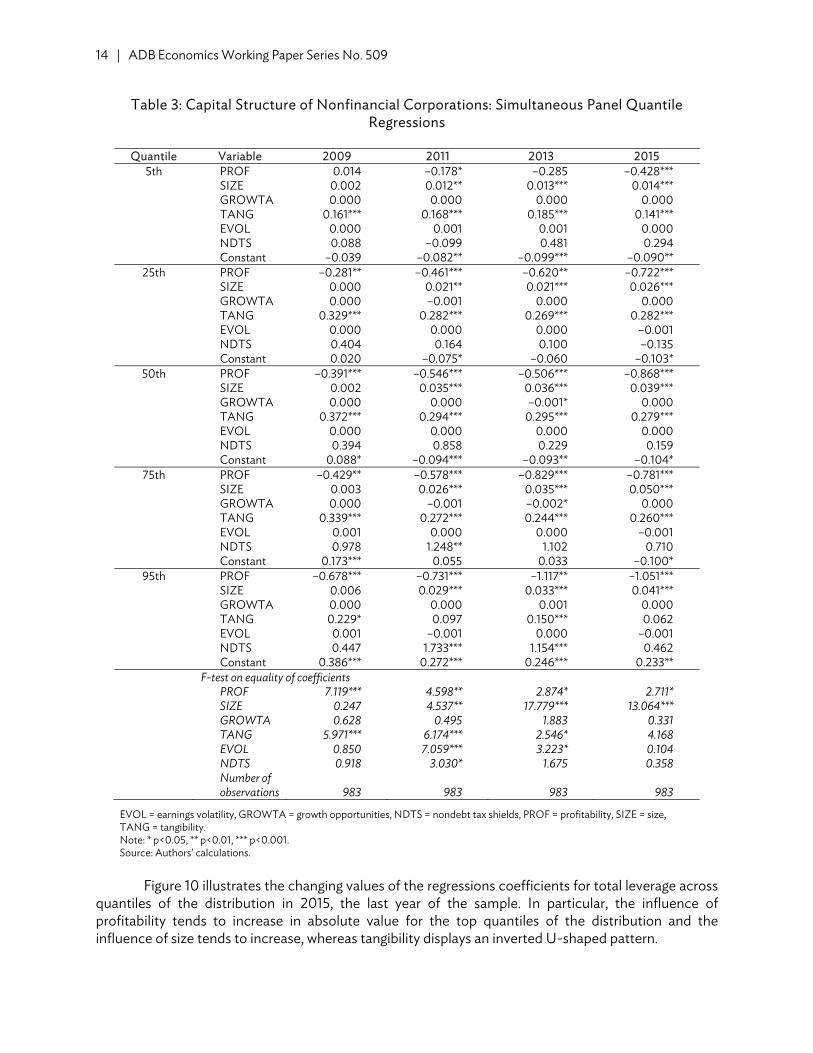
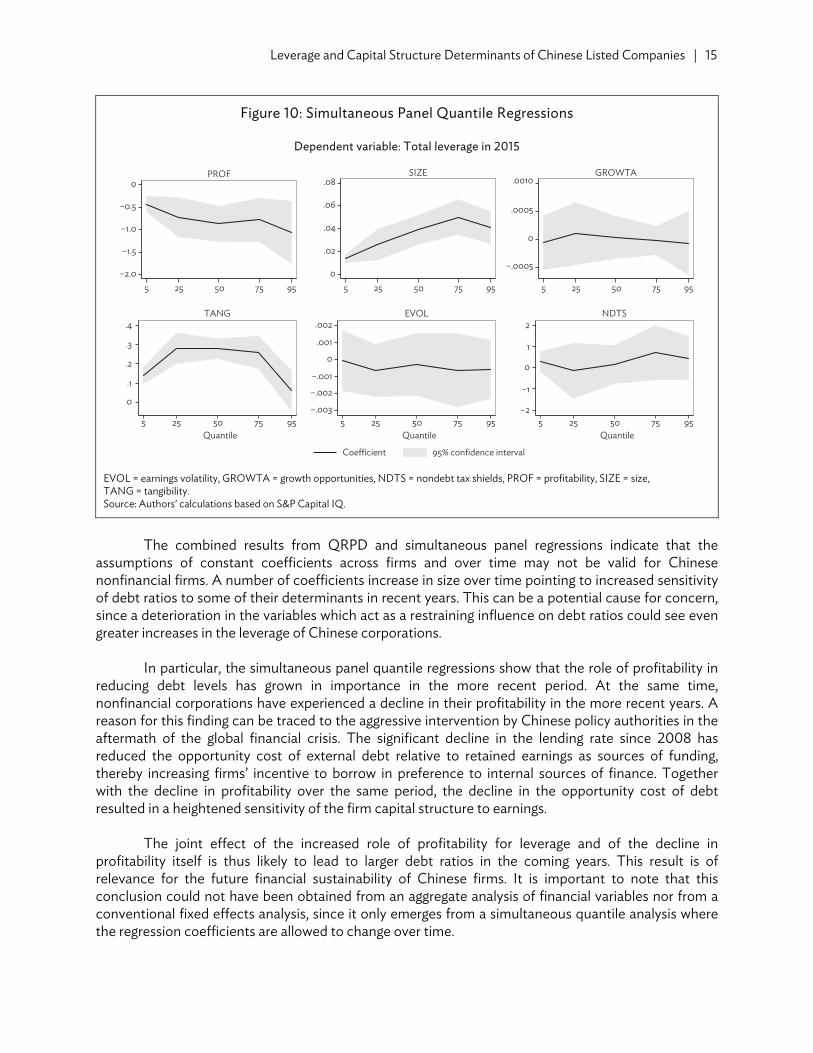
Figure 10 illustrates the changing values of the regressions coefficients for total leverage across
quantiles of the distribution in 2015, the last year of the sample. In particular, the influence of profitability tends to increase in absolute value for the top quantiles of the distribution and the influence of size tends to increase, whereas tangibility displays an inverted U-shaped pattern.
Leverage and Capital Structure Determinants of Chinese Listed Companies | 15
Figure 10: Simultaneous Panel Quantile Regressions
Dependent variable: Total leverage in 2015
EVOL = earnings volatility, GROWTA = growth opportunities, NDTS = nondebt tax shields, PROF = profitability, SIZE = size, TANG = tangibility. Source: Authors’ calculations based on S&P Capital IQ.
The combined results from QRPD and simultaneous panel regressions indicate that the
assumptions of constant coefficients across firms and over time may not be valid for Chinese nonfinancial firms. A number of coefficients increase in size over time pointing to increased sensitivity of debt ratios to some of their determinants in recent years. This can be a potential cause for concern, since a deterioration in the variables which act as a restraining influence on debt ratios could see even greater increases in the leverage of Chinese corporations.
In particular, the simultaneous panel quantile regressions show that the role of profitability in reducing debt levels has grown in importance in the more recent period. At the same time, nonfinancial corporations have experienced a decline in their profitability in the more recent years. A reason for this finding can be traced to the aggressive intervention by Chinese policy authorities in the aftermath of the global financial crisis. The significant decline in the lending rate since 2008 has reduced the opportunity cost of external debt relative to retained earnings as sources of funding, thereby increasing firms’ incentive to borrow in preference to internal sources of finance. Together with the decline in profitability over the same period, the decline in the opportunity cost of debt resulted in a heightened sensitivity of the firm capital structure to earnings.
The joint effect of the increased role of profitability for leverage and of the decline in profitability itself is thus likely to lead to larger debt ratios in the coming years. This result is of relevance for the future financial sustainability of Chinese firms. It is important to note that this conclusion could not have been obtained from an aggregate analysis of financial variables nor from a conventional fixed effects analysis, since it only emerges from a simultaneous quantile analysis where the regression coefficients are allowed to change over time.
–2.0
–1.5
–1.0
–0.5
0
5 25 50 75 95
PROF
0
.02
.04
.06
.08
5 25 50 75 95
SIZE
–.0005
0
.0005
.0010
5 25 50 75 95
GROWTA
0
.1
.2
.3
.4
5 25 50 75 95Quantile
TANG
–.003
–.002
–.001
0
.001
.002
5 25 50 75 95Quantile
Coefficient 95% confidence interval
EVOL
−2
−1
0
1
2
5 25 50 75 95Quantile
NDTS
16 | ADB Economics Working Paper Series No. 509
IV. CONCLUSIONS Ever since the Government of the PRC chose to implement a large stimulus to support the economy in the wake of the financial crisis of 2008/2009, corporate leverage has experienced a steep and sustained increase. The ratios of total debt and of credit to GDP have increased at the same time as corporate returns and interest coverage ratios have been weakening, raising concerns about growing systemic vulnerability within the Chinese financial system.
Based on the analysis of aggregate data, there is no clear evidence yet of weakening corporate performance onto the Chinese financial sector. To an extent, this reflects the predominance of SOEs in the Chinese corporate landscape, and authorities’ control over the financial system and its major players and institutions. Such a controlled environment has the ability to contain or delay the spillover of financial distress from the corporate to the financial sector for some period of time, but not indefinitely. Ultimately, growing systemic pressure constitutes a contingent liability to the state, and its realization would come to bear heavily on the public budget and debt ratios.
This paper assessed corporate sector fragility through panel regressions that relate leverage and other financial indicators to the determinants of capital structure, such as companies’ size and profitability. The rationale for quantile regression analysis—of which we implement also the panel approach developed recently—is that it picks up vulnerabilities not just at the mean or median of the distribution, but also for the more marginal firms, which are those most exposed to negative shocks. Indeed, our analysis confirms that the sensitivity of leverage to its determinants varies across quantiles, with some areas of the distribution being affected much more strongly than others. We also find that some of the estimated coefficients have increased substantially in absolute size over time.
In particular, we find that profitability has a restraining effect on corporate leverage, the
intensity of which has risen sharply over recent years. Possibly, this can be explained by a significant decline in lending rates in the wake of the massive stimulus program, which increased Chinese firms’ incentive to borrow instead of relying on retained earnings as a source of finance. Against the backdrop of deteriorating profitability, this resulted in firms’ heightened sensitivity of the capital structure to earnings. Ultimately, this finding raises some concern about the recent downward trend in corporate firms’ profitability, because it implies that firms could react by taking on even larger levels of debt in the future. An uptick in corporate profitability in 2016—reflected in the latest data release but not in the above analysis—provides some relief in this regard.
In sum, the findings in this paper seem to confirm our hypothesis that financial sector based on aggregate indicators tend to overlook the increased vulnerability of the marginal nonfinancial firms in the Chinese corporate sector. The fragility of the system tends to be underestimated as a result, and may provide a sense of complacency about the stability of the Chinese financial system which is unwarranted in view of continuing weakness in the corporate system.
APPENDIX
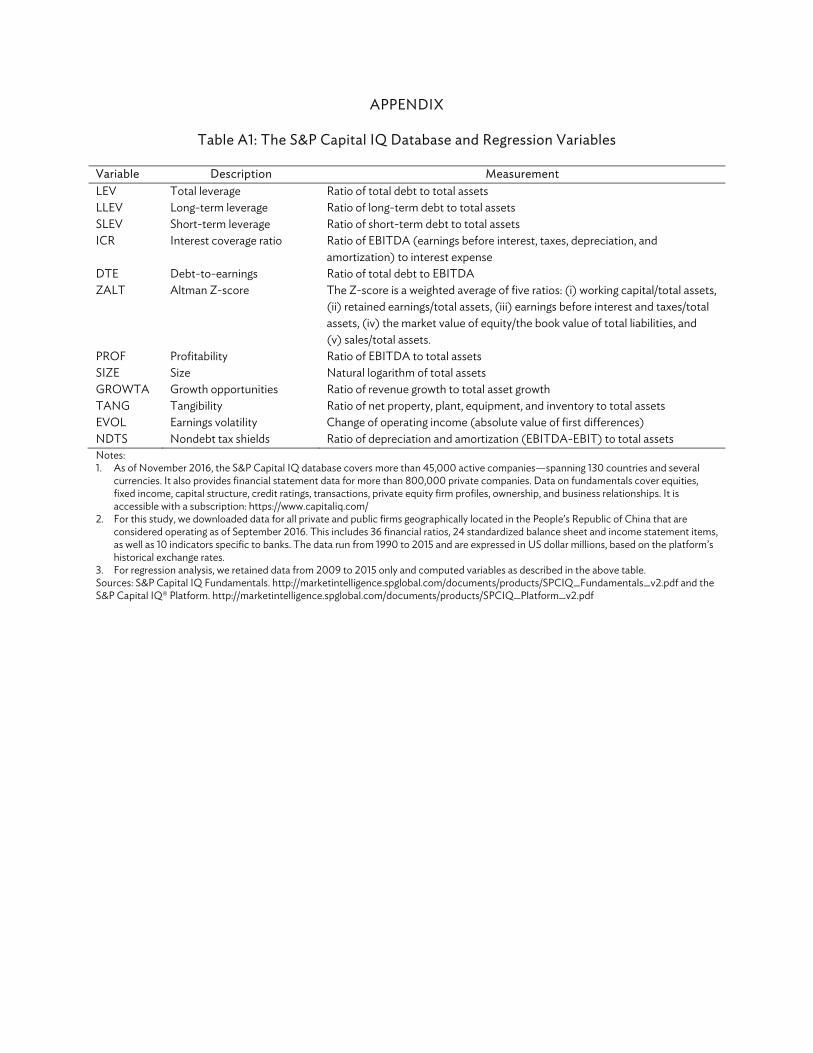
Table A1: The S&P Capital IQ Database and Regression Variables
Variable Description MeasurementLEV Total leverage Ratio of total debt to total assetsLLEV Long-term leverage Ratio of long-term debt to total assetsSLEV Short-term leverage Ratio of short-term debt to total assetsICR Interest coverage ratio Ratio of EBITDA (earnings before interest, taxes, depreciation, and
amortization) to interest expense DTE Debt-to-earnings Ratio of total debt to EBITDAZALT Altman Z-score The Z-score is a weighted average of five ratios: (i) working capital/total assets,
(ii) retained earnings/total assets, (iii) earnings before interest and taxes/total assets, (iv) the market value of equity/the book value of total liabilities, and (v) sales/total assets.
PROF Profitability Ratio of EBITDA to total assetsSIZE Size Natural logarithm of total assetsGROWTA Growth opportunities Ratio of revenue growth to total asset growthTANG Tangibility Ratio of net property, plant, equipment, and inventory to total assetsEVOL Earnings volatility Change of operating income (absolute value of first differences) NDTS Nondebt tax shields Ratio of depreciation and amortization (EBITDA-EBIT) to total assetsNotes: 1. As of November 2016, the S&P Capital IQ database covers more than 45,000 active companies—spanning 130 countries and several
currencies. It also provides financial statement data for more than 800,000 private companies. Data on fundamentals cover equities, fixed income, capital structure, credit ratings, transactions, private equity firm profiles, ownership, and business relationships. It is accessible with a subscription: https://www.capitaliq.com/
2. For this study, we downloaded data for all private and public firms geographically located in the People’s Republic of China that are considered operating as of September 2016. This includes 36 financial ratios, 24 standardized balance sheet and income statement items, as well as 10 indicators specific to banks. The data run from 1990 to 2015 and are expressed in US dollar millions, based on the platform’s historical exchange rates.
3. For regression analysis, we retained data from 2009 to 2015 only and computed variables as described in the above table. Sources: S&P Capital IQ Fundamentals. http://marketintelligence.spglobal.com/documents/products/SPCIQ_Fundamentals_v2.pdf and the S&P Capital IQ® Platform. http://marketintelligence.spglobal.com/documents/products/SPCIQ_Platform_v2.pdf
18 | Appendix
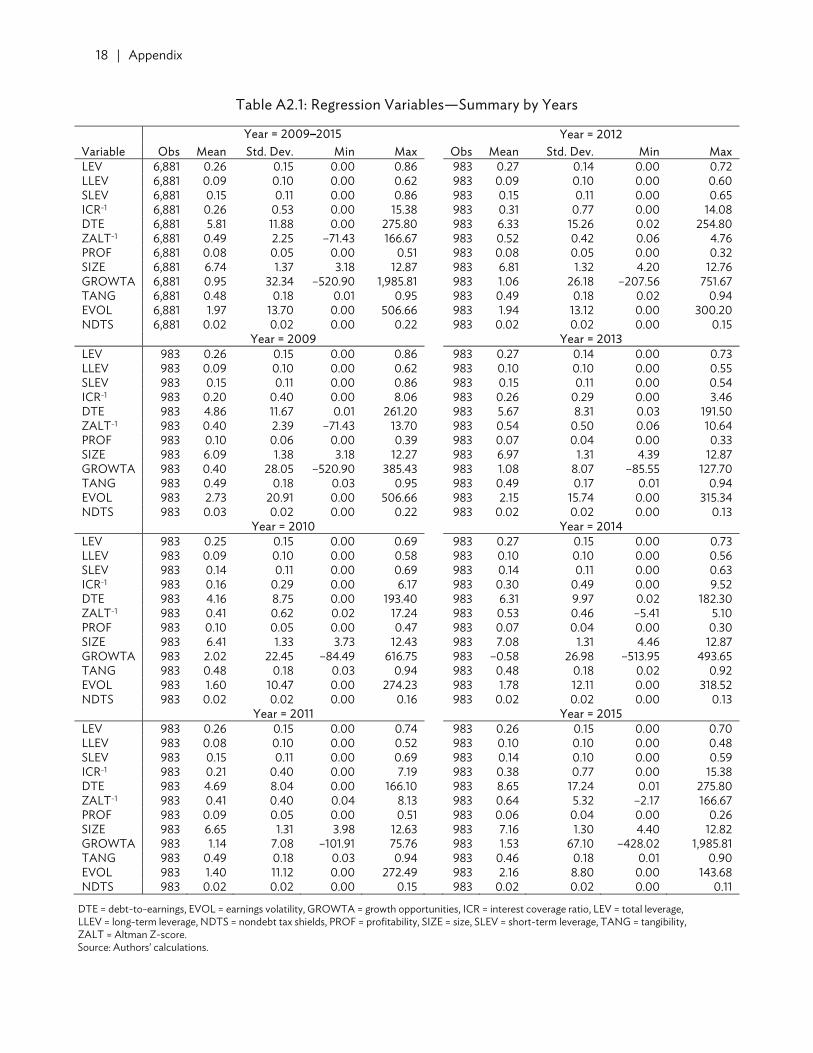
Table A2.1: Regression Variables—Summary by Years
Variable Year = 2009–2015 Year = 2012
Obs Mean Std. Dev. Min Max Obs Mean Std. Dev. Min MaxLEV 6,881 0.26 0.15 0.00 0.86 983 0.27 0.14 0.00 0.72LLEV 6,881 0.09 0.10 0.00 0.62 983 0.09 0.10 0.00 0.60SLEV 6,881 0.15 0.11 0.00 0.86 983 0.15 0.11 0.00 0.65ICR-1 6,881 0.26 0.53 0.00 15.38 983 0.31 0.77 0.00 14.08DTE 6,881 5.81 11.88 0.00 275.80 983 6.33 15.26 0.02 254.80ZALT-1 6,881 0.49 2.25 –71.43 166.67 983 0.52 0.42 0.06 4.76PROF 6,881 0.08 0.05 0.00 0.51 983 0.08 0.05 0.00 0.32SIZE 6,881 6.74 1.37 3.18 12.87 983 6.81 1.32 4.20 12.76GROWTA 6,881 0.95 32.34 –520.90 1,985.81 983 1.06 26.18 –207.56 751.67TANG 6,881 0.48 0.18 0.01 0.95 983 0.49 0.18 0.02 0.94EVOL 6,881 1.97 13.70 0.00 506.66 983 1.94 13.12 0.00 300.20NDTS 6,881 0.02 0.02 0.00 0.22 983 0.02 0.02 0.00 0.15 Year = 2009 Year = 2013 LEV 983 0.26 0.15 0.00 0.86 983 0.27 0.14 0.00 0.73LLEV 983 0.09 0.10 0.00 0.62 983 0.10 0.10 0.00 0.55SLEV 983 0.15 0.11 0.00 0.86 983 0.15 0.11 0.00 0.54ICR-1 983 0.20 0.40 0.00 8.06 983 0.26 0.29 0.00 3.46DTE 983 4.86 11.67 0.01 261.20 983 5.67 8.31 0.03 191.50ZALT-1 983 0.40 2.39 –71.43 13.70 983 0.54 0.50 0.06 10.64PROF 983 0.10 0.06 0.00 0.39 983 0.07 0.04 0.00 0.33SIZE 983 6.09 1.38 3.18 12.27 983 6.97 1.31 4.39 12.87GROWTA 983 0.40 28.05 –520.90 385.43 983 1.08 8.07 –85.55 127.70TANG 983 0.49 0.18 0.03 0.95 983 0.49 0.17 0.01 0.94EVOL 983 2.73 20.91 0.00 506.66 983 2.15 15.74 0.00 315.34NDTS 983 0.03 0.02 0.00 0.22 983 0.02 0.02 0.00 0.13 Year = 2010 Year = 2014 LEV 983 0.25 0.15 0.00 0.69 983 0.27 0.15 0.00 0.73LLEV 983 0.09 0.10 0.00 0.58 983 0.10 0.10 0.00 0.56SLEV 983 0.14 0.11 0.00 0.69 983 0.14 0.11 0.00 0.63ICR-1 983 0.16 0.29 0.00 6.17 983 0.30 0.49 0.00 9.52DTE 983 4.16 8.75 0.00 193.40 983 6.31 9.97 0.02 182.30ZALT-1 983 0.41 0.62 0.02 17.24 983 0.53 0.46 –5.41 5.10PROF 983 0.10 0.05 0.00 0.47 983 0.07 0.04 0.00 0.30SIZE 983 6.41 1.33 3.73 12.43 983 7.08 1.31 4.46 12.87GROWTA 983 2.02 22.45 –84.49 616.75 983 –0.58 26.98 –513.95 493.65TANG 983 0.48 0.18 0.03 0.94 983 0.48 0.18 0.02 0.92EVOL 983 1.60 10.47 0.00 274.23 983 1.78 12.11 0.00 318.52NDTS 983 0.02 0.02 0.00 0.16 983 0.02 0.02 0.00 0.13 Year = 2011 Year = 2015 LEV 983 0.26 0.15 0.00 0.74 983 0.26 0.15 0.00 0.70LLEV 983 0.08 0.10 0.00 0.52 983 0.10 0.10 0.00 0.48SLEV 983 0.15 0.11 0.00 0.69 983 0.14 0.10 0.00 0.59ICR-1 983 0.21 0.40 0.00 7.19 983 0.38 0.77 0.00 15.38DTE 983 4.69 8.04 0.00 166.10 983 8.65 17.24 0.01 275.80ZALT-1 983 0.41 0.40 0.04 8.13 983 0.64 5.32 –2.17 166.67PROF 983 0.09 0.05 0.00 0.51 983 0.06 0.04 0.00 0.26SIZE 983 6.65 1.31 3.98 12.63 983 7.16 1.30 4.40 12.82GROWTA 983 1.14 7.08 –101.91 75.76 983 1.53 67.10 –428.02 1,985.81TANG 983 0.49 0.18 0.03 0.94 983 0.46 0.18 0.01 0.90EVOL 983 1.40 11.12 0.00 272.49 983 2.16 8.80 0.00 143.68NDTS 983 0.02 0.02 0.00 0.15 983 0.02 0.02 0.00 0.11
DTE = debt-to-earnings, EVOL = earnings volatility, GROWTA = growth opportunities, ICR = interest coverage ratio, LEV = total leverage, LLEV = long-term leverage, NDTS = nondebt tax shields, PROF = profitability, SIZE = size, SLEV = short-term leverage, TANG = tangibility, ZALT = Altman Z-score. Source: Authors’ calculations.
Appendix | 19
Table A2.2: Regression Variables—Summary by Leverage Quantiles
Variable Quantile interval = 0–5 Quantile interval = 50–75
Obs Mean Std. Dev. Min Max Obs Mean Std. Dev. Min MaxLEV 344 0.02 0.01 0.00 0.04 1,720 0.31 0.03 0.25 0.36PROF 344 0.09 0.06 0.01 0.42 1,720 0.08 0.05 0.00 0.47SIZE 344 6.26 1.23 3.96 11.11 1,720 6.91 1.37 3.27 11.79GROWTA 344 0.92 15.77 –142.96 197.71 1,720 0.07 19.28 –428.02 262.49TANG 344 0.35 0.15 0.01 0.94 1,720 0.50 0.17 0.02 0.91EVOL 344 1.46 6.10 0.00 59.34 1,720 2.46 18.54 0.00 506.66NDTS 344 0.02 0.01 0.00 0.09 1,720 0.02 0.02 0.00 0.22 Quantile interval = 5–25 Quantile interval = 75–95LEV 1,377 0.10 0.03 0.04 0.15 1,376 0.43 0.04 0.36 0.52PROF 1,377 0.09 0.06 0.00 0.39 1,376 0.07 0.04 0.00 0.27SIZE 1,377 6.32 1.24 3.21 12.43 1,376 7.08 1.24 3.47 10.87GROWTA 1,377 0.63 21.45 –520.90 385.43 1,376 1.72 60.27 –513.95 1,985.81TANG 1,377 0.41 0.16 0.03 0.94 1,376 0.56 0.17 0.01 0.94EVOL 1,377 1.21 5.31 0.00 94.96 1,376 2.00 12.23 0.00 318.52NDTS 1,377 0.02 0.01 0.00 0.12 1,376 0.03 0.02 0.00 0.15 Quantile interval = 25–50 Quantile interval = 95–100LEV 1,720 0.20 0.03 0.15 0.25 344 0.58 0.05 0.52 0.86PROF 1,720 0.09 0.05 0.00 0.51 344 0.06 0.03 0.00 0.20SIZE 1,720 6.53 1.40 3.18 12.87 344 7.72 1.35 3.87 10.84GROWTA 1,720 1.44 21.65 –269.20 616.75 344 1.14 9.85 –74.75 86.21TANG 1,720 0.47 0.16 0.01 0.92 344 0.60 0.20 0.04 0.95EVOL 1,720 1.75 12.03 0.00 300.20 344 3.94 23.67 0.00 315.34NDTS 1,720 0.03 0.02 0.00 0.16 344 0.03 0.02 0.00 0.12
EVOL = earnings volatility, GROWTA = growth opportunities, LEV = total leverage, NDTS = nondebt tax shields, PROF = profitability, SIZE = size, TANG = tangibility. Source: Authors’ calculations.
Table A3: Interest Coverage Ratio and Nonfinancial Corporate Sector Leverage
Year Number of Companies Corporate Debt ($ billion)
ICR<1 Total Ratio (%) ICR<1 Total Ratio (%)1998 2 52 3.8 0.4 33 1.2 1999 5 107 4.7 0.2 53 0.4 2000 7 144 4.9 0.5 50 0.9 2001 2 189 1.1 0.2 55 0.4 2002 8 219 3.7 1.5 80 1.9 2003 9 295 3.1 2.9 116 2.5 2004 8 412 1.9 0.5 159 0.3 2005 23 594 3.9 5.5 234 2.3 2006 52 1,580 3.3 6.3 417 1.5 2007 71 1,944 3.7 12.0 676 1.8 2008 82 2,142 3.8 34.1 963 3.5 2009 87 2,412 3.6 17.1 1,095 1.6 2010 61 2,525 2.4 21.6 1,641 1.3 2011 78 2,750 2.8 51.4 2,233 2.3 2012 146 2,955 4.9 203.4 2,952 6.9 2013 206 3,423 6.0 307.4 4,238 7.3 2014 272 3,565 7.6 533.7 5,234 10.2 2015 303 3,377 9.0 728.9 5,135 14.2
ICR = interest coverage ratio. Source: Authors’ calculations based on S&P Capital IQ.
20 | Appendix
Table A4.1: Capital Structure of Nonfinancial Corporations—SQR for Long-term Leverage
Quantile Variable 2009 2011 2013 20155th PROF 0.000 0.000 –0.002 –0.007
SIZE 0.000 0.001 0.001 0.002GROWTA 0.000 0.000 0.000 0.000TANG 0.000 0.001 0.003 0.004EVOL 0.000 0.000 0.000 0.000NDTS 0.000 0.003 0.000 –0.005Constant 0.000 –0.004 –0.008 –0.011
25th PROF 0.003 –0.040 –0.068 –0.076***SIZE 0.011*** 0.012*** 0.016*** 0.018***GROWTA 0.000 0.000 0.000 0.000TANG 0.083*** 0.059*** 0.085*** 0.107***EVOL 0.000 0.000 0.000 0.000NDTS –0.137* –0.071 –0.121 –0.344*Constant –0.085*** –0.087*** –0.120*** –0.134***
50th PROF –0.026 –0.064 0.020 –0.073SIZE 0.020*** 0.026*** 0.032*** 0.031***GROWTA 0.000 0.000 0.000 0.000TANG 0.169*** 0.130*** 0.184*** 0.168***EVOL 0.000 0.000 0.000 0.000NDTS –0.513* –0.303 –0.458 –0.645*Constant –0.124*** –0.164*** –0.220*** –0.201***
75th PROF –0.039 –0.188* –0.069 –0.271***SIZE 0.030*** 0.037*** 0.040*** 0.041***GROWTA 0.000 –0.001 0.000 0.000TANG 0.247*** 0.207*** 0.215*** 0.196***EVOL 0.000 0.000 0.000 0.000NDTS –0.345 –0.033 –0.492 –0.608Constant –0.166*** –0.207*** –0.223*** –0.209***
95th PROF –0.250 –0.275 0.051 0.075SIZE 0.031** 0.037*** 0.027*** 0.044***GROWTA 0.001 –0.001 –0.002*** 0.000TANG 0.209** 0.198* 0.130 0.143*EVOL 0.000 0.000 –0.000** 0.000NDTS 0.313 0.043 –0.731 –1.038Constant –0.009 –0.061 0.029 –0.094
F-test on equality of coefficients PROF 1.048 2.411* 1.758 3.614** SIZE 100.924*** 24.201*** 33.270*** 33.056*** GROWTA 0.408 0.418 2.157 2.358 TANG 42.578*** 11.711*** 24.552*** 20.804*** EVOL 0.333 1.453 0.813 1.094 NDTS 1.707 0.770 0.979 2.348
Number of observations 983 983 983 983
EVOL = earnings volatility, GROWTA = growth opportunities, NDTS = nondebt tax shields, PROF = profitability, SIZE = size, SQR = simultaneous quantile regression, TANG = tangibility. Note: * p<0.05, ** p<0.01, *** p<0.001. Source: Authors’ calculations.
Appendix | 21
Table A4.2: Capital Structure of Nonfinancial Corporations—SQR for Short-term Leverage
Quantile Variable 2009 2011 2013 20155th PROF –0.085** –0.068*** –0.072 –0.146**
SIZE –0.004* –0.002* –0.001 0.001GROWTA 0.000 –0.000* 0.000 0.000TANG 0.018 0.015* 0.008 0.003EVOL 0.000 0.000 0.001 0.000NDTS 0.341** 0.241*** 0.370*** 0.206Constant 0.030** 0.019* 0.013 0.005
25th PROF –0.106* –0.254*** –0.321*** –0.377***SIZE –0.015*** –0.010*** –0.009*** –0.005**GROWTA 0.000 0.000 –0.001* 0.000TANG 0.059* 0.045 0.053*** 0.012EVOL 0.000 0.000 0.000 –0.001NDTS 0.869** 0.874** 0.453 0.651*Constant 0.119*** 0.112*** 0.117*** 0.095***
50th PROF –0.317** –0.404** –0.536*** –0.599***SIZE –0.023*** –0.012** –0.016*** –0.007*GROWTA 0.000 0.000 –0.001 0.000TANG 0.093** 0.064 0.086** 0.034EVOL 0.000 0.001 0.000 0.000NDTS 1.055** 0.842 1.144** 1.005*Constant 0.235*** 0.195*** 0.205*** 0.166***
75th PROF –0.240* –0.503*** –0.679*** –0.782***SIZE –0.029*** –0.013*** –0.008 –0.010*GROWTA 0.000 0.000 –0.001 0.000TANG 0.107* 0.050 0.031 0.080*EVOL 0.001 0.000 0.000 0.000NDTS 0.731 0.858** 1.108*** 0.729Constant 0.346*** 0.300*** 0.279*** 0.264***
95th PROF –0.707*** –0.473*** –0.836*** –1.041**SIZE –0.043*** –0.023* –0.016 0.003GROWTA 0.000 0.002* –0.002 0.000TANG 0.093 0.060 0.062 0.099EVOL 0.002 –0.001 –0.001 0.000NDTS 0.674 0.423 0.769 0.926Constant 0.616*** 0.500*** 0.490*** 0.304***
F-test on equality of coefficients PROF 5.805*** 6.648*** 10.091*** 6.215*** SIZE 22.949*** 5.530*** 8.819*** 2.912* GROWTA 0.564 1.270 1.127 0.230 TANG 2.759* 0.507 1.387 2.919* EVOL 0.714 0.492 0.836 0.071 NDTS 1.729 3.679 1.377 2.311
Number of observations 983 983 983 983
EVOL = earnings volatility, GROWTA = growth opportunities, NDTS = nondebt tax shields, PROF = profitability, SIZE = size, SQR = simultaneous quantile regression, TANG = tangibility. Note: * p<0.05, ** p<0.01, *** p<0.001. Source: Authors’ calculations.
22 | Appendix
Table A4.3: Capital Structure of Nonfinancial Corporations—SQR for the Inverse of ICR
Quantile Variable 2009 2011 2013 20155th (lagged) PROF –0.113** –0.152*** –0.229*** –0.428***
SIZE –0.001 –0.001 0.000 0.004*GROWTA 0.000 0.000 0.000 0.000TANG 0.030* 0.023** 0.014 0.041*(lagged) EVOL 0.000 0.001 0.002*** 0.000ndts 0.218 0.255** 0.273 0.037Constant 0.015 0.027** 0.038* 0.022
25th (lagged) PROF –0.462*** –0.545*** –1.068*** –1.444***SIZE –0.005** –0.003 –0.002 0.005GROWTA 0.000 0.000 –0.001 0.001TANG 0.050 0.044 0.087 0.081(lagged) EVOL 0.000 0.001 0.001 0.002*NDTS 0.430* 0.661*** 0.416 0.572Constant 0.117*** 0.111*** 0.156*** 0.147***
50th (lagged) PROF –0.826*** –1.034*** –1.692*** –2.411***SIZE –0.009*** –0.002 0.003 0.015*GROWTA 0.000 –0.001 –0.001 0.001TANG 0.069*** 0.078** 0.084* 0.083*(lagged) EVOL 0.001 0.002 0.002 0.002NDTS 0.126 0.603* 0.357 0.807Constant 0.238*** 0.209*** 0.262*** 0.247***
75th (lagged) PROF –1.241*** –1.487*** –2.376*** –3.310***SIZE –0.007 0.004 0.011 0.012GROWTA 0.000 –0.002 –0.002*** 0.001TANG 0.054 0.080* 0.022 –0.010(lagged) EVOL 0.003 0.001 0.002 0.009NDTS –0.258 0.010 0.161 0.269Constant 0.380*** 0.333*** 0.419*** 0.526***
95th (lagged) PROF –1.815*** –2.125*** –3.813*** –7.916***SIZE –0.022 –0.014 –0.015 –0.032GROWTA 0.001 –0.005** –0.005 0.002TANG 0.001 –0.076 0.171 –1.044*(lagged) EVOL 0.009*** 0.000 0.000 0.028*NDTS 0.211 –1.768** 1.082 15.614Constant 0.826*** 0.872*** 0.959*** 1.996**
F-test on equality of coefficients (lagged) PROF 82.137*** 60.277*** 32.786*** 93.567*** SIZE 2.217 1.468 0.796 1.498 GROWTA 1.184 2.994* 1.049 1.318 TANG 1.982 2.032 1.545 2.590* (lagged) EVOL 3.647** 0.054 0.137 3.090* NDTS 1.275 4.530** 0.089 0.885
Number of observations 853 983 983 983
EVOL = earnings volatility, GROWTA = growth opportunities, ICR = interest coverage ratio, NDTS = nondebt tax shields, PROF = profitability, SIZE = size, SQR = simultaneous quantile regression, TANG = tangibility. Note: * p<0.05, ** p<0.01, *** p<0.001. Source: Authors’ calculations.
Appendix | 23
Table A4.4: Capital Structure of Nonfinancial Corporations—SQR for Debt-earnings Ratio
Quantile Variable 2009 2011 2013 20155th (lagged) PROF –2.214 –4.303*** –9.662*** –9.442***
SIZE 0.058 0.059 0.158** 0.228***GROWTA 0.000 –0.006 –0.011 0.000TANG 1.695*** 1.473*** 3.362*** 2.269***(lagged) EVOL 0.006 0.041*** 0.027*** 0.026NDTS –5.392 –1.601 –16.048** –6.723Constant –0.301 –0.008 –0.583 –0.956**
25th (lagged) PROF –9.283*** –15.608*** –22.160*** –34.735***SIZE 0.084 0.260*** 0.250** 0.516***GROWTA –0.001 –0.015 –0.014*** 0.009TANG 3.092*** 3.236*** 4.073*** 5.030***(lagged) EVOL 0.003 0.027* 0.014 0.014NDTS –14.115** –2.192 –22.746*** –23.437***Constant 1.031* 0.364 1.246* 0.139
50th (lagged) PROF –16.996*** –21.270*** –34.544*** –49.510***SIZE 0.275*** 0.370*** 0.514*** 0.790***GROWTA 0.001 –0.028 –0.028*** 0.011TANG 4.316*** 3.506*** 4.437*** 5.557***(lagged) EVOL 0.022 0.038* 0.031 0.021NDTS –27.796*** –14.349* –28.794*** –35.772***Constant 1.842* 1.606** 2.013*** 1.414
75th (lagged) PROF –23.817*** –30.528*** –48.645*** –67.840***SIZE 0.575** 0.565*** 0.798*** 1.218***GROWTA 0.006 –0.057 –0.039* 0.009TANG 3.329*** 3.600*** 5.216*** 6.780***(lagged) EVOL 0.109 0.028 0.042* 0.186NDTS –40.231** –23.806** –46.853*** –55.336**Constant 3.552** 3.322*** 3.636* 2.555
95th (lagged) PROF –33.863*** –50.388*** –68.702*** –130.159***SIZE 1.310 0.709* 1.126 1.069GROWTA –0.025 –0.131 –0.094* 0.033TANG 6.713 4.456 12.822* 12.229(lagged) EVOL 0.545* 0.071 0.003 0.415NDTS –86.400* –75.970*** –57.822 –109.338Constant 5.582 10.621*** 6.346 23.464
F-test on equality of coefficients (lagged) PROF 9.991*** 29.828*** 25.762*** 33.299*** SIZE 5.295*** 4.928*** 4.355** 12.914*** GROWTA 2.349 1.577 2.205 0.700 TANG 3.090* 5.063*** 1.636 5.286*** (lagged) EVOL 2.192 0.938 0.518 0.577 NDTS 4.057** 5.082*** 3.354** 2.363
Number of observations 853 983 983 983
EVOL = earnings volatility, GROWTA = growth opportunities, NDTS = nondebt tax shields, PROF = profitability, SIZE = size, SQR = simultaneous quantile regression, TANG = tangibility. Note: * p<0.05, ** p<0.01, *** p<0.001. Source: Authors’ calculations.
24 | Appendix
Table A4.5: Capital Structure of Nonfinancial Corporations—SQR for the Inverse of Altman Z-score
Quantile Variable 2009 2011 2013 2015
5th (lagged) PROF –0.243 –0.639*** –1.307*** –0.705***(lagged) SIZE 0.029** 0.042*** 0.050*** 0.056***(lagged) GROWTA –0.001 0.000 0.000 –0.001(lagged) TANG 0.224*** 0.118* 0.171** 0.123*(lagged) EVOL 0.001 0.000 0.001 0.001(lagged) NDTS –2.729 –0.095 –0.067 –0.873Constant –0.049 –0.107*** –0.099* –0.225***
25th (lagged) PROF –0.842*** –1.241*** –1.851*** –1.437***(lagged) SIZE 0.050*** 0.062*** 0.077*** 0.097***(lagged) GROWTA 0.001 0.000 0.000 –0.000*(lagged) TANG 0.189*** 0.231*** 0.303*** 0.220***(lagged) EVOL 0.000 0.001 0.000 0.002(lagged) NDTS –0.206 0.251 0.721 0.394Constant –0.047 –0.143*** –0.201*** –0.421***
50th (lagged) PROF –1.118*** –1.462*** –2.402*** –1.847***(lagged) SIZE 0.058*** 0.081*** 0.099*** 0.130***(lagged) GROWTA 0.000 0.000 0.000 0.000(lagged) TANG 0.236*** 0.376*** 0.402*** 0.331***(lagged) EVOL 0.000 0.000 –0.001 0.003*(lagged) NDTS 0.283 –0.055 2.032*** 1.179*Constant –0.012 –0.199*** –0.268*** –0.588***
75th (lagged) PROF –1.088*** –1.509*** –2.741*** –2.176***(lagged) SIZE 0.043** 0.107*** 0.136*** 0.173***(lagged) GROWTA 0.002 0.000 0.000 0.000(lagged) TANG 0.340*** 0.432*** 0.423*** 0.298***(lagged) EVOL 0.002 0.002 0.002 0.003*(lagged) NDTS 1.629 –0.161 2.427*** 2.355Constant 0.175 –0.256*** –0.353** –0.732***
95th (lagged) PROF –1.675** –1.783*** –2.784*** –1.967**(lagged) SIZE 0.082 0.135*** 0.265*** 0.303***(lagged) GROWTA 0.010 –0.001 –0.001 –0.001(lagged) TANG 0.697*** 0.190 0.501** 0.410(lagged) EVOL 0.001 –0.001 –0.001 0.001(lagged) NDTS 1.091 4.524 7.272*** 8.242*Constant 0.264 –0.028 –0.978*** –1.442***
F-test on equality of coefficients (lagged) PROF 1.802 9.793*** 7.457*** 7.829*** (lagged) SIZE 2.805* 13.657*** 14.727*** 11.046*** (lagged) GROWTA 0.794 0.121 0.180 0.569 (lagged) TANG 2.664* 5.766*** 4.453** 1.724 (lagged) EVOL 0.511 0.728 1.495 0.437 (lagged) NDTS 1.256 2.108 7.504*** 1.782 Number of observations 849 983 983 983
EVOL = earnings volatility, GROWTA = growth opportunities, NDTS = nondebt tax shields, PROF = profitability, SIZE = size, SQR = simultaneous quantile regression, TANG = tangibility. Note: * p<0.05, ** p<0.01, *** p<0.001. Source: Authors’ calculations.
REFERENCES Altman, Edward. 1968. “Financial Ratios, Discriminant Analysis and the Prediction of Corporate
Bankruptcy.” The Journal of Finance 23 (4): 589–609. Asian Development Bank (ADB). 2011. Asian Development Outlook 2011. Manila. ————. 2013. Asian Development Outlook Update 2013. Manila. ————. 2016. Asian Development Outlook Update 2016. Manila. Bank for International Settlements (BIS). 2016. BIS Quarterly Review. September. Bernanke, Ben, and John Campbell. 1988. “Is There a Corporate Debt Crisis?” Brookings Papers on
Economic Activity 1988 (1): 83–125. https://core.ac.uk/download/pdf/6252273.pdf Borst, Nicholas, and Nicholas Lardy. 2015. “The People’s Republic of China: Maintaining Financial
Stability amidst Financial Liberalization.” In From Stress to Growth: Strengthening Asia’s Financial Systems in a Post-Crisis World, edited by Marcus Noland and Donghyun Park, chapter 9. Washington, DC: Asian Development Bank and Peterson Institute for International Economics.
Chen, Jean J. 2004. “Determinants of Capital Structure of Chinese-Listed Companies.” Journal of
Business Research 57 (12): 1341–51. CLSA. 2016. “China’s Bad Debt Epidemic.” May 20. https://www.clsa.com/idea/chinas-bad-debt-
epidemic/ DeAngelo, Harry, and Ronald W. Masulis. 1980. “Optimal Capital Structure under Corporate and
Personal Taxation.” Journal of Financial Economics 8 (1): 3–29. DeAngelo, Harry, and Richard Roll. 2015. “How Stable Are Corporate Capital Structures?” The Journal
of Finance 70 (1): 373–418. Fattouh, Bassam, Laurence Harris, and Pasquale Scaramozzino. 2005. “Capital Structure in South
Korea: A Quantile Regression Approach.” Journal of Development Economics 76 (1): 231–50. ————. 2008. “Non-Linearity in the Determinants of Capital Structure: Evidence from UK Firms.”
Empirical Economics 34 (3): 417–38. Ferrarini, Benno, Raghbendra Jha, and Arief Ramayandi, eds. 2012. Public Debt Sustainability in
Developing Asia. London: Asian Development Bank and Routledge. Fitch Ratings. 2016. “China’s Rebalancing Yet to Address Credit Risks.” September 22.
https://www.fitchratings.com/site/pr/1012026 Harris, Milton, and Artur Raviv. 1991. “The Theory of Capital Structure” The Journal of Finance 46 (1):
297–355.
26 | References
Huang, Guihai, and Frank M. Song. 2006. “The Determinants of Capital Structure: Evidence from China.” China Economic Review 17 (1): 14–36.
International Institute of Finance. 2016. Emerging Market Debt Monitor, June 2016. Washington, DC. International Monetary Fund (IMF). 2016a. Global Financial Stability Report: Potent Policies for a
Successful Normalization. April. Washington, DC. ————. 2016b. People’s Republic of China: 2016 Article IV Consultation Staff Report. International
Monetary Fund Country Report No. 16/270. Koenker, Roger, and Gilbert Basset Jr. 1978. “Regression Quantiles.” Econometrica 46 (1): 33–50. Moody’s Investors Service. 2016. “Government of China: Sovereign Exposed to Sizeable, Rising
Contingent Liabilities.” Inside China, July 25. Powell, David. 2014. “Did the Economic Stimulus Payments of 2008 Reduce Labor Supply? Evidence
from Quantile Panel Data Estimation.” RAND Working Papers 710-3. S&P Capital IQ Fundamentals. http://marketintelligence.spglobal.com/documents/products/SPCIQ
_Fundamentals_v2.pdf S&P Capital IQ® Platform. http://marketintelligence.spglobal.com/documents/products/SPCIQ
_Platform_v2.pdf S&P Global Market Intelligence. 2016. “China’s Fast-Rising Bad-Debt Numbers May Vastly Understate
Banking System Risk.” July 18. http://marketintelligence.spglobal.com/our-thinking/ideas/china-s-fast-rising-bad-debt-numbers-may-vastly-understate-banking-system-risks
S&P Global Ratings. 2016a. “China bad debt data may understate banking risk.” Finance Asia. July 28. ————. 2016b. “China’s Credit Boom May Bring Brief but Costly Relief for Banks.” October 19.
www.standardandpoors.com/ratingsdirect Titman, Sheridan, and Roberto Wessels. 1988. “The Determinants of Capital Structure Choice.” The
Journal of Finance 43 (1): 1–19.
ASIAN DEVELOPMENT BANK
AsiAn Development BAnk6 ADB Avenue, Mandaluyong City1550 Metro Manila, Philippineswww.adb.org
Leverage and Capital Structure Determinants of Chinese Listed Companies
We assess the financial fragility of the Chinese economy by looking at risk factors in the nonfinancial sector. Quantile regressions applied to financial data of Chinese listed companies find increasing sensitivity over time of corporate leverage to some of its key determinants. In particular, profitability increasingly acts as a curb on corporate leverage during recent years. At this time of low profitability across the Chinese nonfinancial corporate sector, this may contribute to further increases in corporate leverage over time.
About the Asian Development Bank
ADB’s vision is an Asia and Pacific region free of poverty. Its mission is to help its developing member countries reduce poverty and improve the quality of life of their people. Despite the region’s many successes, it remains home to a large share of the world’s poor. ADB is committed to reducing poverty through inclusive economic growth, environmentally sustainable growth, and regional integration.
Based in Manila, ADB is owned by 67 members, including 48 from the region. Its main instruments for helping its developing member countries are policy dialogue, loans, equity investments, guarantees, grants, and technical assistance.
adb economicsworking paper series
NO. 509
January 2017
LeverAge AND CApitAL StruCture DetermiNANtS Of ChiNeSe LiSteD COmpANieSBenno Ferrarini, Marthe Hinojales, and Pasquale Scaramozzino