Embed Size (px)
Citation preview
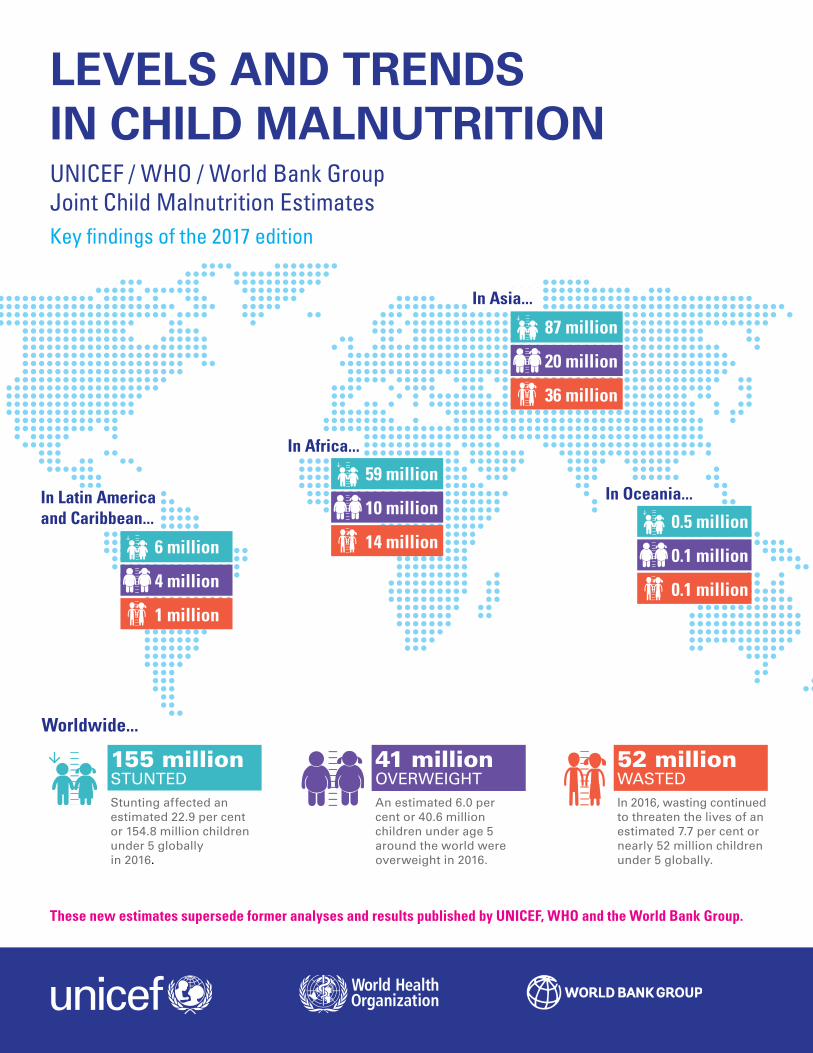
LEVELS AND TRENDS IN CHILD MALNUTRITIONUNICEF / WHO / World Bank Group Joint Child Malnutrition EstimatesKey findings of the 2017 edition
These new estimates supersede former analyses and results published by UNICEF, WHO and the World Bank Group.
41 millionOVERWEIGHTAn estimated 6.0 per cent or 40.6 million children under age 5 around the world were overweight in 2016.
52 millionWASTEDIn 2016, wasting continued to threaten the lives of an estimated 7.7 per cent or nearly 52 million children under 5 globally.
155 millionSTUNTEDStunting affected an estimated 22.9 per cent or 154.8 million children under 5 globallyin 2016.
These new estimates supersede former analyses and results published by UNICEF, WHO and the World Bank Group.
In Africa...
In Asia...
In Oceania...In Latin Americaand Caribbean...
Worldwide...
4 million
6 million
1 million
10 million
59 million
14 million
20 million
87 million
36 million
0.1 million
0.5 million
0.1 million
LEVELS AND TRENDS IN CHILD MALNUTRITIONUNICEF / WHO / World Bank Group Joint Child Malnutrition EstimatesKey findings of the 2017 edition

Good nutrition allows children to grow, develop, learn, play, participate and contribute – while malnutrition robs children of their futures and leaves young lives hanging in the balance.
Stunting is the devastating result of poor nutrition in early childhood. Children suffering from stunting may never grow to their full height and their brains may never develop to their full cognitive potential. Globally, approximately 155 million children under 5 suffer from stunting. These children begin their lives at a marked disadvantage: they face learning difficulties in school, earn less as adults, and face barriers to participation in their communities.
Wasting in children is the life-threatening result of hunger and/or disease. Children suffering from wasting have weakened immunity, are susceptible to long term developmental delays, and face an increased risk of death: they require urgent treatment and care to survive. In 2016, nearly 52 million children under 5 were wasted and 17 million were severely wasted.
There is also an emerging face of malnutrition: childhood overweight and obesity. There are now nearly 41 million overweight children globally, an increase of 11 million since 2000. The emergence of overweight and obesity has been shaped, at least in part, by industry marketing and greater
access to processed foods, along with lower levels of physical activity.
While malnutrition can manifest in multiple ways, the path to prevention is virtually identical: adequate maternal nutrition before and during pregnancy and lactation; optimal breastfeeding in the first two years of life; nutritious and safe foods in early childhood; and a healthy environment including access to basic services and opportunities for physical activity. These key ingredients can deliver a world where children are free from all forms of malnutrition.
Despite this opportunity, the UNICEF, WHO, World Bank global and regional child malnutrition estimates from 1990 to 2017 reveal that we are still far from a world without malnutrition. The joint estimates, published in May 2017, cover indicators of stunting, wasting, severe wasting and overweight among children under 5, and reveal insufficient progress to reach the World Health Assembly targets set for 2025 and the Sustainable Development Goals set for 2030.
Improving children’s nutrition requires effective and sustained multi-sectoral nutrition programming over the long term, and many countries are moving in the right direction. Regular data collection is critical to monitor and analyse country, regional and global progress going forward.
Forms of malnutrition* highlighted in this key findings report
Overweightandstunted
Stunted and wasted
Stunting refers to a child who is too short for his or her age. Stunting is the failure to grow both physically and cognitively and is the result of chronic or recurrent malnutrition. The devastating effects of stunting can last a lifetime.
Overweight refers to a child who is too heavy for his or her height. This form of malnutrition results from expending too few calories for the amount consumed from food and drinks and increases the risk of noncommunicable diseases later in life.
Wasting refers to a child who is too thin for his or her height. Wasting, or acute malnutrition, is the result of recent rapid weight loss or the failure to gain weight. A child who is moderately or severely wasted has an increased risk of death, but treatment is possible.
* Some children suffer from more than one form of malnutrition – such as stunting and overweight or stunting and wasting. There are currently no joint estimates for these combined conditions.
The ultimate aim isfor all children to be
free of malnutrition inall its forms
2 UNICEF/WHO/World Bank Group - Joint Child Malnutrition Estimates 2017 edition

GLOBAL OVERVIEW
Number (millions) of stunted, overweight and wasted children under 5, global, 2000–2016
Percentage of stunted, overweight and wasted children under 5, global, 2000–2016
In 2016, almost half of all overweight children under 5 lived in Asia and one quarter lived in Africa.
In 2016, more than two thirds of all wasted children under 5 lived in Asia and more than one quarter lived in Africa.
Asia 49% Asia 69%Africa 24% Africa 27%
Africa and Asia bear the greatest share of all forms of malnutrition
Source: UNICEF, WHO, World Bank Group joint malnutrition estimates, 2017 edition. See Notes on Data on page 14 on why only one time point is presented for Wasting on the graphs above.
In 2016, more than half of all stunted children under 5 lived in Asia and more than one third lived in Africa.
Asia 56% Africa 38%
stunting overweight wasting 95% confidence interval
0
50
100
150
200
Nu
mb
er (
mill
ion
s)
51.7
20162000
154.8
169.8
182.6
198.4
40.635.932.530.4
0
5
10
15
20
25
30
35
40
5.0 6.07.7
32.7
22.9
Per
cen
tag
e
20162000
Malnutrition rates remain alarming: stunting is declining too slowly while overweight continues to rise
UNICEF/WHO/World Bank Group - Joint Child Malnutrition Estimates 2017 edition 3
4 UNICEF/WHO/World Bank Group - Joint Child Malnutrition Estimates 2017 edition
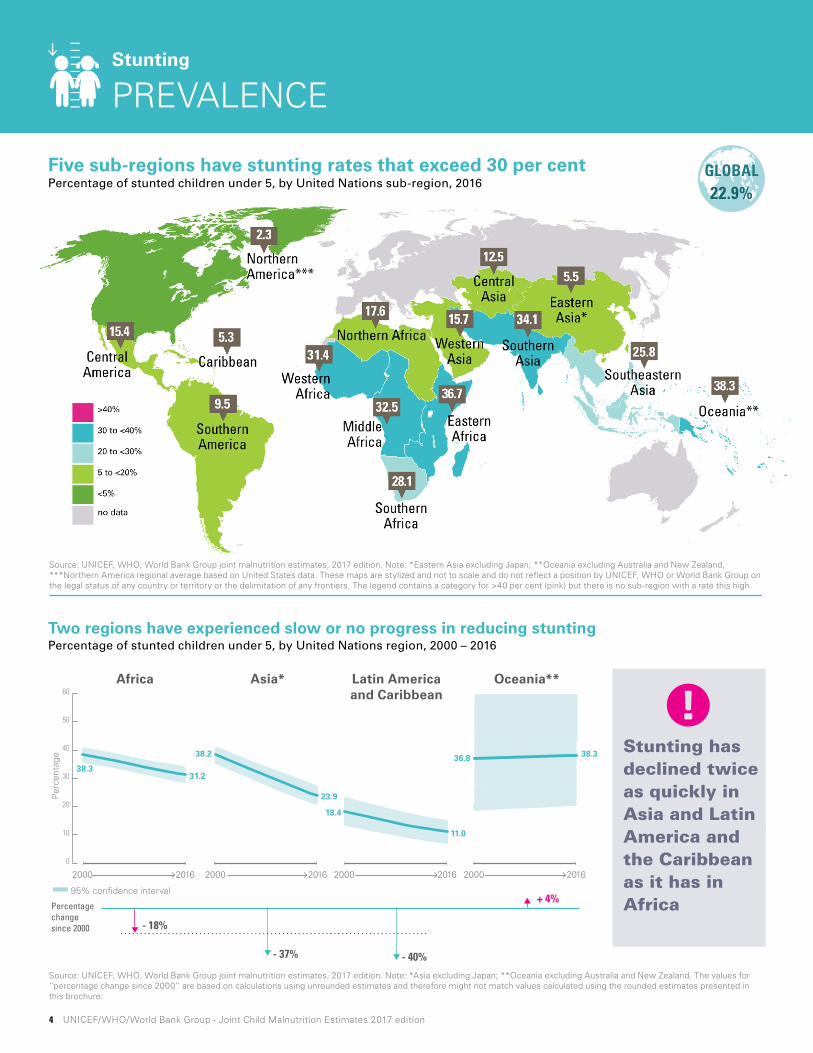
Source: UNICEF, WHO, World Bank Group joint malnutrition estimates, 2017 edition. Note: *Eastern Asia excluding Japan; **Oceania excluding Australia and New Zealand, ***Northern America regional average based on United States data. These maps are stylized and not to scale and do not reflect a position by UNICEF, WHO or World Bank Group on the legal status of any country or territory or the delimitation of any frontiers. The legend contains a category for >40 per cent (pink) but there is no sub-region with a rate this high.
Five sub-regions have stunting rates that exceed 30 per centPercentage of stunted children under 5, by United Nations sub-region, 2016
Stunting has declined twice as quickly in Asia and Latin America and the Caribbean as it has in Africa
Stunting
PREVALENCE
Two regions have experienced slow or no progress in reducing stuntingPercentage of stunted children under 5, by United Nations region, 2000 – 2016
Source: UNICEF, WHO, World Bank Group joint malnutrition estimates, 2017 edition. Note: *Asia excluding Japan; **Oceania excluding Australia and New Zealand. The values for “percentage change since 2000” are based on calculations using unrounded estimates and therefore might not match values calculated using the rounded estimates presented in this brochure.
Africa Latin Americaand Caribbean
Asia* Oceania**
38.3
31.2
38.2
23.9
36.8
18.4
11.0
38.3
Per
cent
age
95% confidence interval
0
10
20
30
40
50
60
2000 2016 2000 2016 2000 2016 2000 2016
Africa Asia*
38.331.2
38.2
23.9
36.8
Per
cent
age
95% confidence interval
0
10
20
30
40
50
60
2000 2016 2000 2016
- 18%
Percentagechangesince 2000
+ 4%
- 37% - 40%
Latin Americaand Caribbean
18.4
11.0
2000 2016
Oceania**
38.3
2000 2016
22.9% 155 million
GLOBAL GLOBAL
7.7% 51.7 million
GLOBAL GLOBAL
6.0% 40.6 million
GLOBAL GLOBAL
UNICEF/WHO/World Bank Group - Joint Child Malnutrition Estimates 2017 edition 5
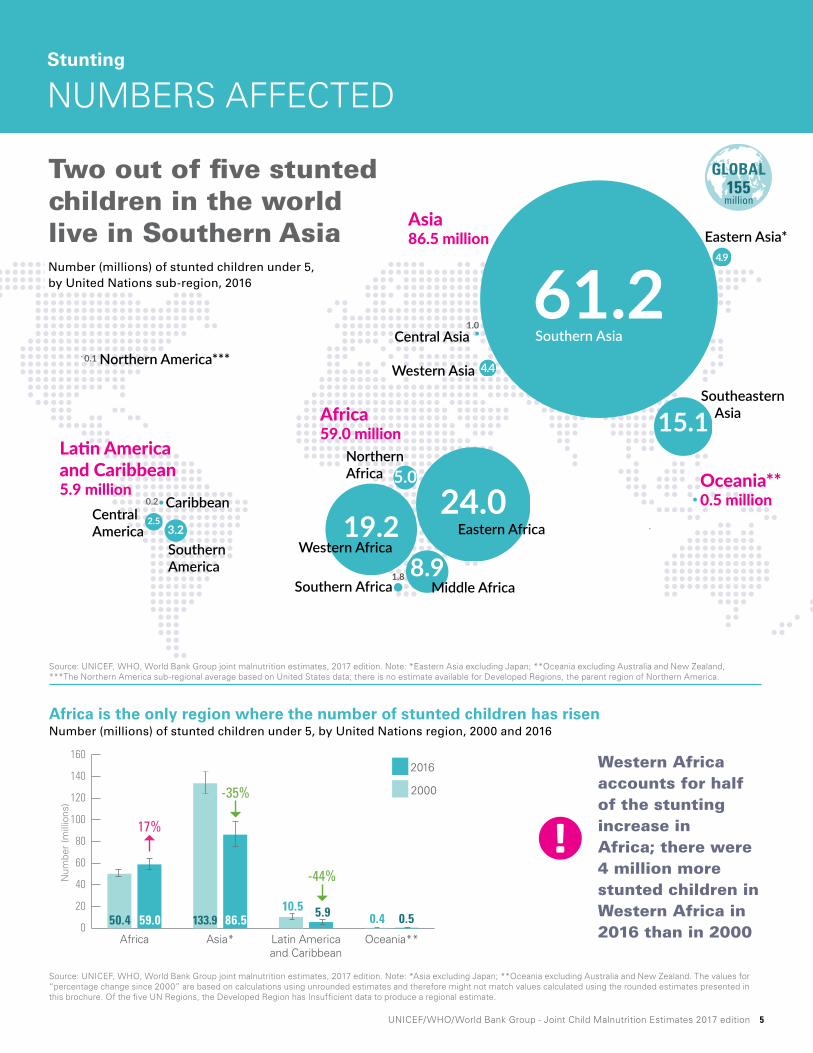
Source: UNICEF, WHO, World Bank Group joint malnutrition estimates, 2017 edition. Note: *Eastern Asia excluding Japan; **Oceania excluding Australia and New Zealand, ***The Northern America sub-regional average based on United States data; there is no estimate available for Developed Regions, the parent region of Northern America.
Africa is the only region where the number of stunted children has risenNumber (millions) of stunted children under 5, by United Nations region, 2000 and 2016
Western Africa accounts for half of the stunting increase in Africa; there were 4 million more stunted children in Western Africa in 2016 than in 2000
Stunting
NUMBERS AFFECTED
0
20
40
60
80
100
120
140
1602016
2000
Oceania**Latin Americaand Caribbean
Asia*Africa
Num
ber
(mill
ions
)
-35%
-44%
17%
50.4 59.0 133.9 86.510.5 5.9 0.4 0.5
19.2
5.0
8.9
24.0
Africa59.0 million
Oceania** 0.5 million
Eastern Africa
Latin Americaand Caribbean5.9 million
CaribbeanCentralAmerica
SouthernAmerica
Middle AfricaSouthern Africa
Western Africa
NorthernAfrica
Western Asia
Central Asia
Eastern Asia*
4.4
15.1
61.24.9
1.0
0.2
Asia86.5 million
3.22.5
Southern Asia
Southeastern Asia
1.8
Northern America***
0.1
Two out of five stunted children in the world live in Southern AsiaNumber (millions) of stunted children under 5, by United Nations sub-region, 2016
Source: UNICEF, WHO, World Bank Group joint malnutrition estimates, 2017 edition. Note: *Asia excluding Japan; **Oceania excluding Australia and New Zealand. The values for “percentage change since 2000” are based on calculations using unrounded estimates and therefore might not match values calculated using the rounded estimates presented in this brochure. Of the five UN Regions, the Developed Region has Insufficient data to produce a regional estimate.
22.9% 155 million
GLOBAL GLOBAL
7.7% 51.7 million
GLOBAL GLOBAL
6.0% 40.6 million
GLOBAL GLOBAL
6 UNICEF/WHO/World Bank Group - Joint Child Malnutrition Estimates 2017 edition
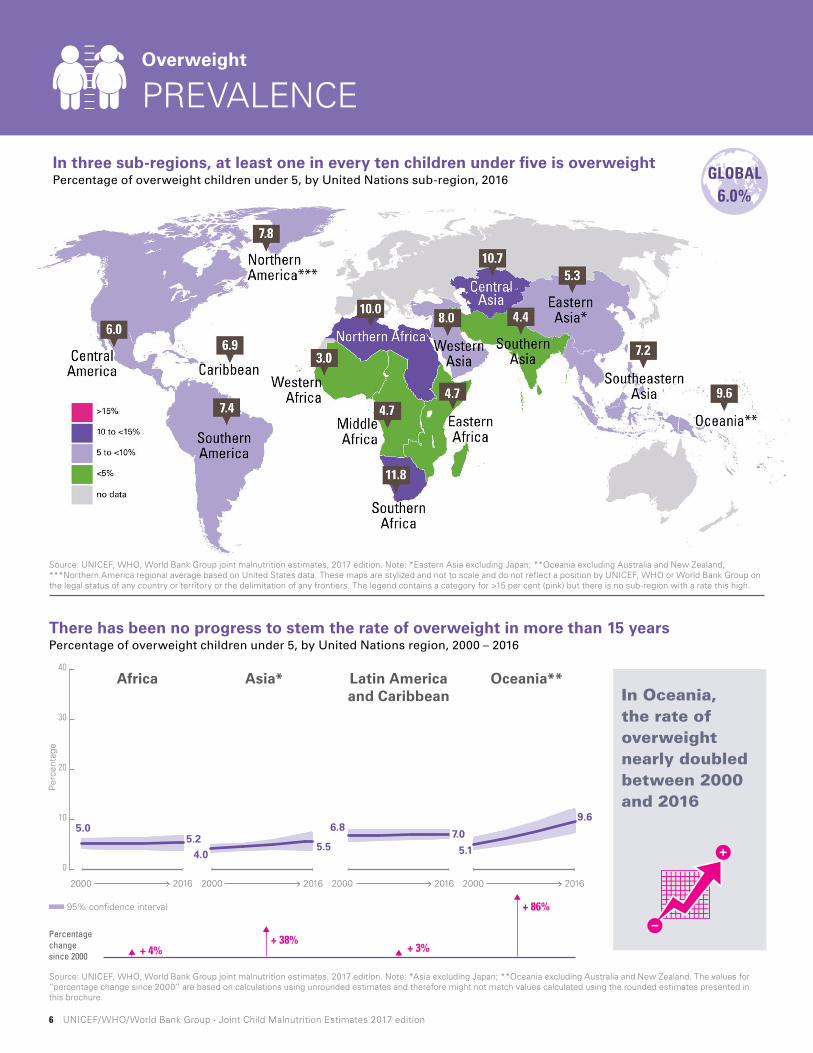
In three sub-regions, at least one in every ten children under five is overweightPercentage of overweight children under 5, by United Nations sub-region, 2016
There has been no progress to stem the rate of overweight in more than 15 yearsPercentage of overweight children under 5, by United Nations region, 2000 – 2016
Source: UNICEF, WHO, World Bank Group joint malnutrition estimates, 2017 edition. Note: *Asia excluding Japan; **Oceania excluding Australia and New Zealand. The values for “percentage change since 2000” are based on calculations using unrounded estimates and therefore might not match values calculated using the rounded estimates presented in this brochure.
Source: UNICEF, WHO, World Bank Group joint malnutrition estimates, 2017 edition. Note: *Eastern Asia excluding Japan; **Oceania excluding Australia and New Zealand, ***Northern America regional average based on United States data. These maps are stylized and not to scale and do not reflect a position by UNICEF, WHO or World Bank Group on the legal status of any country or territory or the delimitation of any frontiers. The legend contains a category for >15 per cent (pink) but there is no sub-region with a rate this high.
Africa Latin Americaand Caribbean
Asia* Oceania**
4 5.1
9.6
6.8 7.05 5.2 5.5
Per
cent
age
overweight
95% confidence interval
0
10
20
30
40
50
60
2000 2016 2000 2016 2000 2016 2000 2016
Africa Latin Americaand Caribbean
Asia*
4.0
6.87.05.0
5.25.5
Per
cent
age
0
10
20
30
40
2000 2016 2000 2016 2000 2016
Oceania**
5.1
9.6
2000 2016
+ 4%Percentagechangesince 2000
+ 3%+ 38%
+ 86%
In Oceania, the rate of overweight nearly doubled between 2000 and 2016
Overweight
PREVALENCE
22.9% 155 million
GLOBAL GLOBAL
7.7% 51.7 million
GLOBAL GLOBAL
6.0% 40.6 million
GLOBAL GLOBAL
UNICEF/WHO/World Bank Group - Joint Child Malnutrition Estimates 2017 edition 7
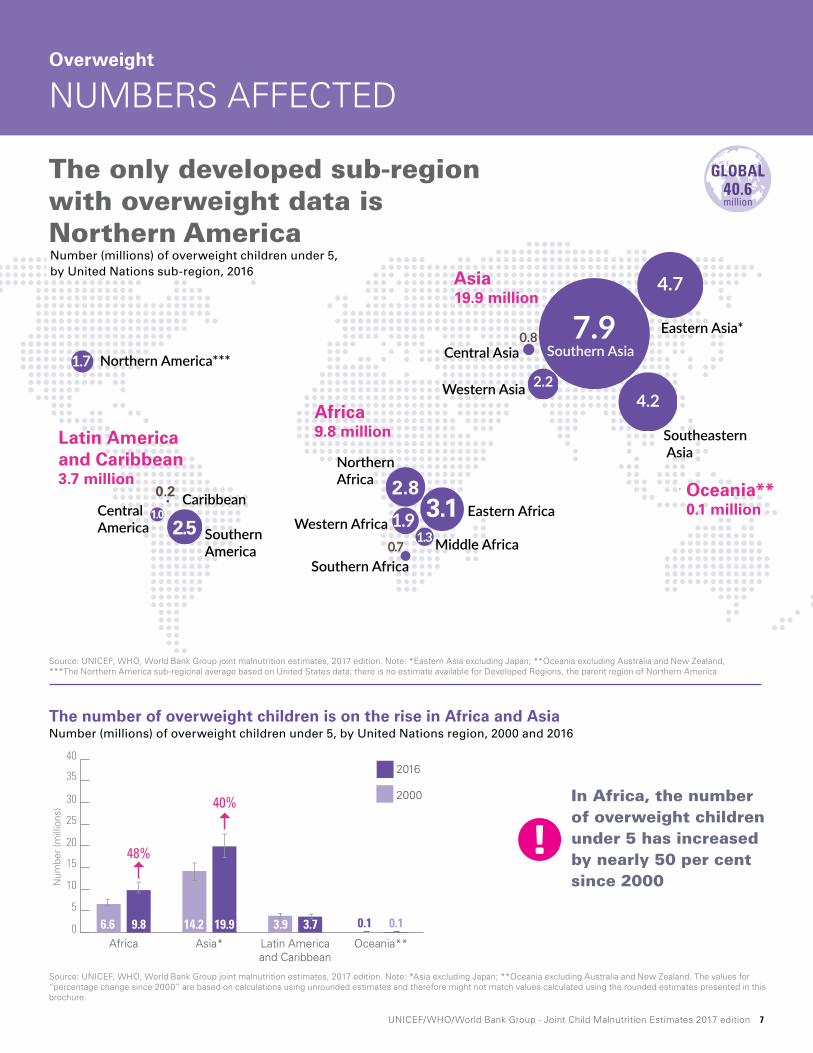
The number of overweight children is on the rise in Africa and AsiaNumber (millions) of overweight children under 5, by United Nations region, 2000 and 2016
In Africa, the number of overweight children under 5 has increased by nearly 50 per cent since 2000
0
5
10
15
20
25
30
35
402016
2000
Oceania**Latin Americaand Caribbean
Asia*Africa
Num
ber
(mill
ions
) 40%
48%
6.6 9.8 14.2 19.9 3.9 3.7 0.1 0.1
Source: UNICEF, WHO, World Bank Group joint malnutrition estimates, 2017 edition. Note: *Asia excluding Japan; **Oceania excluding Australia and New Zealand. The values for “percentage change since 2000” are based on calculations using unrounded estimates and therefore might not match values calculated using the rounded estimates presented in this brochure.
Africa9.8 million Latin America
and Caribbean3.7 million
CaribbeanCentralAmerica Southern
America Middle AfricaSouthern Africa
Western Asia
Central Asia
Asia19.9 million
Southeastern Asia
2.24.2
7.94.7
0.8Southern Asia
Eastern Asia*
1.9
1.7
0.7
2.8
1.3
3.1 Eastern Africa
NorthernAfrica
Western Africa2.51.0
0.2 Oceania** 0.1 million
Northern America***
Overweight
NUMBERS AFFECTED
Number (millions) of overweight children under 5, by United Nations sub-region, 2016
The only developed sub-region with overweight data is Northern America
Source: UNICEF, WHO, World Bank Group joint malnutrition estimates, 2017 edition. Note: *Eastern Asia excluding Japan; **Oceania excluding Australia and New Zealand, ***The Northern America sub-regional average based on United States data; there is no estimate available for Developed Regions, the parent region of Northern America.
22.9% 155 million
GLOBAL GLOBAL
7.7% 51.7 million
GLOBAL GLOBAL
6.0% 40.6 million
GLOBAL GLOBAL

8 UNICEF/WHO/World Bank Group - Joint Child Malnutrition Estimates 2017 edition
Wasting in Southern Asia constitutes a critical public health emergencyPercentage of wasted children under 5, by United Nations sub-region, 2016
Millions of young lives are in jeopardy around the globe due to wastingPercentage of wasted children under 5, by United Nations region, 2016
Source: UNICEF, WHO, World Bank Group joint malnutrition estimates, 2017 edition. Includes 95% confidence interval.Note: *Asia excluding Japan; **Oceania excluding Australia and New Zealand.
Per
cent
age
0
5
10
15
20
25
30
35
40
Africa Latin Americaand Caribbean
Asia* Oceania**
7.4
9.9
1.3
9.4
In Asia and Oceania, wasting is putting nearly
one in ten children under 5 at increased risk of death
Wasting
PREVALENCE
Source: UNICEF, WHO, World Bank Group joint malnutrition estimates, 2017 edition. Note: *Eastern Asia excluding Japan; **Oceania excluding Australia and New Zealand, ***Northern America regional average based on United States data. These maps are stylized and not to scale and do not reflect a position by UNICEF, WHO or World Bank Group on the legal status of any country or territory or the delimitation of any frontiers.
22.9% 155 million
GLOBAL GLOBAL
7.7% 51.7 million
GLOBAL GLOBAL
6.0% 40.6 million
GLOBAL GLOBAL
UNICEF/WHO/World Bank Group - Joint Child Malnutrition Estimates 2017 edition 9
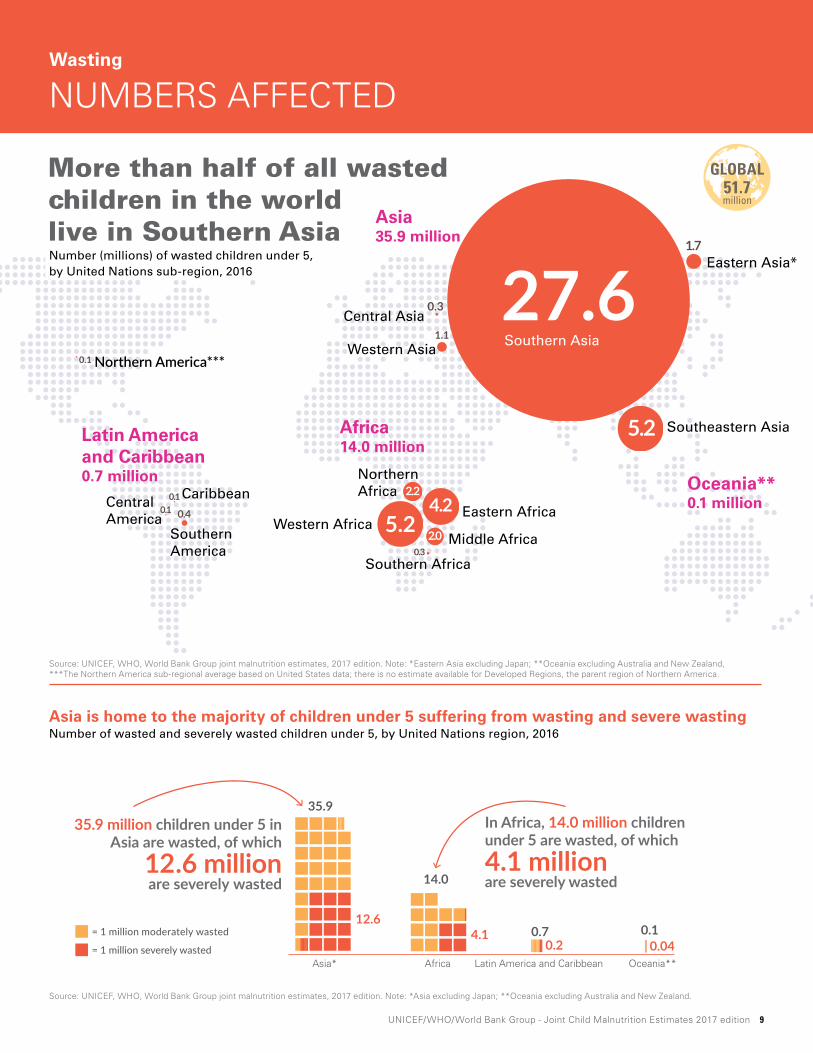
35.9
12.60.7
0.20.1
0.04
14.0
4.1
Oceania**Latin America and CaribbeanAsia* Africa
35.9 million children under 5 in Asia are wasted, of which
12.6 million are severely wasted
In Africa, 14.0 million children under 5 are wasted, of which 4.1 million are severely wasted
= 1 million moderately wasted
= 1 million severely wasted
Asia is home to the majority of children under 5 suffering from wasting and severe wastingNumber of wasted and severely wasted children under 5, by United Nations region, 2016
Source: UNICEF, WHO, World Bank Group joint malnutrition estimates, 2017 edition. Note: *Asia excluding Japan; **Oceania excluding Australia and New Zealand.
Africa14.0 million
Latin Americaand Caribbean0.7 million
CaribbeanCentralAmerica
SouthernAmerica
Middle Africa
Southern Africa
Asia35.9 million
Eastern Africa
NorthernAfrica
Western Africa
1.1
5.2
27.61.7
0.3
Western Asia
Central Asia
Southeastern Asia
Southern Asia
Eastern Asia*
5.20.3
2.2
2.0
4.20.40.1
0.1
Oceania** 0.1 million
Northern America***
0.1
Wasting
NUMBERS AFFECTED
Number (millions) of wasted children under 5, by United Nations sub-region, 2016
More than half of all wasted children in the world live in Southern Asia
Source: UNICEF, WHO, World Bank Group joint malnutrition estimates, 2017 edition. Note: *Eastern Asia excluding Japan; **Oceania excluding Australia and New Zealand, ***The Northern America sub-regional average based on United States data; there is no estimate available for Developed Regions, the parent region of Northern America.
22.9% 155 million
GLOBAL GLOBAL
7.7% 51.7 million
GLOBAL GLOBAL
6.0% 40.6 million
GLOBAL GLOBAL
10 UNICEF/WHO/World Bank Group - Joint Child Malnutrition Estimates 2017 edition
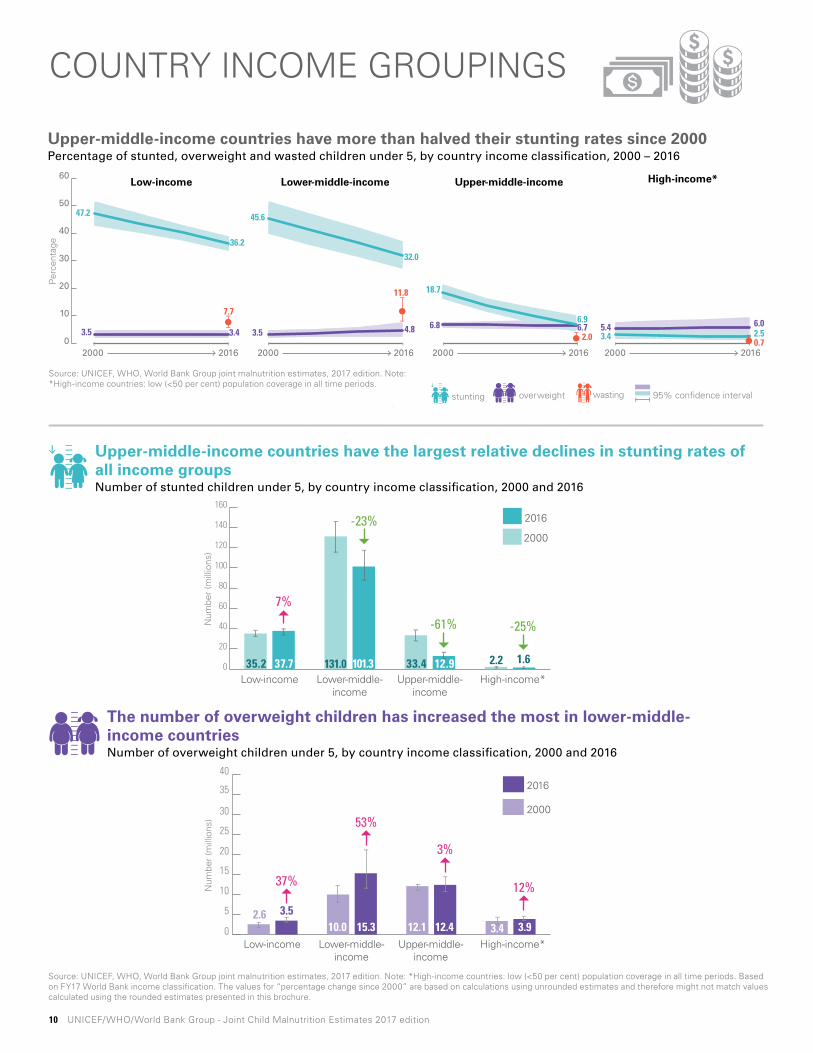
stunting overweight wasting 95% confidence interval
0
10
20
30
40
50
60Low-income
7.7
47.2
36.2
3.5 3.4
Upper-middle-income High-income*
Per
cent
age
Lower-middle-income
11.8
45.6
32.0
3.5 4.82.0
18.7
6.96.8 6.7
2.53.46.05.4
0.72000 2016 2000 2016 2000 2016 2000 2016
Source: UNICEF, WHO, World Bank Group joint malnutrition estimates, 2017 edition. Note: *High-income countries: low (<50 per cent) population coverage in all time periods.
Upper-middle-income countries have more than halved their stunting rates since 2000Percentage of stunted, overweight and wasted children under 5, by country income classification, 2000 – 2016
Source: UNICEF, WHO, World Bank Group joint malnutrition estimates, 2017 edition. Note: *High-income countries: low (<50 per cent) population coverage in all time periods. Based on FY17 World Bank income classification. The values for “percentage change since 2000” are based on calculations using unrounded estimates and therefore might not match values calculated using the rounded estimates presented in this brochure.
The number of overweight children has increased the most in lower-middle- income countriesNumber of overweight children under 5, by country income classification, 2000 and 2016
0
5
10
15
20
25
30
35
40 2016
2000
High IncomeUpper Middle IncomeLower Middle IncomeLow Income
Num
ber
(mill
ions
) 53%
37%
2.6 3.510.0 15.3 12.1 12.4 3.4
3%
12%
3.9High-income*Upper-middle-
incomeLower-middle-
incomeLow-income
Num
ber
(mill
ions
)
0
20
40
60
80
100
120
140
160
2016
2000
High IncomeUpper Middle IncomeLower Middle IncomeLow Income High-income*Upper-middle-income
Lower-middle-income
Low-income
-23%
-61%
7%
35.2 37.7 131.0 101.3 33.4 12.9 2.2 1.6
-25%
Upper-middle-income countries have the largest relative declines in stunting rates of all income groupsNumber of stunted children under 5, by country income classification, 2000 and 2016
COUNTRY INCOME GROUPINGSCOUNTRY INCOME GROUPINGS

UNICEF/WHO/World Bank Group - Joint Child Malnutrition Estimates 2017 edition 11
While less than half of all children under-5 live in lower-middle income countries, two-thirds of all stunted children and three-quarters of all wasted children live there
Distribution of children under-5 in the world, by country income grouping, 2016
Share of wasted children under 5 in 2016
Share of overweightchildren under 5 in 2016
Share of stuntedchildren under 5 in 2016
of all overweight children live in high-income
countries
of all wasted children live in high-income
countries
of all wasted children live in upper-middle-
income countries
of all overweight children live in
low-income countries
of all wasted children live in
low-income countries
of all under-5 children live in high income
countries
of all under-5 children live in upper-middle income
countries
of all under-5 children live in lower-middle income
countries
of all under-5 children live in low income countries
75%of all wasted children live in lower-middle-
income countries
Distribution of children under 5 affected by stunting, overweight and wasting in 2016
10%28%47%
16%
25%of all stunted
children live in low-income
countries
66%of all stunted
children live in lower-middle-
income countriesof all stunted
children live in upper-middle-
income countries
8%
of all stunted children live in high-income
countries
1%
44%of all overweight
children live in lower-middle-
income countries
10% 11%35%of all overweight
children live in upper-middle-
income countries
16%7% 1%

12 UNICEF/WHO/World Bank Group - Joint Child Malnutrition Estimates 2017 edition
PREVALENCE ESTIMATES TABLES*
Footnotes1. Only Developing Regions are displayed, while the aggregates of the Developed Regions are not displayed due to insufficient population coverage. 2. Asia excluding Japan; Eastern Asia excluding Japan.3. Oceania excluding Australia and New Zealand.4. CEE/CIS is Central Eastern Europe/Commonwealth of Independent States; missing data for Russian Federation.5. Other refers mainly to high-income countries not included within UNICEF programme regions.6. High-income countries: low (<50 per cent) population coverage in all time periods.7. For stunting, wasting and severe wasting estimates, the Northern America regional average based only on United States data; hence confidence intervals are not available.8. Consecutive low population coverage; interpret with caution.
Stunting Overweight Wasting and Severe Wasting2000 2016 2000 2016 2016 2016
% stunted (moderate and severe) fo
otno
te % stunted (moderate and severe) fo
otno
te % overweight (moderate and severe) fo
otno
te % overweight (moderate and severe) fo
otno
te % wasted (moderate and severe) fo
otno
te
% wasted (severe)
foot
note
Global 32.7 [31.1-34.4] 22.9 [21.1-24.7] 5.0 [4.5-5.6] 6.0 [5.0-7.1] 7.7 [6.6-8.7] 2.5 [2.0-3.0]
United Nations
Developing Regions1 36.1 [34.3-37.9] 25.0 [23.1-27.0] 4.6 [4.1-5.0] 5.5 [4.5-6.6] 8.4 [7.2-9.5] 2.8 [2.2-3.4]
Africa 38.3 [36.0-40.5] 31.2 [28.8-33.6] 5.0 [4.2-5.9] 5.2 [3.9-6.5] 7.4 [6.3-8.5] 2.2 [1.8-2.6]Eastern Africa 45.6 [41.1-50.2] 36.7 [33.1-40.5] 4.7 [3.8-5.9] 4.7 [3.8-5.8] 6.5 [4.7-8.9] 1.6 [1.2-2.3]Middle Africa 40.1 [34.6-45.8] 32.5 [27.7-37.8] 4.4 [2.9-6.7] 4.7 [3.4-6.4] 7.3 [5.6-9.4] 2.1 [1.5-2.9]Northern Africa 23.6 [17.5-30.9] 17.6 [11.6-25.8] 8.4 [4.9-14.1] 10.0 [4.3-21.3] 7.9 [4.4-13.8] 3.5 [2.0-5.9]Southern Africa 33.2 [29.1-37.6] 28.1 [23.9-32.7] 10.1 [7.5-13.4] 11.8 [7.2-18.6] 5.5 [2.7-10.8] 1.0 [0.5-2.0]Western Africa 37.3 [34.2-40.4] 31.4 [26.7-36.5] 3.2 [2.5-4.1] 3.0 [2.3-4.0] 8.5 [7.2-9.9] 2.3 [1.8-3.1]
Asia2 38.2 [35.6-40.7] 23.9 [20.9-26.8] 4.0 [3.5-4.6] 5.5 [3.8-7.2] 9.9 [8.0-11.8] 3.5 [2.5-4.4]Central Asia 28.0 [21.2-35.8] 12.5 [9.8-15.9] 8 8.8 [5.2-14.4] 10.7 [6.3-17.5] 8 3.8 [3.2-4.4] 8 1.4 [1.0-2.0] 8
Eastern Asia2 19.0 [17.6-20.5] 5.5 [5.0-6.0] 6.2 [5.4-7.0] 5.3 [4.4-6.4] 1.9 [1.8-2.0] 0.4 [0.4-0.5]Southern Asia 49.6 [45.2-54.1] 34.1 [28.9-39.8] 2.8 [1.9-4.0] 4.4 [2.4-8.1] 8 15.4 [12.1-19.4] 5.0 [3.8-6.6]South-eastern Asia 38.2 [32.3-44.6] 25.8 [19.6-33.1] 3.2 [2.6-3.9] 7.2 [3.6-13.8] 8.9 [6.4-12.2] 4.7 [1.9-11.2]Western Asia 23.3 [16.1-32.4] 15.7 [8.3-27.7] 6.7 [4.8-9.2] 8.0 [3.2-18.4] 3.9 [1.3-11.2] 1.1 [0.3-3.7]
Latin American and Caribbean 18.4 [13.8-23] 11.0 [7.4-14.6] 6.8 [5.8-7.8] 7.0 [6.3-7.7] 1.3 [0.8-1.8] 0.3 [0.2-0.4]Caribbean 10.6 [5.8-18.7] 5.3 [2.6-10.5] 8 5.2 [3.9-6.8] 6.9 [4.0-11.7] 8 3.0 [1.8-5.0] 8 1.1 [0.7-1.8] 8
Central America 25.5 [17.1-36.3] 15.4 [9.4-24.2] 5.6 [4.5-7.0] 6.0 [5.6-6.5] 0.9 [0.7-1.2] 0.2 [0.1-0.3]South America 15.8 [11.0-22.3] 9.5 [5.8-15.1] 8 7.5 [6.2-9.1] 7.4 [6.5-8.5] 8 1.3 [0.7-2.3] 8 0.2 [0.1-0.4] 8
Oceania3 36.8 [18.9-59.2] 38.3 [20.9-59.2] 5.1 [4.2-6.3] 9.6 [7.6-12.0] 9.4 [5.7-15.0] 3.3 [1.2-8.6]UNICEF
East Asia and Pacific 24.4[17.0-33.6] 9.3[4.4-18.7] 5.1[3.6-7.2] 5.6[4.3-7.1] 3.2[1.6-6.5] 0.9[0.3-2.5]East and Southern Africa 45.4[39.7-51.2] 34.4[31.7-37.1] 4.5[3.3-5.9] 4.2[3.1-5.7] 6.6[4.8-9.1] 1.9[1.3-2.7]Europe and Central Asia4 13.3[7.2-23.2] 6.2[3.2-11.4] 7.5[5.4-10.3] 12.8[9.7-16.6] 6 1.5[0.8-2.8] 6 0.5[0.2-1.1] 6
Latin America and Caribbean 18.4[13.8-23] 11.0[7.4-14.6] 6.8[5.8-7.8] 7.0[6.3-7.7] 1.3[0.8-1.8] 0.3[0.2-0.4]Middle East and North Africa 22.8[17.2-29.6] 15.3[9.5-23.8] 8.9[6.4-12.2] 10.7[5.9-18.5] 7.4[5.0-11.0] 3.1[1.8-5.1]North America 3.0[-] 2.3[ - ] 6.7[6.4-7.0] 7.8[7.5-8.2] 0.5[ - ] 0.0[ - ]South Asia 51.3[49.7-52.9] 35.8[33.3-38.5] 2.7[1.8-4.0] 4.3[2.4-7.6] 6 16.0[13.4-19.1] 5.2[4.0-6.6]West and Central Africa 41.2[37.9-44.5] 33.5[30.5-36.7] 4.3[3.5-5.4] 3.7[3.1-4.3] 9.2[8.3-10.2] 3[2.4-3.7]WHO
AFRO 42.6 [38.8-46.4] 33.5 [31.1-36.1] 4.6 [3.8-5.5] 4.1 [3.4-5.0] 7.4 [6.1-8.9] 2.2 [1.7-3.0]AMRO 11.0 [5.6-20.6] 6.6 [3.5-12.1] 6.9 [6.2-7.6] 7.1 [6.5-7.9] 0.9 [0.6-1.4] 0.1 [0.0-0.4]EMRO 33.7 [24.4-44.5] 25.1 [16.0-37.1] 6.1 [4.3-8.6] 6.7 [4.2-10.5] 9.1 [7.1-11.6] 3.8 [2.9-5.0]
EURO - - - - - -
SEARO 49.5 [45.7-53.4] 33.8 [29.1-38.9] 2.7 [1.7-4.2] 5.3 [2.6-10.3] 8 15.3 [12.0-19.2] 5.0 [3.7-6.6]WPRO 20.6 [16.8-24.9] 7.0 [4.3-11.2] 5.5 [4.1-7.4] 5.2 [4.6-6.0] 2.4 [1.6-3.5] 0.6 [0.4-0.9]World Bank Income Groups
Low income 47.2 [43.3-51.1] 36.2 [34.1-38.4] 3.5 [2.6-4.6] 3.4 [2.6-4.4] 7.7 [6.1-9.7] 2.1 [1.6-2.8]Middle Income 35.3 [31.8-38.8] 22.7 [19.7-25.7] 4.8 [4.1-5.4] 5.5 [4.1-7.0] 8.2 [5.4-10.9] 2.7 [1.9-3.6]
Lower-middle income 45.6 [40.2-51.1] 32.0 [27.5-36.7] 3.5 [2.6-4.6] 4.8 [3.1-7.5] 11.8 [8.1-16.9] 4.1 [2.9-5.7]Upper middle income 18.7 [16.6-21.1] 6.9 [4.9-9.8] 6.8 [6.3-7.4] 6.7 [5.4-8.3] 2.0 [1.6-2.4] 0.5 [0.4-0.6]
High income6 3.4 [2.2-5.2] 8 2.5 [1.8-3.7] 8 5.4 [3.9-7.5] 8 6.0 [3.9-9.2] 8 0.7 [0.4-1.5] 8 0.0 [0.0-0.1] 8
World Bank Regions
East Asia and Pacific 24.5 [19.3-29.7] 12.2 [8.0-16.3] 4.8 [4.5-5.2] 5.9 [3.9-7.9] 4.1 [2.5-5.7] 1.7 [0.1-3.3]Europe and Central Asia - - - - - -Latin America and Caribbean 18.4 [13.8-23] 11.0 [7.4-14.6] 6.8 [5.8-7.8] 7.0 [6.3-7.7] 1.3 [0.8-1.8] 0.3 [0.2-0.4]Middle East and North Africa 22.8 [17.2-29.6] 15.4 [9.6-23.8] 8.9 [6.4-12.2] 10.7 [5.9-18.5] 7.5 [5.0-11.0] 3.1 [1.8-5.1]North America7 3.0 [-] 2.3 [-] 6.7 [6.4-7.0] 7.8 [7.5-8.2] 0.5 [-] 0.0 [-]South Asia 51.3 [49.7-52.9] 35.8 [33.3-38.5] 2.7 [1.8-4.0] 4.3 [2.4-7.5] 8 16.0 [13.4-19.1] 5.2 [4.0-6.6]Sub-Saharan Africa 43.2 [39.9-46.6] 34.1 [32.1-36.2] 4.4 [3.7-5.2] 3.9 [3.3-4.6] 7.8 [6.5-9.3] 2.4 [1.8-3.1]

UNICEF/WHO/World Bank Group - Joint Child Malnutrition Estimates 2017 edition 13
NUMBER (MILLIONS) AFFECTED TABLES*
*Complete data series for stunting and overweight (1990, 1995, 2000, 2010, 2011, 2012, 2013, 2014, 2015 and 2016) and the latest year for wasting (2016) estimates of prevalence and numbers affected can be found at the websites below for global as well as for the following country groupings: (i) United Nations regions and sub-regions; (ii) UNICEF; (iii) WHO; (iv) World Bank Income; (v) World Bank regions; (vi) SDG regions; and (vii) MDG regions. These websites also contain a file with the regional or income grouping compositions:
UNICEF <uni.cf/jmedashboard> WHO <www.who.int/nutgrowthdb/estimates> World Bank Group <data.worldbank.org/child-malnutrition>
Stunting Overweight Wasting and Severe Wasting2000 2016 2000 2016 2016 2016
number (millions) stunted (moderate and severe) fo
otno
te number (millions) stunted (moderate and severe) fo
otno
te number (millions) overweight (moderate and severe) fo
otno
te number (millions) overweight (moderate and severe) fo
otno
te number (millions) wasted (moderate and severe) fo
otno
te number (millions) wasted (severe)
foot
note
Global 198.4 [188.3-208.4] 154.8 [142.7-166.9] 30.4 [27.1-33.7] 40.6 [33.5-47.7] 51.7 [44.5-58.9] 16.9 [13.3-20.5]
United Nations
Developing Regions1 195.3 [185.5-205.0] 151.9 [140.0-163.9] 24.8 [22.3-27.2] 33.6 [27.1-40.1] 50.7 [43.6-57.9] 16.9 [13.3-20.5]
Africa 50.4 [47.4-53.4] 59.0 [54.5-63.5] 6.6 [5.5-7.8] 9.8 [7.3-12.3] 14.0 [11.9-16.1] 4.1 [3.4-4.9]Eastern Africa 21.1 [19.0-23.2] 24.0 [21.7-26.5] 2.2 [1.7-2.7] 3.1 [2.5-3.8] 4.2 [3.1-5.8] 1.1 [0.8-1.5]Middle Africa 7.2 [6.2-8.2] 8.9 [7.6-10.4] 0.8 [0.5-1.2] 1.3 [0.9-1.8] 2.0 [1.5-2.6] 0.6 [0.4-0.8]Northern Africa 4.8 [3.6-6.3] 5.0 [3.3-7.3] 1.7 [1.0-2.9] 2.8 [1.2-6.1] 2.2 [1.3-3.9] 1.0 [0.6-1.7]Southern Africa 2.1 [1.8-2.4] 1.8 [1.5-2.1] 0.6 [0.5-0.9] 0.7 [0.5-1.2] 0.3 [0.2-0.7] 0.1 [0.0-0.1]Western Africa 15.2 [14.0-16.5] 19.2 [16.4-22.4] 1.3 [1.0-1.7] 1.9 [1.4-2.5] 5.2 [4.4-6.1] 1.4 [1.1-1.9]
Asia2 133.9 [125.0-142.8] 86.5 [75.7-97.4] 14.2 [12.1-16.3] 19.9 [13.9-26.0] 35.9 [29.1-42.7] 12.6 [9.0-16.1]
Central Asia 1.6 [1.2-2.1] 1.0 [0.8-1.2] 8 0.5 [0.3-0.8] 0.8 [0.5-1.3] 8 0.3 [0.2-0.3] 0.1 [0.1-0.2] 8
Eastern Asia2 16.5 [15.3-17.8] 4.9 [4.5-5.4] 5.4 [4.7-6.1] 4.7 [3.9-5.7] 1.7 [1.6-1.8] 0.4 [0.4-0.4]
Southern Asia 89.4 [81.5-97.4] 61.2 [51.8-71.3] 5.0 [3.5-7.2] 7.9 [4.2-14.6] 8 27.6 [21.7-34.8] 9.0 [6.8-11.9]
South-eastern Asia 20.9 [17.7-24.4] 15.1 [11.5-19.3] 1.7 [1.4-2.1] 4.2 [2.1-8.1] 5.2 [3.7-7.1] 2.7 [1.1-6.6]Western Asia 5.4 [3.7-7.5] 4.4 [2.3-7.7] 1.5 [1.1-2.1] 2.2 [0.9-5.2] 1.1 [0.4-3.1] 0.3 [0.1-1.0]
Latin American and Caribbean 10.5 [7.9-13.1] 5.9 [4.0-7.8] 3.9 [3.3-4.4] 3.7 [3.4-4.1] 0.7 [0.4-0.9] 0.2 [0.1-0.2]Caribbean 0.4 [0.2-0.7] 0.2 [0.1-0.4] 8 0.2 [0.2-0.3] 0.2 [0.1-0.4] 8 0.1 [0.1-0.2] 8 0.0 [0.0-0.1] 8
Central America 4.4 [2.9-6.2] 2.5 [1.5-4.0] 1.0 [0.8-1.2] 1.0 [0.9-1.1] 0.1 [0.1-0.2] 0.0 [0.0-0.1]South America 5.7 [4.0-8.1] 3.2 [2.0-5.1] 8 2.7 [2.2-3.3] 2.5 [2.2-2.9] 8 0.4 [0.2-0.8] 8 0.1 [0.0-0.1] 8
Oceania3 0.4 [0.2-0.7] 0.5 [0.3-0.8] 0.1 [0.0-0.1] 0.1 [0.1-0.2] 0.1 [0.1-0.2] 0.0 [0.0-0.1]UNICEF
East Asia and Pacific 36.2[25.2-49.9] 14.4[6.8-28.9] 7.6[5.4-10.7] 8.6[6.7-11.0] 4.8[2.3-9.6] 1.4[0.5-3.9]East and Southern Africa 27.4[23.9-30.9] 28.4[26.2-30.7] 2.7[2.0-3.6] 3.5[2.5-4.7] 3.2[2.3-4.4] 1.5[1.1-2.2]Europe and Central Asia4 6.7[3.6-11.7] 3.4[1.8-6.4] 6 3.8[2.7-5.2] 7.1[5.4-9.3] 6 0.8[0.4-1.5] 6 0.3[0.1-0.6] 6
Latin America and Caribbean 10.5[7.9-13.1] 5.9[4.0-7.8] 3.9[3.3-4.4] 3.7[3.4-4.1] 0.7[0.4-0.9] 0.2[0.1-0.2]Middle East and North Africa 8.5[6.4-11.0] 7.5[4.6-11.6] 3.3[2.4-4.5] 5.2[2.9-9.0] 3.4[2.3-5.1] 1.5[0.9-2.5]North America 0.6[ - ] 0.5[ - ] 1.4[ - ] 1.7[ - ] 0.1[ - ] 0.0[ - ]South Asia 89.2[86.4-92.0] 61.9[57.5-66.4] 4.7[3.1-7.0] 7.4[4.1-13.1] 6 27.9[23.2-33.2] 8.9[7.0-11.4]West and Central Africa 22.9[21.1-24.8] 28.1[25.6-30.8] 2.4[1.9-3.0] 3.1[2.6-3.6] 9.8[8.9-10.9] 2.5[2.0-3.1]WHO
AFRO 48.0 [43.7-52.3] 54.6 [50.6-58.8] 5.2 [4.3-6.2] 6.7 [5.5-8.1] 12.1 [9.9-14.6] 3.6 [2.7-4.9]AMRO 8.6 [4.4-16.0] 5.0 [2.7-9.0] 5.3 [4.9-5.9] 5.4 [4.9-5.9] 0.7 [0.4-1.0] 0.1 [0.0-0.3]EMRO 21.3 [15.5-28.2] 20.2 [12.9-29.9] 3.9 [2.7-5.4] 5.4 [3.4-8.5] 7.3 [5.7-9.3] 3.1 [2.3-4.1]EURO - - - - - -SEARO 90.7 [83.6-97.8] 60.3 [51.9-69.4] 4.9 [3.1-7.6] 9.4 [4.7-18.4] 8 27.2 [21.4-34.3] 8.9 [6.7-11.8]WPRO 23.8 [19.4-28.8] 8.4 [5.2-13.4] 6.4 [4.7-8.6] 6.3 [5.5-7.1] 2.8 [1.9-4.2] 0.7 [0.4-1.0]World Bank Income GroupsLow income 35.2 [32.3-38.1] 37.7 [35.5-40.0] 2.6 [2.0-3.4] 3.5 [2.7-4.6] 8.0 [6.4-10.1] 2.2 [1.7-2.9]Middle Income 164.3 [148.1-180.6] 114.2 [99.0-129.4] 22.1 [19.1-25.2] 27.7 [20.4-35.1] 41.2 [27.4-54.9] 13.8 [9.3-18.2]
Lower-middle income 131.0 [115.4-146.8] 101.3 [87.3-116.4] 10.0 [7.5-13.3] 15.3 [9.8-23.7] 37.5 [25.8-53.6] 12.9 [9.1-18.1]Upper middle income 33.4 [29.6-37.6] 12.9 [9.1-18.1] 12.1 [11.2-13.1] 12.4 [9.9-15.5] 3.6 [3.0-4.5] 0.9 [0.7-1.1]
High income6 2.2 [1.4-3.3] 8 1.6 [1.1-2.3] 8 3.4 [2.5-4.8] 8 3.9 [2.5-5.9] 8 0.5 [0.2-1.0] 8 0.0 [0.0-0.1] 8
World Bank Regions
East Asia and Pacific 36.4 [28.7-44.1] 18.8 [12.4-25.3] 7.2 [6.7-7.7] 9.2 [6.0-12.3] 6.4 [3.9-8.8] 2.6 [0.2-5.1]Europe and Central Asia - - - - - -
Latin America and Caribbean 10.5 [7.9-13.1] 5.9 [4.0-7.8] 3.9 [3.3-4.4] 3.7 [3.4-4.1] 0.7 [0.4-0.9] 0.2 [0.1-0.2]Middle East and North Africa 8.5 [6.4-11.1] 7.5 [4.7-11.6] 3.3 [2.4-4.6] 5.2 [2.9-9.0] 3.6 [2.4-5.4] 1.5 [0.9-2.5]North America7 0.6 0.5 1.4 [1.3-1.5] 1.7 [1.6-1.8] 0.1 0.0South Asia 89.2 [86.4-92.0] 61.9 [57.5-66.4] 4.7 [3.1-7.0] 7.4 [4.1-13.0] 8 27.7 [23.1-33.0] 8.9 [7.0-11.4]Sub-Saharan Africa 50.1 [46.3-54.0] 56.8 [53.5-60.2] 5.1 [4.3-6.1] 6.4 [5.4-7.7] 13.0 [10.8-15.5] 4.0 [3.0-5.2]
14 UNICEF/WHO/World Bank Group - Joint Child Malnutrition Estimates 2017 edition
Strengths and weaknesses of malnutrition dataPrevalence estimates for stunting and overweight are relatively robust. It is therefore possible to track global and regional changes in these two conditions over time.
Wasting and severe wasting are acute conditions that can change frequently and rapidly. This makes it difficult to generate reliable trends over time, and as such, this report provides only most recent global and regional estimates.
The global and regional estimates presented here are based on data from national household surveys. These data are collected infrequently and measure malnutrition at one point in time (e.g. during several months of field work), making it difficult to capture the rapid fluctuations in wasting that can occur over the course of a given year. Incidence data (i.e. the number of new cases that occur during the calendar year) would allow for better tracking of changes over time; however, these data currently do not exist.
The analysis methods have remained unchanged from the 2012 report, except for some minor refinements detailed below:1. Year assigned to each surveyWhen data collection begins in one calendar year and continues into the next, the survey year assigned is the one in which most of the fieldwork took place. For example, if a survey was conducted between 1 September 2009 and 28 February 2010, the year 2009 would be assigned, since the majority of data collection took place in that year (i.e., four months in 2009 versus two months in 2010). This method has been used since the 2013 edition (prior to that, the latter year was used by default – e.g., 2010 in the example above).
2. Final reports onlyAs of the 2014 edition, the dataset used to generate the global and regional estimates is based only on final survey results. Preliminary
survey results are no longer included in the dataset due to situations where they were cancelled or significantly changed before release.
3. Updated data sourcesi. The updated joint dataset includes:
• 806 nationally representative surveys;• data from 150 countries and territories, representing more than 90
per cent of all children under 5 globally (population coverage varies by regions and periods). The majority of data available are from low- and middle-income countries – more efforts are needed to generate data from high-income countries.
ii. The under 5 population estimates were based on The United Nations World Population Prospects, 2015 Revision. These were used as weighting factors for each country survey to derive the regional and global prevalence estimates and calculate the numbers affected.
iii. Regional and country income classifications were based on FY17 World Bank income classification.
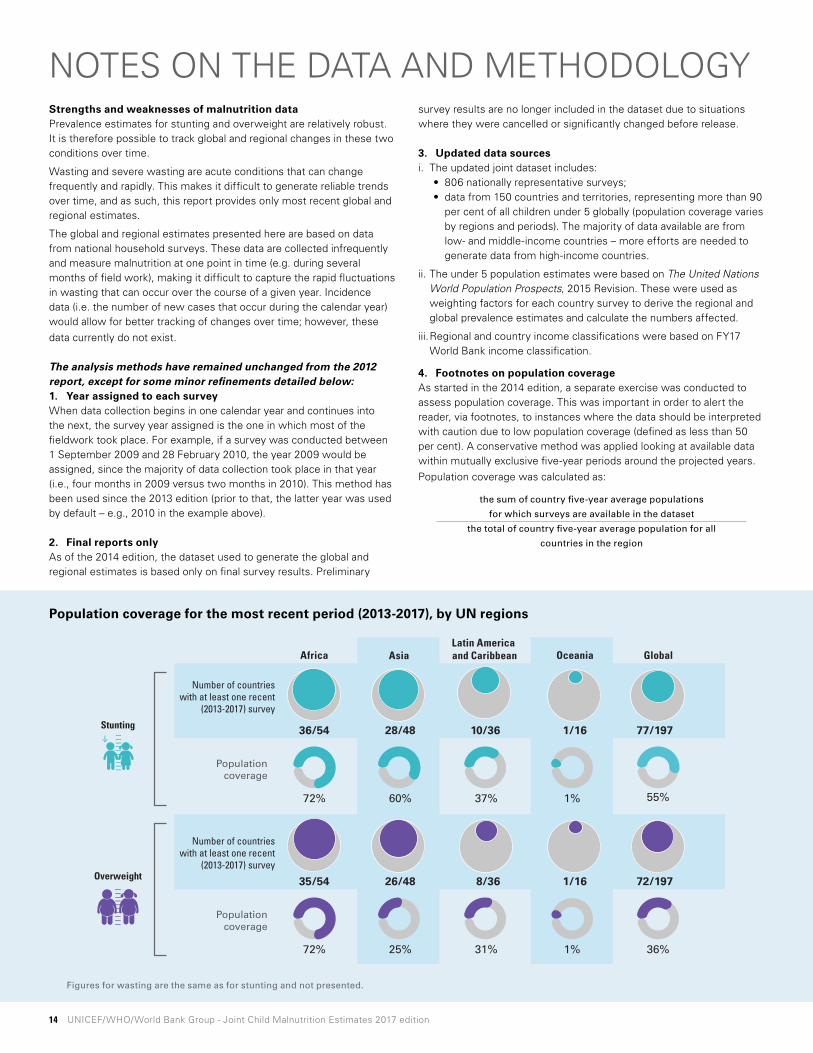
4. Footnotes on population coverageAs started in the 2014 edition, a separate exercise was conducted to assess population coverage. This was important in order to alert the reader, via footnotes, to instances where the data should be interpreted with caution due to low population coverage (defined as less than 50 per cent). A conservative method was applied looking at available data within mutually exclusive five-year periods around the projected years. Population coverage was calculated as:
the sum of country five-year average populations
for which surveys are available in the dataset
the total of country five-year average population for all
countries in the region
Populationcoverage
10/36 77/197
GlobalOceania
28/48
Asia
1/16
Latin America and Caribbean
36/54
Africa
Number of countries with at least one recent
(2013-2017) survey
Number of countries with at least one recent
(2013-2017) survey
55%60% 37% 1%72%
Populationcoverage
8/36 72/19726/48 1/1635/54
36%25% 31% 1%72%
Stunting
Overweight
Figures for wasting are the same as for stunting and not presented.
NOTES ON THE DATA AND METHODOLOGY
Population coverage for the most recent period (2013-2017), by UN regions
UNICEF/WHO/World Bank Group - Joint Child Malnutrition Estimates 2017 edition 15
This key findings report of the 2017 edition of the Joint Malnutrition Estimates summarizes the new numbers and main messages for official United Nations data on child malnutrition. The following materials can be downloaded at the links below for the three organizations:• the latest country-level joint malnutrition dataset, a time series of all
country estimates that were used to generate the global and regional estimates;
• the global and regional estimates database from 1990-2016 by various regional groupings (e.g. United Nations, UNICEF, WHO, etc., regional groupings);
ONLINE MATERIALS
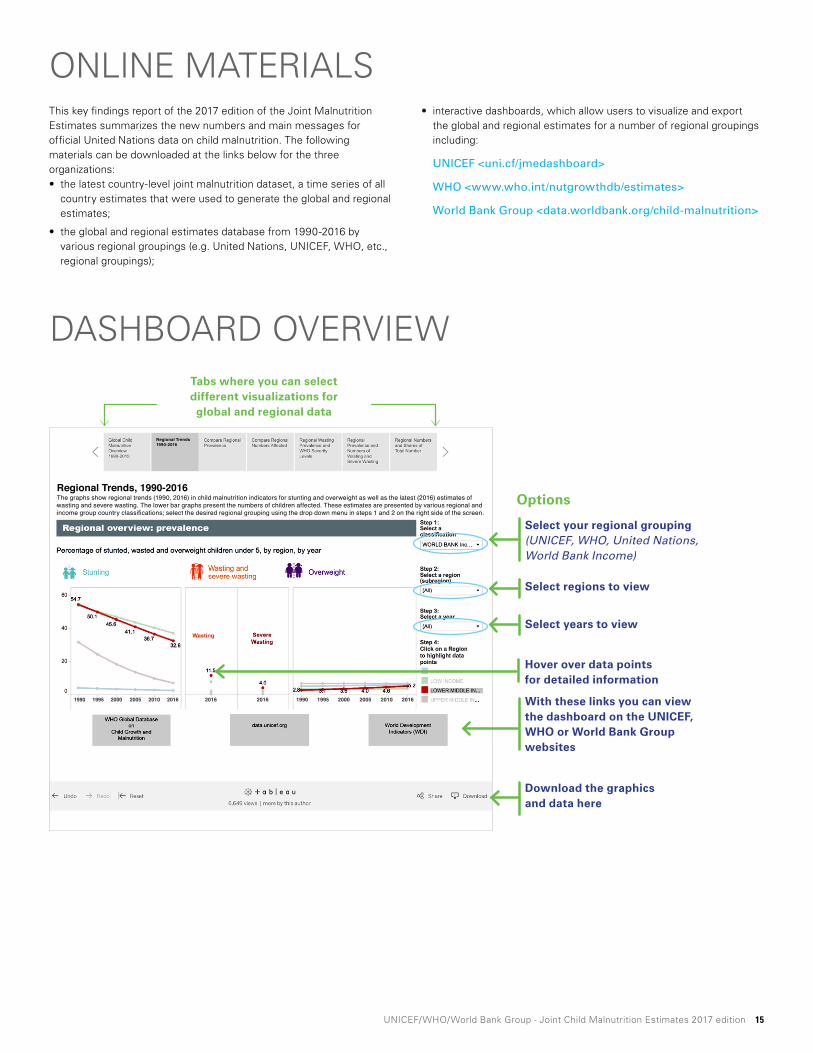
Select your regional grouping (UNICEF, WHO, United Nations, World Bank Income)
Select regions to view
Select years to view
Hover over data points for detailed information
OptionsRegional Trends, 1990-2016The graphs show regional trends (1990, 2016) in child malnutrition indicators for stunting and overweight as well as the latest (2016) estimates of wasting and severe wasting. The lower bar graphs present the numbers of children affected. These estimates are presented by various regional and income group country classifications; select the desired regional grouping using the drop down menu in steps 1 and 2 on the right side of the screen.
Regional Trends1990-2016
1990 1995 2000 2005 2010 2016 1990 1995 2000 2005 2010 2016 2016 2016
Tabs where you can select different visualizations for global and regional data
With these links you can view the dashboard on the UNICEF, WHO or World Bank Group websites
DASHBOARD OVERVIEW
Download the graphics and data here
• interactive dashboards, which allow users to visualize and export the global and regional estimates for a number of regional groupings including:
UNICEF <uni.cf/jmedashboard>
WHO <www.who.int/nutgrowthdb/estimates>
World Bank Group <data.worldbank.org/child-malnutrition>
16 UNICEF/WHO/World Bank Group - Joint Child Malnutrition Estimates 2017 edition
Acknowledgements
This brochure was prepared by: the Data and Analytics Section of the Division of Data, Research and Policy, UNICEF New York together with the Department of Nutrition for Health and Development, WHO Geneva and the Development Data Group of the World Bank, Washington DC. May 2017.
Organizations and individuals involved in generating the brochure:
UNICEF: Chika Hayashi, Julia Krasevec, Richard Kumapley, Vrinda Mehra
WHO: Mercedes de Onis, Elaine Borghi, Monika Blössner, Monica Flores Urrutia
World Bank Group: Espen Beer Prydz, Umar Serajuddin
Design: Nona Reuter (UNICEF); Writing and editing: Julia D’Aloisio (UNICEF)
Special thanks go to Victor Aguayo (UNICEF), Francesco Branca (WHO) and Attila Hancioglu (UNICEF)
Copyright © 2017 by the United Nations Children’s Fund, the World Health Organization and World Bank Group
Email: [email protected] data.unicef.org
Email: [email protected] www.who.int/nutrition
Email: [email protected] data.worldbank.org