Embed Size (px)
Citation preview
Revised version, 8-2-05
LEVEL OF IMPAIRED CONTROL PREDICTSOUTCOME OF MODERATION-ORIENTEDTREATMENT FOR ALCOHOL PROBLEMS
Nick Heather1
&
Sharon Dawe2
andJennifer Brodie3
1. School of Psychology & Sport Sciences, Northumbria University, Newcastle upon Tyne NE1 8ST, UK
2. School of Applied Psychology, Griffith University, Mt. Gravatt Campus, Brisbane 4111, Queensland,
Australia
26 pages: total 3. Department of Psychiatry, University of Newcastle upon Tyne,Newcastle upon Tyne, NE 1 4LP, UK
word count = 5808Suggested running head: Level of impaired control predicts treatment outcome
Address for corresponance : nicks email address
Correspondence to: Professor Nick Heather, School of Psychology & Sport Sciences, NorthumbriaUniversity, Newcastle upon Tyne, NE1 8ST, UK [email protected] Field Code Changed

2
Formatted
3
ABSTRACT
Aims To examine the ability of the Impaired Control Scale (ICS) to predict outcome
of moderation-oriented treatment for alcohol problems and to compare this predictive
ability directly with that of a widely used measure of alcohol dependence, the Severity
of Alcohol Dependence Questionnaire (SADQ).
Design Prospective follow-up study.
Setting Outpatient treatment centres.
Participants A combined sample 154 problem drinkers taking part in two clinical
trials of Moderation-oriented Cue Exposure in the UK and Australia. Clients were
followed up 6 (UK) and 8 (Australia) months after the end of treatment.
Measurements Outcome was categorised by combining drinking behaviour at
follow-up with changes on the Alcohol Problems Questionnaire from before treatment
to follow-up. Controlling for research site, baseline scores on Part 2 of the ICS
(substitution method) and the SADQ-C were entered in logistic regression analyses
with 3 outcome dichotomies as dependent variables.
Findings 5% of clients were abstinent at follow-up, 13% non-problem drinkers, 25%
much improved, 24% somewhat improved and 34% unimproved. Location of
treatment and ICS2 scores were significant predictors of whether or not clients
achieved a successful outcome (abstinence or non-problem drinking). Using a cut-
point of 25 on the ICS, two-thirds of outcomes were correctly classified as either
treatment successes or failures. SADQ-C score was not a significant predictor of
treatment outcome.
Conclusions The ICS predicts outcome of moderation-oriented treatment among
moderately-dependent problem drinkers recruited mainly via newspaper
advertisements. The ICS should replace the SADQ as the basis for advice to clients in
this population of problem drinkers regarding whether or not a moderation goal of
treatment should be pursued.
KEYWORDS: Alcohol problems/ Moderation-oriented treatment/ Controlled
drinking/ Treatment outcome/ Outcome predictors
4
In summarising “the great debate” on the possibility of controlled drinking following
alcohol dependence, Sobell and Sobell (1995) concluded that recoveries of
individuals who have been severely dependent predominantly involve abstinence,
while recoveries of those who have not been severely dependent predominantly
involve reduced drinking. These conclusions are reflected in treatment agency
policies in those countries in which the moderation goal has become an accepted part
of treatment provision for alcohol problems.
In an early survey of British treatment agencies, Robertson and Heather (1982) found
that the main criterion for determining to whom the offer of moderation training
should be made was severity of alcohol dependence. Roughly 10 years later,
Rosenberg and colleagues (1992) reported that those British treatment agencies
regarding moderation as an acceptable goal rated severity of dependence as the most
important factor in selecting this goal, followed by client attitudes and beliefs about
moderation and abstinence, drinking history, results of liver function tests and social
stability/ social relationships.
Among those treatment agencies in the USA surveyed by Rosenberg and Davis’
(1994) that found moderate drinking acceptable, “severity of physiological
dependence” was rated the most important factor in the selection of drinking goal,
followed by drinking history, psychological dependence, previous treatment, criminal
behaviour and liver function test results.
Differences between the USA and UK in the acceptability of the moderation goal
were discussed by Cox et al. (2004) in a study in which treatment providers in both

5
countries made treatment goal recommendations after reading hypothetical case-
histories. Overall, moderation was recommended more strongly for clients with
alcohol problems of lower higher ? Nick should nt this be lower? severity, male
clients and, unexpectedly, those with lower levels of social support.
Findings from these surveys concerned with criteria for selecting a moderation goal
were based on respondents’ clinical experience rather than research data. There is,
however, empirical evidence to support the use of severity of alcohol dependence for
this purpose. In a two-year follow-up of married male clients who had received
abstinence-oriented treatment or advice, Orford, Oppenheimer and Edwards (1976)
found that successful controlled drinkers had reported fewer dependence symptoms at
intake than clients who had become successful abstainers and were more likely to
have been diagnosed as “alpha alcoholics” rather than as “gamma alcoholics”. In a
10-12 year follow-up of the same treatment cohort, Edwards et al. (1983) calculated
that 7 out of 8 clients who had achieved “social drinking” showed a maximum degree
of dependence ever experienced of less than 30 on the Severity of Alcohol
Dependence Questionnaire (SADQ: Stockwell et al., 1979).
Stockwell, Murphy and Hodgson (1983) state that the clinical value of the SADQ
includes its use in deciding the recommended drinking goal of treatment. A score of
31 or higher on the 20-item SADQ correlated with a clinician’s rating of severe
dependence while a score of 30 or less correlated with rating of mild to moderate
dependence. Ratings of degree of dependence have been shown to predict the
likelihood of a successful abstinence or moderation outcome (Polich, Armor &
Braiker, 1980), although other variables were also important. In a sample of Irish
6
problem drinkers, Meehan, Webb and Unwin (1985) confirmed the use of a cut-point
of 31+ to distinguish severe from mild-moderate dependence, as validated against a
clinician’s rating of severity of dependence.
With regard to moderation-oriented treatment, two of the studies described by Miller
and his colleagues (Miller & Joyce, 1979; Miller and Baca, 1983) found that lower
severity of dependence at intake was predictive of a successful outcome. In a longer-
term follow-up of clients who had received moderation-oriented treatment, Miller et
al. (1992) found that both abstainers and treatment failures had been more impaired at
intake than moderate drinkers and those drinkers who showed improvement in alcohol
problems at follow-up.
The data reported in the present article come from two similar studies from the United
Kingdom (Heather et al., 2000) and from Australia (Dawe et al., 2002) designed
primarily as tests of a new treatment modality called Moderation-oriented Cue
Exposure (MOCE). The main hypothesis tested was that MOCE would be superior in
effectiveness to the conventional method of training problem drinkers to moderate
their consumption known as Behavioural Self-control Training (BSCT: Hester &
Miller, 1989). This hypothesis was not supported in either study. In addition, in the
study by Heather et al. (2000), an interaction between treatment modality and level of
dependence was hypothesised such that MOCE was predicted to be relatively more
effective than BSCT at higher levels of dependence, using the conventional cut-point
for this purpose of SADQ >= 31. This hypothesis again was not supported but it was
noted that, irrespective of type of treatment received, a subsample of clients above the
SADQ cut-point at baseline showed outcomes as favourable as those initially below,

7
suggesting that this cut-point may not be the most valid indicator of the advisability of
moderation training.
As well as the SADQ, both studies above included the Impaired Control Scale (ICS:
Heather et al., 1993), a measure of the degree of impaired control over drinking self-
reported by a client. This instrument showed good evidence of reliability and validity
in the study in which it was developed in Australia (Heather et al., 1993), was
subsequently cross-validated in an English sample of treatment attenders (Heather,
Booth & Luce, 1998) and was demonstrated to have significant relationships with
treatment outcome (Heather et al., 1998). Good factor structure, reliability and
validity of the ICS were independently confirmed by Marsh et al. (2002). Although
clearly related to a general factor of alcohol dependence, impaired control as
measured by the ICS can be seen as empirically distinct from it (see Heather et al.,
1993, p. 707).
The aim of the analysis reported here was to examine the ability of the ICS to predict
outcome of moderation-oriented treatment for alcohol problems and to compare this
predictive ability directly with that of a widely used measure of alcohol dependence,
the SADQ.
Method
Participants
Participants in the present study had taken part in two similar randomised controlled
trials of MOCE, one in the UK (Heather et al., 2000) and the other in Australia (Dawe
et al., 2001). The effectiveness of MOCE was compared with that of BSCT at follow-
up approximately 6 months after the termination of treatment in the UK and 8 months
Formatted

8
in Australia. In the UK trial, 39 clients in the MOCE group and 37 in the BSCT group
were successfully followed up and could be allocated to an outcome category in the
classification system developed by Heather and Tebbutt (1989). Applying the same
criteria to the Australian subsample, there were 41 clients in the MOCE group and 37
in the BSCT group. This provided a combined sample of 154 cases for the present
analysis.
Recruitment of clients to the UK project was roughly evenly divided between formal
referral sources (mainly general medical practitioners) and self-referral via newspaper
advertisements, while recruitment in the Australian project was confined to persons
responding to announcements in the local media. Inclusion criteria for the two
projects were similar and both required a stated preference for a goal of moderate
drinking over total abstinence. However, in the Australian project a score of 15 or
above on the Severity of Alcohol Dependence Questionnaire, Form-C (Stockwell et
al., 1994) was required, whereas no such stipulation was made in the UK study.
Exclusion criteria (under 18 years of age; current psychotic disorder; medical
condition precluding continued consumption of alcohol; pregnancy; medications
contra-indicating alcohol consumption) were similar.
Treatments
A detailed description of MOCE principles, methods and procedures is contained in a
Therapists’ Manual (Heather & Wales, unpublished) available from the first author on
request and a shorter description is given by Dawe et al. (2002). BSCT was based on
the methods described by Hester and Miller (1989). The mean number of treatment
sessions attended was 7.1 (sd=4.0) for the UK study and 5.4 (sd=3.2) for the
Formatted

9
Australian study. There were no differences in attendance between treatment groups
at either site. In the UK study, the mean number of treatment sessions attended in the
full sample was 7.1 (sd=4.0),
with means of 7.7 (sd=4.4) in the MOCE group and 6.6 (sd=3.5) in the BSCT group.
In the Australian study SHARON FILL IN HERE PLEASE.
In the UK study, both tTherapists in the UK study were two experienced male
clinicians, with training in either clinical psychology or psychiatric nursing.
Allocation of therapists to treatments was counter-balanced. In the Australian study,
therapy was delivered by a clinical psychologist (SD) and two other psychologists
registered in the state of New South Wales. Training and ongoing clinical supervision
was provided by the authors for all other therapistsone a clinical psychologist and the
other a psychiatric nurse, who received extensive training and supervision in the
delivery of both MOCE and BSCT.. In both trials, daily and weekly limits on drinking
were individually negotiated between therapist and client but typically were in
accordance with levels for low-risk drinking recommended by medical authorities in
each country. YES SHARON, WAS THIS TRUE IN THE AUSTRALIAN
STUDY? For the purposes of the present analysis, “moderate” or “non-problem”
drinking was defined as drinking during the follow-up period but without self-
reported problems.
Measures
In addition to the usual socio-demographic information and drinking history, the
following measures were taken in both studies:
Formatted

10
a) Form 90 (Miller & del Boca, 1994) to provide a detailed record of alcohol
consumption over the past 90 days at baseline and follow-up. In the UK study
this was shortened to Form 60 to provide a record of drinking over the past 60
days but the same outcome measures (see below) were derived as in the
Australian study. Form 90 or 60 was given at both baseline and follow-up.
b) Severity of Alcohol Dependence Questionnaire- Community Version (SADQ-
C; Stockwell et al., 1994) – a revised version of the original SADQ more
suitable for clients with relatively mild dependence. This was given at
baseline.
c) Alcohol Problems Questionnaire (APQ; Williams & Drummond, 1994) – a
measure of alcohol-related problems, as distinct from signs of alcohol
dependence, over the past 6 months. Only the 23 core items of the APQ are
used in this analysis. The APQ was given at baseline and follow-up.
d) Impaired Control Scale (ICS; Heather et al., 1993). This consists of 3 parts
measuring the degree to which the client has attempted to control drinking
over the past 6 months (Part 1), the frequency with which (s)he has succeeded
or failed in controlling drinking over the past 6 months (Part 2), and the degree
to which (s)he believed that (s)he would be able to control drinking if it were
attempted now. The instrument was scored by the “substitution method” (see
Heather et al., 1998), whereby items in Part 2 that the client had endorsed
“Does not apply” were replaced by scores on the corresponding items in Part
3. This method was found by Heather et al. (1998) to result in improved
indices of concurrent and predictive validity. The ICS was given at baseline.

11
The main outcome measures used in both trials of MOCE were Drinks per Drinking
Day (DDD) and Percentage Days Abstinent (PDA) (Project MATCH Research
Group, 1997). For the purposes of the present analysis, however, and in the interests
of relevance to clinical practice, outcome is described by a classification scheme
developed by Heather and Tebbutt (1989) that focuses primarily on changes in the
extent of alcohol-related problems from baseline to follow-up. The categories making
up this scheme are: Abstinent - no alcohol consumption during the assessment
window (i.e., 60 or 90 days); Non-problem Drinking – drinking within the window
but with a score of zero on the APQ; Much Improved – drinking together with a
positive APQ score but with a reduction on the APQ from baseline to follow-up of at
least two-thirds; Somewhat Improved – reduction in APQ score of one third or more
but less than two-thirds; Unimproved – reduction in APQ score of less than one third
or no change/ increase in APQ score at follow-up.
Statistical analysis
Standard units of alcohol recorded in the Australian study (unit = 10g ethanol) were
first converted to UK standard units (= 8g) (Miller, Heather & Hall, 1991). The
method used to test the ability of independent variables to predict treatment outcome
was logistic regression analysis (LRA; SPSS Version 11.0 for Windows) using
dichotomous classifications of outcome as dependent variables (see below).
Controlling for the effects of a possible confounding variable, level of impaired
control as measured by the Impaired Control Scale and level of alcohol dependence
as measured by the Severity of Alcohol Dependence Questionnaire were entered into
the regression model in order to simulate the task of a clinician who wished to know
Formatted
12
which of these instruments could best predict outcome of treatment and therefore
form the basis for advice to the client regarding appropriateness of a moderation goal.
Results
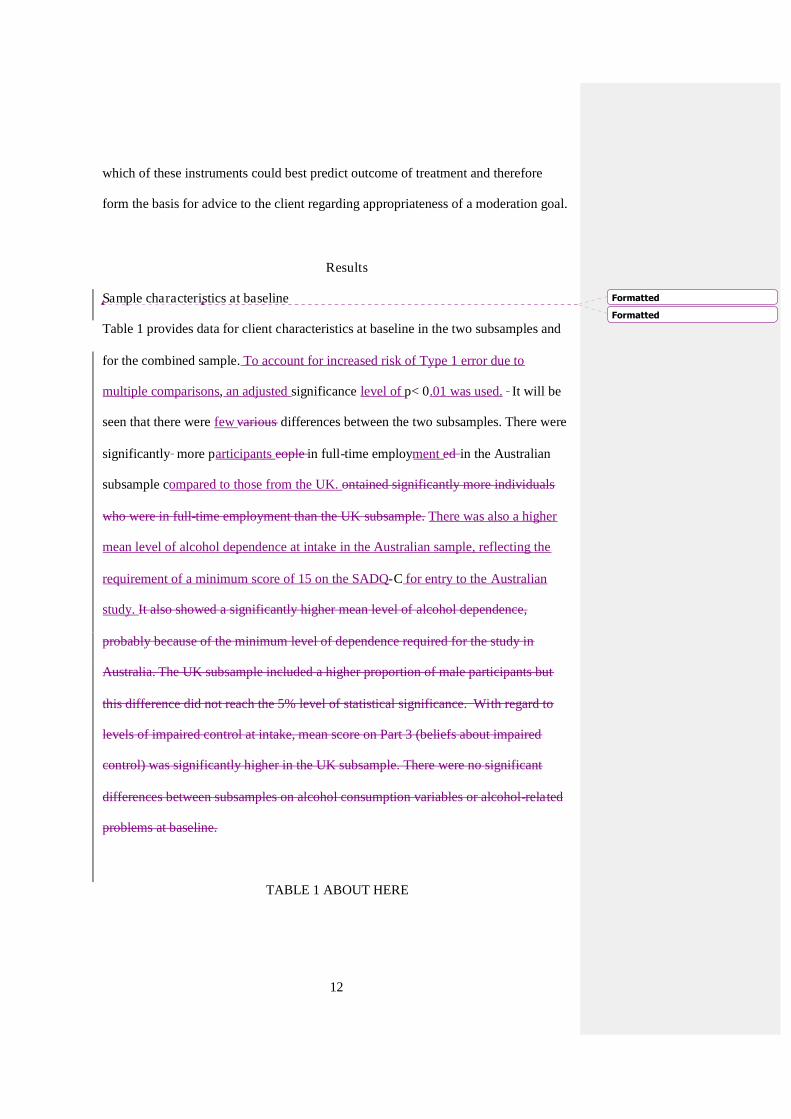
Sample characteristics at baseline
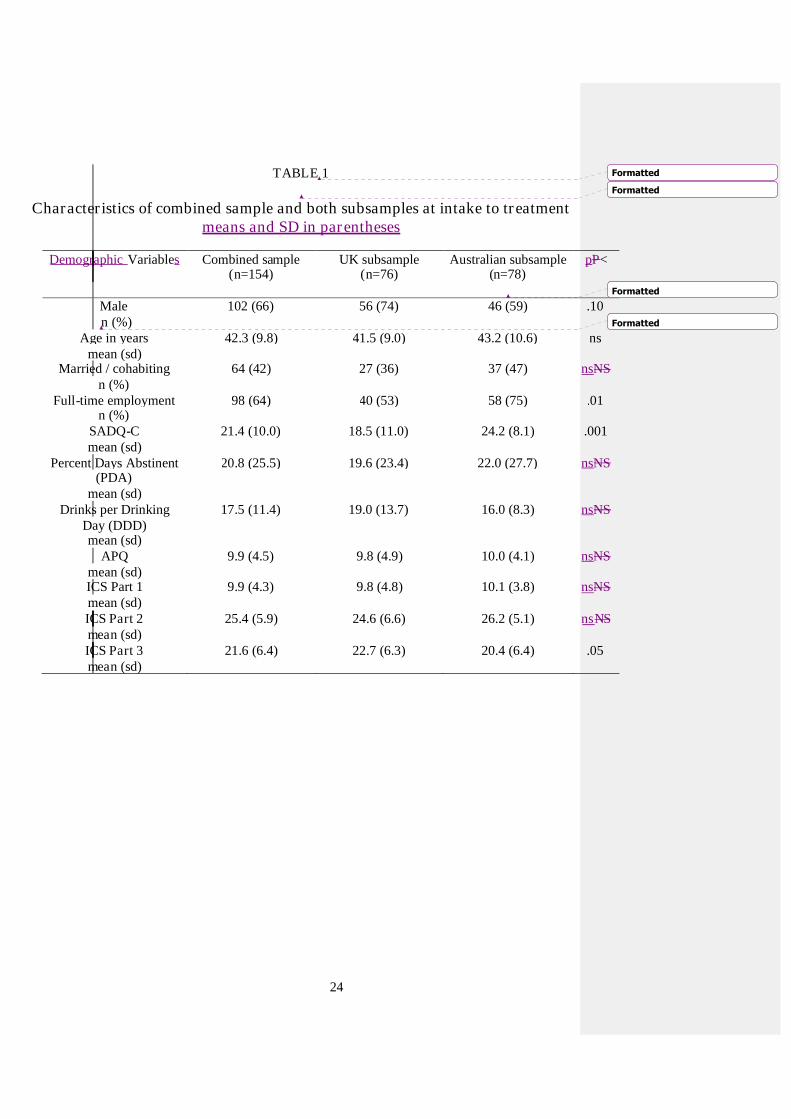
Table 1 provides data for client characteristics at baseline in the two subsamples and
for the combined sample. To account for increased risk of Type 1 error due to
multiple comparisons, an adjusted significance level of p< 0.01 was used. It will be
seen that there were few various differences between the two subsamples. There were
significantly more participants eople in full-time employment ed in the Australian
subsample compared to those from the UK. ontained significantly more individuals
who were in full-time employment than the UK subsample. There was also a higher
mean level of alcohol dependence at intake in the Australian sample, reflecting the
requirement of a minimum score of 15 on the SADQ-C for entry to the Australian
study. It also showed a significantly higher mean level of alcohol dependence,
probably because of the minimum level of dependence required for the study in
Australia. The UK subsample included a higher proportion of male participants but
this difference did not reach the 5% level of statistical significance. With regard to
levels of impaired control at intake, mean score on Part 3 (beliefs about impaired
control) was significantly higher in the UK subsample. There were no significant
differences between subsamples on alcohol consumption variables or alcohol-related
problems at baseline.
TABLE 1 ABOUT HERE
Formatted
Formatted
13
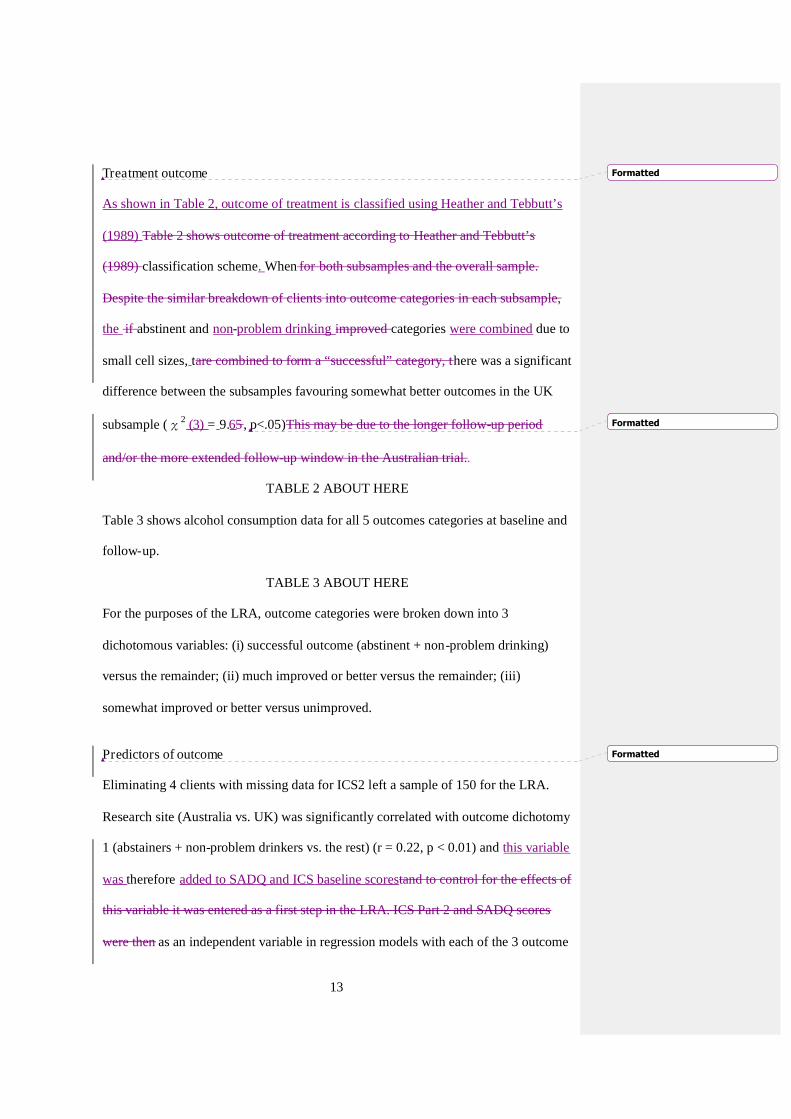
Treatment outcome
As shown in Table 2, outcome of treatment is classified using Heather and Tebbutt’s
(1989) Table 2 shows outcome of treatment according to Heather and Tebbutt’s
(1989) classification scheme. When for both subsamples and the overall sample.
Despite the similar breakdown of clients into outcome categories in each subsample,
the if abstinent and non-problem drinking improved categories were combined due to
small cell sizes, tare combined to form a “successful” category, there was a significant
difference between the subsamples favouring somewhat better outcomes in the UK
subsample (χ2 (3) = 9.65, p<.05)This may be due to the longer follow-up period
and/or the more extended follow-up window in the Australian trial..
TABLE 2 ABOUT HERE
Table 3 shows alcohol consumption data for all 5 outcomes categories at baseline and
follow-up.
TABLE 3 ABOUT HERE
For the purposes of the LRA, outcome categories were broken down into 3
dichotomous variables: (i) successful outcome (abstinent + non-problem drinking)
versus the remainder; (ii) much improved or better versus the remainder; (iii)
somewhat improved or better versus unimproved.
Predictors of outcome
Eliminating 4 clients with missing data for ICS2 left a sample of 150 for the LRA.
Research site (Australia vs. UK) was significantly correlated with outcome dichotomy
1 (abstainers + non-problem drinkers vs. the rest) (r = 0.22, p < 0.01) and this variable
was therefore added to SADQ and ICS baseline scorestand to control for the effects of
this variable it was entered as a first step in the LRA. ICS Part 2 and SADQ scores
were then as an independent variable in regression models with each of the 3 outcome
Formatted
Formatted
Formatted
14
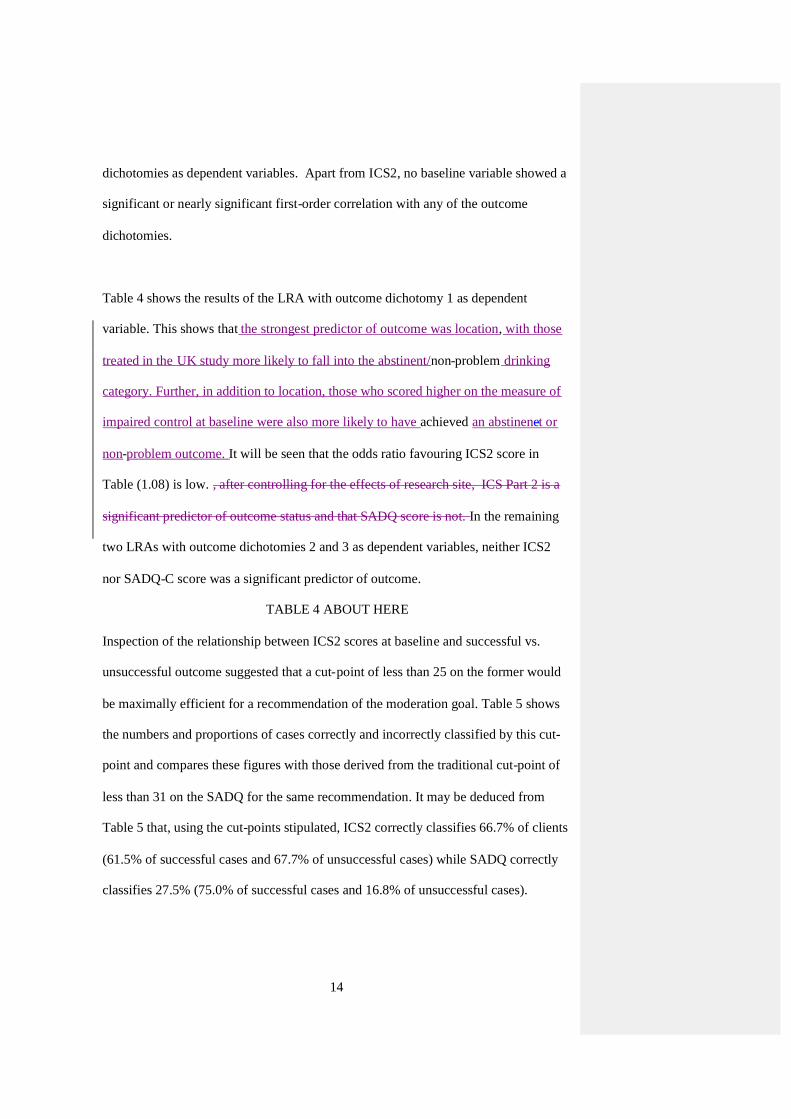
dichotomies as dependent variables. Apart from ICS2, no baseline variable showed a
significant or nearly significant first-order correlation with any of the outcome
dichotomies.
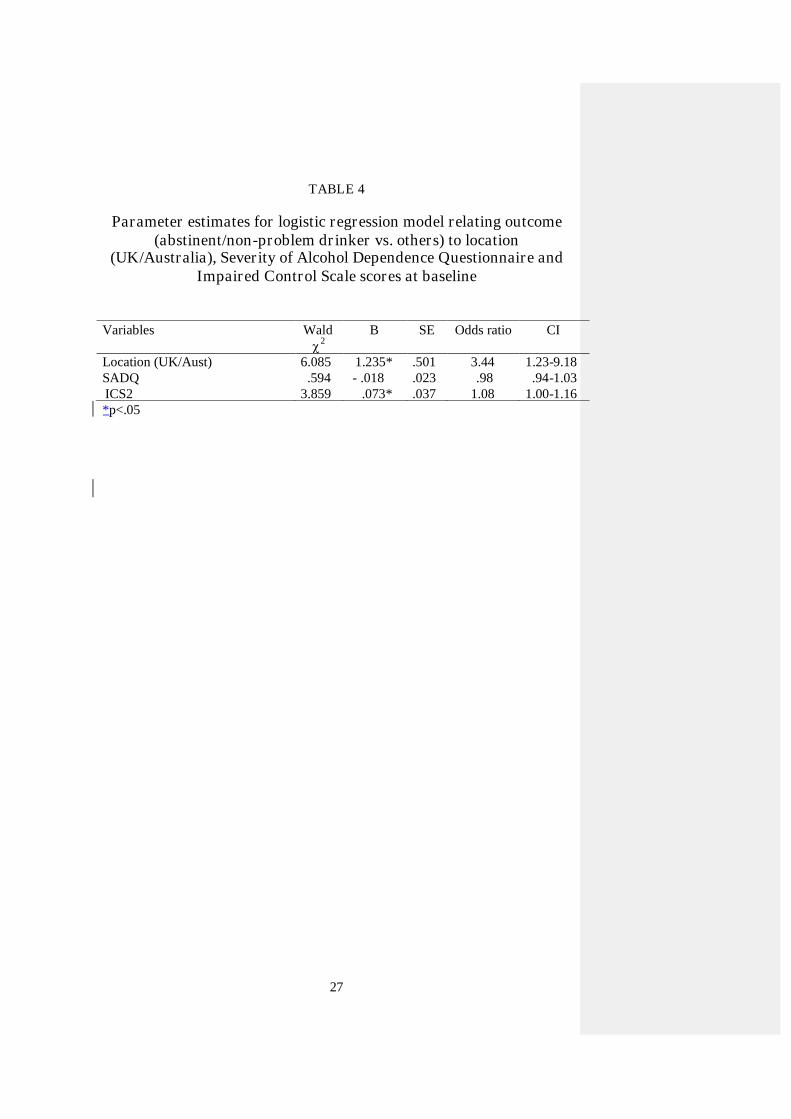
Table 4 shows the results of the LRA with outcome dichotomy 1 as dependent
variable. This shows that the strongest predictor of outcome was location, with those
treated in the UK study more likely to fall into the abstinent/non-problem drinking
category. Further, in addition to location, those who scored higher on the measure of
impaired control at baseline were also more likely to have achieved an abstinenet or
non-problem outcome. It will be seen that the odds ratio favouring ICS2 score in
Table (1.08) is low. , after controlling for the effects of research site, ICS Part 2 is a
significant predictor of outcome status and that SADQ score is not. In the remaining
two LRAs with outcome dichotomies 2 and 3 as dependent variables, neither ICS2
nor SADQ-C score was a significant predictor of outcome.
TABLE 4 ABOUT HERE
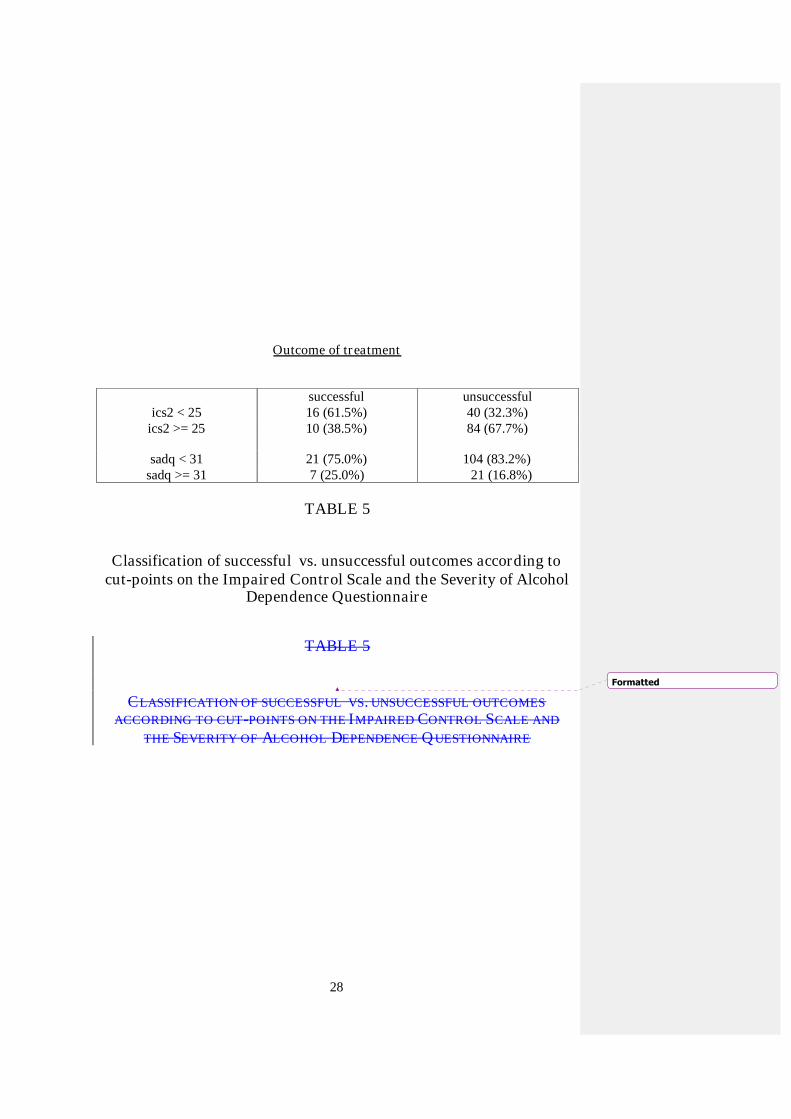
Inspection of the relationship between ICS2 scores at baseline and successful vs.
unsuccessful outcome suggested that a cut-point of less than 25 on the former would
be maximally efficient for a recommendation of the moderation goal. Table 5 shows
the numbers and proportions of cases correctly and incorrectly classified by this cut-
point and compares these figures with those derived from the traditional cut-point of
less than 31 on the SADQ for the same recommendation. It may be deduced from
Table 5 that, using the cut-points stipulated, ICS2 correctly classifies 66.7% of clients
(61.5% of successful cases and 67.7% of unsuccessful cases) while SADQ correctly
classifies 27.5% (75.0% of successful cases and 16.8% of unsuccessful cases).
15
Lowering the cut-point for the SADQ did not substantially improve the classification
of outcomes.
TABLE 5 ABOUT HERE
Discussion
The main finding from this analysis is that a client’s score on Part 2 of the Impaired
Control Scale, using the substitution method of calculation, is a significant predictor
of successful outcome of moderation-oriented treatment for alcohol problems. Given
that a score on the Severity of Alcohol Dependence Questionnaire was not a
significant predictor, it follows that the ICS should replace the SADQ as the chief
instrument of choice among the population of problem drinkers sampled here for
predicting whether or not moderate drinking is likely to be successfully achieved.
More specifically, clients with ICS2 scores of less than 25 should normally be advised
to try to moderate their drinking. Since the only alternative to moderation is to aim for
total abstinence, those with scores of 25 or above on ICS2 should normally be advised
to abstain.
This should not be interpreted to mean, however, that clients with scores of 25 or
above on the ICS will necessarily be able to achieve successful abstinence; the results
of this analysis have no bearing on the prediction of outcome from abstinence-
oriented treatment. In another study, Heather, Booth and Luce (1998) reported that
ICS2 score was able to predict successful outcome among clients aiming at a goal of
total abstinence, suggesting that higher scores on the ICS are associated with poorer
outcomes from both abstinence-oriented and moderation-oriented treatment.
Nevertheless, a conservative clinical policy would be to recommend abstinence to
clients showing higher levels of impaired control at intake.
16
It might be queried why, in an analysis of predictors of moderation-oriented
treatment, 8 abstainers were included in the successful outcome category (see Table
2). The phenomenon of sustained abstinence following moderation-oriented treatment
has been noted previously in the literature (Rychtarik et al., 1987; Miller et al., 1992).
On the other hand, most of the evidence for the existence of “controlled drinking”
outcomes in the earlier literature came from studies of abstinence-oriented treatment
(Heather & Robertson, 1981). Sobell and Sobell (1995) concluded that, “The
association of outcome type and dependence severity appears to be independent of
advice provided in treatment” (p.1149). While this may be to overstate the case, it is
clear that clients frequently achieve an outcome differing from the goal of the
treatment they received and this should no longer cause surprise. It is difficult to
determine whether in the present case elements of moderation-oriented treatment were
beneficial to clients in the attainment of abstinence but this is a possibility. In any
event, it seems illogical to exclude clients from the successful outcome category
merely because their successful outcome at follow-up differs from the goal originally
pursued in treatment.
The strongest predictor of outcome from the LRA was research site location, with
clients in the UK study doing slightly but significantly better than those in the
Australian study. There are several possible reason for this difference: (i) the longer
follow-up period in the Australian study; (ii) the longer window for recording alcohol
consumption at follow-up in the Australian study; (iii) the higher number of treatment
sessions attended in the UK study; (iv) although not significantly related to treatment
outcome in this analysis, the higher mean level of dependence in the Australian sub-

17
sample. A combination of some or all these factors may have contributed to the effect
observed.
It was noted that SADQ-C score was not a significant predictor of treatment outcome
in this analysis. It does not follow from this, however, that the more general concept
of alcohol dependence is irrelevant to treatment outcome or to the allocation of
drinking goals. The notion of “loss of control” or, more recently, “impaired control”
has always been a prominent aspect of conceptualisations of dependence (see Heather,
1991); the alcohol dependence syndrome was defined by Edwards et al. (1977) as “a
disability marked by impaired capacity to control alcohol intake” (p.17). However, in
the original development of the SADQ by Stockwell et al. (1979), it was decided for
technical reasons not to attempt to measure impaired control and this was maintained
in the later version of the SADQ (as opposed to the Impaired Control Questionnaire –
see Stockwell et al., 1994) used here. Thus the conclusion from this analysis might be
that moderation-oriented treatment outcome is predicted by impaired control as
measured by the ICS but not by other aspects of dependence as measured by the
SADQ (i.e., tolerance, withdrawal, relief drinking, reinstatement of dependence).
It is interesting that impaired control was able to predict the dichotomy between
successful outcome, comprised of abstinence and non-problem drinking, and the
remainder of the follow-up sample but not the two dichotomies in which degrees of
improvement (much improved or somewhat improved) were considered to be
favourable outcomes. This is similar to an earlier finding reported by Heather et al.
(1998). It suggests that level of impaired control before treatment is mainly relevant to
whether or not a first episode of heavy drinking occurs in the follow-up period and
18
not to events thereafter possibly involving reinstatement of dependence or the “rule
violation effect” (Parks, Anderson & Marlatt, 2001).
It was noted above that the prediction of successful outcome by ICS2 score gave an
odds ratio of only 1.08. Thus, a cut-point of 25 on the ICS was able to classify only
two-thirds of the follow-up sample as either success or failures. This suggests that
other variables in addition to level of impaired control should be taken into account in
the allocation of drinking goals in treatment. One prominent class of such variables
concerns the client’s beliefs about the nature of one’s alcohol problem (Orford &
Keddie, 1986) and, for example, whether maxims such as “one drink – one drunk”
are believed to be true (Heather, Winton & Rollnick, 1982). In addition to
circumstances where any form of continued drinking is clearly contra-indicated, the
existence of prior periods of sustained moderation or abstinence, degree of social
stability, marital status and a range of other variables may also be relevant (see
Heather & Robertson, 1983; Rosenberg, 1993). Ultimately, drinking goal allocation is
a clinical decision depending on the unique combination of attributes and beliefs of
the individual client.
It can also be argued that allocation to abstinence or moderation goals should be
primarily a matter of the client’s own choice and there is substantial evidence that
many clients will choose the goal that best fits their circumstances (Pachman, Foy &
van Erd, , 1978; Booth et al., 1984, 1992; Hodgins et al. 1997; Adamson & Sellman,
2001). In other cases, however, the client will be uncertain about the choice of
drinking goal and wish the therapist to offer advice or will choose a goal the therapist
19
considers unwise. In these cases, a score on the Impaired Control Scale may assist the
therapist in offering advice in the client’s best interests.
With regard to the generalisability of these findings, they strictly apply to the
population of problem drinkers with a mean level of dependence in the mild to
moderate range, who wish to aim for moderation as a solution to their alcohol
problem and who are mainly recruited via newspaper advertisements and other media.
It is possible that, for unknown reasons, level of impaired control may not be
predictive of outcome among the corresponding population of problem drinkers
seeking treatment at specialist alcohol agencies. It is possible too that the predictive
ability of the ICS applies only in the UK, Australia and countries with a similar
cultural background. Future research should investigate the predictive ability of the
ICS in samples of problem drinkers suitable for a moderation goal and seeking
treatment from specialist agencies and in other countries.
Acknowledgements
The authors wish to thank Jennifer Brodie for collecting data used in this analysis and
Vaughn Rees, Simon Wale and Gerard Wilkinson for carrying out the treatments. We
are also grateful to all the clients who agreed to take part in this study. The research
on which the analysis was based was funded in the UK by the Alcohol Education and
Research Council and in Australia by the Department of Health, Housing, Local
Government and Community Services. It was carried out at the Newcastle & North
Tyneside Regional Drug & Alcohol Service, Newcastle upon Tyne and at the
National Drug & Alcohol Research Centre, University of New South Wales.

20
References
Adamson, S.J. & Sellman, J.D. (2001) Drinking goal selection and treatment outcomein out-patients with mild-moderate alcohol dependence. Drug & AlcoholReview, 20, 351-359.
Booth, P.G., Dale, B. & Ansari, J. (1984) Problem drinkers’ goal choice and treatmentoutcome: a preliminary study. Addictive Behavior, 9, 357-364.
Booth, P.G. , Dale, B., Slade, P.D. & Dewey, M.E. (1992). A follow-up study ofproblem drinkers offered a goal choice option. Journal of Studies on Alcohol,53, 594-600.
Cox, W. M., Rosenberg H., Hodgins, C. H. A., Macartney, J. I. & Maurer, K. A.(2004) United Kingdom and United States healthcare providers'recommendations of abstinence versus controlled drinking, Alcohol &Alcoholism, 39, 130-134.
Dawe, S., Rees, V.W., Sitharthan, T., Mattick, R.P. & Heather, N. (2002) Efficacy ofmoderation-oriented cue exposure for problem drinkers: a randomisedcontrolled trial. Journal of Consulting & Clinical Psychology, 70, 1045-1050.
Edwards, G., Duckitt, A., Oppenheimer, E., Sheehan, M. & Taylor, C. (1983) Whathappens to alcoholics? Lancet, 2, 269-271.
Edwards, G., Gross, M.M., Keller, M., Moser, J. & Room, R. (Eds.) (1977) Alcohol-Related Disabilities. WHO Offset Publication No. 32. Geneva, World HealthOrganization.
Heather, N. (1991) Impaired control over alcohol consumption. In Heather, N, Miller,W.R. & Greeley, J. (Eds.) Self-Control and the Addictive Behaviours (153-179). Sydney: Maxwell Macmillan Publishing Australia.
Heather, N. & Robertson, I. (1983) Controlled Drinking (revised edition). London:Methuen.
Heather, N. & Tebbutt, J. (1989) Definitions of nonabstinent and abstinent categoriesin alcoholism treatment outcome classifications. Drug & Alcohol Dependence,24, 83-93.
Heather, N., Booth, P. & Luce, A. (1998) Impaired Control Scale: cross-validationand relationships with treatment outcome. Addiction, 93, 761-771.
Heather, N., Brodie, J., Wale, S., Wilkinson, G., Luce, A Webb, E. & McCarthy, S(2000) A randomized controlled trial of Moderation-oriented Cue Exposure.Journal of Studies on Alcohol, 61, 561-570.

21
Heather, N., Tebbutt, J.S., Mattick, R.P. & Zamir, R. (1993) Development of a scalefor measuring impaired control over alcohol consumption: a preliminaryreport. Journal of Studies on Alcohol, 54, 700-709.
Heather, N., Winton, M. & Rollnick, S. (1982) An empirical test of “a culturaldelusion of alcoholics.” Psychological Reports, 50, 379-382.
Hester, R.K. & Miller, W.R. (1989) Self-control training. In Hester, R.K. & Miller,W.R. (Eds.) Handbook of Alcoholism Treatment Approaches: EffectiveAlternatives (pp. 141-149). New York NY: Pergamon.
Hodgins, D.C., Leigh, G., Milne, R. & Gerrish, R. (1997). Drinking goal selection inbehavioural self-management treatment of chronic alcoholics. AddictiveBehavior, 247-255.
Marsh, A., Smith, L., Saunders, B. & Piek, J. (2002) The Impaired Control Scale:confirmation of factor structure and psychometric properties for socialdrinkers and drinkers in alcohol treatment. Addiction, 97, 1339-1346.
Meehan, J., Webb, M. & Unwin, A. (1985) The Severity of Alcohol DependenceQuestionnaire in a sample of Irish problem drinkers. British Journal ofAddiction, 80, 57-83.
Miller, W.R. & Baca, L.M. (1983) Two-year follow-up of bibliotherapy and therapist-directed controlled drinking training for problem drinkers. Behavior Therapy,14, 441-448.
Miller, W.R. & del Boca, F.K. (1994) Measurement of drinking behaviour using theForm 90 family of instruments. Journal of Studies on Alcohol, Suppl. 12, 112-118.
Miller, W.R. & Joyce, M.A. (1979) Predictors of abstinence, controlled drinking andheavy drinking outcomes following self-control training. Journal ofConsulting & Clinical Psychology, 47, 773-775.
Miller, W.R., Heather, N. & Hall, W. (1991) Calculating standard drink units:international comparisons. British Journal of Addiction, 86, 43-47.
Miller, W.R., Leckman, A.L., Delaney, H.D. & Tinkcom, M. (1992) Long-termfollow-up of behavioural self-control training. Journal of Studies on Alcohol,53, 249-261.
Orford, J. & Keddie, A. (1986). Abstinence or controlled drinking in clinical practice:a test of the dependence and persuasion hypotheses. British Journal ofAddiction, 81, 495-504.
22
Orford, J., Oppenheimer, E. & Edwards, G. (1976) Abstinence or control: theoutcome for excessive drinkers two years after consultation. BehaviourResearch & Therapy, 14, 409-418.
Pachman, J.S., Foy, D.W., van Erd, M. (1978) Goal choice of alcoholics: acomparison of those who choose total abstinence vs. those who chooseresponsible, controlled drinking. Journal of Clinical Psychology, 34, 781-783.
Parks, G.A., Anderson, B.K. & Marlatt, G.A. (2001) Relapse prevention therapy. InHeather, N., Peters, T.J. & Stockwell, T. (Eds.), International Handbook ofAlcohol Dependence and Problems (pp. 575-592). Chichester: John Wiley &Sons.
Polich, J.M., Armor, D.J. & Braiker, H.B. (1980) The Course of Alcoholism: FourYears After Treatment (Santa Monica, Rand Corporation).
Project MATCH Research Group. (1997) Matching alcoholism treatments to clientheterogeneity: Project MATCH posttreatment drinking outcomes. Journal ofStudies on Alcohol, 58, 7-29.
Robertson, I.H. & Heather, N. (1982) A survey of controlled drinking treatment inBritain. British Journal on Alcohol & Alcoholism, 17, 102-105.
Rosenberg, H. (1993) Prediction of controlled drinking by alcoholics and problemdrinkers. Psychological Bulletin, 113, 129-139.
Rosenberg, H. & Davis, L. A. (1994) Acceptance of moderate drinking by alcoholtreatment services in the United States. Journal of Studies on Alcohol, 55, 167-172.
Rosenberg, H., Melville, J., Levell, D. & Hodge, J.E. (1992) A 10-year follow-upsurvey of acceptability of controlled drinking in Britain. Journal of Studies onAlcohol, 53, 441-446.
Rychtarik, R.G., Foy, D.W., Scott, T., Lokey, L. & Prue, D.M. (1987) Five-six-yearfollow-up of broad-spectrum behavioural treatment for alcoholism: effects oftraining controlled drinking skills. Journal of Consulting & ClinicalPsychology, 52, 1106-108.
Sobell, M. B. & Sobell, L. L. (1995) Controlled drinking after 25 years: howimportant was the great debate? Addiction, 90, 1149-1153.
Stockwell, T.R., Hodgson, R.J., Edwards, G., Taylor, C. & Rankin, H. (1979) Thedevelopment of a questionnaire to measure severity of alcohol dependence.British Journal of Addiction, 74, 79-87.
Stockwell T., Murphy, D. & Hodgson, R. (1983) The Severity of AlcoholDependence Questionnaire: its use reliability and validity, British Journal ofAddiction, 78, 145-155.
23
Stockwell, T.R., Sitharthan, T., McGrath, D. & Lang, E. (1994) The measurement ofalcohol dependence and impaired control in community samples. Addiction,89, 167-174.
Williams, B.T.R. & Drummond, D.C. (1994) The Alcohol Problems Questionnaire:reliability and validity. Drug & Alcohol Dependence, 35, 239-243.
Formatted
24
TABLE 1
Characteristics of combined sample and both subsamples at intake to treatmentmeans and SD in parentheses
Demographic Variables Combined sample(n=154)
UK subsample(n=76)
Australian subsample(n=78)
pP<
Malen (%)
102 (66) 56 (74) 46 (59) .10
Age in yearsmean (sd)
42.3 (9.8) 41.5 (9.0) 43.2 (10.6) ns
Married / cohabitingn (%)
64 (42) 27 (36) 37 (47) nsNS
Full-time employmentn (%)
98 (64) 40 (53) 58 (75) .01
SADQ-Cmean (sd)
21.4 (10.0) 18.5 (11.0) 24.2 (8.1) .001
Percent Days Abstinent(PDA)
mean (sd)
20.8 (25.5) 19.6 (23.4) 22.0 (27.7) nsNS
Drinks per DrinkingDay (DDD)mean (sd)
17.5 (11.4) 19.0 (13.7) 16.0 (8.3) nsNS
APQmean (sd)
9.9 (4.5) 9.8 (4.9) 10.0 (4.1) nsNS
ICS Part 1mean (sd)
9.9 (4.3) 9.8 (4.8) 10.1 (3.8) nsNS
ICS Part 2mean (sd)
25.4 (5.9) 24.6 (6.6) 26.2 (5.1) nsNS
ICS Part 3mean (sd)
21.6 (6.4) 22.7 (6.3) 20.4 (6.4) .05
Formatted
Formatted
Formatted
Formatted

25
TABLE 2
Numbers and percentages in outcome categories in both subsamplesand the overall sample
Outcomecategory
Combinedsample(n=154)
UKsubsample
(n=76)
Australiansubsample
(n=78)Abstinent 8 (5.2) 6 (7.9) 2 (2.6)
Non-problemdrinking
20 (13.0) 15 (19.7) 5 (6.4)
Muchimproved
38 (24.7) 18 (23.7) 20 (25.6)
Somewhatimproved
36 (23.4) 14 (18.4) 22 (28.2)
Unimproved 52 (33.8) 23 (30.3) 29 (37.2)

26
TABLE 3
Means (standard deviations) of Percent Days Abstinent (PDA) andDrinks per Drinking Day (DDD) for 5 outcome categories at baseline
and follow-up
OUTCOMECATEGORY
BaselinePDA
Follow-upPDA
BaselineDDD
Follow-upDDD
Abstinent 36.9(33.2)
100.0(0.0)
15.7(8.4)
0.0(0.0)
Non-problemdrinking
28.3(24.7)
43.6(29.1)
17.1(12.8)
7.4(3.8)
Muchimproved
21.8(24.7)
32.7(25.9)
16.4(12.0)
8.4(7.0)
Somewhatimproved
18.6(27.1)
27.1(28.5)
19.2(10.6)
10.3(6.4)
Unimproved 16.0(23.4)
23.1(23.1)
17.5(11.4)
13.6(9.2)
27
TABLE 4
Parameter estimates for logistic regression model relating outcome(abstinent/non-problem drinker vs. others) to location
(UK/Australia), Severity of Alcohol Dependence Questionnaire andImpaired Control Scale scores at baseline
Variables Wald2
B SE Odds ratio CI
Location (UK/Aust) 6.085 1.235* .501 3.44 1.23-9.18SADQ .594 - .018 .023 .98 .94-1.03ICS2 3.859 .073* .037 1.08 1.00-1.16*p<.05
28
Outcome of treatment
successful unsuccessfulics2 < 25 16 (61.5%) 40 (32.3%)
ics2 >= 25 10 (38.5%) 84 (67.7%)
sadq < 31 21 (75.0%) 104 (83.2%)sadq >= 31 7 (25.0%) 21 (16.8%)
TABLE 5
Classification of successful vs. unsuccessful outcomes according tocut-points on the Impaired Control Scale and the Severity of Alcohol
Dependence Questionnaire
TABLE 5
CLASSIFICATION OF SUCCESSFUL VS. UNSUCCESSFUL OUTCOMESACCORDING TO CUT-POINTS ON THE IMPAIRED CONTROL SCALE AND
THE SEVERITY OF ALCOHOL DEPENDENCE QUESTIONNAIRE
Formatted