Embed Size (px)
Citation preview
Level of Detail:Choosing and Generating LODsDavid LuebkeUniversity of Virginia
Recap: Generating LODs
Simplification operator:– Cell collapse– Vertex removal– Edge collapse
Full edge collapse Half edge collapse Vertex-pair merge a.k.a. “virtual edge
collapse”
Generating LODs
Simplification algorithm– Outer optimization: where to simplify
No optimization Ex: uniform grid cells
Greedy optimization Ex: floating cell clustering Ex: sort edge collapses by error, resort on collapse
Lazy optimization Ex: sort edge collapses by error, dirty bit on
collapse
– Inner optimization: how to simplify Ex: placement of new vertex, retriangulation
Basic Greedy Edge Collapse Algorithm
Sort all edges (by some metric)
repeatCollapse edge
choose edge vertex (or compute optimal vertex)
Fix-up topology
until (no edges left)
Recap: Measuring Error
Most LOD algorithms measure error geometrically– What is the distance between the original and
simplified surface?– What is the volume between the surfaces?– Etc
Really this is just an approximation to the actual visual error, which includes:– Color, normal, & texture distortion– Importance of silhouettes, background
illumination, semantic importance, etc.
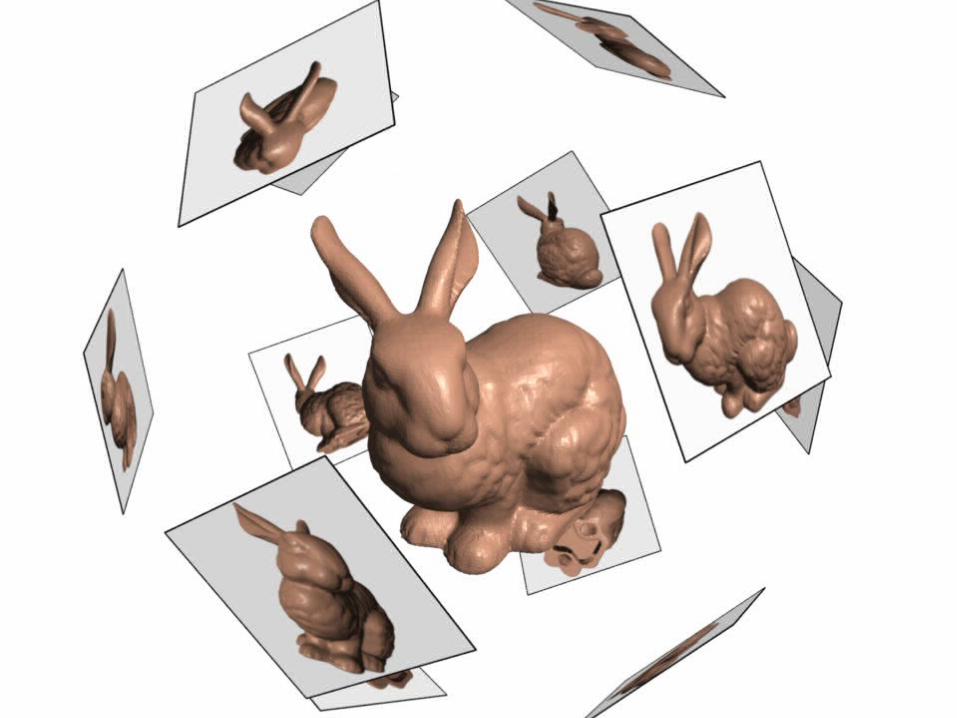
Measuring Visual Error
Measuring error– Image-based ideas
Lindstrom & Turk, SIGGRAPH 2000
– Perceptually-based ideas Luebke & Hallen, EGRW 2001 Williams, Luebke, Cohen, Kelley & Schubert,
I3D 2003
Perceptually Driven LOD
Idea: measure local simplification operations against a perceptual model to predict whether the user can could see the effect of simplification
Model: contrast sensitivity function
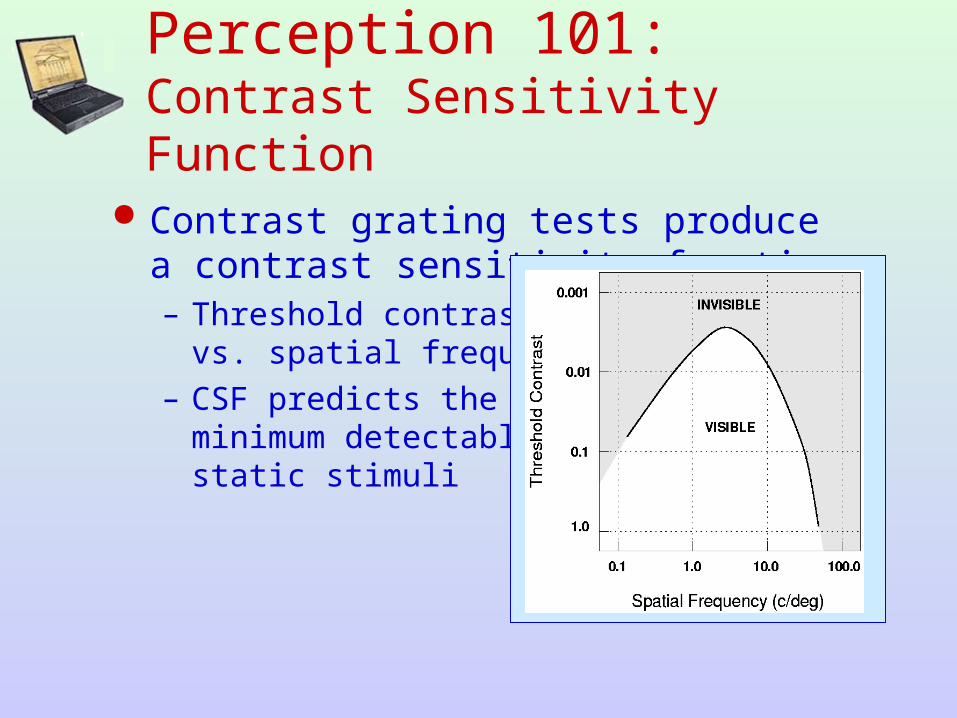
Perception 101: Contrast Sensitivity Function
Contrast grating tests produce a contrast sensitivity function– Threshold contrast
vs. spatial frequency– CSF predicts the
minimum detectablestatic stimuli
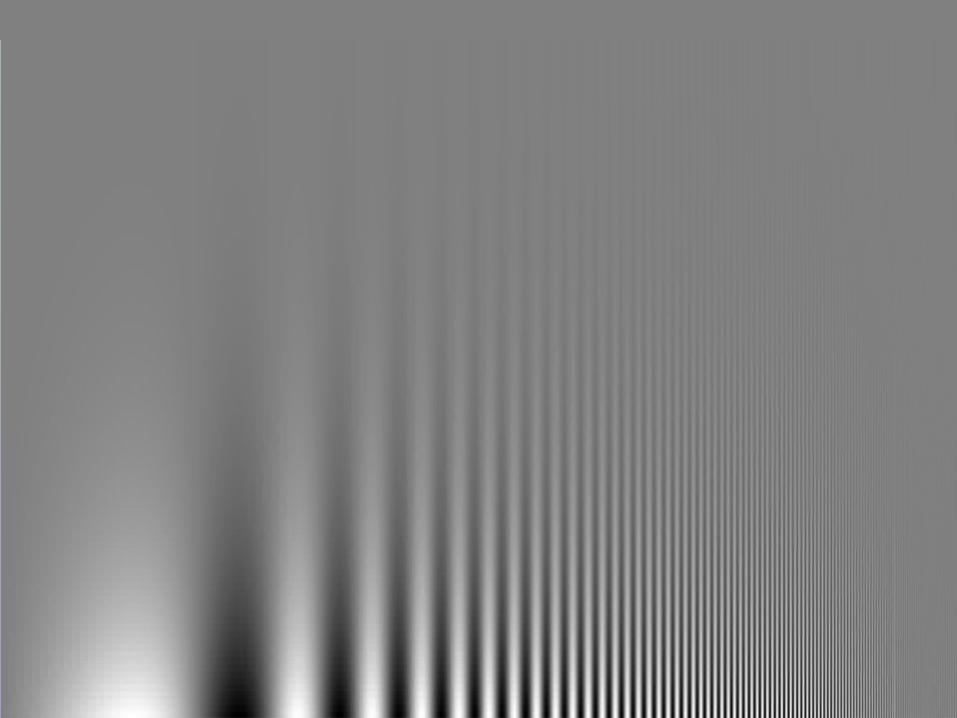
Campbell-Robson Chart by Izumi Ohzawa
Your Personal CSF
Perceptual Graphics:Where To Next?
Incorporate eccentricity, velocity (attention?)
Protect copyrighted media: imperceptible “watermarking” via mesh distortion
Interactive ray tracing…
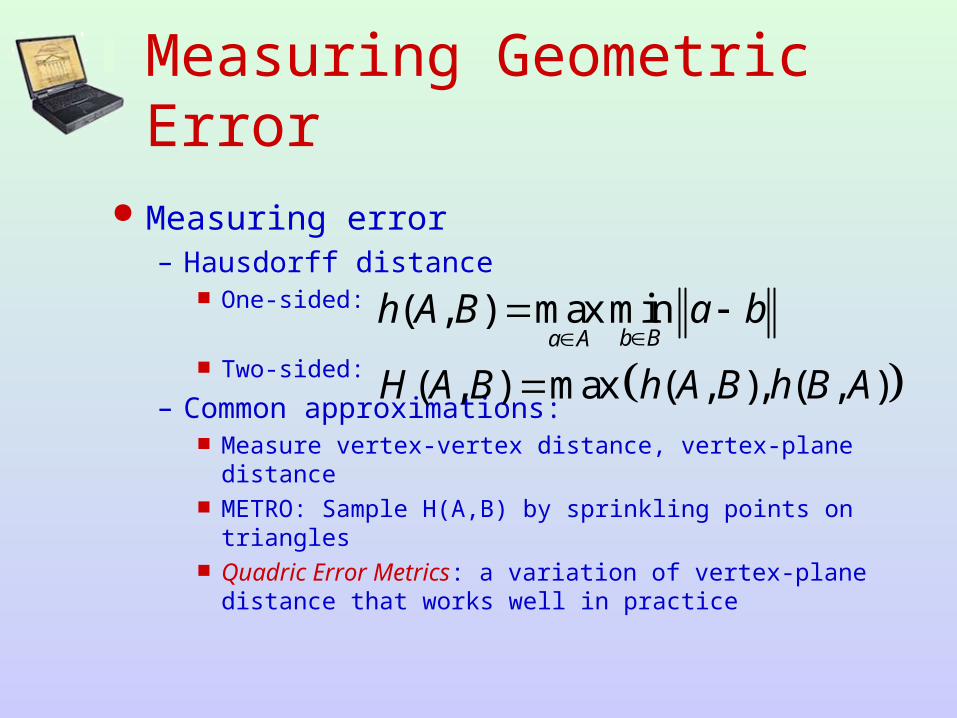
Measuring Geometric Error
Measuring error– Hausdorff distance
One-sided:
Two-sided:
– Common approximations: Measure vertex-vertex distance, vertex-plane
distance METRO: Sample H(A,B) by sprinkling points on
triangles Quadric Error Metrics: a variation of vertex-plane
distance that works well in practice
( , ) max minb Ba A
h A B a b
( , ) max ( , ), ( , )H A B h A B h B A
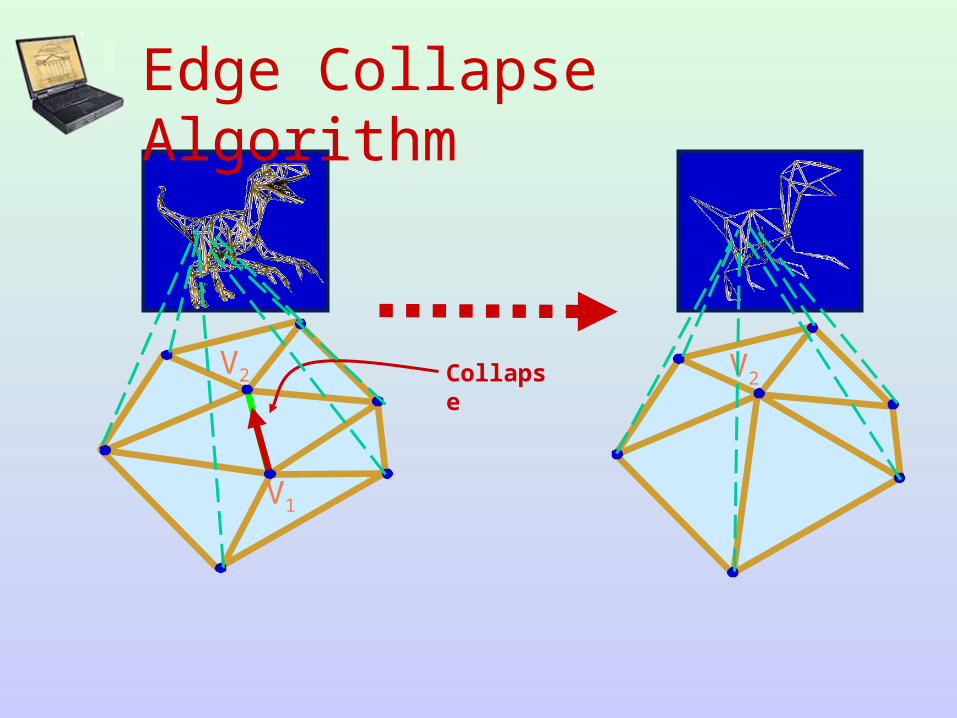
Edge Collapse Algorithm
V1
V2 V2Collapse
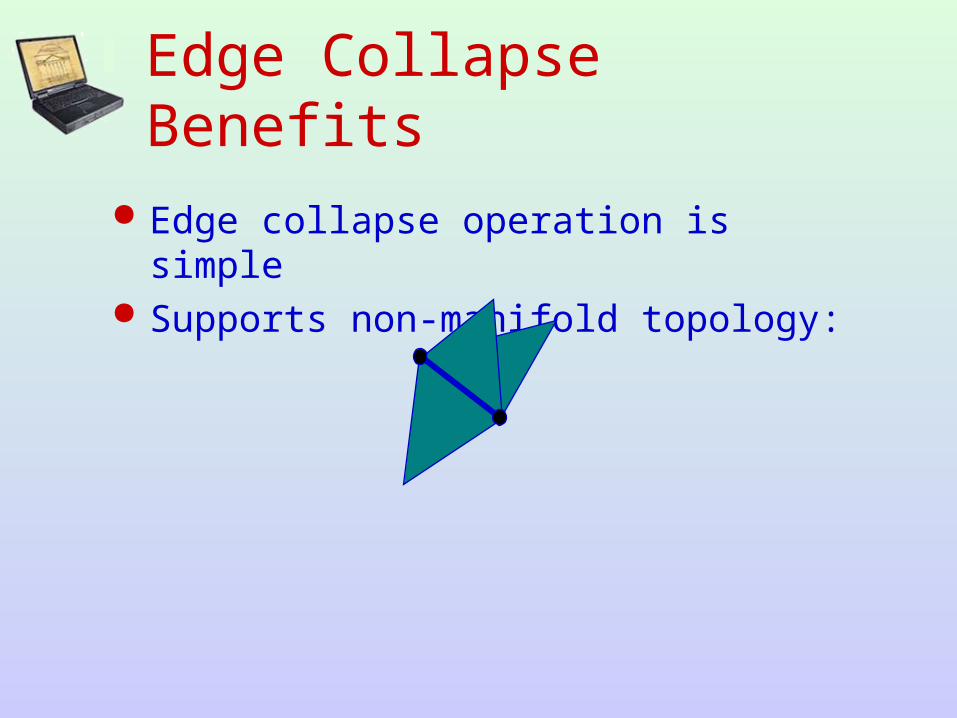
Edge Collapse Benefits
Edge collapse operation is simple Supports non-manifold topology:
Edge Collapse vs. Vertex-Pair Merging
Even better: vertex-pair merging merges two vertices that:– Share an edge, or– Are within some threshold distance t
Q: What does vertex-pair merging enable over edge collapse?
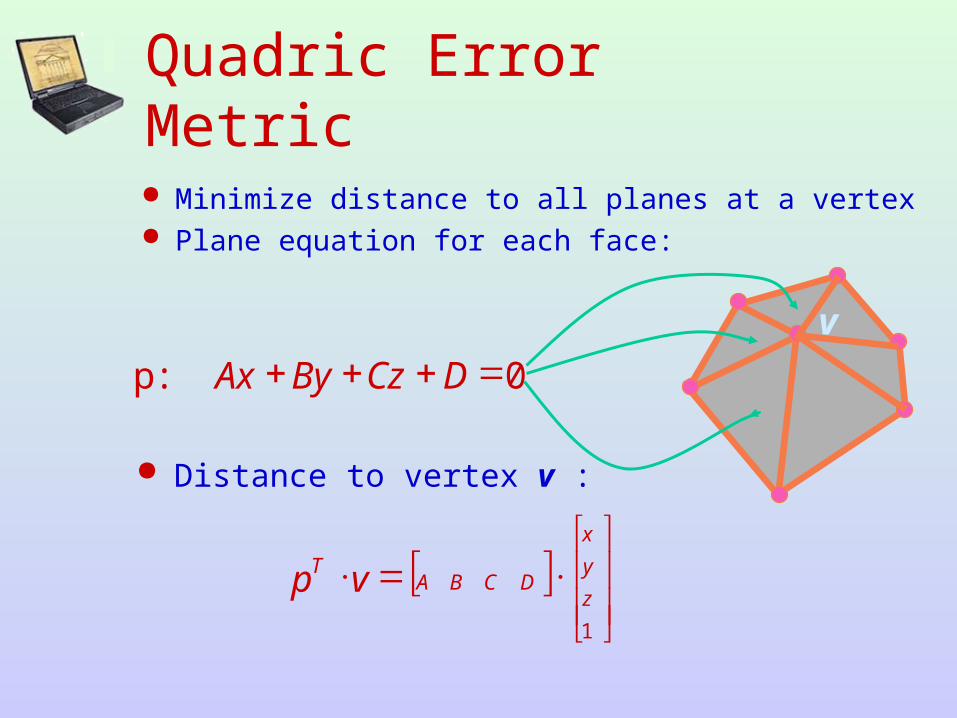
Quadric Error Metric
Minimize distance to all planes at a vertex Plane equation for each face:
0 :p DCzByAx
v
1
z
y
x
DCBAT vp
Distance to vertex v :
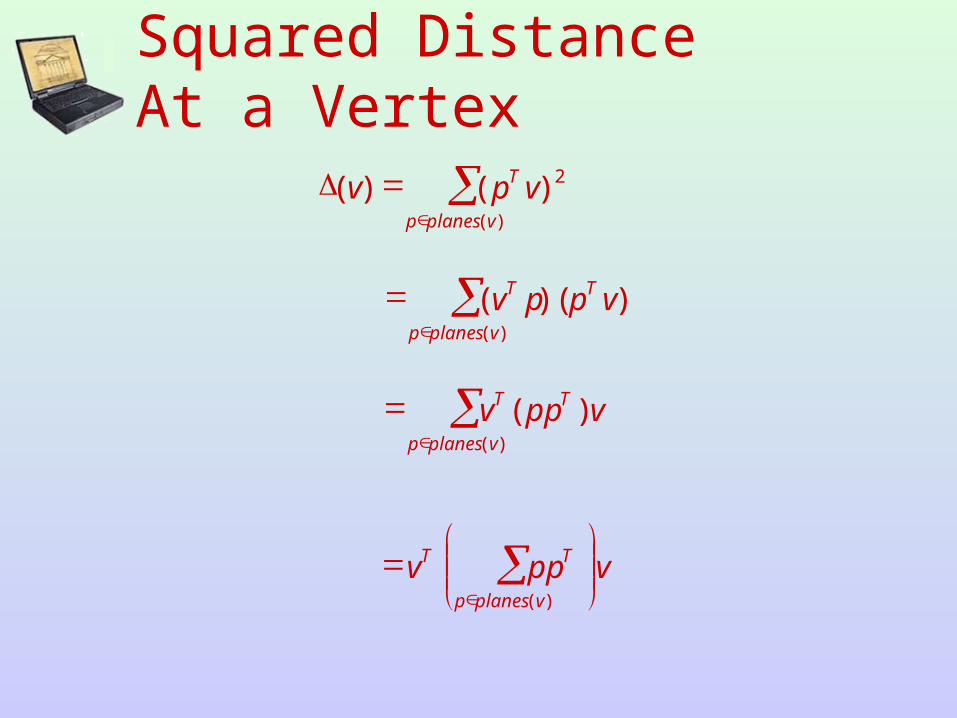
Squared Distance At a Vertex
)(
))((vplanesp
TT vppv
)(
)(vplanesp
TT vppv
vppvvplanesp
TT
)(
)(
2 )()(vplanesp
T vpv
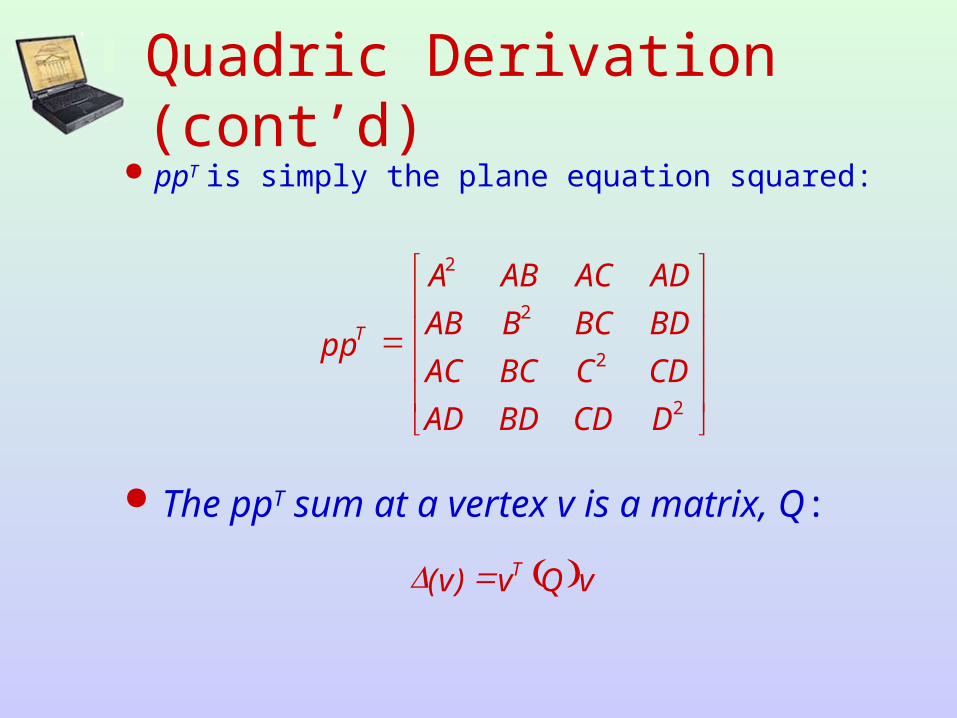
Quadric Derivation (cont’d)
ppT is simply the plane equation squared:
The ppT sum at a vertex v is a matrix, Q:
vQvv T )(
2
2
2
2
DCDBDAD
CDCBCAC
BDBCBAB
ADACABA
ppT