Embed Size (px)
Citation preview

PHOTOGRAPH THIS SHEET
LEVEL INVENTORY
z- 0
SD"cuENT IDEN'TIFICATION
DISTRIBUTION STATEMENT
ACCSION FORNTIS GRAM!
I TAB DTICUNANNOUNCED lI S ELEC T EDJUSTWICATION 02-JN13 IM
DISTRIBUTION /AVAILABILITY CODES cop"DIST AVAIL AND/OR SPECIAL _;;_ _ __ __
DATE ACCESSIONED
DISTRIBUTION STAMP
DATE RETURNED
DATE RECEIVED IN DTIC REGISTERED OR CERTIFIED NO.
PHOTOGRAPH THIS SHEET AND RETURN TO DTIC-FDAC
DTIC FORM 70A DOCUMENT PROCESSING SHEET FREVIOUS EDITION MAY BE USED UNTIL
MARSTOCK IS EXHAUSTED.8

Copy No. 6 MRC/WDC-R-025
High Power Microwave Interaction With Air
W. M. BollenC. L. YeeM. 3. Nagurney
May 1982
Prepared for: Naval Research Laboratory4555 Overlook Avenue, S. E.Washington, D. C. 20380
Contract No. N00014-81-C-2105
Prepared by: MISSION RESEARCH CORPORATION5503 Cherokee Avenue, Suite 201Alexandria,.Virginia 22312
(703) 750-3556
AFf'ROVED FOR PUBLIC B-452
DISTRIBUTIOIA UNLIMITZZ

;ECURITY CLASSlIFICATION OP THIS PAGE (f•Onf Data Entered)
REPORT DOCUMENTATION PAGE READ INSTRUCTIONS17________________ _13EFORE COMPLETINGFORMI• REPORTNUMmlER j. GOVT ACCESSION NO. 3. RECIPIENT'S CATALOG NUMBER
4, TITLE (amd Subtitle) S, TYPE OF REPORT & PERIOD COVERED
Final ReportInvest1gaton of High-Power Microwave 21 Jan 1981 - 20 Jan 1982Breakdown in Air 6, PERFORMING ORG. REPORT NUMBER
MRC/WDC- R-0257. AUTHOR(s) C CONTRACT OR GRANT NUMBER(s)
W. M. Bollen M M. J. Nagurney N00014-81-C-2105C. L. Yee
9. PERFORMING ORGANIZATION NAME AND ADDRESS 10. PROGRAM ELEMENT, PROJECT, TASKAREA & WORK UNIT NUMBERS
Mission Research Corpow ation5503 Cherokee Avenue, Suite 201
__.AipxAndria, Virginia 29319 _____________
II CONTROLLING OFFICE NAME AND ADDRESS 12. REPORT DATE
Naval Research Laboratory May 19824555 Overlook Avenue, S. E. ,1. NUMBER OF PAGES
Washington, D. C. 20370 i14. MONITORING AGENCY NAME & ADORESS(it different from Controllinit Office) 15, SECUPITY CLASS (of this report)
UNCLASSI FIED,Sa. DECL ASSIFICATION.'DOWNGRADING
I SCHEDULE N/A
16. DISTRIBUTION STATEMENT (of this Report)
Naval Research Laboratory, Code 4740 (1 copy)DCASMA, Oxnard (1 copy)Naval Research Laboratory, Code 2627 (6 copies)DDC, Code S47031 (12 copies)NAVAIR, Code 350F (1 copy)
-7. DISTRIBUTION STATEMENT (of the abstract entered In Block 20. it different from Report)
APPROVED FOR PUBLIC RfELEEASAIS TR a T210 Q UnL • u m
II. SUPPLEMENTARY NOTES
19. KEY WORr)S (ConiSnue on revers•e side it necessary and identify by block number)
Microwave Air Breakdown Interaction ReflectionN2 Breakdown Coupling Absorption High Power
20. ABSTRACT (Cnntinue on reverse side If necesscry and Identify by block number)
The computer simulation code MINI has been developed to study microwaveinteraction with nitrogen. MINI has self-consistent wave optics, nitrogenchemistry and hydrodynamic effects included. A number of simulations havebeen performed and compared to experiment showing reasonable agreement.
DD I ,AN 1473 EOI',ON OF I NOV 6S IS OBSOLETE UNCLASSIFIEDSECURITY CLASSIFICATION OF THIS PAGE ("en Data Enteted)

CONTENTS
Sect ion-. Page
I INTRODUCTION 1II CODE DEVELOPMENT 2
III QUALITATIVE FEATURES OF GAS BREAKDOWN4IV COMPARISON OF EXPERIMENT TO MINI 6
REFERENCES 8
APPENDIX AAPPENDIX B
APPENDIX C

ILLUSTRATIONS
Figuare P
1Comparison of Experiment and Simulation for Electron 7Density

I. INTRODUCTION
For the past year Mission Research Corporation has been pursuinga computational and theoretical Investigation of high power microwave
Interactions with air for the Naval Research Laboratory. The technical
objectives were to design, construct, operate and benchmark against
experimental data a one-dimensional, self-consistent computer simulation
of microwave breakdown of nitrogen. A self-consistent nitrogen
chemistry-wave optics hydrodynamic Microwave Gas Breakdown simulation code
MINI has been developed. We have used MINI to simulate the MRC
experiments being performed for NRL (ref. 1) and also to study the
microwave-plasma coupling from atmospheric to low (25 Torr) pressure.
Preliminary simulations have been performed with a simplified
version of MINI which excludes hydrodynamic motion of the electrons and
the neutral gas. The qualitative features of these "No-Hydro" simulations
appear to be consistent with experimental results. These preliminary
simulations are extremely useful, since they allow both hydrodynamic
effects and effects due to plasma reflectivity to be easily isolated. The
No-Hydro simulations were used primarily to study the reflection and
absorption of the microwaves with the breakdown gas. This Is anapproximation even for short pulses since the neutral gas requires only a
small drift speed to conduct/convect large amounts of energy out of a
region. In principle MINI could be run for very long times to follow the
neutral gas motion; however, times much larger than 1 usec become costly.
In the course of Investigation, the electron density profile was
seen to be reasonably modeled using either a symmetric or slab model
proflle. Using a slab model for the electron density profile allowed a
simple simulation to be performed using a separately developed long-term
chemistry code. The Issue addressed in these long-term chemistry
simulations (LTCS) was the reflectivity of the breakdown plasma due to
thermal lonization of the neutral gas. In a thermodyr'mic equilibrium,
with a gas temperature of one electron volt, the breakdown plasma would
"**1

reflect essentially all of the incident microwave energy. These
simulations were typically run for tens of microseconds and provided
valuable quantitative Insight into gas heating by microwave radiation. In
what foIlows, a brief synopsis of the code development arid the theory to
date on microwave gas breakdown will be discussed.
II. CODE DEVELOPMENT
The primary objective in fiscal year 1981 was the development of
a self-consistent nitrogen chemistry - wave optics - hydrodynamic
s3mulatIo11 to investigate microwave decoupling due to gas motion.However, research was initiated using a wave optics chemistry code to
address the issue of plasma reflectance from a high density plasma. The
results showed that the energy deposition of the microwave could not be
sufficiently localized to heat the gas. The details of the wave optics
chemistry code are given In Appendix A. The code follows the electric
field by solving the wave equation for a plane wave of normal Incidence.The electromagnetic boundary conditions were of the Lindman (Ref. 2)
type. The electric field provides the energy source for the 11 speciesnitrogen chemistry code, CHEMN2, ddveloped for this project. CHEMN2
calculates the time development of ground state molecular 'nitrogen, atomic 0nitrogen, their first charge state, the excited states, N2+(B), N4+,N(2 D), N2 (A), N2 (B), N2 (C); and the electrons. The heavy particle
temperature, Tg, vibrational temperature, Tv, and the electron
temperature, Te, are also calculated. The set of stlif differential
equations are solved using a modified version of CHEHEQ (Ref. 3). The
wave optics code has been thoroughly tested and is used extensively in the
simulation of the short pulse experiments.
The development of the hydrodynamic, nitrogen chemistry and wave
optics simuldtion MINI (MIcrowave Nitrogen Interaction Code) was completed
In early 1982. As an extension of the wave optics chemistry simulation
MINI follows the hydrodynamics of the previous mentioned species.Transport processes for the gas include viscous heating and thermal
conduction. The transport coefficients were taken from Bird (Ref. 4 and
-2-.J

5). A Eulerian differential equation of the hydrodynamic equatloi !n
conservative form is solved using the algorithm of Rubin and Burstein
(Ref. 6). The scheme is simple, second order In accuracy, and is
relatively stable while centering the dissipation terms. Although no use
is made of any artificial viscosityt the code can be switched to use theFlux-Corrected-Transport (FCT) algorithm of Boris (Ref. 7). The
hydrodynamic and chemistry portions are calculated separately in a cycleassuming sufficiently weak flows. The hydrodynamics is determined from
the updated values of the chemistry. Hence, the hydrodynamics Is
considered as a small correction to the chemistry.
MINI follows both the electrons and gas hydrodynamics In a
two fluid model assuming separate fluids for the electrons and the heavy
particles. The continuity equation for each species is solved. A single
mass-average velocity for the heavy particles Is calculated. The
diffusion of the neutral species Is neglect'd except for the dominant
molecular nitrogen species. The contribution frora the electric field Is
Included In describing the diffusion of the charged species. The DC
electric field Is assumed to be ambipolar with the sum of the positively
charged particle flux equal to the electron particle flux. In the
strongly collisional region, the electrons do not sample regions of
different electric field or pressure. We assume the electrons are In
steady state as are the positively charged species. The ambipolar field
assumption allows for the solution of the ambipolar field and the electron
drift speed. Sources which cool the electrons and, therefore, heat the
positively charged particles and, hence, the gas Include the following
terms: Joule heating by AC and DC electric fields, elastic and inelasticheating, and work due to momentum transfer. Since the translational androtational degrees of freedom of the heavy particles are closely coupled
and are In near equilibrium, only an energy equation describing the
vibrational energy and translational energy of the gas Is included.Hence, the three energy equations solved are for the electrons, heavyparticles, and the total vibrational energy.
-3-

The AC electric field can be solved In the regular planar
Seometry or in spherical geometry. However, the hydrodvnamics and •
chemistry are always solved In a one dimensional planar geometry. The
solution of the spherical wave equation is used only In modeling spherical
or focused systems similar to the NRC/NRL experiments. The solution to
the hydrodynaroic equations in planar qeometry and the solution to the wave
equation In ,pherical geometry are not cnsistent. One can easily Imagine
systems In which the lateral scale lengths of the system are long compared
to the longitudinal (parallel to the propagation vector) scale lengths.
In such systems, diffusion would actually occur most rapidly in the
longitudinal direction or radial direction If calculating the electric
field In spherical geometry.
MINI can also be run using a dilated electron mass. This allows
for longer time steps In the chemistry and hydrodynamics. Dilating the
electron mass can be Justified physically when the electron drift speed is
slow, i.e., the kinetic energy is small compared to the electron 0temperature. As mentioned previously, the hydrodynamics is taken as a
correction to the chemistry. Hence, in the chemistry portion of the
calculation, the real electron mass Is explicitly used.
III. QUALITATIVE FEATURES OF GAS BREAKDOWN S
Based on simulations using MINI, we have documented some
qualitative features of microwave breakdown of gases. The first of these
Is microwave energy coupling to the breakdown plasma. One general
characteristic of microwave coupling to a breakdown pla'ima is the
Inability to localize the energy deposition. The problem of Interest
requires the gas to be significantly heated before the microwave energy
decouples, Further gas heating, as In a slow combustion wave (In which
the gas diffusion time Is comparable to the gas heating time), is to be
distinguished from a fast detonation wave (in which the gas diffusion
time Is long compared to the gas heating time.) The latter may have
substantial military applications. The basic question addressed was under
-4-___-

what circumstances can a large amount of microwave energy be deposited "
rapidly into the gas. Under high irradiance, the electron density rises
sufficiently rapidly to partially reflect the incident radiation. Thetotal electric field then proceeds to break down the gas at a positionaway from the Instantaneous peak electron density In the direction of theviource (anti-parallel to the wave vector). This secondary ionization
rises rapidly to absorb the microwaves and shields (decouples) the primary
Ionization feont from the microwive radiation. This then limits the
deposition time of the radiation into the gas. Secondary Ionization
fronts due to this process were observed in preformed plasmas or plasmas
formed In a highly spherical (focused) system.
The primary gas heating mechanism at relatively high pressures
(greater than 25 Turr) in nitrogen is quenching of the electronic states
by molecular and atomic nitrogen. Hence, rapid gas heatbig requires high
electron density and temperature, sufficiently high to excite the
electronic states through electron impact. Full hydrodynamic simulations
of short pulse nitrogen breakdown experiments with no target hdve shown
that the gas Is not sufficiently heated to excite these states.
Simulations show electron temperatures on the order of 1-2 eV and an
electron dens&'ty on the order of 1 x 1013 cm-3 for the 35 GHz experimental
parameters. The electric field Is rapidly attenuated In a distance of
approximat.-ly one wavelength. The results are expanded In more detail InAppendix B. These simulation results are qualitatively consistent with
the experiment.
Simulation of microwaves Incident on a reflecting surface shew
breakdown occuring at the peak nodes )f the electric field (the
characteristic standing wave pattern), as wouid be expected, As the
electron density rises, these "pancakes" of electron density begin to
attenuate the radiation such that the pancake closest to the reflectingsurface (one-quarter wavelength away) Is shielded from the radiation. Asthe absorption continues, the remaining pancakes would then sequentially
Erin
decouple the next pancake closest to the surface, and the process repeats M1
Itself. Again, in these low Rressure simulations, the gas is notsignificantly heated.
-5-M

IV. COMPARISON Cr EXPERIMENT TO MINI
"Comparison of MINI to the NRLIMRC experiments has been
undertaken to verify that MINI Includes the proper physics to siumlate
microwave breakdown of nitrogen. Comparison of the simulation predictions
and experimental measurements of electron density a61e shown In Figure 1.
This data Is based on both 3 GHz and 35 GHz experiments. Agreement Is
good, degrading towards the high pressure region. One explanation for
this discrepancy is that MINI assumes a Maxwellian dtstribution for the
electrons. This assumption, particularly for the tail electrons which do
the Ionization, may not be valid for '/w > 1 (high pressure).
Experimental observations of the spectra have been unable to
detect the N2* 3914A band. Only the second positive neutral nitrogen
bands have been observed. This is consistent with MIhI's prediction of
3914/I13371 = 10-4 for the experimental parameters. This effectively sets
an upper bound on the electron temperature in the experiment, Te . 2 eV.
Finally, ionization fronts such as those predicted by MINI were
observed. This is discussed In detail In Appendix C where a copy of our
upco)ming article is reproduced.
-6-

COMPARISON OF EXPERIMENT ANDSIMULATION FOR ELECTRON DENSITY
1o06 I I I
SMINI SIMULATION
1 EXPERIMENT (FREQ.SHOWN IN BRACKETS)
[3] I [3]
101IA
E- [35]
- 1013 -
11-11012 ["
loll - [35]= --
! I !I
110 100 1000PRESSURE (Torr) 1
-7-

REFERENCES
1. W. M. Bollen, R. K. Parker, and W. M. Black, "Experiments on theInteraction of Highpower Microwaves with Air," MRC/WDC-R-015,(3uly 1981).
2. E. L. Lindman, "Free-Space Boundary Conditions for the TimeDependent Wave Equation," 3. Computational Phys. 18, 66 (1975).
3. T. R. Young, 3r., "CHEMEQ - A Subroutine for Solving StiffOrdinary Differential Equations," NRL Memorandum Report No. 4091(1980).
4. R. B. Bird, "Transport Phenomena," Wiley Press, New York (1960).
5. 3. M. Picone and E. S. Oran, "Approximate Equations forTransport Coefficients of Multicomponent Mixtures of NeutralGas," NRL Memorandum Report 4384 (1980).
6. E. L. Rubin and S. Z. Burstein, "Difference Methods for theInviscid and Viscous Equations of a Compressible Gas," 3.Computational Phys. 2, 178, (1967).
7. D. L. Book, 3. P. Boris, and K. Han, "Flux-Corrected TransportII: Generalization of the Method," 3. Computational Phys. 18,248, (1975).
I.i
I!C[
(!
I1
C -8-

APPENDIX A
0
C"

Microwave Energy Deposition, Breakdown and Heating of Nitrogen
C. L. YeeMission Research Corporation
A. W. AllNaval Reseach Laboratory
ABSTRACT
A comprehensive code is developed for the microwave energy deposition in
N2 to describe the breakdown and heating of nitrogen. The microwave
absorption and reflection from a nitrogen plasma is based on wave optics.
The Ionization and the delonization of N2 , however, Is described In detail
by an N2 chemistry code (CHEM-N 2 ) which provides plasma diagnostics
capabilities by calculating emission Intensities of the second positive
and the first negative band systems of N2 and N2 +.
The code is applied to breakdown calculations In N2 and the results are in
reasonable accord with experimental data. The wave optics code for energy
deposition Is also coupled to an air chemistry code (CHMAIR) to describe
the breakdown off a reflecting surface.
An Insight is provided into the plasma absorption by using a simple slab
density profile for the electrons. This models roughly the profile
expected In air breakdown off a reflecting surface. Simulation results
show a steep localized electron density profile at the Interference
maximum. These simple calculations show the plasma reflectivity to be
small (< 25%) for 1 cm light at high electron densities, Ne 1015 cm-3 >
Nc = 1013 cm" 3 . Simulation results also show tne possibility ofattaining high electron density. However, in breakdown off a reflecting
surface, the microwave Is decoupled from the plasma when the absorption
length is less than one-half the wavelength of the light. Important
questions to be addressed In the future Include the possibility of plasmamaintenance, gas heating, shock formation, plasma decoupling and effects
of strong non-linear forces.
_ _ _ _ _ _

* CONTENTS
1. INTRODUCTION ............. ....... 1
2. THE EAND MCODE ..................................... 2
S. N2 BREAKDOWN AND OPTICAL DIAGNOSTICS................6
4. APPLICATIONS TO BREAKDOWN STUDIES ................... 19
REFERENCES ......................................... 29

MICROWAVE ENERGY DEPOSITION, BREAKDOWNAND HEATING OF NITROGEN AND AIR
I. INTRODUCTION
The interactions of the high power microwave radiation with air,
matter and plasmas have potential for various applications, and hence merit
detailed studies and analysis. A detailed study, theoretical and
experimental, is necessary in order to delineate possible regimes for
applications purposes.
Studies can be performed analytically to provide answers in the
limiting cases. However, the phenomena of the microwave interaction with
air, matter and plasmas are complex and require time and space dependent
treatments of a large number of physical processes. This can be carried
out in a self consistent manner by developing detailed computer codes which
treat part or all the phenomena.
This report deals with and describes computer codes, developed at NRL,
for the analysis of the pulsed microwave interaction with nitrogen (N2).
The interaction is considered from the first principles with the microwave
absorption by one or few free electrons, present in the gas, the electron
build up, the breakdown, and the microwave absorption and reflection by the
plasma electrons. The computer code which deiscribes this phenomena'is
basically, consists of two codes coupled together. One, describes the
electromagnetic radiation (E and M' Code) and the other describes the physics
and chemistry of the ionization and the deionization in N2 (CHEM-N 2 ) Code.
The E and M Code, however, can also be coupled into an air chemistry code to
describe the breakdown in air, as discussed in the report.
Manuscript submitted July 24, 1981.
A- 1
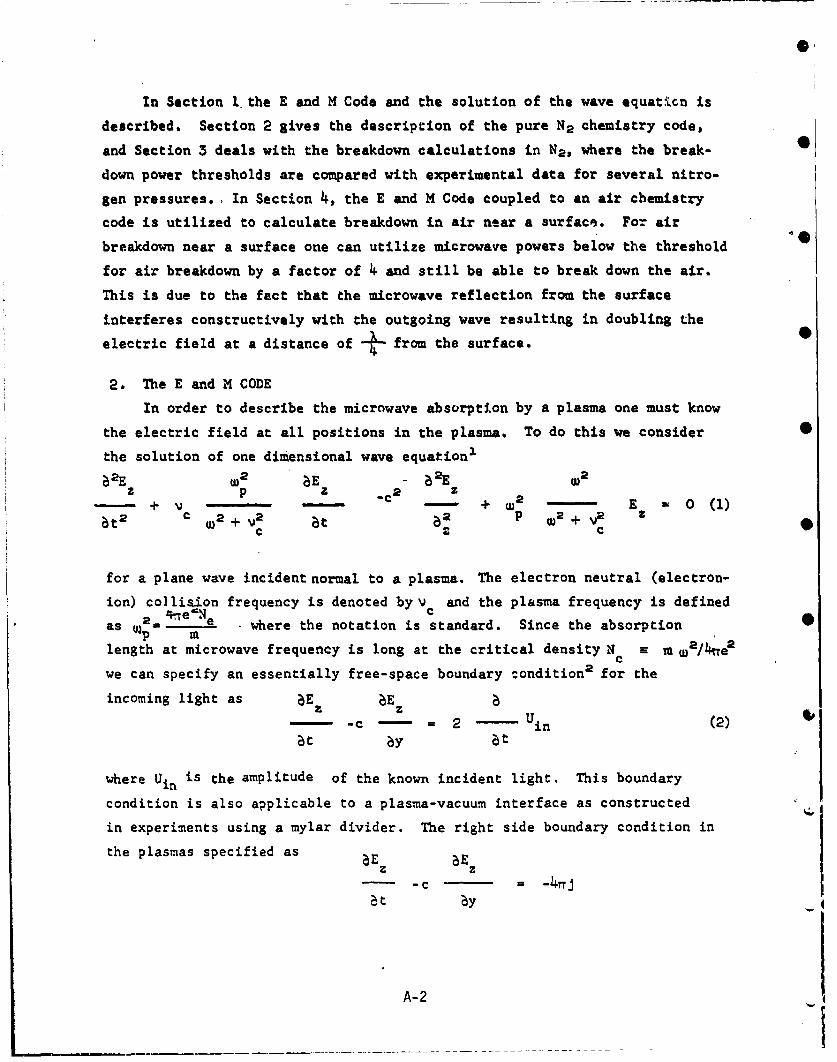
In Section 1 the E and M Code and the solution of the wave equat~.cn is
described. Section 2 gives the description of the pure N2 chemistry code,
and Section 3 deals with the breakdown calculations in Ne, where the break-
down power thresholds are compared with experimental data for several nitro-
gen pressures.. In Section 4, the E and M Code coupled to an air chemistry
code is utilized to calculate breakdown in air near a surface. For air
breakdown near a surface one can utilize microwave powers below the threshold
for air breakdown by a factor of 4 and still be able to break down the air.
This is due to the fact that the microwave reflection from the surface
interferes constructively with the outgoing wave resulting in doubling the
electric field at a distance of from the surface.
2. The E and M CODE
In order to describe the microwave absorption by a plasma one must know
the electric field at all positions in the plasma. To do this we consider 0
the solution of one dimensional wave equation1
•E ®W BE .•E ®z p Z .2 z+ v ... c . + W2 E 0 (1)
SW2 + V2 a2 p 2 + V2 z
for a plane wave incident normal to a plasma. The electron neutral (electron-
ion) collision frequency is denoted by v and the plasma frequency is defined
as 4 eNe where the notation is standard. Since the absorption
length at microwave frequency is long at the critical density N =n W2/ rre 2c
we can specify an essentially free-space boundary condition for the
incoming light as bEz BEB
- -c - = 2 - Uin (2)bt by bt
where Uin is the amplitude of the known incident light. This boundary
condition is also applicable to a plasma-vacuum interface as constructed
in experiments using a mylar divider. The right side boundary condition in
the plasmas specified as Ez •z
- -c -•J
ýt Ay
A-2

whterg J - aEz a - C Ez. Again for low densities, the right
hand side of equation (2) is similar to a free-space propagating to the right.
Equation (1) is differenced implicitly to retain stability for large times
steps in a high density plasma, 2 a VC2 + w2 . The implicit difference form
of equation (1) is
E ' l - 2En + E2"1 W 2 E1 - .E "1
--~ "-"E-=-'E
(At)2 2 w2 + \ 2 Atc
(82E)n+l + 2 (2t)n + (o2E)n-l 2
_ _ _ _ _ _ _ _ _ _+ - 0 (3)(Ay)2 u+4. (W~ p= + va
C
where (6 2E) n En 2 En + This can also be cast into aj J+l j J-1
tri-diagonal system of the form
8200 + + + 2B2) E 82 E A (2iW 2 &t 2 -8 2 E n
2 n-i n-I + 2 n-1 n+ 2$2 En.1 + Ej+I ( y + 28) E +j-. D (4)
2
at ý_where 8 =- and y = 2 A +A solution of a tri-diagonal
2Ay c
system of equations-
-A.E n+l + B E - C EjI D n
can be shown to be
En+l . rG nl E rrI + Fn+lJ+l = l j+l
A-3

where the G 's and Fj's satisfy the recursion relation
C D + A F j+l
"" n__ _ i - a n d -D+ 1 i j J + l ( •)
B -A G j +n1 Bm - A G j+ 1.1 i +l .1 j
The solution technique is then to specify the boundary condition and sweep
the mesh space for the Gj's and F 's. After which we sweep again to obtain
the updated electric field.
The stability analysis of the implicit scheme can be made simple by
dropping the last term of Equation (1). This term is typically not
important in determining the stability criterion. We rewrite r!uation (1)
without this term a- a system of two coupled equations.
p 0at c W2 + V2 by (6)
bw bv
• " (7)at by
BE z 6Ez
where V =- and W = . Choosing an arbitrary fourierat ay
n ~n n
component we let Vj = nexp (-ikjAy) and W n P exp (-ikjay).
We find after some algebra that
1 1(_lY Cy2 21oC2) AG)
1+ V 2 + 2+
A- 4

where W u cAtsin (kay/2) . Stability requires the eigenvalues of theAy
amplification matrix A to be less than or equal to 1. One can show that the
esgenvalues are bounded by
± I + Y ++ (9)
and hence the implicit scheme is unconditionally stable for arbitrary a.
The boundary conditions are explicitly differenced and are coupled to
an explicit form of Equation (1) to obtain boundary value. This explicit
form of Equation (1) is:
E -n-1 2 2 E n+l n-1jjC j j
-ca +2 + 0 (10)
(Ay)2 WP W ® 1C
Once the boundary values are obtained, we use the implicit difference
equation fot all interior points. The boundary values are used as "first"
values in sweepinp tha tri-d.agonal system of equation. Since locally the
explicit differencing is stable for
S2 2 2
(At2) [+- I (V _(7_) 2] 1
the boundar- must be at low density to maintain stability, up2 v V + 2•
A-5
________ _______ ~ ~ IILNqWN

In practice, the implicit scheme must a&Lisfy the explicit stability criterion
to maintain accuracy and minimum phase error. In consalering microwave break-
down off a reflecting surface. this is important aince the interference S
maximum determine* the breakdown field.
As a check on the code, we perform simulations, on free-space, propaga-
tion and reflection off metal surface in a vacuum. Figure (la) shows the
reflected light for a propagating electromagnetic wave in vacuum for a single
pass to the reflecting surface and back to the point of entry of the radia-
tion. The system length is kL a 15 (where k - 2r/%) so the return time of the
radiation is tlu - 30 for cat u O.9hy. The code tracks the propagation
velocity well, however, in the transient time wt : 30, the numerics has intro- •
duced errors in the reflected wave. The averaSe reflected wave should be
zero duzing the transient period, yet we see the average reflected wave of
roughly 10% of the incident light. Figure (lb) shows the spatial electric
field (in normalized variables). Since the launched incoming wave is unity,
the combined wave once reflected from the surface should be of amplitude two.
We see the implicit scheme has introduced large errors in the phase of the
wave and therefore the reconstructed wave. Figure (2a) shows a similar test
with a reduced time step cat - 0.ay. However, in this test, the reflected
wave in the transient period is less than 1% of the incident light. The
smaller phase error reconstructs the interference patterns to its proper
maximum of two as can be seen in Figure (2b). An extensive parameter study
shows good results are obtained using the implic.it scheme for cat : 0.2Ay.
Also as a check, we consider light normally incident on a linear density
profile. The density profile in this collisionless plasma (v - 0.1w) rises
from zero to the cut off density N with a density scale length of kLU - 10.
The Airy function solution requires standing wave pattern toward che incident
light and evanescent wave in the overdense plasma. Figure (3) shows the
solution obtained for the electric field using the implicit scheme with the
boundary conditions. Analytic solution shows the computed field is accurate
in location of the first large maximum, the amplitude of the reflected light
and the amplitude of the largest maximum. The various test problems thus
confirm the validity of the code.
N2 BREAKDOWN, AND OPTICAL DIAGNOSTICS
To describe the nitrogen breakdown by the microwave radiation, we have
A-6 -

*- SIPS
em OS
a Ir - ,
-e06
""at N J P"TION|tit)
(a) (b)
Fig. 1 - Test run with cAt - 0.9&y for a plane wave reflected from a surface (a) reflectedwave (VOS/VEO) versus time (tw•) and (b) electric field (VOSIVE•) versus position (ky)where VOS and VEO indicate the oscillatory and the thermal velocities of the electron,respectively.
on - b a
- asI
(a7 (b)Fig. 2. -- Test run with c•t 0.O2.1y for a plane wave reflected from a surface (a) reflectedwave L YOSiVEO) versus time (tw) and Mb electric field (VOS/'VEO) versus position (kcy)where VOS and VEO indicate the oscillatory and the thermal velocities of the electron,respectively.
A- 7

itl- / at--
S!I I
a . -a ,
0 0 I I Lf I I
-a-

developed an N2 chemistry code. The code calculates the time developments
of Na (K), Na (B). N* , 14, N&D), Na(Or), Na(B%). N&(C%).1 N-, T , T , andT , where the last three symbols designate the electron, the Na - vibrational
and the gas temperatures, respectively. The purpose for the calculation of
the population densities of several excited states is to provide volume
emission rates for optical diagnostic* of the plasma and the investigation
of the ionization from the excited states.
3.1 Ng ¢HMISTRY
A free electron gains energy, in the field of the microwave radiation,
it undergoes both elastic and inelastic collisions with N&, thereby losingpart or all of the energy gained from the field. When the electron energy
reaches and overshoots the ionization threshold for Na an ionization event
may occur according to reaction (11).
• + N2 .6 Na + + 2e ()
Higher energy electrons could ionize N thrnugh the dissociative ionization.
However, the threshold for this process is higher by. 10 eV compared to that
for reaction (11). Therefore, process (11) is the predominant reaction for
the breakdown ionization by microwave radiation.
The deionization of the plasma occurs primarily through the dissociative
recombination of the nitrogen ion N2 and its cluster ion N4, i.e.,
N&++ e . N+N (12)
N4 + e ~N2 + N 2 (13)
The N4 cluster forms via a three-body process 48S i.e.,
N2 + N2 + Ne N4 + N2
and is obviously important at atmospheric pressures and lower gas tempera-
tures. When the gas temperature rises, however, the formation of N4 is
inhibited by the slowing down of the forward reaction in (14) and by the
collisional breakup of N,& (i.e., the reverse reaction of (14) becomesoperative.
A-9
o._~~~Q1 W: 1. 1, I ,I IIIr.wr. • , • .#i•h ~ • IIf MO N AG NO XO N)O M1 QNQM&. I BODrADINM%• • •
The deionization also proceeds via the three-body collisional
recombination, however, it may become important after breakdown and*'when
the electron density is quite high. Finally, the electron.loss occurs
also through diffusion.
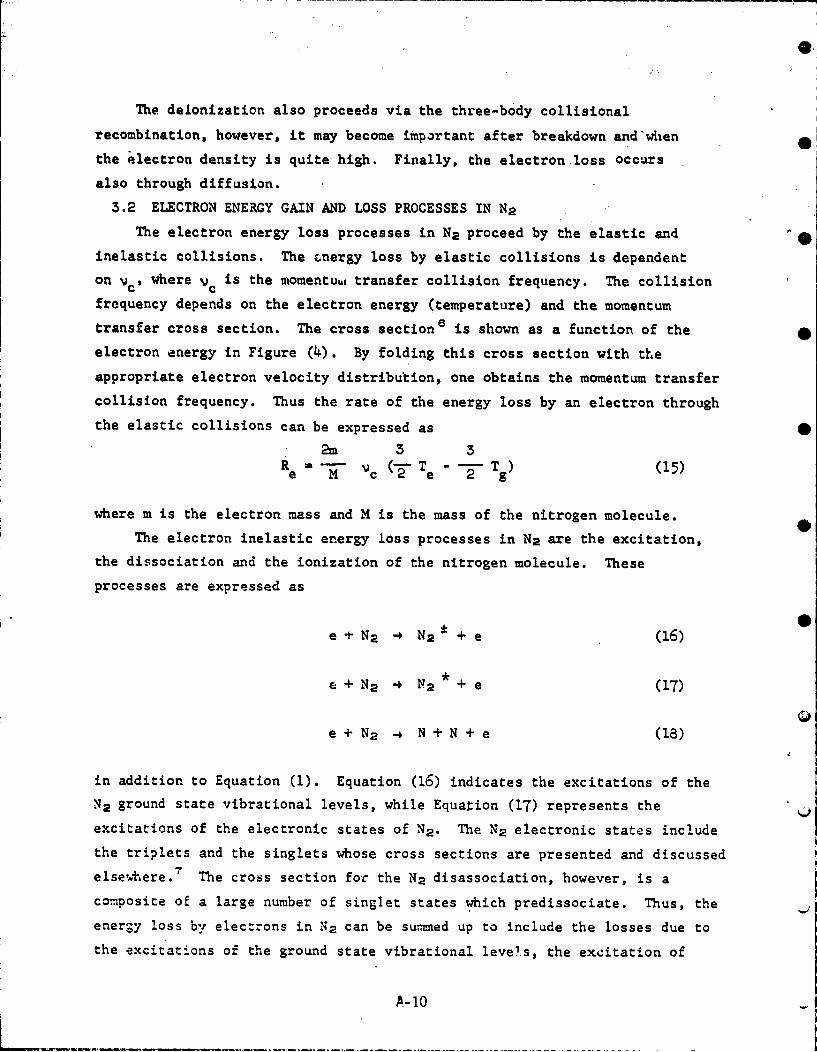
3.2 ELECTRON ENERGY GAIN AND LOSS PROCESSES IN N2The electron energy loss processes in N2 proceed by the elastic and
inelastic collisions. The cnergy loss by elastic collisions is dependenton vi , where vc is the momentum transfer collision frequency. The collisionfrequency depends on the electron energy (temperature) and the momentum
transfer cross section. The cross sectione is shown as a function of theelectron energy in Figure (4). By folding this cross section with the
appropriate electron velocity distribution, one obtains the momentum transfercollision frequency. Thus the rate of the energy loss by an electron through
the elastic collisions can be expressed as
2m 3 3
Re - Vc (- Te - - Tg) (15)
where m is the electron mass and M is the mass of the nitrogen molecule.
The electron inelastic energy loss processes in N2 are the excitation,
the dissociation and the ionization of the nitrogen molecule. These
processes are expressed as
e + N2 4 N2 t + e (16)
e+N 2 4 N2 + e (17)
e + N2 _* N + N + e (18)
in addition to Equation (1). Equation (16) indicates the excitations of the
N2 ground state vibrational levels, while Equation (17) represents the
excitations of the electronic states of N2 . The N2 electronic states include
the triplets and the singlets whose cross sections are presented and discussed
elsewhere.7 The cross section for the N2 disassociation, however, is acomposite of a large number of singlet states which predissociate. Thus, the
energy loss by electrons in N2 can be summned up to include the losses due to
the excitations of the ground state vibrational levels, the excitation of
A-10

0t
ELECTRON ENERGY (eV)
* o1-140 .1 1.0 .1I0.0 1 001 - 7I I I I I I I I I I I I
E
0.0001 0.001 0.01 0.1ELECTRON ENERGY (eV)
Fig. 4 - The Electron Momentum Transfer cross section in nitrogen (N2 )
A--1
(.•
'IA-11l

0
the electronic states A0C, BPC, C3T, aln, the dissociation, and the
ionization of N2 . CBriefly, the vibrational cross sections are from the measurements of
Schulze and are well established as to the peak of the total and the
shape of the individual cross sections8 1°. The cross section for the
ionization is from the measurement of Rapp and Golden 1 1 and the cross eo
section for the dissociation is from the measurements of Winters 1 2 and
Zipf and Mclaughlin' 3 . The cross :section for the triplet states are
discussed in the next section.
The rate coefficients for all the inelastic processes discussed above
have been obtained 14' 15 for a~iaxwellian electron velocity distribution and
are utilized in the breakdown code. Thus, if one designates xi as the
electron impact rate-coefficient for the excitation of the ith state whose
excitation energy is Ei, the rate of the electron energy loss in N2 can be
expressed as
Rin Ei x. Ei N2
Where the summation is over eight ground state vibrational levels, the
singlet and triplet electronic states, the dissociation and the ionization
of N2 . A similar equation for the energy loss in the nitrogen atom can be
utilized, with the appropriate rate coefficients.
Other electron energy loss processes are the excitation of the excited
states from a lower state (not the ground state) and the ionization of the
excited states.The energy gain mechanisms for an electron are the energy absorption
from the field of the microwave i.e., the inverse bremsstrahlung, the
electron impact deexcitation of the ground state vibrational levels and the
deexcitation of the electronic states of the N2 molecule and the nitrogen
atom..
.3. EXCITED STATES
The code as inuieated earlier calculates the time histories of several
excited states of N2 which are discussed below.
A:r: The Ae: state is a metastable and has a life time of 1 sec and an
A-12

I -I
excitationis energy of 6.1 eV. Its excitation cross section by electron
impact has been measured and calculated by several investigators which are
discussed in Ref (7), and shown in Figure 5. The electron impact ionization
of the APE state has been calculated bu Kukulin, et al. 17 The excitation
energy of the A3E state generally ends up as a heating source for the gas
because of the rapid quenching of the state by the atomic nitrogen. The
rate coefficient for the quenchingle of the A3E by N is 5 x 10"11 cms/sec.
!B3E: The B3E state is excited, from the ground state of N2 , by electron
impact, has an excitation energyle of 7.2 eV, and is the upper level for the
first positive band system, (B3rr -4 A%). The strong vibrational bands of
this system are given in Table 1.
TABLE 1
Relatively Strong Emissions in the First Positive Band System
Wave length (.A Transition (5. t) Wavelength (a) Transition (6. •)
7503 4, 2 6069 6, 26704 5, 2 6013 7, 36623 6, 3 5959 8, 46544 7, 4 59o6 9, 5646a 8, 5 5854 lo, 66394 9, 6 5804 11, 7632 10, 7 5755 12, 8
The life times of these transitions are in the range of 10" 5 sec to
10-6 sec and are quenchedz by N2 with a rate coefficient of - (1-2) x 10"1
Cm3 / sec.
The electron imnact excitation cross section for the B3• state have been
measured and calculated by numerous investigators7 and some of these are
shown in Figure 6.
C37: The C3 state is excited from the ground state of N2 , by electron
impact has an excitation energy1 6 of 11 eV and is the upper level for the
second positive band systems, (CW1 -4 B37,). Some of the strong1 8 bands of
this system are given in Table 2.
A-13

ic-,i
N2 (A 3.)
10-16
-2
E 4
z0
0-17
LL 10I
U) I
"10
I S~i
10 9 I I I I I0 10 20 30 40 50 60 70
ELECTRON ENERGY (eV)
Fig. 5 -- The Electron Impact Excitation Cross Section of N2 (A3 •). For details see Ref. (7).
A-14 -

i0-16
"2 N2 (B Iv)
3
4 i0-17
E
z -
w
C,)C,)K0
- I
10-191 !IiII
0 10 20 30 40 50 60 70ELECTRON ENERGY (eV)
Fig. 6 -The Electron Impact E:rcitation Cross Section of N2(B 3fl). For details see Ref. (7).
A-15

0
TABLE 2
Relatively Strong Emissions in the Second Positive Band System
Wavelenath (1) Transition (M. t) Wavelength (I) Transition M5. M)
4059 0, 3 3755 1, 3
3998 1 "i4 3710 2, 4.
3914,3 2, 5 3577 0, 1
3894 3, 6 3536 1, 2
3804 O, 2 3371 0, 0
3159 1, 0
3163 2, 1
The lifetimes of these transitions aresa in the range of tens of
nanoseconds to fractions of a microsecond. Those vibrational levels are
quenched by N2 where the rate coefficient for the quenching of the (0, 0)
transition is 21 1.15 x 10⁻¹¹ cm3 /sec.
The electron impact excitation cross section for the second positive
band system has been calculated and measured extensively7 especially the
cross section for the excitation of the (0, 0) transition at 3371 A. The
excitation cross section is shown in Figure 7.
N2 (B): The nitrogen mclecule has several ionization continua where
upon the ionization the molecular ion is in an excited state. These are
N2 (A), N2 (B), N2 (C), etc. The N2 (B) state has an ionization threshold of
18.8 eV and is the upper level for the first negative band syste:.,
N2 (B2-. X2). The strong1s emissions from this band system are given in
Table 30.
A-16

2-!
NE
z0
04
0 10 20 30 40 50 60 70ELECTRON ENERGY (cV)
Fig. 7 - The Electron Impact Excitation Cross Section of N2 (C3 11 ). For details see Ref. (7).
A-17
*~nnnan annraam~annnlin

TABLE 3
Relatively Strong Emissions in the First Negative Band System
Wavelength (b Transition M, 0) Wavelength -A) Transition (' •)
5228 0s 3 4.236 (1, 2)
5076 2, 5 3914 (0, 0)
4709 0, 2
4599 2, 4
14515 4', 6
4278 0, 1
The lifetimes of these states range2O from tens of nanoseconds to
microseconds and are quenched rapidly by N2 . The rate coefficient 2 2 for the
quenching of the zeroth vibrational level is 4 x 10 -3 cm3 /sec.
The fractional ionization leading to the N2 (B) state is well
.established7 for ionization by electrons with energy of 100 eV and higher.
However, some data exist 2 3 for the fractional ionization below 100 eV, and
emission cross section' 4 which should be of more relevance to the ionization
o! N2 by the microwave radiation.
N(2 D): The metastable state of the nitrogen atcom has an excitation
energyiC of 2.37 eV and arises by the dissociation of N2 , the dissociative+
recombination of N2 , and by direct electron impact excitation from the
ground state of N. The electron impact excitation cross section of N(2 D)
has been calculated. 7
3.4 GAS HEATING
One of the basic interests in the air breakdown is the heating of the
plasma and the neutral species. The heating of the neutral species and the
ions (since the collision between heavy particles is very efficient we
assume that the ions and the neutrals have the same temperature) occurs
through several atomic and molecular processes. These are: the elastic
collisions of the electrons with the heavy particles, the quenching of the
excited electronic states by the neutral species, the dissociative recombina-
tion of the molecular ions and the charge exchange process. The quenching of
the vibrational energy through the collision between neutral species and
vibrationally excited molecules is another essential source for the heating
of the gas. However, the slowest heating rate among these various processes
is the vibrational - translational energy exchange.
A-18

When the gas temperature rises, two additional ionization processes
become operative. These ari the thermial ionization and the associative
ionization as expressed by Equations (20) and (21), respectively.
N2 + 1 .- N2++ N2 + (20)
N +N-N2+e (21)
I. APPLICATIONS TO BREAKDOWN STUDIES
There exist considerable experimental 2P2 data on the microwave
breakdown in air and other gaseous elements. With the advent of lasers, the
air breakdown studies at optical frequencies have increased vonsiderably T?"'-
Theoretical calculations for the air, or gas breakdown generally proceed from
the Boltzman's equation which is solved self consistently for the electron
energy and its distribution. Analytical methods2' 2 7 s'° are also utilized to
obtain the breakdown threshold power. In this report we have assumed a
maxwellian electron velocity distribution in our codes (we are planning to
develop a Boltzman code for this purpose) and have utilized the code for the
breakdown calculations.
4.1 MICROWAVE BREAKDOWN IN N2
In order to compare our results with experiments, we have incorporated
the effect of diffusion into the code. Thus we define an effective ionizationrate %ei - i - D A-2 to allow for diffusion in our code. The diffusion isassumed to be free with a diffusion coefficient D _ V2 t 2 _ 5 x 10¹⁵ T
e c eThe time t€ - 1/vC is the electron-neutral (electron-ion) collision time and
Ve is the electron thermal velocity. The diffusion length A is regarded asbeing specified by the cavity and is assumed known. Our definition of break-down is defined as the electric field required to achieve a net increase in
the electron density for a ten nanosecond pulse. Once the cascade process
begins, the electron density quickly reaches the critical density. Thedominant loss processes at low and high pressures (P ý 1 Torr) are diffusion
and dissociative rocombination (N4+ + e -4 N2 + N2 ), respectively. Our
comparison will be to experimentally measure cw breakdown in nitrogen.The criterion for cw breakdown in nitrogen is vi Vr + D/A2 where Vr is the
dissociative recombination rate1 $ Vr = 5.0 x 10⁻⁵ N4+/Te, where Te is in eV.
Both the diffusion length A and the ambient electron density (n 1 - 102 cm"I)
were specified in the experiment and are known parameters in our calculation.
A-19

S
Calculations wert performed for various frequencies, diffnsion lengths,
and pressures. Figure (8) shows the results obtained by MacDonald et al.a"
for cw breakdown fields in nitrogen at frequencies 992MH and 9.iGH with
diffusion lengths of 0.631 cw and 0.4 cm, respectively. The stars in
Figure (8) denote the calculated breakdown threshold intensity using N2 -Chem.
The calculated thresholds are higher as expected for pulsed breakdown. Table
4 shows the electron temperature, breakdown intensity, and characteristic
time for electron production T M N (dN e/dt)"I as a function of the back-
ground pressure at f a 922 MH and A * 0.631 ca.
Table 4
Pulse Breakdown Threshold Power for 10 cm Wavelength for Various NitrogenPressures
Neutral Electron Pulse Breakdown T (sec)
density (cm-n3) Temperature (eV) Power (Watts/g•y 2
1.32 x l0la 1.7 2200. 7.1 x 10"7
1.32 x 10'- 2.4 80. 4.3 x 10"7
1.32 x 10" 6.4 60. 2.5 x 10? 0
1.32 x 10's 4 1 .0 153. 3.7 x 10-"
The characteristic time T represents roughly the maximum growth time for the
electrons at the start of the avalanche process. Experiments show that once 0
the pulse length t k 2%hs, the pulse breakdown threshold approaches the cw
breakdown limit. The generation time is approximately t. - 7 log 2 and we
require 20 - 25 generations to reach electron densities of order
Ne . 10l cm . Again our definition of the breakdown power is the intensity
required to achieve a net increase in the electron density in 10 ns.
Therefore, our results are certainly applicable to pulse breakdown when
t << 2%s. Since this is easily satisfied by our results, we would expect
the higher breakdown field as characteristic of pulse breakdown. The high
electron temperature at low pressure results from the strong diffusive losses.
The agreement at lower pressures may be somewhat fortuitous since we
extrapolate the ionization and excitation rates to energies above 20 eV.
Current rate coefficients in the code are tabulated for T uo to 2_0 eV.e
A-20

It)
0~
I0~
W 0
102 ( i
L i 111111 11 11 1 1 1 1ii t II t di I I II id
0.1 1.0 10 100PRESSURE (T0RR)
0
0
>102
0.1 1.0 10.0 100PRESSURE (TORR)
Fig. 8 - Comparison between experimental CW N2 breakdown threshold powerand calculations using the N2 chemistry cc 1e1 CHENMN2. Calculations areaindicated by circles and crosses for pulsed and CWV breakdown fields, respec-
tively.
A- 21

However, data is available for T above this temperature and will beeincorporated into the code if desired.
4.2 MICROWAVE AIR BREAKDOWN OFF A REFLECTING SURFACE
We have also coupled the E and M code to a detailed air chemistry
code 3 (CMAIR) to study the breakdown in air. We have, however, chosen to
calculate the breakdown off a reflectine surface to illustrate the breakdown
in air as a result of the interference between the incident and the reflected
waves. In these calculations we neglect the hydrodynamic effects and assume
that chemical processes are more effective in depleting the electron density
than diffusion. This is especially true in microwave absorption experiments
with short pulses (tp 4 40 ns) and rather long wavelength radiation conducted
at atmospheric pressures. Assuming the diffusion length A - ), at
atmospheric condition the characteristic electron diffusion time, for 10 cm
radiation, is roughly tD - (A/Lfp )a tc 10-7 sac where L mfp is the mean
free path of the electron. Since the diffusion time tD )> t - 40ns, ourp
neglect of hydrodynamic effect would seem a good assumption.
The intensity of the standing wave patterns resulting from the
interference maximum can easily be above the threshold for air breakdown.
We imagine the microwave to be incident on a reflecting surface with
intensity 1O < IB. At the first maximum (one-quarter wavelength from the
surface) the field intensity is I 14 I with air breakdown commencing
rapidly a distance + from the surface (Figure 9a). Figure 9b shows the
rapid increase of the electron density as the avalanche begins. The extreme
sensitivity of the air breakdown to the electric field essentially localizes
the electron density resulting in sharp scale lengths, L - N (dN /dy)- 3 < .a a
In this simulation, we have a pulse of 10cm wavelength radiation incident
normal to a reflecting surface with an intensity of 1. - 0.51MW/cm' and a
pulse duration of 4 0ns. The initial ambient electron density is taken to be
n-0cZ- 3 at standard temperature and pressure (STP).
In a collisional plasma, v >> , the cut off density for propagation ofc
electromagnetic radiation is not sharply defined as in collisionless plasmas.
At sufficiently high density such that the skin depth 6 c X, the breakdown
region closest to the surface is decoupled from the microwave radiation.
This is seen in Figure 10a, where we show the square of the electric field at
the end of a LOns pulse. In this particular simulation, we allow for
multiple sources (each source below threshold) such that the net intensity
A-22

US - ll-
UIS 4 ag0
I!Its - Its -
Wa it I -
'is 9-2
It S
II
0 no en sea o o .0 a.0 s0 40 t0 t0
(a) (b)
Fig. 9- (a) Air breakdown off a reflecting surface at atmospheric conditionswith incident power I - 0.5MW'nV/cm 2 at X = 10 cm. (b) Time development ofthe electron density (NIN,).
am
ata
a 30 13 4 . 0 TO 0000 SM W 0
(a) (b)
Fig. 10 - (a) The square of the electric field at the end of the pulse for t.=40 nsec. (b) Time development of the electron density ('/•)
A-23

0
S- 2MW/cm3 > I . The corresponding density for 6 < X can be easilycalculated to be N -50ON . Figure 10b shows the time history of the rise
e C
of the electron density to N e 50ON . Though air breakdown is occurring• cthroughout the volume for this particular simulation, the extreme sensitivity
of the air breakdown to the electric field again localizes the region of the
electron density. The important point to be made here is the high electron
density. As will be shown later, the reflection coefficient for an 0
idealized sharp electron density profile is insignificant until Ne - 10 5Nc at
X = 10cm. The high electron density makes real the possibility of driving a
hydrodynxmic response with microwaves, pending the inclusion of the
hydrodyn33ic effects and various pulse shapes and pulse lengths. Early work 0
by Wood using the hydrodynamic code LASNEX suggests the formation of shocks
at atmospheric conditions using microwave radiation.
4.3 REFLECTION OF MICROWAVE RADIATION
Once the electron density becomes sufficiently large N >> N , the •e c
plasma becomes a good absorber of microwave radiation. However, at too high
densities, the plasma becomes a good reflector of microwave. We wish to
obtain maximum bounds on the reflection and absorption coefficient of the
plasma as a function of wavelength and electron density. We proceed further 0
by calculating the absorption and reflection coefficient for an idealized
slab density profile of density N and thickness d (See Figure 11). We
consider multiple reflection and vary the wavelength, density, and thickness
of the microwave plasma system. In particular we examine the reflection at
two microwave frequency of 3GH and 30GH, respectively. The electron-neutral
collision frequency is assumed to be vc = 5 x 10¹² sec"1 which is typical at
ambient atmospheric conditions. The reflection and transmission coefficients
are given by Ere lleL 2
R E 1- S2 e-i-
and
T = ETrans (1 - S -2 e -i
Einc _ S2 e- i
A-24

SIMPLE PHYSICAL MODEL'
Ne
INCIDENT TRANSMI TTED
________MULTIPLE
*REFLECTED REFLECTION
(_
Fig. 11 - The idealized slab density profile is characteristic of systemsa with high electron densities and steep density profiles.
(~A- 25

where S - (1 - n)/(l + n) and e = 2rtd/c. The complex refraction index
n n -ini is
r i +
,'0(1 a) 4ba2 .
n0
when 1-a>0 and nr +2
= { ai (a-il)2 0
ni= + +- +
2 a) 2
awp ,C awhen - a < O, wherea andb
(a2 - 1) 4b2•
The absorption is determined by the condition R + T + A = 1 with the
nn
2~ 1.2
Figure 12 shows the reflection and absorption coefficients, as a
function of plasma density at e = 10cm and i = 1cm light, respectively. If iwe assrme an absolute electron density of N = lo 1lcm'l , we pee the reflection
coefficient is roughly 60% for 10cm light (Ne = lONc ). Wnereas, for 1cm
light, the reflection coefficient is approximately 25% at Ne = lO5cm"3 =
10 2 N . Our calculations also indicate that to maintain a plasma density of
10c O-cm"- requires an absorbed power of Iabs 2-0..=MW/cm2 . Using a lOcm
light would require an incident power level of Iinc - 1.6MW/cm2 > IB'
Obviously, on.ce the incident po!;er is above the breakdown threshold, the
A-26

102 102
x11
LL L6.
8 Rz
20
OW
- io 3 •ot, o-)-
Fig. 12 - Reflection and absorption coefficient as a function of the electrondensity in the slab plasma model with Pc 5 X 10¹² sec-1.
tA-27
A- 27

plasma would be impossible to maintain. However, the prospects of
maintaining a plasma at N - 101 5 cU"3 using a lcm light appears feasible
since an incident intensity of Itnc 1- MW/cm2 < IB would only be required.
Though the electron density N e 1015cm- 3 is clearly arbitrary, it is note
unreasonable to expect the plasma to become a good reflector when2 V + W2.p c
5. Conclusions
We have presented and discussed two codes developed for the studies of
the pulsed microwave interaction with N2. We have'also utilized our E and M
code coupled to a chemistry code to study the breakdown in air. Our
breakdown threshold power calculations agree favorably with experimental data
in N2 .
Our calculations for breakdown near a surface brings forth the importance
of reflection from a plasma on its maintenance and heating. However,
additional studies in this subject are in progress to delineate this point
further, including the hydrodynamic effects.
0
0
'-
A- 28
I|

REFERENCES
1. V. L. Ginzburg, "Propagation of Electromagnetic Waves in Plasma",
Pergamon Press, Oxford (1964).
2. E. L. Lindman, J. Computational Phys. 18, 66 (1975).
3. R. D. Richtmyer and K. W. Morton, "Difference Method for Initial Value
Problems", J. Wiley, New York (1967).
4 . R. N. Varney, Phys. Rev. 89, 708 (1953), ibid 174, 165 (1968) and
references therein.
5. J. L. McCrumb and P. Warneck, J. Chem. Phys. 66, 5416 (1977).6. A. G. Englehardt, A. V. Phelps and C. G. Risk, Phys. Rev. 135, A1566
(1964).7. A. W. Ali, "Excitation and Ionization Cross Sections for Electron and
Microwave Energy Depositions in Air", NRL Memo Report 4598 (1981).
8. G. J. Schultz, Phys. Rev. 135, A988 (1964) and references therein.
9. D. Spence, J. L. Maurer and G. J. Schulz, J. Chem, Phys. 5U, 5516 (1972).
10. H. Eherhard and K. Willman, Zeit, Phy. 2o4, 462 (1967).
11. D. Rapp and P. Englander-Golden, J. Chem, Phys. L3, 1464 (1965).
12. H. F. Winters, J. Chem, Phys. _4, 1472 (1966).
13. E. C. Zipf and R. W. McLaughlin, Planet Space Sci. 26, 449 (1978).
14. A. W. Ali, "The Physics and the Chemistry of Two NRL Codes for the
Disturbed E and F Regions", NRL Report 7578 (1973).
15. A. W. Ali, "The Physics and the Chemistry of NRL Master Code for the
Disturbed E and F Regions", NRL Memo Report 3732 (1978).
16. A. W. Ali, R. H. Kummler, F. R. Gilmore and J. William McGowan, "Upper
Atmospheric Excitation Processes", NRL Memorandtum Report 3920 (1979).
17. V. I. Kuklin, A. P. Osipov and Y. M. Chuvilskii, Soviet Physics, Tech.
Phys. 24, 883 (1980).
18. R. W. B. Pearse and A. G. Gaydon, "T1he Identification of Molecular
Spectra", Chapman and Hall, London (1965).
19. D. C. Cartwright, J. Geophys. Res. 83, 517 (1978).
20. R. W. Nicholls, Annals de Geophys. 20s 1lh (1964).
21. P. Millet, Y. Salamnero, H. Brunet, J. Galy, D. Blanc and J. L. Teyssier,
J. Chem. Phys. 58, 589 (1973).
22. M. N. Hirsh, E. Poss and P. N. Eisner, Phys. Rev. Al, 1615 (1970) and
references therein.
A-29

!1 -
23. G. R. Wight, M. J. Van der Wiel and C. E. Brion J. Phys. B. Atom.
Mol. Phys. 9, 675 (1976).
24. J. W. McConkey, J. M. Woolsey end D. J. Burns, Planet Space Sci. 15,
1332 (1967).25. M. A. Herlin, and S. C. Brown, Phys. Rev. 74, 291 (1948).
26. A. D. MacDonald, D. V. Gaskell and H. N. Gitterman, Phys. Rev. L30_,
l8a4 (1963).
27. See eig. C. Demichelis, IEEE, J. Quantum. Electron, QE-5, 188 (1969)
and references therein.
28. N. Krall and K Watson, Phys. Rev. M. 1883 (1972). S29. Y. P. Raizer, "Laser-Induced Discharge Phenomena", Consultants Bureau,
New York (1977ý.
30. A. W. Ali, "The Microwave Application Theory Program at NRL and
Some Chemistry Code Applications to Ionospheric Heating by Microwave
Radiation", NRL Memo Report 4302 (1980).
31. M. A. Biondi, Chapter 16, Defense Nuclear Agency Reaction Rate Handbook,
DNA 19L48 H., Bortner and Baurer Eds., DASIAC, DoD Nuclear Information
and Analysis Center, GE-Temp, Santa Barbor, Ca. (1972). •32. R. F. Fernsler, A. W. Ali, J. R. Greig and I. M. Vitkovitsky, NRL Memo
Report 4110 (1979).33. C. H. Wood, Bull Am Phys. Sci 2, 909 (1980).
A
A-30

APPENDIX B
win

Microwave Energy Coupling In a Nitrogen Breakdown Plasma
C. L. Yee, A. W. Alit, and W. M. Bollen
Naval Research Laboratory, Washington, D. C. 20375
ABSTRACT
Computer simulations of microwave coupling to a nitrogen breakdown plasma
have been performed at 25 Torr. Non-hydrodynamic Ionization fronts are
observed to propagate toward the radiation source under a variety of
circumstances. Free nitrogen breakdown simulations in a spherical system
show the propagation velocity of the breakdown wave can be as high as 5 x
10b cm/sec. An elementary theory Is used for estimating the speed of the
breakdown wave In one dimension. The results are in reasonable agreement
with breakdown experiments.
t Plasma Division, Naval Research Laboratory.

* 1.0 Introduction
The pulsed breakdown In air and other gaseous elements has been
studied extensively1 with emphasis on the threshold power for breakdown
* and its dependence on the gas pressure and radiation wavelength. The
hydrodynamic effects were first considered by Lin and Theofilos. 2 Their
calculation of the gas heating showed that both high field Intensity above
the breakdown Intensity and increasing molecular density discouraged
energy deposition in air. Though the preliminary experimental results
confirmed the general features of the simple theory, the observed pressure
waves were stronger than predicted. Scharfman 3 et al., have observed that
a breakdown plasma prevents the transmission of microwave energy to points
* beyond the plasma. Experiments4 recently performed at the Naval Research
Laboratory (NRL) showed that the microwaves are rapidly decoupled from a
target or plasma surface. This rapid decoupling of the microwaves would
limit the amount of energy that can be deposited into the gas. Computer
* simulations of the NRL experiments have been performed at a pressure of 25
Torr In nitrogen. Throughout this work, we have used the MINI code
developed at NRL to help in understanding the basic interaction processes
In the experiments.
2.0 The Microwave Nitrogen Interaction Code (MINI)
The MI1crowave Nitrogen Interaction code (MINI) used In our
studies Is an one-dimensional multi-species, multi-temperature, hydro-
dynamic, nitrogen chemistry and wave optics code. The species followeddynamically were N2 , N•(X), N+(B), N+, N, N(2 D), N2 (A3E), N2 (B 3T),
N2 (C37i), and the electron density (ne). The model calculates the
( electron (Te), vibrational (Tv) and gas (Tg) temperatures, and is
space and time dependent with microwave absorption and reflection
considered In the wave optics mode. The detail of the chemistry and the
wave optics aspect of the code are described elsewhere 5 and will not be
C
( B-I

repeated here. The electrons are described hydrodynamically by the
equations
at(ne) + V,(n+) C
4 e eu 4
ue um - ueE - DeV(Inne) - DeV(lnTe)
t(e + e + Pete + tel =e" e + Ae +Ee
31e ee 2 mene
where Pe neTe is the electron pressure, e = -eneue Is the
electron current density, Re enevc e is theelectron momentum transfer rate, U. = e/mevc Is the electron
mobility, and De = Te/mfec Is the electron diffusion coefficient.
The electron momentum transfer frequency Is vc, and me is the mass of
the electron. The electron energy flux Is Qe = -KeVTe where the
electron thermal conductivity Is Ke =neTe/mevc and B is a
constant. The terms on the right hand side of the energy equation
represent energy lost due to heat flow, work due to momentLmu transfer,
joule heating and heating due to elastic, inelastic, and chemical
processes. The term Ce represents sources and sinks terms for the
electron due to Ionization, recombination, and attachment. The Ee term
In the electron energy equation Includes energy losses due to vibrational
and electronic excitation of molecular nitrogen. The Ce and Ee terms
are discussed more fully in Ref. (5). The average velocity of molecular
nitrogen, Um, Is related to the diffusion and masz-average-velocity 6 of
the heavy particles by um vm + u. The diffusion velocity Is V"m
and I is the mass-average-velocity of the heavy particles.
0
B- 2 0

The continuity equation for each of the heavy particle species
isa t(ntI) + V- (n I *) I CI.
The momentum equation for the heavy particles is
t (P) + V'(PuU + 1-) = P4 - A e
where pa Elminl, p+ = EiZienli, and It = i + pHj are the
mass density, positive charge density, and pressure tensor. The viscous
portion of the pressure tensor is w_, pH a Tg1 1nl Is the heavy
particle pressure, and I Is the unit tensor. The heavy particle energy
equation Is
t{cv(v) ( v (Tg))} EH+ + eU+ -
E H E= iicn iTg + .1 pU2---"n2
where c H Is the total energy density, ci Is the
translation-rotational specific heat, cv(Tv) = clexp(c/Tv) - 1}- is
the average vibrational energy per molecule, 7 c = 0.3 eV is the quantum of
vibrational energy for nitrogen, TV is the characteristic time for
vibratinnal relaxation, 8 and EH is the heating terms due to chemical,
elastic, and Inelastic processes. Again a more detailed discussion of
EH can be found In Ref. (5). The heavy particle energy flux is QH
-KHVTg, and KH Is the thermal conductivity of the gas, including
translational and rotational contribution. 9 The average and diffusion
velocity of species i are related by u I = vI + u. The diffusionvelocity of the ith Ion species Is vi and•u Is the mass-average-velocity
of the heavy particles I
IB-3 0@

The vibrational energy equation may be written approximately as
n8tjnmcv(Tv)'} + 0,{nnv(Tv)•m + .-!- {Iv(T) - (T + E
where 14 2 -,viTv Is the vibrational energy flux and Kv Is thevibrational conductivity. The vibrational temperature can be calculated
assuming that the nitrogen molecule is a harmonic oscillator and that the
vibrational levels have a Boltzman distribution. Hence, the vibrational
energy source term Ev is
Ev = en -ne xp{1c/Tv)aIvivli - expe{cv(Tv - Te)/TvTe}}
where Xv Is the excitation rate coefficient 1 0 for the vth vibrational
level obtained from the experimentally measured cross-sections. 11 The
vibrational energy spacing is c m 0.3 eV for nitrogen.
The equations solved In MINI are:
S(n)e + ( ) - Ce (1)
U u -e eE Deax(inn) - De ax(lnTe) (2)
a tEe) + xtx{eUe + PeUe + Q} ReUe + 3 E + E (3)
= = n T + m n u2
e 2 ee 2 e ee
at(n,) + x(n Iu,) = Ci ý4)
at(Pu) + a {pu 2 + PH (- U + 08)3xul = P +E - R (5)
t(cH) + ax {¢Hu '" {PH A- + UB)axu}u OH (6)HI3
-n {fv(Tv) C v(Tg)I eE ReUe+EiTv
B-4

nYtn cv(Tv)) + 8),jn cv(TV)u) -2 it {(T) C c(T )) + E(7) -
where the Kinematic and bulk viscosity coefficients are U and UB6" The
transport coefficients for the viscosity and thermal conductivity are
taken from Bird. 12
The dc portion of the electric field and the diffusion veloci-
ties are determined by demanding the total current
.,.0 (8)
where 31 = Zieniu1 is the current density of the ith Ion species.
In steady state, each of the ion species satisfies an equation
ui + i - DV(nni) - D7(lnTg) (9)
where the Ion diffusion coefficient and mobility are related to the colli-
sion frequency vi by Di = Tg/mIvi and Ul = Zie/mlvi"
The mass of the ith Ion species is mi. Summing Eq. (9) for all ion
species and using Eq. (8) gives an equation for the ambipolar electric
field. Once the ambipolar field is found, Eqs. (9) and (2) are used to
solve for the flow velocities of the Ions and the electron.
The Eulerian difference equations of Eqs. (1) - (7) are solved
using the algorithm of Rubin and Burstein. 1 3 The scheme is simple, second
order to accuracy, and Is relatively stable while centering the dis-
sipation terms. The hydrodynamic and chemistry portions are calculated
separately in a cycle, assuming the flow velocities of the fluid areweak. The hydrodynamics Is determined from the updated values of the
chemistry. Hence, the hydrodynamics Is considered as a small correctionto the chemistry.
B-5 S

3,0 Cascade Ionization of Nitrogen by a Microwave Pulse
Microwave gas breakdown begins when a small number of priming
electrons acquire sufficient energy from the electric field to ionize the
gas. These priming electrons gain energy when the oscillatory energy of
the electrons in the electric field is randomized by collisions into
thermal energy. Once an electron has an energy in excess of the ioni-
zation energy of the gas, the electron can easily ionize the gas, result-
Ing in the generation of two low energy electrons. The electron avalanche
can be described by
ne (t) = ne (O)exp(t/TB) (10)
where ne(t) is the electron density at time t, and TB is the
breakdown time. Physically, TB is the time required for an electron
to gain the energy needed to ionize the gas. 14 Fig. 1 shows the breakdown
time, TB(sec), and the electron temperature, Te(eV), for conditions
typical of microwave breakdown of N2. A high radiation field would pro-
mote the electron avalanche by increasing the energy imparted to the
electron per collision with the molecule. A high molecular density, how-
ever, requires higher intensities for the avalance breakdown. At moderate
pressures above 25 Torr, the dominant energy loss mechanism for the
electrons is the excitation of the electronic and vibrational modes of the
gas. The root-mean-square electric field to density ratio, E/nm
(V-cm2 ), does not uniquely define the absorbed energy for an ac electric
field. The striped region In Fig. 1 is bounded by the constant intensity
line (I) and the constant pressure line (P). The rapid variation in
T with increasing intensity allows a breakdown threshold, IB, to
be assigned at i onset of breakdown. The ability to couple microwave
energy to a breaKdown gas depends sensitively on the breakdown time,
and the electron density.
B-6
The efficiency of converting microwave energy to the trans-
lational energy of the gas can be enhanced by coupling the microwaves to a
preformed plasma. Plasma maintenance of a preformed plasma by microwaves
allows the microwave deposition to be localized while maintaining a high
electron density. In short pulse breakdown experiments with pulse
lengths, mp < 1 usec, a high electron density is a necessary condition
for rapid heating of the gas. Plasma maintenance requires the breakdown
time TB > TP when ne())1 If the local electric field is not
carefully matched to the Instantaneous plasma conditions, the gas heating
will be self-limited by the formation of a non-hydrodynamic ionization
front. Gas breakdown off a reflecting surface without a preformed plasma
will not result in a local deposition of the microwave energy. Since the
microwave deposition Is determined self-consistently with the electron
density profile, the resulting plasma density cannot rapidly heat the gasin the short pulse experiments.
3.1 Gas Breakdown Near a Reflecting Surface
A plane wave incident normal to a reflecting surface would re-
quire less power for gas breakdown. The constructive ihterference of the
incident and reflected microwave results in the characteristic standing
wave pattern for the electric field and a factor of four Increase in the
field Intensity. If the intensity Is above the breakdown threshold,
breakdown of the gas occurs Instantaneously at the peak nodes of the elec-
tric field. As the electron density rises, these "pancakes" of electrons
begin to attenuate the radiation. Pancakes closest to the reflecting sur-
face rise more rapidly early In the pulse (Fig. 2). As the electron
density continues to rise-, attenuation of the microwave causes the pan-
cakes closest to the surface to fall in density below that of pancakes far
from the surface. Shorter systems with fewer pancakes decouple more
rapidly than longer systems. However, the total absorbed energy remains
essentially constant, Independent of the system size for a fixed pressureI
and pulse IeghB- 7

The finite length simulations represent the planar region near
the surface of a focused microwave system where the distance from the sur-
face Is less than the radius of the spotslze. Fig. 2 shows two similarsimulations with I = 6.25 kW/cm2 for an one-and-a-half and three wave-
length system without hydrodynamic effects. The plasma absorbs 0approximately 20% of the total microwave energy with an asymptotic
absorption efficiency of 80%. The absorption is regulated by the electron
density. Shorter systems have a much higher electron density than larger
systems and can more readily heat the gas In the short pulse experiments.
The gas Is not expected to be heated more than the observed 4% above the
ambient temperature in a weakly focused system. The absorbed energy isdistributed over a larger number of pancakes with a very low electron den-
sity. As will be discussed later, the low electron density of Fig. 2 0results In a long heating time for the gas of T = 6.5 usec whereg
T 9 Tgdg/dt)-. The time required to heat the gas to anappreciable temperature In a weakly focused system would require pulse
lengths of Tp > 6.5 usec. However, even for long pulses, a significant 0heating of the gas is never realized. Later in the pulse, the pancakes
furthest away from the reflecting surface continue to rise in density.
Ultimately, a single pancake will have sufficient density to reflect the
radiation. This pankcake acts as a secondary reflecting surface and 0decouples the radiation from the primary metallic surface. Gas breakdown
experiments 4 using a reflecting surface show this behavior. Similarly,
free nitrogen breakdown simulations without a surface using a focusedsystem also show that the radiation Is decoupled from the initial 0
breakdown site.
3.2 Maintenance of a Preformed Plasma by Microwaves
Microwave coupling to a pre-ionized plasma near a metallic sur-
face show some general characteristics. Though the plasma absorbs themicrowave energy, the absorption cannot be localized. A traveling ionl-
zatlon front is observed to proceed toward the radiation source. Fig. 3
shows the time history of the ionization front in the strong
B-8

mismatch case I > I and T > T The critical time T is the
time required for the electron avalanche to reach the critical density nc
SW2 me/4ne 2 - 101 3 /X2 (cm ) where X is the wavelength of the incident
radiation. In this simulation I = 12.5 kW/cm2 > IB = 3 kW/cm2 , Tp = 0.5
lisec, TC = 0.16 Visec, and all hydrodynamic effects are suppresed. The
initial electron density (pre-ionized plasma) was initialized with a
symmetrtc profile with a peak density of 0 .Inc and FWHM of O.1IU. In Fig.
3, the peak density is determined by Eq. (10). However, the breakdown time,
T., Is a complicated function of the incident and reflected microwaves.
It is clear that the small reflectivity (R < 10%) is important in
determining the propagation speed since as Fig. 3 shows, the separation
distance between peaks Is X/4. The ionization front proceeds toward the
source at a characteristic speed D(t) = X/4T C(). The maximum density
is decreasing with time while the total absorption continues to increase
with time. The asymptotic absorption efficiency is approximately 95%. The
movement of the ionization front limits the time the gas-plasma systems
samples the radiation field. The sampling time, TS, is determined byT
c(cm) 0fS D(t)dt = D(O)Ts where D(O) = X/4 TC (0) = 1.6 x 106 cm/sec isthe early breakdown speed. Estimating the absorption length as c(cm) = X/27r
gives a sampling time of Ts = TC- In the pressure regime P > 25 Torr,
the gas is primarily heated through the quenching of the electronic states by
molecular and atomic nitrogen. The fractional change in the gas. temperature
is £g = (ATg/Tg)Max = TSEa0Qa0nan 0 cna/cvnmTg where
Qaa is the quenching rate of the N2 triplet state na by the quenchant
nr. The specific heat of nitrogen is cv and Ca is the energy level of
the na state. As an example, the N2 (C•r) state is quenched by N2 with a rate
coefficient 1 6 of 1.2 x 10⁻¹¹ cm3 /sec. The fractional change in the gas
temperature, cg, is approximately 21% from the ambient temperature.
The region of the maximum gas heating is at the initial breakdown
site (-X/4 from the surface). The electric field is less than
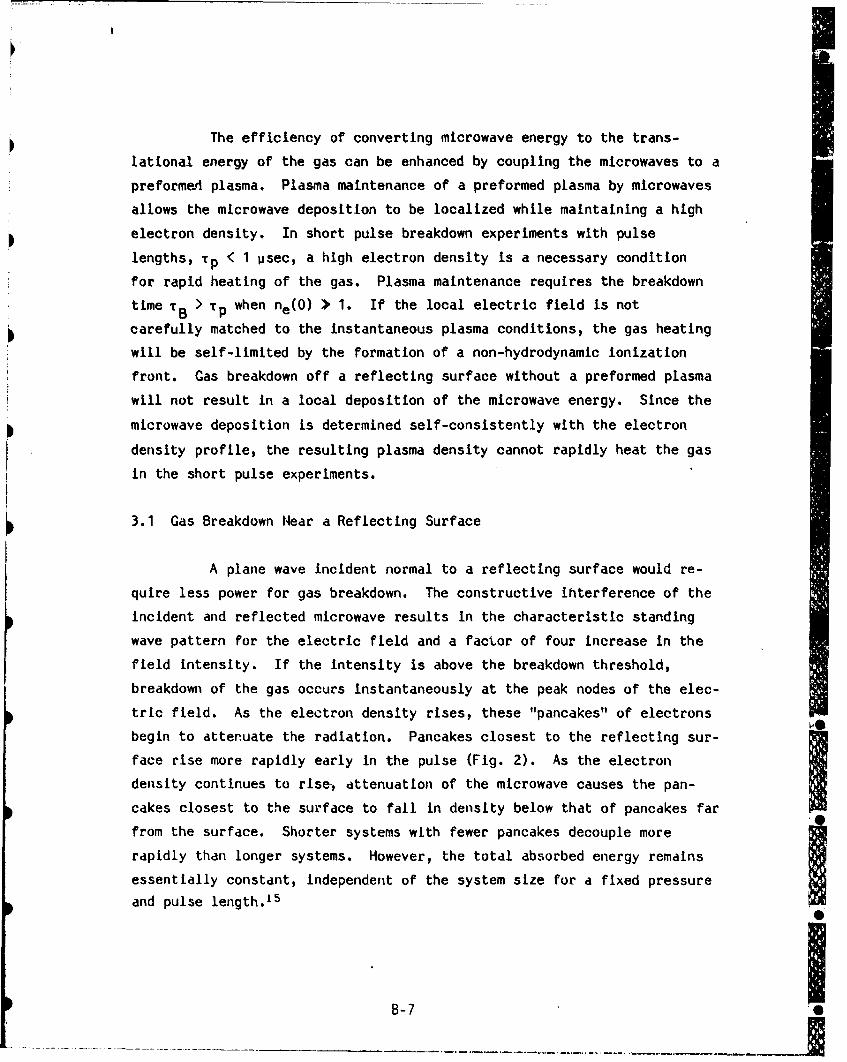
B-9

1% of the Incident time average electric field at the maximum gas tempera-
ture (Fig. 4a). The plasma absorbs approximately 70% of the incident
microwave energy and has an electron temperature of less than 2.5 eV
(Fig. 4b). Maximum gas heating requires the sampling time and the elec-
tron temperature to be as large as possible without decoupling the
system. A high electron temperature populates the electronic states which
are rapidly quenched to heat the gas. Approximately 4% and 40% of the in-
cident energy goes into heating the gas and exciting the vibrational
states. A similar simulation with the peak power reduced to I = 6.25 kW/
cm2 shows no movement of the Initial Ionization region while increasing
the fractional change In the gas temperature to 27%. Further irradiance
would Increase the gas temperature. However, these results are sensitive
to the hydrodynamic response of the plasma. Again, a similar simulation
with hydrodynamic effects showed a reduction in the gas and vibrational
temperature. The microwave plasma system again decoupled; however, the
hydrodynamic motion reduced the energy input Into the gas and vibrational
energy to 0.1% and 26% respectively. The electron density scale lengths
are sharp, L/N > 1O-2 where L =_ne(dne/dx)-l. The hydrodynamic motion
of the electrons tends to reduce the electron temperature and density in
regions of high density. The slow gas flow (< 300 cin/sec) further reduces
the electron temperature by convecting the vibrational ener gy away from
regions of high electron density. The small temperature and density
changes translate to greater than 10% reduction In the population of theelectronic states. Since quenching of the electronic state Is the domi-
nant mechanism for rapidly heating the gas, the gas heating is negligibly
small. It Is clear that the motion of the Ionization front will certainl~y
limit the gas heating.
3.3 Gas Breakdown In a Focused Microwave System
Simulations of a focused microwave system were also performed.
If the field intensity in a focused system greatly exceeds the breakdown
threshold at the focal spot, a breakdown wave propagates toward the
source. 17 The motion of the microwave plasma absorbing layer IS 11ot a
B -10

simple breakdown wave, since the reflected microwave Is important in
determining the propagation speed. Fig. 5 shows the time history of the
electron density profile during the course of a Tp = 0.5 usec pulse in a
focused system. The spherical wave equation is solved for the electric
field to model the convergence of the field. The peak incident field Is I
= 10 kW/cm2 with a system aspect ratio of 2.5. The average power at focus
Is 31.25 kW/cm2 , and all hydrodynamic effects are suppressed. The very
rapid early time speed of the absorbing wave, D = 5 x 106 cm/sec, gives a
sampling time of TS = 1.7 x 10⁻⁸ sec. However, the gas continues to
be heated after the passage of the field by the de-excitation of the elec-
tronic states. The maximum gas and vibrational temperatures are eg
10% and c. = 260% respectively. The quarter-wavelength fine structure
in the density profile shows the effect of the reflected light. The time
average reflection and absorption coefficient are 19% and 68% respect-
ively. A snapshot of the electric field and electron temperature (Fig. 6)
shows the lack of field penetration (a = 0.1X) and the cold plasma
temperature, Te < 3.3 eV. The gas and vibrational temperatures again
are reduced when hydrodynamic effects are included in the simulations.
The gas is expected to be heated, at most, to 10% of the initial value
during the course of a 0.5 Usec pulse.
The propagation velocity of the breakdown wave in a focused
microwave system can be calculated. Simulations show the absorption is
localized at the head of the breakdown wave. The reflection coefficient
is relatively constant after the initial breakdown (t > TC). The
breakdown time, .B' is inversely proportional to the light flux,
1/TB (1 + 2Reý + 42)I, where the reflection coefficient is C2. The
intensity in a conically focused system can be written as
I(Xt) 4Z (1 + 2Rec + c2) x 0tr2
B-11
L . . . . .

where *(t) Is a form function characterizing the pulse. The radius of the
radiation channel at a position X ori the channel axis Is r = r 0 + XtanO.
The minunmum radius of the waist at the focal point is r 0 and 8 is the
half-angle of the radiation column. Following Raizer, 1 7 the pýopagation
velocity of the breakdown wave Is approximately D = rO/T Ctane. Under
the assumptions made, the velocity D would be an upper bound on the
propagation velocity of the breakdown wave.
4.0 Simulation of the NRL Experiments
We compare the simulation results with the NRL experiment. The
NRL 35 CHz 112 kW focused gyrotron system gives an average power at the
focal spot of 33 kW/cm2 . The polarization oF the microwave Is such that
the electric field Is perpendicular to the plasma gradient (S polari-
zation). The average aspect ratio of the experiment gives an equivalent
simulation aspect ratio of 2.5. The free nitrogen breakdown experiments
were performed at 25 Torr with a 100 pps repetition rate at Tp = 1.5
psec. The minimum radius of the waist at the focal spot Is r 0 = 0.75 cm
and the half-angle of the radiation column satisfies tan8 = 0.35. Expert-
mentally, framing camera data (Fig. 7) gives a propagation velocity of D
4.6 x 106 cm/sec. The width of the absorbing wave is approximately 1.2
cm. The measured absolute intensity of the second positive band, N2 2P
(0-0) at 3371 A is 1.4 x 10²¹ eV/cm2 -sec. The calculated spatial width of
the 3371 A light emission is 0.8 cm with a peak intensity of 1.8 x 10²¹
eV/cm2 -sec. As mentioned previously, the calculated speed of the break-
down wave is 5 x 106 cm/sec. Experimentally, the inferred breakdown time
is T B = 2.5 x 10⁻⁸ sec or TC = 7.4 x 10⁻⁷ sec. This is to be
compared to the calculated breakdown time early in the pulse, TB e 4.5
x 10-9 sec, and late In the pulse, TB w 6 x 10⁻⁸ sec. The simulation
results are felt to be in reasonable agreement with the experiment.
B-12

* 5.0 Conclusion
In conclusion, computer simulation of microwave coupling to a
weakly Ionized nitrogen gas plasma shows excellent absorption of the
* microwave energy. The electronic states of nitrogen excited by electron
Impact are rapidly quenched by molecular and atomic nitrogen to heat the
gas at pressures above 25 Torr. However, high power irradiance can easilyproduce a non-hydrodynamic Ionization front which can severely limit the
heating of the gas. Microwave gas breakdown experiments with pulselengths less than one microsecond are expected to show only a slight heat-
Ing of the gas.
C B-13

RERERENCES
1. A. D. MacDonald, Microwave Breakdown In Gases, 3ohn Wiley and Sons,Inc. (New York, 1V66).
2. S. C. Lin and G. P. Theoftlos, Phys. Fluid 6, 1369 (1963).
3. W. E. Scharfman, et al., IEEE Trans. Antennas and Propagation 12, 709(1964).
4. W. M. Bollen, et al., "High Power Microwave Energy Coupling to
Nitrogen During Breakdown," NRL Memo Report (in press).
5. C. L. Yee and A. W. All, "Microwave Energy Deposition, Breakdown andHeating of Nitrogen and Air," NRL Memo Report 4617 (1981).
6. 3. 0. Hirschfelder, C. F. Curtiss, and R. B. Bird, Molecular Theory ofCases and Liquids, 3ohn Wiley and Sons, Inc. (New York, 1964).
7. 3. W. Rich, 3. AppI, Phys. 42, 2719 (1971).
8. R. Millikan and D. White, 3. Chem. Phys. 39, 3209 (1963).
9. Kinetic Processes in Gases and Plasma, edited by A. R. Hochstim(Academic, New York, 1969), Chaps. 2 and 3.
10. A. W. Ali, "The Physics and Chemistry of Two NRL Codes for theDisturbed E and F Regions," NRL Memo Report 7578 (1973).
11. G. 3. Schulz, Phys. Rev. 135, A 988 (1964); H. Ehrhardt and R.Willman, Zeits, Phys. 204_,62 (1967); A. G. Engelhardt, et al,,Phys. Rev. 135, A 1566TF964).
12. R. B. Bird, Transport Phenomena, 3ohn Wiley and Sons, Inc. (New York,
1960).
13. E. L. Rubin and S. Z. Burstein, 3. Computdtional Phys. 2, 178 (1967).
14. Y. B. Zel'Dovich and Y. P. Raizer, Soviet Physics 3ETP 20, 772 (1965).
15. Wee Woo and 3. S. DeGroot, "Analysis and Computations ofMicrowave-Atmospheric Interaction," University of California, Davis,Department of Applied Science, Plasma Research Group Report 1981.
16. P. Millet, et al., 3. Chem. Phys. 58, 5839 (1973).
17. Y. P. Raizer, Soviet Physics JETP 21, 1009 (1965).
B-14Sn - -- - e =a ..a m ' ..a aw~n f .~ 4 U U Jaf

FIGURE CAPTIONS
Fig. 1 The breakdown time and the electron temperature vs. the rmselectric field to density ratio E/nm.
Fig. 2 Gas breakdown near a reflecting surface showing the electrondensity pancakes for (a) one-and-a half, and (b) threewavelengths planar system. The critical density is nc = 1.5 x1013 cm- 3 and k = 7.33 cm-1.
Fig. 3 Time history of the ionization front in a planar system showingthe wave motion toward the radiation source. The microwaves areincident from the left onto a pre-ionized plasma near areflecting jurface on the right boundary. The normalizationparameters are the same as in Fig. 2.
Fig. 4 (a) The time averaged electric field square and (b) the electrontemperature vs. position. The normalization parameters are:Tel = 0.25 eV, k = 7.33 cm- 1 , and the arbitrary unit; of <E2 >
corresponds to an average intensity of 9.4 kW/cml.
Fig. 5 Time history of the ionization front in a spherical system. Themicrowaves are incident from the left boundary with an intensityof 5 kW/cm2 . The focused average power is 31.25 kW/cm2 at theright side boundary.
Fig. 6 (a) The time averaged electric field square and (b) the electrontemperature vs. position for the simulation of Fig. 5. Thenormalization parameters are the same as In Fig. 4.
Fig. 7 Framing camera data showing the motion of the ionization frontin a focused free nitrogen breakdown experiment. The top andbottom photographs were respectively taken 0.2- and 0.1- usecafter the first observable breakdown.
B-15

I10-7 ._ ..
10 - 10
To- 6
4
I' ,'-:w
101002o 3 4 67
10-1
E/flm (1.04 x 10-" V-cm2)
B- 16
-~ -- .-- - wh - -

Ci0
01CL
L0
Cu/ ) AiSN30NON13U1
B-17Z

0 uCNIa
C I -
H L U)
0.
(*U/'(U) A'-4LL OULO1
B-18)
0.9 500ns 11.25 Tn500ns
0.8 10.00
0.7 8.75
0.6 ! 7.50
~0.5 0.~6.25ww
S0.4 5
wD I.-
0.3W 3.75-
0.2 2.50-
0.1- 1.25-
0.0I 0.000 5 10 15 20 0 5 10 15 20
POSITION (ky) POSITION (ky)
FIGURE 4
B- 19

St
0.9 T 500ns 11.25 T 500ns
0.8 10.00
0.7 8.75
0.6 ! 7.50
0.5 _ 6.25-
* .4 o 5.00-• i °°4c-
0.3- -1 3.75-
0.2- 2.50 -
C 0.1- 1.25-
0.0L L0.00 L I I0 5 10 15 20 0 5 10 15 20
POSITION (ky) POSITION (ky)
cFIGURE 4
B-19

00
'I))
It
k.C
0-2
W, AV

0Cl)
0 )0a C
N C;
(CG~/~)d(AJL NOU13316
C')d
........ .......
( 8 e v ) 3 8 V O ~ c o
B-I2;

0
C.
c 10 cm
FIGURE 7
B -22

APPENDIX C
I
III

High Power Microwave Energy Coupling to Nitrogen During Breakdown
W. 1. Bollen, C. L. Yee, A. W. Alit, M. 3. Nagurney,
and M. E. Readt
ABSTRACT
Microwave energy coupling to nitrogen for breakdown conditions
have been Investigated. The experiments were performed in 25 Torr
nitrogen using a 35 GHz lus microwave pulse focused to 33 kW/cm2 . The
plasma created during breakdown was observed to travel towards the source
with a velocity of 4.6 x 106 cm/s. Spectroscopic measurements using a
nitrogen helium mixture indicate the average electron density over a 2 cm
cord to be 4.4 x 1012 cm- 3, and the electron temperature to be 3.8 eV.
Microwave cutoff was observed photographically and suggests the peak
electron density to be the collisional critical density. Computer
simulations were also performed and their results are in accord with the
experimental results.
t Navdl Research Laboratory

I. INTRODUCTION
Microwave breakdown studies of gaseous elements have been
carried out extensively over a wide range of pressures and for several
microwave frequencies using CW and pulsed radiation sources'. The main
emphasis on these studies was the determination of the breakdown power
threshold, and Its dependence on the gas pressure and the microwave
frequency. The coupling of microwave energy into the breakdown plasma and
neutral gas has not been studied in detail. The reason for this is that
until recently no high power microwave sources have been available to per-
form such studies. Most of the early work performed on breakdown
thresholds was performed using high Q cavities to obtain the necessary
electric field to break down the gas. Once breakdown of the gas occurred,
the Q of the cavity dropped and the Interaction changed. Using the NRL
high power gyrotron facility, we have been able to eliminate the need for
cavities and have performed experiments using a focused geometryZ to
examine the coupling of microwave energy to nitrogen gas during
breakdown. We have also modeled the experiments using a 1-D compuitersimulation code3. Simulations were performed In a spherical geometry
using a self-consistent, nitrogen chemistry, wave optics, microwave
breakdown simulation code, MINI.
The main emphasis of tnis paper Is on the Ionization front
created during nitrogen breakdown and Its motion and plasma properties as
observed experimentally. This motion Is not a movement of the plasma but
rather a movement of where the strongest ionization of the gas Is taking6
place. We believe it to be due to two effects: 1) delayed Ionization and
2) reflection from the plasma itself. Since the electron density IsIproprtinal to e ,whr10Is the local microwave Intensity,
breakdown occurs faster in those regions of high Intensity. In a focused
system this results in breakdown beginning at the focus. The breakdown
C-I

then moves back Into the lower Intensity region as time progresses. If
nothing else Is occurring, one would then observe a cone of plasma late In
time. However, the plasma is both absorptive and reflective. The
reflection results in standing wave patterns. Thus peaks X/2 apart are
seen to grow In time. The first peak is X/4 from the plasma surface. As
the density increases in these peaks, they become reflective and
absorptive, cutting off the microwave energy to peaks behind them. Again,
the density grows as e atI0, and, therefore, those peaks nearest the
focus initially grow fastest. If only one peak were reflecting, we would
expect X/2 structure. However, all the peaks reflect and, therefore, we
expect X1/4, the distance from the reflecting surface to the first electric
field maximum, to occur as well. Thus, In the experiment, we would
expect a background plasma due to delayed ionization with X/2, and X/4
struictures in it due to reflection. Reflection and absorption will also
prevent microwave penetration, so we expect to see the plasma disappear
behind the front of the Ionization. This results in the appearance of
motion. This motion may then occur as X/2 or X/4 Jumps, since once these
structures develop, the Intensity at these points Is larger, due to
reflection, than the background Intensity.
This Ionization front motion strongly affects the coupling of
microwave energy to the gas. It determines where the energy will be
absorbed, since its high density does not allow microwave penetratlon.
Also, since It is moving, it spreads the heating out In the gas. Motion
towards the micromave source has been observed by Salisbury and Flint 4 ,
and by Beust and Ford5 . The velocities were much slower, however, V - 3 x
103 cm/s for Salisbury and Flint's work, and V - 600 cm/s for Beust and
Ford's work. Raizer 6 advanced a theoretical treatment for the microwave
discharge propagation In high pressure air (lAtm) to explain Beust and
Ford's results under CW conditions. Other work by Scharfman, et a1 7 ,
observed that for low pressures the breakdown plasma became opaque to
microwaves, thus preventing penetration. We have observed the formation
of the front, Its motion, the prevention of microwave penetration, and
C-2 3
measured the plasma density and electron temperature of the front. Good
agreement was found between the experiment and the simulation model.
II. EXPERIMENT
A. Apparatus
The microwave energy coupling experiments were performed In dry
nitrogen using one of the NRL 35 0Hz, high power gyrotrons 8 . This gyro-
tron Is capable of 150 kW, lsec pulses at 100 pps. The Investigation,
however, was performed with a microwave power a 112 kW using S polari-
zation. The nitrogen pressure was variable. The data presented Is at a
pressure of 25 Torr which corresponds to v/O = 0.65, where v Is the
collision frequency for electron momentum transfer and w Is the natural
frequency of the microwave radiation. The microwave radiation is
Introduced into a test chamber using a conical horn with a focusing
dielectric lens In front, see Figure 1. The lens has a focal length of
11.2 cm and a diameter of 7.62 cm. The focal spot Is elliptical and has
an approximate gaussian distribution In intensity with half widths of 1.5
cm and 1.1 cm. The 3dB focal spot area Is approximately 1.7 cm2 . For 112
kW this Implies 33 kW/cm2 average power Inside the 3dB spot. Breakdown,
without a reflecting surface, was observed to cease at p - 75 Torr for P =
112 kW. Theoretically, we calculate an average power of 27 kW/cm2 is
required for breakdown at 75 Torr In nitrogen. This is in reasonable
agreement with an estimated Intensity of 33 kW/cm2 . We have, however,
ignored the gaussian spread and assumed an even distribution.
The breakdown experiments were performed with and without a
metal surface at the focal point. The planar metal surface could be
oriented perpendicular, 90%, or with an angle of 45* to the incident
radiation. The metal surface serves to set up a standing wave pattern in
C-3

front of the surface resulting In 4 Io at the peaks, where 10 is the
intensity of the incident radiation. Also, a thin dielectric could be
placed dff the metallic surface. This was used In determining the cause
of the plasma motion observed and will be discussed later.
Observation of the plasma was done using a TRW framing/streaking
camera. A 20 ns exposure time was used in the framing mode and a 2 Us ex-
posure time in the streaking mode. Due to the amount of light present,
multiple exposures were required in order to obtain easily visible photo-
graphs. However, some single shot experiments were performed and showed
that the results were reproducible shot-to-shot. The electron temperature
and density were measured by using a nitrogen-heli.um gas mixture. In a
pure nitrogen mixture, only second positive nitrogen bands were
observable. By introducing helium, the 5876A line could be used with the
nitrogen 3371A band to make the required density and temperature
measurements. An Oriel model 7240 monochrometer, f/3.7, with a 1OA
bandwidth was used. The monochromator output was measured using a 1P28
photcmultiplier with a base modified for nanosecond response time.
Absolute intensity calibrations were performed using a calibrated
deuterium arc lamp source9 for 3371A and a calibrated strip tungsten lamp
source1 0 for 5876A.
Our experiments were performed at 25 Torr where we had approxi-
mately nine times the intensity required to break down the nitrogen at the
focal spot. With the presence of a metal surface, a factor of four re-
duction In the power required for breakdown occurs due to the standing
wave pattern which is set up. Due to the focused nature of the experi-
ment, the standing wave pattern's intensity drops as the distance from the
surface is increased. For the 450 target, In fact, there Is only a small
region of standing waves perpendicular to the surface. It Is only for the
90° surface, or the case of a reflective plasma perpendicular to the
microwave beam, that a standing wave pattern back the length of the beam
line exists. A delayed breakdown from the surface back towards the lens
C-4
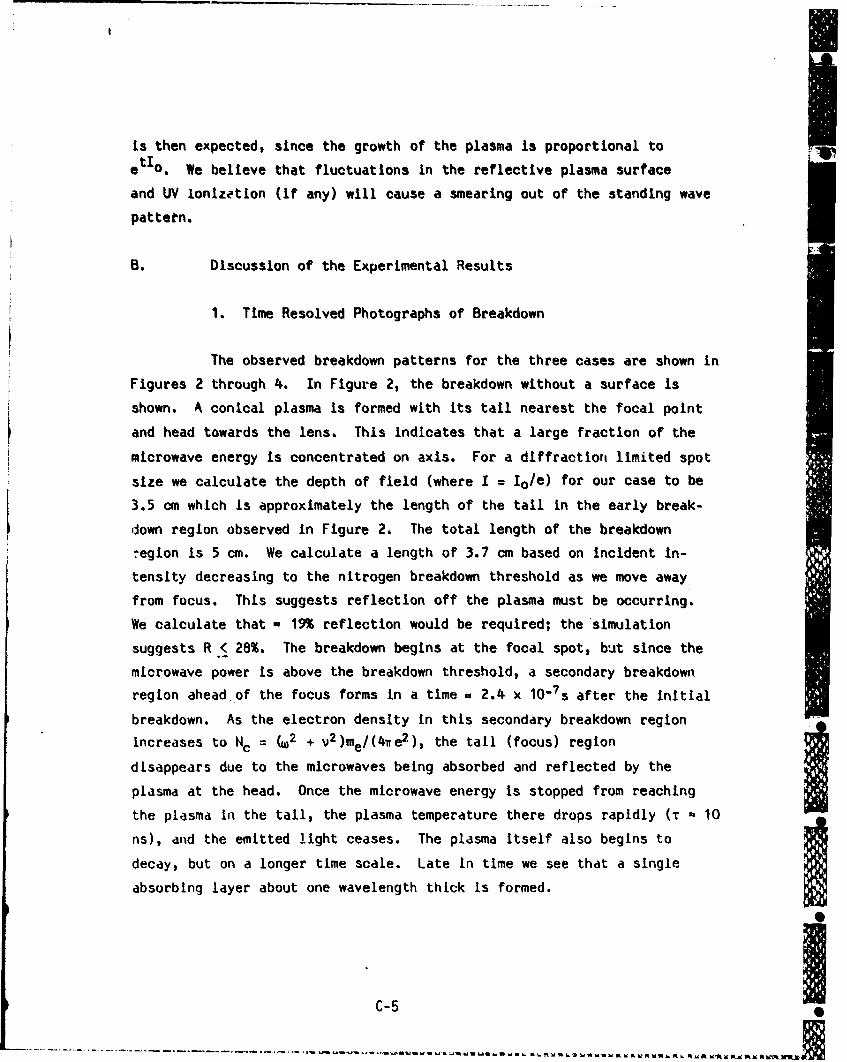
is then expected, since the growth of the plasma Is proportional toe•tI0. We believe that fluctuations In the reflective plasma surface
and UV lonizetion (if any) will cause a smearing out of the standing wave
patteMn.
B. Discussion of the Experimental Results
1. Time Resolved Photographs of Breakdown
The observed breakdown patterns for the three cases are shown in
Figures 2 through 4. In Figure 2, the breakdown without a surface Is
shown. A conical plasma is formed with Its tail nearest the focal point
and head towards the lens. This Indicates that a large fraction of the
microwave energy Is concentrated on axis. For a diffractiont limited spot
size we calculate the depth of field (where I = Io/e) for our case to be
3.5 cm which Is approximately the length of the tall In the early break-
down region observed In Figure 2. The total length of the breakdown
-egion Is 5 cm. We calculate a length of 3.7 cm based on Incident In-
tensity decreasing to the nitrogen breakdown threshold as we move away
from focus. This suggests reflection off the plasma must be occurring.
We calculate that - 19% reflection would be required; the simulation
suggests R < 28%. The breakdown begins at the focal spot, but since the
microwave power Is above the breakdown threshold, a secondary breakdown
region ahead of the focus forms In a time a 2.4 x 10⁻⁷s after the Initial
breakdown. As the electron density In this secondary breakdown region
Increases to Nc = (W2 + V2)me/(4we 2 ), the tall (focus) region
disappears due to the microwaves being absorbed and reflected by the
plasma at the head. Once the microwave energy Is stopped from reachingthe plasma In the tall, the plasma temperature there drops rapidly (T 10
ns), and the emitted light ceases. The plasma Itself also begins to
decay, but on a longer time scale. Late In time we see that a single
absorbing layer about one wavelength thick Is formed.
C-5

Figure 3a shows the framing camera data for the perpendicular
surface experiment and Figure 3b shows a streak photograph for the same
case. We expect a standing wave to be set up off the surface with the
first maximum X/4 from the surface and with the rest of the maxima spaced
X/2 apart. This can be seen In Figure 3a. Also observed Is a "blooming"
of the visible plasma near the target. We believe this Is an effect due
to the focusing. The microwave beam becomes more Intense near focus.
Therefore, the diameter of the beam capable of breaking down the plasma
Increases. Similar to the no target case, an absorbing front travels away
from the target towards the microwave source. From the displacement In
the streak photograph, we calculate that the plasma moves away from thesurface with a velocity a4.6 x 106 cm/s. It continues to Move back along
the microwave beam until the beam energy decreases sufficiently (due todefocusing) that the beating with any reflected microwaves Is below the
breakdown threshold. This "stagnation point" is also observed for the 45*surface. Similar behavior Is also observed in the computer simulation.
The 45* data Is shown In Figure 4. It Is similar to the 90'
data except fringes occur XI(2 cos 8) apart, 6 = 45% with the firstfringe at 11(4 cos 8) from the surface. Again, an absorbing front moving
along the beam axis Is observed. This occurs as a result of energy re- .flected by the plasma along the beam. Since we are far above threshold,
we believe a planar plasma, perpendicular to the beam, grows near the tar-
get and is Initiated by the plasma growth at the standing wave maxima.
Its density grows (t4e__-vNc) and It becomes reflective, setting up
standing waves. Plasma density builds at these maxima cutting off
microwave penetration, and the process repeats. Visually, this appears as
plasma motion. We would expect the motion to jump in either X/2 or X/4
steps. Some of the 45' data shows 1/2 bars behind the main moving
plasma. In general, however, this is not observed. The X/2 spacing is at
about the limit of resolution. Further, we believe that fluctuations In
the reflective plasma surface cause a smearing out of the standing wave
C-6

patter;; and results in the more solid like appearance we observe for the
moving plasma.
One other Possible explanat ion for the front motion Is that UV Iemission causes Ionization to occur In front of the plasma. This new
plasma absorbs microwaves, heats up, and then the process repeats. This
would result In a uniform smear with no X/2 structure. Our data Is some-
what suggestive of this. To check this Idea we placed a thin dielectric a
few wavelengths of f the metallic surface to stop UV penetration but allow
microwave transmission. If UV Ionization was the method of propagation,
we expected the plasma to stop moving when It hit the dielectric. Theplasma moved through the dielectric barrier. We, therefore, believe the
motion to be due to reflection from the plasma Itself resulting in Ioni-
zation fronts. However, Ionization due to UV may be responsible for some
of the smearing of the X/2 and X/4 structure. The UV Ionization mean free
path Is - 0.05 cum CX/2 for our conditions.
For the ItS' target case the breakdown was examined as the power
was decreased. As the power was decreased, the ionization front was ob-
served to stagnate closer and closer to the target, as expected. When the
Incoming power was 20 kW, m 5.9 kW/cm2, we observed only two fringes and
no apparent Ionization front. At 30 kW the front reappeared. Incident
radiation on a metal surface for breakdown to occur at 25 Torr Is a 0.75kW/cm2. However, we are only twice the free nitrogen breakdown threshold
of 3 kW/cm2, and this will be the dominant threshold for Ionization front
travel due to delayed ionization.
2. Spectroscopic Measurement of Density and Temperature
In order to measure the temperature and density of the
electrons, the absolute Intensity of the nitrogen second positive band,
3371A, was compared to the absolute Intensity of the neutral helium lineI
at 5876A. A mixture of the helium and nitrogen was used to perform this
C-7i

experiment. The 3371A band Corresponds to the (0,0) transition in the
second positive band system'of N2 . We obtained the electron temperature
"rom the ratio of the two lines1 1 and the electron density from the
absolute Intensity measurement and the deduced electron temperature.
For an optically thin line and assuming a steady state coronal
model, the band intensity at 3371A can be expressed as:
NHN X A E° L
I e 2 oc °t0 0,0 (1)u= A + q N2 (
where N2 Is the density of the nitrogen molecules in the ground state,
Xo c Is the emission excitation rate coefficient, Ao,o Is the
transition rate for the band at 3371A and Ao Is the total transition
rate for the excited state, Eo,o is the photon energy, L is the length
of the emitting plasma, and q Is the quenching rate coefficient of the
excited state by the neutral species. A similar equation can be written
for the intensity of the helium line. The excitation rate coefficients
for 3371A and 5876A were obtained using the measured cross sections 12 , 1 3
averaged over a Maxwellian electron velocity distribution. The transition
rates for 3371A and for 5876A are from Refs. (1') and (15) respectively.
The quenching rate coefficient 1 6 for 3371A by N2 is 1.15 x 10⁻¹¹ cm3 /sec.
The measured absolute intensities of 3371A and 5876A in a mix-
ture of 15 Torr N2 and 19 Torr He were 28.36 W/cm2 sr and 5.6 x 10⁻²
W/cm2 sr. Using the above analysis, we obtain Te = 3.8 eV and Ne = 4.4
x 1012 cm- 3 for the average density over a 2 cm chord. If quenching of
the helium line by nitrogen Is Included the electron temperature changes
slightly, Te a 4.1 eV, with a corresponding slight decrease In the
calculated electron density. This electron density is in reasonable
agreement with Langmulr probe data, Ne - 2 x 1013 cm3 and simulation
predictions, Ne = 3.6 x 1013 cm-3 since these last two are peak local
densities. It Is reasonable to expect that the peak density is at least
four times larger then the average density since the density is
C C- -8

proportional to eIot and the microwave Intensity is gaussian
across the chord. (The two centimeter cord ia slightly larger then the
FWHM of the Intensity gausslan.) A comparison of the absolute Intensity
of the 3371A nitrogen band for pure N2 as observed experimentally (Iexp =
1.12 x 10²⁰ eV/(P.m2 -s-sr)) agreed reasonably well with the simulation
predictions for similar conditions (Isim = 3.6 x 10²⁰ eV/(s-cm2 -sr)).
As expected, the simulation also predicted a lower electron temperature,
Te - 3.25 eV, for the pure N2 case.
III. COMPUTER SIMULATION
The breakdown experiments were modeled neglecting hydrodynamic
motion and solving the electric field In spherical geometry1 7 . Nitrogen
breakdown experiments with no surface, Figure 2, show the microwaves
penetrating approximately six wavelengths Into the tenuous plasma early in
time. The experimental light emission shows t. e electric field is
essentially close to planar for regions near the focal point. However,
for distances greater than 4 cm from the focal point, the electric field
shows an abrupt transition to a spherical (converging) geometry. Theratio of the Inner and outer radius In a spherical system defines an
aspect ratio. The converging geometry of the experiment defines an aspect
ratio of 3.2 In the converging region and 1.9 In the diffraction limited
focal region (approximately planar). We modeled this using an aspect
ratio of 2.5 In the simulation. (The simulation has shown that for larger
aspect ratios the behavior is similar, but the front does not travel as
far.) The simulation used a O.5us pulse length, Tp, at an angular
frequency, w, of 2.2 x 10)1 sec-1 and an average power of 31.25 kW/cm2 at
tUe focal point. The region modeled wds three wave lengths long (2.57
cm), had no reflecting surface, and a nitrogen pressure of 25 Torr. Thissimuldtion showed ionization front motion similar to that seen
experinmentally in Figure 2. This is shown In Figure 5 as a time history
of the plasma density profile. The electric field drops rapidly beyondLhe peak electron density Nemax -- 3.6 x 1013 cm" 3 and penetrates about
C-9

one and a half wavelengths into the overdense plasma (Figure 6a). The
peak electron and gas temperatures are Te a 3.5 eV (Figure 6b) and Tg
< 0.027 eV, respectively. Breakdown simulations with hydrodynamic effects
show similar features.
This same simulation was repeated with a reflecting surface at 0
the focal point. Figure 7 shows the simulation results for the electron
density. Close to the reflecting surface, the radiation Is essentially
planar and exhibits the characteristic standing wave pattern. Electron
density "pancakes" form at the interference maximum of the electric
field. However, at high power the electron density of the pancakes rises
to Ne Ž Nc at which time the radiation Is partially reflected from the
density pancakes. This shifts the breakdown patterns in increments of a
quarter-wavelength. The quarter-wavelength fine structure of Figure 8 "
cannot be resolved experimentally. Similar to the frer.-nitrogen
breakdown, approximately 79% of the Incident microwave energy is
absorbed. Early in time, the reflecting surface acts to enhance the
field. However, once the density rises to absorb the radiation, the field 0
reflects from the density pancakes. Though the reflection was small (R <
28%), the effects ;of the reflection can also be seen for the no surface
simulation In the quarter-wavelength fine structure of Figure 5.
The ionization front Is observed to stagnate at about the same
position In the experiment with and without a surface. This would only be
true if the target is essentially decoupled from the microwave radiation
and the absorption efficiencies are approximately equal. The simulations
show this to be true with absorption efficiencies of 79% and 72% for
breakdown with and without a surface. The simulations predict a front
motion of V w 5 x 106 cm/s early in the pulse and slowing to 2 x 106 cm/s
when the simulation ends It, O.5ps. This gradual slowing of the ionization
front is consistent with what is seen experimentally in Figure 3b.
c-1I

IV. CONCLUSION
In conclusion, we have observed that for I > IB, Ionization
fronts form and move towards the source at a velocity 4 4.6 x 106 cm/s.
These ionization fronts result from both delayed ionization and reflection
of microwave energy from the front. The front density can become quite
large and Is seen to cut-off microwave penetration In about one wavelength
In late time. The average chord plasma density was spectroscopically
measured to be Ne = 4.4 x 1012 cm-3 and the electron temperature to be
Te = 3.8 eV for a nitrogen-helium mixture. Langmuir probe measurements
of the density gave reasonable agreement with peak densities for pure
nitrogen of Ne w 2 x 1013 cm- 3 . The cut-off of microwave penetration
observed photographically suggests an electron density Ne = Nc = 2.2 x
1013 cm" 3 . We expect the electron temperature In the gas mixture to be
higher since N2 vibrational and low lying electronic states act to
decrease Te and monoatomic He has no such states. Reasonable
agreement was seen with the simulation for the velocity of the ionization
front, Ne, Te, and 13371. The simulation predicts small reflection, R
< 28%, and low gas temperature, Tg < 0.027 eV.
Ic-li 0e
FIGURE CAPTIONS
Fig. 1 Schematic of nitrogen breakdown experiment. Shown as an insertis the 3dB focal spot.
Fig. 2 Framing photographs of breakdown 2at 25 Torr N2 for no surfacepresent, Io = 112 kW or 33 kW/cm at focus. The microwavesare incident from the left. Frames are 100 ns apart and have a20 ns exposure time. Time shown on right refers to the delayafter the first observable breakdown and not the microwavepulse.
Fig. 3a Framing photographs at 25 Torr N2 for 90* metal surface presentat focus, I0 = 112 kW. Times shown on right refer to thedelay after first observable breakdown.
Fig. 3b Streaking photograph at 25 Torr N2 for 90° metal surface presentat focus, I0 = 112 kW. Streaking time was 2Us. The velocityof motion for the ionization front is measured to be 4.6 x 106cm/s from the photograph.
Fig. 4 Framing photographs at 25 Torr N2 for 45" metal surface, Io =112 kW. Times shown on right refer to the delay after the firstobservable breakdown.
Fig. 5 Time history of the ionization front in a spherical system. Themicrowaves are incident from the left with an intensity of 5kW/cm2 . The focused average power is 31.25 kW/cm2 at the righthand boundary. An aspect ratio of 2.5 was used to model theexperiment and Nc is the collisionless critical density.
Fig.6a Time average intensity for parameters of Figure 5. Units are inS= (Vos/Veo)2 such that a = 1 corresponds to I = 9.4kW/cm2 .
Fig. 6b Electron temperature for parameters of Fig. 5 where Teo = 0.25eV.
Fig. 7 Electron density profile at t = 0.26ps into the pulse. Sameparameters as in Fig. 5 except with a reflecting surface.
C-12

U38UOS2IV 1U
CDL00
H 0-<LL
Z~L :DH
w CCD
(f))
N LN
LC C)
C-01

0.5
0.3
F 0.20.1
0
10 cm
FIGURE 2I
C- 14
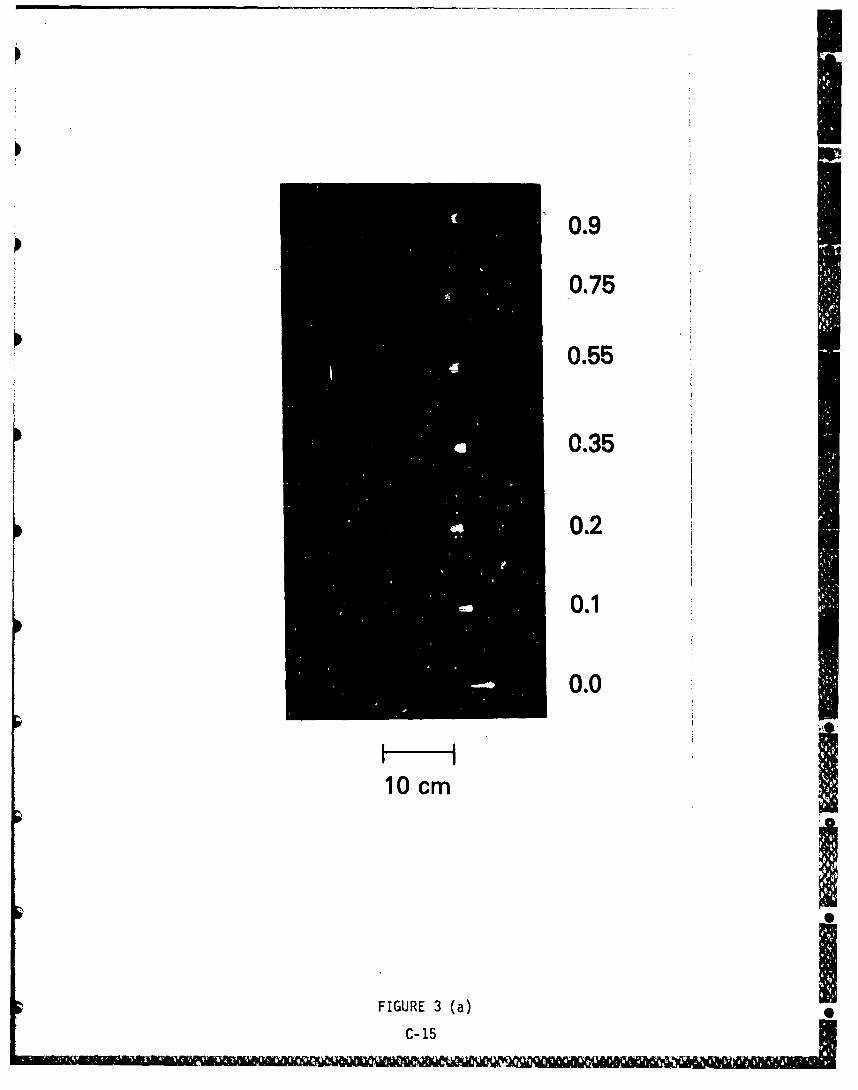
0.9
0.75
0.55
0.35
0.2
0.1
0.0
h- II
10 cm
a
FIGURE 3 (a) IC- 15

2/,s
10 cm
I
FIGURE 3(b)
C- 16

1.0
0.7
0.5
0.35
0.25
0.1
0
10 cm
FIGURE 4
C-17

Itn
Ido
Lo
U)U
I--
Lo
La'
Inn
Inn
CD
Lo In usp
('u/*U) AIISN30 NOV03-13
C- 18

0
00
C4)
oz
(00
0.L
ossno 0
' ~ vu C-19

4.5--
T- 257ns
4.0-
3.5-
3.0
- 2.5-z0
0z 2.0-I---J
Lii 1.5-
1.0-
0.5-
0.0I0.0 5.0 10.0 15.0 20.0
POSITION (ky)
FIGURE 7C- 20

0 ACKNOWLEDGEMENTS
We would like to acknowledge many useful discussions with Dr.
• E. A. McLean and Dr. 3. R. Greig on optical diagnostics. We also want to
acknowledge Dr. T. 3. Wieting and 3. L. DeRosa for allowing us to use
their microwave chamber and for useful technical discussions. Thetechnical assistance of D. Hardesty was greatly appreciated. This work
was supported by Naval Sea System Command under a contract to the NavalResearch Laboratory.
0
C
C-21

REFERENCES
1. A. D. MacDonald, Microwave Breakdown In Cases, Wiley, New York,(1966).
2. This technique is also being used to investigate the coupling ofenergy to surfaces through microwave supported plasmas by T. 3.Welting et al. This work will be discussed In a forth comingpublication. T. 3. Wieting, 3. L. DeRosa, and M. E. Read.
3. C. L. Yee and A. W. All, "Microwave Energy Deposition, Breakdownand Heating of Nitrogen and Air," NRL Memo Report 4617, (1981).
4. W. W. Salls•',ry and W. Flynt, "Microwave Energy Coupling Through
Re-entry Plasma," Varo, Inc., RADC-TR-64-575, (December, 1964).
5. W. Beust and W. L. Ford, Microwave 3., (10), p.91, (1961).
6. Y. P. Ralzer, Soy Phy 3ETP, 34, p.114, (1972).
7. W. E. Scharfman, W. C. Taylor, and T. Morita, IEEE-Trans.Antennas Propag., 12, p.7O9, (1964).
8. M. E. Read, R. M. Gilgenbach, R. Lucey, K. R. Chu, A. T. Drobot,"Spatial and Temporal Coherence of a 35 GHZ Gyromonotron Usingthe TE0, Circular Mode," IEEE Trans. Microwave Theory Tech., 28,p.875, (1980).
9. W. R. Ott, P. Fieffe-Prevost, and W. L. Wiese, Appl. Opt. 12,
p.1618, (1973).
10. C. R. Barber, 3. Sci. Instrum., 2.3, p.238, (1946).
11. H. R. Griem, Plasma Spectrostrophy, McGraw-Hill, New York,(1964).
12. M. Imami and W. Brost, 3. Chem. Phys., 6.1, p.1115, (1974).
13. R. M. St. 3ohn, F. L. Miller, and C. C. Lin, Phys. Rev. A, 134,p.A888, (1964).
14. R. Nicholls, Ann. Geophys., 20, p.144, (1964). I15. W. L. Wiese, M. Smith, and B. M. Glenn, "Atomic Transition
Probabilities," Vol. 1, National Bureau of Standards ReferenceData Systems NSRDS-NBS-4, (1966).
16. P. Millet, Y. Salamero, H. Brunet, 3. Galy and D. Blanc, 3.Chem. Phys., L__8, p.5839, (1973).
17. C. L. Yee, A. W. All, and W. M. Bollen, "Microwave Energy
Coupling In a Nitrogen Breakdown Plasma," to be published as anNRL memo.
C-22