Embed Size (px)
Citation preview

2011 Level III Guideline Answers Morning Session - Page 1 of 39
LEVEL III
Question: 1 Topic: Individual PM/Behavioral Minutes: 15
Reading References:
2011 Level III, Volume 2, Study Session 3, Reading 7, pp. 5–12 “Heuristic-Driven Bias: The First Theme,” Beyond Greed and Fear: Understanding Behavioral Finance and the Psychology of Investing, Hersh Shefrin (Oxford University School Press, 2002) 2011 Level III, Volume 2, Study Session 3, Reading 8, pp13–20 “Frame Dependence: The Second Theme,” Beyond Greed and Fear: Understanding Behavioral Finance and the Psychology of Investing, Hersh Shefrin (Oxford University School Press, 2002) 2011 Level III, Volume 2, Study Session 4, Reading 16, pp. 246–250 “Estate Planning in a Global Context,” Stephen M. Horan, CFA, and Thomas R. Robinson, CFA (CFA Institute, 2009).
LOS:
2011-III-3-7-a 7. “Heuristic-Driven Bias: The First Theme”
The candidate should be able to
a) evaluate the impact of heuristic-driven biases (including representativeness,
overconfidence, anchoring-and-adjustment, aversion to ambiguity) on investment
decision making.
2011-III-3-8-a 8. “Frame Dependence: The Second Theme”
The candidate should be able to:
a) explain how loss aversion can result in investors’ willingness to hold on to
deteriorating investment positions;
b) evaluate the impacts that the emotional frames of self-control, regret minimization, and money illusion have on investor behavior.
2010-III-4-16-a, b, f, g 16. “Estate Planning in a Global Context”
The candidate should be able to:
a) discuss the purpose of estate planning and explain the basic concepts of domestic
estate planning, including estates, wills, and probate;
b) explain the two principal forms of wealth transfer taxes and discuss the impact of
important non-tax issues, such as legal system, forced heirship, and marital
property regime;
c) determine a family’s core capital and excess capital, based on mortality probabilities and Monte Carlo analysis;

2011 Level III Guideline Answers Morning Session - Page 2 of 39
LEVEL III
Question: 1 Topic: Individual PM/Behavioral Minutes: 15
d) evaluate the relative after-tax value of lifetime gifts and testamentary bequests; e) explain the estate planning benefit of making lifetime gifts when gift taxes are paid by the
donor, rather than the recipient;
f) evaluate the after-tax benefits of basic estate planning strategies, including
generation skipping, spousal exemptions, valuation discounts, and charitable gifts;
g) explain the basic structure of a trust and discuss the differences between revocable
and irrevocable trusts;
h) explain how life insurance can be a tax-efficient means of wealth transfer; i) discuss the two principal systems (source jurisdiction and residence jurisdiction) for
establishing a country’s tax jurisdiction; j) discuss the possible income and estate tax consequences of foreign situated assets and
foreign-sourced income; k) evaluate a client’s tax liability under each of three basic methods (credit, exemption, and
deduction) that a country may use to provide relief from double taxation; l) describe the impact of increasing international transparency and information exchange on
international estate planning.

2011 Level III Guideline Answers Morning Session - Page 3 of 39
LEVEL III
Question: 1 Topic: Individual PM/Behavioral Minutes: 15
Guideline Answer:
PART A
Template for Question 1-A
Note: Consider each objective independently.
Objective
Determine which
trust (irrevocable,
revocable, or both
equally) is more
appropriate for
each objective.
(circle one)
Justify your response with one reason for each
objective.
1. Sell USD 1.0 million of Buildco shares while minimizing total taxes.
irrevocable
revocable
both equally
Becker should sell the shares in the revocable trust. Current taxes on realized capital gains will be the same for either trust (20% × USD 1.8 million). Assets in the irrevocable trust are not subject to estate tax. Assets in the revocable trust are subject to estate taxes upon Becker’s death, at which time the cost basis will be increased to market value. Thus, total taxes are minimized by selling from the revocable trust.
2. Put additional assets into a trust to protect those assets from potential future legal claims against Becker.
irrevocable
revocable
both equally
Becker remains the owner of revocable trust assets. These would be at legal risk if a claim were made against him. Irrevocable trust assets are no longer owned by the settlor and hence are out of the reach of any claimants.

2011 Level III Guideline Answers Morning Session - Page 4 of 39
LEVEL III
Question: 1 Topic: Individual PM/Behavioral Minutes: 15
PART B
Template for Question 1-B
Note: Consider each bias independently. Use each discussion only once.
Behavioral bias
Identify the
discussion in which
one of the
participants best
illustrates each of
the following
behavioral biases
(circle the
discussion number
from Exhibit 1).
Justify each response with one reason.
i. representativeness
1 2 3 4
Representativeness refers to judgments based on stereotypes. Becker may be overly optimistic that Rolling Mix Cement shares will perform well because the CEO of Rolling Mix Cement performed well at Buildco.
ii. frame dependence
1 2 3 4
Frame dependence refers to investor behavior that depends on the way decisions are framed. Becker holds many positions valued below cost. This may be evidence of frame dependence (loss aversion). His investment decisions are framed to avoid losses rather than continuously reevaluate holdings.
iii. aversion to ambiguity
1 2 3 4
People prefer the familiar to the unfamiliar. Frost prefers the certainty of bond cash flows to the uncertainty of risky asset cash flows, even though investors might receive appropriately higher returns for assuming that risk.

2011 Level III Guideline Answers Morning Session - Page 5 of 39
LEVEL III
Question: 2 Topic: Individual PM Minutes: 23
Reading References:
2011 Level III, Volume 2, Study Session 4, Reading 14, pp. 97–167 “Managing Individual Investor Portfolios,” Ch. 2, James W. Bronson, Matthew H. Scanlan, and Jan R. Squires, Managing Investment Portfolios: A Dynamic Process, 3rd edition (CFA Institute, 2007). LOS: 2011-III-4-14-a, j, k, l, n 14. “Managing Individual Investor Portfolios”
The candidate should be able to:
a) discuss how source of wealth, measure of wealth, and stage of life affect an
individual investors’ risk tolerance;
b) explain the role of situational and psychological profiling in understanding an individual investor;
c) compare and contrast the traditional finance and behavioral finance models of investor decision making;
d) explain the influence of investor psychology on risk tolerance and investment choices; e) explain the use of a personality typing questionnaire for identifying an investor’s
personality type; f) compare and contrast risk attitudes and decision-making styles among distinct investor
personality types, including cautious, methodical, spontaneous, and individualistic investors;
g) explain the potential benefits, for both clients and investment advisers, of having a formal investment policy statement;
h) explain the process involved in creating an investment policy statement; i) distinguish between required return and desired return and explain the impact these have
on the individual investor’s investment policy;
j) explain how to set risk and return objectives for individual investor portfolios and
discuss the impact that ability and willingness to take risk have on risk tolerance;
k) identify and explain each of the major constraint categories included in an
individual investor’s investment policy statement;
l) formulate and justify an investment policy statement for an individual investor;
m) determine the strategic asset allocation that is most appropriate for an individual investor’s specific investment objectives and constraints;
n) compare and contrast traditional deterministic versus Monte Carlo approaches to
retirement planning and explain the advantages of a Monte Carlo approach.

2011 Level III Guideline Answers Morning Session - Page 6 of 39
LEVEL III
Question: 2 Topic: Individual PM Minutes: 23
Guideline Answer:
PART A
The after-tax nominal rate of return required for the Beckers’ first year of retirement is calculated by dividing the Year 1 Net Required Cash Flow by the Beginning of Year 1 Net Investable Assets, and then adjusting for expected inflation. Cash Flows Year 1 of Retirement
Michael’s after-tax company pension $48,000 Living expenses (250,000 × 1.03 inflation) –257,500
Year 1 Net required cash flow –$209,500
Net Investable Assets
Inheritance $8,000,000 Mortgage debt repayment –3,500,000 Consumer debt repayment –150,000
Investable asset base (beginning Year 1) $4,350,000
Return Objective
Year 1 after-tax required cash flow $209,500
Divided by investable asset base $4,350,000
Equals after-tax real return 4.82%
Plus expected inflation 3.00% Equals after-tax nominal rate of return 7.82%
or geometrically { (1.0482)(1.03) – 1 } 7.96%

2011 Level III Guideline Answers Morning Session - Page 7 of 39
LEVEL III
Question: 2 Topic: Individual PM Minutes: 23
PART B
There are several factors that decrease the Becker’s risk tolerance:
• The Beckers, being retired, are in the maintenance stage of life. They do not intend to work; no additional income flows are expected.
• Michael Becker has a small pension relative to living expenses. The Beckers must depend primarily on their investment portfolio.
• The Beckers have a high level of spending relative to investable assets, making them less able to tolerate volatility and negative short-term returns.
• The Beckers want their portfolio to be invested conservatively (low willingness to take risk).
• The Beckers inherited their wealth (passive source of wealth), which may result in a reduced willingness to take risk.
PART C
i. Liquidity: The Beckers have USD 3,650,000 immediate cash needs for debt repayments plus USD 209,500 in net living expenses for the first year of retirement (USD 257,500 – USD 48,000 Michael’s annual pension), or a total of USD 3,859,500. Ongoing liquidity needs will be USD 209,500 adjusted for inflation. ii. Time horizon: The Beckers are retiring at a young age, and do not expect expenses to change until one of them dies. Therefore, their time horizon is long-term, two-stage: (1) when they are both alive, and (2) after one of them dies. The Beckers’ time horizon may also be considered long-term, three-stage. In this case, their beginning liquidity needs are the first stage. The second and third stages would be the remainder of their lives as noted above.

2011 Level III Guideline Answers Morning Session - Page 8 of 39
LEVEL III
Question: 2 Topic: Individual PM Minutes: 23
PART D
i. Portfolio A will better allow the Beckers to achieve their primary financial goal of maintaining their living standard until both have died. This is because the portfolio has a higher probability of achieving a positive terminal value. ii. 1. Frost should incorporate expected capital market assumptions into her simulation. Historical
data may not fully reflect the range of possible future investment returns. Historical data also may include unlikely outliers.
2. Frost should model the performance of the portfolio’s specific assets rather than the performance of its asset classes. The portfolio’s performance and risk may differ from asset class performance and risk. Asset class simulation could also exclude important aspects of asset-specific investment returns such as fees and tax efficiencies.

2011 Level III Guideline Answers Morning Session - Page 9 of 39
LEVEL III
Question: 3 Topic: Institutional Portfolio Management Minutes: 26
Reading References:
2011 Level III, Volume 2, Study Session 5, Reading 20 “Managing Institutional Investor Portfolios,” Ch. 3, R. Charles Tschampion, Laurence B. Siegel, Dean J. Takahashi, and John L. Maginn, Managing Investment Portfolios: A Dynamic Process, 3rd edition (CFA Institute, 2007). LOS: 2011-III-5-20-h, i, j, l, m, n 20. “Managing Institutional Investor Portfolios”
The candidate should be able to a) contrast a defined-benefit plan to a defined-contribution plan, from the perspective of the
employee and employer and discuss the advantages and disadvantages of each; b) discuss investment objectives and constraints for defined-benefit plans; c) evaluate pension fund risk tolerance when risk is considered from the perspective of the
(1) plan surplus, (2) sponsor financial status and profitability, (3) sponsor and pension fund common risk exposures, (4) plan features, and (5) workforce characteristics;
d) formulate an investment policy statement for a defined-benefit plan; e) evaluate the risk management considerations in investing pension plan assets; f) formulate an investment policy statement for a defined-contribution plan; g) discuss hybrid pension plans (e.g., cash balance plans) and employee stock ownership
plans;
h) distinguish among various types of foundations, with respect to their description,
purpose, source of funds, and annual spending requirements;
i) compare and contrast the investment objectives and constraints of foundations,
endowments, insurance companies, and banks;
j) formulate an investment policy statement for a foundation, an endowment, an
insurance company, and a bank;
k) contrast investment companies, commodity pools, and hedge funds to other types of institutional investors;
l) discuss the factors that determine investment policy for pension funds, foundations,
endowments, life and nonlife insurance companies, and banks;
m) compare and contrast the asset/liability management needs of pension funds,
foundations, endowments, insurance companies, and banks;
n) compare and contrast the investment objectives and constraints of institutional
investors given relevant data, such as descriptions of their financial circumstances
and attitudes toward risk.

2011 Level III Guideline Answers Morning Session - Page 10 of 39
LEVEL III
Question: 3 Topic: Institutional Portfolio Management Minutes: 26
Guideline Answer:
PART A
i. The return objective for the WU endowment is to earn a rate of return sufficient to maintain the real value of its assets and to support 25% of the university’s annual operating expenses.
ii. The required rate of return for the WU endowment combines the 5% spending rate, the
higher education inflation rate of 4%, and annual management expense of 0.55%.
Calculated using a multiplicative formulation; the required return is:
[ (1.05) × (1.04) × (1.0055) ] – 1 = 0.09801 or 9.80%
OR by the arithmetic formulation:
(0.05) + (0.04) + (0.0055) = 0.0955 or 9.55%

2011 Level III Guideline Answers Morning Session - Page 11 of 39
LEVEL III
Question: 3 Topic: Institutional Portfolio Management Minutes: 26
PART B
Template for Question 3-B
Note: Consider each factor independently.
Factor
Determine how a
change in each of the
factors, holding all else
constant, affects the
risk tolerance
(increases, decreases,
does not change) for the
WU endowment.
(circle one)
Justify each response with one reason.
i. private donations
increases
decreases
does not change
Increases risk tolerance: External funding (including private donations) is a source of liquidity. As donations increase, a lower proportion of invested assets is required to meet current spending needs, and the endowment can assume greater risk. Decreases risk tolerance: As donations decrease, a higher proportion of invested assets is required to meet current spending needs, and the endowment must assume lower risk.
ii. expected inflation
increases
decreases
does not change
Increases risk tolerance: An increase in expected inflation may cause the endowment to demand a higher real return on investments to compensate for a perceived increase in risk. This can lead to an increase in expected long-term real returns for the portfolio. As expected real returns increase, with the nominal spending rule held constant, the risk tolerance of the endowment increases. Decreases risk tolerance: An increase in expected inflation may cause the endowment to use inflation hedges, or to hold more liquid assets in the portfolio to meet expected increased spending needs. This reduction in risk exposure may be considered a reduction in risk tolerance.

2011 Level III Guideline Answers Morning Session - Page 12 of 39
LEVEL III
Question: 3 Topic: Institutional Portfolio Management Minutes: 26
PART C
i. The liquidity constraint is defined by the endowment’s current spending need. This is 5% of the beginning of period market value of the asset portfolio, or 25% of WU’s operating expenses. For the current year, the endowment’s liquidity needs are USD 37.5 million. (Management fees of 0.55% can also be considered liquidity needs, increasing required spending to 5.55% of beginning of period market value of the asset portfolio, or USD 41.625 million.)
ii. The WU endowment fund has a long-term time horizon as its goal is to maintain the real
value the endowment in perpetuity.

2011 Level III Guideline Answers Morning Session - Page 13 of 39
LEVEL III
Question: 3 Topic: Institutional Portfolio Management Minutes: 26
PART D
Template for Question 3-D
Determine which one
of Bergen’s strategic
actions is:
Bergen’s
strategic
actions (circle
one)
Justify each response with one reason.
i. least likely to assist the endowment in achieving its primary goal.
1 2 3
Revising the portfolio’s asset allocation to decrease its risk reduces the expected return on the asset portfolio and the WU endowment will be less likely to maintain its real value over the long-term.
ii. most likely to reduce the volatility of the endowment’s funding of WU’s operating expenses.
1 2 3
Adopting a rolling three-year average spending rule, based on the endowment’s beginning-of-year market value for the last three years, spreads or smooths the impact of a particular year, thereby reducing the volatility of the endowment’s funding of WU’s operating expenses.

2011 Level III Guideline Answers Morning Session - Page 14 of 39
LEVEL III
Question: 3 Topic: Institutional Portfolio Management Minutes: 26
PART E
Factors that suggest SU may have a higher risk tolerance than WU: 1. SU’s endowment has a lower relative commitment to SU’s operating budget than WU’s
endowment to WU’s operating budget (10% versus 25%). Hence, SU is less likely to face a spending obligation short-fall and, holding all else constant, suggests that SU’s risk tolerance is higher than WU.
2. SU’s endowment is committed to covering the SU operating deficit, but only up to its
spending rule. If the operating deficit (in dollar terms) is smaller than its spending rule (in dollar terms), it will spend less. Therefore, in any period where it is required to spend less than 5%, it can accumulate real value. Given WU’s secondary goal of funding 25% of the operating budget, it is less likely that WU’s spending will be less than 5%.
3. SU’s operating expenses are expected to grow at a slower rate than WU’s, thus SU is less
likely to face a spending obligation short-fall in the future and, holding all else constant, suggests that SU may have a higher risk tolerance than WU.
4. Donations have been increasing for SU and decreasing for WU. SU requires fewer liquid
assets and relies less on portfolio returns to satisfy spending needs. Thus, SU’s risk tolerance is higher than WU.
5. SU’s investment manager is evaluated with a longer-term return metric. Hence, SU’s
manager has less short-term performance pressure, and is able to tolerate greater short-term volatility.
6. SU receives government funding whereas WU relies on a private funding. Therefore, SU has
a more stable or reliable external funding source, resulting in a higher risk tolerance. 7. SU has a spending rule that is smoothed over a three year period versus WU’s annual
spending rule. A smoothed spending rule will decrease volatility in spending requirements, allowing SU to assume higher risk tolerance.

2011 Level III Guideline Answers Morning Session - Page 15 of 39
LEVEL III
Question: 4 Topic: Economics Minutes: 23
Reading References:
2011-Level III: Volume 3; Study Session 7; Reading 24 “Equity Market Valuation,” Peter C. Stimes and Stephan E. Wilcox (CFA Institute, 2011) LOS: 2011-III-7-24-c, d, f, g 24. “Equity Market Valuation”
The candidate should be able to: a. explain the terms of the Cobb-Douglas production function and demonstrate how the
function can be used to model growth in real output under the assumption of constant returns to scale;
b. evaluate the relative importance of growth in total factor productivity, in capital stock, and in labor input given relevant historical data;
c. demonstrate the use of the Cobb-Douglas production function in obtaining a
discounted dividend model estimate of the intrinsic value of an equity market;
d. evaluate the sensitivity of equity market value estimates to changes in assumptions;
e. contrast top-down and bottom-up forecasts of the earnings per share of an equity market index;
f. explain and critique models of relative equity market valuation based upon earnings
and assets;
g. judge whether an equity market is under-, fairly, or over-valued based on a relative
equity valuation model.

2011 Level III Guideline Answers Morning Session - Page 16 of 39
LEVEL III
Question: 4 Topic: Economics Minutes: 23
Guideline Answer:
PART A
The Cobb-Douglas production function can be used to calculate the projected annual real GDP growth rate. The model is particularly useful in the case of developing markets where the structure of the underlying economy has experienced, and may continue to experience, fundamental changes. One assumption of the model is that the production function exhibits constant returns to scale (i.e., a given percentage increase in capital stock and labor input results in an equal percentage increase in output). Projected annual real GDP growth rate = growth in Total Factor Productivity (TFP) + {(Output Elasticity of Capital) × (Growth in Capital Stock)} + {(1 – Output Elasticity of Capital) × (Growth in Labor Input)} For the projected annual real GDP growth rate = 2.8% + (0.4 × 3.6%) + (0.6 × 2.2%) = 2.8% + 1.44% + 1.32% = 5.56% or 5.6%

2011 Level III Guideline Answers Morning Session - Page 17 of 39
LEVEL III
Question: 4 Topic: Economics Minutes: 23
PART B
Template for Question 4-B
Note: No calculations are required. Consider each action independently.
Action
Determine the
initial effect
(increase, decrease,
or no change) each
action would most
likely have on the
country’s GDP
growth trend.
(circle one)
Justify each response with one reason.
1. Issue new regulations to reduce environmental pollution by manufacturers.
increase
decrease
no change
Total Fixed Costs increase as a result of the new regulations. This will lead to lower levels of production and lower growth rates of GDP in the short- to medium-term. However, in the long run, there are no fixed costs. As retro-fitting is completed and obsolete plants and machinery are replaced, a new equilibrium will be established.
2. Decrease the minimum retirement age by three years for all workers.
increase
decrease
no change
Decreasing the minimum retirement age will initially decrease labor participation and therefore the growth in labor input. This directly decreases the GDP growth trend.

2011 Level III Guideline Answers Morning Session - Page 18 of 39
LEVEL III
Question: 4 Topic: Economics Minutes: 23
PART C
In the H-Model, the dividend growth rate gS, is expected to decline linearly over a finite horizon, towards a sustainable rate gL. It incorporates a growth rate in dividends “gS” that is expected to prevail in the initial period of years, N, and then decline linearly to a long-term dividend growth rate “gL”. gL is expected to prevail to perpetuity from the end of period N. Inputs also include the initial annual dividend at time zero, D0, and a discount rate to perpetuity of r. Implied Price Level (V0) = [D0 / (r-gL)] [(1+gL) + (N/2) (gS -gL)] Where D0 = initial annualized dividend rate at time zero Where gS = dividend growth rate in initial period, N Where gL = long-term dividend growth rate (in perpetuity) starting at the end of period N Where r = discount rate in perpetuity V0 = [(10 / (0.055 – 0.03)] [(1 + 0.03) + (15 / 2) (0.06 – 0.03)] V0 = 400 [1.03 + 7.5 (0.03)] V0 = 400 (1.255) = 502 Based on the H-Model, the estimated intrinsic value of the country’s broad equity index is 502.
PART D
Two factors not included in the Fed Model but included in the Yardeni Model are: 1. The equity risk premium.
2. Earnings growth. The Yardeni Model attempts to address the equity risk premium by including the yield on risky debt (credit spread on A-rated bonds). While including a credit risk premium may improve upon the Fed Model, this approach does not accurately address the equity risk premium. The Yardeni Model includes a long-term earnings growth forecast, which does accurately address the earnings growth.

2011 Level III Guideline Answers Morning Session - Page 19 of 39
LEVEL III
Question: 4 Topic: Economics Minutes: 23
PART E
Template for Question 4-E
Model
Determine, using the
data in Exhibit 2, if
the broad equity
market is overvalued,
fairly valued, or
undervalued
according to the
models indicated.
(circle one)
Justify each response with one reason.
Show your calculations.
i. Fed Model
overvalued
fairly valued
undervalued
The Fed model assumes that a market is fairly valued when the yield on long-term government debt, Ygovt equals the forward equity-index earnings yield, Yeqty. In this case, the forward equity-index earnings yield is lower than the long-term government bond yield; therefore the equity market is overvalued. In this case:
• The long-term government bond yield (Ygovt) equals 4.05%
• The forward equity index earnings yield (Yeqty ) equals 3.95%
Yeqty < Ygovt Therefore, based on the Fed model, the broad equity market is overvalued.

2011 Level III Guideline Answers Morning Session - Page 20 of 39
LEVEL III
Question: 4 Topic: Economics Minutes: 23
Template for Question 4-E (continued)
Model
Determine, using the
data in Exhibit 2, if
the broad equity
market is overvalued,
fairly valued, or
undervalued
according to the
models indicated.
(circle one)
Justify each response with one reason.
Show your calculations.
ii. Yardeni Model
overvalued
fairly valued
undervalued
The Yardeni model assumes that a market is fairly valued when the justified forward earnings yield, Yeqty is equal to the forward equity index earnings yield value implied by current equity market index values (using consensus forward earnings estimates). The Yardeni model defines the justified forward earnings yield as the long-term corporate bond yield, Ycorp, minus the weighted long-term earnings growth rate, d × LTEG (the weighting, d, is based on the market). In this case:
• The forward equity index earnings yield value implied by current equity market index values (Yeqty) equals 3.95%.
• The long-term corporate bond yield (Ycorp) minus the weighted long-term earnings
growth rate (d × LTEG) equals 3.95%,
4.70% – (0.10 × 7.5%) = 3.95%.
Since (Yeqty) = (Ycorp) – (d × LTEG), the Yardeni model would conclude that the equity market is fairly valued.

2011 Level III Guideline Answers Morning Session - Page 21 of 39
LEVEL III
Question: 5 Topic: Asset Allocation Minutes: 20
Reading References:
2011 Level III, Volume 3, Study Session 8, Reading 26. “Asset Allocation,” Ch. 5, William F. Sharpe, Peng Chen, Jerald E. Pinto, and Dennis W. McLeavey, Managing Investment Portfolios: A Dynamic Process, 3rd edition (CFA Institute, 2007). LOS: 2010-III-8-26-d, l, and o. 26. “Asset Allocation”
The candidate should be able to a) summarize the function of strategic asset allocation in portfolio management and discuss
its role in relation to specifying and controlling the investor’s exposures to systematic risk;
b) compare and contrast strategic and tactical asset allocation; c) appraise the importance of asset allocation for portfolio performance;
d) contrast the asset-only and asset/liability management (ALM) approaches to asset
allocation and discuss the investor circumstances in which they are commonly used;
e) explain the advantage of dynamic over static asset allocation and discuss the trade-offs of complexity and cost;
f) explain how loss aversion, mental accounting, and fear of regret may influence asset allocation policy;
g) evaluate return and risk objectives in relation to strategic asset allocation; h) evaluate whether an asset class or set of asset classes has been appropriately specified; i) select and justify an appropriate set of asset classes for an investor; j) evaluate the theoretical and practical effects of including additional asset classes in an
asset allocation; k) formulate and implement the major steps in asset allocation;
l) discuss the strengths and limitations of the following approaches to asset allocation:
mean–variance, resampled efficient frontier, Black–Litterman, Monte Carlo
simulation, ALM, and experience based;
m) discuss the structure of the minimum-variance frontier with a constraint against short sales;
n) formulate and justify a strategic asset allocation, given an investment policy statement and capital market expectations;
o) contrast the characteristic issues relating to asset allocation for individual investors
versus institutional investors and critique a proposed asset allocation in light of
those issues;
p) formulate and justify tactical asset allocation (TAA) adjustments to strategic asset class weights, given a TAA strategy and expectational data.

2011 Level III Guideline Answers Morning Session - Page 22 of 39
LEVEL III
Question: 5 Topic: Asset Allocation Minutes: 20
Guideline Answer:
PART A
i. Advantages of using a resampled efficient frontier:
The resampled efficient frontier approach generates portfolios that are more stable through time than those derived using standard mean-variance optimization (MVO). Finnegan stated that she was dissatisfied with the high level of turnover and transaction costs she incurred in her portfolio using standard MVO. A portfolio that is more stable would reduce turnover and transaction costs, and be more appropriate for Finnegan. The resampled efficient frontier approach generates portfolios that are more diversified than those derived using standard MVO. Finnegan stated that she has below-average risk tolerance until she finds a new job. A more diversified portfolio should be less volatile, meeting Finnegan’s lower risk tolerance requirement.
ii. Advantages of using the Black-Litterman approach:
The Black-Litterman (BL) approach incorporates the investor’s views. Finnegan has a positive view of the European retail clothing sector. The BL approach allows her to incorporate these views, while standard MVO does not. The BL approach generates portfolios that are more diversified than those derived using standard MVO. Finnegan stated that she has below-average risk tolerance until she finds a new job. A more diversified portfolio should be less volatile, meeting Finnegan’s lower risk tolerance requirement.
iii. Advantages of using a Monte-Carlo simulation:
Monte Carlo simulations allow for portfolio rebalancing under changing tax rates and in multi-period situations. Finnegan’s effective tax rate will likely increase sharply when she starts a new job. MVO does not consider these factors. Monte Carlo simulations can compute path-dependent terminal wealth. Finnegan hopes to make a deposit on a home for her sister within the year, provided she finds a new job. Cash flows in and out of a portfolio and the sequence of returns will have a material effect on terminal wealth – this is termed path-dependent. In Finnegan’s case, the deposit would be a significant cash outflow, resulting in lower terminal wealth.
2011 Level III Guideline Answers Morning Session - Page 23 of 39
LEVEL III
Question: 5 Topic: Asset Allocation Minutes: 20
PART B
The ALM approach focuses asset allocation on funding liabilities. Finnegan should adopt an ALM approach because:
• Finnegan faces a significant penalty for not meeting her liabilities. If she misses her mortgage payments for three or more months, she risks losing her home. She does not want to sell assets to pay the mortgage. Therefore, a portfolio structure designed to meet liabilities would be appropriate.
• Finnegan has below average risk tolerance while unemployed. Loss averse investors, or investors with below-average risk tolerance, are better suited to an ALM approach than to an AO approach.
• Finnegan’s mortgage payments are interest-rate sensitive. Holding investment assets with similarly sensitive cash flows would hedge this risk. Therefore, an ALM approach is more appropriate than an AO approach for her.
PART C
Finnegan should have a lower allocation to equities because:
• Finnegan is young and has a large amount of human capital relative to her financial capital.
• The correlation between Finnegan’s income and the equity market’s performance is high. Thus, her overall allocation to “equity like” capital is extremely high. Investors whose human capital is highly correlated with equity returns should balance human capital risk through a lower allocation to equities in their investment portfolios.

2011 Level III Guideline Answers Morning Session - Page 24 of 39
Level III
Question: 6 Topic: Fixed Income Minutes: 19
Reading References:
2011 Level III, Volume 4, Study Session 9, Reading 28 “Fixed-Income Portfolio Management-Part I,” Ch. 6, sections 1–4 (pp. 1–40), H. Gifford Fong and Larry D. Guin, Managing Investment Portfolios: A Dynamic Process, 3rd edition (CFA Institute, 2007). 2011 Level III, Volume 4, Study Session 9, Reading 29 “Relative-Value Methodologies for Global Credit Bond Portfolio Management,” Ch. 5, Jack Malvey, Fixed Income Readings for the Chartered Financial Analyst® Program, 2nd edition (CFA Institute, 2005).
LOS:
2011-III-9-28-d, g 28. “Fixed-Income Portfolio Management-Part I”
The candidate should be able to: a) compare and contrast, with respect to investment objectives, the use of liabilities as a
benchmark and the use of a bond index as a benchmark; b) compare and contrast pure bond indexing, enhanced indexing, and active investing with
respect to the objectives, techniques, advantages, and disadvantages of each; c) discuss the criteria for selecting a benchmark bond index and justify the selection of a
specific index when given a description of an investor’s risk aversion, income needs, and liabilities;
d) review and justify the techniques, such as duration matching and the use of key rate
durations, by which an enhanced indexer may seek to align the risk exposures of the
portfolio with those of the benchmark bond index;
e) contrast and illustrate the use of total return analysis and scenario analysis to assess the risk and return characteristics of a proposed trade.
f) design a bond immunization strategy to ensure funding of a predetermined liability and evaluate the strategy under various interest rate scenarios;
g) demonstrate the process of rebalancing a portfolio to re-establish a desired dollar
duration;
h) explain the importance of spread duration; i) discuss the extensions that have been made to classical immunization theory, including
the introduction of contingent immunization; j) explain the risks associated with managing a portfolio against a liability structure,
including interest rate risk, contingent claim risk, and cap risk; k) compare and contrast immunization strategies for a single liability, multiple liabilities,
and general cash flows; l) compare and contrast risk minimization with return maximization in immunized
portfolios;

2011 Level III Guideline Answers Morning Session - Page 25 of 39
m) demonstrate the use of cash flow matching to fund a fixed set of future liabilities and contrast the advantages and disadvantages of cash flow matching to those of immunization strategies.
2011-III-9-29-d, e 29. “Relative-Value Methodologies for Global Credit Bond Portfolio Management”
The candidate should be able to: a) explain classic relative-value analysis, based on top-down and bottom-up approaches to
credit bond portfolio management; b) discuss the implications of cyclical supply and demand changes in the primary corporate
bond market and the impact of secular changes in the market’s dominant product structures;
c) summarize the influence of investors’ short- and long-term liquidity needs on portfolio management decisions;
d) discuss common rationales for secondary market trading, including yield-spread
pickup trades, credit-upside trades, credit-defense trades, new-issue swaps, sector-
rotation trades, yield curve–adjustment trades, structure trades, and cash flow
reinvestment;
e) discuss and evaluate corporate bond portfolio strategies that are based on relative
value, including total return analysis, primary market analysis, liquidity and
trading analysis, secondary trading rationales and trading constraints, spread
analysis, structure analysis, credit curve analysis, credit analysis, and asset
allocation/sector analysis.
2011 Level III Guideline Answers Morning Session - Page 26 of 39
Level III
Question: 6 Topic: Fixed Income Minutes: 19
Guideline Answer:
PART A
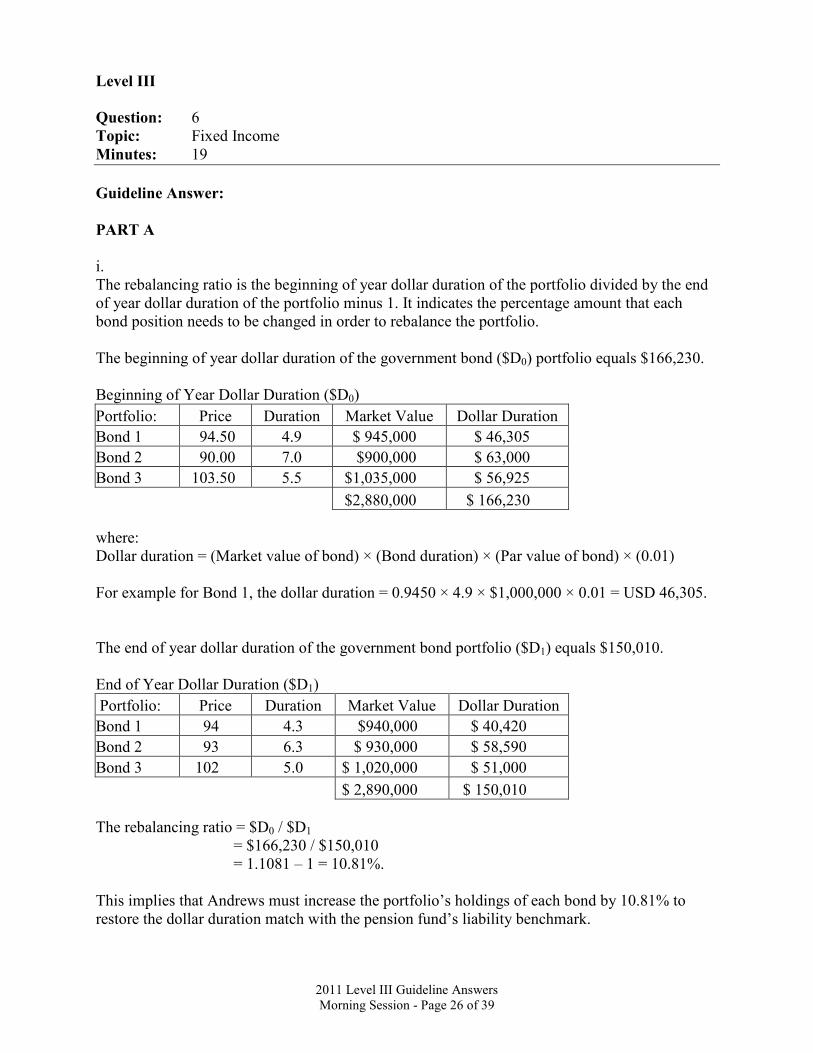
i. The rebalancing ratio is the beginning of year dollar duration of the portfolio divided by the end of year dollar duration of the portfolio minus 1. It indicates the percentage amount that each bond position needs to be changed in order to rebalance the portfolio. The beginning of year dollar duration of the government bond ($D0) portfolio equals $166,230. Beginning of Year Dollar Duration ($D0)
Portfolio: Price Duration Market Value Dollar Duration
Bond 1 94.50 4.9 $ 945,000 $ 46,305
Bond 2 90.00 7.0 $900,000 $ 63,000
Bond 3 103.50 5.5 $1,035,000 $ 56,925
$2,880,000 $ 166,230
where: Dollar duration = (Market value of bond) × (Bond duration) × (Par value of bond) × (0.01) For example for Bond 1, the dollar duration = 0.9450 × 4.9 × $1,000,000 × 0.01 = USD 46,305. The end of year dollar duration of the government bond portfolio ($D1) equals $150,010. End of Year Dollar Duration ($D1)
Portfolio: Price Duration Market Value Dollar Duration
Bond 1 94 4.3 $940,000 $ 40,420
Bond 2 93 6.3 $ 930,000 $ 58,590
Bond 3 102 5.0 $ 1,020,000 $ 51,000
$ 2,890,000 $ 150,010
The rebalancing ratio = $D0 / $D1
= $166,230 / $150,010 = 1.1081 – 1 = 10.81%.
This implies that Andrews must increase the portfolio’s holdings of each bond by 10.81% to restore the dollar duration match with the pension fund’s liability benchmark.

2011 Level III Guideline Answers Morning Session - Page 27 of 39
Level III
Question: 6 Topic: Fixed Income Minutes: 19
ii. The amount of cash required for rebalancing equals the end of year market value of the bond portfolio times the rebalancing ratio. Cash required for rebalancing = $2,890,000 × 0.1081 = $312,409
PART B Wang’s portfolio will most likely outperform its benchmark. Wang’s portfolio deviates from the benchmark in one parameter: sector weights. Relative to the benchmark index, his portfolio is overweight in Consumer Cyclicals, underweight in Consumer Non-cyclicals and neutral in Utilities. Consumer Cyclicals tend to outperform other sectors during a period of economic strength, as consumers go forward with delayed and non-essential purchases. Therefore, the returns on Wang’s portfolio are expected to be higher than the benchmark portfolio returns during a period of increased economic activity, as forecast by SM Capital’s economist. The utilities sector will neither increase nor decrease portfolio returns compared to the benchmark index, because the portfolio weighting matches the index. Similarly, the other two parameters, duration and credit quality, are matched to the benchmark and thus would have no impact on relative performance.

2011 Level III Guideline Answers Morning Session - Page 28 of 39
Level III
Question: 6 Topic: Fixed Income Minutes: 19
PART C
Template for Question 6-C
Note: Consider each strategy independently.
Trading
strategy
Describe the trades that
Wang could use (buy/sell
bonds as appropriate) to
implement each trading
strategy.
Justify each trade, based on the economist’s
forecast.
1. sector rotation trades
Bonds to buy: Consumer Cyclicals
A sector rotation trade is used to move out of a sector that is expected to weaken and move into a sector that is expected to strengthen. When there is an increase in economic activity, the Consumer Cyclicals sector tends to outperform other sectors. Consumers go forward with purchases that have been delayed and purchases of non-essential goods.
Since the economist has forecast a significant economic improvement, an appropriate sector rotation trade for Wang would be to increase Consumer Cyclicals holdings (Wang is already overweight this sector relative to the benchmark index). Either Consumer Non-cyclicals or Utilities can be sold to fund the purchase. Given that Wang’s portfolio is already underweight in Consumer Non-cyclicals relative to the benchmark index, he is more likely to reduce his exposure to Utilities, which also behave in a non-cyclical fashion.
Bonds to sell: Consumer Non-Cyclicals or Utilities

2011 Level III Guideline Answers Morning Session - Page 29 of 39
Level III
Question: 6 Topic: Fixed Income Minutes: 19
Template for Question 6-C (continued)
Note: Consider each strategy independently.
Trading
strategy
Describe the trades that
Wang could use (buy/sell
bonds as appropriate) to
implement each trading
strategy.
Justify each trade, based on the economist’s
forecast.
2. credit adjustment trades
Bonds to buy: Low rated bonds: BBB
A credit adjustment trade is designed to increase or decrease the average credit quality of the bond portfolio. Given the economist’s strong outlook for the economy and the prospect of fewer corporate defaults, Wang should decrease the average credit quality of the portfolio. Lower quality bonds tend to outperform higher quality bonds during periods of increased economic activity. Therefore, Wang should engage in trades that increase the proportion of lower-rated bonds such as BBB bonds, and decrease the proportion of higher-rated bonds such as AA and above.
Bonds to sell: High rated bonds: AA and above
3. yield curve adjustment trades
Bonds to buy: Shorter duration bonds
A yield curve adjustment trade is designed to capitalize on expected shifts in the yield curve. The economist is expecting no change in short-term interest rates and expecting long-term interest rates to rise by 200 basis points. This would decrease the value of the long duration bonds in Wang’s portfolio, thereby negatively affecting total portfolio returns. The longer the maturity of a bond (other factors equal), the longer the duration of a bond. The longer the duration, the more price-sensitive a bond is to interest rate movements. Therefore, Wang should decrease the overall duration of the portfolio by decreasing the proportion of longer duration bonds.
Bonds to sell: Longer duration bonds

2011 Level III Guideline Answers Morning Session - Page 30 of 39
LEVEL III
Question: 7 Topic: Equity Minutes: 22
Reading References:
2011 Level III, Volume 4, Study Session 12, Reading 33 “Corporate Governance,” Ch. 1, The Theory of Corporate Finance, Jean Tirole (Princeton University Press, 2006). 2011 Level III, Volume 4, Study Session 12, Reading 35, pp. 405-407. “Emerging Markets Finance,” Geert Bekaert and Campbell R. Harvey, Journal of Empirical Finance, vol. 10, issue 5 (Elsevier, December 2003).
LOS: 2011-III-12-33-b, c, d, e 33. “Corporate Governance”
The candidate should be able to: a) explain the ways in which management may act that are not in the best interest of the
firm’s owners (moral hazard) and illustrate how dysfunctional corporate governance can lead to moral hazard.
b) evaluate explicit and implicit incentives that can align management’s interests with
those of the firm’s shareholders;
c) explain the shortcomings of boards of directors as monitors of management and
state and discuss prescriptions for improving board oversight;
d) discuss why active monitoring by investors requires control, the various
mechanisms by which control is exercised, and the limitations of active monitoring;
e) critique the effectiveness of debt as a corporate governance mechanism;
f) explain the social responsibilities of the corporation in a “stakeholder society” and evaluate the advantages and disadvantages of a corporate governance structure based on stakeholder rather than shareholder interests;
g) discuss the Cadbury Report recommendations for best practice in maintaining an effective board of directors whose interests are aligned with those of shareholders.
2011-III-12-35-c 35. “Emerging Markets Finance”
The candidate should be able to: a) discuss the process of financial liberalization and explain the expected impact on pricing
and expected returns as a segmented market evolves into an integrated market; b) explain the benefits that may accrue to an emerging market economy as a result of
financial liberalization;
c) discuss the major issues confronting emerging market investors, including excess
correlations during times of crisis (contagion), corporate governance, price
discovery, and liquidity.

2011 Level III Guideline Answers Morning Session - Page 31 of 39
LEVEL III
Question: 7 Topic: Equity Minutes: 22
Guideline Answer:
PART A
The management incentive system at Orca would likely be improved by each of the following: Recommended measures:
• Increase share-based incentives – Orca’s executive compensation system currently emphasizes cash bonuses based on one year earnings growth which encourages a short-term focus and possible manipulation of accounting data. By implementing greater share-based incentives, management will be encouraged to take a long-term perspective on shareholder value.
• Include share options as part of the compensation – Compensation in the form of share options provides a stronger incentive to increase the share price (compared with awarding straight shares), since there is a payoff only if the share price moves above the exercise price (which should be set above current market value).
• Increase implicit incentives, such as the threat of firing – These incentives appear to be weak at Orca, based on the long tenure of executive management, despite poor share price performance.
• Structure bonuses to reward Orca’s share price performance relative to the industry’s share price performance – Bonuses are currently based on earnings targets for Orca set at the beginning of the year. By indexing against the average industry share price performance, Orca managers would be rewarded for the relative performance of Orca’s share price compared to the industry and would not be penalized or rewarded for market-driven events or trends.

2011 Level III Guideline Answers Morning Session - Page 32 of 39
LEVEL III
Question: 7 Topic: Equity Minutes: 22
PART B
The reasons that Orca’s board of directors most likely does not represent the best interests of shareholders can be grouped into three main categories: 1. Lack of independence:
• The Board Chair is also the CEO. The Chair exercises a disproportionate influence on board meetings. When the Chair is also the CEO, it could be difficult for other members of the board to effectively represent all stakeholders.
• Manley Bank has two board seats and is a major creditor of Orca. These board members would likely be biased towards the interests of debt holders.
• Five of the Board directors are classified as insiders. Therefore, only half the board is potentially free of conflicts of interest in representing all stakeholders. In addition, at least two of the independent directors have a vested interest in representing the interests of Manley Bank. Therefore, there are at most three truly independent directors.
2. Insufficient attention:
• Three of Orca’s independent directors are each CEOs of large publicly traded companies and directors of other boards. As such, they are likely to be unable to devote adequate attention to their Orca Board duties. In these situations, directors may be inclined to rely entirely on information provided by management.
3. Insufficient incentives:
• Board compensation consists only of a fixed annual fee, which does not connect Board interests to shareholder interests.
PART C
Replacing debt with equity would:
• Increase Orca’s liquidity by reducing the amount of regular contractual interest and principal payments. This is particularly important for Orca, since it appears to need to invest in new products and production technologies.
• Allow Orca to invest in projects that have a higher degree of risk and higher return potential since there will be less need to preserve cash for principal and interest payments.
• Improve Orca’s ability to raise capital.
• Decrease the likelihood of cash shortages, defaults and bankruptcy.
• Lower the weighted average cost of capital if the company’s debt is currently above the level indicated by its optimal capital structure.
2011 Level III Guideline Answers Morning Session - Page 33 of 39
LEVEL III
Question: 7 Topic: Equity Minutes: 22
PART D
With only 4% ownership, it would be suboptimal for Horizon to acquire strategic information to challenge the firm’s policies. Horizon would only receive a small portion (4%) of any increase in value for shareholders. There would be substantial free-riding on Horizon’s monitoring efforts. Since Orca’s shares are highly liquid, Horizon can easily exit its investment by selling its position in the company. Investors are more likely to incur the costs of monitoring to protect their investment when a company’s shares are illiquid, since investors cannot easily sell their positions. The relatively high turnover in Horizon’s funds suggests that the mutual fund company is generally not a long-term investor that might expend resources to create long-run value through monitoring.
PART E
Issuance of ADRs would likely have a positive effect on Acorn’s corporate governance. ADR issuance would:
• allow Acorn to ‘opt-in’ to a better external governance regime in the US.
• commit the firm to a higher level of disclosure, having to meet US disclosure rules.
• lead to increased coverage by research analysts and an increase in the quality of the research on the firm. Increased investor and media scrutiny also improves the information environment.

2011 Level III Guideline Answers Morning Session - Page 34 of 39
LEVEL III
Question: 8 Topic: Risk Management Minutes: 16
Reading References: 2011 Level III, Volume 5, Study Session 14, Reading 39 “Risk Management,” Ch. 9, Don M. Chance, Kenneth Grant, and John Marsland, Managing Investment Portfolios: A Dynamic Process, 3rd edition (CFA Institute, 2007). 2011 Level III, Volume 5, Study Session 14, Reading 40 “Currency Risk Management,” Ch. 11, Global Investments, 6th edition, Bruno Solnik and Dennis W. McLeavey (Addison Wesley, 2009).
LOS: 2010-III-14-39-c, d, e, f, g, h 39. “Risk Management”
The candidate should be able to: a) compare and contrast the main features of the risk management process, risk governance,
risk reduction, and an enterprise risk management system; b) recommend and justify the risk exposures an analyst should report as part of an enterprise
risk management system;
c) evaluate the strengths and weaknesses of a company’s risk management processes
and the possible responses to a risk management problem;
d) evaluate a company’s or a portfolio’s exposures to financial and nonfinancial risk
factors;
e) interpret and compute value at risk (VAR) and explain its role in measuring overall
and individual position market risk;
f) compare and contrast the analytical (variance–covariance), historical, and Monte
Carlo methods for estimating VAR and discuss the advantages and disadvantages of
each;
g) discuss the advantages and limitations of VAR and its extensions, including cash
flow at risk, earnings at risk, and tail value at risk;
h) compare and contrast alternative types of stress testing and discuss the advantages
and disadvantages of each;
i) evaluate the credit risk of an investment position, including forward contract, swap, and option positions;
j) demonstrate the use of risk budgeting, position limits, and other methods for managing market risk;
k) demonstrate the use of exposure limits, marking to market, collateral, netting arrangements, credit standards, and credit derivatives to manage credit risk;
l) compare and contrast the Sharpe ratio, risk-adjusted return on capital, return over maximum drawdown, and the Sortino ratio as measures of risk-adjusted performance;
m) demonstrate the use of VAR and stress testing in setting capital requirements.

2011 Level III Guideline Answers Morning Session - Page 35 of 39
LEVEL III
Question: 8 Topic: Risk Management Minutes: 16
LOS: 2010-III-14-40-a 40. “Currency Risk Management”
The candidate should be able to
a) demonstrate and explain the use of foreign exchange futures to hedge the currency
exposure associated with the principal value of a foreign investment;
b) justify the use of a minimum-variance hedge when covariance between local currency returns and exchange rate movements exists and interpret the components of the minimum-variance hedge ratio in terms of translation risk and economic risk;
c) evaluate the effect of basis risk on the quality of a currency hedge; d) evaluate the choice of contract terms (short, matched, or long term) when establishing a
currency hedge; e) explain the issues that arise when hedging multiple currencies; f) discuss the use of options rather than futures/forwards to insure and hedge currency risk; g) evaluate the effectiveness of a standard dynamic delta hedge strategy when hedging a
foreign currency position; h) discuss and justify other methods for managing currency exposure, including the indirect
currency hedge created when futures or options are used as a substitute for the underlying investment;
i) compare and contrast the major types of currency management strategies specified in investment policy statements.

2011 Level III Guideline Answers Morning Session - Page 36 of 39
LEVEL III
Question: 8 Topic: Risk Management Minutes: 16
Guideline Answer:
PART A
i. Historical VaR
Use of a historical VaR model is not appropriate as it will not take into account the recent increase in the volatility of Polish equities. ii. Analytical VaR Use of an analytical VaR model is not appropriate, as it will not take into account that the portfolio return distribution is most likely not normal. Both the equity index options that hedge the downside risk of the portfolio and the classification of Poland as an emerging market are likely to contribute to a non-normal distribution of returns.
PART B
To determine the 1% monthly VaR using annualized data, the expected annualized return and standard deviation must first be adjusted. The expected monthly return equals 0.06 / 12 = 0.005
and the monthly standard deviation equals 0.07 / √12= 0.020207.
The 1 percent monthly portfolio VAR is �p – 2.33ơ = 0.005 – 2.33(0.020207) = –0.042083. Then the VaR in PLN equals 1,400,000,000(0.042083) = PLN 58,916,080.
PART C
The portfolio produced a profit of PLN 400,000, calculated by converting initial and ending LHS market values to PLN, and subtracting the initial values from the ending values.
Initial LHS Value
Initial PLN Value (Initial LHS × 0.87)
Ending LHS Value
Ending PLN Value(Ending LHS × .80)
Profit/Loss (PLN)
Bonds 25,000,000 21,750,000 27,500,000 22,000,000 250,000
Equities 10,000,000 8,700,000 8,000,000 6,400,000 –2,300,000
– Fwd –35,000,000 –30,450,000 –35,000,000 –28,000,000 2,450,000
Total Profit/Loss 400,000

2011 Level III Guideline Answers Morning Session - Page 37 of 39
LEVEL III
Question: 9 Topic: Performance Evaluation Minutes: 16
Reading References:
2011 Level III, Volume 6, Study Session 17, Reading 46 “Evaluating Portfolio Performance,” Ch. 12, Jeffery V. Bailey, Thomas M. Richards, and David E. Tierney, Managing Investment Portfolios: A Dynamic Process, 3rd edition (CFA Institute, 2010) LOS: 2011-III-17-46; LOS: k, l, and o 46. “Evaluating Portfolio Performance”
The candidate should be able to: a) demonstrate the importance of performance evaluation from the perspective of fund sponsors and
the perspective of investment managers; b) explain the basic components of portfolio evaluation (performance measurement, performance
attribution, and performance appraisal); c) calculate, interpret, and contrast time-weighted and money-weighted rates of return and discuss
how each is affected by cash contributions and withdrawals; d) identify and explain potential data quality issues as they relate to calculating rates of return; e) demonstrate the analysis of portfolio returns into components attributable to the market, to style,
and to active management; f) discuss the properties of a valid benchmark and evaluate the advantages and disadvantages of
alternative types of performance benchmarks; g) summarize the steps involved in constructing a custom security-based benchmark; h) judge the validity of using manager universes as benchmarks; i) evaluate benchmark quality by applying tests of quality to a variety of possible benchmarks; j) discuss the issues that arise when assigning benchmarks to hedge funds; k) distinguish between macro and micro performance attribution and discuss the inputs
typically required for each;
l) demonstrate, justify, and contrast the use of macro and micro performance attribution
methodologies to evaluate the drivers of investment performance;
m) discuss the use of fundamental factor models in micro performance attribution; n) differentiate between the effect of the external interest rate environment and the effect of active
management on fixed-income portfolio returns; o) explain the management factors that contribute to a fixed-income portfolio’s total return
and interpret the results of a fixed-income performance attribution analysis;
p) calculate, interpret, and contrast alternative risk-adjusted performance measures, including (in their ex post forms) alpha, information ratio, Treynor measure, Sharpe ratio, and M2;
q) explain how a portfolio’s alpha and beta are incorporated into the information ratio, Treynor measure, and Sharpe ratio;
r) demonstrate the use of performance quality control charts in performance appraisal; s) discuss the issues involved in manager continuation policy decisions, including the costs of hiring
and firing investment managers; t) contrast Type I and Type II errors in manager continuation decisions.
2011 Level III Guideline Answers Morning Session - Page 38 of 39
LEVEL III
Question: 9 Topic: Performance Evaluation Minutes: 16
Guideline Answer:
PART A
i. Chin should prepare a macro performance attribution report. This is required in order for the committee to understand the overall results of the Fund compared to its benchmark, and to analyze the effects of the committee’s decisions (asset allocation, manager allocation, choice of benchmarks) on the Fund.
ii. Macro attribution analysis requires two additional inputs: policy allocations and benchmark
portfolio returns. Fund sponsors determine policy allocations, or “normal” weightings for each asset class and individual manager. Fund sponsors typically determine these weightings from a review of asset/liability analysis and risk tolerance. Benchmark portfolio returns are necessary to adequately evaluate the value added by the managers. Fund sponsors may use broad market indexes as benchmarks for asset categories and the entire portfolio, and may use more focused indexes to represent a manager’s investment style and mandate.
PART B
i. The pure sector allocation return for Consumer Durables equals (wpj – wBj) × (rBj – rB).
where: wpj = Portfolio weight of sector j wBj = Benchmark weight of sector j rBj = Benchmark return of sector j rB = Overall benchmark return
= (26.3% – 21.9%) × (4.90% – 2.80%) = 0.092% or nine basis points. ii. The within-sector allocation (security selection) return for Technology equals wBj × (rpj – rBj).
where: rpj = Portfolio return of sector j
= 22.4% × (1.30% – (–0.20%) = 0.336% or thirty-four basis points.

2011 Level III Guideline Answers Morning Session - Page 39 of 39
LEVEL III
Question: 9 Topic: Performance Evaluation Minutes: 16
PART C
Template for Question 9-C
Statement
Conclude (yes, no,
cannot determine with
the information
provided) whether
each statement made
by the managers is
consistent with the
data in Exhibit 2.
(circle one)
Justify each response with one reason.
Manager A: “Our strategy is to add value by actively managing the duration of the fixed income securities in the portfolio.”
yes
no
cannot determine with the information
provided
The Interest Rate Management Effect indicates how well the manager predicts interest rate changes. It can be broken down into returns due to duration, convexity, and yield-curve shape changes. Manager A has generated a –0.08% return from Interest Rate Management Effect. This is inconsistent with their stated strategy. Skillful duration management suggests an ability to add value by actively managing the duration of the fixed income securities in the portfolio.
Manager B: “Our strategy is to add value by identifying undervalued securities and sectors to take advantage of bonds that are mispriced by the market.”
yes
no
cannot determine with the information
provided
Other Management Effects consists of sector/quality, bond selectivity, and transaction costs. The sector/quality effect measures the manager’s ability to identify undervalued/overvalued sector/ quality groups and buying/selling accordingly. Manager B has generated a 0.32% return from Other Management Effects which is consistent with their stated strategy to add value by identifying undervalued securities and sectors.