Embed Size (px)
Citation preview
Level 32, 1 O’Connell Street Sydney NSW 2000
W www.eclipxgroup.com
Eclipx Group Limited | ABN: 85 131 557 901
ASX Release 20 May 2015 ECLIPX GROUP REPORTS 1H15 NPATA OF $23.8M, ON TRACK TO MEET FY15 FORECAST First Half Highlights
• NPATA of $23.8 million • New Business Written (NBW) of $396 million, up 40% on same period last year • $1.675b Assets under Management or Financed, up 6% since 30 September 2014 • 79,876 Total Vehicles Under Management or Financed (VUMOF), up 6% net since 30
September 2014 • Business transformation and integration of FleetPlus and CarLoans acquisitions tracking to plan • On track to meet prospectus forecasts for FY15
Eclipx Group Limited (ASX: ECX), an established leader in Australia and New Zealand fleet financing and management, today announced a Net Profit After Tax & Amortisation (NPATA) of $23.8 million for the six months to 31 March 2015, in line with the forecast presented in the company’s prospectus and underpinned by a strong performance across each of its business divisions. Chief Executive Officer Doc Klotz said Eclipx has delivered a very solid first-half result, with the company’s Australian commercial division a stand out performer. “This is an extremely pleasing result for Eclipx, continuing the success of our listing on the Australian Securities Exchange last month” Mr Klotz said. “In the past 12 months we have transformed Eclipx’s sales performance, its service offering and technology capability and this has translated into some very strong results, particularly in New Business Written volumes which have grown to $396 million in the first-half, up 40% percent on the prior corresponding period”. “Our Australian and New Zealand commercial divisions, representing 72% of total NBW for 1H15, have performed exceptionally well, driven by our customer centric focus and new technology, and we are continuing to build on this momentum” he said. Australia Commercial The Australian commercial segment was the stand out performer in 1H15 with NBW at $197 million, up 54% over the prior corresponding period (“PCP”). Net Promoter Score programs were introduced during 1H15, yielding scores of +30, demonstrating strong client relationships and engagement with drivers. Technology initiatives such as FleetAlerts and FBT saving telematics products helped increase value and drive down fleet costs for corporate customers. Additionally, the launch of Eclipx Commercial Equipment Finance division in December 2014 has provided good cross selling opportunities to the Eclipx customer base.
For
per
sona
l use
onl
y
Level 32, 1 O’Connell Street Sydney NSW 2000
W www.eclipxgroup.com
Eclipx Group Limited | ABN: 85 131 557 901
New Zealand Commercial The New Zealand Commercial segment grew robustly in 1H15 with NBW up 52% on the PCP to $87 million despite some supply issues delaying delivery of new vehicles. Full year FY15 fleet size and average assets under management targets have already been exceeded. Direct-to-consumer vehicle sales channel Auto Select continued to outperform wholesale disposal options. Australia Consumer The Australian consumer segment, including Carloans.com.au and the novated lease businesses are tracking well. MyCar – FleetPartners’ fully automated novated leasing portal – was launched during the period and operating hours for CarLoans were extended to more closely align to lead arrival patterns. Eclipx also purchased the car review content website, Performancedrive.com.au during the period. Other The latest Federal Budget provides opportunities for Eclipx to sell its sub $20,000 end of lease vehicles (through Carloans.com.au) to small businesses with Australian Business Numbers (ABNs) who can claim full tax deductions, and to sell its electronic tax logbook product to individuals or to tradespeople required to maintain logbooks. Outlook Eclipx is on track to meet its prospectus forecasts for FY15. Eclipx continues to drive sustainable top-line growth while focusing on operational optimisation and we will continue to assess organic and strategic expansion into existing and new financial services adjacencies. Media Inquiries: Newgate Communications Greg Baxter: 0419 461 368 Jo Collins: 0423 029 932 Investor Inquiries: Eclipx Group: Deputy CEO & Chief Financial Officer Garry McLennan +61 2 89737272 About Eclipx: Eclipx Group Limited (ECX) is a leading provider of fleet and equipment leasing and management to corporate customers, SME and consumers in Australia and corporate and SME customers in New Zealand. As at 31 March 2015, Eclipx managed or financed 79,876 vehicles across Australia and New Zealand under four primary brand names, "FleetPartners", "FleetPlus", "CarLoans.com.au" and "Fleet Choice".
For
per
sona
l use
onl
y
Half Yearly Results Presentation
Doc Klotz - Chief Executive Officer & Managing Director Garry McLennan - Deputy CEO & Chief Financial Officer
For
per
sona
l use
onl
y
2
This Presentation contains summary information about Eclipx Group Limited (“Eclipx”) and its subsidiaries and their activities. The information in this Presentation does not purport to be complete. It should be read in conjunction with Eclipx’s other periodic and continuous disclosure announcements lodged with the Australian Securities Exchange, which are available at www.asx.com.au.
The information contained in this Presentation is not investment or financial product advice and has been prepared without taking into account the investment objectives, financial situation or particular needs of any particular person. Before making an investment decision investors should consider the appropriateness of the information having regard to their own objectives, financial situation and needs and seek independent professional advice appropriate to their jurisdiction and circumstances.
To the extent permitted by law, no responsibility for any loss arising in any way from anyone acting or refraining from acting as a result of this information is accepted by Eclipx or any of its related bodies corporate. No representation or warranty, express or implied, is made by any person, including Eclipx, and its directors, officers, employees, professional advisors and agents (“Related Parties”) as to the fairness, accuracy, completeness or correctness of the information, opinions and conclusions contained in this Presentation.
An investment in Eclipx securities is subject to investment and other known and unknown risks, some of which are beyond the control of Eclipx. Eclipx does not guarantee any particular rate of return or the performance of Eclipx securities.
Past performance information given in this Presentation is given for illustrative purposes only and should not be relied upon as (and is not) an indication of future performance.
This Presentation contains certain forward‐looking statements with respect to the financial condition, results of operations and business of Eclipx and associated entities of Eclipx entities and certain plans and objectives of the management of Eclipx. Forward‐looking statements can be identified by the use of forward‐looking terminology, including, without limitation, the terms “believes”, “estimates”, “anticipates”, “expects”, “predicts”, “intends”, “plans”, “goals”, “targets”, “aims”, “outlook”, “guidance”, “forecasts”, “may”, “will”, “would”, “could” or “should” or, in each case, their negative or other variations or comparable terminology. These forward‐looking statements include all matters that are not historical facts. Such forward‐looking statements involve known and unknown risks, uncertainties and other factors which because of their nature may cause the actual results or performance of Eclipx to be materially different from the results or performance expressed or implied by such forward‐looking statements.
Such forward‐looking statements are based on numerous assumptions regarding Eclipx’s present and future business strategies and the political, regulatory and economic environment in which Eclipx will operate in the future, which may not be reasonable, and are not guarantees or predictions of future performance. No representation or warranty is made that any of these statements or forecasts (express or implied) will come to pass or that any forecast result will be achieved.
Forward‐looking statements speak only as at the date of this Presentation and to the full extent permitted by law, Eclipx, its affiliates, related bodies corporate and Related Parties disclaim any obligation or undertaking to release any updates or revisions to information to reflect any change in any of the information contained in this Presentation (including, but not limited to, any assumptions or expectations set out in the Presentation).
Statutory profit is prepared in accordance with the Corporations Act 2001 and the Australian Accounting Standards, which comply with the International Financial Reporting Standards. Underlying profits are categorised as non-IFRS financial information and therefore have been presented in compliance with ASIC Regulatory Guide 230 – Disclosing non-IFRS information, issued in December 2011.
All figures in the Presentation are A$ unless stated otherwise and all market shares are estimates only. A number of figures, amounts, percentages, estimates, calculations of value and fractions are subject to the effect of rounding. Accordingly, the actual calculations of these figures may differ from figures set out in this Presentation.
Legal disclaimer
For
per
sona
l use
onl
y
Agenda
3
Highlights 1
Eclipx overview 2
Financial performance 3
Segment performance & outlook 4
Appendices – Financial Statements 5
For
per
sona
l use
onl
y

1
Highlights
1
For
per
sona
l use
onl
y
5
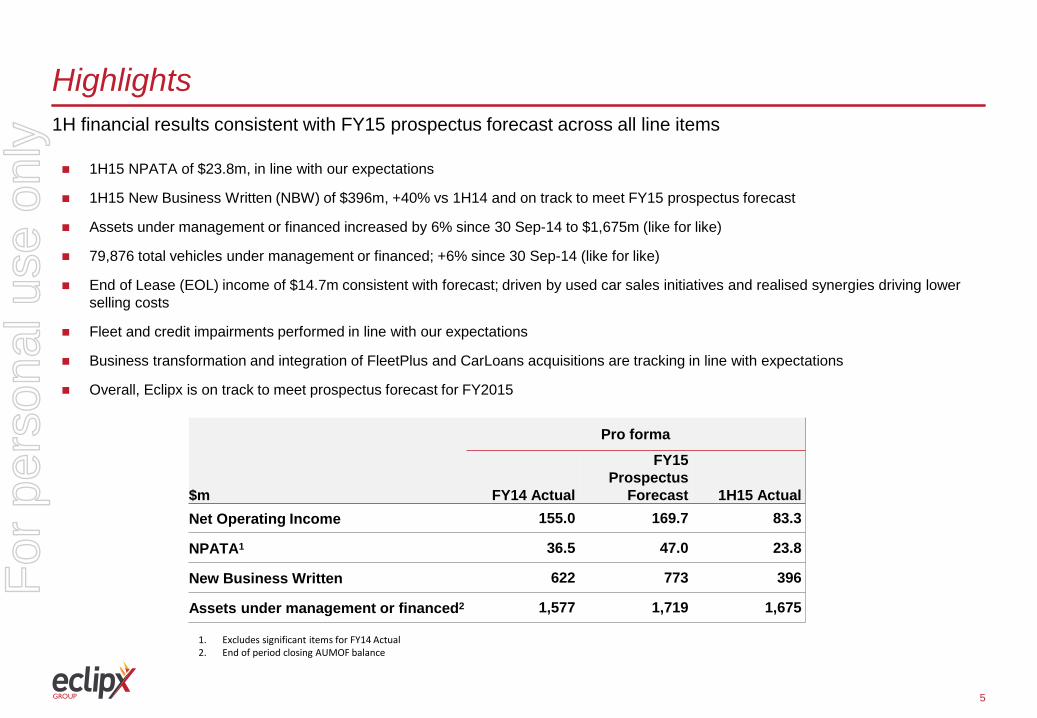
Highlights 1H financial results consistent with FY15 prospectus forecast across all line items
1H15 NPATA of $23.8m, in line with our expectations
1H15 New Business Written (NBW) of $396m, +40% vs 1H14 and on track to meet FY15 prospectus forecast
Assets under management or financed increased by 6% since 30 Sep-14 to $1,675m (like for like)
79,876 total vehicles under management or financed; +6% since 30 Sep-14 (like for like)
End of Lease (EOL) income of $14.7m consistent with forecast; driven by used car sales initiatives and realised synergies driving lower selling costs
Fleet and credit impairments performed in line with our expectations
Business transformation and integration of FleetPlus and CarLoans acquisitions are tracking in line with expectations
Overall, Eclipx is on track to meet prospectus forecast for FY2015
$m
Pro forma
FY14 Actual
FY15 Prospectus
Forecast 1H15 Actual Net Operating Income 155.0 169.7 83.3
NPATA1 36.5 47.0 23.8
New Business Written 622 773 396
Assets under management or financed2 1,577 1,719 1,675
1. Excludes significant items for FY14 Actual 2. End of period closing AUMOF balance
For
per
sona
l use
onl
y

1
Eclipx overview
2
For
per
sona
l use
onl
y
7
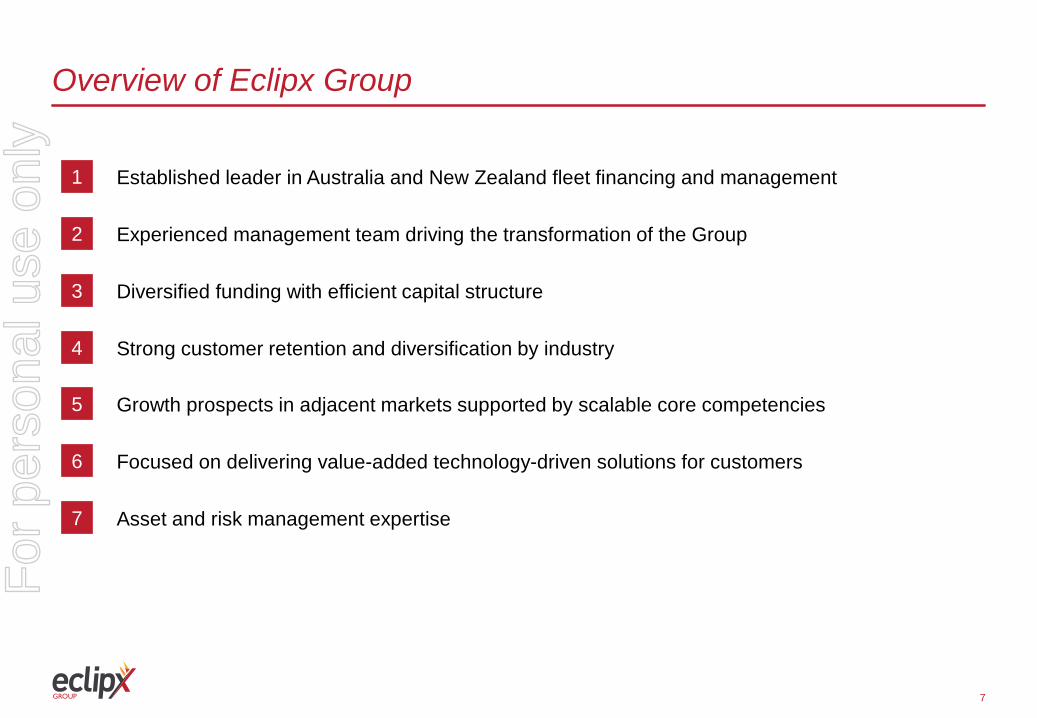
Overview of Eclipx Group
Established leader in Australia and New Zealand fleet financing and management 1
Experienced management team driving the transformation of the Group 2
Diversified funding with efficient capital structure 3
Strong customer retention and diversification by industry 4
Growth prospects in adjacent markets supported by scalable core competencies 5
Focused on delivering value-added technology-driven solutions for customers 6
Asset and risk management expertise 7
For
per
sona
l use
onl
y
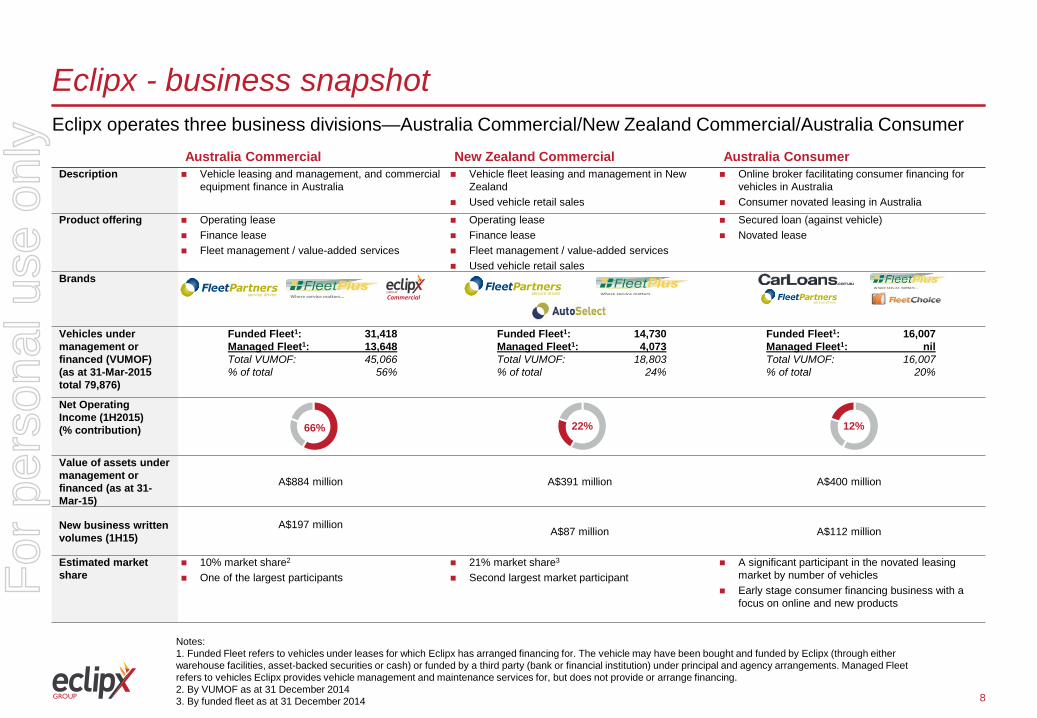
Notes: 1. Funded Fleet refers to vehicles under leases for which Eclipx has arranged financing for. The vehicle may have been bought and funded by Eclipx (through either warehouse facilities, asset-backed securities or cash) or funded by a third party (bank or financial institution) under principal and agency arrangements. Managed Fleet refers to vehicles Eclipx provides vehicle management and maintenance services for, but does not provide or arrange financing. 2. By VUMOF as at 31 December 2014 3. By funded fleet as at 31 December 2014
Eclipx - business snapshot
Australia Commercial New Zealand Commercial Australia Consumer Description Vehicle leasing and management, and commercial
equipment finance in Australia Vehicle fleet leasing and management in New
Zealand Used vehicle retail sales
Online broker facilitating consumer financing for vehicles in Australia
Consumer novated leasing in Australia
Product offering Operating lease Finance lease Fleet management / value-added services
Operating lease Finance lease Fleet management / value-added services Used vehicle retail sales
Secured loan (against vehicle) Novated lease
Brands
Vehicles under management or financed (VUMOF) (as at 31-Mar-2015 total 79,876)
Funded Fleet1: 31,418 Managed Fleet1: 13,648 Total VUMOF: 45,066 % of total 56%
Funded Fleet1: 14,730 Managed Fleet1: 4,073 Total VUMOF: 18,803 % of total 24%
Funded Fleet1: 16,007 Managed Fleet1: nil Total VUMOF: 16,007 % of total 20%
Net Operating Income (1H2015) (% contribution)
Value of assets under management or financed (as at 31-Mar-15)
A$884 million A$391 million A$400 million
New business written volumes (1H15)
A$197 million
A$87 million A$112 million
Estimated market share
10% market share2
One of the largest participants 21% market share3
Second largest market participant A significant participant in the novated leasing
market by number of vehicles Early stage consumer financing business with a
focus on online and new products
66% 22% 12%
Eclipx operates three business divisions—Australia Commercial/New Zealand Commercial/Australia Consumer
Commercial
8
For
per
sona
l use
onl
y
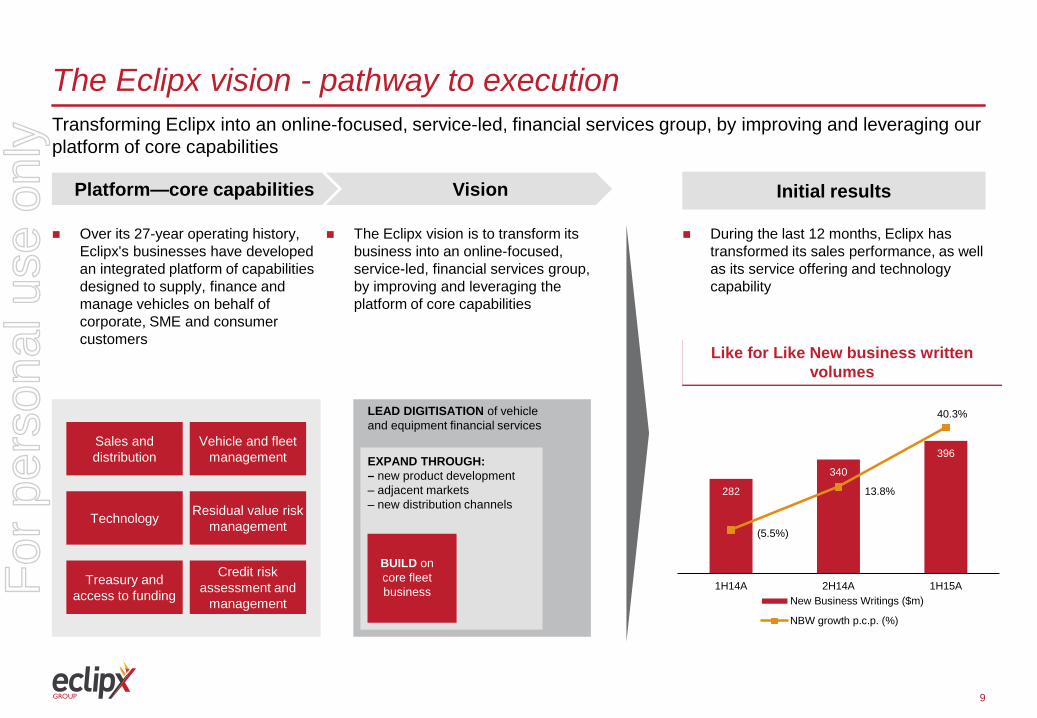
Like for Like New business written volumes
9
The Eclipx vision - pathway to execution
Over its 27-year operating history, Eclipx's businesses have developed an integrated platform of capabilities designed to supply, finance and manage vehicles on behalf of corporate, SME and consumer customers
Initial results Vision Platform—core capabilities
The Eclipx vision is to transform its business into an online-focused, service-led, financial services group, by improving and leveraging the platform of core capabilities
During the last 12 months, Eclipx has transformed its sales performance, as well as its service offering and technology capability
Sales and distribution
Technology
Treasury and access to funding
Vehicle and fleet management
Residual value risk management
Credit risk
assessment and management
BUILD on core fleet business
EXPAND THROUGH: – new product development – adjacent markets – new distribution channels
LEAD DIGITISATION of vehicle and equipment financial services
Transforming Eclipx into an online-focused, service-led, financial services group, by improving and leveraging our platform of core capabilities
282
340
396
(5.5%)
13.8%
40.3%
-25.0%
-15.0%
-5.0%
5.0%
15.0%
25.0%
35.0%
45.0%
0
50
100
150
200
250
300
350
400
450
500
1H14A 2H14A 1H15ANew Business Writings ($m)
NBW growth p.c.p. (%)
For
per
sona
l use
onl
y
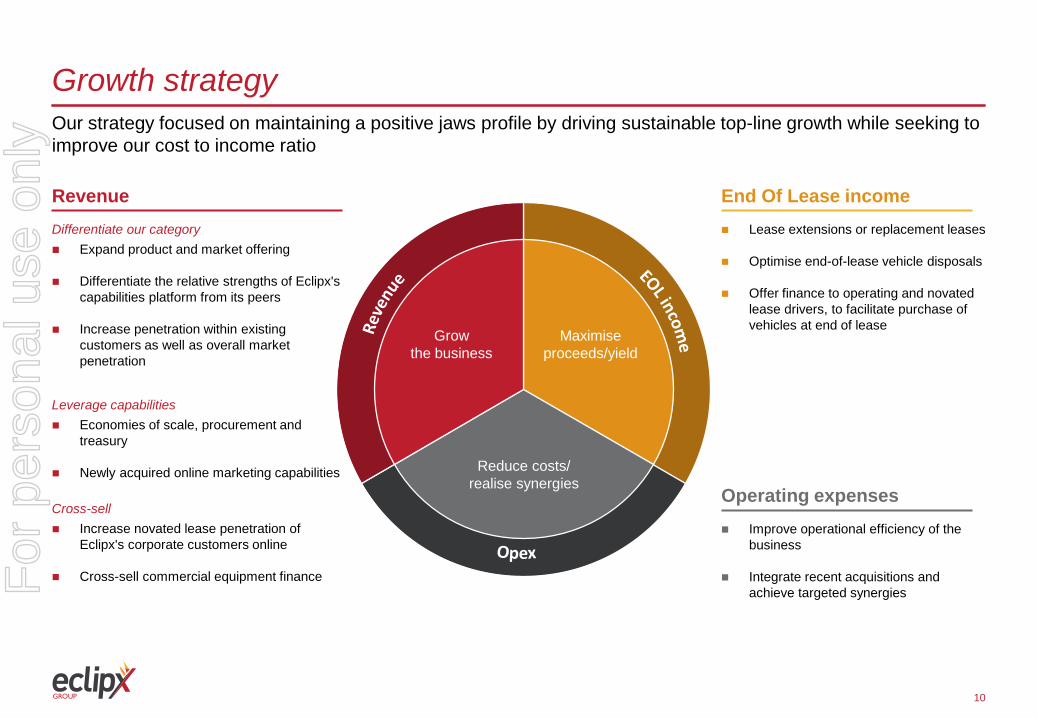
Growth strategy Our strategy focused on maintaining a positive jaws profile by driving sustainable top-line growth while seeking to improve our cost to income ratio
10
Differentiate our category Expand product and market offering
Differentiate the relative strengths of Eclipx's
capabilities platform from its peers
Increase penetration within existing customers as well as overall market penetration
Leverage capabilities Economies of scale, procurement and
treasury
Newly acquired online marketing capabilities
Cross-sell Increase novated lease penetration of
Eclipx's corporate customers online
Cross-sell commercial equipment finance
Revenue Lease extensions or replacement leases
Optimise end-of-lease vehicle disposals
Offer finance to operating and novated
lease drivers, to facilitate purchase of vehicles at end of lease
End Of Lease income
Improve operational efficiency of the business
Integrate recent acquisitions and achieve targeted synergies
Operating expenses
Grow the business
Reduce costs/ realise synergies
Maximise proceeds/yield
For
per
sona
l use
onl
y

1
Financial performance
3
For
per
sona
l use
onl
y
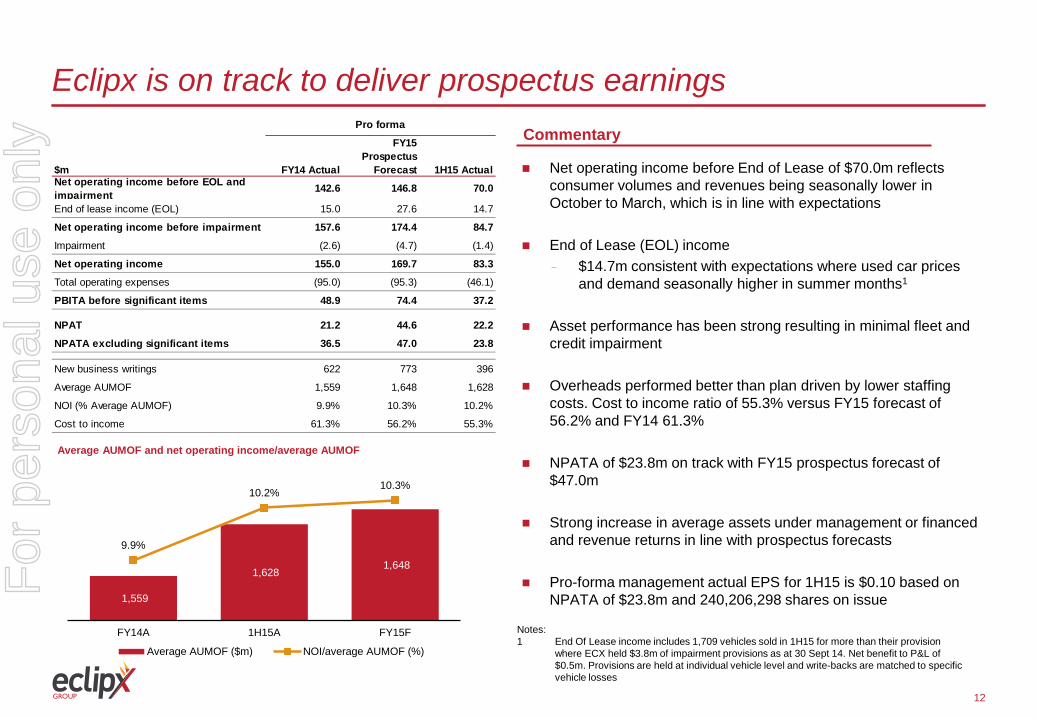
Eclipx is on track to deliver prospectus earnings
12
Net operating income before End of Lease of $70.0m reflects consumer volumes and revenues being seasonally lower in October to March, which is in line with expectations
End of Lease (EOL) income - $14.7m consistent with expectations where used car prices
and demand seasonally higher in summer months1 Asset performance has been strong resulting in minimal fleet and
credit impairment Overheads performed better than plan driven by lower staffing
costs. Cost to income ratio of 55.3% versus FY15 forecast of 56.2% and FY14 61.3%
NPATA of $23.8m on track with FY15 prospectus forecast of $47.0m
Strong increase in average assets under management or financed and revenue returns in line with prospectus forecasts
Pro-forma management actual EPS for 1H15 is $0.10 based on NPATA of $23.8m and 240,206,298 shares on issue
Commentary
Average AUMOF and net operating income/average AUMOF
Notes: 1 End Of Lease income includes 1,709 vehicles sold in 1H15 for more than their provision where ECX held $3.8m of impairment provisions as at 30 Sept 14. Net benefit to P&L of $0.5m. Provisions are held at individual vehicle level and write-backs are matched to specific vehicle losses
$m FY14 Actual
FY15Prospectus
Forecast 1H15 ActualNet operating income before EOL and impairment 142.6 146.8 70.0
End of lease income (EOL) 15.0 27.6 14.7
Net operating income before impairment 157.6 174.4 84.7
Impairment (2.6) (4.7) (1.4)
Net operating income 155.0 169.7 83.3
Total operating expenses (95.0) (95.3) (46.1)
PBITA before significant items 48.9 74.4 37.2
NPAT 21.2 44.6 22.2
NPATA excluding significant items 36.5 47.0 23.8
New business writings 622 773 396
Average AUMOF 1,559 1,648 1,628
NOI (% Average AUMOF) 9.9% 10.3% 10.2%
Cost to income 61.3% 56.2% 55.3%
Pro forma
1,559
1,628 1,648
9.9%
10.2% 10.3%
FY14A 1H15A FY15F
Average AUMOF ($m) NOI/average AUMOF (%)
For
per
sona
l use
onl
y
13
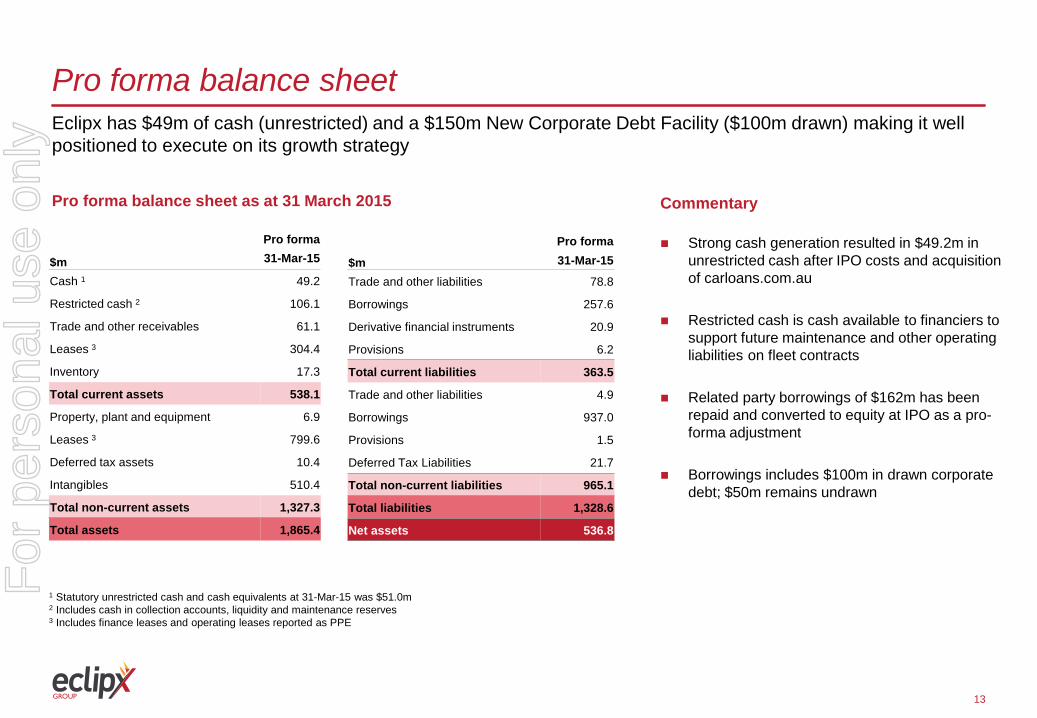
Pro forma balance sheet
Pro forma balance sheet as at 31 March 2015 Commentary
Eclipx has $49m of cash (unrestricted) and a $150m New Corporate Debt Facility ($100m drawn) making it well positioned to execute on its growth strategy
Strong cash generation resulted in $49.2m in unrestricted cash after IPO costs and acquisition of carloans.com.au
Restricted cash is cash available to financiers to support future maintenance and other operating liabilities on fleet contracts
Related party borrowings of $162m has been repaid and converted to equity at IPO as a pro-forma adjustment
Borrowings includes $100m in drawn corporate debt; $50m remains undrawn
1 Statutory unrestricted cash and cash equivalents at 31-Mar-15 was $51.0m 2 Includes cash in collection accounts, liquidity and maintenance reserves 3 Includes finance leases and operating leases reported as PPE
Pro forma
$m 31-Mar-15
Cash 1 49.2
Restricted cash 2 106.1
Trade and other receivables 61.1
Leases 3 304.4
Inventory 17.3
Total current assets 538.1
Property, plant and equipment 6.9
Leases 3 799.6
Deferred tax assets 10.4
Intangibles 510.4
Total non-current assets 1,327.3
Total assets 1,865.4
Pro forma
$m 31-Mar-15
Trade and other liabilities 78.8
Borrowings 257.6
Derivative financial instruments 20.9
Provisions 6.2
Total current liabilities 363.5
Trade and other liabilities 4.9
Borrowings 937.0
Provisions 1.5
Deferred Tax Liabilities 21.7
Total non-current liabilities 965.1
Total liabilities 1,328.6
Net assets 536.8
For
per
sona
l use
onl
y
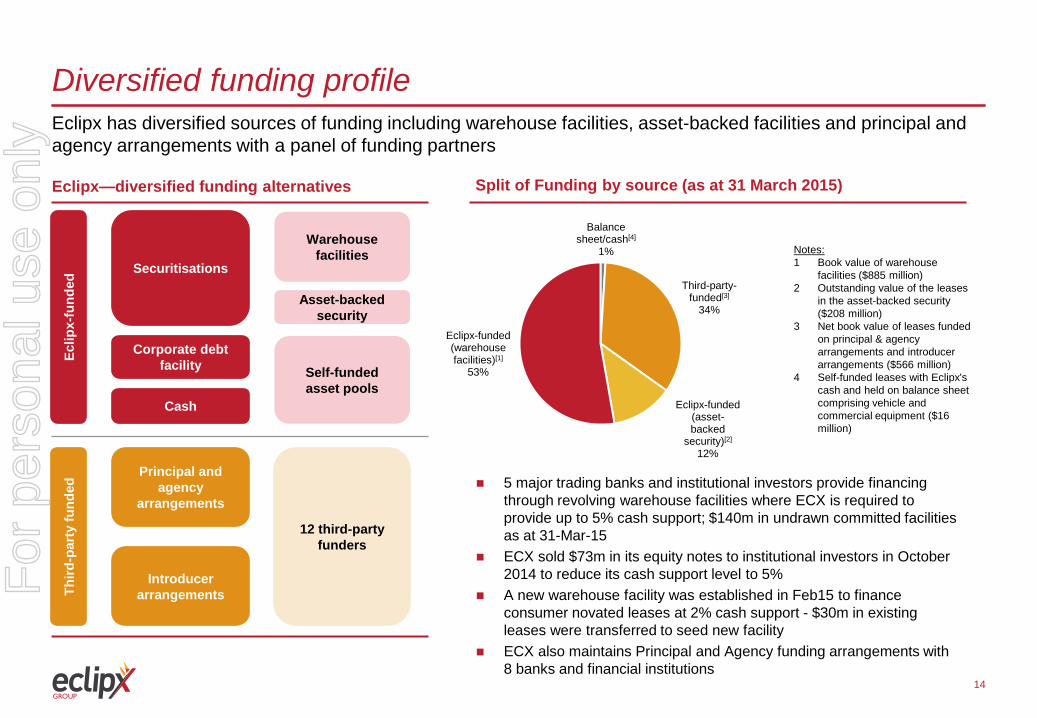
Diversified funding profile Eclipx has diversified sources of funding including warehouse facilities, asset-backed facilities and principal and agency arrangements with a panel of funding partners
14
Split of Funding by source (as at 31 March 2015) Eclipx—diversified funding alternatives
Eclip
x-fu
nded
Th
ird-p
arty
fund
ed
Securitisations
Corporate debt facility
Cash
Principal and agency
arrangements
Introducer arrangements
Warehouse facilities
Asset-backed security
Self-funded asset pools
12 third-party funders
Notes: 1 Book value of warehouse
facilities ($885 million) 2 Outstanding value of the leases
in the asset-backed security ($208 million)
3 Net book value of leases funded on principal & agency arrangements and introducer arrangements ($566 million)
4 Self-funded leases with Eclipx's cash and held on balance sheet comprising vehicle and commercial equipment ($16 million)
5 major trading banks and institutional investors provide financing through revolving warehouse facilities where ECX is required to provide up to 5% cash support; $140m in undrawn committed facilities as at 31-Mar-15
ECX sold $73m in its equity notes to institutional investors in October 2014 to reduce its cash support level to 5%
A new warehouse facility was established in Feb15 to finance consumer novated leases at 2% cash support - $30m in existing leases were transferred to seed new facility
ECX also maintains Principal and Agency funding arrangements with 8 banks and financial institutions
Balance sheet/cash[4]
1%
Third-party-funded[3]
34%
Eclipx-funded (asset-backed
security)[2] 12%
Eclipx-funded (warehouse facilities)[1]
53%
For
per
sona
l use
onl
y

1
Segment performance and outlook
4
For
per
sona
l use
onl
y
16
Australia Commercial Australia Commercial – a standout performance in 1H15
Segment performance
Comments Pro forma
1H15
Actual FY15
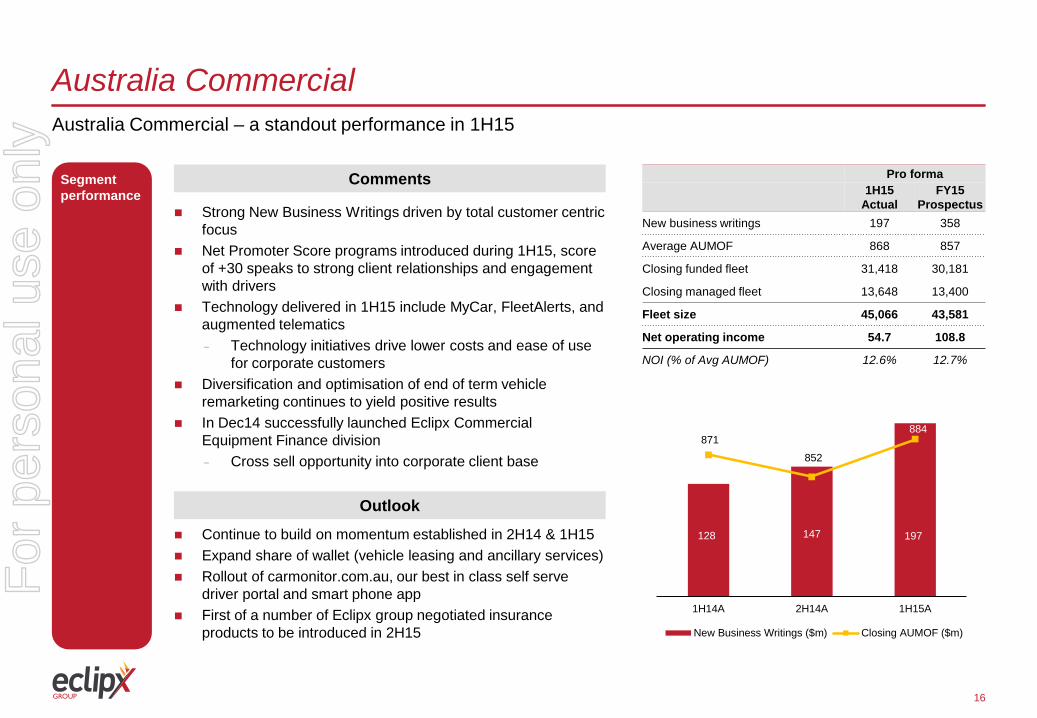
Prospectus New business writings 197 358
Average AUMOF 868 857
Closing funded fleet 31,418 30,181
Closing managed fleet 13,648 13,400
Fleet size 45,066 43,581
Net operating income 54.7 108.8
NOI (% of Avg AUMOF) 12.6% 12.7%
Strong New Business Writings driven by total customer centric focus
Net Promoter Score programs introduced during 1H15, score of +30 speaks to strong client relationships and engagement with drivers
Technology delivered in 1H15 include MyCar, FleetAlerts, and augmented telematics - Technology initiatives drive lower costs and ease of use
for corporate customers Diversification and optimisation of end of term vehicle
remarketing continues to yield positive results In Dec14 successfully launched Eclipx Commercial
Equipment Finance division - Cross sell opportunity into corporate client base
Outlook
Continue to build on momentum established in 2H14 & 1H15 Expand share of wallet (vehicle leasing and ancillary services) Rollout of carmonitor.com.au, our best in class self serve
driver portal and smart phone app First of a number of Eclipx group negotiated insurance
products to be introduced in 2H15
128 147 197
871
852
884
1H14A 2H14A 1H15A
New Business Writings ($m) Closing AUMOF ($m)
For
per
sona
l use
onl
y
17
New Zealand Commercial Robust growth in New Zealand
Segment performance
Comments Pro forma
1H15
Actual FY15
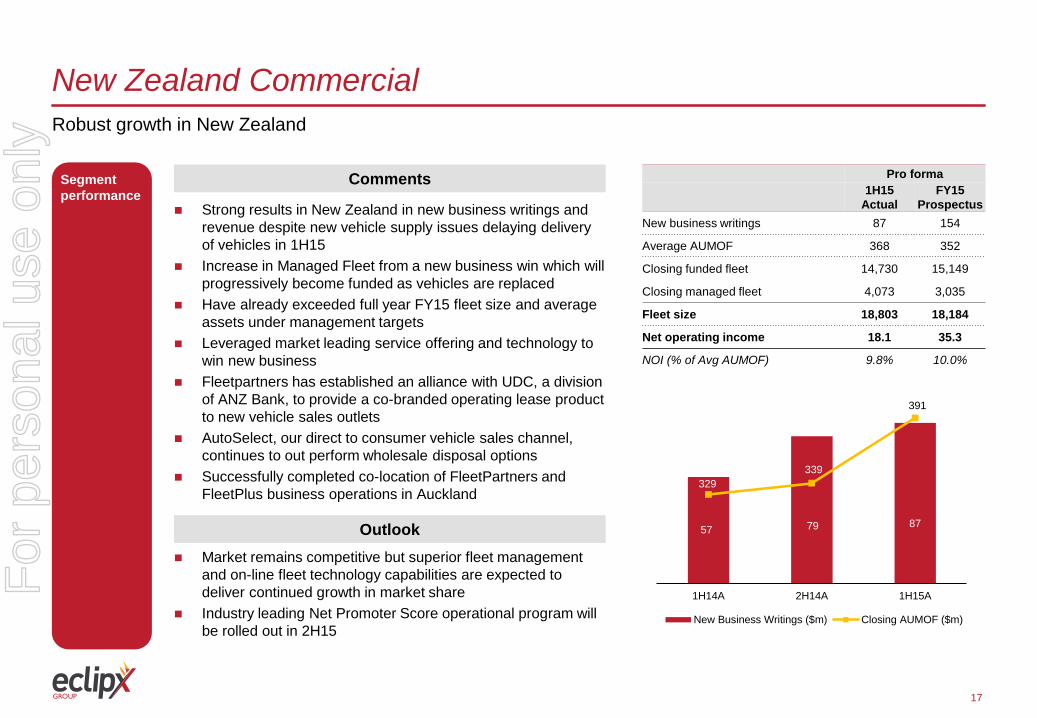
Prospectus New business writings 87 154
Average AUMOF 368 352
Closing funded fleet 14,730 15,149
Closing managed fleet 4,073 3,035
Fleet size 18,803 18,184
Net operating income 18.1 35.3
NOI (% of Avg AUMOF) 9.8% 10.0%
Strong results in New Zealand in new business writings and revenue despite new vehicle supply issues delaying delivery of vehicles in 1H15
Increase in Managed Fleet from a new business win which will progressively become funded as vehicles are replaced
Have already exceeded full year FY15 fleet size and average assets under management targets
Leveraged market leading service offering and technology to win new business
Fleetpartners has established an alliance with UDC, a division of ANZ Bank, to provide a co-branded operating lease product to new vehicle sales outlets
AutoSelect, our direct to consumer vehicle sales channel, continues to out perform wholesale disposal options
Successfully completed co-location of FleetPartners and FleetPlus business operations in Auckland
Outlook Market remains competitive but superior fleet management
and on-line fleet technology capabilities are expected to deliver continued growth in market share
Industry leading Net Promoter Score operational program will be rolled out in 2H15
57 79 87
329 339
391
1H14A 2H14A 1H15A
New Business Writings ($m) Closing AUMOF ($m)
For
per
sona
l use
onl
y
18
Australia Consumer Significant market opportunities for Eclipx
Segment performance
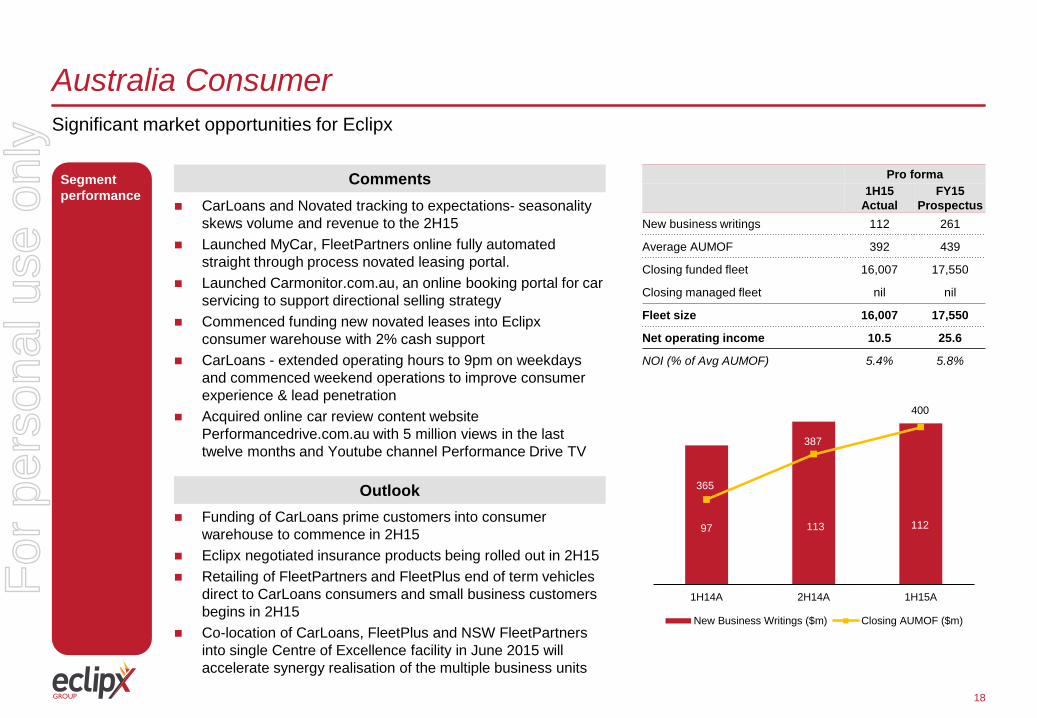
Comments CarLoans and Novated tracking to expectations- seasonality
skews volume and revenue to the 2H15 Launched MyCar, FleetPartners online fully automated
straight through process novated leasing portal. Launched Carmonitor.com.au, an online booking portal for car
servicing to support directional selling strategy Commenced funding new novated leases into Eclipx
consumer warehouse with 2% cash support CarLoans - extended operating hours to 9pm on weekdays
and commenced weekend operations to improve consumer experience & lead penetration
Acquired online car review content website Performancedrive.com.au with 5 million views in the last twelve months and Youtube channel Performance Drive TV
Pro forma
1H15
Actual FY15
Prospectus New business writings 112 261
Average AUMOF 392 439
Closing funded fleet 16,007 17,550
Closing managed fleet nil nil
Fleet size 16,007 17,550
Net operating income 10.5 25.6
NOI (% of Avg AUMOF) 5.4% 5.8%
Outlook Funding of CarLoans prime customers into consumer
warehouse to commence in 2H15 Eclipx negotiated insurance products being rolled out in 2H15 Retailing of FleetPartners and FleetPlus end of term vehicles
direct to CarLoans consumers and small business customers begins in 2H15
Co-location of CarLoans, FleetPlus and NSW FleetPartners into single Centre of Excellence facility in June 2015 will accelerate synergy realisation of the multiple business units
97 113 112
365
387
400
1H14A 2H14A 1H15A
New Business Writings ($m) Closing AUMOF ($m)
For
per
sona
l use
onl
y
19
Outlook Eclipx is well placed to meet prospectus forecasts and grow market share
ECX is well placed with technology, customer service and efficient funding platforms – all are key determinants to success in this segment
Benign fleet leasing competitive environment with a number of major participants currently distracted with internal issues
New product initiatives and extended operating hours (alignment with lead arrival patterns) expected to increase consumer revenue from 2H15
Used vehicle prices continue to be supported by low interest rates and AUD, low unemployment, no change to FBT and continued strong levels of migration
Latest Australian Federal Budget provides opportunities for ECX to sell its sub $20,000 end of lease vehicles to small businesses who can claim full tax deduction under newly announced Government tax incentives. Sale will be facilitated through carloans.com.au and other ECX URL’s where loan product will be offered to small business
Continued focus on value accretive acquisition opportunities
F
or p
erso
nal u
se o
nly
20
Outlook Dividend expected between 60% and 70% of pro forma 2H15 NPAT
Payout ratio - Expected to be based on a target payout ratio of between 60% and 70% of pro forma NPAT for the six months ending 30 September
2015 Franking
- anticipated by the Directors to be fully franked
For
per
sona
l use
onl
y

1
Summarised financial statements
A
For
per
sona
l use
onl
y
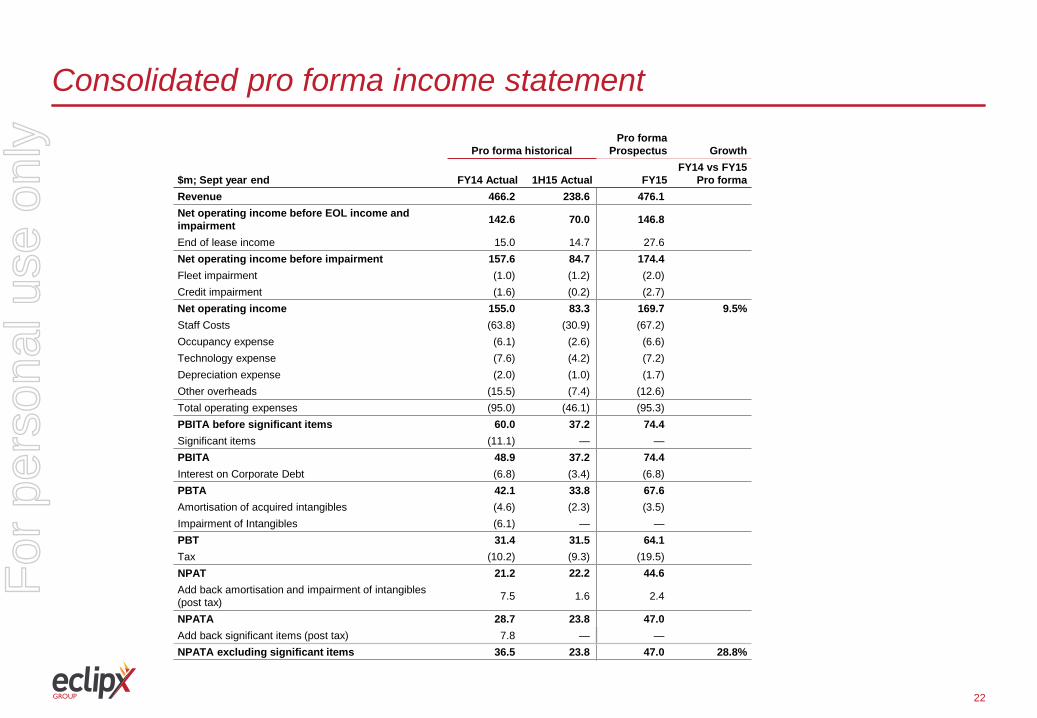
Pro forma historical Pro forma
Prospectus Growth
$m; Sept year end FY14 Actual 1H15 Actual FY15 FY14 vs FY15
Pro forma Revenue 466.2 238.6 476.1 Net operating income before EOL income and impairment 142.6 70.0 146.8
End of lease income 15.0 14.7 27.6 Net operating income before impairment 157.6 84.7 174.4 Fleet impairment (1.0) (1.2) (2.0) Credit impairment (1.6) (0.2) (2.7) Net operating income 155.0 83.3 169.7 9.5% Staff Costs (63.8) (30.9) (67.2) Occupancy expense (6.1) (2.6) (6.6) Technology expense (7.6) (4.2) (7.2) Depreciation expense (2.0) (1.0) (1.7) Other overheads (15.5) (7.4) (12.6) Total operating expenses (95.0) (46.1) (95.3) PBITA before significant items 60.0 37.2 74.4 Significant items (11.1) — — PBITA 48.9 37.2 74.4 Interest on Corporate Debt (6.8) (3.4) (6.8) PBTA 42.1 33.8 67.6 Amortisation of acquired intangibles (4.6) (2.3) (3.5) Impairment of Intangibles (6.1) — — PBT 31.4 31.5 64.1 Tax (10.2) (9.3) (19.5) NPAT 21.2 22.2 44.6 Add back amortisation and impairment of intangibles (post tax) 7.5 1.6 2.4
NPATA 28.7 23.8 47.0 Add back significant items (post tax) 7.8 — — NPATA excluding significant items 36.5 23.8 47.0 28.8%
22
Consolidated pro forma income statement F
or p
erso
nal u
se o
nly
23
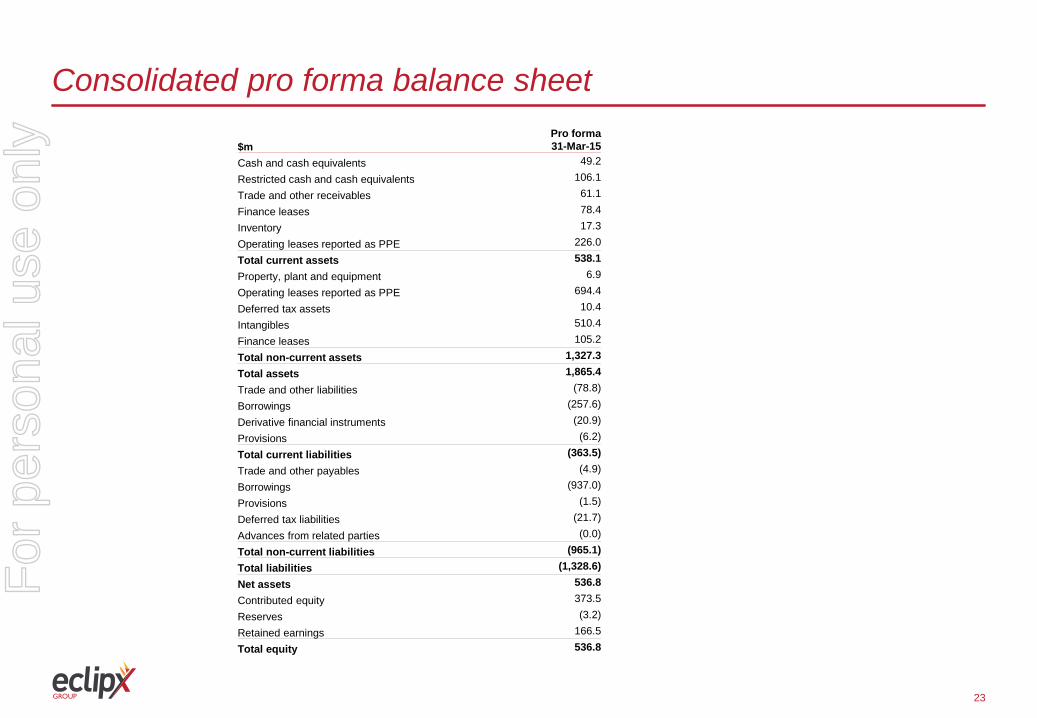
Consolidated pro forma balance sheet
$m Pro forma 31-Mar-15
Cash and cash equivalents 49.2
Restricted cash and cash equivalents 106.1
Trade and other receivables 61.1
Finance leases 78.4
Inventory 17.3
Operating leases reported as PPE 226.0
Total current assets 538.1 Property, plant and equipment 6.9
Operating leases reported as PPE 694.4
Deferred tax assets 10.4
Intangibles 510.4
Finance leases 105.2
Total non-current assets 1,327.3 Total assets 1,865.4 Trade and other liabilities (78.8)
Borrowings (257.6)
Derivative financial instruments (20.9)
Provisions (6.2)
Total current liabilities (363.5) Trade and other payables (4.9)
Borrowings (937.0)
Provisions (1.5)
Deferred tax liabilities (21.7)
Advances from related parties (0.0)
Total non-current liabilities (965.1) Total liabilities (1,328.6) Net assets 536.8 Contributed equity 373.5
Reserves (3.2)
Retained earnings 166.5
Total equity 536.8
For
per
sona
l use
onl
y
24
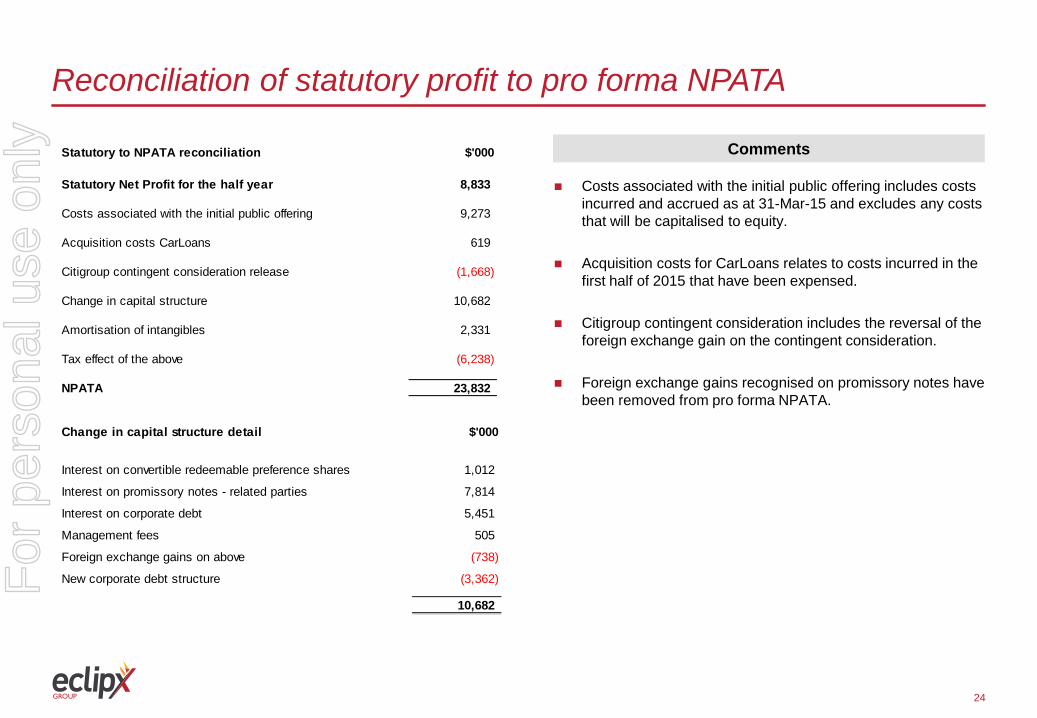
Reconciliation of statutory profit to pro forma NPATA
Costs associated with the initial public offering includes costs incurred and accrued as at 31-Mar-15 and excludes any costs that will be capitalised to equity.
Acquisition costs for CarLoans relates to costs incurred in the first half of 2015 that have been expensed.
Citigroup contingent consideration includes the reversal of the foreign exchange gain on the contingent consideration.
Foreign exchange gains recognised on promissory notes have been removed from pro forma NPATA.
Comments Statutory to NPATA reconciliation $'000
Statutory Net Profit for the half year 8,833
Costs associated with the initial public offering 9,273
Acquisition costs CarLoans 619
Citigroup contingent consideration release (1,668)
Change in capital structure 10,682
Amortisation of intangibles 2,331
Tax effect of the above (6,238)
NPATA 23,832
Change in capital structure detail $'000
Interest on convertible redeemable preference shares 1,012
Interest on promissory notes - related parties 7,814
Interest on corporate debt 5,451
Management fees 505
Foreign exchange gains on above (738)
New corporate debt structure (3,362)
10,682
For
per
sona
l use
onl
y