Embed Size (px)
Citation preview
Project #4639A
Level 1 Water Audit Validation:Guidance Manual
Level 1 Water Audit Validation: Guidance Manual
©2016 Water Research Foundation. ALL RIGHTS RESERVED
About the Water Research Foundation
The Water Research Foundation (WRF) is a member-supported, international, 501(c)3 nonprofit organization that sponsors research that enables water utilities, public health agencies, and other professionals to provide safe and affordable drinking water to consumers.
WRF’s mission is to advance the science of water to improve the quality of life. To achieve this mission, WRF sponsors studies on all aspects of drinking water, including resources, treatment, and distribution. Nearly 1,000 water utilities, consulting firms, and manufacturers in North America and abroad contribute subscription payments to support WRF’s work. Additional funding comes from collaborative partnerships with other national and international organizations and the U.S. federal government, allowing for resources to be leveraged, expertise to be shared, and broad-based knowledge to be developed and disseminated.
From its headquarters in Denver, Colorado, WRF’s staff directs and supports the efforts of more than 800 volunteers who serve on the board of directors and various committees. These volunteers represent many facets of the water industry, and contribute their expertise to select and monitor research studies that benefit the entire drinking water community.
Research results are disseminated through a number of channels, including reports, the Website, Webcasts, workshops, and periodicals.
WRF serves as a cooperative program providing subscribers the opportunity to pool their resources and build upon each other’s expertise. By applying WRF research findings, subscribers can save substantial costs and stay on the leading edge of drinking water science and technology. Since its inception, WRF has supplied the water community with more than $460 million in applied research value.
More information about WRF and how to become a subscriber is available at www.WaterRF.org.
©2016 Water Research Foundation. ALL RIGHTS RESERVED
Level 1 Water Audit Validation: Guidance Manual
Prepared by: Lucy Andrews, Kate Gasner, and Reinhard Sturm Water Systems Optimization George Kunkel Kunkel Water Efficiency Consulting Will Jernigan and Steve Cavanaugh Cavanaugh
Sponsored by: Water Research Foundation 6666 West Quincy Avenue, Denver, CO 80235
Published by:
©2016 Water Research Foundation. ALL RIGHTS RESERVED
DISCLAIMER
This guidance manual was funded by the Water Research Foundation (WRF). WRF assumes no responsibility for the content of the research study reported in this
publication or for the opinions or statements of fact expressed in this report. The mention of trade names for commercial products does not represent or imply the approval or endorsement of WRF. This report is presented solely for informational
purposes.
Copyright © 2016 by Water Research Foundation
ALL RIGHTS RESERVED.
No part of this publication may be copied, reproduced, or otherwise utilized without permission.
ISBN 978-1-60573-278-7
Printed in the U.S.A.
©2016 Water Research Foundation. ALL RIGHTS RESERVED

v
TABLE OF CONTENTS
LIST OF TABLES ............................................................................................................................... vii
FOREWORD ..................................................................................................................................... ix
ACKNOWLEDGMENTS ..................................................................................................................... xi
OVERVIEW .................................................................................................................................... xvii
ABOUT THIS MANUAL ................................................................................................................... xix
CHAPTER 1: WHAT IS A WATER AUDIT? ......................................................................................... 1
Why Should I Perform a Water Audit? ............................................................................... 1
What Tools Can Assist Me in Preparing a Water Audit? .................................................... 2
American Water Works Association Manual M36: Water Audits and Water
Loss Control Programs ................................................................................ 2
American Water Works Association Free Water Audit Software and Compiler
Software ...................................................................................................... 2
Water Research Foundation Leakage Component Analysis Model ....................... 3
CHAPTER 2: HOW DOES DATA QUALITY AFFECT A WATER AUDIT? ............................................... 5
What Factors Influence Data Quality? ................................................................................ 5
Primary Measurement of Raw Water Audit Data................................................... 5
Secondary Data Transfer and Summary of Primary Measurements ...................... 6
Human Interaction with Data and Methodology, Including Estimation ................ 7
How Does the AWWA Software Assess Data Quality? ....................................................... 7
CHAPTER 3: WHAT IS WATER AUDIT VALIDATION? ....................................................................... 9
What are the Levels of Water Audit Validation? ................................................................ 9
Who Should Validate Water Audits? ................................................................................ 10
CHAPTER 4: WHAT DEFINES LEVEL 1 WATER AUDIT VALIDATION? ............................................. 13
What Does Level 1 Water Audit Validation Do? ............................................................... 13
What Does Level 1 Water Audit Validation Not Do? ........................................................ 13
CHAPTER 5: HOW DO I PERFORM LEVEL 1 WATER AUDIT VALIDATION? .................................... 15
Step 1: Receive and Review the Water Audit and Supporting Documentation ............... 15
Step 2: Examine Performance Indicators for Evidence of Inaccuracy .............................. 16
Non‐Revenue Water as a Percent by Cost of Operating System .......................... 17
Apparent Losses Per Service Connection Per Day ................................................ 17
Real Losses (Normalized) ...................................................................................... 18
©2016 Water Research Foundation. ALL RIGHTS RESERVED
vi
Infrastructure Leakage Index ................................................................................ 18
Summary ............................................................................................................... 19
Step 3: Validate Audit Inputs and Confirm Correct Application of Methodology ............ 19
Volume from Own Sources ................................................................................... 21
Volume from Own Sources – Master Meter and Supply Error Adjustment ......... 23
Water Imported .................................................................................................... 25
Volume Imported – Master Meter and Supply Error Adjustment ....................... 28
Water Exported ..................................................................................................... 30
Volume Exported – Master Meter and Supply Error Adjustment ........................ 32
Billed Metered Authorized Consumption ............................................................. 33
Billed Unmetered Authorized Consumption ........................................................ 36
Unbilled Metered Authorized Consumption ........................................................ 38
Unbilled Unmetered Authorized Consumption .................................................... 40
Unauthorized Consumption .................................................................................. 42
Customer Metering Inaccuracies .......................................................................... 44
Systematic Data Handling Errors .......................................................................... 47
Length of Mains .................................................................................................... 50
Number of Active and Inactive Service Connections ............................................ 52
Average Length of Customer Service Line ............................................................ 55
Average Operating Pressure ................................................................................. 57
Total Annual Cost of Operating Water System ..................................................... 60
Customer Retail Unit Cost ..................................................................................... 62
Variable Production Cost ...................................................................................... 65
Step 4: Re‐Examine Performance Indicators for Evidence of Persisting
Inaccuracy ............................................................................................................. 68
Step 5: Document Results ................................................................................................. 69
CHAPTER 6: WHAT ARE ADVANCED VALIDATION OPTIONS? ....................................................... 71
What are Examples of Level 2 Water Audit Validation? ................................................... 71
What are Examples of Level 3 Water Audit Validation? ................................................... 72
What Should I Do After Validating My Water Audit? ....................................................... 73
APPENDIX A: LEVEL 1 VALIDATION CHECKLIST ............................................................................. 75
REFERENCES AND RESOURCES ...................................................................................................... 85
ABBREVIATIONS ............................................................................................................................ 87
NOTES ............................................................................................................................................ 89
©2016 Water Research Foundation. ALL RIGHTS RESERVED
vii
LIST OF TABLES
1 Performance indicator checks ................................................................................................. 19
2 Performance indicator checks ................................................................................................. 68
©2016 Water Research Foundation. ALL RIGHTS RESERVED

©2016 Water Research Foundation. ALL RIGHTS RESERVED
ix
FOREWORD
The Water Research Foundation (WRF) is a nonprofit corporation dedicated to the development
and implementation of scientifically sound research designed to help drinking water utilities
respond to regulatory requirements and address high‐priority concerns. WRF’s research agenda
is developed through a process of consultation with WRF subscribers and other drinking water
professionals. WRF’s Board of Directors and other professional volunteers help prioritize and
select research projects for funding based upon current and future industry needs, applicability,
and past work. WRF sponsors research projects through the Focus Area, Emerging Opportunities,
and Tailored Collaboration programs, as well as various joint research efforts with organizations
such as the U.S. Environmental Protection Agency and the U.S. Bureau of Reclamation.
This publication is a result of a research project fully funded or funded in part by WRF subscribers.
WRF’s subscription program provides a cost‐effective and collaborative method for funding
research in the public interest. The research investment that underpins this report will
intrinsically increase in value as the findings are applied in communities throughout the world.
WRF research projects are managed closely from their inception to the final report by the staff
and a large cadre of volunteers who willingly contribute their time and expertise. WRF provides
planning, management, and technical oversight and awards contracts to other institutions such
as water utilities, universities, and engineering firms to conduct the research.
A broad spectrum of water supply issues is addressed by WRF's research agenda, including
resources, treatment and operations, distribution and storage, water quality and analysis,
toxicology, economics, and management. The ultimate purpose of the coordinated effort is to
assist water suppliers to provide a reliable supply of safe and affordable drinking water to
consumers. The true benefits of WRF’s research are realized when the results are implemented
at the utility level. WRF's staff and Board of Directors are pleased to offer this publication as a
contribution toward that end.
Charles M. Murray Robert C. Renner, P.E.
Chair, Board of Directors Chief Executive Officer
Water Research Foundation Water Research Foundation
©2016 Water Research Foundation. ALL RIGHTS RESERVED

©2016 Water Research Foundation. ALL RIGHTS RESERVED
xi
ACKNOWLEDGMENTS
The authors wish to acknowledge the members of the Project Advisory Committee, who provided
valuable feedback on the content and accessibility of this document:
Rose Gavrilovic – South Central Connecticut Regional Water Authority (New Haven, CT)
Chris Leauber – Water and Wastewater Authority of Wilson County (Lebanon, TN)
Ralph McCord – Louisville Water Company (Louisville, KY)
Jen Santini – American Water Works Association (Denver, CO)
David Sayers – Black and Veatch (Philadelphia, PA)
The authors also wish to acknowledge Megan Karklins, Water Research Foundation editorial
assistant, for her support in preparing the final report.
Finally, thank you to Maureen Hodgins, Water Research Foundation research manager, for her
contributions to and guidance of this project.
©2016 Water Research Foundation. ALL RIGHTS RESERVED

©2016 Water Research Foundation. ALL RIGHTS RESERVED
xiii
OVERVIEW
Hello! Welcome to the world of water audit validation.
This manual will guide you through the process of level 1 water audit validation. It will also
highlight the factors that influence water audit data quality and connect you with additional
resources.
But first – a little bit of background information.
WHAT IS AN AWWA WATER AUDIT? WHAT IS WATER LOSS CONTROL?
An American Water Works Association water audit – hereafter referred to simply as a “water
audit” – accounts for all water introduced into a water distribution system and then consumed
in order to estimate volumes of water loss. When a utility understands its volumes of water loss,
it can act to cost‐effectively reduce water loss.
This practice of assessing water distribution efficiency, evaluating the economic parameters of
water loss management, and then acting to reduce water loss to an economically‐efficient level
is referred to as water loss control.
Effective water loss control offers a host of benefits to a water utility, including:
Water conservation
Increased revenue
Reduced operating costs
Reduced liability
Strengthened credibility with stakeholders
Improved infrastructure management
Improved data accuracy
WHAT IS WATER AUDIT VALIDATION?
Water audit validation is the process of examining water audit inputs to improve the water
audit’s accuracy and document the uncertainty associated with water audit data. Though water
audit validation can be conducted at three distinct levels of rigor, all water audit validation efforts
share two common goals.
©2016 Water Research Foundation. ALL RIGHTS RESERVED
xiv
As outlined by Sturm et al. (forthcoming), water audit validation aims to:
1. Identify and appropriately correct for inaccuracies in water audit data and application
of methodology
2. Evaluate and communicate the uncertainty inherent in water audit data
In order for a water audit to effectively inform utility management and water loss control
programming, it must accurately capture the performance of a distribution system. Water audit
reliability, and therefore the data informing water loss management, is improved through water
audit validation.
Without a methodical, validated water audit, it is possible that estimations of water loss
misrepresent what a utility is actually experiencing. As a result, a water audit that has not been
validated can mislead stakeholders, customers, regulators, and utility management in stewarding
valuable water and financial resources. Additionally, each of the three levels of validation
corresponds to certain goals, outcomes, and limitations.
By validating a water audit, you will deepen your understanding of the water distribution system,
the data sources available, and the opportunities presented by water loss control.
Let’s get started!
©2016 Water Research Foundation. ALL RIGHTS RESERVED
xv
ABOUT THIS MANUAL
This manual has three objectives:
1. Provide step‐by‐step instruction in level 1 water audit validation.
2. Define a standard of care and documentation for level 1 water audit validation.
3. Highlight the factors that influence water audit data quality.
To accomplish these goals, this manual begins with an explanation of the tools and resources
available to compile water audits.
Then, this manual discusses the relationship between data quality and data validation before
discussing the role of the validator and the distinct levels of validation.
Finally, this manual guides you step‐by‐step through level 1 water audit validation and briefly
explores higher‐level validation activities.
Chapter 1 What is a water audit?
Chapter 2 How does data quality affect a water audit?
Chapter 3 What is water audit validation?
Chapter 4 What defines level 1 water audit validation?
Chapter 5 How do I perform level 1 water audit validation?
Chapter 6 What are advanced validation options?
©2016 Water Research Foundation. ALL RIGHTS RESERVED

©2016 Water Research Foundation. ALL RIGHTS RESERVED
1
CHAPTER 1
WHAT IS A WATER AUDIT?
An audit is a systematic examination of records or accounts to confirm their accuracy and ensure
the viability of the entity being audited. Audits are common in the world of finance and
accounting.
Similar to financial audits, water audits review records and data that trace the flow of water from
the point of potable system input, through the distribution system, and to customer delivery.
A water audit accounts for all water introduced into a water distribution system and then
consumed in order to estimate volumes of water loss.
Water auditing is often conducted with a worksheet that tallies annual volumes of potable
supply, customer consumption, utility operational use, and water losses. A standard water audit
also tracks relevant summary costs and calculates a suite of performance indicators to assess the
efficiency of the water utility in supplying drinking water.
Through this process of volumetric accounting, a water audit aims to:
1. Account for all volumetric inputs and outputs in a distribution system during an audit
period to derive volumes of water loss.
2. Study the reliability and accuracy of water audit data sources to qualify the potential
uncertainty of water audit results.
3. Communicate system efficiency with a suite of calculated performance indicators.
WHY SHOULD I PERFORM A WATER AUDIT?
Water auditing provides structured accountability to a water utility’s operations.
Additionally, in performing a water audit, the auditor will:
Assemble and present information in a standardized format for reliable assessment,
tracking, and comparison.
Provide foundational data and metrics to inform water loss control programs, improve
water distribution efficiency, increase revenue, and save water and money.
Meet regulatory requirements in certain US states and Canadian provinces.
Improve staff knowledge of utility operations and integration between utility
departments.
©2016 Water Research Foundation. ALL RIGHTS RESERVED
2
Water suppliers are stewards of the valuable water resources that they manage, but they must
also be fiscally responsible to customers, regulatory agencies, and the stakeholders. Water
auditing supports these goals.
WHAT TOOLS CAN ASSIST ME IN PREPARING A WATER AUDIT?
The International Water Association publication, Performance Indicators for Water Supply
Services (Alegre et al. 2000), defined the terms and process of the water audit approach discussed
in this guidance manual. Later publications expanded upon the concepts or discussed them in
more detail. A handful of software tools and authoritative sources of methodological guidance
support water loss control efforts in the drinking water industry. These tools, published by the
American Water Works Association (AWWA) and the Water Research Foundation (WRF),
promote a standardized, robust approach to water loss assessment and intervention. Because
the AWWA and WRF tools are accessible and consistent, a growing number of state, regional,
and provincial regulatory agencies have adopted requirements for water auditing that harness
these resources.
American Water Works Association Manual M36: Water Audits and Water Loss Control
Programs
The American Water Works Association (AWWA) promotes water auditing as the best practice
for assessing water losses. To facilitate water auditing that follows a standardized methodology,
AWWA publishes guidance manual M36: Water Audits and Loss Control Programs. The 3rd edition
(and later editions) contain major revisions to the water audit terms and process based on Alegre
et al. (2000). At the time of this manual’s publication, the most up‐to‐date version of M36 is the
fourth edition.
American Water Works Association Free Water Audit Software and Compiler Software
To support utilities in preparing standardized water audits, the Software Subcommittee of the
AWWA Water Loss Control Committee created the AWWA Free Water Audit Software (“AWWA
Software”), available for free download from the AWWA Water Loss Control web portal. The
AWWA Software is a Microsoft Excel spreadsheet tool that allows users to develop a water
balance, access standard definitions, qualify data validity, and calculate performance indicators.
At the time of this manual’s publication, AWWA Software version 5.0 is the most recent software
iteration. As a result, this guidance manual deals specifically with AWWA Software version 5.0,
though the philosophy and process of assessing data validity will likely apply to future versions
of the Software.
The AWWA Software Subcommittee also publishes a compiler tool available for download from
the Water Loss Control web portal to enable utilities and their partners to assess multiple water
audits simultaneously. The current iteration of the Microsoft Excel‐based AWWA Compiler
©2016 Water Research Foundation. ALL RIGHTS RESERVED
3
Software can combine thousands of individual audits at a time into a single flat spreadsheet. The
Compiler Software allows benchmarking among utilities and multi‐year performance tracking for
the same utility.
Water Research Foundation Leakage Component Analysis Model
A water audit generates an initial estimate of the total volume of Real Losses, but additional
leakage data and analysis is necessary to plan cost‐effective Real Loss reduction. To determine
the most appropriate interventions against leakage, a utility should complete a Component
Analysis of Real Losses after preparing a water audit. A Component Analysis of Real Losses divides
the total volume of leakage into distinct types of leakage based on how the leakage can be
discovered and reduced.
The Water Research Foundation offers a free software tool for utilities to conduct a Component
Analysis of Real Losses. The tool, Leakage Component Analysis software, collates and analyzes
leak repair and infrastructure data so that the user can plan cost‐effective interventions against
leakage. Leakage Component Analysis software can be downloaded from the Water Research
Foundation’s project 4372 webpage.
©2016 Water Research Foundation. ALL RIGHTS RESERVED

©2016 Water Research Foundation. ALL RIGHTS RESERVED

5
Inaccuracy and uncertainty can be introduced into a water audit at three distinct levels of data
production (Sturm et al. forthcoming):
primary measurement of raw water audit data
secondary data transfer and summary of primary measurements
human interaction with data and methodology, including estimation
CHAPTER 2
HOW DOES DATA QUALITY AFFECT A WATER AUDIT?
The accuracy of each data input directly affects the accuracy of the final water audit. Accurate
water audits allow for effective water loss control strategies to be planned. Therefore, it’s
essential that the quality of data that supports a water audit is examined and understood.
By studying the quality of water audit data, a water audit validator will:
explore and document uncertainty
minimize inaccuracy
WHAT FACTORS INFLUENCE DATA QUALITY?
To validate water audit data, it’s helpful to appreciate how inaccuracy and uncertainty can be
introduced into a water audit.
When validating a water audit, the validator should keep each of these sources of inaccuracy and
uncertainty in mind to minimize and document their effects on the overall quality of a water
audit.
Primary Measurement of Raw Water Audit Data
Primary measurements – the raw values recorded by instruments that capture volumes, flow
rates, pressure, and other essential facets of utility operations – form the foundation of a water
audit. Inaccuracies in foundational data cumulatively contribute to overall water audit
inaccuracy. In the absence of relevant instruments, water audit data can be estimated, as
discussed below in the section on human interaction with water audit data.
Careful investigation of the reliability and efficacy of the instruments that produce raw water
audit data is necessary to ascertain the accuracy of a water audit.
©2016 Water Research Foundation. ALL RIGHTS RESERVED
6
The validator should consider the factors that influence instrument accuracy, to the extent
aligned with the scope of validation. These factors include:
maintenance practices
installation conditions
accuracy test practices and results
calibration and programming
measurement resolution
sampling and recording frequency
To capture inaccuracies in water audit data resulting from instrument performance, level 2
and/or level 3 water audit validation (described is Chapter 3) should be performed. Level 1
validation typically will not diagnose inaccuracies due to instrument malfunction.
Secondary Data Transfer and Summary of Primary Measurements
Once data has been collected through primary measurement, it is often transferred to
permanent storage. Permanent archival can involve data reformatting and multiple data
management systems, which can introduce inaccuracy into the final archived data. Therefore,
the validator should study the process of data transfer and storage whenever possible and
aligned with the scope of validation.
After data has been archived, inaccuracy and uncertainty can also be introduced when data is
accessed and summarized for the purposes of the water audit. Documenting utility operations
for an entire year produces many individual data points. As a result, working with a year’s worth
of data describing a wide range of daily operations can be time‐intensive. Instead of reckoning
with thousands, if not millions, of individual measurements, auditors and validators may instead
choose to work with summarized datasets. Additionally, because the AWWA Free Water Audit
Software accepts only a handful of inputs to communicate entire system performance, summary
of raw data is necessary.
To condense raw data points into a single descriptive value, an auditor may perform a variety of
mathematical operations. Furthermore, the programs and data management systems used to
collate water audit data may be programmed to automatically perform mathematical operations
in producing an output.
The validator should identify how raw data was selected and summarized to confirm that the
summary number in the water audit reflects utility operations as accurately as possible. Potential
operations performed include:
averaging
summing
©2016 Water Research Foundation. ALL RIGHTS RESERVED
7
interpolating
extrapolating
identifying a minimum
identifying a maximum
calculating a mode
calculating a median
performing a regression
Whether these operations are performed by the auditor or by data management systems
(SCADA, billing software, GIS applications, work order platforms, etc.), it is essential that the data
selected for summary is indeed the correct data.
Archival and summarizing functions can introduce inaccuracy or uncertainty into a water audit.
To the extent required by the level of validation, it is up to the validator to catch inaccuracy and
note the potential for uncertainty introduced by data archival, data management systems, and
data summary.
Human Interaction with Data and Methodology, Including Estimation
Water auditing often necessitates that an auditor choose sources of data, methods of estimation,
and tailored interpretations of general methodology. If the auditor’s choices do not accurately
capture a utility’s audit period performance, the resulting audit is likely to be inaccurate or
uncertain.
To identify potential inaccuracy and uncertainty introduced by the auditor, the validator should
note the choices that the auditor made in completing the audit. Where possible and aligned with
the scope of validation, the outcomes resulting from other choices should be explored, and
alternate data sources should be identified.
HOW DOES THE AWWA SOFTWARE ASSESS DATA QUALITY?
Internationally, water audit data quality has been expressed with a range of techniques, from
statistical methods that incorporate confidence intervals to qualitative systems that use
alphanumeric scales. In North America, the AWWA Free Water Audit Software is recognized as
the standard tool for collecting water audit data and qualitatively communicating the data’s
quality.
In 2010, a data validity grading capability was introduced to the AWWA Free Water Audit
Software, version 4. In the AWWA Software system, each input to the Software spreadsheet is
assessed for validity on a qualitative, 1‐to‐10 scale. For some inputs, a grade of N/A may also be
selected.
©2016 Water Research Foundation. ALL RIGHTS RESERVED
8
A grade of 1 indicates lowest validity.
A grade of 10 indicates highest validity.
The criteria for grading the validity of each input is unique to that input. This acknowledges that
the practices that support data integrity for one volume or data point are often distinct from the
practices supporting data integrity for a different volume. For example, it is important to maintain
supply meter accuracy to accurately calculate the volumes of Water Supplied, but correctly
monitoring and assessing average system pressure requires that attention be paid to pressure
models and pressure logging instruments.
To assist both auditors and validators in grading the validity of each input, the AWWA Software
includes instructions and a Grading Matrix. The Software user can find the unabridged matrix in
the “Grading Matrix” tab of the Software. The Grading Matrix provides two levels of guidance for
each water audit data input: criteria for selecting a grade and actions to take to achieve a higher
grade in future water audits. Additionally, the criteria for grading each input also appear in a
hover box over the data grade input cell in the Reporting tab of the Software.
When evaluating data validity grades, the validator must remember that all criteria must be met
or exceeded for a given grade and all grades below it in order for that grade to apply.
Once data validity grades have been assigned to all water audit inputs, the AWWA Software
calculates a composite Data Validity Score (DVS). The DVS reflects the extent to which the water
utility employs best practices in collecting, managing, and analyzing water audit data. The DVS is
weighted and normalized to 100, with the most weight given to the largest volumes in the water
audit.
Lastly, the AWWA Software also includes a Water Loss Control Planning Guide, a table that
evaluates the DVS in five ranked ranges. A DVS falling in lower ranges prompts a utility to
implement practices that promote the collection of more reliable data. A DVS in higher ranges
indicates that water audit data is reliable enough to serve as the basis for water loss intervention
planning.
©2016 Water Research Foundation. ALL RIGHTS RESERVED
9
CHAPTER 3
WHAT IS WATER AUDIT VALIDATION?
Water audits are composed of individual data inputs. If water audit data inputs are inaccurate,
the water audit results will also be inaccurate. As a result, simply compiling a water audit does
not guarantee accuracy. Primary measurement, secondary data summary, human interpretation
of data and methodology, and estimation can introduce inaccuracy and uncertainty into the final
water audit.
To determine the potential for inaccuracy and uncertainty in a water audit, the audit should be
validated.
According to Sturm et al. (forthcoming), water audit validation is the process of examining water
audit inputs in order to:
1. Identify and appropriately correct for inaccuracies in water audit data and application
of methodology
2. Evaluate and communicate the uncertainty inherent in water audit data
Additionally, water audit validation helps ensure that water audit data validity grades and the
overall Data Validity Score reliably represent the operations and practices of the water utility
during the audit year.
Without a methodical, validated water audit, it is possible that estimations of water loss
misrepresent what a utility is actually experiencing. As a result, a water audit that has not been
validated can mislead stakeholders, customers, regulators, and the utility itself in stewarding
valuable water and financial resources.
Furthermore, water audit validation provides a degree of quality control to utility water audit
data. While not guaranteeing that the final water audit is free of inaccuracy or uncertainty, the
validation process does strengthen water audit results so that utilities can more effectively plan
water loss control efforts, track performance, benchmark indicators, and improve future water
audits.
WHAT ARE THE LEVELS OF WATER AUDIT VALIDATION?
The depth of water audit validation depends on the utility’s goals and resources. At one end of
the spectrum of validation, validation can be an introductory assessment of data inputs that looks
for evident inaccuracies and correct application of methodology. At the other end of the
spectrum, validation can be much more rigorous, involving a complete interrogation of all data
sources and field tests of instrument accuracy.
©2016 Water Research Foundation. ALL RIGHTS RESERVED
10
There are three levels of water audit validation that build upon self‐reported water audits, each
with a distinct aim and level of effort.
The levels of validation below were discussed by WLCC (2015), Sturm et al. (2015) and Sturm et
al. (forthcoming). The definitions below have developed throughout these works.
Self‐reported water audits have not been validated. Their accuracy and reliability have not been
confirmed.
Level 1 validated water audits have been examined for inaccuracies evident in summary data and
application of methodology. The data validity grades assigned to inputs accurately reflect utility
practices.
Level 2 validated water audits have been corroborated with investigations of raw data and
archived reports of instrument accuracy. The best sources of data to inform the water audit have
been identified.
Level 3 validated water audits have been bolstered by field tests of instrument accuracy. The
water audit’s estimate of Real Losses has been confirmed through pilot leak detection,
Component Analysis of Real Losses, and/or minimum night flow analysis.
Because validation can be conducted at distinct levels with distinct outcomes, it is necessary to
define the purpose and level of validation before starting the validation process.
WHO SHOULD VALIDATE WATER AUDITS?
When selecting a person to validate a water audit, it is important to consider the validator’s
relationship to the water audit, knowledge of validation methodology, and overall posture
toward data quality and validation.
A water audit validator should not be the person who compiled the water audit.
The process of water audit review is made more effective when the validator approaches the
water audit with fresh eyes, having not been intimately involved in its assembly. Nonetheless,
the validator may be a part of the same organization as the auditor, and a validator may validate
the audit of his or her own utility.
The effectiveness of water audit validation hinges on the knowledge and skills of the validator. A
validator must:
Be proficient in current AWWA M36 best practices for water audit preparation and
validation
Have access to the data and people that informed the water audit
©2016 Water Research Foundation. ALL RIGHTS RESERVED
11
Be gently skeptical of water audit data and data validity grades, as initially submitted
Ask open‐ended questions and listen to the answers
Document the process and outcomes of water audit validation
In addition to having these technical capacities, a water audit validator must also adopt a posture
toward water auditing and validation that furthers the goals of validation.
A water audit validator should be:
objective in order to appreciate the interplay between instrumentation, data
management systems, and utility staff as it affects the water audit
transparent in order for validation findings to improve the quality of the water audit
diplomatic in order to appreciate the work that went into compiling the water audit
but still uncover inaccuracies
methodical in order to catch all potential inaccuracies or sources of uncertainty
through the validation process
forward‐thinking in order for the recommendations resulting from validation to
improve the water audit and water loss control in subsequent years
©2016 Water Research Foundation. ALL RIGHTS RESERVED

©2016 Water Research Foundation. ALL RIGHTS RESERVED
13
CHAPTER 4
WHAT DEFINES LEVEL 1 WATER AUDIT VALIDATION?
The levels of water audit validation are defined by distinct goals, outcomes, and limitations.
Therefore, to discuss level 1 water audit validation, it’s important to enumerate what level 1
validation does and does not do.
Level 1 water audit validation ensures that the data validity grades assigned to data inputs
accurately describe utility practices. In addition, the level 1 validation process aims to document
and correct for inaccuracies that are evident at the summary level and confirm the correct
application of water audit methodology.
WHAT DOES LEVEL 1 WATER AUDIT VALIDATION DO?
As per Sturm et al. (forthcoming) the Level 1 water audit validation aims to:
confirm the accurate application of AWWA M36 water audit methodology and
terminology to the utility‐specific situation
identify evident inaccuracies and correct inaccuracies, where realistic
verify the selection of correct data validity grades
In meeting these goals, the level 1 validation process results in:
data validity grades that reflect utility practices
identification of macroscopic inaccuracies
recommendations for advanced validation activities
WHAT DOES LEVEL 1 WATER AUDIT VALIDATION NOT DO?
Level 1 water audit validation is the least rigorous level of validation. The effort and time required
to complete level 1 validation are relatively small. As a result, a level 1 engagement with data
sources and the water audit has limitations.
Level 1 water audit validation does not:
correct inaccuracies in raw data that may affect summary data and audit inputs
investigate data processing and handling to identify and correct inaccuracies
study instrument accuracy through field tests to improve the certainty of the water
audit
corroborate the volume of Real Losses with bottom‐up or field investigations of
leakage
©2016 Water Research Foundation. ALL RIGHTS RESERVED

14
Given these limitations, anyone who wishes to understand the performance of key water audit
instruments and data management systems; study raw data for gaps, redundancies, and
inaccuracies; or document the translation of data from measurement to summary should perform
higher‐level validation activities.
The more rigorous the validation, the more likely the water audit is to be accurate and
representative of actual utility performance. As a result, level 1 water audit validation is often
only a starting point in the effort to compile reliable water audits. Higher‐level validation activities
are usually needed to produce and confirm high‐quality water audits that inform long‐term, cost‐
effective water loss control.
©2016 Water Research Foundation. ALL RIGHTS RESERVED
15
CHAPTER 5
HOW DO I PERFORM LEVEL 1 WATER AUDIT VALIDATION?
Before a water audit can be validated, it must be prepared. The process of preparing a water
audit is distinct from the process of validating a water audit. Though many of the best practices
for water audit validation can also apply to water audit preparation, this manual guides validators
in performing level 1 water audit validation; it does not address water audit preparation. For an
in‐depth treatment of water audit preparation, please refer to AWWA Manual M36: Water Audits
and Loss Control Programs.
Level 1 water audit validation consists of 5 steps:
1. Receive and review the water audit and supporting documentation.
2. Review performance indicators for evidence of inaccuracy.
3. Review audit inputs and data validity grades and confirm correct application of
methodology in a level 1 validation interview. Adjust inputs and data validity grades if
necessary.
4. Review performance indicators again for evidence of persisting inaccuracy.
5. Document results.
Each step is described on the following pages.
The validator should keep in mind that the goals of a level 1 validation effort are confirming that
the methodology was correctly interpreted, identifying evident inaccuracies, and verifying that
data validity grades accurately reflect utility practices. Level 1 validation will not correct – or even
identify – all inaccuracies that may be present in a water audit. Nonetheless, the potential for
uncertainty in a water audit will be better understood following a level 1 validation.
STEP 1: RECEIVE AND REVIEW THE WATER AUDIT AND SUPPORTING DOCUMENTATION
When preparing to perform level 1 water audit validation, the validator should request and
receive the water audit and the documentation necessary to corroborate key water audit inputs,
methodology, and data validity grades. Though much data likely supports the water audit, an in‐
depth examination of water audit data, analyses, and instrumentation is beyond the scope of
level 1 validation.
At minimum, the validator should request and receive:
⃝ Completed AWWA Free Water Audit Software
⃝ Volume from Own Sources detailed by month and supply meter
©2016 Water Research Foundation. ALL RIGHTS RESERVED
16
⃝ Water Imported detailed by month
⃝ Water Exported detailed by month
⃝ Supply meter testing and/or calibration documentation (if supply meters are tested
and/or calibrated)
⃝ Volume of water sold detailed by month and rate code (e.g. charge status, water type,
or customer class)
If the validator does not receive all required supporting documentation, the water audit cannot
be level 1 validated.
Additional supporting documentation will improve the level 1 validation process, but such
information is not strictly necessary to complete a level 1 water audit validation. Helpful
supplemental documentation includes the derivations of Customer Meter Inaccuracy, Average
Operating Pressure, Customer Retail Unit Cost, and Variable Production Cost. Additionally, audits
from previous years can be collected to examine consistency from one year to the next, if
previous audits are available.
Once the validator has received the water audit and supporting documentation, the validator
should schedule a conversation with the auditor and other utility staff positioned to describe
utility practices.
Level 1 validation consists primarily of an interview between the validator, the auditor, and utility
staff.
In the interview, the validator should ask open‐ended questions to explore the utility practices
that maintain the quality of infrastructure, instruments, data, and general operations.
Because each utility operates uniquely, every interview and the collection of supporting
documentation must be tailored to the utility. However, some general questions and lines of
inquiry that pertain to water audit inputs and data validity grades are provided in this manual for
the third step, reviewing water audit inputs.
Once the validator has collected supporting documentation and scheduled a level 1 validation
interview, the validator should examine initial performance indicators for evidence of inaccuracy,
STEP 2: EXAMINE PERFORMANCE INDICATORS FOR EVIDENCE OF INACCURACY
The “Performance Indicators” tab of the AWWA Software lists a suite of performance indicators
calculated using the data inputs provided by the auditor. Prior to the level 1 validation interview,
©2016 Water Research Foundation. ALL RIGHTS RESERVED
17
each performance indicator can be checked for feasibility as described below to supply an initial
assessment of the overall reliability of the water audit. Additionally, by studying initial
performance indicators before examining each audit input in the interview, the validator will be
positioned to identify potential audit data inaccuracies contributing to questionable performance
indicators.
Non‐Revenue Water as a Percent by Cost of Operating System
To calculate Non‐Revenue Water as a percent by cost of operating system, the audit software
first calculates the value of Apparent Losses using the Customer Retail Unit Cost. Then, the audit
software calculates the value of Real Losses and Unbilled Authorized Consumption using either
the Variable Production Cost (default) or the Customer Retail Unit Cost, depending on the
auditor’s selection. Next, the audit software sums the Non‐Revenue Water component volume
valuations to determine the total value of Non‐Revenue Water. Finally, the audit software divides
the value of Non‐Revenue Water by the total cost of operating the system.
To verify that the results of the audit are technically feasible, this performance indicator should
be greater than 0% and less than 100%. A performance indicator in this range communicates that
some but not all of the utility’s operating budget covers the intrinsic cost of water losses.
⃝ Is Non‐Revenue Water as a percent by cost of operating system greater than 0%?
⃝ Is Non‐Revenue Water as a percent by cost of operating system less than 100%?
If Non‐Revenue Water as a percent by cost of operating system does not pass this check, at least
one of the volumetric or cost inputs is inaccurate.
Apparent Losses Per Service Connection Per Day
To calculate Apparent Losses per service connection per day, the audit software divides the total
Apparent Loss volume by the count of service connections and the number of days in the audit
period. Apparent Losses per service connection per day as a performance indicator is often
referred to as “normalized Apparent Losses.”
Generally, utilities incur Apparent Losses through theft, meter under‐registration, and errors in
data handling. As a result, the majority of utilities will have positive values of normalized
Apparent Losses.
However, a handful of utilities may experience negative normalized Apparent Losses through
meter over‐registration and certain errors in data handling, like duplication. However, such a
situation is unlikely. Should a utility present negative normalized Apparent Losses, the validator
should pay careful attention to the derivation of Apparent Loss volumes.
©2016 Water Research Foundation. ALL RIGHTS RESERVED
18
Real Losses (Normalized)
The AWWA Free Water Audit Software reports Real Losses as a total volume and then calculates
a series of normalized Real Loss performance indicators.
For systems with a service connection density equal to or greater than 32 connections per mile
of main, the audit software normalizes Real Losses to service connections and to operating
pressure. To arrive at Real Losses normalized to service connections, the audit software divides
the Real Loss volume by the count of service connections and the number of days in the audit
period. Results are presented in gallons per connection per day. The audit software also further
normalizes Real Losses to pressure by dividing Real Losses normalized to service connections by
the average operating pressure. Results are presented in gallons per connection per day per PSI
of pressure.
For systems with a service connection density less than 32 connections per mile of main, the
audit software normalizes Real Losses to the length of mains. To arrive at Real Losses normalized
to the length of mains, the audit software divides the Real Loss volume by the miles of main and
the number of days in the audit period. Results are presented in gallons per mile of main per day.
To verify that the results of the audit are technically feasible, all normalized Real Loss
performance indicators should be greater than 0 gallons per day. A normalized Real Loss
performance indicator greater than 0 gallons per day indicates that the utility lost some of the
volume it supplied to leakage, as is expected.
⃝ Is Real Losses (normalized) greater than 0 gallons?
If normalized Real Losses does not pass this check, at least one of the volumetric inputs is
incorrect.
Infrastructure Leakage Index
To calculate the Infrastructure Leakage Index (ILI), the audit software divides the derived volume
of Real Losses by the volume of Unavoidable Annual Real Losses (UARL). The UARL is modeled
using the length of mains, count of service connections, average length of customer service lines,
and average operating pressure. The ILI is a dimensionless ratio that compares a utility’s Current
Annual Real Losses (CARL) volume to its calculated technical minimum volume of leakage. (Alegre
et al. 2000)
To verify that the results of the audit are technically feasible, this performance indicator should
be greater than 1.0. An ILI greater than 1.0 indicates that the utility lost a volume of leakage
greater than its calculated technical minimum volume of leakage.
⃝ Is the ILI greater than 1.0?
©2016 Water Research Foundation. ALL RIGHTS RESERVED
19
If the ILI does not pass this check, it is likely that at least one of the volumetric inputs,
infrastructure inputs, or average system pressure is incorrect.
However, a handful of very efficient utilities have reported and defended ILIs less than 1.0. Such
remarkable performance suggests that the modeling assumptions underlying the calculation of
the ILI need to be adjusted to apply to this subset of systems. Should a utility present an ILI less
than 1.0, the validator should pay careful attention to all audit inputs and explore the utility’s
infrastructure maintenance and renewal programs. For a water utility to have a valid ILI close to
or below 1.0, the utility must have extensive and verifiable leakage policies and practices in place.
Summary
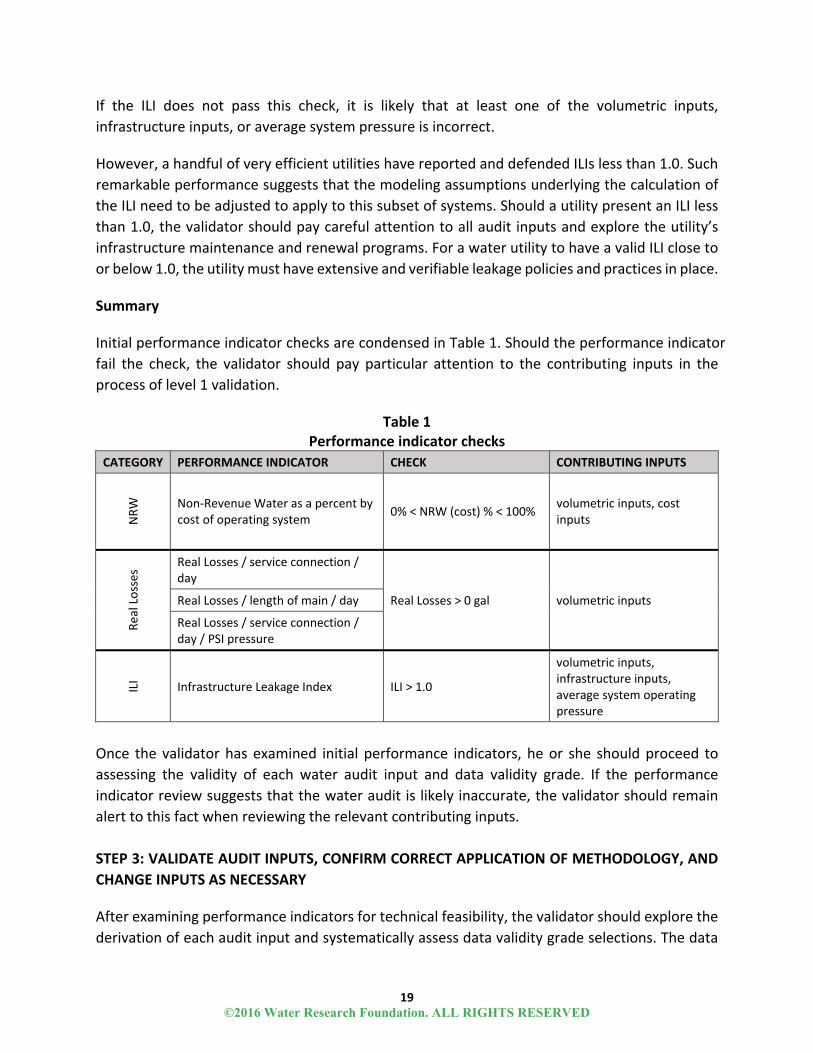
Initial performance indicator checks are condensed in Table 1. Should the performance indicator
fail the check, the validator should pay particular attention to the contributing inputs in the
process of level 1 validation.
Table 1 Performance indicator checks
CATEGORY PERFORMANCE INDICATOR CHECK CONTRIBUTING INPUTS
NRW
Non‐Revenue Water as a percent by cost of operating system
0% < NRW (cost) % < 100% volumetric inputs, cost inputs
Real Losses Real Losses / service connection /
day
Real Losses > 0 gal volumetric inputs Real Losses / length of main / day
Real Losses / service connection / day / PSI pressure
ILI
Infrastructure Leakage Index ILI > 1.0
volumetric inputs, infrastructure inputs, average system operating pressure
Once the validator has examined initial performance indicators, he or she should proceed to
assessing the validity of each water audit input and data validity grade. If the performance
indicator review suggests that the water audit is likely inaccurate, the validator should remain
alert to this fact when reviewing the relevant contributing inputs.
STEP 3: VALIDATE AUDIT INPUTS, CONFIRM CORRECT APPLICATION OF METHODOLOGY, AND
CHANGE INPUTS AS NECESSARY
After examining performance indicators for technical feasibility, the validator should explore the
derivation of each audit input and systematically assess data validity grade selections. The data
©2016 Water Research Foundation. ALL RIGHTS RESERVED
20
validity grading themes are unique for each input, so this manual elucidates the important
considerations for the assignment of each grade. Additionally, this manual identifies the common
errors associated with each input and provides examples of the data validity scoring process.
The AWWA Free Water Audit Software contains 20 data inputs. For each audit input, the validator
should ask the following broad questions:
How did the auditor arrive at the water audit input?
How did the auditor interpret general methodology and definitions to apply to the
specifics of the system?
How did the auditor select a data validity grade?
How does the audit input compare to previous years (if applicable)?
In evaluating the data validity grade for each input, the validator should keep in mind that all
criteria must be met or exceeded for a given grade and all grades below it in order for that grade
to apply. The AWWA Software grading matrix does provide flexibility in assigning grades by
permitting the user to select odd numbers (3, 5, 7, and 9), which exist without descriptive criteria
but fall between even grades.
The example data validity grading scenarios presented in the following pages use grading criteria
extracted from AWWA Software version 5.0.
©2016 Water Research Foundation. ALL RIGHTS RESERVED
21
Volume from Own Sources
Volume from Own Sources is the volume of water withdrawn from water resources (rivers, lakes,
wells, etc.) controlled by the utility and treated for potable water distribution (Alegre et al. 2000,
AWWA 2009, WLCC 2014).
Data Validity Themes
The validity of the Volume from Own Sources input depends on:
the extent of production metering
the frequency and results of calibration of the meters’ related instrumentation
the frequency and results of meter volumetric accuracy testing
To grade the validity of the Volume from Own Sources input the validator will have to answer the
following questions.
⃝ How many distinct own‐source distribution inputs are there?
⃝ How many inputs are metered?
⃝ Are any of the meters in series?
⃝ Do the meters capture raw water or potable water?
⃝ How are unmetered inputs estimated?
⃝ Which own‐source meters are calibrated? How often are calibrations performed?
⃝ What were the results of the calibrations closest to the audit period?
⃝ Which own‐source meters are volumetrically tested? How often are tests conducted?
⃝ What were the results of the volumetric accuracy tests closest to the audit period?
Common Errors
In validating the Volume from Own Sources input, it is important to maintain a distinction
between meter calibration and meter volumetric accuracy testing.
Meter calibration pertains to a meter’s secondary instrumentation. Meter calibration
ensures the accurate communication and conversion of electronic signals.
Meter volumetric accuracy testing studies a meter’s primary measuring mechanism. In
volumetric testing, a meter’s registered volume is compared to a known reference
volume.
Meter calibration and volumetric accuracy testing each relate to a distinct aspect of meter
performance. As a result, a meter’s accuracy is best understood when both maintenance
©2016 Water Research Foundation. ALL RIGHTS RESERVED
22
practices are jointly employed. Achieving a high data validity grade requires that a utility calibrate
and volumetrically test meters; mid‐range grades require either calibration or volumetric
accuracy testing.
Additionally, it is important that the Volume from Own Sources consist exclusively of potable
water. If a utility does not meter all potable water and instead meters raw water prior to the
treatment process, the validator will need to investigate the estimations employed to arrive at a
volume of potable water. A minor volume of water is usually consumed in the treatment process,
resulting in a potable water volume slightly smaller than the raw water volume.
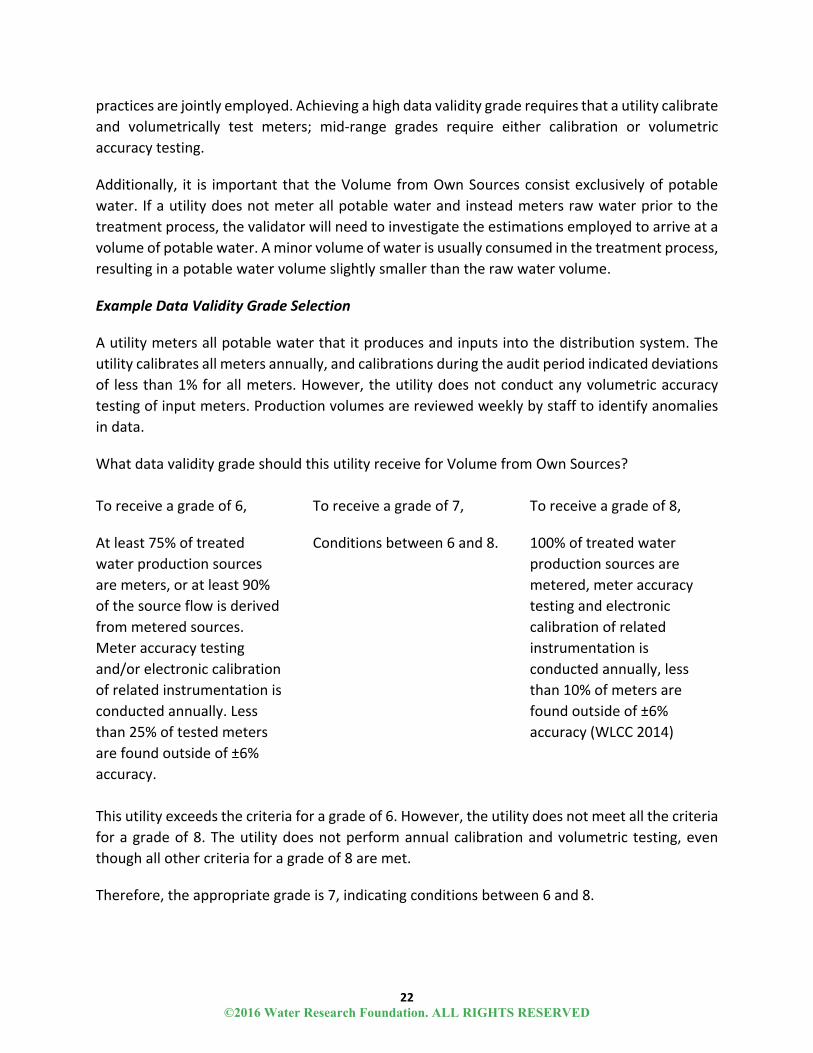
Example Data Validity Grade Selection
A utility meters all potable water that it produces and inputs into the distribution system. The
utility calibrates all meters annually, and calibrations during the audit period indicated deviations
of less than 1% for all meters. However, the utility does not conduct any volumetric accuracy
testing of input meters. Production volumes are reviewed weekly by staff to identify anomalies
in data.
What data validity grade should this utility receive for Volume from Own Sources?
To receive a grade of 6,
At least 75% of treated
water production sources
are meters, or at least 90%
of the source flow is derived
from metered sources.
Meter accuracy testing
and/or electronic calibration
of related instrumentation is
conducted annually. Less
than 25% of tested meters
are found outside of ±6%
accuracy.
To receive a grade of 7,
Conditions between 6 and 8.
To receive a grade of 8,
100% of treated water
production sources are
metered, meter accuracy
testing and electronic
calibration of related
instrumentation is
conducted annually, less
than 10% of meters are
found outside of ±6%
accuracy (WLCC 2014)
This utility exceeds the criteria for a grade of 6. However, the utility does not meet all the criteria
for a grade of 8. The utility does not perform annual calibration and volumetric testing, even
though all other criteria for a grade of 8 are met.
Therefore, the appropriate grade is 7, indicating conditions between 6 and 8.
©2016 Water Research Foundation. ALL RIGHTS RESERVED
23
Volume from Own Sources – Master Meter and Supply Error Adjustment
Volume from Own Sources is adjusted for meter inaccuracy with a Master Meter and Supply Error
Adjustment (MMEA). The auditor may choose to adjust for Master Meter and Supply Error using
either a percentage input into the audit software or a volume that is then added or subtracted
from the Volume from Own Sources. (Alegre et al. 2000, AWWA 2009, WLCC 2014).
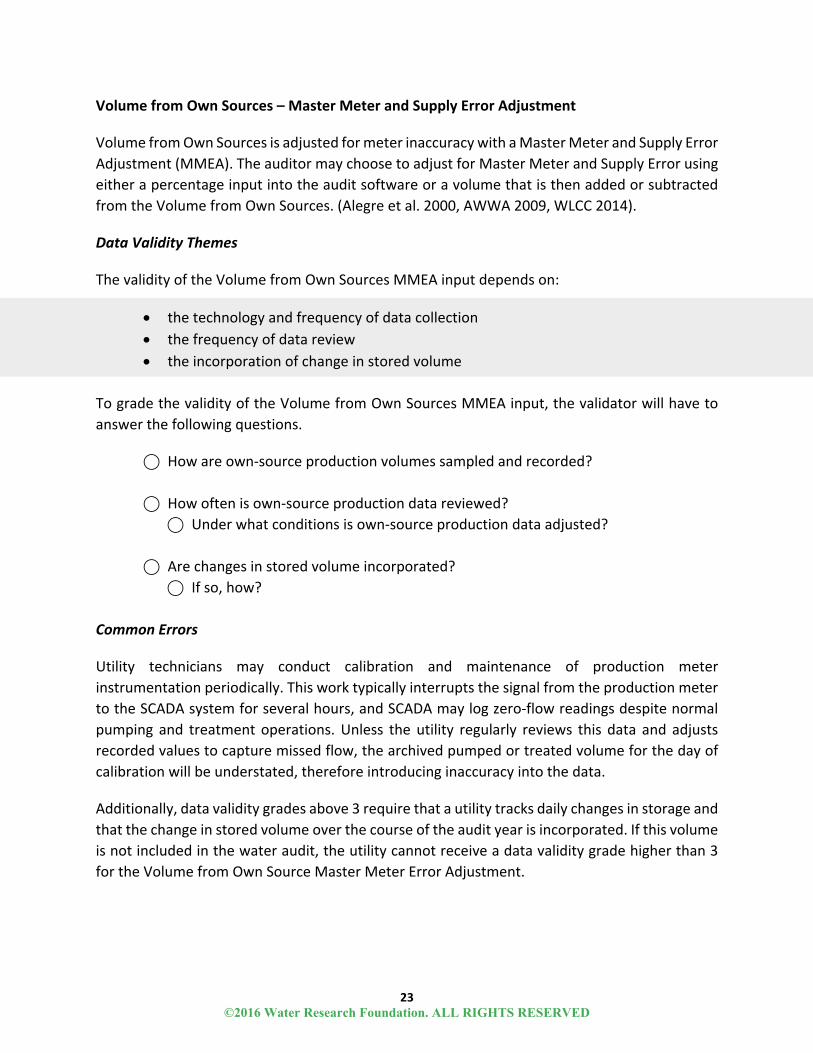
Data Validity Themes
The validity of the Volume from Own Sources MMEA input depends on:
the technology and frequency of data collection
the frequency of data review
the incorporation of change in stored volume
To grade the validity of the Volume from Own Sources MMEA input, the validator will have to
answer the following questions.
⃝ How are own‐source production volumes sampled and recorded?
⃝ How often is own‐source production data reviewed?
⃝ Under what conditions is own‐source production data adjusted?
⃝ Are changes in stored volume incorporated?
⃝ If so, how?
Common Errors
Utility technicians may conduct calibration and maintenance of production meter
instrumentation periodically. This work typically interrupts the signal from the production meter
to the SCADA system for several hours, and SCADA may log zero‐flow readings despite normal
pumping and treatment operations. Unless the utility regularly reviews this data and adjusts
recorded values to capture missed flow, the archived pumped or treated volume for the day of
calibration will be understated, therefore introducing inaccuracy into the data.
Additionally, data validity grades above 3 require that a utility tracks daily changes in storage and
that the change in stored volume over the course of the audit year is incorporated. If this volume
is not included in the water audit, the utility cannot receive a data validity grade higher than 3
for the Volume from Own Source Master Meter Error Adjustment.
©2016 Water Research Foundation. ALL RIGHTS RESERVED

24
Example Data Validity Grade Selection
A utility records production data continuously with a recently‐upgraded SCADA system. Summary
SCADA data is reviewed on Friday each week to identify anomalous values and gaps in data;
errors and gaps are corrected whenever reasonably possible. The utility does not archive stored
volumes in its SCADA system, and as a result the stored volume on the first day of the audit period
and the last day of the audit period is not known.
What data validity grade should this utility receive for Volume from Own Sources Master Meter
Error and Supply Adjustment?
To receive a grade of 2,
No automatic datalogging of
production volumes; daily
readings are scribed on
paper records without any
accountability controls.
Flows are not balanced
across the water distribution
system; tank or storage
elevation changes are not
employed in calculating the
Volume from Own Sources
component, and archived
flow data is adjusted only
when grossly evident data
error occurs.
To receive a grade of 3,
Conditions between 2 and 4.
To receive a grade of 4,
Production meter data is
logged automatically in
electronic format and
reviewed at least on a
monthly basis with
necessary corrections
implemented. Volume from
own sources tabulations
include estimate of daily
changes in tanks/storage
facilities. Meter data is
adjusted when gross data
errors occur, or occasional
meter testing deems this
necessary.
(WLCC 2014).
Though this utility logs production data automatically and reviews the data weekly, the volume
in storage is not considered in the estimation of Volume from Own Sources. Therefore, because
all criteria for a given grade must be met for that grade to apply, this utility does not qualify for
a grade of 4. Nonetheless, the utility exceeds the criteria for a grade of 2.
Therefore, the appropriate grade is 3.
©2016 Water Research Foundation. ALL RIGHTS RESERVED
25
Water Imported
Water Imported is the volume of bulk water purchased to supply the distribution system.
Typically, Water Imported is purchased from a neighboring water utility or regional water
authority and is metered at a point of interconnection between the two utilities. (Alegre et al.
2000, AWWA 2009, WLCC 2014).
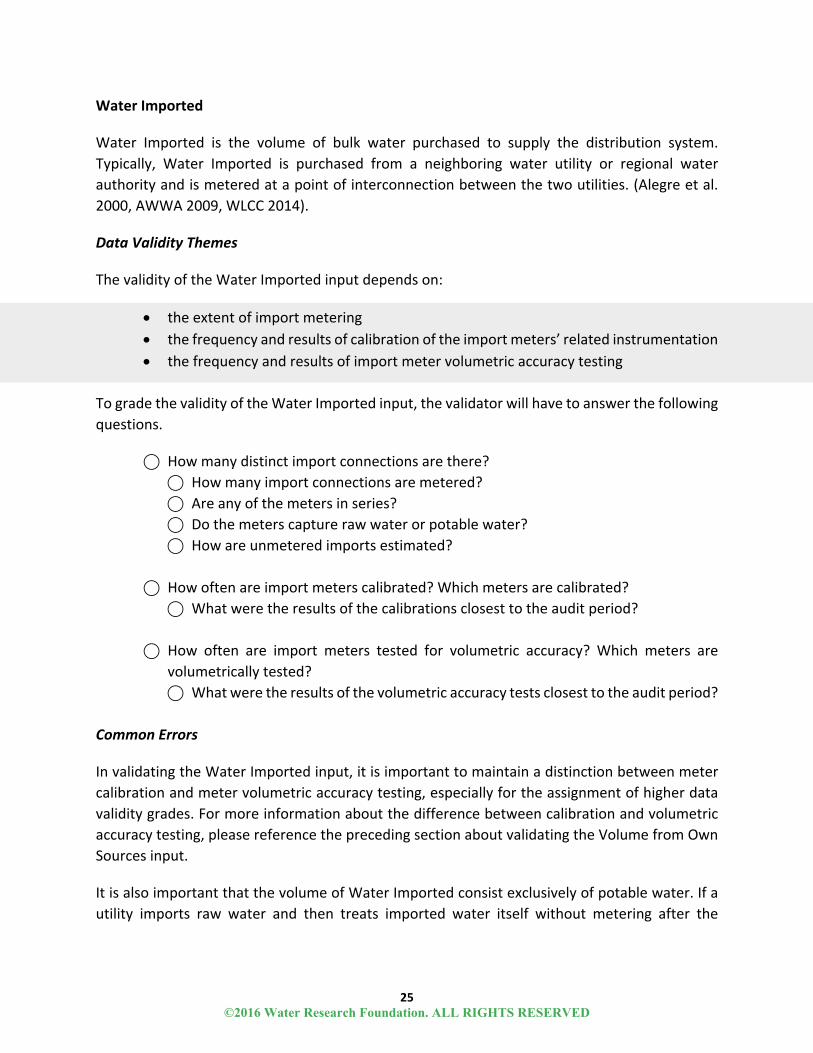
Data Validity Themes
The validity of the Water Imported input depends on:
the extent of import metering
the frequency and results of calibration of the import meters’ related instrumentation
the frequency and results of import meter volumetric accuracy testing
To grade the validity of the Water Imported input, the validator will have to answer the following
questions.
⃝ How many distinct import connections are there?
⃝ How many import connections are metered?
⃝ Are any of the meters in series?
⃝ Do the meters capture raw water or potable water?
⃝ How are unmetered imports estimated?
⃝ How often are import meters calibrated? Which meters are calibrated?
⃝ What were the results of the calibrations closest to the audit period?
⃝ How often are import meters tested for volumetric accuracy? Which meters are
volumetrically tested?
⃝ What were the results of the volumetric accuracy tests closest to the audit period?
Common Errors
In validating the Water Imported input, it is important to maintain a distinction between meter
calibration and meter volumetric accuracy testing, especially for the assignment of higher data
validity grades. For more information about the difference between calibration and volumetric
accuracy testing, please reference the preceding section about validating the Volume from Own
Sources input.
It is also important that the volume of Water Imported consist exclusively of potable water. If a
utility imports raw water and then treats imported water itself without metering after the
©2016 Water Research Foundation. ALL RIGHTS RESERVED
26
treatment process, the validator will need to investigate the estimations employed to arrive at a
volume of potable Water Imported.
Finally, if a utility imports water through emergency interconnections that are not always active,
this imported volume should still be included in the water audit. The auditor and validator will
need to note the tracking mechanisms that document emergency imports and inform the water
audit.
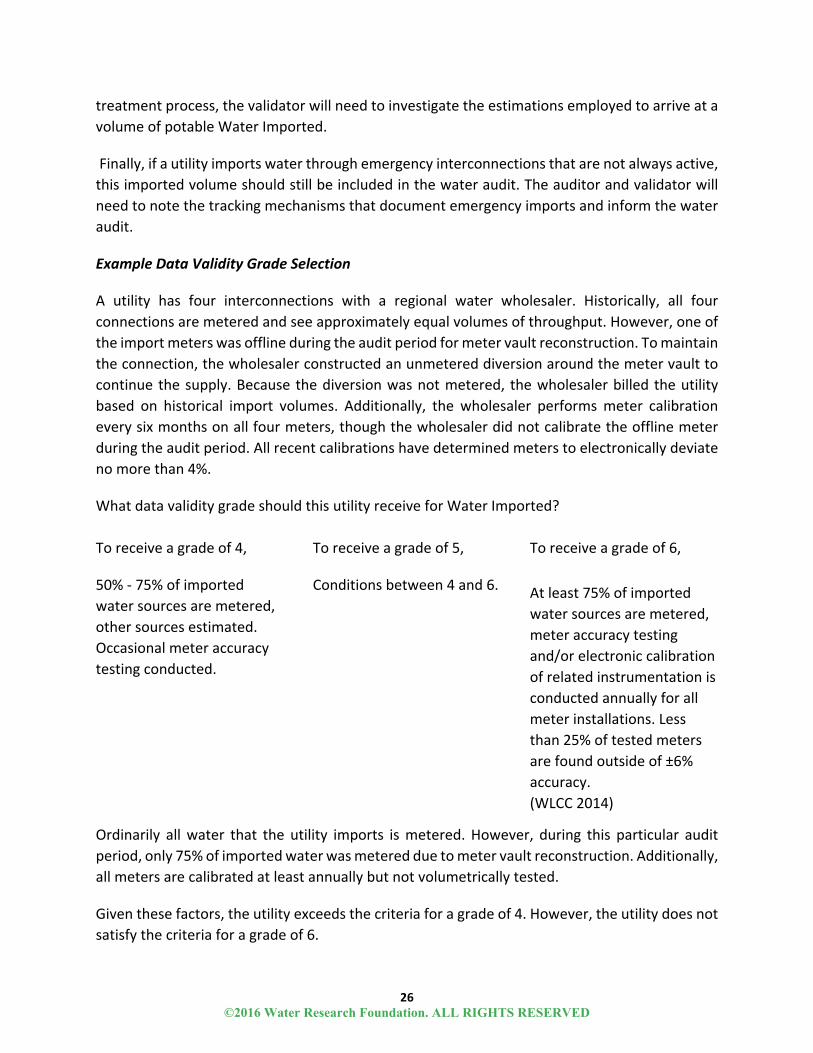
Example Data Validity Grade Selection
A utility has four interconnections with a regional water wholesaler. Historically, all four
connections are metered and see approximately equal volumes of throughput. However, one of
the import meters was offline during the audit period for meter vault reconstruction. To maintain
the connection, the wholesaler constructed an unmetered diversion around the meter vault to
continue the supply. Because the diversion was not metered, the wholesaler billed the utility
based on historical import volumes. Additionally, the wholesaler performs meter calibration
every six months on all four meters, though the wholesaler did not calibrate the offline meter
during the audit period. All recent calibrations have determined meters to electronically deviate
no more than 4%.
What data validity grade should this utility receive for Water Imported?
To receive a grade of 4,
50% ‐ 75% of imported
water sources are metered,
other sources estimated.
Occasional meter accuracy
testing conducted.
To receive a grade of 5,
Conditions between 4 and 6.
To receive a grade of 6,
At least 75% of imported
water sources are metered,
meter accuracy testing
and/or electronic calibration
of related instrumentation is
conducted annually for all
meter installations. Less
than 25% of tested meters
are found outside of ±6%
accuracy.
(WLCC 2014)
Ordinarily all water that the utility imports is metered. However, during this particular audit
period, only 75% of imported water was metered due to meter vault reconstruction. Additionally,
all meters are calibrated at least annually but not volumetrically tested.
Given these factors, the utility exceeds the criteria for a grade of 4. However, the utility does not
satisfy the criteria for a grade of 6.
©2016 Water Research Foundation. ALL RIGHTS RESERVED
27
Therefore, the appropriate grade is 5, indicating conditions between 4 and 6. In future years
when all imported water is metered, the utility will qualify for a higher data validity grade for
Water Imported, assuming all other import considerations remain the same.
©2016 Water Research Foundation. ALL RIGHTS RESERVED
28
Volume Imported – Master Meter and Supply Error Adjustment
Volume Imported is adjusted for meter inaccuracy with a Master Meter and Supply Error
Adjustment (MMEA). The auditor may choose to adjust for Master Meter Error using either a
percentage input into the audit software or a volume that is then added or subtracted from the
Volume Imported. (Alegre et al. 2000, AWWA 2009, WLCC 2014).
Data Validity Themes
The validity of the Water Imported MMEA input depends on:
the technology and frequency of data collection
the frequency of data review
the documentation and clarity of interagency import‐export agreement
To grade the validity of the Water Imported MMEA input, the validator will have to answer the
following questions.
⃝ How are Water Imported volumes recorded?
⃝ How often are Water Imported volumes captured?
⃝ How often is Water Imported data reviewed?
⃝ Under what conditions is Water Imported data adjusted?
⃝ What documentation is available to describe the interagency import‐export
agreement?
Example Data Validity Grade Selection
A utility imports water from a regional wholesaler through a single meter. The terms of the
import‐export agreement are recorded in written materials and revisited once a decade. The
meter is owned by the wholesaler, who is contractually obligated to volumetrically test and
calibrate the meter annually. However, the wholesaler was unable to produce any
documentation when asked for the most recent test and calibration records.
The wholesaler also operates a SCADA system that continually logs the transferred volume, and
production data is reviewed daily for errors and gaps. Corrections to archived data are made as
appropriate and thoroughly documented.
What data validity grade should this utility receive for Water Imported Master Meter Error and
Supply Adjustment?
©2016 Water Research Foundation. ALL RIGHTS RESERVED

29
To receive a grade of 8,
Continuous Imported supply
metered flow data is logged
automatically and reviewed
each business day by the
Exporter. Data is adjusted to
correct gross error from
detected meter or
instrumentation equipment
malfunction and/or results
of meter accuracy testing.
Any data errors or gaps are
detected and corrected on a
daily basis. A data trail exists
for the process to protect
both the selling and the
purchasing Utility.
To receive a grade of 9,
Conditions between 8 and
10.
To receive a grade of 10,
Computerized system
(SCADA or similar)
automatically records data
which is reviewed each
business day by the
Exporter. Tight
accountability controls
ensure that all errors and
data gaps that occur in the
archived flow data are
quickly detected and
corrected. A reliable data
trail exists and contract
provisions for meter testing
and data management are
reviewed by the selling and
purchasing Utility at least
once every five years.
(WLCC 2014)
Because data is logged continuously and reviewed daily and documentation of the import‐export
agreement exists, this utility exceeds a grade of 8. However, because the exporter was unable to
produce a “reliable data trail” for meter test and calibration results, the utility does not qualify
for a grade of 10. Furthermore, the terms of the import‐export agreement are only reviewed
once every ten years, rather than once every five years as the criteria for a grade of 10 require.
Therefore, the appropriate grade is 9.
©2016 Water Research Foundation. ALL RIGHTS RESERVED

30
Water Exported
Water Exported is the volume of bulk water conveyed and sold by a water utility to a neighboring
system(s) that exists outside the utility’s service area. Typically, Water Exported is metered at a
point of interconnection between the two water utilities, and usually the meter(s) is owned by
the utility that sells the water. (Alegre et al. 2000, AWWA 2009, WLCC 2014).
It is important to note that the Water Exported volume is sold in bulk to agencies who are
normally charged a wholesale rate. Wholesale rates tend to differ from retail rates charged to
customers within a utility’s own service territory. As a result, it is important to differentiate Water
Exported from Billed Metered Authorized Consumption and avoid double‐counting the volume
of Water Exported. (WLCC 2014).
Data Validity Themes
The validity of the Water Exported input depends on:
the extent of export metering
the frequency and results of export meter calibration
the frequency and results of export meter volumetric accuracy testing
To grade the validity of the Water Exported input, the validator will have to answer the following
questions.
⃝ How many distinct export connections are there?
⃝ How many export connections are metered?
⃝ Are any of the meters in series?
⃝ Do the meters capture raw water or potable water?
⃝ How are unmetered exports estimated?
⃝ How often are export meters calibrated? Which meters are calibrated?
⃝ What were the results of the calibrations closest to the audit period?
⃝ How often are export meters tested for volumetric accuracy? Which meters are
volumetrically tested?
⃝ What were the results of the volumetric accuracy tests closest to the audit period?
Common Errors
In validating the Water Exported input, it is important to maintain a distinction between meter
calibration and meter volumetric accuracy testing, especially for the assignment of higher data
validity grades. For more information about the difference between calibration and volumetric
©2016 Water Research Foundation. ALL RIGHTS RESERVED
31
accuracy testing, please reference the preceding section about validating the Volume from Own
Sources input.
Additionally, if a utility exports water through emergency interconnections that are not always
active, this exported volume should still be included in the water audit. The auditor and validator
will need to note the tracking mechanisms that document emergency exports and inform the
water audit.
Utilities who sell bulk water as a wholesale export must be careful to categorize this water as
Water Exported and not double‐count it as Billed Metered Authorized Consumption. Wholesale
exports are commonly tracked in the billing database, so the auditor and validator alike should
confirm that wholesale export volumes have been extracted from billing summaries and included
in the volume of Water Exported.
Example Data Validity Grade Selection
The criteria for grading the validity of the Water Exported volume is identical to the criteria for
grading the validity of the Water Imported volume, only applied in reference to an export
meter(s) and the corresponding contractual arrangement. Therefore, for an example of the
grading process as it pertains to volumes of Water Imported and Water Exported, please refer
back to the section on Water Imported.
©2016 Water Research Foundation. ALL RIGHTS RESERVED

32
Volume Exported – Master Meter and Supply Error Adjustment
Volume Exported is adjusted for meter inaccuracy with a Master Meter and Supply Error
Adjustment (MMEA). The auditor may choose to adjust for Master Meter Error using either a
percentage input into the audit software or a volume that is then added or subtracted from the
Volume Imported. (Alegre et al. 2000, AWWA 2009, WLCC 2014).
Data Validity Themes
The validity of the Water Exported MMEA input depends on:
the technology and frequency of data collection
the frequency of data review
the documentation and clarity of interagency import‐export agreement
To grade the validity of the Water Exported MMEA input, the validator will have to answer the
following questions.
⃝ How are Water Exported volumes recorded?
⃝ How often are Water Exported volumes captured?
⃝ How often is Water Exported data reviewed?
⃝ Under what conditions is Water Exported data adjusted?
⃝ What documentation is available to describe the interagency import‐export
agreement?
Example Data Validity Grade Selection
The criteria for grading the validity of the Water Exported Mater Meter and Supply Error
Adjustment is identical to the criteria for grading the validity of the Water Imported Master
Meter and Supply Error Adjustment, only applied in reference to an export meter(s) and the
corresponding contractual arrangement. Therefore, for an example of the grading process as it
pertains to volumes of Water Imported MMEA and Water Exported MMEA, please refer back to
the section on Water Imported MMEA.
©2016 Water Research Foundation. ALL RIGHTS RESERVED
33
Billed Metered Authorized Consumption
Billed Metered Authorized Consumption (BMAC) is water delivered to metered customers who
receive a bill and generate revenue for a utility. All billed and metered customer groups are
incorporated in the total Billed Metered Authorized Consumption volume, including domestic,
commercial, industrial, potable irrigation, and agricultural users. However, bulk water exported
is not considered a component of Billed Metered Authorized Consumption. Instead, Water
Exported is a component of the System Input Volume used to calculate Water Supplied. (Alegre
et al. 2000, AWWA 2009, WLCC 2014).
Data Validity Themes
The validity of the BMAC input depends on:
the prevalence of customer metering
the technology and success of customer meter read collection
the frequency of customer meter replacement
the prevalence and purpose of customer meter testing
the technology of customer data management
the frequency of customer meter data review
To grade the validity of the Billed Metered Authorized Consumption input, the validator will have
to answer the following questions.
⃝ What portion of customers are metered?
⃝ How are customer meter reads collected?
⃝ What is the success rate of meter read collection?
⃝ When are customer meters replaced?
⃝ How many customer meters are tested annually? Why?
⃝ How are customer bill records maintained?
⃝ How often are customer bill records audited? By whom?
Common Errors
The guidance provided for BMAC data validity grading incorporates three broad but distinct
components of customer billing and metering: the prevalence of metering, the technology of
meter read collection and management, and the policies surrounding meter replacement and
testing. It is important that both the auditor and validator keep all three contributing factors in
mind in selecting the grade for which all criteria are met. For the BMAC input, it is particularly
©2016 Water Research Foundation. ALL RIGHTS RESERVED
34
important that the validator strictly adhere to the requirement that a utility meet or exceed all
criteria for a grade and all grades below it for that grade to legitimately apply.
For example, a utility may benefit from a fully‐metered system with successful advanced
metering infrastructure (AMI). However, if meters are only replaced upon complete failure, the
utility cannot qualify for a data validity grade above 4.
Additionally, it will be important to confirm that the BMAC volume does not contain non‐potable
water, include unbilled authorized uses, or double‐count volume already categorized as Water
Exported.
Example Data Validity Grade Selection
A utility aims to meter all billed customers, and a recent study concluded that more than 99% of
billed customers indeed have a radio‐read (AMR) meter. The study also audited portions of the
billing system and determined that introduction of error into the billing process is likely minimal,
but structured or regular billing system audits are infrequently conducted. Furthermore, the
utility maintains a customer meter replacement program in which meters are replaced 18 years
after installation. It is utility policy that meters are tested only in response to customer requests.
What data validity grade should this utility receive for Billed Metered Authorized Consumption?
©2016 Water Research Foundation. ALL RIGHTS RESERVED
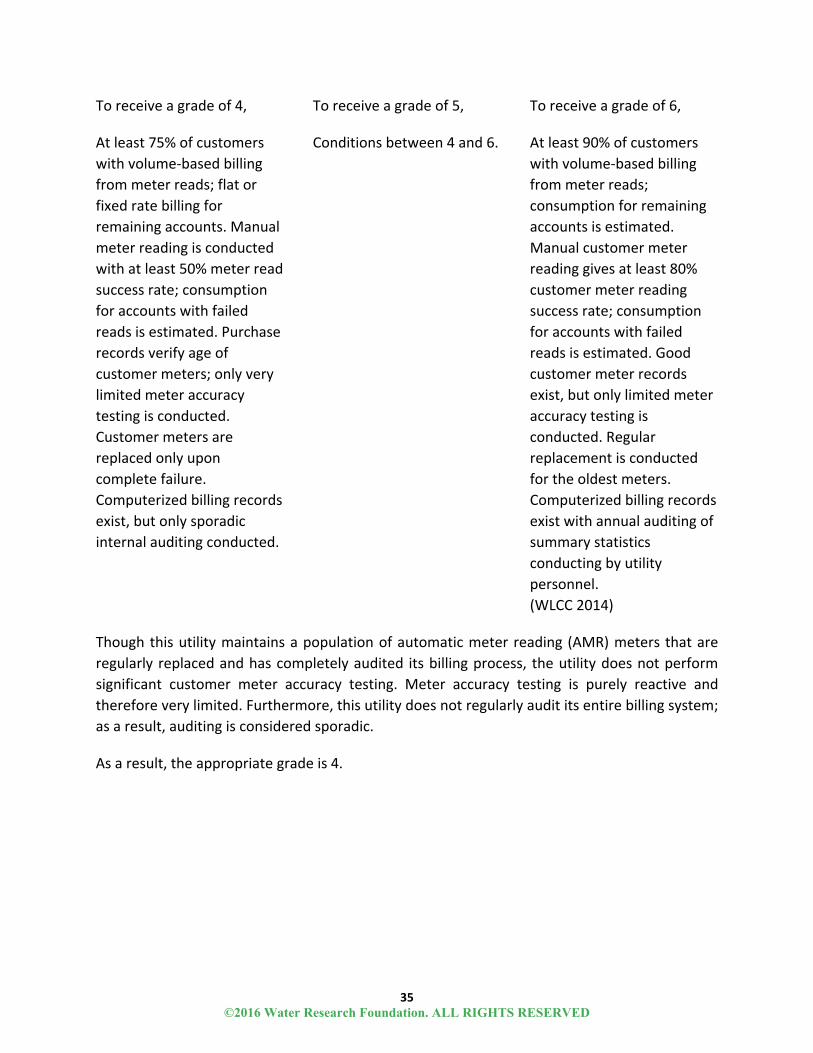
35
To receive a grade of 4,
At least 75% of customers
with volume‐based billing
from meter reads; flat or
fixed rate billing for
remaining accounts. Manual
meter reading is conducted
with at least 50% meter read
success rate; consumption
for accounts with failed
reads is estimated. Purchase
records verify age of
customer meters; only very
limited meter accuracy
testing is conducted.
Customer meters are
replaced only upon
complete failure.
Computerized billing records
exist, but only sporadic
internal auditing conducted.
To receive a grade of 5,
Conditions between 4 and 6.
To receive a grade of 6,
At least 90% of customers
with volume‐based billing
from meter reads;
consumption for remaining
accounts is estimated.
Manual customer meter
reading gives at least 80%
customer meter reading
success rate; consumption
for accounts with failed
reads is estimated. Good
customer meter records
exist, but only limited meter
accuracy testing is
conducted. Regular
replacement is conducted
for the oldest meters.
Computerized billing records
exist with annual auditing of
summary statistics
conducting by utility
personnel.
(WLCC 2014)
Though this utility maintains a population of automatic meter reading (AMR) meters that are
regularly replaced and has completely audited its billing process, the utility does not perform
significant customer meter accuracy testing. Meter accuracy testing is purely reactive and
therefore very limited. Furthermore, this utility does not regularly audit its entire billing system;
as a result, auditing is considered sporadic.
As a result, the appropriate grade is 4.
©2016 Water Research Foundation. ALL RIGHTS RESERVED
36
Billed Unmetered Authorized Consumption
Billed Unmetered Authorized Consumption (BUAC) is water delivered to unmetered customers
who nonetheless receive a bill and generate revenue for the utility. Generally, billed unmetered
customers pay a flat rate, even though consumption may be variable. As a result, Billed
Unmetered Authorized Consumption volumes must typically be estimated for the purposes of
the water audit. (Alegre et al. 2000, AWWA 2009, WLCC 2014).
Data Validity Themes
The validity of the BUAC input depends on:
the prevalence of customer meter installation
the method of consumption estimation
the clarity and comprehensiveness of utility metering policy
To grade the validity of the Billed Unmetered Authorized Consumption input, the validator will
have to answer the following questions.
⃝ What are utility policies regarding which customers must be metered?
⃝ Are metering policies clear?
⃝ Are metering policies consistently implemented?
⃝ How is unmetered consumption estimated?
Common Errors
In assessing the validity of the BUAC input, the validator will need to study utility policy on
customer metering exemptions and determine how effectively utility policy is implemented.
While a utility may aim to meter all customers in accordance with written policy, it is possible
that a significant portion of customers may nonetheless be unmetered due to unusual
circumstances or incomplete customer data management.
Additionally, the BUAC volume pertains to volume that is unmetered due to utility policy. It does
not include volume passed through meters that are installed but not functioning properly. Missed
volume, whether partial or complete, is a form of Apparent Loss.
Example Data Validity Grade Selection
A utility has historically operated an unmetered system. However, three years ago the utility
adopted a policy to meter all customers. Since the policy was adopted, meters were installed on
a majority of service connections. As the meter installation program nears completion, the utility
is conducting a census of all customer accounts to identify those that remain unmetered.
©2016 Water Research Foundation. ALL RIGHTS RESERVED
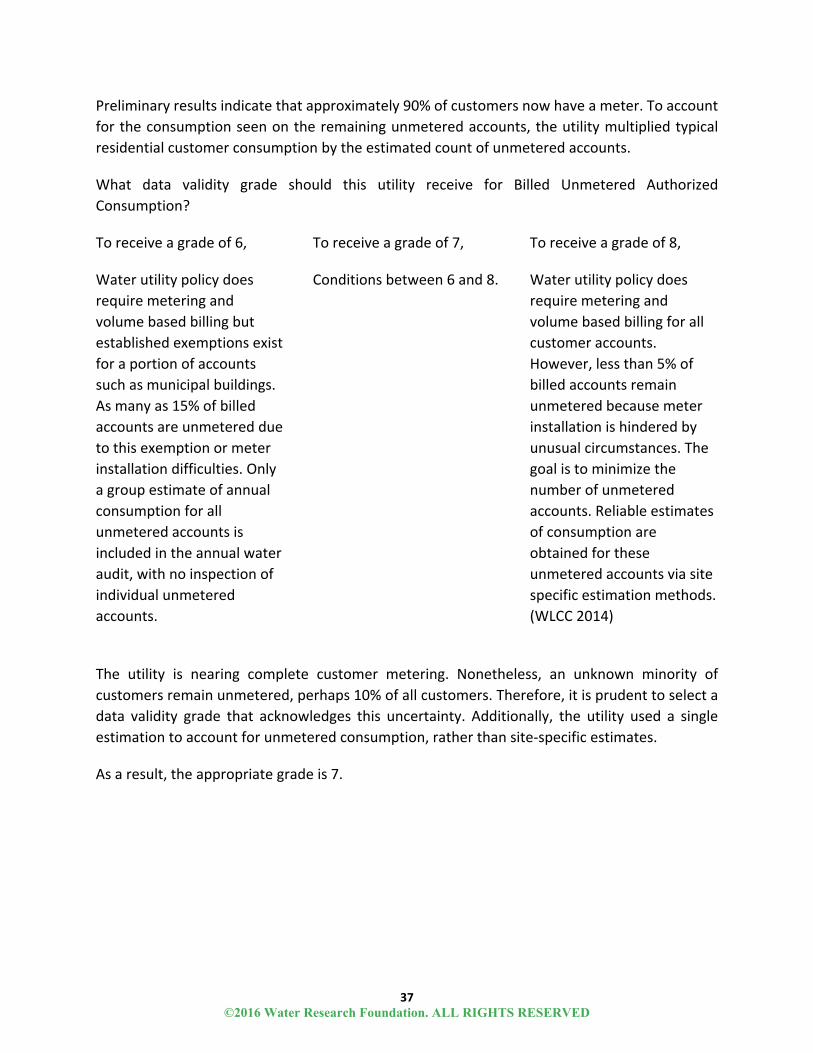
37
Preliminary results indicate that approximately 90% of customers now have a meter. To account
for the consumption seen on the remaining unmetered accounts, the utility multiplied typical
residential customer consumption by the estimated count of unmetered accounts.
What data validity grade should this utility receive for Billed Unmetered Authorized
Consumption?
To receive a grade of 6,
Water utility policy does
require metering and
volume based billing but
established exemptions exist
for a portion of accounts
such as municipal buildings.
As many as 15% of billed
accounts are unmetered due
to this exemption or meter
installation difficulties. Only
a group estimate of annual
consumption for all
unmetered accounts is
included in the annual water
audit, with no inspection of
individual unmetered
accounts.
To receive a grade of 7,
Conditions between 6 and 8.
To receive a grade of 8,
Water utility policy does
require metering and
volume based billing for all
customer accounts.
However, less than 5% of
billed accounts remain
unmetered because meter
installation is hindered by
unusual circumstances. The
goal is to minimize the
number of unmetered
accounts. Reliable estimates
of consumption are
obtained for these
unmetered accounts via site
specific estimation methods.
(WLCC 2014)
The utility is nearing complete customer metering. Nonetheless, an unknown minority of
customers remain unmetered, perhaps 10% of all customers. Therefore, it is prudent to select a
data validity grade that acknowledges this uncertainty. Additionally, the utility used a single
estimation to account for unmetered consumption, rather than site‐specific estimates.
As a result, the appropriate grade is 7.
©2016 Water Research Foundation. ALL RIGHTS RESERVED

38
Unbilled Metered Authorized Consumption
Unbilled Metered Authorized Consumption (UMAC) is water delivered to metered customers but
deemed by utility policy to be unbilled and therefore not revenue‐generating (Alegre et al. 2000,
AWWA 2009, WLCC 2014). This could include metered water consumed by the utility itself in
treatment or distribution operations or metered water provided to a civic institution free of
charge.
Data Validity Themes
The validity of the UMAC input depends on:
the enforcement of billing policies
the frequency of meter reading
the precision of the count of unbilled metered connections
To grade the validity of the Unbilled Metered Authorized Consumption input, the validator will
have to answer the following questions.
⃝ What are utility policies regarding which customers are metered but unbilled?
⃝ Are billing exemption policies clear?
⃝ Are billing exemption policies consistently implemented?
⃝ How often are unbilled meters read?
⃝ How is unbilled metered consumption estimated in the absence of a recent meter
read?
Common Errors
Meter reading for unbilled customers and consumptive utility operations is generally a lower
priority than collecting reads of revenue‐generating meters. As a result, read frequency for
unbilled customers or utility meters can be infrequent. Therefore, though an unbilled customer
or utility operation may be metered, the meter may not have been read frequently enough to
fully inform the audit, requiring the auditor to estimate some portion of UMAC.
Even though UMAC consumption may be estimated, it is important to maintain the
categorization of the volume as metered, given that more accurate measurements of
consumption could be achieved with more frequent meter reading.
©2016 Water Research Foundation. ALL RIGHTS RESERVED

39
Example Data Validity Grade Selection
A utility meters but does not bill treatment plant use, water utility office building consumption,
and city park irrigation, as laid out in city contracts and operating protocols. In total, there are
twelve unbilled metered accounts, a count the utility is confident about but has not audited this
year. The utility has been short‐staffed the past couple of years, so meter reading for unbilled
accounts occurs only a few times annually.
What data validity grade should this utility receive for Unbilled Metered Authorized
Consumption?
To receive a grade of 8,
Written policy identifies the
types of accounts granted a
billing exemption. Customer
meter management and
meter reading are
considered secondary
priorities, but meter reading
is conducted at least
annually to obtain
consumption volumes for
the annual water audit. High
level auditing of billing
records ensures that a
reliable census of such
accounts exists.
To receive a grade of 9,
Conditions between 8 and
10.
To receive a grade of 10,
Clearly written policy
identifies the types of
accounts given a billing
exemption, with emphasis
on keeping such accounts to
a minimum. Customer meter
management and meter
reading for these accounts is
given proper priority and is
reliably conducted. Regular
auditing confirms this. Total
water consumption for
these accounts is taken from
reliable readings from
accurate meters.
(WLCC 2014)
Though the utility operates with clear policies about customers granted billing exemptions and
maintains a count of the number of exemptions, meters are not read nor audited frequently.
As a result, the appropriate grade is 8.
©2016 Water Research Foundation. ALL RIGHTS RESERVED
40
Unbilled Unmetered Authorized Consumption
Unbilled Unmetered Authorized Consumption (UUAC) is any form of Authorized Consumption
that is neither billed nor metered and must therefore be estimated. Unbilled Unmetered
Authorized Consumption typically includes water used for fire‐fighting, water and sewer main
flushing, street cleaning, and fire flow tests (Alegre et al. 2000, AWWA 2009, WLCC 2014).
Users may select a default value (1.25% of Water Supplied) to estimate UUAC. Employing the
default value automatically assigns a data validity grade of 5 to UUAC. Should the auditor choose
instead to input a UUAC volume, the auditor will have to select an appropriate data validity grade.
Data Validity Themes
The validity of the UUAC input depends on:
clarity of and adherence to documentation policies
the method of consumption estimation
To grade the validity of the Unbilled Unmetered Authorized Consumption input, the validator will
have to answer the following questions.
⃝ What uses are unmetered and unbilled?
⃝ Are utility policies on unmetered and unbilled use clear?
⃝ How are unmetered, unbilled uses documented?
⃝ How is consumption for each use estimated?
Common Errors
Water lost to leakage is not considered an authorized use and should therefore not be included
in Unbilled Unmetered Authorized Consumption. However, water used for leak repair (for
example, in post‐repair flushing) is indeed authorized and should be categorized as Unbilled
Unmetered Authorized Consumption.
Example Data Validity Grade Selection
A utility initially selects the default option to estimate UUAC. The utility then conducts a high‐
level census of UUAC volumes and determines that some uses, like sewer flushing, are easy to
estimate because field operators reliably record flow rates and event durations. Other uses, like
fire‐fighting and post‐repair flushing, are undocumented. Upon comparing the default volume to
the utility’s own estimates of UUAC, the utility notices that the default value grossly
overestimates the probable volume of UUAC. Therefore, the utility chooses a more conservative
assumption of 0.25% of Water Supplied to account for UUAC.
©2016 Water Research Foundation. ALL RIGHTS RESERVED
41
What data validity grade should this utility receive for Unbilled Unmetered Authorized
Consumption?
To receive a grade of 2,
Clear extent of unbilled,
unmetered consumption is
unknown, but a number of
events are randomly
documented each year,
confirming existence of such
consumption, but without
sufficient documentation to
quantify an accurate
estimate of the annual
volume consumed.
To receive a grade of 3,
Conditions between 2 and 4.
To receive a grade of 4,
Extent of unbilled,
unmetered consumption is
partially known, and
procedures exist to
document certain events
such as miscellaneous fire
hydrant uses. Formulae is
used to quantify the
consumption from such
events (time running
multiplied by typical
flowrate, multiplied by
number of events).
(WLCC 2014)
Because the utility chose not to use the AWWA Software‐supplied default value, the utility should
choose a data validity grade other than 5 to describe the UUAC input. The utility maintained
detailed records of some uses but no records of other uses. The UUAC records are not random,
as a grade of 2 indicates. The utility does use formulae to quantify the uses from some events,
but these formulae were used only to corroborate a simple percentage estimate of UUAC.
Therefore, the appropriate grade is 3.
©2016 Water Research Foundation. ALL RIGHTS RESERVED
42
Unauthorized Consumption
Unauthorized Consumption is water that an end user consumes illegitimately. This includes water
illegally withdrawn from fire hydrants, illegal connections, bypasses around customer
consumption meters, and other methods of extraction intended to circumvent the utility’s ability
to collect revenue. (Alegre et al. 2000, AWWA 2009, WLCC 2014).
Unauthorized Consumption tends to be a small volume, and discovering instances of
Unauthorized Consumption is often resource‐intensive. Nonetheless, some volume of
Unauthorized Consumption is expected in all systems. As a result, the auditor may choose to
select a value of 0.25% of Water Supplied to estimate Unauthorized Consumption. If an auditor
has not yet gather detailed data capturing occurrences of Unauthorized Consumption, it is
recommended that the auditor select the default value.
Data Validity Themes
The validity of the Unauthorized Consumption input depends on:
insight into the extent of Unauthorized Consumption
the method of Unauthorized Consumption estimation
To grade the validity of the Unauthorized Consumption input, the validator will have to answer
the following questions.
⃝ What instances of Unauthorized Consumption have been documented?
⃝ What information is captured in records of Unauthorized Consumption?
⃝ How are unmetered, unbilled uses documented?
⃝ How is consumption for each use estimated?
⃝ Are documented volumes of Unauthorized Consumption thorough enough to replace
the default estimate?
Common Errors
Most users select the default value to estimate Unauthorized Consumption. Users are
discouraged from inputting a value of zero, since a small volume of Unauthorized Consumption
is expected for all systems.
Example Data Validity Grade Selection
A utility records occasional instances of discovered water theft, but most instances are not
documented. During this audit period, the auditor found six reports of illegal connections and
©2016 Water Research Foundation. ALL RIGHTS RESERVED
43
three reports of intentional meter tampering. A loss volume was calculated for each discovered
instance of theft, resulting in a total estimated loss of 0.7 acre‐feet. Because the information
describing Unauthorized Consumption appeared incomplete, the auditor chose to use the default
value of 0.25% of Water Supplied, which produced an estimate of 1.5 acre‐feet of Unauthorized
Consumption.
What data validity grade should this utility receive for Unbilled Unmetered Authorized
Consumption?
To receive a grade of 4,
Procedures exist to
document some
Unauthorized Consumption
such as observed
unauthorized fire hydrant
openings. Use formulae to
quantify this consumption
(time running multiplied
typical flowrate, multiplied
by number of events).
To receive a grade of 5,
Default value of 0.25% of
volume of Water Supplied is
employed.
To receive a grade of 6,
Coherent policies exist for
some forms of unauthorized
consumption (more than
simply fire hydrant misuse)
but others await closer
evaluation. Reasonable
surveillance and
recordkeeping exist for
occurrences that fall under
the policy. Volumes
quantified by inference from
these records.
(WLCC 2014)
Though some information is available to describe Unauthorized Consumption using per‐event
estimates, the auditor did not deem the information complete. Instead, the auditor selected the
default value to estimate Unauthorized Consumption.
Therefore, the appropriate grade is 5. Upon selecting the default, the AWWA Software will
automatically assign a data validity grade of 5. Even though the utility has data available to
describe some instances of Unauthorized Consumption, that data did not ultimately inform the
water audit input for Unauthorized Consumption.
©2016 Water Research Foundation. ALL RIGHTS RESERVED
44
Customer Metering Inaccuracies
Customer Metering Inaccuracies are a form of Apparent Loss that results from collective meter
under‐registration. Most meters gradually wear with cumulative throughput, causing the meters
to register volumes smaller than the volumes that actually passed through the meters (Alegre et
al. 2000, AWWA 2009, WLCC 2014). All metered systems feature a degree of inaccuracy.
In acknowledging meter inaccuracy in the AWWA software, the auditor may input either an
inaccuracy percentage to describe bulk under‐registration or a volume of Apparent Loss resulting
from calculation performed outside the AWWA Software.
Data Validity Themes
The validity of the Customer Metering Inaccuracy input depends on:
the quality and technology of customer meter recordkeeping
the frequency and design of customer meter replacement
the frequency and purpose of customer meter testing
the method of Customer Metering Inaccuracies estimation
To grade the validity of the Customer Metering Inaccuracies input, the validator will have to
answer the following questions.
⃝ How are customer meter records managed?
⃝ What is the make‐up of the customer meter population? Is it homogenous or varied?
⃝ How many meters are replaced annually?
⃝ How are meters selected for replacement?
⃝ How many meters are tested annually? Why?
⃝ Were test results used for Customer Metering Inaccuracies calculation? How?
Common Errors
Prior to using customer meter test results to estimate Customer Metering Inaccuracies, it is
essential that the auditor identify the purpose of the tests. Because the Customer Metering
Inaccuracies percentage input describes the performance of a typical meter in a utility’s meter
stock, test results used to calculate this figure should also capture a typical meter.
Many utilities primarily test meters suspected of malfunction. Tests conducted to diagnose poor
performance, while useful for maintaining customer meter accuracy, do not accurately inform
©2016 Water Research Foundation. ALL RIGHTS RESERVED
45
water audits. Instead, meters should be selected randomly and representatively to increase the
statistical likelihood that sample test results capture average meter performance.
Lastly, meter age does not always correspond to meter accuracy. Research over the past decade
has indicated that age is not a reliable predictor of meter accuracy. Variables like meter
installation conditions, water hardness, consumption patterns, and climate also affect meter
accuracy. Even new meters can under‐register. Therefore, while an older meter population is
likely to register more inaccurately than a newer meter population, meter age alone does not
always provide sufficient insight for calculating Apparent Losses due to Customer Metering
Inaccuracies.
Example Data Validity Grade Selection
A utility conducted a customer meter accuracy study five years ago, and the study indicated that
an average meter in the utility’s meter stock registered with 98.2% accuracy. Since the conclusion
of the study, the utility has replaced a quarter of its meter stock to improve revenue generation.
No follow‐up assessments of meter accuracy have been performed. However, customer meters
are tested upon customer request.
Additionally, the utility maintains a thorough electronic customer meter inventory. For the
purposes of this audit, the utility has estimated Customer Metering Inaccuracy to be 1.5%, a slight
improvement over the 1.8% inaccuracy calculated five years ago prior to meter replacement.
What data validity grade should this utility receive for Customer Metering Inaccuracies?
To receive a grade of 2,
Poor recordkeeping and
meter oversight is
recognized by water utility
management who has
allotted staff and funding
resources to organize
improved recordkeeping and
start meter accuracy testing.
Existing paper records
gathered and organized to
provide cursory disposition
of meter population.
Customer meters are tested
for accuracy only upon
customer request.
To receive a grade of 3,
Conditions between 2 and 4.
To receive a grade of 4,
Reliable recordkeeping
exists; meter information is
improving as meters are
replaced. Meter accuracy
testing is conducted
annually for a small number
of meters (more than just
customer requests, but less
than 1% of inventory). A
limited number of the oldest
meters are replaced each
year. Inaccuracy volume is
largely an estimate, but
refined based upon limited
testing data. (WLCC 2014)
©2016 Water Research Foundation. ALL RIGHTS RESERVED
46
The utility maintains reliable meter information and has tested meters in the past, but for this
audit period, no temporally‐relevant test data was available to describe the accuracy of the meter
population. Meters are only tested upon customer request.
Therefore, the appropriate grade is 2. Should the utility randomly and representatively test
customer meters in the future, the data validity grade for Customer Metering Inaccuracies will
increase.
©2016 Water Research Foundation. ALL RIGHTS RESERVED

47
Systematic Data Handling Errors
Systematic Data Handling Errors can cause Apparent Losses through accounting omissions, errant
computer programming, gaps in policy and procedure, and other data lapses that result in under‐
stated customer consumption (AWWA 2009, WLCC 2014).
The auditor may choose to select a default value of 0.25% of Billed Metered Authorized
Consumption to estimate Systematic Data Handling Errors. If an auditor has not yet gather
detailed data capturing occurrences of Systematic Data Handling Errors, it is recommended that
the auditor select the default value, since some degree of error is likely.
Data Validity Themes
The validity of the Systematic Data Handling Errors input depends on:
the quality and frequency of review of billing policies and procedures
the technology that manages billing data
the frequency and extent of billing data review
the method used in volume estimation
To grade the validity of the Systematic Data Handling Errors input, the validator will have to
answer the following questions.
⃝ What policies govern billing processes and account management?
⃝ How effectively are these policies implemented?
⃝ What technologies are used in read collection and billing processes?
⃝ How often are billing processes and billing data audited?
⃝ Who performs the auditing?
⃝ What checks and functions are built into billing data management to minimize
error?
⃝ How was the volume of Systematic Data Handling Errors estimated?
Common Errors
While each utility’s read collection practices and billing technology is susceptible to unique lapses
and errors, it is common to encounter zero reads and negative reads that affect summaries of
billed volumes.
©2016 Water Research Foundation. ALL RIGHTS RESERVED
48
Consecutive zero consumption recordings may legitimately indicate no consumption, perhaps
due to property vacancy or seasonal occupation. However, it is also possible that consecutive
zeroes result from meter reading errors, read transmission failure, meter failure, or billing system
lapses, all of which should be investigated in order to determine the volume of Apparent Loss
due to Systematic Data Handling Errors.
Negative reads may result from billing system algorithms that adjust recorded volumes to
generate financial credits. Such data manipulation may delete record of legitimate consumption
and cause the volume of metered consumption to be understated. In these cases, bill adjustment
procedures should be reviewed to determine the volume that is potentially missing from
summaries of Authorized Consumption.
In the absence of a detailed investigation of meter reading and bill generation processes, a utility
does not have the basis to report a Systematic Data Handling Errors volume of 0. Should a utility
not have an estimate available for Apparent Losses due to Systematic Data Handling Errors, the
default value should be selected.
Example Data Validity Grade Selection
A utility reviews its billing policies and procedures every five years. The utility manages meter
read collection and bill generation processes with a new computerized system. The system
incorporates checks on consumption and includes flags for flat‐lined consumption, unexpectedly
high or low consumption, and missing reads. However, the volume attributable to errant reads,
stuck meters, and other shortcomings of the billing process is difficult to quantify, so the utility
can only calculate an approximate volume that is qualified by some assumptions made in the
calculation.
What data validity grade should this utility receive for Systematic Data Handling Errors?
©2016 Water Research Foundation. ALL RIGHTS RESERVED

49
To receive a grade of 4,
Policy and procedures for
new account activation and
oversight of billing
operations exist but needs
refinement. Computerized
billing system exists, but is
dated or lacks needed
functionality. Periodic,
limited internal audits
conducted and confirm with
approximate accuracy the
consumption volumes lost to
billing lapses.
To receive a grade of 5,
Conditions between 4 and 6.
To receive a grade of 6,
Policy and procedures for
new account activation and
oversight of billing
operations is adequate and
reviewed periodically.
Computerized billing system
is in use with basic reporting
available. Any effect of
billing adjustments on
measured consumption
volumes is well understood.
Internal checks of billing
data error conducted
annually. Reasonably
accurate quantification of
consumption volume lost to
billing lapses is obtained.
(WLCC 2014)
The utility does use a computerized system that identifies certain types of data handling errors.
Policies and procedures are reviewed periodically. However, the utility is at this time only able to
approximate the volume lost to Systematic Data Handling Errors.
Therefore, the appropriate grade is 5. Should the utility be able to quantify the volume lost to
Systematic Data Handling Errors with greater certainty in the future, the data validity grade for
Systematic Data Handling Errors will increase.
©2016 Water Research Foundation. ALL RIGHTS RESERVED
50
Length of Mains
For the purposes of the water audit, the Length of Mains is the length of all pipelines (except
service connections) in a system, measured from the point of input metering to encompass only
the infrastructure that transmit potable water. The Length of Mains includes the total length of
fire hydrant lead pipe and laterals. (Alegre et al. 2000, AWWA 2009, WLCC 2014).
Data Validity Themes
The validity of the Length of Mains input depends on:
the policies that direct asset installation and documentation
the technology used for asset data management
the method and frequency of asset data review
To grade the validity of the Length of Mains input, the validator will have to answer the following
questions.
⃝ What is the utility policy for installing and documenting new infrastructure?
⃝ How effectively are these policies implemented?
⃝ How are pipe assets tracked?
⃝ How often are asset records validated with field data?
Common Errors
The Length of Mains for a utility should include not only standard transmission and distribution
piping, but also the total length of fire hydrant laterals. However, the Length of Mains does not
include service connection piping. When selecting a data source to inform the Length of Mains
calculation, the auditor will need to identify what types of potable water pipe are included in the
data source.
To include the length of fire hydrant laterals, the auditor may either sum the lengths of individual
hydrants laterals (if such data is available) or multiply the estimated average lengths of a hydrant
lateral by the count of hydrants in the system.
Example Data Validity Grade Selection
A utility is building a GIS system to manage asset data after using paper records for decades.
Because the GIS system is still coming online, the paper records are maintained as a system back‐
up. It is utility policy that all new installations are recorded in the GIS system within 48 hours of
project completion. However, no field validation of the GIS system has yet been performed. The
©2016 Water Research Foundation. ALL RIGHTS RESERVED
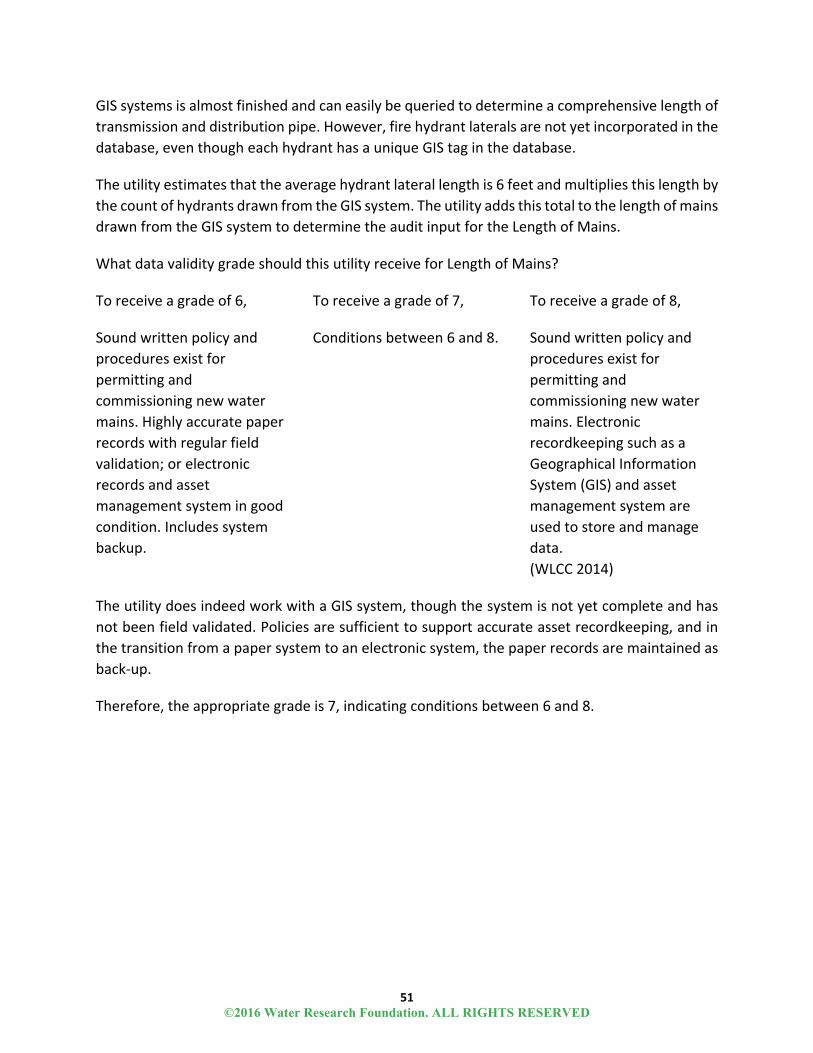
51
GIS systems is almost finished and can easily be queried to determine a comprehensive length of
transmission and distribution pipe. However, fire hydrant laterals are not yet incorporated in the
database, even though each hydrant has a unique GIS tag in the database.
The utility estimates that the average hydrant lateral length is 6 feet and multiplies this length by
the count of hydrants drawn from the GIS system. The utility adds this total to the length of mains
drawn from the GIS system to determine the audit input for the Length of Mains.
What data validity grade should this utility receive for Length of Mains?
To receive a grade of 6,
Sound written policy and
procedures exist for
permitting and
commissioning new water
mains. Highly accurate paper
records with regular field
validation; or electronic
records and asset
management system in good
condition. Includes system
backup.
To receive a grade of 7,
Conditions between 6 and 8.
To receive a grade of 8,
Sound written policy and
procedures exist for
permitting and
commissioning new water
mains. Electronic
recordkeeping such as a
Geographical Information
System (GIS) and asset
management system are
used to store and manage
data.
(WLCC 2014)
The utility does indeed work with a GIS system, though the system is not yet complete and has
not been field validated. Policies are sufficient to support accurate asset recordkeeping, and in
the transition from a paper system to an electronic system, the paper records are maintained as
back‐up.
Therefore, the appropriate grade is 7, indicating conditions between 6 and 8.
©2016 Water Research Foundation. ALL RIGHTS RESERVED

52
Number of Active and Inactive Service Connections
The Number of Active and Inactive Service Connections is the total count of pressurized customer
service connections extended from the water main to supply water to customers (WLCC 2014).
This figure should include the number of distinct pressurized connections, including fire
connections, regardless of whether connections are metered or unmetered. (Alegre et al. 2000,
AWWA 2009, WLCC 2014).
Data Validity Themes
The validity of the Number of Active and Inactive Service Connections input depends on:
the policies and procedures that direct service connection permitting and installation
the technology used for service connection data management
the potential error in the total count
the frequency of field verification
To grade the validity of the Number of Active and Inactive Service Connections input, the
validator will have to answer the following questions.
⃝ What is the utility policy for permitting, installing and documenting new service
connections?
⃝ How effectively are these policies implemented?
⃝ How are service connections tracked?
⃝ How is service connection documentation field verified?
⃝ What margin of error does the auditor assign to the estimate of the Number of Active
and Inactive Service Connections?
Common Errors
As the name implies, the Number of Active and Inactive Service Connections should indeed
include connections that are inactive, unmetered, and/or unbilled in addition to standard billed
and metered connections, as long as the service connection piping is full and pressurized. The
Number of Active and Inactive Service Connections is used to calculate a utility’s Unavoidable
Annual Real Losses (UARL), and so each point of connection to the main pipe is allocated a
technical‐minimum leakage allowance.
This may be distinct from the number of active and inactive accounts. The audit input for the
Number of Active and Inactive Service Connections is strictly concerned with infrastructure, not
accounting or customer service designations. Therefore, the auditor will have to choose a data
©2016 Water Research Foundation. ALL RIGHTS RESERVED
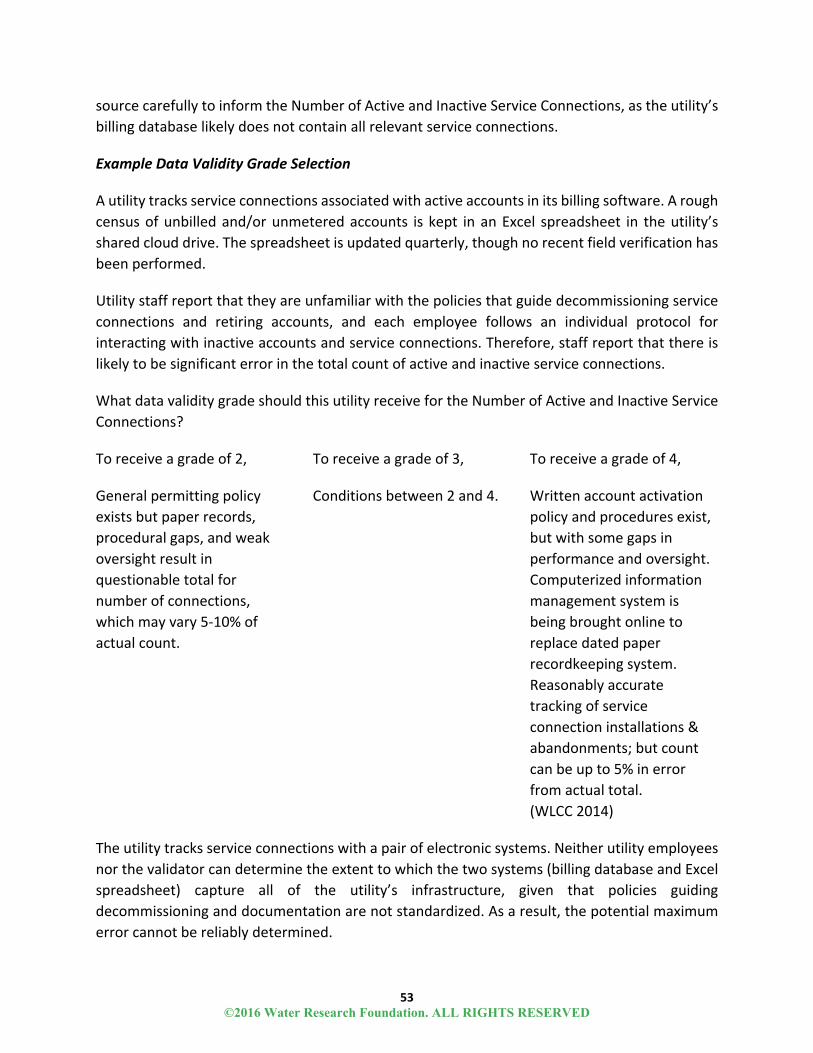
53
source carefully to inform the Number of Active and Inactive Service Connections, as the utility’s
billing database likely does not contain all relevant service connections.
Example Data Validity Grade Selection
A utility tracks service connections associated with active accounts in its billing software. A rough
census of unbilled and/or unmetered accounts is kept in an Excel spreadsheet in the utility’s
shared cloud drive. The spreadsheet is updated quarterly, though no recent field verification has
been performed.
Utility staff report that they are unfamiliar with the policies that guide decommissioning service
connections and retiring accounts, and each employee follows an individual protocol for
interacting with inactive accounts and service connections. Therefore, staff report that there is
likely to be significant error in the total count of active and inactive service connections.
What data validity grade should this utility receive for the Number of Active and Inactive Service
Connections?
To receive a grade of 2,
General permitting policy
exists but paper records,
procedural gaps, and weak
oversight result in
questionable total for
number of connections,
which may vary 5‐10% of
actual count.
To receive a grade of 3,
Conditions between 2 and 4.
To receive a grade of 4,
Written account activation
policy and procedures exist,
but with some gaps in
performance and oversight.
Computerized information
management system is
being brought online to
replace dated paper
recordkeeping system.
Reasonably accurate
tracking of service
connection installations &
abandonments; but count
can be up to 5% in error
from actual total.
(WLCC 2014)
The utility tracks service connections with a pair of electronic systems. Neither utility employees
nor the validator can determine the extent to which the two systems (billing database and Excel
spreadsheet) capture all of the utility’s infrastructure, given that policies guiding
decommissioning and documentation are not standardized. As a result, the potential maximum
error cannot be reliably determined.
©2016 Water Research Foundation. ALL RIGHTS RESERVED
54
Therefore, the appropriate grade is 2, because in conservative assessment this utility’s count of
service connections could be up to 10% in error.
©2016 Water Research Foundation. ALL RIGHTS RESERVED
55
Average Length of Customer Service Line
The Average Length of Customer Service Line is the average length of the customer service line
owned and maintained by the customer from the point of ownership transfer to the customer
water meter or building line, if the customer is unmetered (Alegre et al. 2000, AWWA 2009, WLCC
2014). This parameter accounts for unmetered service line infrastructure that may leak on
customer property but will not be captured by the customer’s water meter.
The audit software prompts the user to indicate whether customer meters are typically located
at the curbstop or property line. If meters are typically located at the curbstop or customer
property line, the auditor should select “Yes” from the appropriate drop‐down box. If the auditor
selects “Yes”, the option to indicate the Average Length of Customer Service Line will disappear,
and the audit input will be assigned a data validity grade of 10.
If the auditor selects “No,” the input will need to be graded for data validity.
Data Validity Themes
The validity of the Average Length of Customer Service Line input depends on:
the policies and procedures that determine ownership delineation and meter
placement
the method used to estimate
the frequency of installation review
To grade the validity of the Average Length of Customer Service Line input, the validator will have
to answer the following questions.
⃝ Where does utility policy dictate that ownership transfer occurs?
⃝ Where does utility policy dictate that meters are installed?
⃝ How is meter installation and asset ownership information tracked?
⃝ How is recorded information field verified?
⃝ How is the average length of service connection pipe estimated?
Example Data Validity Grade Selection
A utility locates meters in customer basements as clear utility policy dictates, rather than at the
curbstop or property line. Therefore, the utility selects “No” from the drop‐down menu and is
prompted to indicate the average length of customer service lines.
©2016 Water Research Foundation. ALL RIGHTS RESERVED

56
The utility does not have this information stored in GIS or in paper records, nor are staff able to
visit a representative selection of properties to measure a sample of average lengths. Staff agree
that customer service line length to the meter ranges widely from 10 feet to more than 100 feet,
and field staff guess that the average length of customer service line is around 50 feet.
To receive a grade of 1,
Vague policy exists to define the
delineation of water utility ownership
and customer ownership of the service
connection piping. Curb stops are
perceived as the breakpoint but these
have not been well‐maintained or
documented. Most are buried or
obscured. Their location varies widely
from site‐to‐site, and estimating this
distance is arbitrary due to the unknown
location of many curb stops.
To receive a grade of 2,
Policy requires that the curb stop serves
as the delineation point between water
utility ownership and customer
ownership of the service connection
pipe. The pipe from the water main to
the curb stop is the property of the
water utility; and the piping from the
curb stop to the customer building is
owned by the customer. Curb stop
locations are not well documented and
the average distance is based upon a
limited number of locations measured in
the field.
(WLCC 2014)
Though utility policy on the location of ownership delineation and meter installation is clear, the
average length of customer service lines is unknown. As a result, the audit input is a guess and
has not been informed by any field measurements.
Therefore, the appropriate grade is 1.
©2016 Water Research Foundation. ALL RIGHTS RESERVED
57
Average Operating Pressure
The Average Operating Pressure should be calculated for the potable water distribution
infrastructure that is the subject of the water audit (Alegre et al. 2000, AWWA 2009, WLCC 2014).
The exact calculation of Average Operating Pressure is utility‐specific, but generally the pressure
in areas with more infrastructure should be given greater weight.
Data Validity Themes
The validity of the Average Operating Pressure input depends on:
the technologies that monitor pressure, manage pressure and separate zones
the success of pressure regulation
the frequency and purpose of pressure data collection
the process of average operating pressure estimation
To grade the validity of the Average Operating Pressure input, the validator will have to answer
the following questions.
⃝ How does the utility manage system pressure?
⃝ Does the utility employ pressure zones?
⃝ How are pressure zones defined and separated?
⃝ Are pressure zones discrete?
⃝ How does pressure vary throughout the system?
⃝ How and where is pressure data collected?
⃝ How was average system pressure determined?
Common Errors
When validating average operating pressure, the validator should explore the data sources that
informed the audit input. Use of a fully calibrated, current hydraulic model can provide a detailed
calculation of average pressure. A utility can also use field pressure measurements to calculate
average system pressure, as long as pressure zones, infrastructure density, and topography are
taken into consideration. In either case, the reliability of the average pressure calculation relies
upon obtaining accurate and representative field measurements to calibrate the hydraulic model
or input in weighted calculations.
Furthermore, it is advised that infrastructure density is incorporated in weighting discrete
pressure measurements or nodes when calculating average pressure for the entire system.
©2016 Water Research Foundation. ALL RIGHTS RESERVED
58
Additionally, the validator should investigate how pressure measurements or nodes relate to the
geography and topography of the distribution system. For example, pressures logged at pump
station inlets likely represent minimum local pressure and should not be the sole data source
used to describe average operating pressure.
Example Data Validity Grade Selection
A utility operates three discrete pressure zones. One pressure zone is gravity‐fed from a
treatment plant. The other two zones are fed from the gravity zone by pump stations. The utility
continuously logs pressure at pump outlets and the outlet of the treatment plant using a SCADA
system. Additionally, pressures are sporadically collected during fire hydrant flushing and when
low pressure complaints arise. The utility has a hydraulic model, though it has not been updated
in seven years.
To calculate average system pressure, the utility chose to use recorded pressures at the
treatment plant and pump station outlets and logged hydrant pressures closest to pump station
inlets. Additionally, pressures were weighted by the portion in each zone of the total mileage,
which distribution staff were able to estimate roughly.
©2016 Water Research Foundation. ALL RIGHTS RESERVED
59
To receive a grade of 4,
Effective pressure controls
separate different pressure
zones; moderate pressure
variation across the system,
occasional open boundary
valves are discovered that
breech pressure zones. Basic
telemetry monitoring of the
distribution system logs
pressure data electronically.
Pressure data gathered by
gauges or dataloggers at fire
hydrants or buildings when
low pressure complaints
arise, and during fire flow
tests and system flushing.
Reliable topographical data
exists. Average pressure is
calculated using this mix of
data.
To receive a grade of 5,
Conditions between 4 and 6.
To receive a grade of 6,
Reliable pressure controls
separate distinct pressure
zones; only very occasional
open boundary valves are
encountered that breech
pressure zones. Well‐
covered telemetry
monitoring of the
distribution system (not just
pumping at source
treatment plants or wells)
logs extensive pressure data
electronically. Pressure is
gathered by gauges or
dataloggers at fire hydrants
and buildings when low
pressure complaints arise,
and during fire flow tests
and system flushing.
Average pressure is
determined by using this mix
of reliable data.
(WLCC 2014)
The utility logs some pressures with an electronic telemetric system (SCADA), but this form of
pressure monitoring is not geographically comprehensive. The utility’s understanding of pressure
is deepened by hydrant pressure sampling, though this program is also not comprehensive and
captures pressures only during the day.
Therefore, the appropriate grade is 4. The criteria for a grade of 4 are met but not exceeded, so
a grade of 5 does not apply.
©2016 Water Research Foundation. ALL RIGHTS RESERVED

60
Total Annual Cost of Operating Water System
The Total Annual Cost of Operating Water System includes costs for operations, maintenance,
and any annually incurred costs for upkeep of the drinking water supply and distribution system.
Both daily costs and long‐term financing (e.g. capital bond repayment, infrastructure expansion
and rehabilitation projects) should be incorporated, in addition to employee salaries and
benefits, materials, equipment, insurance, and other administrative costs. Depreciation costs
may also be included, depending on utility policy (Alegre et al. 2000, AWWA 2009, WLCC 2014).
It is important that all costs pertain specifically to the potable water system.
Data Validity Themes
The validity of the Total Annual Costs of Operating Water System input depends on:
the extent of operational cost tracking
the technology that manages utility accounting
the frequency of financial auditing
the relationship of the financial auditor to the utility
To grade the validity of the Total Annual Cost of Operating System input, the validator will have
to answer the following questions.
⃝ How thoroughly are costs tracked?
⃝ Are any relevant costs not tracked?
⃝ What technology manages cost, budget, and other financial data?
⃝ How frequently are operating costs audited? By whom?
Common Errors
The Total Annual Cost to Operate System should only include costs relevant to the potable
system. If a utility also operates reclaimed water, recycled water, or sewer system in addition to
a potable system, total operating costs should be parsed to reflect the approximate allocation of
expenses, time, and resources to the potable system.
Example Data Validity Grade Selection
A utility tracks all relevant costs with a newly‐installed, electronic accounting system. Utility
employees audit their budgets and expenditures every month. Every other year, a third‐party
CPA is hired to audit all financial records. During the most recent audit, the CPA confirmed that
©2016 Water Research Foundation. ALL RIGHTS RESERVED
61
all relevant costs had been included and all relevant costs had been excluded in the Total Annual
Cost to Operate System.
To receive a grade of 8,
Reliable electronic, industry‐
standard cost accounting
system in place, with all
pertinent water system
operating costs tracked.
Data audited at least
annually by utility personnel,
and at least once every
three years by third‐party
CPA.
To receive a grade of 9,
Conditions between 8 and
10.
To receive a grade of 10,
Reliable electronic, industry‐
standard cost accounting
system in place, with all
pertinent water system
operating costs tracked.
Data audited annually by
utility personnel and
annually also by third‐party
CPA.
(WLCC 2014)
The utility meets all conditions for a grade 10 except the requirement for annual auditing by a
third party CPA, since the utility’s financed are audited by a third‐party CPA only every other year.
Therefore, the appropriate grade is 9, indicating conditions between 8 and 10.
©2016 Water Research Foundation. ALL RIGHTS RESERVED
62
Customer Retail Unit Cost
The Customer Retail Unit Cost is the average rate that customers pay for a unit of water. The
Customer Retail Unit Cost is used to value Apparent Losses, since improvements in customer
meter accuracy and billing data handling will result in increased revenues at retail rates. Most
utilities bill customers with a tiered rate structure that incorporates ranges of use and/or distinct
customer classes. In valuing Apparent Losses, it is recommended that a composite average
customer retail rate is used, rather than any single rate tier or customer class rate. (Alegre et al.
2000, AWWA 2009, WLCC 2014).
If sewer revenues collected by the water utility are volumetrically linked to potable water use,
the Customer Retail Unit Cost can also incorporate sewer rates since improvements in meter
accuracy will increase both water revenue and sewer revenue.
In regions of source water scarcity, water utilities may also choose to value Real Losses at the
Customer Retail Unit Cost by selecting a check box next to the Customer Retail Unit Cost input in
the water audit software.
Data Validity Themes
The validity of the Customer Retail Unit Cost input depends on:
the quality of the customer rate structure
the consistency of rate application
the process of customer retail cost estimation
the frequency of rate structure review
To grade the validity of the Customer Retail Unit Cost input, the validator will have to answer the
following questions.
⃝ What is the utility’s rate structure?
⃝ When was the rate structure last studied or updated?
⃝ How consistently is the rate structure applied?
⃝ How was the Customer Retail Unit Cost determined?
⃝ Have all rate tiers and account classes been incorporated?
⃝ How frequently is the rate structure reviewed by a party knowledgeable in AWWA
water audit methodology?
©2016 Water Research Foundation. ALL RIGHTS RESERVED

63
Common Errors
It is important that the Customer Retail Unit Cost represents a weighted average of all customer
rate classes and tiers. A simple average of all individual rates will likely over‐value Apparent
Losses; conversely, selection of the lowest or most commonly applied rate will likely under‐value
Apparent Losses. To calculate an appropriately weighted average, the total volumetric revenue
collected during the audit period should be divided by the total volume registered as sold. If a
utility is unable to calculate a weighted‐average Customer Retail Unit Cost, the utility will receive
a low data validity grade for this audit input.
Additionally, the Customer Retail Unit Cost should only include relevant commodity charges. All
fixed, flat, or readiness‐to‐serve costs should be excluded. Sewer rates that are proportional to
the volume of water consumed should be included.
Example Data Validity Grade Selection
A utility tracks all revenues with an up‐to‐date customer billing system. Customers are billed
based on account class (residential, commercial, industrial, and agricultural) with a progressive
tiered rate structure. The rate structure was updated last year, and given its complexity, the
auditor chose to divide total revenue earned by total volume sold to determine the Customer
Retail Unit Cost. The auditor was careful to exclude all fixed fees, and the utility does not operate
a sewer system. The utility hires a third‐part expert to study the effectiveness of the rate
structure at least every four years, but the expert is unfamiliar with water auditing.
To receive a grade of 8,
Effective water rate
structure is in force and is
applied reliably in billing
operations. Composite
customer rate is determined
using a weighted average
composite consumption
rate, which includes
residential, commercial,
industrial, institutional (CII),
and any other distinct
customer classes within the
water rate structure.
To receive a grade of 9,
Conditions between 8 and
10.
To receive a grade of 10,
Current, effective water rate
structure is in force and
applied reliably in billing
operations. The rate
structure and calculations of
composite rate ‐ which
includes residential,
commercial, industrial,
institutional (CII), and other
distinct customer classes ‐
are reviewed by a third party
knowledgeable in the M36
methodology at least once
every five years.
(WLCC 2014)
©2016 Water Research Foundation. ALL RIGHTS RESERVED

64
Though the utility calculated the Customer Retail Unit Cost in alignment with prescribed
methodology and incorporated only relevant costs, the rate structure expert that the utility hires
is not proficient in M36 methodology.
Therefore, the appropriate grade is 9, indicating conditions between 8 and 10.
©2016 Water Research Foundation. ALL RIGHTS RESERVED
65
Variable Production Cost
The audit input for Variable Production Cost is used to value Real Losses. Therefore, the auditor
may choose to value Real Losses at strict Variable Production Cost (the average cost of producing
one unit of water) or use a higher value that incorporates costs relevant to marginal production
(the production of the next unit of water), the most expensive source of water, avoided
expenditures, or other indirect expenses. (Alegre et al. 2000, AWWA 2009, WLCC 2014).
Data Validity Themes
The validity of the Variable Production Cost input depends on:
the technology used for and completeness of production cost tracking
the process used for cost estimation
the frequency and nature of production cost review
To grade the validity of the Variable Production Cost input, the validator will have to answer the
following questions.
⃝ How thoroughly are production costs tracked?
⃝ Are any relevant production costs not tracked?
⃝ What technology manages production cost tracking?
⃝ How was Variable Production Cost estimated?
⃝ How frequently are production costs audited? By whom?
Common Errors
It is important that the Variable Production Cost or an alternate Real Loss valuation exclude fixed
costs related to the current production of water. For example, the salaries of treatment plant
operators are not directly related to the volumes of water that they produce at the treatment
plant. Therefore, operator salaries should not be included in the Variable Production Cost. The
exception to this rule is when new fixed costs will be incurred in marginal supply development. If
reducing Real Losses results in deferred supply development (and the capital and other fixed
costs associated with development), then these costs can be incorporated in the valuation of
Real Losses.
©2016 Water Research Foundation. ALL RIGHTS RESERVED

66
Example Data Validity Grade Selection
To supply its system, a utility imports raw water and then treats the water itself. The imported
water cost is known, as it is the same for every unit. Additionally, the utility has record of its
chemical purchases during the audit period. However, the utility is unable to identify the portion
of total power costs that resulted from the production of water, in contrast to the costs that
maintained other operations (like administrative buildings). Asset depreciation relevant to the
volumetric production of water cannot be identified in current depreciation schedules.
Therefore, the utility chooses to include only imported water and chemical costs plus an
estimated 25% of power expenditures in its Variable Production Cost calculation. The utility
recognizes that this likely under‐values Real Losses.
Additionally, a CPA audits all utility financial statements every year, though the CPA is not versed
in water auditing and water loss control. Financial statements and utility‐wide expenditures are
tracked with a standard electronic accounting system.
To receive a grade of 2,
Reasonably maintained, but
incomplete, paper or
electronic accounting
provides data to roughly
estimate the basic
operations costs (pumping
power costs and treatment
costs) and calculate a unit
variable production cost.
To receive a grade of 3,
Conditions between 2 and 4.
To receive a grade of 4,
Electronic, industry‐standard
cost accounting system in
place. Electric power and
treatment costs are reliably
tracked and allow accurate
weighted calculation of unit
variable production costs
based on these two inputs
and water imported
purchase costs (if
applicable). All costs are
audited internally on a
periodic basis.
(WLCC 2014)
©2016 Water Research Foundation. ALL RIGHTS RESERVED
67
The utility incorporates import, treatment, and pumping costs in its assessment of Variable
Production Cost, though the allocation of pumping costs is rough and therefore does not meet
the criteria for a grade of 4. Because the utility hires a third‐party auditor annually, the utility
exceeds the criteria for a grade of 2.
Therefore, the appropriate grade is 3, indicating conditions between 2 and 4.
After examining inputs, the validator should work with the auditor to incorporate changes to data
validity grades and audit inputs in order to improve the accuracy of the audit before re‐examining
performance indicators.
©2016 Water Research Foundation. ALL RIGHTS RESERVED
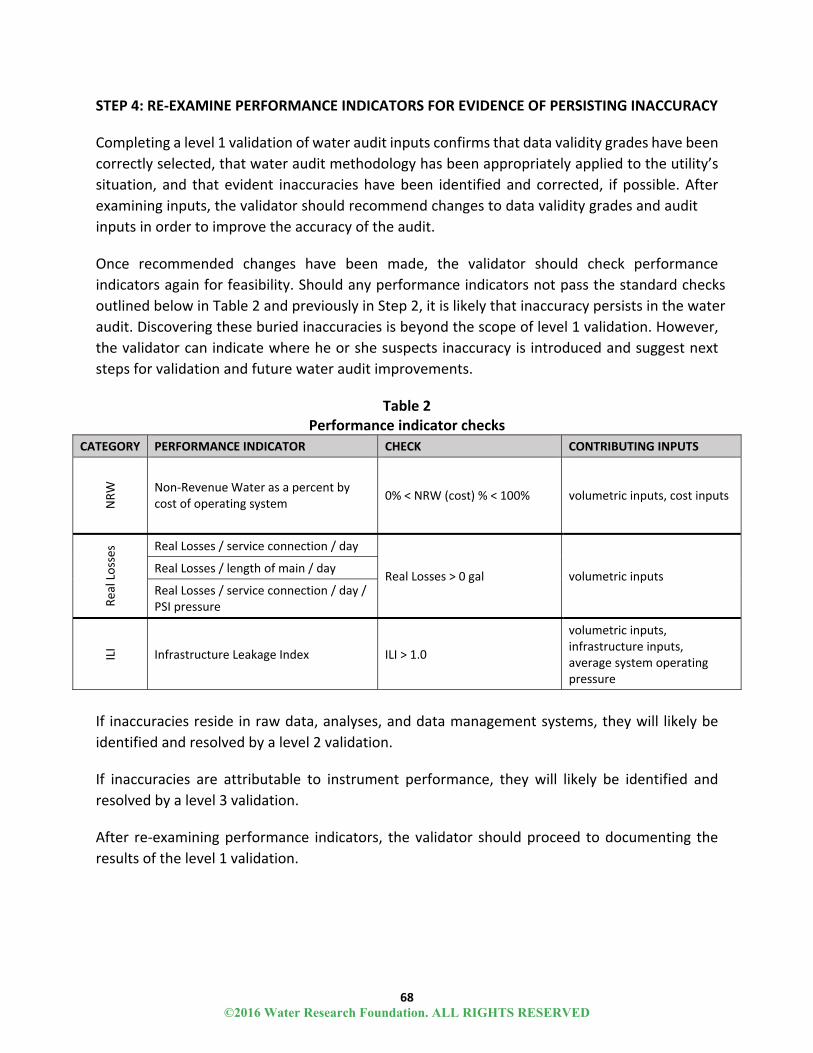
68
STEP 4: RE‐EXAMINE PERFORMANCE INDICATORS FOR EVIDENCE OF PERSISTING INACCURACY
Completing a level 1 validation of water audit inputs confirms that data validity grades have been
correctly selected, that water audit methodology has been appropriately applied to the utility’s
situation, and that evident inaccuracies have been identified and corrected, if possible. After
examining inputs, the validator should recommend changes to data validity grades and audit
inputs in order to improve the accuracy of the audit.
Once recommended changes have been made, the validator should check performance
indicators again for feasibility. Should any performance indicators not pass the standard checks
outlined below in Table 2 and previously in Step 2, it is likely that inaccuracy persists in the water
audit. Discovering these buried inaccuracies is beyond the scope of level 1 validation. However,
the validator can indicate where he or she suspects inaccuracy is introduced and suggest next
steps for validation and future water audit improvements.
Table 2 Performance indicator checks
CATEGORY PERFORMANCE INDICATOR CHECK CONTRIBUTING INPUTS
NRW
Non‐Revenue Water as a percent by cost of operating system
0% < NRW (cost) % < 100% volumetric inputs, cost inputs
Real Losses Real Losses / service connection / day
Real Losses > 0 gal volumetric inputs Real Losses / length of main / day
Real Losses / service connection / day / PSI pressure
ILI
Infrastructure Leakage Index ILI > 1.0
volumetric inputs, infrastructure inputs, average system operating pressure
If inaccuracies reside in raw data, analyses, and data management systems, they will likely be
identified and resolved by a level 2 validation.
If inaccuracies are attributable to instrument performance, they will likely be identified and
resolved by a level 3 validation.
After re‐examining performance indicators, the validator should proceed to documenting the
results of the level 1 validation.
©2016 Water Research Foundation. ALL RIGHTS RESERVED

69
STEP 5: DOCUMENT RESULTS
The validator should document the results of the level 1 validation in the “Comments” tab of the
AWWA Software or in a comparable format. At minimum, the validator should provide the
following information:
Validator name and contact information
Results of initial performance indicator review
Summary of level 1 interview, particularly related to water audit input derivation and
data validity grade selection
Recommended changes to data validity grades and rationale
Recommended changes to water audit inputs and rationale
Results of follow‐up performance indicator review
Overall impressions, including the consistency of performance indicators with system
conditions and water loss management practices
Recommendations for advanced validation and water audit improvements
While some uncertainty may persist in the water audit, the water audit is more reliable for having
been level 1 validated.
©2016 Water Research Foundation. ALL RIGHTS RESERVED

©2016 Water Research Foundation. ALL RIGHTS RESERVED
71
CHAPTER 6
WHAT ARE ADVANCED VALIDATION OPTIONS?
Level 1 validation is often only the initial step in pursuing accurate and consistent water audits.
After level 1 validation, gross inaccuracies, incorrect application of methodology, incomplete
data, and misleading data validity grades should no longer be issues. However, minimizing
obvious inaccuracies and misinterpretation of methodology does not guarantee accurate water
audits. Errors can still exist in the data, instrumentation, and analyses that support the water
audit.
Persisting inaccuracies may or may not produce unfeasible performance indicators, depending
on the nature of the inaccuracies and the balance of water audit data inputs.
For example, if a utility is approaching an ILI of 1.0 (its technical minimum volume of leakage),
any inaccuracies in water audit data may produce an ILI below 1.0. In contrast, comparable
inaccuracies for a utility with a higher true ILI may inaccurately lower the ILI, but not below a
threshold that arouses suspicion.
To further address the potential for uncertainty and inaccuracy in water audits, higher‐level
validation activities are encouraged. Level 2 validation investigates inaccuracy in raw water audit
data and data management systems. Level 3 validation investigates inaccuracy in
instrumentation and corroborates water audit results with other investigations of Real Loss.
Level 2 water audit validation and level 3 water audit validation need not be conducted
sequentially or concurrently. A utility may choose the higher‐level validation activities that most
directly address the probable sources of inaccuracy and uncertainty in that utility’s water audit.
Establishing water audit reliability tends to require effort over multiple years. It is recommended
that level 1 validation of a water audit be conducted every year. The more detailed activities of
level 2 and level 3 validation may occur over a period of years, with validation activities focusing
on one or two components of the water audit at a time.
WHAT ARE EXAMPLES OF LEVEL 2 WATER AUDIT VALIDATION?
As discussed in WLCC (2015), Sturm et al. (2015), and Sturm et al. (forthcoming), level 2 water
audit validation aims to:
Study the accuracy of data translation from primary measurement to water audit
input
Identify anomalies, gaps, and redundancies in raw data and correct inaccuracies,
where possible
Stratify and apply available customer meter test data to water audit calculations
©2016 Water Research Foundation. ALL RIGHTS RESERVED

72
Confirm the average operating pressure calculation
To meet these aims, potential level 2 validation activities include:
Investigation of SCADA data archival and retrieval fidelity
Analysis of raw billing and consumption data to confirm consistency, completeness,
and relevance
Pro‐rating of billing and consumption data to temporally aligned volumes of
production and consumption
Analysis of existing customer meter test results to incorporate statistical
considerations like demographic stratification, flow rate and consumption profiles,
and margin‐of‐error assessment
Detailed average system pressure calculation to weight infrastructure density and
geography of pressure measurements or model nodes
WHAT ARE EXAMPLES OF LEVEL 3 WATER AUDIT VALIDATION?
As discussed in WLCC (2015), Sturm et al. (2015), and Sturm et al. (forthcoming), level 3 water
audit validation aims to:
Measure supply meter accuracy
Confirm 4‐20 mA signal conversion accuracy from meter transmitter to SCADA archive
Improve the understanding of Apparent Losses with meter tests
Confirm the Real Loss volume through bottom‐up or field investigation
Field verify average system pressure
To meet these aims, potential level 3 validation activities include:
Volumetric accuracy testing of supply meters using a reference volume or
comparative meter
Calibration of supply meter electronics
4‐20mA signal tracking
Customer meter testing that randomly and representatively investigates small meters
and studies the most influential large meters
Component Analysis of Real Losses to determine the system’s Real Loss profile
Pilot leak detection to explore the prevalence and types of leaks
Minimum night flow analysis to establish zonal leakage budgets
Pressure logging that studies pressure dynamics throughout the system
©2016 Water Research Foundation. ALL RIGHTS RESERVED
73
WHAT SHOULD I DO AFTER VALIDATING MY WATER AUDIT?
The process of water loss control begins with a validated water audit, but more information and
analyses are necessary to direct resources to the most cost‐effective water loss interventions. A
water loss control program typically consists of seven steps as discussed in Alegre et al. (2000),
AWWA (2009), and others.
The first three steps evaluate water losses and the opportunities presented by water loss control.
The next three steps cost‐effectively intervene against water losses.
The last step supports the monitoring and tracking mechanisms necessary to institutionalize
water distribution efficiency.
1. Compile and thoroughly validate a water audit.
2. Perform a Component Analysis of Real Losses.
3. Evaluate the costs and benefits of intervention against component volumes of Real
and Apparent Losses.
4. Implement interventions to the extent cost‐effective.
5. Evaluate the efficacy of interventions.
6. Refine interventions against water loss.
7. Continue to monitor water losses through annual validated water audits and
Component Analyses of Real Losses while improving the accuracy and reliability of key
data sources.
Water audits and water loss control activities are most effective when they are ongoing and
incorporated into standard utility business practices.
©2016 Water Research Foundation. ALL RIGHTS RESERVED

©2016 Water Research Foundation. ALL RIGHTS RESERVED

75
APPENDIX A
LEVEL 1 VALIDATION CHECKLIST
STEP 1: RECEIVE AND REVIEW THE WATER AUDIT AND SUPPORTING DOCUMENTATION
At minimum, the validator should request and receive:
⃝ Completed AWWA Free Water Audit Software
⃝ Volume from Own Sources detailed by month and supply meter
⃝ Water Imported detailed by month
⃝ Water Exported detailed by month
⃝ Supply meter testing and/or calibration documentation (if supply meters are tested
and/or calibrated)
⃝ Volume of water sold detailed by month and rate code (e.g. charge status, water type,
or customer class)
Additional supporting documentation will improve the level 1 validation process
⃝ Derivations of Customer Meter Accuracy
⃝ Derivations of Average Operating Pressure,
⃝ Derivations of Customer Retail Unit Cost,
⃝ Derivations of Variable Production Cost.
⃝ Audits from previous years
STEP 2: EXAMINE PERFORMANCE INDICATORS FOR EVIDENCE OF INACCURACY
Prior to the level 1 validation interview, each performance indicator can be checked for feasibility
as described below to supply an initial assessment of the overall reliability of the water audit.
©2016 Water Research Foundation. ALL RIGHTS RESERVED

76
Table 1 Performance indicator checks
CATEGORY PERFORMANCE INDICATOR CHECK CONTRIBUTING INPUTS
NRW Non‐Revenue Water as a percent by
cost of operating system 0% < NRW (cost) % < 100% volumetric inputs, cost inputs
Real Losses
Real Losses / service connection / day
Real Losses > 0 gal volumetric inputs Real Losses / length of main / day
Real Losses / service connection / day / PSI pressure
ILI Infrastructure Leakage Index ILI > 1.0
volumetric inputs, infrastructure inputs,
average system operating pressure
STEP 3: VALIDATE AUDIT INPUTS, CONFIRM CORRECT APPLICATION OF METHODOLOGY, AND
CHANGE INPUTS AS NECESSARY
The AWWA Free Water Audit Software contains 20 data inputs. For each audit input, the validator
should ask the following broad questions:
How did the auditor arrive at the water audit input?
How did the auditor interpret general methodology and definitions to apply to the
specifics of the system?
How did the auditor select a data validity grade?
How does the audit input compare to previous years (if applicable)?
Volume from Own Sources
To grade the validity of the input the validator will have to answer the following questions.
⃝ How many distinct own‐source distribution inputs are there?
⃝ How many inputs are metered?
⃝ Are any of the meters in series?
⃝ Do the meters capture raw water or potable water?
©2016 Water Research Foundation. ALL RIGHTS RESERVED
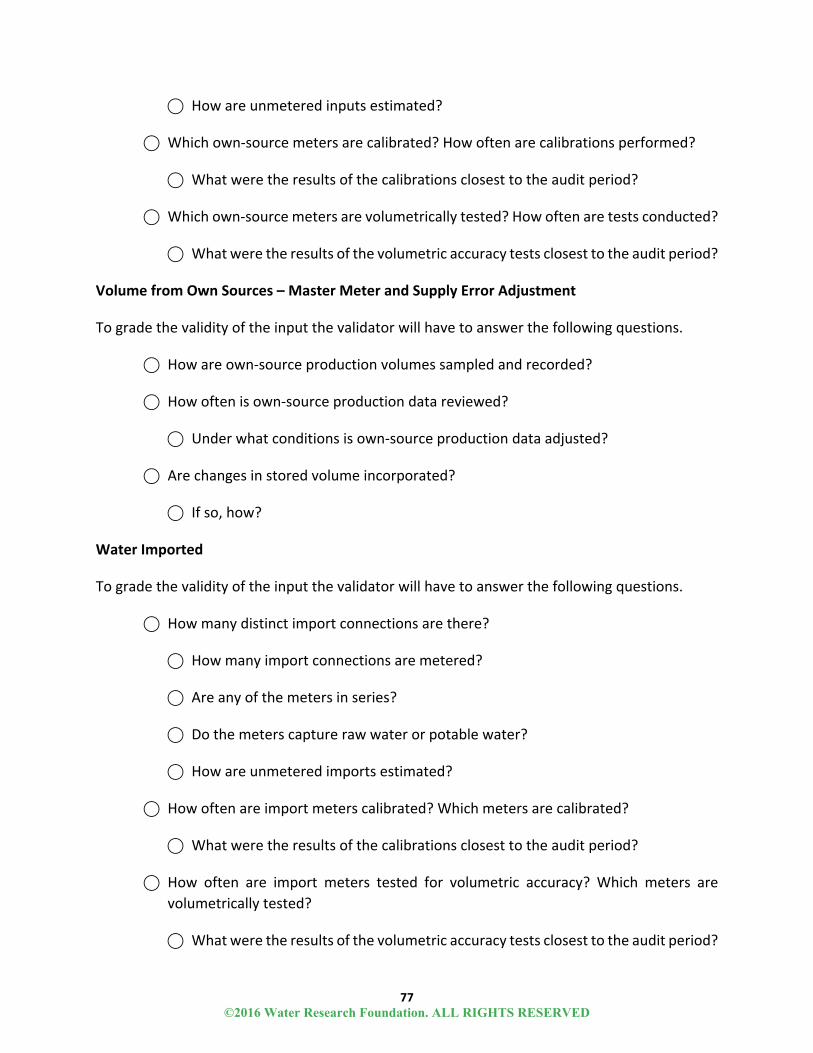
77
⃝ How are unmetered inputs estimated?
⃝ Which own‐source meters are calibrated? How often are calibrations performed?
⃝ What were the results of the calibrations closest to the audit period?
⃝ Which own‐source meters are volumetrically tested? How often are tests conducted?
⃝ What were the results of the volumetric accuracy tests closest to the audit period?
Volume from Own Sources – Master Meter and Supply Error Adjustment
To grade the validity of the input the validator will have to answer the following questions.
⃝ How are own‐source production volumes sampled and recorded?
⃝ How often is own‐source production data reviewed?
⃝ Under what conditions is own‐source production data adjusted?
⃝ Are changes in stored volume incorporated?
⃝ If so, how?
Water Imported
To grade the validity of the input the validator will have to answer the following questions.
⃝ How many distinct import connections are there?
⃝ How many import connections are metered?
⃝ Are any of the meters in series?
⃝ Do the meters capture raw water or potable water?
⃝ How are unmetered imports estimated?
⃝ How often are import meters calibrated? Which meters are calibrated?
⃝ What were the results of the calibrations closest to the audit period?
⃝ How often are import meters tested for volumetric accuracy? Which meters are
volumetrically tested?
⃝ What were the results of the volumetric accuracy tests closest to the audit period?
©2016 Water Research Foundation. ALL RIGHTS RESERVED
78
Volume Imported – Master Meter and Supply Error Adjustment
To grade the validity of the input the validator will have to answer the following questions.
⃝ How are Water Imported volumes recorded?
⃝ How often are Water Imported volumes captured?
⃝ How often is Water Imported data reviewed?
⃝ Under what conditions is Water Imported data adjusted?
⃝ What documentation is available to describe the interagency import‐export
agreement?
Water Exported
To grade the validity of the input the validator will have to answer the following questions.
⃝ How many distinct export connections are there?
⃝ How many export connections are metered?
⃝ Are any of the meters in series?
⃝ Do the meters capture raw water or potable water?
⃝ How are unmetered exports estimated?
⃝ How often are export meters calibrated? Which meters are calibrated?
⃝ What were the results of the calibrations closest to the audit period?
⃝ How often are export meters tested for volumetric accuracy? Which meters are
volumetrically tested?
⃝ What were the results of the volumetric accuracy tests closest to the audit period?
Volume Exported – Master Meter and Supply Error Adjustment
To grade the validity of the input the validator will have to answer the following questions.
⃝ How are Water Exported volumes recorded?
⃝ How often are Water Exported volumes captured?
©2016 Water Research Foundation. ALL RIGHTS RESERVED
79
⃝ How often is Water Exported data reviewed?
⃝ Under what conditions is Water Exported data adjusted?
⃝ What documentation is available to describe the interagency import‐export
agreement?
Billed Metered Authorized Consumption
To grade the validity of the input the validator will have to answer the following questions.
⃝ What portion of customers are metered?
⃝ How are customer meter reads collected?
⃝ What is the success rate of meter read collection?
⃝ When are customer meters replaced?
⃝ How many customer meters are tested annually? Why?
⃝ How are customer bill records maintained?
⃝ How often are customer bill records audited? By whom?
Billed Unmetered Authorized Consumption
To grade the validity of the input the validator will have to answer the following questions.
⃝ What are utility policies regarding which customers must be metered?
⃝ Are metering policies clear?
⃝ Are metering policies consistently implemented?
⃝ How is unmetered consumption estimated?
Unbilled Metered Authorized Consumption
To grade the validity of the input the validator will have to answer the following questions.
⃝ What are utility policies regarding which customers are metered but unbilled?
⃝ Are billing exemption policies clear?
⃝ Are billing exemption policies consistently implemented?
©2016 Water Research Foundation. ALL RIGHTS RESERVED

80
⃝ How often are unbilled meters read?
⃝ How is unbilled metered consumption estimated in the absence of a recent meter
read?
Unbilled Unmetered Authorized Consumption
To grade the validity of the input the validator will have to answer the following questions.
⃝ What uses are unmetered and unbilled?
⃝ Are utility policies on unmetered and unbilled use clear?
⃝ How are unmetered, unbilled uses documented?
⃝ How is consumption for each use estimated?
Unauthorized Consumption
To grade the validity of the input the validator will have to answer the following questions.
⃝ What instances of Unauthorized Consumption have been documented?
⃝ What information is captured in records of Unauthorized Consumption?
⃝ How are unmetered, unbilled uses documented?
⃝ How is consumption for each use estimated?
⃝ Are documented volumes of Unauthorized Consumption thorough enough to replace
the default estimate?
Customer Metering Inaccuracies
To grade the validity of the input the validator will have to answer the following questions.
⃝ How are customer meter records managed?
⃝ What is the make‐up of the customer meter population? Is it homogenous or varied?
⃝ How many meters are replaced annually?
⃝ How are meters selected for replacement?
⃝ How many meters are tested annually? Why?
©2016 Water Research Foundation. ALL RIGHTS RESERVED
81
⃝ Were test results used for Customer Metering Inaccuracies calculation? How?
Systematic Data Handling Errors
To grade the validity of the input the validator will have to answer the following questions.
⃝ What policies govern billing processes and account management?
⃝ How effectively are these policies implemented?
⃝ What technologies are used in read collection and billing processes?
⃝ How often are billing processes and billing data audited?
⃝ Who performs the auditing?
⃝ What checks and functions are built into billing data management to minimize
error?
⃝ How was the volume of Systematic Data Handling Errors estimated?
Length of Mains
To grade the validity of the input the validator will have to answer the following questions.
⃝ What is the utility policy for installing and documenting new infrastructure?
⃝ How effectively are these policies implemented?
⃝ How are pipe assets tracked?
⃝ How often are asset records validated with field data?
Number of Active and Inactive Service Connections
To grade the validity of the input the validator will have to answer the following questions.
⃝ What is the utility policy for permitting, installing and documenting new service
connections?
⃝ How effectively are these policies implemented?
⃝ How are service connections tracked?
⃝ How is service connection documentation field verified?
©2016 Water Research Foundation. ALL RIGHTS RESERVED
82
⃝ What margin of error does the auditor assign to the estimate of the Number of Active
and Inactive Service Connections?
Average Length of Customer Service Line
To grade the validity of the input the validator will have to answer the following questions.
⃝ Where does utility policy dictate that ownership transfer occurs?
⃝ Where does utility policy dictate that meters are installed?
⃝ How is meter installation and asset ownership information tracked?
⃝ How is recorded information field verified?
⃝ How is the average length of service connection pipe estimated?
Average Operating Pressure
To grade the validity of the input the validator will have to answer the following questions.
⃝ How does the utility manage system pressure?
⃝ Does the utility employ pressure zones?
⃝ How are pressure zones defined and separated?
⃝ Are pressure zones discrete?
⃝ How does pressure vary throughout the system?
⃝ How and where is pressure data collected?
⃝ How was average system pressure determined?
Total Annual Cost of Operating Water System
To grade the validity of the input the validator will have to answer the following questions.
⃝ How thoroughly are costs tracked?
⃝ Are any relevant costs not tracked?
⃝ What technology manages cost, budget, and other financial data?
⃝ How frequently are operating costs audited? By whom?
©2016 Water Research Foundation. ALL RIGHTS RESERVED
83
Customer Retail Unit Cost
To grade the validity of the input the validator will have to answer the following questions.
⃝ What is the utility’s rate structure?
⃝ When was the rate structure last studied or updated?
⃝ How consistently is the rate structure applied?
⃝ How was the Customer Retail Unit Cost determined?
⃝ Have all rate tiers and account classes been incorporated?
⃝ How frequently is the rate structure reviewed by a party knowledgeable in AWWA
water audit methodology?
Variable Production Cost
To grade the validity of the input the validator will have to answer the following questions.
⃝ How thoroughly are production costs tracked?
⃝ Are any relevant production costs not tracked?
⃝ What technology manages production cost tracking?
⃝ How was Variable Production Cost estimated?
⃝ How frequently are production costs audited? By whom?
©2016 Water Research Foundation. ALL RIGHTS RESERVED
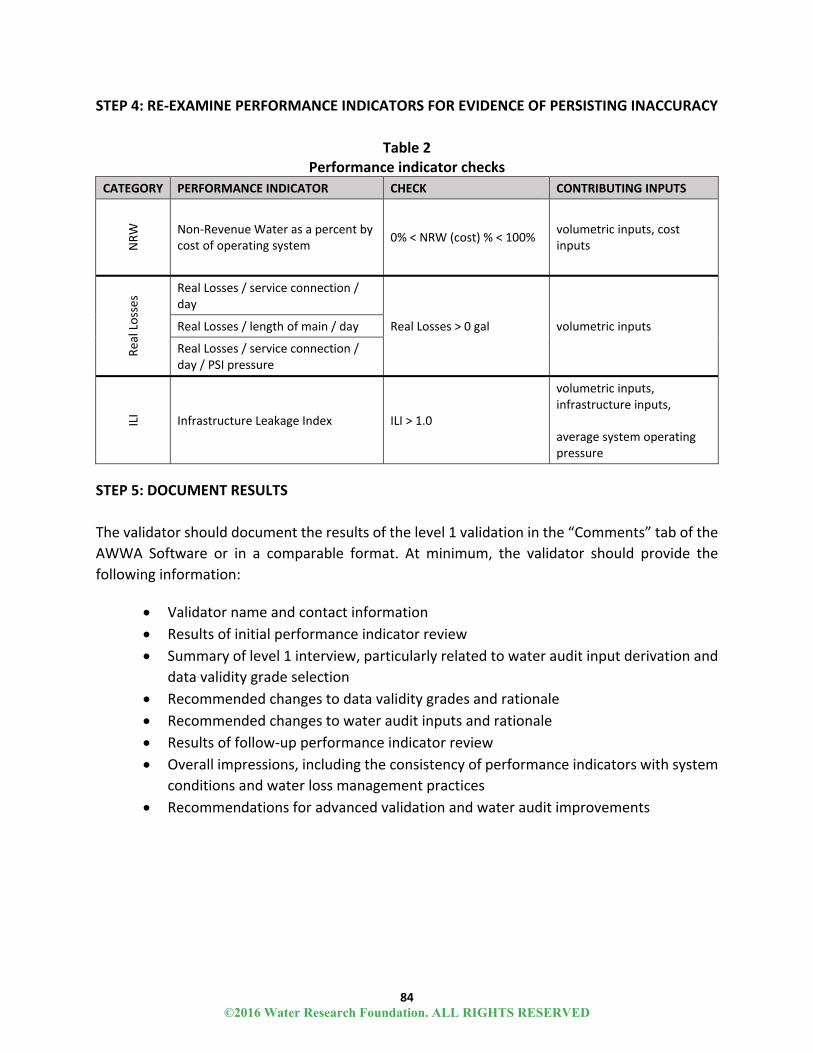
84
STEP 4: RE‐EXAMINE PERFORMANCE INDICATORS FOR EVIDENCE OF PERSISTING INACCURACY
Table 2 Performance indicator checks
CATEGORY PERFORMANCE INDICATOR CHECK CONTRIBUTING INPUTS
NRW
Non‐Revenue Water as a percent by cost of operating system
0% < NRW (cost) % < 100% volumetric inputs, cost inputs
Real Losses Real Losses / service connection /
day
Real Losses > 0 gal volumetric inputs Real Losses / length of main / day
Real Losses / service connection / day / PSI pressure
ILI
Infrastructure Leakage Index ILI > 1.0
volumetric inputs, infrastructure inputs,
average system operating pressure
STEP 5: DOCUMENT RESULTS
The validator should document the results of the level 1 validation in the “Comments” tab of the
AWWA Software or in a comparable format. At minimum, the validator should provide the
following information:
Validator name and contact information
Results of initial performance indicator review
Summary of level 1 interview, particularly related to water audit input derivation and
data validity grade selection
Recommended changes to data validity grades and rationale
Recommended changes to water audit inputs and rationale
Results of follow‐up performance indicator review
Overall impressions, including the consistency of performance indicators with system
conditions and water loss management practices
Recommendations for advanced validation and water audit improvements
©2016 Water Research Foundation. ALL RIGHTS RESERVED
85
REFERENCES AND RESOURCES
REFERENCES
Alegre, H., H. Hirner, J.M. Baptista, and R. Parena. 2000. Performance Indicators for Water
Supply Services – IWA Manual of Best Practice. London, UK: IWA Publishing.
AWWA (American Water Works Association). 2009. M36 Water Audits and Loss Control
Programs. Third Edition. Denver, Colo.: American Water Works Association.
Sturm, R., L. Andrews, K. Gasner, W. Jernigan, S. Cavanaugh, and G. Kunkel. Forthcoming.
“Utility Water Audit Validation: Principles and Programs.” Project #4639. Denver, Colo.:
Water Research Foundation.
Sturm, R., K. Gasner, and L. Andrews. 2015. Water Audits in the United States: A Review of
Water Losses and Data Validity. Project #4372b. Denver, Colo.: Water Research
Foundation.
WLCC (Water Loss Control Committee). 2014. AWWA Free Water Audit Software (version 5.0).
Microsoft Excel. Denver, CO: American Water Works Association.
WLCC (Water Loss Control Committee – Software Subcommittee). 2015. Validation Level
Summary. Unpublished working document. Denver, Colo: American Water Works
Association.
RESOURCES
Additional resources are available to anyone who wishes to learn more about water auditing and
water loss control. This manual builds upon decades of water loss control research and
establishment of best practices. A selection of definitive resources is listed below.
AWWA (American Water Works Association). 2016. M36 Water Audits and Loss Control
Programs. Fourth Edition. Denver, Colo.: American Water Works Association.
Sturm, R. K. Gasner, T. Wilson, S. Preston and M.A. Dickinson. 2014. Real Loss Component
Analysis: A Tool for Economic Water Loss Control. Project #4372. Denver, Colo.: Water
Research Foundation.
WLCC (Water Loss Control Committee). 2015. AWWA Water Audit Software Compiler (version
5.0). Microsoft Excel. Denver, CO: American Water Works Association.
©2016 Water Research Foundation. ALL RIGHTS RESERVED

©2016 Water Research Foundation. ALL RIGHTS RESERVED
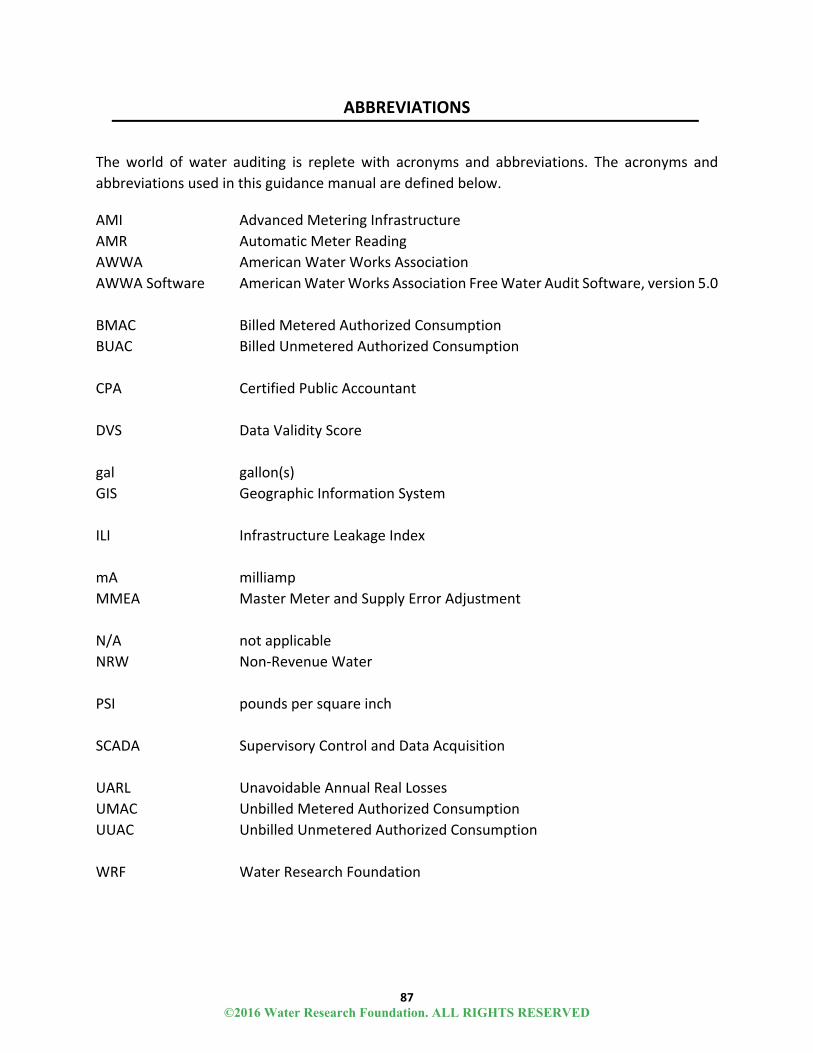
87
ABBREVIATIONS
The world of water auditing is replete with acronyms and abbreviations. The acronyms and
abbreviations used in this guidance manual are defined below.
AMI Advanced Metering Infrastructure
AMR Automatic Meter Reading
AWWA American Water Works Association
AWWA Software American Water Works Association Free Water Audit Software, version 5.0
BMAC Billed Metered Authorized Consumption
BUAC Billed Unmetered Authorized Consumption
CPA Certified Public Accountant
DVS Data Validity Score
gal gallon(s)
GIS Geographic Information System
ILI Infrastructure Leakage Index
mA milliamp
MMEA Master Meter and Supply Error Adjustment
N/A not applicable
NRW Non‐Revenue Water
PSI pounds per square inch
SCADA Supervisory Control and Data Acquisition
UARL Unavoidable Annual Real Losses
UMAC Unbilled Metered Authorized Consumption
UUAC Unbilled Unmetered Authorized Consumption
WRF Water Research Foundation
©2016 Water Research Foundation. ALL RIGHTS RESERVED

©2016 Water Research Foundation. ALL RIGHTS RESERVED

89
NOTES
©2016 Water Research Foundation. ALL RIGHTS RESERVED

90
©2016 Water Research Foundation. ALL RIGHTS RESERVED