Embed Size (px)
Citation preview

Letters to the shareholders: A content analysis comparison of letters
written by CEOs in the U.S. and Japan
Reggy Hooghiemstra
University of Groningen
Faculty of Economics and Business
Department of Accounting and Auditing, Room WSN 813
PO Box 800
9700 AV, Groningen, The Netherlands
Phone: +31 50 363 3772
Fax: +31 50 363 7174
Email: [email protected]
Reggy Hooghiemstra is an Assistant Professor at the University of Groningen, Faculty of
Economics and Business, Department of Accounting and Auditing. Many thanks to
Walter Aerts, Ole-Kristian Hope, Liz Kummerow, Brendan O’Dwyer, Richard Taffler,
and Leo van der Tas for their helpful comments on earlier drafts. Nevertheless, the usual
caveat applies.

1
Letters to the shareholders: A content analysis comparison of letters written
by CEOs in the U.S. and Japan
Abstract
Previous studies suggest that letters to the shareholders are widely used in investors‟ decision-
making processes. Letters to the shareholders, however, are unaudited and usually not subject to
regulation. Hence, CEOs may use them strategically to manage the impressions shareholders
have of the company. This paper focuses on letters to the shareholders from Japanese and U.S.
companies. The research examines whether U.S. and Japanese CEOs explain the causes of good
and bad news in different ways. The findings point to a number of interesting differences
between the U.S. and Japanese letters to the shareholders. The results indicate that U.S. CEOs in
particular emphasize good news. However, Japanese and U.S. Letters are statistically
indistinguishable with respect to extent to which CEOs claim responsibility for good news.
Furthermore, while CEOs in general ascribe bad news to causes beyond their control, this
tendency is particularly strong in Japanese Letters. The implications of the study for both
investors and regulators are discussed.
Key words
Letter to the shareholders, impression management, comparative reporting, United States, Japan

2
1. Introduction and motivation
The objective of this paper is to examine whether U.S. and Japanese CEOs address company
performance differently in their letters to the shareholders.1 The letter to the shareholders is
usually not subject to regulation and the auditor‟s role remains limited to verifying that the
information in it is consistent with the numbers presented in the financial statements (Clatworthy
and Jones, 2003; Nobes and Parker, 1998). Hence, it provides management with an excellent
opportunity to manage the impressions outsiders have of the company without having to concern
too much for regulatory repercussions. Prior research indicates that American CEOs utilize this
opportunity by using a self-serving attributional bias (e.g. Bettman and Weitz, 1983; Staw et al.,
1983; Lee et al., 2004). This implies that they are inclined to explain good news (e.g. an increase
in profits) in terms of internal causes such as the corporate strategy and investment decisions.
However, it also means that they are likely to ascribe bad news to adverse general economic
conditions, the weather or other causes beyond management‟s control. More recent studies
demonstrate that also European CEOs address company performance in a self-serving fashion by
ascribing good news to themselves and by blaming bad outcomes on the external environment
(Aerts, 1994, 2005; Clatworthy and Jones, 2003).
The importance of the letter to the shareholders is well documented. Research indicates
that investors use the Letter in their decision-making processes (e.g. Bartlett and Chandler,
1997). For example, prior studies show that the Letter contains information that is predictive of
both a company‟s future financial performance (e.g. Beynon et al., 2004) and the chance of
corporate failure (e.g. Smith and Taffler, 2000). Furthermore, Breton and Taffler (2001, p. 99)
find that analysts rely on „non-financial, soft, qualitative and impressive information in making
stock recommendations‟. Several other studies suggest that the Letter can influence private
3
investors‟ decisions (e.g. Kaplan et al., 1990; Baird and Zelin, 2000). Baird and Zelin (2000), for
example, find that the order in which positive and negative information is presented in the Letter
significantly influenced investors‟ decisions.
Additionally, it seems that CEOs‟ explanations for company performance affect share
prices (Baginski et al., 2004; Lee et al., 2004; Staw et al., 1983) and analysts‟ forecasts (Barton
and Mercer, 2005). For instance, Baginski et al. (2004) analyze managements‟ explanations for
earnings forecasts in the U.S. and observe that these explanations contain a self-serving
attributional bias. They also show that there is a significantly negative relation between the three-
day cumulative abnormal return and the presence of an attribution for earnings forecasts. Barton
and Mercer (2005) conduct an experiment with financial analysts to investigate their reactions to
external explanations for poor financial performance. They demonstrate that implausible
explanations backfire and lead analysts to provide lower earnings forecasts and assess a higher
cost of capital than if the explanation had not been provided. Plausible explanations, however,
did not improve management‟s reputation with analysts, suggesting that „analysts expect
managers to provide plausible performance explanations‟ (Barton and Mercer, 2005, p. 512).
In the present study we examine the fashion in which firm performance is addressed in
letters to the shareholders from the world‟s two largest capital markets: the United States and
Japan. We focus on these two countries not only because they are considered important for the
development of accounting (Nobes and Parker, 1998), but also because the cultural values
predominating in these countries are dissimilar (e.g. Hofstede, 2001). Prior studies have
demonstrated that as a result of these cultural differences management practices in Japan are
considerably different from U.S. practices (e.g. Bruton and Lau, 2008; Hofstede, 2001; Kim and

4
Nam, 1998). Furthermore, there is evidence that culture affects financial reporting (see
Chanchani and MacGregor (1999) and Doupnik and Tsakumis (2004) for overviews).
An additional research question of the study is to examine whether the creation of the
IASB in 2001 and the subsequent processes toward convergence with IFRS that have taken place
in the U.S. and Japan affected the Letters written by the CEOs in these countries. Although IFRS
do not cover Letters, it is conceivable that the convergence processes influenced the use of self-
serving attributions in the letters to the shareholders. Furthermore, although the Sarbanes-Oxley
Act (SOX) of 2002 does not address the Letter in particular, it cannot be ruled out that it might
have had an effect on U.S. CEOs letters in the post-SOX period.
The present paper contributes to the literature in various ways. This study is the first to
look at Letters from Japanese companies. As such, it not only extends prior research into the self-
serving attributional bias in letters to the shareholders, but also research examining the amount of
information disclosed in Japanese annual reports (e.g. Cooke, 1993; Singleton and Globerman,
2002). Furthermore, this study is one of the few that examines letters to the shareholders from a
comparative perspective. Hence, it complements previous comparative studies that look at
measurement and disclosure practices. In this study, we specifically look at the use of impression
management techniques in the conveyance of information through the letter to the shareholders.
According to Merkl-Davies and Brennan (2007) the use of impression management techniques
may undermine the quality of financial reporting. By comparing Letters from Japanese and U.S.
companies, this study shows how widespread is the use of impression management in letters to
the shareholders from these two countries. Being aware of transnational differences as to the
pervasiveness of the self-serving attributional bias in letters to the shareholders is important in
view of the Letter‟s impact on analysts‟ reactions and investors‟ decisions and because the

5
attributional bias may distort cross-national investment decisions (Beattie and Jones, 2000;
Merkl-Davies and Brennan, 2007). Otherwise stated, it is possible that a choice to invest in an
U.S. company and a comparable Japanese firm not only reflects the investor‟s expectations about
future firm performance based on past performance, but is also influenced by the extent to which
a self-serving attributional bias is present in the Letters.
Another contribution of the study is that, apart from examining the self-serving
attributional bias, we consider positive and negative outcomes that remain unexplained. We
believe that, in the context of letters to the shareholders, statements that simply present outcomes
without any explanation are also important. Prior studies only considered statements in which
effects were ascribed to causes (e.g. Aerts, 1994, 2005; Lee et al., 2004). By including these
unexplained effects we provide a more complete picture of impression management through the
Letter and, as such, enrich the accounting literature on this subject.
A final contribution of the present study is that we examine Letters from both the period
before as well as after the creation of the IASB in 2001. Prior studies have examined, among
others, the extent to which the disclosure requirements of the IASB are voluntarily complied
with (Street and Bryant, 2000), the effects of international accounting standards on earnings
management (Van Tendeloo and Vanstraelen, 2005), and the impact of auditor choice on IFRS
compliance (Hodgdon et al., 2008). To the best of our knowledge, this is the first study that
examines the possible impact of international accounting standards on the relatively unregulated
letters to the shareholders.
The remainder of the paper is organized as follows. Section 2 provides a review of the
literature and develops the hypotheses of the study. Section 3 describes the research design.

6
Sections 4 and 5, respectively, present and discuss the empirical results. Section 6 concludes the
paper.
2. Literature review and hypotheses
2.1. Impression management and explaining company performance
Impression management refers to the process by which individuals attempt to influence the
impressions others form of them (Leary, 1996; Merkl-Davies and Brennan, 2007). The primary
aim of impression management is to be viewed by others as one desire and, generally speaking,
as favorably as possible. Although it is not clear „whether impression management is conscious
or unconscious‟ (Clatworthy and Jones, 2006, p. 506), it seems that most studies implicitly
assume conscious behavior (Merkl-Davies and Brennan, 2007). Obviously, in the case of annual
reports an important motive for CEOs attempting to influence users‟ perceptions of company
performance may be found in their remuneration, which is often tied to the financial performance
of the company (Clatworthy and Jones, 2003). Other possible motives to engage in impression
management include preventing a CEO‟s dismissal and avoiding a takeover.
Although the ideas as to impression management originate in social psychology,
increasingly they are being used to account for organizational behavior (e.g. Aerts, 2005; Lee et
al., 2004). For example, there is ample evidence demonstrating that impression management
occurs in annual reports (see Merkl-Davies and Brennan (2007) for an overview). Apart from
financial graphs (e.g. Beattie and Jones, 2000; Godfrey et al., 2003) and photographs (e.g.
Preston et al., 1996), accounting narratives (e.g. Aerts, 1994, 2005; Courtis, 1995) are also part
of the impression management repertoire available to corporate management. In both the
accounting and organizational literature explaining company performance in a biased fashion is
7
seen as an explicit form of impression management (e.g. Aerts, 1994, 2005; Leary, 1996; Merkl-
Davies and Brennan, 2007).
Most research on the self-serving attributional bias in letters to the shareholders focuses on
the U.S. and dates from the 1980s (e.g. Bettman and Weitz, 1983; Staw et al., 1983). The general
picture arising from these studies is that while positive outcomes are ascribed to internal causes,
negative outcomes (i.e. a reported loss or decrease in sales) are blamed on external causes. A
more recent study by Lee et al. (2004) yields similar results.
European research in this area is relatively scarce and limited to studies of British and
Belgian companies. Clatworthy and Jones (2003) study whether 50 well performing and 50
poorly performing U.K. firms differ in the way their CEOs communicate good and bad news.
Similar to previous U.S. studies, they find that, irrespective of firm performance, U.K. managers
exhibit a self-serving attributional bias. Their findings also indicate that the poorly performing
firms pay attention almost equally to good and bad news. Aerts (1994, 2005) studies Belgian
Letters and also finds that successes are ascribed to internal causes. However, in contrast to their
American and British colleagues, Belgian CEOs use external and internal factors almost equally
to explain negative outcomes.
2.2. U.S.-Japan differences in the self-serving attributional bias
In the last two decades an increasing number of social psychologists have questioned the
universality of the self-serving attributional bias because most of the evidence is from studies
conducted in the U.S. (e.g. Heine et al., 1999; Kobayashi and Brown, 2003; Takata, 2003). These
researchers believe that the self-serving attributional bias is either muted, absent, or reversed in
Japan. The main reason for this belief lies in a fundamental difference in the view of the self held

8
by people from the U.S. and Japan; a difference related to Hofstede‟s (2001) Individualism vs.
Collectivism dimension. More specifically, whereas the independent view prevails in
individualistic countries such as the United States, the interdependent view is dominant in
collectivistic nations such as Japan (e.g. Fiske et al., 1998; Markus and Kitayama, 1991).
Markus and Kitayama (1991) posit that the independent view motivates people to see
themselves as autonomous, independent persons. Fiske et al. elaborate on this and indicate that
the person „is oriented primarily toward independent success and achievement‟ (1998, p. 920). In
contrast, the interdependent view emphasizes the person „not as separate from the social context
but as more connected and less differentiated from others‟ (Markus and Kitayma, 1991, p. 227).
In a similar vein, Kobayashi and Brown postulate that people in Japan „think about themselves in
ways that emphasize their connectedness with others rather than their uniqueness or superiority‟
(2003, p. 568). Such differences in views of the self have implications for the manner in which
self-esteem is protected or stimulated and, ultimately, for the way people explain outcomes of
their behavior.
Generally speaking, people in the U.S. need to view themselves positively (e.g. Heine and
Hamamura, 2007; Heine et al., 1999). In order to satisfy this need they are inclined to self-
enhance implying that they show a tendency to exaggerate positive aspects about the self
(Kitayama et al., 1997). This tendency to self-enhance leads to self-evaluations that are „fraught
with inaccurate and distorted perceptions‟ (Heine et al., 1999, p. 779). Prime among these is the
tendency to focus on and claim responsibility for successes (Mezulis et al., 2004). In addition, in
case an American is confronted with negative information about the self his self-esteem will be
threatened. Consequently, it is likely that he will engage in a variety of acts designed to protect

9
self-esteem, such as denying responsibility for failures and seeking justification for his decisions
(Heine, 2003).
The need to view oneself positively is, however, absent in Japan (e.g. Heine et al., 1999;
Kitayama et al., 1997). Instead, people from Japan have a propensity to criticize themselves
implying that they dwell on the negative aspects of the self (Takata, 2003). Kitayama et al.
(1997, p. 1246) argue that this sensitivity for negative self-relevant information „serves to affirm
one‟s belongingness to the [group]‟. Furthermore, stressing and claiming one‟s successes would
be counterproductive in Japan as it would weaken the solidarity of the group (Heine et al., 1999;
Heine, 2003). Such behavior does not correspond to modesty either, a virtue preferred by the
Japanese (e.g. Heine et al., 2001). Showing modesty serves to maintain harmony within the
group as by playing down one‟s performance, no one can be threatened or offended. Obviously,
blaming others for a failure would not contribute to maintaining harmony within the group (Fiske
et al., 1998). Harmony is preserved best if one assumes personal responsibility for a failure. In
sum, it is argued that the tendency to ascribe successes to external causes and failures to internal
causes serves to maintain harmony within the group, enhances feelings of „belongingness‟, and,
thus, fits the interdependent view of the self (Heine et al., 1999, 2001).
Mezulis et al. (2004) find evidence in support of the idea that differences in views of the
self and self-esteem lead to differences in the magnitude of the self-serving attributional bias.
They conduct a meta-analysis of 266 studies that examined self-serving attributional biases in
various countries and settings (in the period 1967 to 2001). They conclude that the magnitude of
the self-serving attributional bias was large in U.S. samples and significantly smaller, if not
absent, in Japanese studies.

10
Most social-psychological studies indicating a U.S.-Japan difference in the self-serving
attributional bias have relied on undergraduate students in psychology. However, as self-
enhancement and self-criticism are constantly promoted during the respective educations of U.S.
and Japanese people, it can be argued that these traits are deeply rooted in both societies (Heine
et al., 1999, 2001; Markus and Kitayama, 1991). For instance, Heine et al. (2001, p. 600)
comment that contemporary practices such as „corporations basing promotions and salaries on
individuals‟ achievements, [and] schools emphasizing the building of self-esteem‟ reflect the
pursuit of self-enhancement in the U.S. Similarly, the „seniority-based systems of promotion and
salary, educational focus on group learning, [and] child-rearing styles that emphasize self-
discipline and cooperation with others‟ (Heine et al., 2001, p. 600) are a reflection of the
Japanese preference for self-criticism. Therefore, we expect CEOs to exhibit similar behaviors as
well. Indeed, there is evidence demonstrating that the preferences and values prevailing within a
society affect corporate strategy, communication, and leadership styles (e.g. Bruton and Lau,
2008; House et al., 1997).
2.3. Hypotheses development
To recapitulate: prior studies show that culture affects financial disclosures (e.g. Doupnik and
Tsakumis, 2004), that people from the U.S. and Japan have dissimilar views of the self (Markus
and Kitayama, 1991) and that those dissimilarities lead to a pervasive difference as to the extent
people from the two countries exhibit a self-serving attributional bias (Mezulis et al., 2004).
Specifically, people from the U.S. generally prefer to see themselves as independent. They are
inclined to emphasize and claim good news but downplay and avoid responsibility for bad news
(Heine et al., 1999, 2001). The Japanese, on the other hand, value modesty and the maintenance
11
of harmony within the group (reflecting the interdependent view of the self). In their case self-
esteem is achieved by focusing on one‟s weaknesses and by looking for ways to improve oneself.
This has an important consequence: not stressing or claiming successes nor blaming others for
failures comprises behaviors in line with the interdependent view of the self. Meta-analyses have
confirmed that self-enhancement (Heine and Hamamura, 2007) and the self-serving attributional
bias (Mezulis et al., 2004) are less prevalent in Japan than in the U.S.
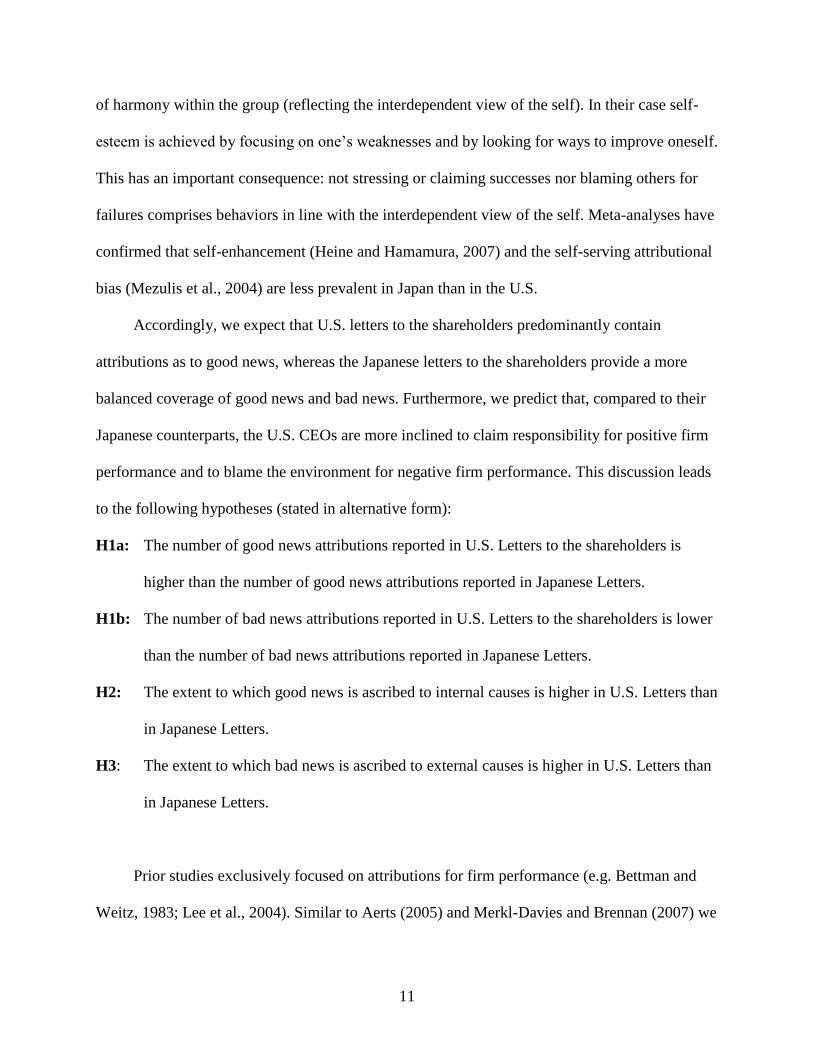
Accordingly, we expect that U.S. letters to the shareholders predominantly contain
attributions as to good news, whereas the Japanese letters to the shareholders provide a more
balanced coverage of good news and bad news. Furthermore, we predict that, compared to their
Japanese counterparts, the U.S. CEOs are more inclined to claim responsibility for positive firm
performance and to blame the environment for negative firm performance. This discussion leads
to the following hypotheses (stated in alternative form):
H1a: The number of good news attributions reported in U.S. Letters to the shareholders is
higher than the number of good news attributions reported in Japanese Letters.
H1b: The number of bad news attributions reported in U.S. Letters to the shareholders is lower
than the number of bad news attributions reported in Japanese Letters.
H2: The extent to which good news is ascribed to internal causes is higher in U.S. Letters than
in Japanese Letters.
H3: The extent to which bad news is ascribed to external causes is higher in U.S. Letters than
in Japanese Letters.
Prior studies exclusively focused on attributions for firm performance (e.g. Bettman and
Weitz, 1983; Lee et al., 2004). Similar to Aerts (2005) and Merkl-Davies and Brennan (2007) we
12
contend that attributions for firm performance only partially reflect the impression management
repertoire CEOs can utilize to address firm performance in the letters to the shareholders. One
possibility, which so far has remained unexamined, is that a CEO simply mentions an outcome
without providing any explanation for it. These comprise the so-called unexplained effects. To
fully capture differences in reporting patterns between U.S. and Japanese CEOs, we believe it is
important to simultaneously consider explained and unexplained effects. Below we motivate why
CEOs may employ unexplained effects to manage impressions through the Letter.
First, it is not inconceivable that in case a CEO has to account for declining firm
performance he may be trying to downplay this bad news by presenting positive unexplained
effects elsewhere in the Letter. Indeed, prior research shows that managers confronted with
declining performance attempt to place a positive spin on the results by making more salient
good news (Aerts, 2005; Bettman and Weitz, 1983; Clatworthy and Jones, 2003; Lee et al.,
2004). Second, because of the self-promoter‟s paradox (Jones and Pittman, 1982), overly
claiming responsibility for good news is not necessarily effective in case the performance is
already good. The self-promoter‟s paradox implies that the more excessively a person engages in
self-promotion (including claiming responsibility for good news), the more likely an audience
will discount part of the information as it presumes that individuals tend to exaggerate their
achievements and capabilities (Jones and Pittman, 1982; Leary, 1996). As the self-promoter‟s
paradox is likely to arise in a financial reporting context as well (Aerts, 2005), it probably pays
off not to explain every instance of good news in a letter to the shareholder and, rather, to let the
results speak for themselves. Hence, we believe it is important to investigate the total amount of
good and bad news statements -- irrespective of whether effects are being explained or not -- to
assert that U.S. CEOs stress the positive, while their Japanese colleagues show a more balanced

13
reporting pattern. Specifically, and in line with our argumentation as to hypothesis 1, we
hypothesize that (in alternative form):
H4: The number of good news statements (both explained and unexplained) reported in U.S.
Letters is higher than the number of good news statements reported in Japanese Letters.
H5: The number of bad news statements (both explained and unexplained) reported in U.S.
Letters is lower than the number of bad news statements reported in Japanese Letters.
3. Research design
3.1. Sample description
In this study we concentrate on companies from Japan and the U.S. We choose these countries
not only because they belong to the world‟s largest economies and are considered important for
the development of accounting (Nobes and Parker, 1998), but also because the countries
represent cultures with significant differences on the Individualism vs. Collectivism dimension
(Hofstede, 2001). This dimension is important for explaining cultural differences in financial
reporting (e.g. Chanchani and MacGregor, 1999; Doupnik and Tsakumis, 2004) and helps to
account for differences in the pervasiveness of the self-serving attributional bias in the U.S. and
Japan (e.g. Mezulis et al., 2004).
We sampled 50 American and 50 Japanese non-financial companies.2
The sampling
procedure started by randomly selecting 25 Japanese firms from the Fortune Global 500 list as
per 1998 (based on fiscal 1997 sales figures). These 25 firms were complemented by another 25
Japanese firms that were randomly selected from the Worldscope database. Subsequently, the 50
Japanese firms were matched with 50 U.S. firms based on classification according to primary
SIC code, business description and firm size (in terms of dollar revenue as of fiscal year 1997).
14
The final sample span companies from several industries including manufacturing, food,
retail, chemicals, construction, steel, automotive, and electronics. A t-test reveals that the average
size in terms of total sales (based on 1997 figures) of the American and Japanese companies are
not significantly different (t = 0.51; not significant).3
We also ensured that the sample comprised
Japanese and U.S. companies directed by Japanese and American citizens, respectively.4
Therefore, a company such as 7-Eleven (in the United States) was not included in the sample as
it had a Japanese CEO during part of the period surveyed. We exclude years in which a company
experienced a CEO change. The main reason for excluding these years is that Godfrey et al.
(2003) demonstrated that CEO changes affect both earnings management and impression
management.
We evaluate the representativeness of our sample by comparing key financial measures of
our sampled companies to all other companies from the U.S. and Japan included in Compustat
(for each country separately). For each fiscal year we compare the two subsets (again, separately
for the U.S. and for Japan) on: total assets, total sales, return on assets, net sales margins, and
earnings per share and calculate t-statistics. The results of the t-tests indicate that while both the
U.S. as well as the Japanese firms in our data set are, on average, larger than the other Compustat
firms, they are not statistically significant different in terms of return on assets, sales margin, or
earnings per share. That is, the U.S. and Japanese firms included in our sample are significantly
larger than the other firms listed in the U.S. or Japan. However, relative firm performance is
statistically indistinguishable between the sampled firms and the other Compustat firms.
For each of these 100 companies we initially selected two annual reports from 1994 to
2000: one from a good year (i.e. a year in which firm performance improved) and another from a
bad year (i.e. a year in which the company suffered from a deterioration in firm performance). In

15
order to designate a year as either good or bad, we have compiled a database containing
information (as reported in the companies‟ reporting currencies) on net sales margin and return
on assets (ROA) for each of the fiscal years included in the sampled period. For each fiscal year
we have computed the relative change in firm‟s ROA and net sales margin from one year to the
next. For example, the relative change in return on assets for 1999 has been determined by
comparing 1999 ROA figures with 1998 ROA figures. A year is designated „good‟ if the relative
change of both variables is in the positive direction. Similarly, a year is considered „bad‟ if the
relative change of both variables is negative. To be included in the sample, it is not necessary
that the annual reports come from consecutive years. Rather, the procedure allows for the
possibility that the annual reports related to fiscal years that are separated by several years. The
main reason for including an annual report from both a good year as well as a bad year (in terms
of firm performance) is that prior research among British and U.S. companies showed that,
irrespective of firm performance, CEOs attempt to place a positive spin on the events by
focusing on good news (Staw et al., 1983; Clatworthy and Jones, 2003). However in view of the
cultural differences between U.S. and Japan (as addressed in section 2.2) it is an open empirical
question whether similar results are obtained in the Japanese context.
We replicate the study covering the period 1994-2000 to provide an answer to our second
research question, i.e. whether there has been a change in the pervasiveness of the self-serving
attributional bias after the creation of the IASB and the subsequent convergence projects in the
U.S. and Japan. Specifically we include two annual reports from the period 2001-2007; again
one corresponded to a good year and another to a bad year.5
We use these 400 reports to obtain the letter to the shareholders. On average the Letters
were three pages long, ranging from one to ten pages. We find no statistically significant
16
difference (on the basis of t-tests) in the length of the Letters between the two countries, periods
(i.e. between 1994 to 2000 or 2001 to 2007), or between good or bad years.
3.2. Content analysis
Similar to prior studies (e.g. Bettman and Weitz, 1983; Aerts, 1994, 2005), we use content
analysis and examine causal statements. A causal statement is defined as one or more coherent
sentences or phrases (i.e. parts of a sentence) in which an outcome (e.g. increasing profits or
declining sales) is connected to a cause or reason. Frequently, a causal statement can be
recognized explicitly because connective words or phrases such as „contributed to‟, „can be
ascribed to‟, „because‟, „despite‟ are used. However, a sentence or phrase is also considered a
causal statement, even if no connective words are explicitly present, if the causal relationship can
implicitly be derived from the text. In either case, to be considered a causal statement, a cause-
effect relationship has to be clearly present. Furthermore, outcome and cause have to appear in
proximity -- that is, within one or two sentences or within the same paragraph. Whenever several
causes are provided to explain one organizational outcome each of those combinations is treated
as a separate causal statement.
Apart from causal statements (i.e. explained effects), in which organizational (financial)
outcomes are linked to one or more causes, we also consider unexplained organizational
(financial) outcomes. These are similar to causal statements, except that no cause or reason is
provided for the outcome. Examples of such unexplained organizational outcomes include: „This
year the company was able to report record sales‟ and „Profits for 2000 reached an all-time high.‟
A coding manual was prepared to document coding instructions and coding worksheets.
Furthermore, coders have been given instruction on the key concepts and procedures and went

17
through a formal practice round on five Letters that were not part of the final sample. The actual
coding involved two stages. In the first stage coders independently read the Letters to identify
both causal statements as well as unexplained outcomes. Before advancing to the second stage,
the coders discussed the results of this stage in order to reach agreement on the statements to be
coded. In the second stage, the coders independently coded the causal statements and
unexplained outcomes along a number of dimensions (see below). In cases of disagreement the
coders discussed the statements and had to come to an agreement. Only in rare occasions the
coders failed to coming to an agreement. In these cases, an independent third coder made the
final decision.
The statements were independently coded by two pairs of coders. One pair coded all
statements from Letters drawn from the 1994-2000 period. The other pair of coders focused on
coding the Letters from the 2001-2007 period. The coding of causal statements involved four
dimensions, for which we designed exhaustive and mutually exclusive categories. The
dimensions were:
a. Type of effect indicating the kind of financial outcome addressed: profits/earnings,
revenues/sales, costs, market share, or shareholder value/earnings per share. Coders could
also use the categories general/other and „more than one of those mentioned above‟.
b. Positive versus negative effect indicating whether the outcome that is explained represents
good news (i.e. improving firm performance such as increasing sales or a record profit) or
bad news (i.e. declining firm performance such as a loss or a sales decline) from the CEO‟s
point of view.6
c. Locus of causality measuring whether a cause is internal (e.g. due to corporate strategy,
managers‟ decisions or other causes under management‟s control) or whether a cause is

18
external and beyond management‟s control (e.g. general economic conditions, inflation,
interest rates or natural disasters).
d. Direction of cause-effect relationship revealing whether cause and effect have the same
sign (e.g. increase in profits due to a well-established corporate strategy) or have opposite
signs (e.g. despite the Asian Crisis we were able to increase our sales).7
The unexplained effects were coded only on the dimensions: Type of effect and Positive versus
negative effect.
The first dimension, type of effect, is included mainly for descriptive and exploratory
purposes. Furthermore, we expect to see some variation in coverage of the types in U.S. and
Japanese Letters. Specifically, the literature on corporate governance emphasizes that in the U.S.
managers tend to focus on achieving value for their shareholders that may lead to a short-term
time horizon (e.g., Moerland, 1995). That is, in the U.S. „managers are expected to be rewarded
using short-term performance measures such as earnings per share and other profit related
measures‟ (Demirag, 1998: 67). In contrast, Japanese CEOs are said to be more concerned with
long-term corporate growth than short-term profitability (Demirag, 1998). In these countries
CEOs tend to focus on long-term growth, e.g. sales, market share and firm growth (Doi, 1998).
The dimensions positive versus negative effect and locus of causality have been used in
prior research into self-serving attributions (e.g. Aerts, 1994, 2005; Bettman and Weitz, 1983).
These two dimensions address the desirability of an outcome from the presenter‟s (in this study:
the CEO‟s) point of view and indicate whether the presenter is willing to accept responsibility
for the outcome. As was indicated in the introduction, the self-serving attributional bias generally
involves that a presenter claims responsibility for highly desirable outcomes (for instance, good

19
news indicating that profits went up), but denies responsibility for undesirable outcomes (e.g.,
decreasing sales) by blaming them on causes beyond the presenter‟s control. That is, these two
dimensions are critical for examining our hypotheses.
The last dimension, direction of cause-effect relationship, is used to identify opposite
causal influences and was previously used by Aerts (1994, 2005). The main reason is that the
direction in which an attributional statement is expressed has a significant impact on its meaning.
Although causal statements such as „Due to the favorable economic conditions our sales
increased‟ and „Notwithstanding the Asian crisis our sales increased‟ are both coded as positive
effects explained externally, the implied meaning is very different. Whereas the first credits the
environment for the success, in the second statement managers implicitly claim they are
responsible for the success. Treating such effects without taking the implied meaning into
consideration would yield an unreliable picture.
To give the reader a flavor of both the types of the statements analyzed as well as how
these statements are coded along the relevant dimensions, we provide a number of examples in
the Appendix.
The coding procedure yielded reliable results. Cohen‟s kappas ( ) are all significantly
different from 0.00, implying intercoder agreement greater than chance. With respect to type of
effect ( = 0.80), valence of the attributed effect ( = 0.94), direction of the cause-effect
relationship ( = 0.86), and locus of causality ( = 0.83), reported kappas are above the 0.80
level indicating excellent intercoder agreement beyond chance (Neuendorf, 2002).
The replication study (covering Letters drawn from 2001 to 2007) made use of the same
coding procedure, manual, and worksheets. Furthermore, the coding was conducted by two
coders. However, due to budget constraints, it was feasible to double code 40 Letters. The 40
20
Letters comprised 20 Letters from years in which firm performance improved and 20 Letters in
which firm performance declined. Furthermore, Japanese and U.S. Letters were equally
represented. Cohen‟s kappas for these 40 Letters were higher than 0.75.
4. Results
4.1. Descriptive results
In total, the 400 Letters contained 935 unexplained effects. In addition, we encountered 1,087
effects explained by 1,672 causes. Tables 1 and 2 provide descriptive information regarding the
way the unexplained and explained effects, respectively, are coded along the relevant
dimensions. The figures in Tables 1 and 2 point to a number of interesting differences between
Japan and the U.S.
[Please insert Table 1]
[Please insert Table 2]
First, profits and sales represent approximately half of the unexplained and explained effects
encountered in U.S. Letters. They, surprisingly, make up almost 80 percent of the Japanese
unexplained effects and approximately 70 percent of the Japanese explained effects (see panel A
of Tables 1 and 2, respectively). Additionally, we observe that U.S. CEOs discuss shareholder
value-related issues as well.8 This U.S.-Japan difference in type of effects addressed is
statistically significant at the 1% level (based on two separate χ² tests for unexplained and
explained effects).

21
Second, U.S. Letters particularly highlight good news (85.9 percent of the unexplained
effects and 71.5 percent of the explained effects have a positive valence). Although the positive
is also emphasized in the Japanese Letters, the tendency to focus on good news is more moderate
than in the U.S. Letters (see panel B of Tables 1 and 2). This differential attention for good and
bad news is statistically significant (χ² tests; p-value < 0.01).
Third, in Panel C of Table 2, we see that both countries (χ² test; not significant) prefer to
avoid causal statements in which cause and effect are expressed in opposite directions. In total,
in 85.2 percent of the causal statements U.S. and Japanese CEOs use statements of form “Profits
went up due to …” or “We were forced to report a profit because of …” (i.e. statements in which
cause and effect are stated in similar directions).
Last, we observe that explanations for company performance in general are internally
oriented (see panel D of Table 2). If we omit statements that could not be coded along the locus
of causality dimension, the overall bias towards internal causes is particularly pronounced: about
58 percent of all explanations is internal. However, there is again a statistically significant
difference between U.S. and Japanese Letters (χ² test; p-value < 0.01): whereas approximately 63
percent (omitting the statements that could not be coded on this dimension) of the American
causes are internal, this percentage is lower in Japanese Letters (54 percent).
4.2. Hypotheses testing
To test our hypotheses, we follow previous research (e.g. Aerts, 1994, 2005) and adopt the Letter
in a specific year as the unit of analysis. This means that the initial sample of 1,672 causal
statements is reduced to 400 company-year observations. Additionally, we combine the coding
dimensions of the effects with those of the causes. Apart from the dimensions Positive versus

22
negative effect and Locus of causality, the dimension Direction of the cause-effect relationship is
also important. Although causal statements such as „Due to the favorable economic conditions
our sales increased‟ and „Notwithstanding the Asian crisis our sales increased‟ are both coded as
positive effects explained externally, the implied meaning is very different. Whereas the first
credits the environment for the success, in the second statement managers implicitly claim they
are responsible for the success. Therefore, a statement such as „Notwithstanding the Asian crisis
our sales increased‟ is considered a positive effect that is explained internally. The results of this
procedure are presented in Table 3.9
[Please insert Table 3]
Hypothesis 1a predicted that the number of good news attributions reported in U.S. letters
to the shareholders is higher than the number of good news attributions reported in Japanese
Letters. The results in Table 3 show that, on average, Japanese Letters contain 2.32 goods news
attributions (i.e. statements in which CEOs provide explanations for sales improvements, profit
increases, etc.). With an average of 2.05 statements it is slightly lower in the U.S. Letters. A
Mann-Whitney test, however, does not reveal a statistically significant difference. Hence,
hypothesis 1a cannot be accepted.
Hypothesis 1b indicated that the number of bad news attributions reported in U.S. Letters
is lower than the number of bad news attributions reported in Japanese Letters. The results
reported in Table 3 lend support to hypothesis 1b. We see that, on average, U.S. Letters contain
0.85 statements addressing bad news. This number is significantly lower than the average

23
number of bad news statements (1.54) found in Japanese Letters (Mann-Whitney test; p-value <
0.05).
Furthermore, we see that U.S. Letters focus on good news (Wilcoxon signed ranks test;
p-value < 0.01): the average number of good news statements (2.05) is significantly higher than
the average number of bad news statements (0.85). Although less pronounced than in the U.S.
Letters, a similar tendency is noticeable in the Japanese Letters. In case of the Japanese Letters,
the average number of good news statements (2.32) is also significantly higher than the average
number of bad news statements (1.54) (Wilcoxon signed ranks test; p-value < 0.01).
To test hypothesis 2, which predicted that the extent to which good news is ascribed to
internal causes is higher in U.S. Letters than in Japanese Letters, we compare the average
number of good news statements explained by internal factors. Table 3 shows that the average
number of good news statements explained by internal factors is approximately 1.80 in both
Japanese as well as U.S. Letters. In contrast to our expectations, the average number of good
news statements ascribed to internal factors is statistically indistinguishable between the U.S.
Letters and the Japanese Letters (Mann-Whitney test; not significant). Therefore, we reject
hypothesis 2.
Hypothesis 3 stated (in alternative form) that the extent to which bad news is ascribed to
external causes is higher in U.S. Letters than in Japanese Letters. The results in Table 3 indicate
that, on average, Japanese Letters contain more statements in which bad news is blamed on
external causes than do U.S. Letters. More specifically, we see that the average number of
statements in which bad news is externalized is almost twice as high in Japanese Letters (1.13)
than in U.S. Letters (0.60) (Mann-Whitney test; p-value < 0.05). Therefore, we reject hypothesis
3 and conclude that in contrast to our expectations Japanese CEOs are, compared to their U.S.
24
colleagues, more inclined to blame the environment for deteriorating performance. Interestingly,
we also observe that the Japanese CEOs are more than their U.S. colleagues inclined to accept
personal blame for bad news (i.e. declining firm performance). Specifically, Table 3 shows that
the average number of statements in which bad news is ascribed to internal causes is 0.41 in
Japanese Letters, which is significantly higher than the average number of 0.25 found in U.S.
Letters (Mann-Whitney test; p-value < 0.10).
To test hypotheses 4 and 5, we look at the average number of positive and negative effects
reported in the letters to the shareholders, irrespective of whether they are explained or not.
Table 4 shows the results.
[Please insert Table 4]
Hypothesis 4 predicted that the number of good news statements (both explained and
unexplained) reported in U.S. Letters is higher than the number of good news statements
reported in Japanese Letters. On the basis of the results reported in Table 4 we are able to accept
this hypothesis. Table 4 illustrates that the average number of total good news statements (i.e.
both explained and unexplained statements addressing an improvement in performance) is
significantly higher in U.S. Letters (4.43) than in Japanese Letters (3.61) (Mann-Whitney test; p-
value < 0.05). As is evident in Table 4, this difference can be largely attributed to the fact that
U.S. CEOs employ unexplained effects to address the positive. Specifically, the average number
of unexplained good news statements in U.S. Letters (2.38) is considerably higher than the
number of unexplained good news statements in the Japanese Letters (1.29).
25
Table 4 also lends support for hypothesis 5. Stated in its alternative form, this hypothesis
indicated that the number of bad news statements (both explained and unexplained) reported in
U.S. Letters is lower than the number of bad news statements reported in Japanese Letters. As
Table 4 shows, on average, the Japanese Letters (2.08) contain a significantly higher number of
bad news statements than the U.S. Letters (1.19) (Mann-Whitney test; p-value < 0.05).
Furthermore, Table 4 demonstrates that, compared to the U.S. Letters, the Japanese Letters
contain on average not only more unexplained bad news statements but also more attributions for
declining performance.
Overall, the results with respect to hypotheses 4 and 5 point to a systematic U.S.-Japan
difference in the way financial performance is addressed. Whereas U.S. Letters emphasize good
news, the Japanese Letters are more balanced in the coverage of improving and declining
performance.
4.3. Did attributional behavior change after the creation of the IASB?
Our second research question aims to find out whether the pervasiveness of the self-serving
attributional bias has changed after the creation of the IASB and the subsequent convergence
projects in the U.S. and Japan. Prior research examined among others the determinants and
consequences of the voluntary adoption of non-local GAAP (including IFRS) (Cuijpers and
Buijink, 2005), the impact of IFRS on earnings management (Barth et al., 2007; Van Tendeloo
and Vanstraelen, 2005) and whether auditor choice affects compliance with IFRS (Hodgdon et
al., 2009).
To answer this research question we compare the good news and bad news statements
presented in Letters from the pre-IASB period (i.e. 1994 to 2000) with the statements in Letters

26
from the post-IASB period (i.e. 2001 to 2007). Table 5 shows the results. Panel A of Table 5
provides the results for the full sample. Panels B and C, respectively, show the same information
for U.S. and Japanese Letters separately.
[Please insert Table 5]
A number of interesting observations can be made from this table. First, the results in
Table 5 show that not much has changed with respect to the attention for good news. Although
we observe that, for the full sample, the average total number of good news statements decreased
from 4.24 to 3.80, this decrease is not statistically significant. Furthermore, Table 5, Panels B
and C provide qualitate qua similar results for the U.S. and Japanese Letters separately. Things
are considerably different with respect to bad news statements. For both the full sample (Panel A
of Table 5), as well as the U.S. and Japanese samples (Table 5, Panels B and C, respectively), we
observe that the number of bad news statements significantly declined from the pre-IASB period
to the post-IASB period. For example, for the full sample we find that the average total number
of bad news statements declined from 2.13 to 1.15 (Wilcoxon Signed Rank Test, p-value < 0.01).
Panels B and C of Table 5 point to a similar trend in U.S. Letters (a decline in the total average
number of bad news statements from 1.55 to 0.83) and in Japanese Letters (from 3.53 to 1.46).
4.4. The impact of firm performance
Prior research found that firm performance affects the extent to which good and bad news are
addressed. Specifically, researchers demonstrated that companies with improving performance
concentrate on good news (e.g. Bettman and Weitz, 1983; Clatworthy and Jones, 2003; Lee et

27
al., 2004). However, these researchers also showed that CEOs of companies with declining
performance tend to address the positive aspects of firm performance rather than focusing on the
bad news.
[Please insert Table 6]
Although Table 6, Panel A reveals a number of statistically significant differences between
the U.S. and Japan, one message stands out. Specifically, we observe that in years in which firm
performance improved, the Japanese and U.S. letters to the shareholders are quite similar as to
the average number of good news and bad news statements (total number of explained and
unexplained statements). In line with prior research (Bettman and Weitz, 1983; Lee et al., 2004),
good news is emphasized in the U.S. Letters. In the U.S. Letters drawn from years in which
company performance improved the number of good news statements is almost ten times the
number of bad news statements. This tendency is somewhat more moderate in Japanese Letters.
However with a ratio of six good news statements for one bad news statement it is still
considerable.
In contrast, there is evidence of asymmetry in reporting of good and bad news by U.S. and
Japanese CEOs facing declining performance (see panel B of Table 5). First, we observe that
U.S. Letters contain, on average, a significantly higher number of good news statements (3.39)
than do Japanese Letters (2.26). The results also show that U.S. CEOs try to highlight positive
aspects of firm performance through unexplained effects. The average number of positive
unexplained effects is significantly higher in U.S. Letters (1.80) than in Japanese Letters (0.76)
(Mann-Whitney test; p-value < 0.01). Second, we see that the average number of negative effects

28
presented in Letters of Japanese companies with declining performance (3.36) is 80 percent
greater than in U.S. Letters (1.86) (Mann-Whitney test; p-value < 0.01).
4.5. The impact of general economic conditions
We also examine whether the general economic conditions have an impact on the differences we
found between U.S. and Japanese Letters. To determine whether the general economic
conditions can be considered favorable or unfavorable we follow a similar procedure as Bettman
and Weitz (1983). Specifically, we look at two national economic indicators relevant to
corporations: gross national product and stock market indices. For each year and country the
relative change is calculated for these two measures using Datastream and OECD information. If
the relative change for both measures is negative, the year is designated unfavorable.
Accordingly, we identify 1995 and 2002 as years in which general economic conditions are
unfavorable in the U.S., while 1998, 1999, and 2002 are considered unfavorable in Japan (among
others reflecting the Asian Crisis). All other years are considered favorable in terms of general
economic conditions. In total, we have 117 Letters that relate to economic unfavorable
conditions and 283 that relate to favorable conditions. To analyze the impact of prevailing
economic conditions on the self-serving attributional bias in U.S. and Japanese Letters, we split
the sample in two subsets and analyze whether there are country differences.
The first subset comprises the 117 Letters that were written while general economic
conditions were tough. Not tabulated Mann-Whitney tests indicate that U.S. and Japanese Letters
are only statistically different in terms of the average number of attributions in which declining
firm performance is explained. Whereas the 101 Japanese Letters present on average 2.25 of
these statements, the average in the 16 U.S. Letters is significantly lower at 0.63 (p-value <
29
0.10). Clearly, it is conceivable that this difference is an artifact of the low number of U.S.
Letters. Otherwise stated, we cannot rule out the possibility that results might have been different
if we had more U.S. Letters from economically unfavorable years.
The second subset contains 283 Letters from years in which general economic conditions
were favorable. Using Mann-Whitney statistics we are able to find a number of interesting
differences between the 184 U.S. Letters and the 99 Japanese Letters. First, we find that the
average number of good news statements that remain unexplained is significantly higher in the
U.S. (2.45) than in the Japanese Letters (1.39) (p-value < 0.01; not tabulated). Second, we find
that the average number of bad news statements that is ascribed to causes (i.e. number of causal
statements) is significantly higher in the Japanese Letters (1.27) than in the U.S. Letters (0.86)
(not tabulated).
To examine whether the difference is simply a reflection of underlying firm performance,
we split the subset comprising the 283 Letters taken from an economically favorable year in two
subsample. We start with the 154 Letters that are written while both firm-specific performance
and prevailing economic conditions are favorable. We find that the average number of
unexplained good news statements presented in the 98 U.S. Letters (2.99) is significantly higher
than in the 56 Japanese Letters (1.70) (not tabulated). Probably more interesting are the 129
Letters that are written while general economic conditions are favorable, but address a
deterioration of firm performance. Again we observe a number of statistically significant
differences between the U.S. and Japan (not tabulated). First, the average number of unexplained
good news statements is significantly higher in the U.S. Letters (1.83) than in the Japanese
Letters (1.00) (Mann Whitney, p-value < 0.01) (not tabulated). Second, the average number of
statements in which declining firm performance is attributed to specific causes is significantly

30
higher in Japanese Letters (2.35) than in U.S. Letters (1.42) (p-value < 0.05) (not tabulated).
Overall, the results indicate that despite disappointing firm performance U.S. CEOs want to
accentuate the positive.
4.6. Impact of U.S. listing on Japanese Letters
Previous studies (e.g. Cooke, 1993; Singleton and Globerman, 2002) demonstrate that Japanese
firms with a U.S. listing tend to be U.S.-oriented in terms of financial accounting disclosures.
Therefore, we check whether there are variations in explanatory behavior between Japanese
Letters written in years in which the companies are listed in the U.S. (43 of the 200 Japanese
Letters) and those where there is no such listing (the other 157 Letters). Surprisingly, we are able
to find only one statistically significant difference: Japanese Letters from CEOs whose company
is U.S. listed contain on average more good news statement that remain unexplained (mean is
1.98) than the Letters from CEOs of companies not listed in the U.S. (mean is 1.10) (not
tabulated). Therefore, we can conclude that Japanese CEOs demonstrate qualitate qua similar
attributional behavior irrespective of whether their firm is U.S.-listed or not.
5. Discussion
In this study we looked at the manner in which U.S. and Japanese CEOs address company results
and, subsequently, explain those results in their letters to the shareholders. Using content analysis
on 400 Letters we found evidence that the Letter is used to manage the impressions people have
of the company. More specifically, we found that CEOs use this opportunity to portray the
company in the best possible light, thereby corroborating previous research in this area (e.g.

31
Aerts, 1994, 2005; Bettman and Weitz, 1983; Clatworthy and Jones, 2003; Staw et al., 1983).
Additionally, we found a number of striking differences between the U.S. and Japanese Letters.
First, we found the tendency to stress good news is particularly strong in U.S. Letters.
More specifically, approximately 80 percent of all effects addressed in U.S. Letters relates to
good news. This is significantly higher than the 64 percent found in the Japanese Letters.
Additional analyses, however, revealed that it is important to take into account firm performance.
Specifically, both the average total number of good news statements (i.e. both explained and
unexplained positive effects) as well as the average total number of bad news statements (i.e.
both explained and unexplained negative effects) are statistically indistinguishable between the
U.S. Letters and the Japanese Letters written in a year in which firm performance improved. In
Letters written in years in which firm performance improved the positive is highlighted in both
countries. However, when the CEO wrote the Letter in a year in which firm performance
deteriorated things were considerably different. Whereas the Japanese CEOs stuck to addressing
the bad news, their U.S. counterparts highlighted the positive aspects rather than focusing on the
declining performance in their Letters. This tendency of U.S. CEOs to emphasize good news is
in line with recent social-psychological research which indicates that the need to view oneself
positively is particularly strong in the U.S. (e.g. Heine et al., 1999, 2000, 2001; Kitayama et al.,
1997; Markus and Kitayama, 1991) and encourages people „to seek out, enhance and elaborate
their positive characteristics‟ (Heine et al., 1999, p. 775). In Japan, however, negative
information (i.e. bad news) is not considered threatening.
Second, contrary to our expectations the average number of good news statements that is
explained in terms of the firm‟s strategy, the board‟s decisions, or other internal causes is not
significantly different between the U.S. and Japanese Letters. The finding that Japanese CEOs
32
tend to ascribe good news to internal causes conforms to recent evidence suggesting that the
nature of the relationship affects the way people explain outcomes (Takata, 2003). More
specifically, Takata (2003) demonstrates that Japanese people self-enhance in case they provide
explanations for their behavior in front of people who are relatively unknown and anonymous to
them. This may well apply to the CEO of a large, listed company who writes the Letter -- a letter
directed at shareholders in general who are likely to remain personally unknown to the CEO.
Third, with respect to bad news we found that both U.S. and Japanese managers prefer
not to assume responsibility, but rather to explain bad news in terms of external factors.
Surprisingly and in contradiction with our expectations, we found that this tendency is relatively
strongest among the Japanese managers. Apart from the possibility that the Asian Crisis provided
them with a credible excuse, „face‟ may be another explanation for this result. As declining
performance can be perceived as a predicament (Aerts, 2005) and is likely to threaten a CEO‟s
public‟s image (i.e. his „face‟), it induces various reactions including denying responsibility for
the bad news. Indeed, Kim and Nam (1998, p.531) argue that „because the consequences of loss
of face tend to be more serious in Asian cultures than in Western cultures, Asians may show a
stronger tendency to attribute their failures to meet role expectations to external causes than
Westerners‟.
Fourth, we analyzed whether CEOs changed their reporting behavior in the Letters after
the creation of the IASB and the subsequent convergence processes that have taken place in the
United States and Japan. Our results suggest that U.S. and Japanese CEOs reacted similarly:
whereas they did not alter the way they communicated goods news, they did change their
communication of bad news. In both the U.S. and Japanese Letters the average number of total
bad news statements (i.e. both explained and unexplained effects) was significantly lower in the

33
post-IASB period (i.e. after 2001) than in the pre-IASB period. At present it is difficult to
explain why the CEOS only changed the way they communicated bad news.
Last, we studied the impact of U.S.-listing on Japanese Letters to see whether the
Japanese cross-listed firms fall in between the U.S. firms and the Japanese firms not cross-listed
in the U.S. In contrast to prior research (e.g. Cooke, 1993; Singleton and Globerman, 2002) we
did not find evidence suggesting that Japanese firms with U.S. listing are different from the
Japanese firms that are not quoted in the U.S.
6. Conclusion, implications and limitations
In this study we found substantial evidence that CEOs explain organizational outcomes in a self-
serving manner in their letters to the shareholders. First, CEOs prefer both to present as well as
claim responsibility for good news. Second, bad news is predominantly externalized by blaming
it on causes such as the weather or a recession. These results suggest that explanations in Letters
might be used strategically to influence readers‟ perceptions of the company. We have also
revealed a number of interesting differences between Japanese and U.S. CEOs. In line with our
expectations, we have demonstrated that good news is emphasized particularly in U.S. Letters.
However, the U.S. and Japanese Letters are statistically indistinguishable with respect to the
average number of good news statements that are ascribed to internal causes. Contrary to our
expectations, the tendency to assign bad news to external causes is particularly strong in
Japanese Letters. These U.S.-Japan differences indicate that the country in which a company
operates has an impact on this form of impression management.
The results of this study have a number of implications. First, they confirm previous
research that demonstrate that this specific type of accounting narratives are subject to
34
impression management and, hence, may harm the provision of a balanced, true and fair view of
company performance (Clatworthy and Jones, 2003). Otherwise stated, the quality of financial
reporting may be undermined because letters to the shareholders are subject to impression
management (Merkl-Davies and Brennan, 2007). Second, in comparison with U.S. and U.K.
results, this study points to differences in the extent to which self-serving attributional biases are
present in letters to the shareholders from different countries. While U.S. and U.K. focus on good
news irrespective of firm performance, Japanese CEOs do address bad news when underlying
firm performance requires it. This is an important observation in view of prior research
indicating that investors use the Letter in their decision-making processes (e.g. Baird and Zelin,
2000; Baginski et al., 2004; Barton and Mercer, 2005). Our findings suggest that investors have
to be careful in using information presented in letters to the shareholders when they decide to
invest in, for instance, either a Japanese or a U.S. company, because the underlying differences
between U.S. and Japanese Letters may distort cross-national investment decisions (Beattie and
Jones, 2000). Investors who are interested in buying shares from an U.S. company or from a
comparable Japanese firm need to be aware that, even when the two firms perform equally well,
while the U.S. CEOs emphasize the positive in their Letters, this tendency is more moderate in
Japanese Letters.
The findings also have implications for regulators in general and the IASB and IFAC
(International Federation of Accountants) in particular. This study indicates that to a certain
extent national differences are present in accounting narratives. Therefore, the IASB is advised
to draw up a new Standard (or make revisions to IAS 1 Presentation of Financial Statements)
containing requirements with respect to accounting narratives. The IFAC, who issues the
International Standards on Auditing (ISAs), is encouraged to examine whether they should come
35
with a new ISA in which auditors are not only required to ensure consistency of the information
in the accounting narratives (including the CEO‟s Letter) with the financial results presented
elsewhere in the annual report, but, additionally, to give guidance on how this independent
review should be performed.
The results of this study are subject to a number of important caveats. A first limitation of
the study concerns our focus on Letters of U.S. and Japanese companies. Although we found a
number of differences between Japanese and U.S. companies with respect to the way results are
explained in letters to the shareholders, we cannot say that the results are generalizable to a
comparison between, for instance, Singapore with the United Kingdom or Thailand with
Australia. Further studies need to replicate our investigation.
A second limitation relates to the sample. The sampled firms are, on average, larger than
the other U.S. and Japanese listed firms. Although in terms of firm performance the sampled and
other U.S. and Japanese firms are statistically indistinguishable and although we believe that
self-serving attributional biases within the Letter are mainly driven by firm performance, we
cannot rule out the possibility that the results of this study are not generalizable to the smaller
listed firms.
A third limitation of the study concerns the method used -- content analysis. Content
analysis is a relatively subjective method which puts great demands on the coders. Though we
designed our content analysis carefully and the high kappas indicate that it yielded reliable
results, we cannot completely discard the possibility that the outcomes reflect differences in
familiarity with the concepts of interest. Possibly some causal statements were not included in
the analysis because the coders either did not identify them as such or failed to agree on phrases

36
being causal. Alternatively, it is also possible that some statements were included in the analysis
that other people would not have identified as causal.
A fourth limitation of the study involves our focus on good news and bad news
statements presented in the Letters. That is, we looked at only one form of impression
management by which CEOs may try to influence people‟s perceptions of the organization.
Other possible ways, which may also be present in letters to the shareholders, include biases in
the conveyance of news, distortions in graphs, variations in readability, and juxtaposition of
color. Possibly these other forms of managing people‟s impressions work hand in hand with the
use of self-serving explanations.
A last, related limitation is that we looked only at the Letter and ignored other elements
of the financial report. In general, the Letter is often read in combination with financial
information presented elsewhere in the annual report. As this study considered only the relatively
unregulated Letter, it is unclear whether the results would have been different had we looked at
other parts of the annual report instead. That is, in other more regulated parts of the annual
report, and the Management Discussion and Analysis (MD&A) (or the comparable Operational
and Financial Review) section in particular, the self-serving attributional bias may possibly be
less pronounced; i.e., the results of this study might not be generalizable to the MD&A.

37
Footnotes
1 We use the term „letter to the shareholders‟ or „Letter‟ in this paper to cover similar documents
such as the „chairman‟s statement or address‟ and the „president‟s letter‟ as well.
2 We exclude banks, insurance companies and other financial institutions due to the specific
nature of their activities and the terminology used in their annual reports.
3 Additional t-tests on total assets and market capitalization do not affect this outcome.
4 We verified the nationality of the CEO by looking at information presented on the company‟s
website and in the annual report.
5 In general, we are able to include precisely the same companies that were sampled in the first
period (i.e. covering 1994-2000). However, in five cases we are forced to replace the original
company sampled in the pre-IASB period by another company. In these cases we make sure that
the new company is active in the same industry as the old company.
6 Throughout the paper we use „positive effects‟ and „good news (statements)‟ interchangeably.
The same applies to „negative effects‟ and „bad news (statements)‟
7 Apart from the categories mentioned, coders could also opt for a category „uncodeable along
this dimension.‟ The coders were instructed to use this category occasionally and only if they

38
thought that none of the options (for a single dimension) were able to reflect the meaning of the
effect or explanation that had to be coded.
8 An example of an unexplained statement that relates to shareholder value is the following:
“Perhaps most important [we] achieved a total return to our shareholders – that is, share price
appreciation plus dividends – of more than 70%. (This was on top of an 82% total shareholder
return in 1997)” (annual report Adolph Coors fiscal year 1998).
9 Kolmogorow-Smirnov tests for goodness of fit reveal that not one of the composite variables
followed a normal distribution (all p-values < 0.01). Consequently, we use non-parametric
statistics.

39
References
Aerts, W., 1994. On the use of accounting logic as an explanatory category in narrative
accounting disclosures. Accounting, Organizations and Society, Vol. 19: 337-353.
Aerts, W., 2005. Picking up the pieces: impression management in the retrospective attributional
framing of accounting outcomes. Accounting, Organizations and Society, Vol. 30: 493-517.
Baginski, S.P., J.M. Hassell, and M.D. Kimbrough, 2004. Why do managers explain their
earnings forecasts? Journal of Accounting Research, Vol. 42: 1-29.
Baird, J.E. and R.C. Zelin, 2000. The effects of information ordering on investor perceptions: An
experiment utilizing presidents‟ letters. Journal of Financial and Strategic Decisions, Vol.
13: 71-81.
Barth, M.E., Landsman, R. Wayne, and M.H. Lang, 2007. International Accounting Standards
and Accounting Quality. Stanford University Graduate School of Business Research Paper
No. 1976. Available at SSRN: http://ssrn.com/abstract=688041.
Bartlett, S.A. and R.A. Chandler, 1997. The corporate report and the private shareholder: Lee
and Tweedie twenty years on. British Accounting Review, Vol. 29: 245-261.
Barton, J. and M. Mercer, 2005. To blame or not to blame: Analysts‟ reactions to external
explanations for poor financial performance. Journal of Accounting and Economics, Vol. 39:
509-533.
Beattie, V.A. and M.J. Jones, 2000. Impression management: The case of inter-country financial
graphs. Journal of International Accounting, Auditing and Taxation, Vol. 9, 159-183.
Bettman, J.R. and B.A. Weitz, 1983. Attributions in the board room: Causal reasoning in
corporate annual reports. Administrative Science Quarterly, Vol. 28: 165-183.

40
Beynon, M.J., M.A. Clatworthy, and M.J. Jones, 2004. The prediction of profitability using
accounting narratives: A variable-precision rough set approach. Intelligent systems in
Accounting, Finance and Management, Vol. 12: 227-242.
Breton, G. and R.J. Taffler, 2001. Accounting information and analyst stock recommendation
decisions: A content analysis approach. Accounting and Business Research, Vol. 31: 91-101.
Bruton, G.D. and C.M. Lau, 2008. Asian management research: Status today and future outlook.
Journal of Management Studies, Vol. 45: 636-659.
Chanchani, S. and A. MacGregor, 1999. A synthesis of cultural studies in accounting. Journal of
Accounting Literature, Vol. 18: 1-30.
Clatworthy, M. and M.J. Jones, 2003. Financial reporting of good and bad news: Evidence from
accounting narratives. Accounting and Business Research, Vol. 33: 171-185.
Cooke, T.E., 1993. Disclosure in Japanese corporate annual reports. Journal of Business Finance
and Accounting, Vol. 20: 521-535.
Courtis, J.K., 1995. Readability of annual reports: Western versus Asian evidence. Accounting,
Auditing, and Accountability Journal, Vol. 8: 4-17.
Courtis, J.K. and S. Hassan, 2002. Reading ease of bilingual annual reports. Journal of Business
Communication, Vol. 39: 394-413.
Cuijpers, R. and W. Buijink, 2005. Voluntary adoption of non-local GAAP in the EU: A study of
determinants and consequence. European Accounting Review, Vol. 14: 487-524.
Demirag, I.S., 1998. Short –term performance pressures, corporate governance, an
accountability: An overview. In: Corporate governance, accountability, and pressures to
perform: An international study, I.S. Demirag (ed.), Stamford: JAI Press.

41
Doi, N., 1998. Corporate governance, corporate control, and R&D in Japanese manufacturing.
In: Corporate governance, accountability, and pressures to perform: An international study,
I.S. Demirag (ed.), Stamford: JAI Press.
Doupnik, T.S. and G.T. Tsakumis, 2004. A critical review of tests of Gray‟s theory of cultural
relevance and suggestions for future research. Journal of Accounting Literature, Vol. 23: 1-
48.
Fiske, A.P., S. Kitayama, H.R. Markus, and R.E. Nisbett, 1998. The cultural matrix of social
psychology. In D.T. Gilbert, S.T. Fiske, and G. Lindzey (eds.), The handbook of social
psychology, volume 2 (pp. 915-981). Boston: McGraw-Hill.
Godfrey, J., P. Mather, and A. Ramsay, 2003. Earnings and impression management in financial
reports: The case of CEO changes. Abacus, Vol. 39: 95-123.
Heine, S.J., 2003. An exploration of cultural variation in self-enhancing and self-improving
motivations. In V. Murphy-Berman and J. J. Berman (Eds.), Nebraska Symposium on
Motivation: Vol. 49. Cross-cultural differences in perspectives on the self (pp. 101-128).
Lincoln: University of Nebraska Press.
Heine, S.J. and T. Hamamura, 2007. In search of East-Asian self-enhancement, Personality and
Social Psychology Review, Vol. 11: 1-24.
Heine, S.J., S. Kitayama, and D.R. Lehman, 2001. Cultural differences in self-evaluation:
Japanese readily accept negative self-relevant information. Journal of Cross-Cultural
Psychology, Vol. 32: 434-443.
Heine, S.J., D.R. Lehman, H.R. Markus, and S. Kitayama, 1999. Is there a universal need for
positive self-regard? Psychological Review, Vol. 106: 666-694.

42
Hodgdon, C., R.H. Tondkar, A. Adhikari, and D.W. Harless, 2009. Compliance with
International Financial Reporting Standards and auditor choice: New evidence on the
importance of the statutory audit. International Journal of Accounting, Vol. 44: 33-55.
Hofstede, G., 2001. Culture’s consequences: Comparing values, behaviors, institutions, and
organizations across nations. Thousand Oaks: Sage Publications.
House, R.J., N.S. Wright, and R.N. Aditya, 1997. Cross-cultural research on organizational
leadership: A critical analysis and a proposed theory. In P.C. Earley and M. Erez (eds.), New
perspectives on international industrial/organizational psychology. San Fransisco: New
Lexington Press.
Jones, E.E. and T.S. Pittman, 1982. Toward a theory of strategic self-presentation. In: J. Suls
(ed.) Psychological perspectives on the self (pp. 231-262), Hillsdale, Erlbaum.
Kaplan, S.E., S. Pourciau, and P.M.J. Reckers, 1990. An examination of the effect of the
president‟s letter and stock advisory service information on financial decisions. Behaviorial
Research in Accounting, Vol. 2: 63-92.
Kim, J.Y. and S.H. Nam, 1998. The concept and dynamics of face: Implications for
organizational behaviour in Asia. Organization Science, Vol. 9: 522-534.
Kitayama, S., H.R. Markus, H. Matsumoto, and V. Norasakkunkit, 1997. Individual and
collective processes in the construction of the self: Self-enhancement in the United States and
self-criticism in Japan. Journal of Personality and Social Psychology, Vol. 72: 1245-1267.
Kobayashi, C. and J.D. Brown, 2003. Self-esteem and self-enhancement in Japan and America.
Journal of Cross-Cultural Psychology, Vol. 34, 567-580.
Leary, M.R., 1996. Self-presentation: Impression management and interpersonal behaviour.
Boulder: Westview Press.

43
Lee, F., C. Peterson, and L.Z. Tiedens, 2004. Mea Culpa: Predicting stock prices from
organizational attributions. Personality and Social Psychological Bulletin, Vol. 30: 1636-
1649.
Markus, H.R. and S. Kitayama, 1991. Culture and the self: Implications for cognition, emotion,
and motivation. Psychological Review, Vol. 98, 224-253.
Merkl-Davies, D.M. and N.M. Brennan, 2007. Discretionary disclosure strategies in corporate
narratives: Incremental information or impression management? Journal of Accounting
Literature, Vol. 26: 116-194.
Mezulis, A.H., L.Y. Abramson, J.S. Hyde, and B.L. Hankin, 2004. Is there a universal positivity
bias in attributions? A meta-analytic review of individual, developmental, and cultural
differences in the self-serving attributional bias. Psychological Bulletin, Vol. 130: 711-747.
Moerland, P.W., 1995. Alternative disciplinary mechanisms in different corporate systems.
Journal of Economic Behaviour and Organisation, Vol. 26: 17-34.
Neuendorf, K.A., 2002. The content analysis guidebook. Thousand Oaks: Sage Publications.
Nobes, C.W. and R.H. Parker, Comparative international accounting, London, 1998.
Preston, A.M., C. Wright, and J.J. Young, 1996. Imag[in]ing annual reports. Accounting,
Organizations and Society, Vol. 21: 113-137.
Singleton, W.R. and S. Globerman, 2002. The changing nature of financial disclosure in Japan.
The International Journal of Accounting, Vol. 37: 95-111.
Smith, M. and R.J. Taffler, 2000. The chairman‟s statement: A content analysis of discretionary
narrative disclosures. Accounting, Auditing, and Accountability Journal, Vol. 13: 624-646.
Staw, B.M., P.I. McKechnie, and S.M. Puffer, 1983. The justification of organizational
performance, Administrative Science Quarterly, Vol. 28: 582-600.

44
Takata, T., 2003. Self-enhancement and self-criticism in Japanese culture: An experimental
analysis. Journal of Cross-Cultural Psychology, Vol. 34: 542-551.
Van Tendeloo, B. and A. Vanstraelen, 2005. Earnings management under German GAAP versus
IFRS. European Accounting Review, Vol. 14: 155-180.

45
Tables
TABLE 1
Descriptives of unexplained effects
Panel A – Type of effect
US JP Total
Count % Count % Count %
Profits 125 22.6 140 36.6 265 28.3
Sales 172 31.1 156 40.8 328 35.1
Costs 9 1.6 0 0.0 9 1.0
Market share 20 3.6 5 1.3 25 2.7
Shareholder value 93 16.8 17 4.5 110 11.8
Other 44 8.0 17 4.5 61 6.5
More effects 90 16.3 47 12.3 137 14.7
Total 553 100.0 382 100.0 935 100.0
Panel B – Positive versus negative effects
US JP Total
Count % Count % Count %
Positive 475 85.9 254 66.5 729 78.0
Negative 69 12.5 113 29.6 182 19.5
Uncodeable 9 1.6 15 3.9 24 2.6
Total 553 100.0 382 100.0 935 100.0

46
TABLE 2
Descriptives of causal statements (i.e. explained effects)
Panel A – Type of effect
US JP Total
Count % Count % Count %
Profits 139 29.4 213 34.7 352 32.4
Sales 105 22.2 225 36.6 330 30.4
Costs 16 3.4 12 2.0 28 2.6
Market share 17 3.6 12 2.0 28 2.7
Shareholder value 24 5.1 2 0.3 26 2.4
Other 98 20.7 58 9.4 156 14.4
More effects 74 15.6 92 15.0 166 15.3
Total 473 100.0 614 100.0 1,087 100.0
Panel B – Positive versus negative effect
US JP Total
Count % Count % Count %
Positive 388 71.5 366 59.6 704 64.7
Negative 132 27.9 245 39.9 377 34.7
Uncodeable 3 0.6 3 0.5 6 0.6
Total 473 100.0 614 100.0 1,087 100.0
Panel C – Direction cause-effect relationship
US JP Total
Count % Count % Count %
Similar 598 86.9 827 84.0 1,425 85.2
Opposite 85 12.4 151 15.3 236 14.1
Uncodeable 5 0.7 6 0.6 11 0.7
Total 688 100.0 984 100.0 1,672 100.0
Panel D – Locus of causality
US JP Total
Count % Count % Count %
Internal 367 53.3 423 43.0 790 47.2
External 218 31.7 352 35.8 570 34.1
Uncodeable 103 15.0 209 21.2 312 18.7
Total 688 100.0 984 100.0 1,672 100.0

47
TABLE 3
Average number of internal versus external attributions for positive and negative
effects
Positive effects
(Good news)
Negative effects
(Bad news)
US Japan Total US Japan Total
Total number 2.05 2.32 2.18 0.85 1.54 σ, 1.19
Internal 1.79 1.85
1.82 0.25 0.41 0.33
External 0.27 0.47 σ
0.37 0.60 1.13 σ 0.86
Notes
σ Represents a significant difference between U.S. and Japan at the 0.01 level (on the basis of a Mann-
Whitney test)
Represents a significant difference between U.S. and Japan at the 0.1 level (on the basis of a Mann-
Whitney test)
Represents a significant difference between average number of good and bad news statements at the
0.01 level (on the basis of a Wilcoxon signed-ranks test)

48
TABLE 4
Average number of statements addressing positive and negative effects
Positive effects
(Good news)
Negative effects
(Bad News)
US Japan US Japan
Unexplained 2.38 1.29 0.34
0.54 φ
Explained 2.05 2.32
0.85 1.54 σ
Total 4.43 3.61 σ
1.19 2.08 σ
Notes
Represents a significant difference between U.S. and Japan at the 0.01 level (on the basis of a Mann-
Whitney test)
σ Represents a significant difference between U.S. and Japan at the 0.05 level (on the basis of a Mann-
Whitney test)
φ Represents a significant difference between U.S. and Japan at the 0.10 level (on the basis of a Mann-
Whitney test)

49
TABLE 5
Average number of positive and negative effects: Pre-IASB and post-IASB
Panel A: Full sample
Positive effects
(Good news)
Negative effects
(Bad news)
Pre Post Pre Post
Unexplained 2.08 1.59 0.69
0.21
Explained 2.16 2.21
1.44 0.94
Total 4.42 3.80
2.13 1.15
Panel B: U.S. companies
Positive effects
(Good news)
Negative effects
(Bad news)
Pre Post Pre Post
Unexplained 2.61 2.15 0.46
0.23
Explained 2.19 1.91
1.09 0.60
Total 4.80 4.06
1.55 0.83
Panel B: Japanese companies
Positive effects
(Good news)
Negative effects
(Bad news)
Pre Post Pre Post
Unexplained 1.55 0.91 1.03
0.18
Explained 2.13 1.79
2.50 1.28
Total 3.68 2.70
3.53 1.46
Notes
Represents a significant difference between average number of good and bad news statements at the
0.01 level (on the basis of a Wilcoxon signed-ranks test)
Represents a significant difference between average number of good and bad news statements at the
0.05 level (on the basis of a Wilcoxon signed-ranks test)

50
TABLE 6
The impact of firm performance on the average number of positive and negative
effects
Panel A: Improving firm performance
Positive effects
(Good news)
Negative effects
(Bad news)
US Japan US Japan
Unexplained 2.96 1.82 0.15
0.23
Explained 2.51 3.13 φ
0.37 0.57 φ
Total 5.47 4.95
0.52 0.80
Panel B: Declining firm performance
Positive effects
(Good news)
Negative effects
(Bad news)
US Japan US Japan
Unexplained 1.80 0.76 0.54
0.86
Explained 1.59 1.50
1.32 2.50
Total 3.39 2.26
1.86 3.36 Notes
Represents a significant difference between U.S. and Japan at the 0.01 level (on the basis of a Mann-
Whitney test)
σ Represents a significant difference between U.S. and Japan at the 0.05 level (on the basis of a Mann-
Whitney test)
φ Represents a significant difference between U.S. and Japan at the 0.10 level (on the basis of a Mann-
Whitney test)

51
APPENDIX: EXAMPLES OF CODED STATEMENTS
This appendix contains three examples of causal statements (i.e. explained effects). The effects
are in italics, whereas the explanations or causes for the effects are printed in bold. These
examples are followed by one example of an unexplained effect.
Example 1 (Kajima Corporation report fiscal year 1999)
„Civil engineering contracts increased to ¥ 360 billion, up 10.6% from fiscal 1998,
reflecting a rise in government projects aimed at stimulating domestic demand.‟
Coding
Type of effect Sales
Positive vs negative effect Positive (i.e. good news)
Locus of causality External
Direction Cause and effect have similar signs
Example 2 (Goodyear report fiscal year 1997)
„I am pleased to report significant progress as we achieved record earnings before
rationalisation charges for both the fourth quarter and 1997, despite very
challenging economic and competitive conditions.‟
Coding
Type of effect Earnings/profits
Positive vs negative effect Positive (i.e. good news)
Locus of causality External
Direction Cause and effect have opposite signs
Example 3 (Yamanouchi report fiscal year 2001)
„However, due to the expiry of the U.S. patent in October 2000, the exclusivity
period for which lasted until April 2001, sales of our bulk Gaster and royalty
income fell 18.1%.‟
Coding
Type of effect More than one of those mentioned above (i.e. sales
and earnings)
Positive vs negative effect Negative (i.e. bad news)
Locus of causality External
Direction Cause and effect have similar signs
Example 4 (UPS report fiscal year 2006)
„UPS reported the highest revenue, profit and earnings per share in our history.‟
Coding

52
Type of effect More than one of those mentioned above (i.e. sales,
earnings, and e.p.s.)
Positive vs negative effect Negative (i.e. bad news)


![Craig, Russell J. and Brennan, Niamh M. [2012] An Exploration of the Relationship between Language Choice in CEO Letters to Shareholders and Corporate Reputation, Accounting Forum,](https://img.pdfslide.us/doc/110x75/554c46afb4c9056b648b53a4/craig-russell-j-and-brennan-niamh-m-2012-an-exploration-of-the-relationship-between-language-choice-in-ceo-letters-to-shareholders-and-corporate-reputation-accounting-forum-363-166-177.jpg)