Embed Size (px)
Citation preview

LETTERdoi:10.1038/nature11606
EZH2 inhibition as a therapeutic strategy forlymphoma with EZH2-activating mutationsMichael T. McCabe1, Heidi M. Ott1, Gopinath Ganji1, Susan Korenchuk1, Christine Thompson1, Glenn S. Van Aller1, Yan Liu1,Alan P. Graves2, Anthony Della Pietra III1, Elsie Diaz2, Louis V. LaFrance1, Mark Mellinger1, Celine Duquenne1, Xinrong Tian1,Ryan G. Kruger1, Charles F. McHugh1, Martin Brandt2, William H. Miller1, Dashyant Dhanak1, Sharad K. Verma1, Peter J. Tummino1
& Caretha L. Creasy1
In eukaryotes, post-translational modification of histones is criticalfor regulation of chromatin structure and gene expression. EZH2 isthe catalytic subunit of the polycomb repressive complex 2 (PRC2)and is involved in repressing gene expression through methylationof histone H3 on lysine 27 (H3K27). EZH2 overexpression is impli-cated in tumorigenesis and correlates with poor prognosis in severaltumour types1–5. Additionally, somatic heterozygous mutations ofY641 and A677 residues within the catalytic SET domain of EZH2occur in diffuse large B-cell lymphoma (DLBCL) and follicularlymphoma6–10. The Y641 residue is the most frequently mutatedresidue, with up to 22% of germinal centre B-cell DLBCL andfollicular lymphoma harbouring mutations at this site. Theselymphomas have increased H3K27 tri-methylation (H3K27me3)owing to altered substrate preferences of the mutant enzymes9,11–13.However, it is unknown whether specific, direct inhibition ofEZH2 methyltransferase activity will be effective in treatingEZH2 mutant lymphomas. Here we demonstrate that GSK126, apotent, highly selective, S-adenosyl-methionine-competitive, small-molecule inhibitor of EZH2 methyltransferase activity, decreasesglobal H3K27me3 levels and reactivates silenced PRC2 target genes.GSK126 effectively inhibits the proliferation of EZH2 mutantDLBCL cell lines and markedly inhibits the growth of EZH2 mutantDLBCL xenografts in mice. Together, these data demonstratethat pharmacological inhibition of EZH2 activity may provide apromising treatment for EZH2 mutant lymphoma.
To identify inhibitors of EZH2 methyltransferase activity, a high-throughput biochemical screen with a five-member PRC2 proteincomplex was performed14. This work identified a small-moleculeEZH2 inhibitor with a Ki
app 5 700 nM. Extensive optimization of thiscompound through medicinal chemistry generated GSK126 (Fig. 1a).GSK126 potently inhibits both wild-type and mutant EZH2methyltransferase activity with similar potencies (Ki
app 5 0.5–3 nM)independent of substrate used, and is competitive with S-adenosyl-methionine (SAM) and non-competitive with peptide substrates(Fig. 1b and Supplementary Fig. 1a, b). GSK126 is highly selectiveagainst other methyltransferases and multiple other protein classes(Supplementary Tables 1–4). In particular, GSK126 is more than1,000-fold selective for EZH2 versus 20 other human methyltrans-ferases, including both SET-domain-containing and non-SET-domain-containing methyltransferases15. Even EZH1, which is 96%identical to EZH2 within the SET domain, and 76% identical overall,is inhibited more than 150-fold less potently (Ki
app 5 89 nM). Usingan EZH2 homology model9, combined with enzyme mechanism-of-action and inhibitor structure–activity relationship data, in silico dock-ing revealed the SAM binding pocket as the most plausible docking sitefor GSK126. Here it is predicted to make extensive contacts with thepost-SET domain which forms one side of the SAM binding pocket(Supplementary Fig. 2a–d). Interestingly, within 10 A of the predicted
GSK126-binding site, four of the six residue differences between EZH2and EZH1 lie within the post-SET domain, and these may contribute tothe decreased potency for EZH1.
The altered substrate preferences of EZH2 mutants lead to an imbal-ance in cellular H3K27 methylation states (Supplementary Fig. 3a)9,11.Nonetheless, GSK126 induced a 50% loss of H3K27me3 in both EZH2wild-type and mutant DLBCL cell lines at concentrations ranging from 7–252 nM independent of EZH2 mutation status (t-test, P 5 0.27) (Fig. 1c).Further analyses demonstrated that inhibition of H3K27me3 began before24 h and potency was maximal after 2 days (Supplementary Fig. 3b).GSK126 most potently inhibited H3K27me3, followed by H3K27me2,and H3K27me1 was only weakly reduced at the highest inhibitor concen-tration (Fig. 1d and Supplementary Fig. 3c). Total histone H3 and PRC2components were not affected by GSK126 (Supplementary Figs 3c and 4),thus reduction of H3K27 methylation is due to direct inhibition of EZH2methyltransferase activity and not degradation of histone H3 or PRC2.
1Cancer Epigenetics Discovery Performance Unit, Cancer Research, Oncology R&D, GlaxoSmithKline, 1250 S. Collegeville Road, Collegeville, Pennsylvania 19426, USA. 2Platform Technology and Sciences,GlaxoSmithKline, 1250 S. Collegeville Road, Collegeville, Pennsylvania 19426, USA.
DM
SO
2 μ
M
25 n
M
150 n
M
500 n
M
a
c
b
d
me0 me2
0
1
2
3
4
Kia
pp (nM
)
me1
1
10
100
1,000
H3K
27m
e3 IC
50 (nM
) Mutant EZH2 WT EZH2
KARPAS-422
H3K27me2
GSK126
H3K27me3
Total H3
H3K27me1
NH
ONHO
N
NN
HN
WT
A677G
A677G
A677G
Y641F
Y641H
Y641N
Y641S
Y641C
Pfe
iffer
KARPA
S-4
22
RL
SU-D
HL-
10
SU-D
HL-
4
WSU-D
LCL2
HT
SU-D
HL-
8 To
ledo
BC-2
Figure 1 | Biochemical and cellular mechanistic activity of GSK126.a, Structure of GSK126. b, Potency of GSK126 against wild-type and mutantEZH2. Histone H3 peptides (21–44) with K27me0, K27me1 or K27me2 wereused as substrates (n 5 2; mean values 6 s.d. are shown). c, Effect of GSK126 onH3K27me3 in lymphoma cell lines treated with GSK126 for 48 h. IC50 valueswere determined using an H3K27me3 ELISA (n $ 2; mean values 6 s.d. areshown). d, Evaluation of H3K27me3/2/1 in KARPAS-422 cells followingtreatment for 72 h. Total histone H3 is shown as a loading control.
0 0 M O N T H 2 0 1 2 | V O L 0 0 0 | N A T U R E | 1
Macmillan Publishers Limited. All rights reserved©2012

This is in contrast to 3-deazaneplanocin A (DZNep), an inhibitor ofS-adenosyl-L-homocysteine (SAH) hydrolase that promotes degradationof the PRC2 complex and indirectly inhibits EZH2 through effects onintracellular SAH concentrations16.
We evaluated the effect of GSK126 on cell proliferation in a panel ofB-cell lymphoma cell lines. DLBCL cell lines were the most sensitive toEZH2 inhibition (Fig. 2a). Six of the seven most sensitive DLBCL celllines harboured Y641N, Y641F or A677G EZH2 mutations (growthIC50 5 28–861 nM) (Fig. 2a, Supplementary Table 5 and Sup-plementary Fig. 5). The exception was the cell line HT, which is wildtype for EZH2 (growth IC50 5 516 nM). Interestingly, HT harbours amutation in UTX (R1111C), a H3K27 demethylase frequently inacti-vated in multiple tumour types17. Only two of the 11 remainingDLBCL cell lines harboured EZH2 mutations indicating that, in mostcases, DLBCL cell lines with mutant EZH2 are dependent on EZH2activity for cell growth. However, in some situations co-occurring
alterations may override the dependence of the cell on EZH2 activity,making it less sensitive to EZH2 inhibition. Among EZH2 mutantcell lines, sensitivity to GSK126 is independent of BCL2 transloca-tion or p53 mutation, common alterations found within DLBCL(Supplementary Table 5). There was a modest correlation betweeninhibition of H3K27me3 and cell growth (Pearson, r 5 0.62), but therewas no correlation between sensitivity to GSK126 and EZH2 proteinlevels (Supplementary Fig. 6a–c). Interestingly, two of the most sens-itive DLBCL cell lines, WSU-DLCL2 and KARPAS-422, are derivedfrom patients with refractory disease18,19 indicating that DLBCL cellsthat are resistant to standard-of-care may be sensitive to EZH2 inhibi-tion. Burkitt lymphoma and Hodgkin’s lymphoma cell lines weregenerally less sensitive to EZH2 inhibition (growth IC50 . 1.3mM)with the exception of Jiyoye (growth IC50 5 232 nM), a Burkittlymphoma cell line with wild-type EZH2. Evaluation of GSK126 inadditional lymphoma cell lines and extensive genomic and epigenomic
b a
EZH2 wild type
EZH2 mutant
10
100
1,000
10,000
100,000
Gro
wth
IC
50 (n
M)
DLBCL BL BCBL FL HL Other NHL
WIL
L-2
T
ole
do
W
ILL-1
SU
-DH
L-4
R
L
U-2
940
SU
-DH
L-8
U
-2932
SU
-DH
L-5
F
ara
ge
OC
I-Ly-1
9
DB
S
U-D
HL-6
HT
S
U-D
HL-1
0
KA
RP
AS
-422
WS
U-D
LC
L2
Pfe
iffe
r R
aji
C
A46
DG
-75
P3H
R-1
H
S-S
ultan
Daud
i
Jiy
oye
SC
-1
WS
U-N
HL
NU
-DU
L-1
MC
116
RI-
1
MIN
O
U-6
98-M
M
HH
-PR
EB
-1
KA
RP
AS
-1106P
R
C-K
8
CI-
1
SU
-DH
L-1
6
HD
-MY
-Z
L-4
28
Hs 4
45
RP
MI-
6666
BC
-1
BC
-2
BC
-3
CR
O-A
P2
WS
U-F
SC
CL
10
100
1,000
10,000
0 1 2 3 4 5 6 7 8
Gro
wth
IC
50 (n
M)
Days of treatment
KARPAS-422
Pfeiffer
d e
Fre
qu
en
cy
Sub- G1
c
DMSO
50 nM
500 nM
5 μM
Propidium iodide
Pfeiffer Pfeiffer Pfeiffer
0
100
200
300
400
500
600
0 1 2 3 4 5 6 7 8
CT
G s
ign
al (%
of
T0)
Days of treatment
4,582 nM 2,291 nM 1,146 nM 573 nM 286 nM 143 nM 72 nM 36 nM 18 nM DMSO
0.1
1
10
100
0 1 10 100 1,000 10,000
Fo
ld c
han
ge
GSK126 (nM)
Day 1
Day 2
Day 3
Day 6
KARPAS-422 KARPAS-422 g h
Fre
qu
en
cy
Propidium iodide
KARPAS-422 f
DMSO
50 nM
500 nM
0
2,000
4,000
6,000
8,000
10,000
12,000
0 1 2 3 4 5 6 7 8
4,582 nM 2,291 nM 1,146 nM 573 nM 286 nM 143 nM 72 nM 36 nM 18 nM DMSO
0.1
1
10
100
0 1 10 100 1,000 10,000
Fo
ld c
han
ge
GSK126 (nM)
Day 1
Day 2
Day 3
Day 6
CT
G s
ign
al (%
of
T0)
Days of treatment
Sub- G1
5 μM
Figure 2 | GSK126 inhibits the proliferation of several EZH2 mutantlymphoma cell lines. a, The effect of GSK126 on the growth of 46 lymphomacell lines after 6 days represented as the concentration of GSK126 required toinhibit 50% of growth (growth IC50). BCBL, AIDS body cavity-basedlymphoma; BL, Burkitt lymphoma; DLBCL, diffuse large B-cell lymphoma; FL,follicular lymphoma; HL, Hodgkin’s lymphoma; NHL, non-Hodgkin’s
lymphoma. b, Potency of GSK126 on growth of Pfeiffer and KARPAS-422 cellsover time represented as growth IC50. c, f, Dose-dependent effects of GSK126on cell proliferation over time in Pfeiffer or KARPAS-422 cells. Growth isexpressed as a percentage of CTG at time zero (T0). d, g, DNA contenthistograms showing the effect of GSK126 on the cell cycle after 72 h. e, h, Meanfold-change in caspase 3/7 activity over vehicle control 6 s.d. is shown (n 5 4).
RESEARCH LETTER
2 | N A T U R E | V O L 0 0 0 | 0 0 M O N T H 2 0 1 2
Macmillan Publishers Limited. All rights reserved©2012

characterization will be required to fully elucidate the determinants ofsensitivity among lymphoma subtypes.
Both cytostatic and cytotoxic responses were observed among themost sensitive cell lines (Supplementary Table 5); therefore, the timingof GSK126-induced effects on proliferation and cell death was exam-ined in detail in two of the most sensitive cell lines. In the Pfeiffer cellline, potent inhibition of cell proliferation was observed after 2 days(Fig. 2b) and net decreases in cell number were evident after 3 days(Fig. 2c). This cell death seems to be driven by caspase-mediatedapoptosis as indicated by the increase in the sub-G1 population(Fig. 2d) and dose-dependent induction of caspase activity (Fig. 2e).The response in the KARPAS-422 cell line was slower with 6–7 daysrequired for maximal potency (Fig. 2b). Furthermore, a primarilycytostatic effect was observed in KARPAS-422 cells as demonstratedby CellTiter-Glo (CTG) values remaining above day 0 levels, a G1
arrest (43% and 77% of cells in G1 with dimethylsulphoxide(DMSO) and 500 nM GSK126, respectively) with little sub-G1 content,and minimal caspase activity with ,1mM GSK126 (Fig. 2f–h).Consistent with these observations, short-hairpin-RNA-mediatedknockdown of EZH2 led to profound cytotoxic and apoptotic res-ponses in Pfeiffer cells, and decreased cell proliferation and no caspase
activation in KARPAS-422 cells, demonstrating that the phenotypiceffects observed with GSK126 are due to inhibition of EZH2(Supplementary Fig. 7).
Because EZH2 is associated with transcriptional repression, we eval-uated the effect of GSK126 on gene expression in DLBCL cell lines witha range of sensitivity to GSK126. Robust transcriptional activation wasnoted in the most sensitive cell lines (Fig. 3a, Supplementary Fig. 8aand Supplementary Table 6). Not surprisingly, considering therepressive nature of H3K27me2/3, the majority of transcriptionalchanges involved upregulation. The high degree of similarity betweengene expression changes observed with GSK126 treatment and EZH2knockdown in KARPAS-422 and Pfeiffer cells indicates that thesetranscriptional changes are due to loss of EZH2 activity and not off-target effects (Supplementary Figs 9 and 10). Additionally, analysis ofdata from chromatin immunoprecipitation followed by sequencing(ChIP-seq) for the three most responsive cell lines showed that beforetreatment upregulated genes exhibited broad enrichment ofH3K27me3, indicating that these genes are EZH2 targets marked byH3K27me3 (Fig. 3b and Supplementary Fig. 11).
In contrast to the response observed in the sensitive cell lines,minimal transcriptional changes occurred with GSK126 treatment in
1 6
2
3
4
5
6
7
c
a
+10 kb –10 kb
Up Down All
H3K
27m
e3 t
ag
density
H3K
27m
e3 t
ag
density
H3K
27m
e3 t
ag
density
Pfeiffer
KARPAS-422
WSU-DLCL2
b d
e
– Vehicle + 500 nM GSK126
10
100
1,000
10,000
0
200
400
600
800
1,000
Gro
wth
IC5
0 (nM
)
Num
ber
of
pro
be s
ets
HT
Pfeiff
er
WSU-D
LCL2
SU-DHL-1
0
KARPAS-422
DB
SU-DHL-4
Toledo
SU-DHL-6
OCI-L
Y-19
Mutant EZH2
WT EZH2
Upregulated
Downregulated
Growth IC50
0
5
10
15
20
25
Fo
ld c
hang
e
(vs D
MS
O)
TXNIP
25 nM
125 nM
500 nM
1,000 nM
1
10
100
1,000
Fo
ld c
hang
e
(vs D
MS
O)
TNFRSF21
25 nM
125 nM
500 nM
1,000 nM
Pfeiffer KARPAS
-422
Toledo
0
2
4
6
8
0
2
4
6
8
Gene
Pfe
iffe
r
WS
U-D
LC
L2
KA
RP
AS
-422
SU
-DH
L-1
0
HT
Overlap
Upregulated
Not significant
Downregulated
Pfe
iffe
r
WS
U-D
LC
L2
KA
RP
AS
-422
SU
-DH
L-1
0
HT
SU
-DH
L-6
DB
OC
I-L
Y-1
9
SU
-DH
L-4
To
led
o
– +
Log2
signal
14
8
0
SU
-DH
L-6
DB
OC
I-LY
-19
SU
-DH
L-4
To
led
o
– + – + – + – + – + – + – + – + – +
Figure 3 | GSK126 induces transcriptional activation in sensitive cell lines.a, The number of probe sets showing significantly altered gene expression (falsediscovery rate (FDR) , 0.1 and fold-change . 2 or , 22) following 72 htreatment with 500 nM GSK126 (n 5 2). b, Basal H3K27me3 ChIP-seqenrichment profiles of genes upregulated (red), downregulated (green), or allhuman transcripts (black) following GSK126 treatment. c, qRT–PCR analysisof TXNIP and TNFRSF21 following 72 h treatment with GSK126 (n 5 3; mean
values 6 s.d. are shown). d, The overlap of up- and downregulated probe setsbetween 10 DLBCL cell lines using a twofold expression change cut-off. e, Heatmap showing the average gene expression intensities of the 35 probe setsexhibiting significantly increased expression in at least four of the five mostsensitive mutant DLBCL cell lines (Pfeiffer, KARPAS-422, WSU-DLCL2,SU-DHL-10 and SU-DHL-6).
LETTER RESEARCH
0 0 M O N T H 2 0 1 2 | V O L 0 0 0 | N A T U R E | 3
Macmillan Publishers Limited. All rights reserved©2012

Toledo cells, a cell line with wild-type EZH2 whose growth is notaffected by EZH2 inhibition (Fig. 3a). Even at 2mM GSK126, veryfew transcriptional changes were observed in Toledo cells (23 upregu-lated and 10 downregulated probe sets), despite a near complete loss ofH3K27me3 at this dose and time (Supplementary Table 6 andSupplementary Fig. 3c). Likewise, quantitative PCR with reverse tran-scription (qRT–PCR) performed for quantitative mRNA expressionanalysis of two H3K27me3-enriched genes revealed dose-responsiveincreases in gene expression with as little as 25 nM GSK126 in Pfeifferand KARPAS-422 cells, but no transcriptional changes in Toledo cellswith up to 1mM GSK126 (Fig. 3c and Supplementary Table 7).Interestingly, even in the most sensitive wild-type EZH2 cell line, HT,the transcriptional response was less pronounced when compared toEZH2 mutant DLBCL cell lines with similar sensitivity (Fig. 3a).Relaxing the transcriptional fold-change criteria from 2.0 to 1.5 revealedadditional modest transcriptional changes in HT cells (SupplementaryFig. 8b). This muted transcriptional response in wild-type EZH2 andless sensitive mutant cell lines indicates that other compensatorymechanisms (such as H3K9, H4K20 or DNA methylation) may existin these cell lines to dampen the transcriptional response.
Among the EZH2 mutant cell lines, global H3K27me3 levels werestatistically higher in transcriptionally responsive lines (t-test, P 5
0.019), indicating that EZH2 mutation status together with globalH3K27me3 levels may be a better predictive biomarker than mutationstatus alone (Supplementary Fig. 8c). Whereas the five most sensitiveEZH2 mutant cell lines showed a preponderance of upregulated geneexpression changes (69–95%), little overlap was observed among thedifferentially regulated probe sets using either twofold or 1.5-fold sig-nificance criteria (Fig. 3d and Supplementary Fig. 8d). Only 35 upre-gulated probe sets were common to at least four of these five mutantcell lines (Supplementary Table 8). Examination of these commonlyupregulated probe sets revealed that many are enriched for H3K27me3(32/35) (Supplementary Tables 7 and 8). Additionally, many of theseprobe sets are induced, albeit weakly, in the other cell lines, indicatingthat additional time or chromatin factors may be required for completegene activation in these settings (Fig. 3e and Supplementary Table 8).Lastly, whereas no single pathway or process was significantly enrichedamong the limited set of genes commonly upregulated, gene ontologyenrichment analysis of regulated gene sets in each cell line individuallyrevealed several common processes including cell cycle regulation, celldeath and regulation of biological/cellular processes (SupplementaryFig. 12 and Supplementary Table 9). These data demonstrate that theglobal loss of H3K27me3 following inhibition of EZH2 with GSK126 isassociated with transcriptional activation of EZH2 target genes thatcorrelates well with sensitivity, and that mutant EZH2 de-regulatesH3K27me3 in a global, rather than targeted, manner. The significantvariation between the upregulated gene sets of sensitive cell lines is asurprising observation that likely highlights the complexity anduniqueness of the epigenome in each cell line, and the diversity ofselective pressures during the development of individual lymphomas.
On the basis of its potent effects in cell culture, we evaluated GSK126in mice using subcutaneous xenografts of KARPAS-422 and Pfeiffercells. Following 10 days of once-daily dosing of GSK126, globalH3K27me3 decreased and gene expression increased in a dose-dependent fashion consistent with observations from cell culture(Fig. 4a, b). Although GSK126 was initially cleared rapidly from theblood, there was an extended terminal phase where drug eliminationfrom blood and tumour was slower (Supplementary Fig. 13a, b). Withdaily 50 mg per kg dosing, complete tumour growth inhibition wasobserved in both KARPAS-422 and Pfeiffer cell models (Fig. 4c andSupplementary Fig. 14a). When higher dosing regimens were exam-ined with KARPAS-422 xenografts, marked tumour regression wasobserved (Fig. 4c). Upon cessation of dosing, tumours in the 50 mgper kg once daily group showed tumour stasis whereas completetumour eradication was observed in the 150 mg per kg once dailyand 300 mg per kg twice per week groups. Tumour growth inhibition
also correlated with statistically significant increased survival of micebearing the more aggressive KARPAS-422 tumours, where spontan-eous deaths occurred in vehicle-treated animals (Fig. 4d). On the basisof these striking observations, intermittent dosing regimens with lowerdoses of GSK126 given weekly or with a 1 week drug holiday wereexamined in KARPAS-422 tumour xenografts with large tumours(Supplementary Fig. 14b). All schedules demonstrated tumour growthinhibition (91–100%, t-test, P values 5 0.0008–0.0024). These resultsindicate that the response to GSK126 is durable and that intermittentdosing schedules may be effective in a clinical setting even in advancedtumours.
GSK126 was well tolerated at the doses and schedules examined asmeasured by little to no decrease in body weight, normal grooming andbehaviour, and vastly improved survival in mice carrying KARPAS-422 xenografts (Supplementary Fig. 15a–c and Fig. 4d). Given the roleof EZH2 in normal haematopoiesis and the identification of EZH2loss-of-function mutations in myeloid malignancies20–23, we investi-gated the effects of GSK126 treatment on peripheral blood of immu-nocompetent mice. Complete blood count analysis revealed nosignificant changes in any blood cell types at doses and timeswhere efficacy was observed in tumour xenografts (SupplementaryFig. 15d).
Over the past decade, the development of targeted agents that spe-cifically inhibit oncoproteins with activating somatic alterations hasprovided profound clinical benefit for cancer patients24,25. The datashown here provide compelling evidence that inhibition of EZH2methyltransferase activity may be a viable strategy for the treatmentof DLBCL and non-indolent follicular lymphoma harbouring activ-ating mutations in EZH2. GSK126 also provides a means to evaluatewhether EZH2 activity is required for the survival of tumours whereEZH2 overexpression has been linked to poor prognosis2–5, andtumours harbouring loss-of-function mutations in UTX17,21,26.
a c
GSK126 dosing No drug
GSK126 dosing
P = 0.0024
P ≤ 2 × 10⁻⁵
d
b
0
20
40
60
80
100
KARPAS-422 Pfeiffer
mg per kg
0
2
4
6
8
10
1
10
100
1,000
0
200
400
600
800
1,000
1,200
1,400
1,600
1,800
0 20 40 60
Study day
Vehicle 50 mg per kg once daily150 mg per kg once daily300 mg per kg twice per week
0
20
40
60
80
100
120
0 10 20 30 40 50 60 70
Vehicle 50 mg per kg once daily150 mg per kg once daily300 mg per kg twice per week
No drug
P < 0.0001
P < 0.0001
P = 0.0063
15 50 150 15 50 150 H3K
27m
e3 (%
of
co
ntr
ol)
Study day
Vehicle 15 50 150 mg per kg
Fo
ld c
hang
e
TXNIP
Perc
enta
ge s
urv
ival
Fo
ld c
hang
e
Vehicle 15 50 150
TNFRSF21
Tum
our
vo
lum
e (m
m3)
mg per kg
Figure 4 | In vivo inhibition of H3K27me3 and tumour growth responsewith GSK126. a, Response of H3K27me3 in tumour xenografts following10 days of once daily dosing with GSK126. b, qRT–PCR analysis of EZH2 targetgenes in KARPAS-422 tumour xenografts. Mean values 6 s.d. (n 5 3) areshown (a, b). c, Activity of GSK126 on the growth of subcutaneous KARPAS-422 xenografts. Mean tumour volume 6 s.e.m. is shown (n 5 10). d, Kaplan–Meier survival curve of mice treated in c. Significant P values, calculated using anonparametric log-rank test, between vehicle and treatment groups areindicated. No significant differences were observed between treatment groups(P values 5 0.07–0.32).
RESEARCH LETTER
4 | N A T U R E | V O L 0 0 0 | 0 0 M O N T H 2 0 1 2
Macmillan Publishers Limited. All rights reserved©2012

Although we do not expect GSK126 to be effective in treating myeloidmalignancies bearing loss-of-function mutations in EZH2 (refs 21–23), GSK126 should be an important tool to assess the role of EZH2 innormal myeloid development and to understand the oncogenic role ofEZH2 in myeloproliferative neoplasms. Lastly, the identification of aselective EZH2 inhibitor which does not lead to degradation of thePRC2 complex provides a useful tool to understand the role of EZH2methyltransferase activity versus its scaffolding role in development,tumorigenesis and tumour progression that could not be elucidatedthrough conventional genetic manipulation studies.
METHODS SUMMARYBiochemical assays used the five-member PRC2 complex (human Flag–EZH2,EED, SUZ12, AEBP2, RbAp48) containing either wild-type or mutant EZH2,[3H]-SAM and the indicated peptide substrate; reactions were incubated for30 min. Global histone modification levels were determined by enzyme-linkedimmunosorbent assay (ELISA) or western blot methods using antibodies specificfor total histone H3, H3K27me1, H3K27me2 or H3K27me3. Cell proliferation andcaspase-3/7 activity were assessed using CellTiter-Glo and Caspase-Glo 3/7(Promega), respectively. Gene expression profiling was conducted usingAffymetrix Human Genome U133 Plus 2.0 microarrays. Differentially expressedprobe sets were determined by fitting the data to a linear model using the limmastatistical package (http://www.bioconductor.org) and carrying out pair-wise con-trasts of treated versus control. Significant probe sets were filtered for detection(log2 signal threshold of 8), an average fold-change .2 or ,22, or .1.5 or,21.5, where indicated, with P values adjusted for multiple testing correctionby false discovery rate (FDR; Benjamini–Hochberg) , 0.1. H3K27me3 ChIP readswere aligned using Bowtie27. H3K27me3 enrichment peaks were identified usingSICER28 with optimized parameters. A custom PERL script was used to quantifythe average basal H3K27me3 ChIP-seq tag density across gene sets. All in vivostudies were conducted after review by the Institutional Animal Care and UseCommittee at GSK and in accordance with the GSK Policy on the Care, Welfareand Treatment of Laboratory Animals. GSK126 and vehicle were administered tomice intraperitoneally. Two-tailed t-tests were conducted assuming two samplesof equal variance. A complete description of the materials and methods is providedin Supplementary Information.
Full Methods and any associated references are available in the online version ofthe paper.
Received 25 June; accepted 24 September 2012.
Published online 10 October 2012.
1. Varambally, S. et al. Genomic loss of microRNA-101 leads to overexpression ofhistone methyltransferase EZH2 in cancer. Science 322, 1695–1699 (2008).
2. Varambally, S. et al. The polycomb group protein EZH2 is involved in progressionof prostate cancer. Nature 419, 624–629 (2002).
3. Kleer, C. G. et al. EZH2 is a marker of aggressive breast cancer and promotesneoplastic transformation of breast epithelial cells. Proc. Natl Acad. Sci. USA 100,11606–11611 (2003).
4. Wagener, N. et al. Enhancer of zeste homolog 2 (EZH2) expression is anindependent prognostic factor in renal cell carcinoma. BMC Cancer 10, 524(2010).
5. Takawa, M. et al. Validation of the histone methyltransferase EZH2 as a therapeutictarget for various types of human cancer and as a prognostic marker. Cancer Sci.102, 1298–1305 (2011).
6. Morin, R. D. et al. Frequent mutation of histone-modifying genes in non-Hodgkinlymphoma. Nature 476, 298–303 (2011).
7. Morin, R. D. et al. Somatic mutations altering EZH2 (Tyr641) in follicular anddiffuse large B-cell lymphomas of germinal-center origin. Nature Genet. 42,181–185 (2010).
8. Pasqualucci, L. et al. Analysis of the coding genome of diffuse large B-celllymphoma. Nature Genet. 43, 830–837 (2011).
9. McCabe,M. T. et al. Mutationof A677 inhistone methyltransferaseEZH2 inhumanB-cell lymphoma promotes hypertrimethylation of histone H3 on lysine 27(H3K27). Proc. Natl Acad. Sci. USA 109, 2989–2994 (2012).
10. Ryan, R. J. et al. EZH2 codon 641 mutations are common in BCL2-rearrangedgerminal center B cell lymphomas. PLoS ONE 6, e28585 (2011).
11. Sneeringer, C. J. et al. Coordinated activities of wild-type plus mutant EZH2 drivetumor-associated hypertrimethylation of lysine 27 on histone H3 (H3K27) inhuman B-cell lymphomas. Proc. Natl Acad. Sci. USA 107, 20980–20985 (2010).
12. Wigle, T. J. et al. The Y641C mutation of EZH2 alters substrate specificity forhistone H3 lysine 27 methylation states. FEBS Lett. 585, 3011–3014 (2011).
13. Yap, D. B. et al. Somatic mutations at EZH2 Y641 act dominantly through amechanism of selectively altered PRC2 catalytic activity, to increase H3K27trimethylation. Blood 117, 2451–2459 (2011).
14. Diaz, E. et al. Development and validation of reagents and assays for EZH2 peptideand nucleosome high-throughput screens. http://dx.doi.org/10.1177/1087057112453765 J. Biomol. Screen. (2012).
15. Schubert, H. L., Blumenthal, R. M. & Cheng, X. Many paths to methyltransfer: achronicle of convergence. Trends Biochem. Sci. 28, 329–335 (2003).
16. Miranda, T. B. et al. DZNep is a global histone methylation inhibitor that reactivatesdevelopmental genes not silenced by DNA methylation. Mol. Cancer Ther. 8,1579–1588 (2009).
17. van Haaften, G. et al. Somatic mutations of the histone H3K27 demethylase geneUTX in human cancer. Nature Genet. 41, 521–523 (2009).
18. Dyer, M. J., Fischer, P., Nacheva, E., Labastide, W. & Karpas, A. A new human B-cellnon-Hodgkin’s lymphoma cell line (Karpas 422) exhibiting both t(14;18) andt(4;11) chromosomal translocations. Blood 75, 709–714 (1990).
19. Al-Katib, A. M. et al. Bryostatin 1 down-regulates mdr1 and potentiates vincristinecytotoxicity in diffuse large cell lymphoma xenografts. Clin. Cancer Res. 4,1305–1314 (1998).
20. Chou, R. H., Yu, Y. L. & Hung, M. C. The roles of EZH2 in cell lineage commitment.Am. J. Transl. Res. 3, 243–250 (2011).
21. Jankowska, A. M. et al. Mutational spectrum analysis of chronic myelomonocyticleukemia includes genes associated with epigenetic regulation: UTX, EZH2, andDNMT3A. Blood 118, 3932–3941 (2011).
22. Ernst, T.et al. Inactivatingmutationsof thehistonemethyltransferasegeneEZH2 inmyeloid disorders. Nature Genet. 42, 722–726 (2010).
23. Makishima, H. et al. Novel homo- and hemizygous mutations in EZH2 in myeloidmalignancies. Leukemia 24, 1799–1804 (2010).
24. Chapman, P. B. et al. Improved survival with vemurafenib in melanoma with BRAFV600E mutation. N. Engl. J. Med. 364, 2507–2516 (2011).
25. Kwak, E. L. et al. Anaplastic lymphoma kinase inhibition in non-small-cell lungcancer. N. Engl. J. Med. 363, 1693–1703 (2010).
26. Gui, Y. et al. Frequent mutations of chromatin remodeling genes in transitional cellcarcinoma of the bladder. Nature Genet. 43, 875–878 (2011).
27. Langmead, B., Trapnell, C., Pop, M. & Salzberg, S. L. Ultrafast and memory-efficientalignment of short DNA sequences to the human genome. Genome Biol. 10, R25(2009).
28. Zang, C. et al. A clustering approach for identification of enriched domains fromhistone modification ChIP-Seq data. Bioinformatics 25, 1952–1958 (2009).
Supplementary Information is available in the online version of the paper.
Acknowledgements We acknowledge members of GlaxoSmithKline’s PlatformTechnology and Sciences group for reagent generation and sequencing, OcimumBiosolutions for bioinformatic support, A. Anderson for statistical analysis, P. Hoffmanfor assistance with the manuscript, and all members of the Cancer EpigeneticsDiscovery Performance Unit for their guidance and support.
Author Contributions M.T.M., G.G., R.G.K., C.F.M., M.B., S.K.V. and C.L.C. designedstudies; M.T.M., H.M.O., S.K., C.T., G.S.V.A., E.D., Y.L., A.P.G., A.D.P., L.V.L., M.M., C.D., X.T.and C.F.M. performed research; M.T.M., G.G., R.G.K., A.P.G., C.F.M., S.K.V., W.H.M., D.D.,P.J.T. andC.L.C. analysed dataandM.T.M.,G.G., R.G.K., A.P.G. and C.L.C.wrote thepaper.
Author Information The gene expression data are accessible on GEO throughaccession number GSE40972 and the ChIP-seq data through accession numberGSE40970. Reprints and permissions information is available at www.nature.com/reprints. The authors declare no competing financial interests. Readers are welcome tocomment on the online version of the paper. Correspondence and requests formaterials should be addressed to C.L.C. ([email protected]).
LETTER RESEARCH
0 0 M O N T H 2 0 1 2 | V O L 0 0 0 | N A T U R E | 5
Macmillan Publishers Limited. All rights reserved©2012

METHODSDetermination of Ki
app values for GSK126 inhibition of wild-type and mutantEZH2. The five-member PRC2 complex (Flag–EZH2, EED, SUZ12, AEBP2,RbAp48) containing either wild-type or mutant (A677G, Y641N, Y641C,Y641H, Y641S or Y641F) EZH2 was prepared as previously described9. GSK126was dissolved in DMSO and tested at concentrations of 0.6 nM to 300 nM with afinal DMSO concentration of 2.5%. In contrast to wild-type EZH2 which prefersH3K27me0 as a substrate in vitro, EZH2 Y641 mutants prefer H3K27me2 andhave little activity with H3K27me0 or H3K27me1. The A677G mutant is distinctfrom both the wild-type and Y641 mutant forms of EZH2 in that it efficientlymethylates H3K27me0, H3K27me1, and H3K27me2; therefore, histone H3 pep-tides (residues 21–44; 10mM final) with either K27me0 (wild type, A677G EZH2),K27me1 (A677G EZH2), or K27me2 (A677G, Y641N, Y641C, Y641H, Y641S andY641F EZH2) were used as methyltransferase substrates. GSK126 was added toplates followed by addition of 6 nM EZH2 complex and peptide. As the potency ofGSK126 is at or near the tight binding limit of an assay run at [SAM] 5 Km, weused a method where IC50 values were measured at a high concentration of thecompetitive substrate SAM relative to its Km (7.5mM SAM where the SAM Km is0.3mM). Under these conditions, the contribution from the enzyme concentrationbecomes relatively small (see equation (1)) and accurate estimates of Ki can becalculated29. Reactions were initiated with [3H]-SAM, incubated for 30 min,quenched with the addition of 500-fold excess unlabelled SAM, and the methy-lated product peptide was captured on phosphocellulose filters according to thevendor supplied protocol for MSPH Multiscreen plates (EMD Millipore). Plateswere read on a TopCount after adding 20ml of Microscint-20 cocktail (both fromPerkinElmer). Apparent Ki values 6 s.d. were calculated using the Cheng–Prusoffrelationship30 for a competitive inhibitor (n 5 2).
IC50 5 Ki(1 1 [S]/Km) 1 [E]/2 (1)
where E is the enzyme and S is the substrate.Mechanism of GSK126 inhibition of EZH2. IC50 values were determined forGSK126 inhibition of EZH2 at several SAM concentrations ranging from 0.9mM to15mM and then separately at several peptide concentrations ranging from 16mMto 60mM using the assay conditions described above. The resulting IC50 values wereplotted against the [SAM]/Km ratio or the [peptide]/Km ratio, respectively.Cell culture and immunoblotting. Cell lines were obtained from the AmericanType Culture Collection or the Deutsche Sammlung von Mikroorganismen undZellbulturen and maintained in the recommended cell culture media at 37 uC in5% CO2. Cells were lysed with radioimmunoprecipitation (RIPA) buffer (ThermoScientific) and western blot analysis was conducted as previously described9.Antibodies were obtained as previously described9 or from Cell SignalingTechnology (SUZ12, 3737), or Santa Cruz Biotechnology (EED, sc-28701).H3K27 methylation status and PRC2 components following GSK126 treat-ment. Cells (2 3 105 per well) were seeded into six-well tissue culture plates in theappropriate cell culture media 24 h before treatment. Cells were then exposed to0.1% DMSO or varying concentrations of GSK126 (range 5 25 nM–2mM) for 24,72 or 144 h.Enzyme-linked immunosorbent assay (ELISA)-based quantification of totalhistone H3 and H3K27me3 levels. Following tissue homogenization, tumourtissue lysates were prepared using the Epigentek Histone Extraction kit (OP-0006). Alternatively, cells were seeded at 2,000 cells per well in a 96-well plateand were treated with a 10-point threefold dilution series of GSK126 (doserange 5 2 nM–38mM) for 48 h. Cells were lysed with 0.2 N HCl for 30 min toextract histones, the acid-insoluble portion was pelleted by centrifugation, andthe supernatant was neutralized with neutralization buffer (1 M Na2HPO4,pH 12.5; ActiveMotif) containing protease inhibitors (Roche). Lysates were addedto Maxisorp ELISA plates (Nunc) in duplicate on each of two plates plus blockingbuffer (1% BSA). Plates were incubated for 1 h, washed four times with imidazolebuffered saline containing Tween-20 (Kirkegaard & Perry Laboratories), incu-bated with primary antibodies for H3K27me3 or total H3, washed, incubated withhorseradish peroxidase (HRP)-linked secondary anti-rabbit IgG antibody, andwashed again. Luminata Forte substrate (Millipore) was added 5 min beforechemiluminescence was quantified with an EnVision multi-label plate reader(PerkinElmer). H3K27me3 levels were normalized to total H3 values and IC50
values were determined using a four-parameter curve fit.Cell proliferation assay. The optimal cell seeding was determined empirically forall cell lines by examining the growth of a wide range of seeding densities in a384-well format to identify conditions that permitted proliferation for 6 days.Cells were then plated at the optimal seeding density 24 h before treatment (induplicate) with a 20-point twofold dilution series of GSK126 or 0.15% DMSO.Plates were incubated for 6 days at 37uC in 5% CO2. Cells were then lysed with
CellTiter-Glo (CTG) (Promega) and chemiluminescent signal was detected with aTECAN Safire2 microplate reader. In addition, an untreated plate of cells washarvested at the time of compound addition (T0) to quantify the starting numberof cells. CTG values obtained after the 6 day treatment were expressed as a percentof the T0 value and plotted against compound concentration. Data were fit with afour-parameter equation to generate a concentration response curve and theconcentration of GSK126 required to inhibit 50% of growth (growth IC50) wasdetermined.Caspase 3/7 assay. For detection of caspase-3/7 activity, cells were cultured in 96-well plates, treated with a 10-point threefold dilution series of GSK126 (range0.03 nM to 5mM) and evaluated using Caspase-Glo 3/7 (Promega) as per themanufacturer’s instructions. Values were normalized to CTG (Promega) levelsat each time point and expressed as a percentage of vehicle treated control. Datarepresent an average of n 5 4.Cell cycle analysis. Cell cycle phase distribution was examined by flow cytometry.Twenty-four hours after seeding cells in a six-well culture plate, cells were treatedwith GSK126 or 0.1% DMSO (vehicle) for 3 days. Cells were washed with PBS,pelleted in CycleTest solution B (BD Biosciences, catalogue no. 340242b), flashfrozen, and stored at 280 uC. CycleTest PLUS DNA reagent kit (BD Biosciences,catalogue no. 340242) was used according to the manufacturer’s instructions toprepare and stain nuclei with propidium iodide. Samples were evaluated using aFACSCalibur flow cytometer (BD Biosciences) and data were analysed usingFlowJo software (Tree Star).Gene expression profiling. Cells (2 3 105 per well) were seeded into six-welltissue culture plates in the appropriate cell culture media 24 h before treatment.Duplicate wells were then exposed to 0.1% DMSO, 500 nM or 2mM GSK126 for72 h. Cells were collected into TRIzol reagent (Invitrogen) and total RNA wasisolated via phenol:chloroform extraction and the RNeasy kit (Qiagen) accordingto the manufacturer’s instructions. Total RNA was labelled and hybridized toAffymetrix Human Genome U133 Plus 2.0 oligonucleotide microarrays arraysaccording to the manufacturer’s instructions (Affymetrix) at Expression Analysis,Inc. These data are accessible through GEO via accession number GSE40972.Principal component and correlation analysis were used to confirm data repro-ducibility (Supplementary Fig. 16).Affymetrix gene chip data analysis. CEL files, corresponding to individual sam-ples, were processed by the Micro Array Suite 5.0 (MAS5) algorithm (http://www.affymetrix.com/support/index.affx) where signal values were scaled to atarget intensity of 500 and log2 transformed. Differentially expressed probe setswere determined by fitting the data to a linear model and carrying out pair-wisecontrasts of treated versus control. Significant probe sets were filtered for detection(log2 signal threshold of 8), an average fold-change .2 or ,22, or .1.5 or,21.5, where indicated, with P-values adjusted for multiple testing correctionby false discovery rate (FDR) (Benjamini–Hochberg) , 0.1. Statistical analyseswere performed using the limma package from Bioconductor (http://www.bio-conductor.org/). Functional analyses of differentially expressed probe sets wereperformed using DAVID (http://david.abcc.ncifcrf.gov/). Significantly over-represented GO Biological Process and Molecular Function terms (levels 3–5)were filtered for EASE P-value , 0.01.qRT–PCR. Cells were treated for 72 h with 0.1% DMSO or a range of concentra-tions of GSK126 (range 5 25 nM–1mM) and total RNA was isolated as describedabove. RNA (2.8mg) was reverse transcribed with MultiScribe ReverseTranscriptase (Applied BioSystems) according to the manufacturer’s recommen-dations. The resulting cDNA was diluted and used along with TaqMan geneexpression assays (Applied Biosystems; GAPDH, Hs03929097_g1; TNFRSF21,Hs00205419_m1; TXNIP, Hs00197750_m1). TaqMan Gene Expression MasterMix (Applied BioSystems) and a ViiA 7 Real-Time PCR System (AppliedBioSystems) were used according to the manufacturer’s recommendations toquantify gene expression.ChIP-seq. Cells (5 3 107) were maintained in the appropriate cell culture mediafor 24 h before fixation. Cells were fixed for 15 min at room temperature withfreshly prepared formaldehyde solution (final concentrations 1% formaldehyde,10 mM NaCl, 0.1 mM EDTA pH 8.0, 5 mM HEPES pH 7.9) followed by the addi-tion of glycine to 125 mM. Fixed cells were rinsed twice in PBS containing 0.5%Igepal CA-630 (Sigma) and cell pellets were flash frozen. ChIP assays were per-formed using a custom assay protocol at Active Motif Inc. H3K27me3 ChIP andinput libraries were prepared for 35 nucleotide single-end sequencing on anIllumina GAIIx sequencer according to manufacturer’s instructions. These dataare accessible through GEO via accession number GSE40970. Reads were assessedfor quality (base quality ,20 were excluded) and aligned to human referencesequence (hg19 build) using the Bowtie27 algorithm allowing for up to two mis-matches. Only uniquely mapped reads were used for subsequent analyses.ChIP-seq analysis. The average basal H3K27me3 ChIP-seq tag count was quan-tified across genes that were upregulated, downregulated or unchanged following
RESEARCH LETTER
Macmillan Publishers Limited. All rights reserved©2012

treatment with GSK126 using a custom PERL script. In addition to the gene body, aregion encompassing 10 kilobases (kb) upstream of the transcription initiation siteand 10 kb downstream of the transcription termination site were evaluated. All geneswere oriented by strand, and the variable length of gene bodies were standardized to10,000 bins. After averaging the numbers of sequence tags at each base pair the valueswere normalized to the total number of mapped sequence tags per ChIP. A 500 basepair (bp) centred moving average was then applied to highlight larger trends andsmooth out short-range fluctuations. MultiExperiment Viewer (http://www.tm4.org/mev/) was used to evaluate enrichment across individual genes. Peaks of H3K27me3enrichment were identified using the peak calling software SICER28 with the followingparameters: fragment size, 250 bp; effective genome size fraction, 0.86; window size,750 bp; gap size, 3; redundancy threshold, 1; FDR, 0.001. Statistically significant peaks(FDR , 0.001) enriched in the ChIP sample relative to its corresponding inputsample were annotated for genomic location and were assigned to genes within610 kb from transcription start site (TSS) to identify target genes: upstream (210to 2.5 kb relative to TSS), promoter (22.5 kb to 12.5 kb), 59UTR, coding region,39UTR. All genes were considered in the 59R39 orientation. Bedtools was used formanipulation and analysis of data and IGV (http://www.broadinstitute.org/igv/) wasused for visualization. Annotation files were downloaded from UCSC.RNA isolation from tumour xenografts. QIAzol (300ml per mg tumour) (Qiagen)was added to tumour xenograft tissue. The tumour was lysed and homogenizedusing the Qiagen TissueLyzer and stainless steel beads. Chloroform was added tothe QIAzol lysate. The QIAzol/chloroform homogenate was then added to a QiagenMaXtract High Density tube (Qiagen). The aqueous phase was transferred to a freshtube and mixed with an equal volume of 70% ethanol and applied to a QiagenRNeasy column (Qiagen). The remaining RNA isolation was carried out accordingto the manufacturer’s protocol.In vivo studies. All studies were conducted after review by the InstitutionalAnimal Care and Use Committee at GSK and in accordance with the GSK
Policy on the Care, Welfare and Treatment of Laboratory Animals. For all in vivostudies, GSK126 or vehicle was administered intraperitoneally at a dose volume of0.2 ml per 20 g body weight in 20% captisol adjusted to pH 4–4.5 with 1 N aceticacid. Pfeiffer or KARPAS-422 cells (1 3 107) in 100% Matrigel (BD Biosciences)were implanted subcutaneously in female beige SCID mice. Tumours were mea-sured with calipers, and block randomized according to tumour size into treat-ment groups. For efficacy studies, 10 mice were randomized in each treatmentgroup before the initiation of dosing and GSK126 treatment was initiated once thetumour volumes were approximately 200 mm3 in the Pfeiffer and KARPAS-422studies (Fig. 4c and Supplementary Fig. 14a) and 500 mm3 in the KARPAS-422intermittent dosing study (Supplementary Fig. 14b). Mice were weighed andtumours measured with calipers twice weekly. Two-tailed t-tests were conductedassuming two samples of equal variance. For mouse pharmacokinetic studies,tumour and blood samples were harvested from euthanized mice at the indicatedtime. Blood and tumour homogenates were flash frozen and subsequently ana-lysed by HPLC/MS/MS to evaluate the concentration of GSK126. For pharmaco-dynamic studies, a portion of each tumour was frozen for H3K27me3/H3 ELISAsor placed in RNAlater (Ambion) for RNA isolation. For peripheral blood analyses,blood was harvested via cardiac puncture from euthanized, immunocompetentfemale CD-1 mice (three mice per group) on day 18. Blood was immediatelyplaced into a Microtainer EDTA tube (BD) and gently mixed by inverting. Acomplete blood count analysis was conducted using the Advia 2120 haematologyanalyser (Siemens Medical Solutions) using multi-species software as per manu-facturer’s instructions.
29. Tornheim, K. Kinetic applications using high substrate and competitive inhibitorconcentrations to determine Ki or Km. Anal. Biochem. 221, 53–56 (1994).
30. Yung-Chi, C. & Prusoff, W. H. Relationship between the inhibition constant (K1)and the concentration of inhibitor which causes 50 per cent inhibition (I50) of anenzymatic reaction. Biochem. Pharmacol. 22, 3099–3108 (1973).
LETTER RESEARCH
Macmillan Publishers Limited. All rights reserved©2012

W W W. N A T U R E . C O M / N A T U R E | 1
SUPPLEMENTARY INFORMATIONdoi:10.1038/nature11606
Supplementary Figure 1.
a b
Supplementary Figure 1 | Mechanism of EZH2 inhibition. a The potency of GSK126 is near the concentration of EZH2 used inthe assays; therefore, standard mechanism of inhibition determination through double titration of inhibitor and substrate followedby global fitting of the data is precluded. Instead, the IC50 values of GSK126 determined at several SAM concentrations (0.9 μM -15 μM) were plotted against the [SAM]/Km ratio. The data were fit to models of competitive, uncompetitive, and non-competitiveinhibition and were best fit by a competitive model as determined by F-test analysis. b A similar experiment was performed usingthe peptide substrate over a range of peptide concentrations (16 µM - 60 µM). The inhibitor mechanism using peptide is best fit toa non-competitive model as determined by F-test analysis.

SUPPLEMENTARY INFORMATION
2 | W W W. N A T U R E . C O M / N A T U R E
RESEARCH
c
Supplementary Figure 2.
b d
a
Supplementary Figure 2 | Homology model of EZH2 and predicted binding mode of GSK126. a A homology model of EZH2 andpredicted binding mode of GSK126. GSK126 (green carbons) bound in the SAM binding site is overlaid with SAH (orangecarbons). The H3K27me2 peptide substrate (yellow), the SET domain (grey ribbon) and the post-SET domain (cyan ribbon) andthe residue differences between EZH2 and EZH1 within 10 Å of the predicted binding mode of GSK126 (magenta) are indicated. bA zoomed in view of the binding mode of GSK126 is depicted. Specific hydrogen bond and arene-H interactions are representedas dashed magenta and cyan lines, respectively. The binding site surface contributed by residues from the post-SET domain iscolored cyan. c A 2D ligand interaction diagram highlighting specific interactions between residues of EZH2 and GSK126. dDiagram of EZH2 functional domains (UniProt Q15910) with the position of the A677 and Y641 activating mutations highlightedwithin the SET domain.

W W W. N A T U R E . C O M / N A T U R E | 3
SUPPLEMENTARY INFORMATION RESEARCH
Supplementary Figure 3.
Supplementary Figure 3 | Analysis of H3K27 methylation in cell lines treated with GSK126. a Comparison of global H3K27me3,H3K27me2, and H3K27me1 levels across EZH2 WT (Toledo and SU-DHL-8) and mutant (Pfeiffer and KARPAS-422) lymphomacell lines. b Potency of GSK126 over time as measured by reduction of global H3K27me3 levels in KARPAS-422, Pfeiffer, andSU-DHL-8 B-cell lymphoma cell lines. Cells were treated with a 3-fold dilution series of GSK126. The concentration of GSK126required to reduce H3K27me3 levels by 50% (H3K27me3 IC50) was determined by ELISA (n≥2; mean values ± s.d. are shown). cEvaluation of H3K27me3, H3K27me2, and H3K27me1 following treatment for 72 hours. Total histone H3 is shown as a loadingcontrol.
a b
c
1
10
100
1,000
10,000
24 48 72 24 48 72 24 48 72
H3K
27m
e3 IC
50(n
M)
hours
KARPAS-422 Pfeiffer SU-DHL-8

SUPPLEMENTARY INFORMATION
4 | W W W. N A T U R E . C O M / N A T U R E
RESEARCH
Pfeiffer (A677G)
EED
Actin
SUZ12
EZH2
KARPAS-422 (Y641N)
SU-DHL-8 (WT) Toledo (WT)
EED
Actin
SUZ12
EZH2
a b
c d
DMSO
25nM
150n
M
500n
M
2μM
GSK126
DMSO
25nM
150n
M
500n
M
2μM
GSK126
DMSO
25nM
150n
M
500n
M
2μM
GSK126
DMSO
25nM
150n
M
500n
M
2μM
GSK126
EED
Actin
SUZ12
EZH2
EED
Actin
SUZ12
EZH2
Supplementary Figure 4.
Supplementary Figure 4 | Western blot analysis of EZH2, SUZ12, and EED following treatment of EZH2 mutant (a,b) or WT (c,d)lymphoma cell lines with 0.1% DMSO (vehicle control), 25 nM, 150 nM, 500 nM, or 2 µM GSK126 for 72 hrs. Actin is included as aloading control.
W W W. N A T U R E . C O M / N A T U R E | 5
SUPPLEMENTARY INFORMATION RESEARCH
Supplementary Figure 5.
0.1 1 10 100 1000 10000
0
10
20
30
40
50
60
70
80
90
100
PfeifferWSU-DLCL2KARPAS-422SU-DHL-10HTSU-DHL-6DBOCI-Ly-19FarageSU-DHL-5U-2932SU-DHL-8U-2940RLSU-DHL-4WILL-1ToledoWILL-2
% g
row
th
GSK126 (nM)
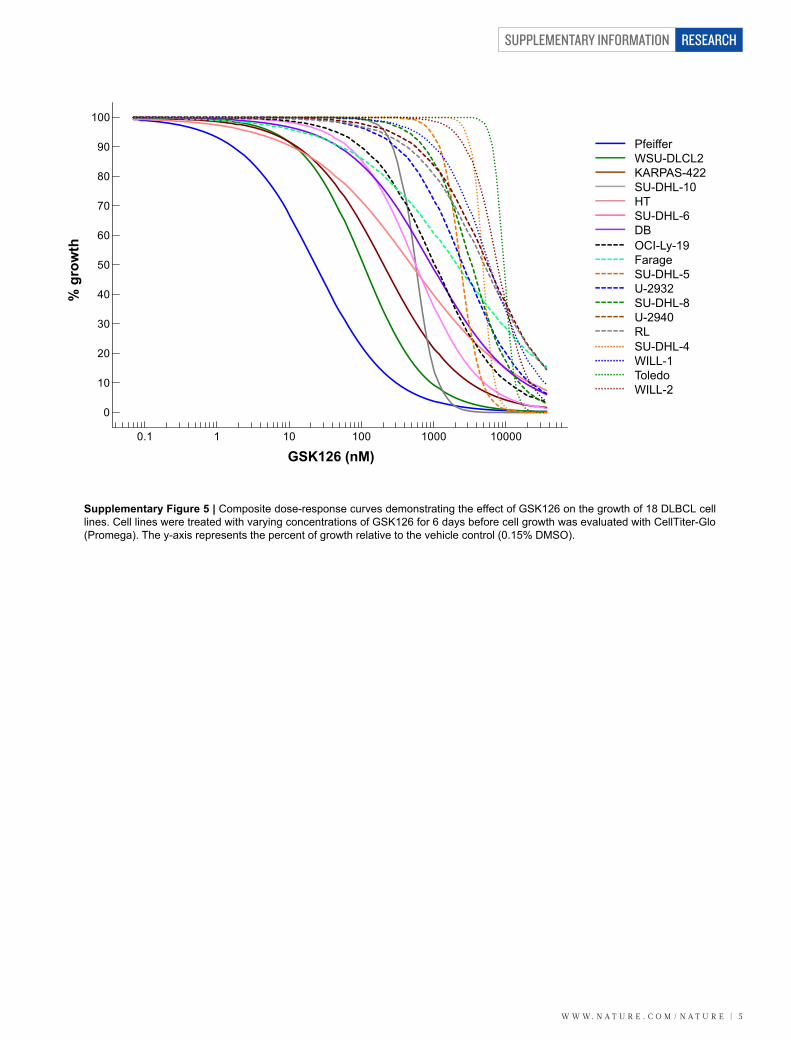
Supplementary Figure 5 | Composite dose-response curves demonstrating the effect of GSK126 on the growth of 18 DLBCL celllines. Cell lines were treated with varying concentrations of GSK126 for 6 days before cell growth was evaluated with CellTiter-Glo(Promega). The y-axis represents the percent of growth relative to the vehicle control (0.15% DMSO).

SUPPLEMENTARY INFORMATION
6 | W W W. N A T U R E . C O M / N A T U R E
RESEARCH
EZH2
Supplementary Figure 6.
b
c
Actin
a
Supplementary Figure 6 | Correlation analysis between inhibition of H3K27me3, cell growth and EZH2 levels. a Cell growth IC50values for GSK126 from Supplementary Table 5 plotted against H3K27me3 IC50 values for GSK126 from Figure 1c. Pearsoncorrelation value is indicated. b A representative western blot of EZH2 and actin from whole cell extracts of lymphoma cell lines.Western blot signal intensities for EZH2 and actin were quantified using Li-Cor Odyssey software. c EZH2 signal intensities werenormalized for total actin levels and plotted against cell growth IC50 values for GSK126 in a 6-day proliferation assay fromSupplementary Table 5.
10
100
1,000
10,000
0 100 200 300
Gro
wth
IC50
(nM
)
EZH2 protein

W W W. N A T U R E . C O M / N A T U R E | 7
SUPPLEMENTARY INFORMATION RESEARCH
a
b
Supplementary Figure 7.
c
Supplementary Figure 7 | Phenotypic effects of EZH2 knockdown by shRNA. a Cell proliferation over a 6 day period forKARPAS-422 (left) and Pfeiffer (right) expressing an shRNA to EZH2 (blue) or a non-targeting control shRNA (orange). CTGsignal at each time point is represented as a percentage of cells at day 0 (T0). b Caspase 3/7 activity over time in KARPAS-422(left) and Pfeiffer (right) expressing an shRNA to EZH2 (blue) or a non-targeting control shRNA (orange). Caspase 3/7 activity ateach time point is represented as a percentage of activity at day 0 (T0). c Western blot analysis of EZH2, H3K27me3, H3K27me2,H3K27me1, and total histone H3 following shRNA knockdown of EZH2. Actin is included as a loading control.

SUPPLEMENTARY INFORMATION
8 | W W W. N A T U R E . C O M / N A T U R E
RESEARCH
Supplementary Figure 8.
d
ab
Pfeiffern=730
WSU-DLCL2n=783
KARPAS-422n=1059
SU-DHL-10n=524
SU-DHL-6n=288
- - + + - - + + - - + + - - + + - - + +
- Vehicle + 500 nM GSK126
c
10
100
1,000
10,000
0200400600800
1,0001,2001,4001,6001,8002,0002,2002,400
growth IC
50 (nM)
Num
ber o
f pro
be s
ets
Mutant EZH2WT EZH2
UpregulatedDownregulatedGrowth IC50
Supplementary Figure 8 | Expression analysis of DLBCL cell lines. a Gene expression heatmaps of normalized gene expressiondata for differentially expressed probe sets following treatment with GSK126 for 72 hours. Green, lower expression. Red, higherexpression. b The number of probe sets exhibiting significantly altered gene expression (>1.5 or < -1.5 fold) following treatment of10 DLBCL cell lines in duplicate for 72 hours with 500 nM GSK126 compared with 0.1% DMSO (vehicle control). c Correlationbetween the number of up-regulated probe sets and basal H3K27me3 levels in transcriptionally responsive and unresponsivemutant EZH2 DLBCL cell lines (Pfeiffer,WSU-DLCL2, KARPAS-422, SU-DHL-10, DB, and SU-DHL-4). H3K27me3 levels arenormalized to total histone H3 and are expressed as a percentage of those levels observed in the Pfeiffer cell line.Transcriptionally responsive and unresponsive cell lines are circled in red and blue, respectively. d The number of common probesets within indicated cell lines exhibiting a 1.5 or 2-fold increase in expression with GSK126 treatment.

W W W. N A T U R E . C O M / N A T U R E | 9
SUPPLEMENTARY INFORMATION RESEARCH
Supplementary Figure 9.
Supplementary Figure 9 | Comparison of gene expression changes elicited by EZH2 knockdown versus treatment with GSK126in KARPAS-422. a Gene expression profiling was performed in KARPAS-422 cells treated with control shRNA or EZH2-specificshRNA for 10 days or with vehicle control or 500 nM GSK126 for 3 days. The heatmap represents unsupervised hierarchicalclustering of normalized gene expression data for 1,778 probe sets that were significantly changed with either EZH2 knockdown orEZH2 inhibition. Green, lower expression. Red, higher expression. Differentially-regulated probe sets are included inSupplementary Table 6. b Venn diagram depicting the overlap of gene expression changes meeting criteria for significant up-regulation (FDR adjusted p-value < 0.1, > 2-fold change). Among the 393 probe sets that changed > 2-fold with GSK126 treatmentbut not with EZH2 knockdown, 185 were up-regulated ≥ 1.5-fold with shEZH2. c To determine the extent to which each class ofgenes identified in b was enriched for EZH2 target genes, H3K27me3 enrichment was evaluated using ChIP-Seq data fromKARPAS-422 cells. Both commonly up-regulated and GSK126 only up-regulated gene sets were enriched above the “All”transcripts background; however, shEZH2 only up-regulated genes were not, suggesting that they represent off-target effects ofthe shRNA or secondary gene expression changes due to the longer treatment duration required for stable knockdown.
a b
c
shEZH2 GSK126

SUPPLEMENTARY INFORMATION
1 0 | W W W. N A T U R E . C O M / N A T U R E
RESEARCH
Supplementary Figure 10.
Supplementary Figure 10 | Comparison of gene expression changes elicited by EZH2 knockdown versus treatment with GSK126in Pfeiffer. a Gene expression profiling was performed in Pfeiffer cells treated with control shRNA or EZH2-specific shRNA for 10days or with vehicle control or 500 nM GSK126 for 3 days. The heatmap represents unsupervised hierarchical clustering ofnormalized gene expression data for probe sets that were significantly changed with either EZH2 knockdown or EZH2 inhibition.Green, lower expression. Red, higher expression. Differentially-regulated probe sets are included in Supplementary Table 6. bVenn diagram depicting the overlap of gene expression changes meeting criteria for significant up-regulation (FDR adjusted p-value < 0.1, > 2-fold change). Among the 493 probe sets that changed > 2-fold with GSK126 treatment but not with EZH2knockdown, 165 were up-regulated ≥ 1.5-fold with shEZH2. c To determine the extent to which each class of genes identified in bwas enriched for EZH2 target genes, H3K27me3 enrichment was evaluated using ChIP-Seq data from Pfeiffer cells. Bothcommonly up-regulated and “GSK126 unique” up-regulated gene sets were enriched above the “All” transcripts background;however, “shEZH2 Unique” up-regulated genes were not, suggesting that they represent off-target effects of the shRNA orsecondary gene expression changes due to the longer treatment duration required for stable knockdown.
a b
c
shEZH2 GSK126

W W W. N A T U R E . C O M / N A T U R E | 1 1
SUPPLEMENTARY INFORMATION RESEARCH
Supplementary Figure 11.
Supplementary Figure 11 | Genes up-regulated in response to GSK126 are enriched for H3K27me3. Probe sets that weresignificantly up-regulated, down-regulated, or unchanged identified in Pfeiffer, WSU-DLCL2, and KARPAS-422 cells following 72hours with 500 nM GSK126 were mapped to individual genes and H3K27me3 enrichment determined for each gene and ±10kbfrom H3K27me3 ChIP-seq data. Relative H3K27me3 enrichment is represented as a white to red gradient with white representingno enrichment and red representing the highest enrichment. Each row represents a unique gene.
Pfeiffer
WSU-DLCL2
KARPAS-422
Upregulated Downregulated No Change
Gene-10kb +10kb
Gene-10kb +10kb
Gene-10kb +10kb

SUPPLEMENTARY INFORMATION
1 2 | W W W. N A T U R E . C O M / N A T U R E
RESEARCH
Supplementary Figure 12.a
b
Supplementary Figure 12 | Gene ontology enrichment analysis. a GO enrichment analysis for probe sets significantly up-regulated with 500 nM GSK126 in Pfeiffer, WSU-DLCL2, KARPAS-422, SU-DHL-10, or SU-DHL-6. b GO enrichment analysis forprobe sets either significantly up- or down-regulated with 500 nM GSK126 in Pfeiffer, WSU-DLCL2, KARPAS-422, SU-DHL-10, orSU-DHL-6. Over-represented biological process and molecular function terms were filtered for p-value < 0.01 (dashed lines), atleast 5 genes per term, and those that were common across ≥ 3 cell lines.
0 1 2 3 4 5
neg reg of nitrogen cmpd metabolic processintracellular signaling cascade
transcription factor bindingregulation of developmental processregulation of programmed cell death
regulation of apoptosistranscription corepressor activity
cell cycle arrestregulation of cellular process
negative regulation of biological processnegative regulation of cellular process
-log10 (p-value)
PfeifferWSU-DLCL2KARPAS-422SU-DHL-10SU-DHL-6
0 1 2 3 4 5
intracellular signaling cascade
actin binding
programmed cell death
regulation of cellular process
apoptosis
negative regulation of cellular process
negative regulation of biological process
-log10 (p-value)
PfeifferWSU-DLCL2KARPAS-422SU-DHL-10SU-DHL-6

W W W. N A T U R E . C O M / N A T U R E | 1 3
SUPPLEMENTARY INFORMATION RESEARCH
Supplementary Figure 13.
1
10
100
1000
10000
100000
0 240 480 720 960 1200 1440
Con
cent
ratio
n(n
g/m
l Blo
od, n
g/g
Tum
or)
Time (min)
BloodTumor
AUC0-1440(ng*h/mL blood or
ng*h/g tumor)
Ratio (tumor AUC/Blood AUC)
Cmax(ng/mL blood,
ng/g tumor)Tmax (min)
Blood 53189 N/A 37667 ± 15040 15
Tumor 19251 0.4 1678 ± 211 60
a
b
Supplementary Figure 13 | Pharmacokinetic analysis of GSK126. a Blood and tumor distribution following intraperitonealadministration of 50 mg per kg GSK126 to female beige SCID mice bearing Pfeiffer xenografts. Three mice were evaluated ateach time point. b Area under the curve (AUC0-1440), tumor/blood AUC ratio, maximum concentration achieved (Cmax), and time ofmaximum concentration (Tmax) for the data presented in a. N/A, not applicable.

SUPPLEMENTARY INFORMATION
1 4 | W W W. N A T U R E . C O M / N A T U R E
RESEARCH
Supplementary Figure 14 | GSK126 inhibits tumor growth in vivo. a Efficacy of GSK126 on the growth of subcutaneous Pfeiffer xenografts. b Efficacy of intermittent dosing of GSK126 on the growth of subcutaneous KARPAS-422 xenografts with or without a 1 week drug holiday. Values are the mean tumor volume ± standard error (n=10). P values were calculated using a nonparametric log-rank test comparing vehicle and each treatment group.
a
GSK126 Dosing
Pfeiffer KARPAS-422
GSK126 Dosing
b
Supplementary Figure 14.
P = 0.0024P = 0.0008P = 0.0008P = 0.0015
P = 0.021
P = 3 x 10⁻⁶
0
500
1,000
1,500
2,000
2,500
3,000
0 10 20 30 40
Tum
or V
olum
e (m
m3 )
Study Day
vehicle15 mg per kg once daily50 mg per kg once daily
0
500
1,000
1,500
2,000
2,500
3,000
0 10 20 30 40
Tum
or V
olum
e (m
m3)
Study Day
vehicle150 mg per kg twice per week (5 wks)100 mg per kg thrice per week (5 wks) 150 mg per kg twice per week (2wks on/1wk off/2wks on)100 mg per kg thrice per week (2wks on/1wk off/2wks on)

W W W. N A T U R E . C O M / N A T U R E | 1 5
SUPPLEMENTARY INFORMATION RESEARCH
Supplementary Figure 15.a b
cd
70%
80%
90%
100%
110%
120%
130%
0 10 20 30 40
Bod
y W
eigh
t
Study Day
vehicle15 mg per kg once daily50 mg per kg once daily
70%
80%
90%
100%
110%
120%
0 10 20 30 40
Bod
y W
eigh
t
Study Day
vehicle150 mg per kg twice per week (5 wks)100 mg per kg thrice per week (5 wks) 150 mg per kg twice per week (2wks on/1wk off/2wks on)100 mg per kg thrice per week (2wks on/1wk off/2wks on)
70%
80%
90%
100%
110%
120%
130%
0 10 20 30 40
Bod
y W
eigh
t
Study Day
vehicle50 mg per kg once daily150 mg per kg once daily300 mg per kg twice per week
0.001
0.010
0.100
1.000
10.000
100.000
Valu
esVehicle150 mg per kg twice per week300 mg per kg twice per week
Supplementary Figure 15 | Effect of GSK126 on body weight and peripheral blood. a-c Average body weight measurements ofmice bearing Pfeiffer (a) or KARPAS-422 (b,c) subcutaneous xenografts during treatment with vehicle or GSK126. Values arerepresented as a percentage of the average weight at the start of dosing. d Complete blood count analysis of CD-1 mice followingtwice weekly dosing over 18 days. RBC, red blood cells (x106 cells/µl); HGB, hemoglobin (g/dl); HCT, hematocrit (percent); MCV,mean corpuscle volume (fl); MCH, mean corpuscle hemoglobin (pg); MCHC, mean corpuscle hemoglobin concentration (g/dl);PLT, platelets (x105 platelets/µl); WBC, white blood cells (x103 cells/µl); NEUT, neutrophils (x103 cells/µl); LYMPH, lymphocytes(x103 cells/µl); MONO, monocytes (x103 cells/µl); EOS, eosinophils (x103 cells/µl); BASO, basophils (x103 cells/µl); LEUK,leukocytes (x103 cells/µl).

SUPPLEMENTARY INFORMATION
1 6 | W W W. N A T U R E . C O M / N A T U R E
RESEARCHSupplementary Figure 16.
Supplementary Figure 16 | Principal component and correlation analysis of gene expression profiling data. a PCA plot of datafrom biological replicates of 10 DLBCL cell lines treated for 72 hours with vehicle or 500 nM GSK126. b Correlation of biologicalreplicates of DLBCL cell lines with robust transcriptional changes. K, KARPAS-422; P, Pfeiffer; W, WSU-DLCL2; S10, SU-DHL-10; S6, SU-DHL-6.
-150 -100 -50 0 50 100 150 200
Comp.1 [12.50%]
-100
-50
0
50
100
150
200
Co
mp
.2 [1
0.0
4%
]
Color by Cell line
Pfeiffer
WSU-DLCL2
KARPAS-422
SU-DHL-10
HT
SU-DHL-6
DB
OCI-LY-19
SU-DHL-4
Toledo
Shape by Treatment
vehicle
500 nM
a b
-vehicle + 500 nM GSK126

W W W. N A T U R E . C O M / N A T U R E | 1 7
SUPPLEMENTARY INFORMATION RESEARCHSupplementary Figure 17.
Supplementary Figure 17 | 1H-NMR spectral image of GSK126. Spectra were recorded at 400 MHz.

SUPPLEMENTARY INFORMATION
1 8 | W W W. N A T U R E . C O M / N A T U R E
RESEARCH
Supplementary Figure 18.
Supplementary Figure 18 | 13C-NMR spectral image of GSK126. Spectra were recorded at 100 MHz.

W W W. N A T U R E . C O M / N A T U R E | 1 9
SUPPLEMENTARY INFORMATION RESEARCH
Supplementary Methods Chemistry The following abbreviations are used throughout the experimental and have the following meaning:
aq aqueous
BINAP 2,2’ –bis(diphenylphosphino) –1,1’-binapthyl
ca. circa
CDCl3-d chloroform-d
CD3OD-d4 methanol-d4
Cs2CO3 cesium carbonate
CHCl3 chloroform
ACN acetonitrile
CH3CN acetonitrile
Celite® registered trademark of Celite Corp. brand of diatomaceous earth
DBU 1,8-diazabicyclo[5.4.0]undeca-7-ene
DCE dichloroethane
DCM methylene chloride
DME 1,2 dimethoxyethane
DMF N,N-dimethylformamide
DIEA diisopropyl ethylamine
DMSO-d6 dimethylsulfoxide-d6
EtOAc ethyl acetate
EDC 1-(3-dimethylaminopropyl)-3-ethylcarbodimmide hydrochloride
h hour(s) 1H NMR proton nuclear magnetic resonance
HCl hydrochloric acid
HOAT 1-hydroxy-7-azabenzotriazole
HPLC high performance liquid chromatography
IPA 2-propanol
K2CO3 potassium carbonate
KOH potassium hydroxide
LC/MS liquid chromatography/mass spectroscopy
MgSO4 magnesium sulfate
MeOH methanol
min minute(s)
MTBE methyl tert-butyl ether
MS mass spectrometry
NaOH sodium hydroxide

SUPPLEMENTARY INFORMATION
2 0 | W W W. N A T U R E . C O M / N A T U R E
RESEARCH
Na2SO4 sodium sulfate
NH4OH ammonium hydroxide
NMM 4-methylmorpholine
NMP N-Methyl-2-pyrrolidone
Pd/C Palladium (10% by wt) on carbon
PdCl2(dppf)-CH2Cl2 1,1'-Bis(diphenylphosphino)ferrocene-palladium(II)dichloride dichloromethane
complex
Pd(Ph3P)4 tetrakis(triphenylphosphine)palladium(0)
RT room temperature
SOCl2 thionyl chloride
SPhos 2-Dicyclohexylphosphino-2',6'-dimethoxybiphenyl
TFA trifluoroacetic acd
THF tetrahydrofuran
TLC thin layer chromatography
The following guidelines apply to all chemistry experimental procedures described herein. All reactions
were conducted under a positive pressure of nitrogen using oven-dried glassware, unless otherwise
indicated. Temperatures designated are external (i.e. bath temperatures), and are approximate. Air and
moisture-sensitive liquids were transferred via syringe. Reagents were used as received, and sources for
lesser known commercially available reagents are listed. Solvents utilized were those listed as
“anhydrous” by vendors. Molarities listed for reagents in solutions are approximate, and were used
without prior titration against a corresponding standard. All reactions were agitated by stir bar, unless
otherwise indicated. Heating was conducted using heating baths containing silicon oil, unless otherwise
indicated. Reactions conducted by microwave irradiation (0 – 400 W at 2.45 GHz) were done so using a
Biotage InitiatorTM 2.0 instrument with Biotage microwave EXP vials (0.2 – 20 mL) and septa and caps.
Irradiation levels utilized (i.e. high, normal, low) based on solvent and ionic charge were based on vendor
specifications. Cooling to temperatures below -70 °C was conducted using dry ice/acetone or dry ice/2-
propanol. Magnesium sulfate and sodium sulfate used as drying agents were of anhydrous grade, and
were used interchangeably. Solvents described as being removed “in vacuo” or “under reduced
pressure” were done so by rotary evaporation.
Preparative normal phase silica gel chromatography was carried out using either a Teledyne ISCO
CombiFlash Companion instrument with RediSep or ISCO Gold silica gel cartridges (4 g-330 g), or an
Analogix IF280 instrument with SF25 silica gel cartridges (4 g – 3-00g), or a Biotage SP1 instrument with
HP silica gel cartridges (10g – 100 g). Purification by reverse phase HPLC was conducted using a YMC-
pack column (ODS-A 75x30mm) as solid phase, unless otherwise noted. A mobile phase of 25mL/min A

W W W. N A T U R E . C O M / N A T U R E | 2 1
SUPPLEMENTARY INFORMATION RESEARCH
(acetonitrile-0.1%TFA): B (water-0.1% TFA), 10-80% gradient A (10 min) was utilized with UV detection at
214 nM, unless otherwise noted.
A PE Sciex API 150 single quadrupole mass spectrometer (PE Sciex, Thornhill, Ontario, Canada) was
operated using electrospray ionization in the positive ion detection mode. The nebulizing gas was
generated from a zero air generator (Balston Inc., Haverhill, MA, USA) and delivered at 65 psi and the
curtain gas was high purity nitrogen delivered from a Dewar liquid nitrogen vessel at 50 psi. The voltage
applied to the electrospray needle was 4.8 kV. The orifice was set at 25 V and mass spectrometer was
scanned at a rate of 0.5 scan/sec using a step mass of 0.2 amu and collecting profile data.
Method A LCMS. Samples were introduced into the mass spectrometer using a CTC PAL autosampler
(LEAP Technologies, Carrboro, NC) equipped with a hamilton 10 uL syringe which performed the
injection into a Valco 10-port injection valve. The HPLC pump was a Shimadzu LC-10ADvp (Shimadzu
Scientific Instruments, Columbia, MD) operated at 0.3 mL/min and a linear gradient 4.5% A to 90% B in
3.2 min. with a 0.4 min. hold. The mobile phase was composed of 100% (H2O 0.02% TFA) in vessel A
and 100% (CH3CN 0.018% TFA) in vessel B. The stationary phase is Aquasil (C18) and the column
dimensions were 1 mm x 40 mm. Detection was by UV at 214 nm, evaporative light-scattering (ELSD)
and MS.
Method B, LCMS. Alternatively, an Agilent 1100 analytical HPLC system with an LC/MS was used and
operated at 1 mL/min and a linear gradient 5% A to 100% B in 2.2 min with a 0.4 min hold. The mobile
phase was composed of 100% (H2O 0.02% TFA) in vessel A and 100% (CH3CN 0.018% TFA) in vessel
B. The stationary phase was Zobax (C8) with a 3.5 um particle size and the column dimensions were 2.1
mm x 50 mm. Detection was by UV at 214 nm, evaporative light-scattering (ELSD) and MS.
Method C, LCMS. Alternatively, an MDSSCIEX API 2000 equipped with a capillary column of (50 × 4.6
mm, 5 μM) was used. HPLC was done on Agilent-1200 series UPLC system equipped with column
Zorbax SB-C18 (50 x 4.6 mm, 1.8 μM) eluting with CH3CN: ammonium acetate buffer. The reactions
were performed in the microwave (CEM, Discover).
1H-NMR spectra were recorded at 400 MHz using a Bruker AVANCE 400 MHz instrument or at 500 MHz
using a Bruker DRX 500 MHz instrument, at 25 oC using a 5 mm 1H-13C/15N/D Z-GRAD TXI cryoprobe. 13C-NMR spectra were recorded at 100 MHz using a Bruker AVANCE 400 MHz instrument or at 125.7
MHz using a Bruker DRX 500 MHz instrument. For 1H-NMR spectra, multiplicities indicated are:
s=singlet, d=doublet, t=triplet, q=quartet, quint= quintet, sxt= sextet, m=multiplet, dd = doublet of
doublets, dt=doublet of triplets etc. and br indicates a broad signal. All spectra (Supplementary Fig. 17

SUPPLEMENTARY INFORMATION
2 2 | W W W. N A T U R E . C O M / N A T U R E
RESEARCH
and 18) were collected by means of standard Bruker programs, and with ACD Spect manager v. 10 used
for reprocessing.
Analytical HPLC: Products were analyzed by Agilent 1100 Analytical Chromatography system, with 4.5 x
75 mm Zorbax XDB-C18 column (3.5 um) at 2 mL/min with a 4 min gradient from 5% CH3CN (0.1%
trifluoroacetic acid) to 95% CH3CN (0.1% trifluoroacetic acid) in H2O (0.1% trifluoroacetic acid) and a 1
min hold.
High Resolution Mass Spec was completed on a Waters (Milford, MA) qTOF Premiere Mass
Spectrometer operating in W mode (resolving power ~15,000). Positive ion electrospray ionization is
employed. Mass error (within 3mDa or 5ppm) and isotope fit considered to confirm formula. Melting
points were taken from crystalline material using Thomas Hoover capillary melting point apparatus (Serial
# 84T-096), and are uncorrected. Optical Rotations were performed using Jasco P-2000 Polarimeter
(Serial #: A002361232). Samples were dissolved in methanol with a sample concentration of 10.00
mg/mL. Elemental (CHN) analysis was conducted at Intertek, (Whitehouse, New Jersey).
The compounds were named using ACD Name software [Advanced Chemistry Development, Inc.,
(ACD/Labs), Toronto, Canada. (http://www.acdlabs.com/products/name_lab/)].
W W W. N A T U R E . C O M / N A T U R E | 2 3
SUPPLEMENTARY INFORMATION RESEARCH
Preparation of GSK126
Methyl 5-bromo-2-methyl-3-nitrobenzoate (2)
To a stirred solution of 2-methyl-3-nitro benzoic acid (300 g, 1647 mmol) in conc. H2SO4 (1.5 L) was
added 1,3-dibromo-5,5 dimethyl -2,4-imadazolidinedione (258 g, 906 mmol) and the mixture was stirred
at room temperature for 5 h. The reaction mixture was slowly added to ice water (4 L), and solid was

SUPPLEMENTARY INFORMATION
2 4 | W W W. N A T U R E . C O M / N A T U R E
RESEARCH
precipitated out. The solid was filtered off and washed with water (1.2 L), pet ether (1 L) and dried to
afford the title compound 2 as a white solid (411 g, 96%), which was used without further purification. 1H
NMR (DMSO, 400 MHz) : δ 2.446 (s, 3H), 8.136 (s, 1H), 8.294 (s, 1H). LCMS (ES) m/z = 257.93 (M-H)-
Methyl 6-bromo-1H-indole-4-carboxylate (3)
To a stirred solution of 2 (140 g, 538.4 mmol) in DMF (550 ml) was added DMF-DMA (599 mL, 4846
mmol) at room temperature. The reaction mixture was stirred at 115 oC for 18 h. The reaction mixture was
then concentrated in vacuo. The residual contents (176 g, 536.5 mmol) were dissolved in acetic acid (696
mL) and added to a suspension of iron (329.2 g, 5902 mmol) in acetic acid (1.4 L) at 50 oC. After
completion of addition, the reaction mixture was stirred at 80-90 oC for 4 h. The reaction mixture was then
filtered through a Celite pad. The filtrate was poured onto ice water (1 L) and extracted with diethyl ether
(3 x 700 ml). The combined organic layers were washed with sat NaHCO3, brine, and dried over
anhydrous Na2SO4, filtered, and evaporated under vacuum. The crude product was purified by silica gel
chromatography (eluent: 10% ethyl acetate in pet ether) and afforded the title compound 3 as a solid (80
g, 59%). 1H NMR (DMSO-d6, 400 MHz) δ: 3.980 (s, 3H), 7.168 (d, J = 3.2 Hz, 1H), 7.334 (d, J = 3.2 Hz,
1H), 7.734 (s, 1H), 8.017 (s, 1H), 8.384 (brs, 1H); LCMS (ES-) m/z = 251.9 (M-H).
Methyl 6-bromo-1-(sec-butyl)-1H-indole-4-carboxylate (4)
To a stirred suspension of sodium hydride (5.66 g, 141.7 mmol) in DMF (100 mL) was added a solution of
3 (30 g, 118.1 mmol) in DMF (50 mL) at 0 oC and stirred for 20 min. Then 2-bromobutane (29.1 g, 212.5
mmol) was added at 0 oC and the reaction mixture was stirred at room temperature for 16 h. The reaction
mixture was diluted with cold water and extracted with ethyl acetate (4 x 150 mL). The combined organic
layer was washed with cold water (150 mL), brine (100 mL) and dried over anhydrous Na2SO4 and
concentrated under reduced pressure to afford crude product, which was purified by column
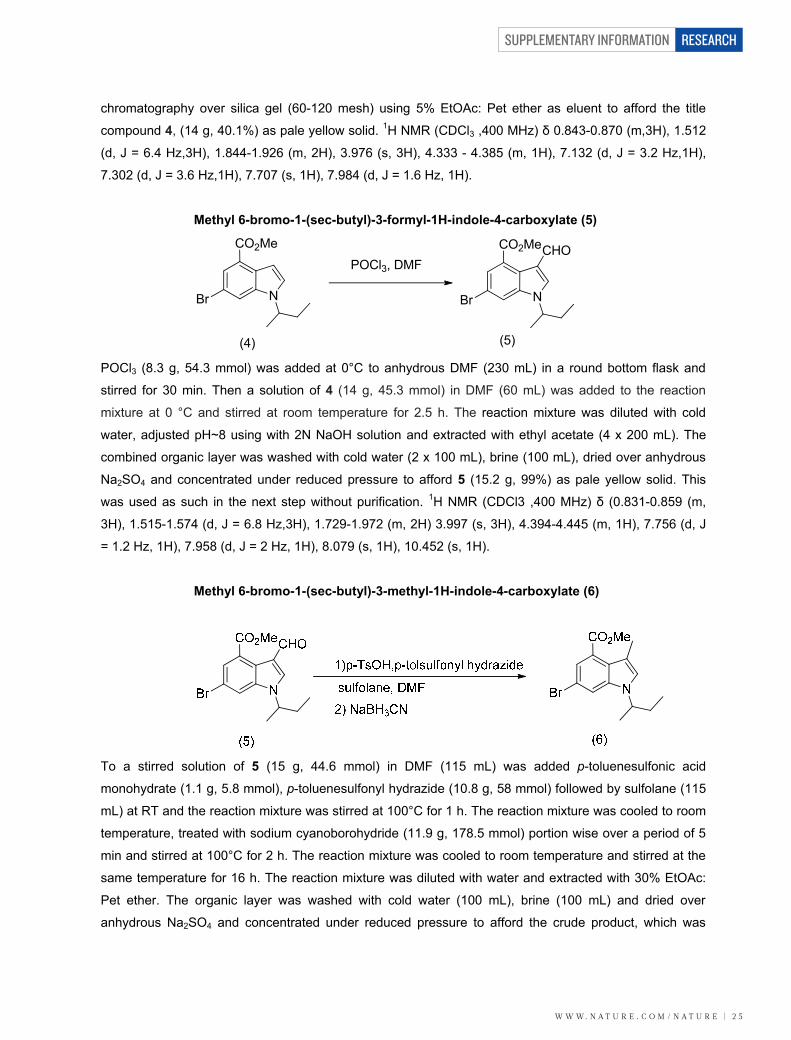
W W W. N A T U R E . C O M / N A T U R E | 2 5
SUPPLEMENTARY INFORMATION RESEARCH
chromatography over silica gel (60-120 mesh) using 5% EtOAc: Pet ether as eluent to afford the title
compound 4, (14 g, 40.1%) as pale yellow solid. 1H NMR (CDCl3 ,400 MHz) δ 0.843-0.870 (m,3H), 1.512
(d, J = 6.4 Hz,3H), 1.844-1.926 (m, 2H), 3.976 (s, 3H), 4.333 - 4.385 (m, 1H), 7.132 (d, J = 3.2 Hz,1H),
7.302 (d, J = 3.6 Hz,1H), 7.707 (s, 1H), 7.984 (d, J = 1.6 Hz, 1H).
Methyl 6-bromo-1-(sec-butyl)-3-formyl-1H-indole-4-carboxylate (5)
POCl3, DMF
NBr
CO2Me
NBr
CO2MeCHO
(4) (5) POCl3 (8.3 g, 54.3 mmol) was added at 0°C to anhydrous DMF (230 mL) in a round bottom flask and
stirred for 30 min. Then a solution of 4 (14 g, 45.3 mmol) in DMF (60 mL) was added to the reaction
mixture at 0 °C and stirred at room temperature for 2.5 h. The reaction mixture was diluted with cold
water, adjusted pH~8 using with 2N NaOH solution and extracted with ethyl acetate (4 x 200 mL). The
combined organic layer was washed with cold water (2 x 100 mL), brine (100 mL), dried over anhydrous
Na2SO4 and concentrated under reduced pressure to afford 5 (15.2 g, 99%) as pale yellow solid. This
was used as such in the next step without purification. 1H NMR (CDCl3 ,400 MHz) δ (0.831-0.859 (m,
3H), 1.515-1.574 (d, J = 6.8 Hz,3H), 1.729-1.972 (m, 2H) 3.997 (s, 3H), 4.394-4.445 (m, 1H), 7.756 (d, J
= 1.2 Hz, 1H), 7.958 (d, J = 2 Hz, 1H), 8.079 (s, 1H), 10.452 (s, 1H).
Methyl 6-bromo-1-(sec-butyl)-3-methyl-1H-indole-4-carboxylate (6)
To a stirred solution of 5 (15 g, 44.6 mmol) in DMF (115 mL) was added p-toluenesulfonic acid
monohydrate (1.1 g, 5.8 mmol), p-toluenesulfonyl hydrazide (10.8 g, 58 mmol) followed by sulfolane (115
mL) at RT and the reaction mixture was stirred at 100°C for 1 h. The reaction mixture was cooled to room
temperature, treated with sodium cyanoborohydride (11.9 g, 178.5 mmol) portion wise over a period of 5
min and stirred at 100°C for 2 h. The reaction mixture was cooled to room temperature and stirred at the
same temperature for 16 h. The reaction mixture was diluted with water and extracted with 30% EtOAc:
Pet ether. The organic layer was washed with cold water (100 mL), brine (100 mL) and dried over
anhydrous Na2SO4 and concentrated under reduced pressure to afford the crude product, which was

SUPPLEMENTARY INFORMATION
2 6 | W W W. N A T U R E . C O M / N A T U R E
RESEARCH
purified by column chromatography over silica gel (100-200 mesh) using 5% EtOAc: Pet ether as eluent
to afford title compound 6 (7.88 g, 54.6%) as pale yellow gum. 1H NMR (CDCl3 ,400 MHz): δ 0.804-
0.841(t, J=7.4 Hz, 3H),1.454-1.470 (d, J = 6.4 Hz, 3H), 1.865-1.884 (m, 2H), 2.363 (s, 3H), 3.950 (s, 3H),
4.265 - 4.316 ( m, 1H), 7.038 (s, 1H), 7.609 (d, J = 1.2 Hz, 1H), 7.671 (d, J = 2 Hz, 1H). MS (ES+): 324.19
[M+H] ion present.
6-bromo-1-(sec-butyl)-3-methyl-1H-indole-4-carboxylic acid (7)
Compound 6 (3.24 g, 9.99 mmol) was dissolved in methanol (30 mL) and tetrahydrofuran (THF) (7 mL).
The contents were stirred for 5 min., and then aq. 3N NaOH (19.99 mL, 60.0 mmol) was added via
addition funnel over 3 min. The contents rapidly became a yellow suspension and were stirred at room
temperature for 65 h. The volatiles were removed in vacuo and the residue dissolved in water (60 mL).
The contents were washed with ether (1 x 50 mL). The aq layer was cooled in an ice bath and adjusted to
pH 3-4 with 1M HCl, from which an oily residue precipitated. The contents were extracted with EtOAc (2 x
60 mL). The combined organic layers were dried over magnesium sulfate, filtered through celite, and
concentrated in vacuo. The residue obtained was treated with TBME, concentrated in vacuo, and then
dried under hi vacuum to afford 7 as a yellow foam as 3.08 g (93%). 1H NMR (400 MHz, DMSO-d6) δ
ppm 0.70 (t,J=7.33 Hz, 3H), 1.39 (d, J=6.82 Hz, 3H), 1.71 - 1.86 (m, 2H), 2.30 (s, 3H), 4.48 - 4.62 (m,
1H), 7.40- 7.49 (m, 2H), 7.96 (d, J=1.77 Hz, 1H), 12.99 (s, 1H); LCMS = 310.0/312.0 (MH+).
(S)-6-bromo-1-(sec-butyl)-N-((4,6-dimethyl-2-oxo-1,2-dihydropyridin-3-yl)methyl)-3-methyl-1H-indole-4-carboxamide (8)
Added sequentially to a reaction flask were 7 (1.33 g, 4.29 mmol), 3-(aminomethyl)-4,6-dimethyl-2(1H)-
pyridinone (1.213 g, 6.43 mmol), 1-hydroxy-7-azabenzotriazole (0.875 g, 6.43 mmol), EDC (1.233 g, 6.43

W W W. N A T U R E . C O M / N A T U R E | 2 7
SUPPLEMENTARY INFORMATION RESEARCH
mmol), followed by DMSO (30 mL, via syringe) and then N methylmorpholine (1.886 mL, 17.15 mmol, via
syringe). The contents were sealed and stirred at room temperature and the solids gradually dissolved.
The contents were stirred at room temperature for 32 h, and then slowly diluted into 220 mL of ice-water
with stirring. The contents were stirred for 10 min, and then allowed to stand for an additional 10 min. The
contents were filtered and the filtered solid was washed with additional water (50 mL). The solid was then
air dried for 10 min, and then in a vacuum oven at 50 ºC for 23 h total. The product was collected as 1.75
g (87%). 1H NMR (400 MHz, DMSO-d6) δ ppm 0.69 (t, J=7.33 Hz, 3H), 1.36 (d, J=6.57 Hz, 3H), 1.77 (dq,
J=10.29, 7.09 Hz, 2H), 2.12 (d, J=9.09 Hz, 6H), 2.21 (s, 3H), 4.30 (d, J=5.05 Hz, 2H), 4.43 - 4.56 (m, 1H),
5.86 (s, 1H), 6.99 (d, J=1.52 Hz, 1H), 7.30 (s, 1H), 7.77 (d, J=1.77 Hz, 1H), 8.25 (t, J=4.93 Hz, 1H), 11.49
(br. s.,1H); LCMS = 444.1 (MH+). 6-Bromo-1-(sec-butyl)-N-((4,6-dimethyl-2-oxo-1,2-dihydropyridin-3-
yl)methyl)-3-methyl-1H-indole-4-carboxamide (racemic mixture, 1.9 g) was resolved by chiral HPLC
(column : Chiralpak AD-H, 5 microns, 50 mm x 250 mm, UV detection :240 nM, flow rate: 100 mL/min, T
= 20 deg C, eluent: 60:40:0.1 n-heptane:ethanol:isopropylamine (isocratic)). For each run, 100 mg of the
racemic compound was dissolved in 30 volumes (3.0 mL) of warm ethanol with a few drops of
isopropylamine added. A total of 19 runs were performed. Baseline resolution was observed for each run.
The isomer that eluted at 8.3-10.1 min was collected (following concentration) as a white solid, which was
dried at 50 °C (< 5 mm Hg) to afford 901 mg, and was determined to be the S isomer compound 8.*
(chiral HPLC: >99.5% ee (no R isomer detected). The isomer that eluted at 10.8-13.0 min was collected
as a white solid, which was dried at 50 °C (< 5 mm Hg) to afford 865 mg, and was determined to be the R
isomer.* 1H NMR and LCMS were consistent with the parent racemate. * The absolute configuration was
determined by an independent synthesis of each enantiomer from the corresponding commercially
available homochiral alcohols via Mitsunobu reaction. The sterochemical assignments were also
consistent by vibrational circular dichroism (VCD) analysis.
(S)-1-(sec-butyl)-N-((4,6-dimethyl-2-oxo-1,2-dihydropyridin-3-yl)methyl)-3-methyl-6-(6-(piperazin-1-
yl)pyridin-3-yl)-1H-indole-4-carboxamide (GSK126)
To a 30 mL microwave vial were added 8 (100 mg, 0.225 mmol), 1-(5-(4,4,5,5-tetramethyl-1,3,2-
dioxaborolan-2-yl)pyridin-2-yl)piperazine (85 mg,0.293 mmol), 1,2-Dimethoxyethane (DME) (3 mL), water

SUPPLEMENTARY INFORMATION
2 8 | W W W. N A T U R E . C O M / N A T U R E
RESEARCH
(1.000 mL) and sodium carbonate (0.338 mL, 0.675 mmol), and the mixture was degassed for 5 min by
bubbling nitrogen. PdCl2(dppf)-CH2Cl2 adduct (14.70 mg, 0.018 mmol) was added and the tube was
sealed. The mixture was irradiated (microwave) at 140 °C for 10 min. The mixture was concentrated and
the residue was taken up into MeOH and filtered. The filtrate was purified using reverse phase HPLC
(eluent: 25%ACN/H2O, 0.1% NH4OH to 60% ACN/H2O, 0.1% NH4OH ) to give 91 mg of GSK126 as off-
white solid. m.p. = 260-261 oC; TLC (CH2Cl2:MeOH with 1% NH4OH added, 90:10 v/v): RF = 0.16; [α]D20
(deg cm3 g−1 dm−1) = −13.3 (c = 0.1 g cm−3 in CH3OH); 1H NMR (500 MHz, DMSO-d6) δ ppm 8.50 (d,
J=2.53 Hz, 1H), 8.16 (t, J=5.05 Hz, 1H), 7.91 (dd, J=8.84, 2.53 Hz, 1H), 7.73 (d, J=1.26 Hz, 1H), 7.26 (s,
1H), 7.17 (d, J=1.52 Hz, 1H), 6.88 (d, J=8.84 Hz, 1H), 5.87 (s, 1H), 4.56 - 4.68 (m, 1H), 4.35 (d, J=5.31
Hz, 2H), 3.41 - 3.49 (m, 4H), 2.77 - 2.85 (m, 4H), 2.22 - 2.27 (m,3H), 2.16 (s, 3H), 2.11 (s, 3H), 1.75 -
1.87 (m, 2H), 1.37 - 1.44 (m, 3H), 0.70 - 0.78 (m, 3H); 13C NMR (125 MHz, DMSO-d6) δ 169.6 (CO),
164.0 (CO), 159.2 (C), 150.2 (C), 146.4 (CH), 143.5 (C), 138.6 (C), 136.7 (CH), 131.5 (C), 130.6 (C),
126.6 (C), 125.2 (CH), 123.8 (C), 122.6 (C), 116.9 (CH), 110.6 (C), 108.5 (CH), 108.2 (CH), 107.6 (CH),
52.4 (CH), 46.9 (2 CH2), 46.3 (2 CH2), 35.9 (CH2), 30.4 (CH2), 21.7 (CH3), 19.9 (CH3), 19.1 (CH3), 12.6
(CH3), 11.6 (CH3); HRMS (m/z): [MH]+ calcd for C31H39N6O2, 527.3134; found, 527.3134; CHN analysis
(% calcd, % found for C31H38N6O2 0.1 mol H2O and 0.09 mol acetone): C (70.39, 70.44), H (7.27, 7.50), N
(15.74, 15.80).
3-(Aminomethyl)-4,6-dimethyl-2(1H)-pyridinone hydrochloride (10)
Palladium on carbon (10%) (3.24 g) was charged into a 2L dry Parr bottle and a small amount of acetic
acid was added. Next added 4,6-dimethyl-2-oxo-1,2-dihydro- pyridine-3- carbonitrile (30 g , 202.7 mmol),
sodium acetate (30.75 g, 375.0 mmol), platinum oxide (0.218 g), and acetic acid (1 L).. The bottle was
capped, placed on Parr apparatus, and shaken under an atmosphere of H2 (100 psi) for 2 days. The
reaction mixture was filtered. The solvent was removed to give a residue, which was treated with 150 mL
of conc. HCl, and the formed solids were filtered. The yellow filtrate was concentrated . To the crude
compound was added 30 mL of conc. HCl and 150 mL EtOH, the contents cooled to 0 oC, and stirred at 0 oC for 2h. The formed solids were filtered, washed with cold EtOH, ether, and dried. The product was
collected as 36 g. This batch was combined with other batches prepared on smaller scales and triturated
with ether to give 51 g of pure compound 10. 1H NMR (400 MHz, DMSO-d6) δ ppm 11.85 (br s,1 H) 8.13
(br s, 3 H) 5.93 - 6.01 (m, 1 H) 3.72 - 3.80 (m, 2 H) 2.22 (s, 3 H) 2.16 (s, 3 H).

W W W. N A T U R E . C O M / N A T U R E | 2 9
SUPPLEMENTARY INFORMATION RESEARCH
Selectivity analysis of GSK126 in a panel of methyltransferases (HMTs). GSK126 was profiled at Reaction Biology Corp. (Malvern, PA) to assess inhibition in their panel of histone methyltransferase assays (Supplementary Table 1). Methyltransferase activity was assessed using HotSpot technology, a miniaturized radioisotope-based filter binding assay. GSK126 was dissolved in dimethyl sulfoxide (DMSO) and tested at concentrations up to 100 µM with a final DMSO concentration of 2%. Buffer containing the methyltransferase and its preferred substrate (histone H4 for PRMT1, core histones for DOT1L, MLL1, MLL2, MLL3, and MLL4, or histone H3 for the remaining enzymes, lambda DNA for DNMT1 and DNMT3a/b) was pre-incubated with GSK126 for 10 minutes. Reactions were initiated by the addition of 1 µM S-adenosyl-L-[methyl-3H]methionine (SAM), allowed to incubate for 60 min at 30 oC followed by transfer to P81 filter-paper, and washed with PBS before detection.
Selectivity Analysis of GSK126 in a panel of histone acetyltransferases (HDACs). GSK was profiled at Reaction Biology Corp. to assess inhibition in their panel of histone deacetylase assays (Supplementary Table 2). Deacetylase activity was assessed using fluorogenic substrates. GSK126 was dissolved in dimethyl sulfoxide (DMSO) and tested at concentrations up to 100 µM with a final DMSO concentration of 2%. GSK126 was added to reaction plates containing the HDAC of interest in assay buffer. Reactions were initiated by addition of 50 µM of the fluorogenic substrate (an acetylated peptide substrate based on residues 379-382 of p53 (Arg-His-Lys-Lys(Ac)), incubated for 2 hr at 30 oC before being developed. Selectivity analysis of GSK126 in a panel of GPCRs and ion channels. Adenosine 2a, Adrenergic α1b, Serotonin 3 and α1 nicotinic ACHr activity were assessed in cultured whole cells loaded with calcium-sensitive dyes (Supplementary Table 3). Fluorescent output was monitored in real-time using a fluorometric imaging plate reader (FLIPR). Dopamine D2, µ Opioid and Serotonin 1B activity was assessed in a 35S-GTPγS binding scintillation proximity assay using membranes prepared from cells expressing Gi-coupled 7TM receptors. Membranes were pre-coupled with GDP and beads, 35S-labelled GTPγS was added to the mixture immediately before dispensing into plates containing test compounds (agonist format). After incubation, luminescence was determined in a Viewlux plate reader (Perkin Elmer). For antagonist assays,a standard agonist was added to the assay mix at the same time as [35S]-GTPγS, and ablation of GTPγS-binding was assessed. Selectivity analysis of Norepinephrine transporter (NET) [3H]-nisoxetine binding to Bacmam membranes expressing human NET was measured using LEADSeeker beads (Perkin Elmer) (Supplementary Table 3). Selectivity analysis of GSK126 in a panel of kinases. GSK was profiled at Reaction Biology Corp. to asses inhibition in their panel of kinases (Supplementary Table 4). Kinases activity was assessed using HotSpot technology, a miniaturized radioisotope-based filter binding assay. GSK126 was dissolved in dimethyl sulfoxide (DMSO) and tested at a single concentration of 10 µM with a final DMSO concentration of 2%. GSK126 was added to reaction plates containing the kinase of interest in assay buffer containing a suitable substrate for the given kinase (generally, either a polypeptide containing 9-40 amino acids, or a full length generic protein such as maltose binding protein (MBP), casein, or Histone H1). Reactions were initiated with 10 µCi/µL 33P-ATP (total ATP concentration at Km) incubated for 2 hr at RT. Completed

SUPPLEMENTARY INFORMATION
3 0 | W W W. N A T U R E . C O M / N A T U R E
RESEARCH
reactions were spotted on P81 ion exchange paper and washed with 0.75% phosphoric acid before detection.
shRNA-mediated EZH2 knockdown. Pfeiffer and KARPAS-422 cells plated in RPMI-1640 supplemented with 10% fetal bovine serum and 8 µg/ml polybrene were infected with lentiviral transduction particles (Sigma) containing shRNA specific for a non-mammalian control sequence or human EZH2. Sequences for the shRNA were as follows: shControl – CCGGCAACAAGATGAAGAGCACCAACTCGAGTTGGTGCTCTTCATCTTGTTGTTTTT and shEZH2 – CCGGTATGATGGTTAACGGTGATCACTCGAGTGATCACCGTTAACCATCATATTTTTG. Two days after the addition of virus, cells were transferred to RPMI-1640 media supplemented with 10% fetal bovine serum and 1 µg/ml puromycin to select for infected cells. After 2 days of puromycin selection, cells were plated into 96 well plates for analysis of cell proliferation and Caspase 3/7 activity using CellTiter-Glo (Promega) and Caspase-Glo 3/7 (Promega), respectively. For 6 days, plates were read daily using an EnVision multi-label plate reader (PerkinElmer) after a 30 minute incubation with CellTiter-Glo or Caspase-Glo 3/7 reagent. Triplicate wells were evaluated with each reagent at each time point and Caspase-3/7 activity was normalized to CellTiter-Glo signal. For gene expression profiling studies, KARPAS-422 cells were treated with control non-targeting shRNA or EZH2-specific shRNA for 10 days in duplicate, and cells were collected and processed as described below.

W W W. N A T U R E . C O M / N A T U R E | 3 1
SUPPLEMENTARY INFORMATION RESEARCH
Supplementary Table 1: Inhibition of human methyltransferases by GSK126
Target Name IC50 (nM)a Kiapp (nM)b
EZH2cd 9.9 0.57
EZH1cd 680 89
SET8d 13,000 NDf
MLL4d 25,000 ND
DNMT1e 29,490 ND
MLL1d 30,000 ND
SET7d 38,000 ND
SUV39H2d 86,000 ND
PRMT6e 88,000 ND
DOT1Le >100,000 ND
G9A/EHMT2d >100,000 ND
MMSET/NSD2d >100,000 ND
PRMT1e >100,000 ND
PRMT3e >100,000 ND
PRMT4e >100,000 ND
PRMT5e >100,000 ND
SETMARd >100,000 ND
SMYD2d >100,000 ND
SUV39H1d >100,000 ND
MLL2d >100,000 ND
MLL3d >100,000 ND
DNMT 3a/3be >100,000 ND a IC50, the concentration of GSK126 resulting in 50% inhibition of enzyme activity. b As the potency of GSK126 is at or near the tight binding limit of an assay run at [SAM] = Km, IC50 values were re-determined at a higher SAM concentration (7.5 μM) and apparent Ki values were calculated using the Cheng-Prusoff1 relationship for a competitive inhibitor. c Measured using 5-member complexes of EZH2 or EZH1 along with EED, SUZ12, AEBP2, RbAp48. d SET domain containing methyltransferase e Non-SET domain containing methyltransferase f ND, not determined.

SUPPLEMENTARY INFORMATION
3 2 | W W W. N A T U R E . C O M / N A T U R E
RESEARCH
Supplementary Table 2: Inhibition of human histone deacetylases and demethylases by GSK126
Target Name Protein Class IC50 (nM) a
HDAC1 HDAC *
HDAC2 HDAC *
HDAC3 HDAC *
HDAC4 HDAC >100,000
HDAC5 HDAC *
HDAC6 HDAC *
HDAC7 HDAC *
HDAC8 HDAC >100,000
HDAC9 HDAC >100,000
HDAC10 HDAC >100,000
HDAC11 HDAC >100,000
JMJD2d HDM 7,900
JMJD3 HDM >50,000
LSD1 HDM >100,000
a IC50, the concentration of GSK126 resulting in 50% inhibition of enzyme activity.* Indicates no inhibition or compound activity that could be fit to an IC50 curve.

W W W. N A T U R E . C O M / N A T U R E | 3 3
SUPPLEMENTARY INFORMATION RESEARCH
Supplementary Table 3: Activity of GSK126 against GPCRs, ion channels, and transporters
Protein Name Protein Class Assay Mode GSK126EC50/IC50(μM) a
Serotonin 1B GPCR Agonist >31.6
Serotonin 1B GPCR Antagonist >31.6
Adenosine 2a GPCR Agonist >31.6
Adrenergic α1b GPCR Antagonist > 40
Dopamine D2 GPCR Agonist 100
μ Opioid GPCR Agonist >100
μ Opioid GPCR Antagonist >100
Serotonin 3 Ion Channel Blocker 4.0
Serotonin 3 Ion Channel Opener >50
α1 nicotinic AChR Ion Channel Opener >50
Norepinephrine Transporter Antagonist 31.6
a EC50 and IC50, the concentration of GSK126 resulting in 50% maximal effective or inhibitory activity, respectively.

SUPPLEMENTARY INFORMATION
3 4 | W W W. N A T U R E . C O M / N A T U R E
RESEARCH
Supplementary Table 4: Inhibition of kinases by GSK126
Kinase
% Enzyme Activity (relative to DMSO controls)a
GSK126
IC50 (nM) Staurosporineb
Data 1 Data 2
ABL1 86 82 49
ABL2/ARG 89 87 16
ACK1 93 94 19
AKT1 94 88 3
AKT2 92 95 11
AKT3 96 92 3
ALK 93 90 2
ALK1/ACVRL1 96 100 3162
ALK2/ACVR1 99 86 3545
ALK4/ACVR1B 101 96 17630
ALK5/TGFBR1 100 100 >20000
ARAF 101 108 NDc
ARK5/NUAK1 102 102 <1.0
ASK1/MAP3K5 103 102 8
Aurora A 90 86 2
Aurora B 114 93 3
Aurora C 103 99 2
AXL 106 100 6
BLK 84 79 2
BMX/ETK 100 104 15
BRAF 97 94 ND
BRK 96 90 170
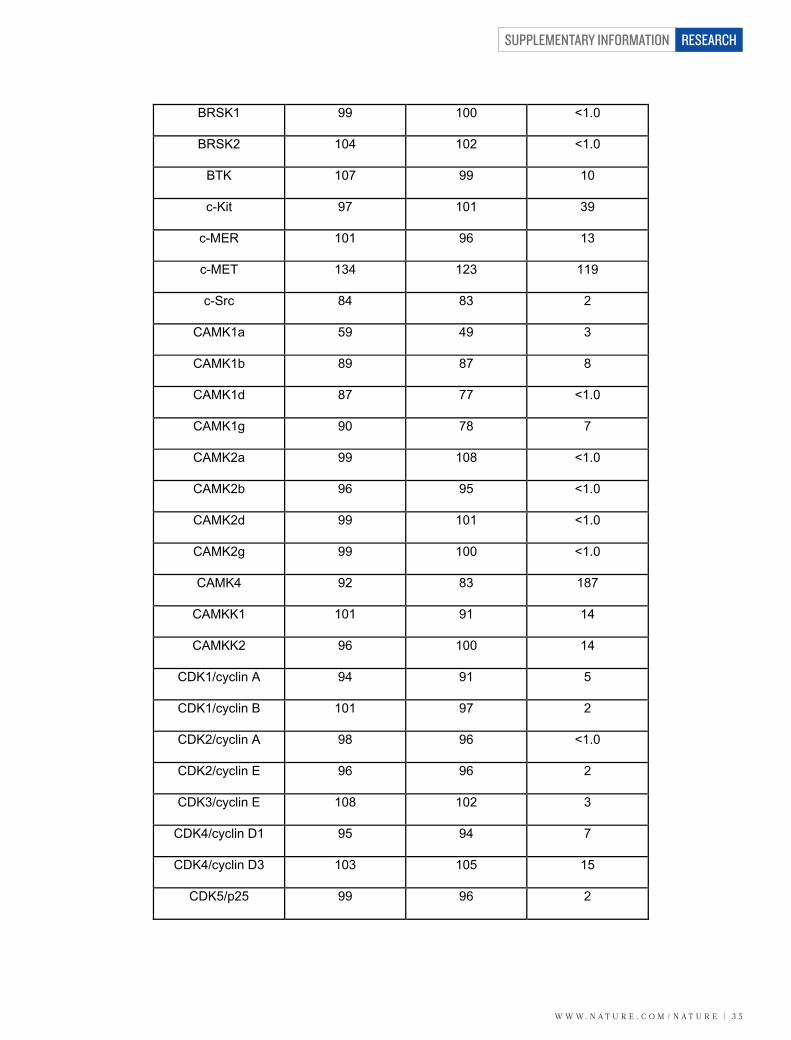
W W W. N A T U R E . C O M / N A T U R E | 3 5
SUPPLEMENTARY INFORMATION RESEARCH
BRSK1 99 100 <1.0
BRSK2 104 102 <1.0
BTK 107 99 10
c-Kit 97 101 39
c-MER 101 96 13
c-MET 134 123 119
c-Src 84 83 2
CAMK1a 59 49 3
CAMK1b 89 87 8
CAMK1d 87 77 <1.0
CAMK1g 90 78 7
CAMK2a 99 108 <1.0
CAMK2b 96 95 <1.0
CAMK2d 99 101 <1.0
CAMK2g 99 100 <1.0
CAMK4 92 83 187
CAMKK1 101 91 14
CAMKK2 96 100 14
CDK1/cyclin A 94 91 5
CDK1/cyclin B 101 97 2
CDK2/cyclin A 98 96 <1.0
CDK2/cyclin E 96 96 2
CDK3/cyclin E 108 102 3
CDK4/cyclin D1 95 94 7
CDK4/cyclin D3 103 105 15
CDK5/p25 99 96 2

SUPPLEMENTARY INFORMATION
3 6 | W W W. N A T U R E . C O M / N A T U R E
RESEARCH
CDK5/p35 102 104 2
CDK6/cyclin D1 105 106 2
CDK6/cyclin D3 93 112 24
CDK7/cyclin H 103 100 162
CDK9/cyclin K 96 97 12
CDK9/cyclin T1 101 95 12
CHK1 78 80 <1.0
CHK2 102 40 3
CK1a1 102 92 7927
CK1d 104 96 ND
CK1epsilon 97 92 ND
CK1g1 106 113 5010
CK1g2 90 91 2001
CK1g3 98 98 1997
CK2a 113 106 ND
CK2a2 68 85 1368
CLK1 104 94 7
CLK2 91 88 2
CLK3 88 84 807
CLK4 94 97 24
COT1/MAP3K8 93 98 ND
CSK 92 87 12
CTK/MATK 99 92 1033
DAPK1 100 93 7
DAPK2 105 107 4
DCAMKL2 105 104 26

W W W. N A T U R E . C O M / N A T U R E | 3 7
SUPPLEMENTARY INFORMATION RESEARCH
DDR2 103 102 23
DMPK 92 109 54
DRAK1/STK17A 96 97 15
DYRK1/DYRK1A 96 94 2
DYRK1B 86 95 <1.0
DYRK2 202 205 75
DYRK3 100 93 34
DYRK4 99 98 ND
EGFR 102 91 174
EPHA1 104 104 102
EPHA2 103 108 63
EPHA3 101 95 23
EPHA4 96 88 20
EPHA5 76 78 18
EPHA6 94 86 10
EPHA7 94 89 23
EPHA8 89 89 96
EPHB1 93 88 31
EPHB2 101 90 88
EPHB3 96 89 1067
EPHB4 96 94 158
ERBB2/HER2 103 97 150
ERBB4/HER4 102 85 277
ERK1 102 96 1651
ERK2/MAPK1 99 91 1951
FAK/PTK2 98 85 7

SUPPLEMENTARY INFORMATION
3 8 | W W W. N A T U R E . C O M / N A T U R E
RESEARCH
FER 84 87 1
FES/FPS 102 96 2
FGFR1 87 82 7
FGFR2 97 100 2
FGFR3 89 72 11
FGFR4 89 89 81
FGR 93 89 1
FLT1/VEGFR1 98 97 13
FLT3 92 83 <1.0
FLT4/VEGFR3 87 78 2
FMS 98 92 <1.0
FRK/PTK5 100 94 14
FYN 99 102 3
GCK/MAP4K2 93 90 <1.0
GRK2 113 103 452
GRK3 103 107 651
GRK4 99 97 102
GRK5 97 105 42
GRK6 105 103 39
GRK7 96 99 1
GSK3a 104 99 4
GSK3b 92 100 11
Haspin 102 94 6
HCK 105 97 1
HGK/MAP4K4 107 97 <1.0
HIPK1 99 99 ND

W W W. N A T U R E . C O M / N A T U R E | 3 9
SUPPLEMENTARY INFORMATION RESEARCH
HIPK2 95 85 576
HIPK3 105 95 878
HIPK4 92 84 373
IGF1R 97 96 52
IKKa/CHUK 94 92 358
IKKb/IKBKB 102 102 604
IKKe/IKBKE 89 100 <1.0
IR 95 96 33
IRAK1 97 97 53
IRAK4 106 108 3
IRR/INSRR 91 85 14
ITK 93 86 12
JAK1 98 97 <1.0
JAK2 93 90 <1.0
JAK3 97 94 <1.0
JNK1 104 95 10840
JNK2 84 77 4150
JNK3 103 107 ND
KDR/VEGFR2 107 100 25
KHS/MAP4K5 106 98 <1.0
LCK 101 97 1
LIMK1 102 97 2
LKB1 105 108 30
LOK/STK10 91 89 7
LRRK2 96 102 5
LYN 98 109 2

SUPPLEMENTARY INFORMATION
4 0 | W W W. N A T U R E . C O M / N A T U R E
RESEARCH
LYN B 91 93 2
MAPKAPK2 99 99 174
MAPKAPK3 108 93 2217
MAPKAPK5/PRAK 80 92 651
MARK1 100 91 <1.0
MARK2/PAR-1Ba 94 91 <1.0
MARK3 111 109 <1.0
MARK4 82 84 <1.0
MEK1 106 99 7
MEK2 103 100 24
MEKK2 104 97 9
MEKK3 107 107 5
MELK 81 78 <1.0
MINK/MINK1 111 100 <1.0
MKK6 95 94 53
MLCK/MYLK 97 95 46
MLCK2/MYLK2 99 94 11
MLK1/MAP3K9 94 91 <1.0
MLK2/MAP3K10 104 102 2
MLK3/MAP3K11 96 94 1
MNK1 96 98 35
MNK2 104 92 12
MRCKa/CDC42BPA 103 98 4
MRCKb/CDC42BPB 102 100 4
MSK1/RPS6KA5 107 108 <1.0
MSK2/RPS6KA4 90 91 <1.0

W W W. N A T U R E . C O M / N A T U R E | 4 1
SUPPLEMENTARY INFORMATION RESEARCH
MSSK1/STK23 97 99 2061
MST1/STK4 98 96 <1.0
MST2/STK3 89 91 <1.0
MST3/STK24 81 83 2
MST4 102 94 3
MUSK 105 103 73
MYO3b 94 90 6
NEK1 99 94 8
NEK11 112 102 199
NEK2 102 104 909
NEK3 107 107 >20000
NEK4 99 92 126
NEK6 97 94 ND
NEK7 100 99 ND
NEK9 106 97 106
NIK/MAP3K14 104 94 698
NLK 96 94 55
OSR1/OXSR1 96 89 78
P38a/MAPK14 103 97 ND
P38b/MAPK11 103 102 ND
P38d/MAPK13 100 90 168
P38g 102 93 219
p70S6K/RPS6KB1 100 94 <1.0
p70S6Kb/RPS6KB2 96 88 2
PAK1 104 108 <1.0
PAK2 97 98 <1.0

SUPPLEMENTARY INFORMATION
4 2 | W W W. N A T U R E . C O M / N A T U R E
RESEARCH
PAK3 95 92 <1.0
PAK4 98 97 6
PAK5 97 106 2
PAK6 100 103 54
PASK 88 93 11
PBK/TOPK 97 91 105
PDGFRa 104 95 <1.0
PDGFRb 106 97 2
PDK1/PDPK1 102 99 39
PHKg1 101 95 1
PHKg2 97 90 <1.0
PIM1 101 103 3
PIM2 101 97 30
PIM3 102 85 <1.0
PKA 109 94 <1.0
PKAcg 100 100 5
PKCa 103 110 <1.0
PKCb1 101 102 3
PKCb2 94 94 <1.0
PKCd 108 97 <1.0
PKCepsilon 100 99 <1.0
PKCeta 105 101 <1.0
PKCg 97 86 1
PKCiota 99 100 10
PKCmu/PRKD1 103 98 <1.0
PKCnu/PRKD3 110 95 <1.0

W W W. N A T U R E . C O M / N A T U R E | 4 3
SUPPLEMENTARY INFORMATION RESEARCH
PKCtheta 101 98 <1.0
PKCzeta 101 98 52
PKD2/PRKD2 98 98 <1.0
PKG1a 96 94 1
PKG1b 91 90 1
PKG2/PRKG2 99 95 3
PKN1/PRK1 86 92 <1.0
PKN2/PRK2 91 88 1
PLK1 102 95 189
PLK2 94 93 3775
PLK3 114 98 225
PRKX 80 81 <1.0
PYK2 108 113 5
RAF1 101 93 ND
RET 100 97 <1.0
RIPK2 96 95 237
RIPK5 101 94 27
ROCK1 94 98 <1.0
ROCK2 104 93 <1.0
RON/MST1R 92 102 315
ROS/ROS1 120 101 <1.0
RSK1 84 68 <1.0
RSK2 95 86 <1.0
RSK3 95 89 <1.0
RSK4 104 80 <1.0
SGK1 98 100 9

SUPPLEMENTARY INFORMATION
4 4 | W W W. N A T U R E . C O M / N A T U R E
RESEARCH
SGK2 107 103 15
SGK3/SGKL 104 106 131
SIK2 111 105 <1.0
SLK/STK2 112 104 9
SNARK/NUAK2 107 99 19
SRMS 102 85 12610
SRPK1 106 110 45
SRPK2 100 97 228
STK16 102 101 96
STK22D/TSSK1 97 108 <1.0
STK25/YSK1 92 94 1
STK33 94 95 23
STK38/NDR1 100 94 11
STK39/STLK3 98 93 22
SYK 93 85 <1.0
TAK1 104 107 43
TAOK1 93 90 <1.0
TAOK2/TAO1 105 101 4
TAOK3/JIK 104 98 <1.0
TBK1 105 105 <1.0
TEC 89 74 643
TGFBR2 96 104 15490
TIE2/TEK 97 94 85
TLK2 97 105 2
TRKA 108 104 2
TRKB 97 101 <1.0

W W W. N A T U R E . C O M / N A T U R E | 4 5
SUPPLEMENTARY INFORMATION RESEARCH
TRKC 105 98 <1.0
TSSK2 95 92 2
TTK 96 107 156
TXK 90 81 14
TYK1/LTK 107 96 14
TYK2 90 93 <1.0
TYRO3/SKY 96 93 5
ULK1 98 98 3
ULK2 101 98 2
ULK3 104 104 <1.0
VRK1 106 96 4761
WEE1 100 101 ND
WNK2 93 93 2910
WNK3 97 93 ND
YES/YES1 81 76 2
ZAK/MLTK 100 92 ND
ZAP70 100 95 16
ZIPK/DAPK3 106 107 4
a GSK126 was tested in duplicate at a single dose of 10 µM. b Staurosporine was used as a control compound and was tested with a 10-point 3-fold dilution series starting at 20 µM. c ND, not determined.
1. Cheng,Y. & Prusoff,W.H. Relationship between the inhibition constant (K1) and the concentration of inhibitor which causes 50 per cent inhibition (I50) of an enzymatic reaction. Biochem. Pharmacol. 22, 3099-3108 (1973).

SUPPLEMENTARY INFORMATION
4 6 | W W W. N A T U R E . C O M / N A T U R E
RESEARCH
Supplementary Table 5 | Growth IC50 values, baseline H3K27me3 levels, mutation status, and tumor subtype for lymphoma cell lines.
Cell LineAverage
Growth IC50a
(nM)
BaselineH3K27me3
levelbEZH2 Mutation Statusc Tumor Typed Sub-Typee t(14:18)
Statusfp53
StatusgCytostatic/Cytotoxich
WILL-2 27458 NDi WT B-NHL DLBCL N/Aj N/AToledo 13786 34 WT B-NHL DLBCL positive mutantWILL-1 5527 ND D185Hk (Het) B-NHL DLBCL N/A N/A
SU-DHL-4 4828 70 Y641S (Het); Y661N (Het) B-NHL DLBCL positive mutantRL 4727 55 Y641N; D185H (Het) B-NHL DLBCL N/A N/A
U-2940 4558 ND WT B-NHL DLBCL N/A N/ASU-DHL-8 3190 ND WT B-NHL DLBCL negative mutant
U-2932 2935 ND WT B-NHL DLBCL N/A N/ASU-DHL-5 2299 39 WT B-NHL DLBCL negative WT
Farage 1715 32 D185H (Het) B-NHL DLBCL negative mutantOCI-Ly-19 1019 23 WT B-NHL DLBCL N/A WT
DB 861 63 Y641N (Het) B-NHL DLBCL positive mutant cytostaticSU-DHL-6 582 ND Y641N (Het) B-NHL DLBCL positive mutant cytostatic
HT 516 21 WT B-NHL DLBCL negative mutant cytostaticSU-DHL-10 448 134 Y641F (Het) B-NHL DLBCL negative mutant cytotoxic
KARPAS-422 232 106 Y641N (Het) B-NHL DLBCL positive mutant cytostaticWSU-DLCL2 134 105 Y641F (Het) B-NHL DLBCL N/A mutant cytotoxic
Pfeiffer 28 100 A677G (Het) B-NHL DLBCL positive WT cytotoxicRaji 7865 30 WT B-NHL Burkitt N/A N/A
CA46 6585 28 D185H (Het) B-NHL Burkitt N/A N/ADG-75 3254 30 WT B-NHL Burkitt N/A N/A
P3HR-1 3207 32 WT B-NHL Burkitt N/A N/AHS-Sultan 2275 26 WT B-NHL Burkitt N/A N/A
Daudi 1265 55 WT B-NHL Burkitt N/A N/AJiyoye 232 39 WT B-NHL Burkitt N/A N/A cytostaticBC-1 8292 20 WT B-NHL AIDS-BCBL N/A N/ABC-2 4762 24 WT B-NHL AIDS-BCBL N/A N/ABC-3 2217 36 D185H (Het) B-NHL PEL, AIDS-BCBL N/A N/A
CRO-AP2 1643 ND WT B-NHL PEL, AIDS-BCBL N/A N/AWSU-FSCCL 11966 ND D185H (Het) B-NHL FL N/A N/A
SC-1 3727 ND D185H (Het) B-NHL FL N/A WTWSU-NHL 3537 ND D185H (Het) B-NHL FL positive mutantNU-DUL-1 17060 ND WT B-NHL N/A N/A mutant
MC116 10168 39 WT B-NHL N/A N/A mutantRI-1 7656 ND WT B-NHL MCL N/A mutant
MINO 7340 ND D185H (Het) B-NHL N/A N/A N/AU-698-M 5599 ND WT B-NHL N/A N/A mutant
MHH-PREB-1 5300 33 WT B-NHL N/A N/A mutantKARPAS-1106P 4536 ND E744A (Het) B-NHL MLBCL N/A WT
RC-K8 4528 40 D185H (Het) B-NHL N/A N/A WTCI-1 4282 ND D185H (Het) B-NHL N/A N/A N/A
SU-DHL-16 3282 ND D185H (Het) B-NHL N/A N/A mutantHD-MY-Z 10717 30 WT Hodgkin's N/A N/A N/A
L-428 4704 185 Y641S (Het) Hodgkin's N/A N/A N/AHs 445 3528 32 WT Hodgkin's N/A N/A N/A
RPMI-6666 1429 33 WT Hodgkin's N/A N/A N/Aa Growth IC50 values represent the average of at least 2 independent replicate experiments.b Baseline H3K27me3 levels are represented relative to the level observed in the Pfeiffer cell line. c Amino acid residue numbering based on NP_001190176. d B-NHL, B-cell non-hodgkin lymphoma. Hodgkin's, Hodgkin's lymphoma.e DLBCL, diffuse large B-cell lymphoma. Burkitt, Burkitt lymphoma. PEL, primary effusion lymphoma. AIDS-BCBL, acquired immunodeficiency syndrome body cavity-based lymphoma. MLBCL, mediastinal large B cell lymphoma. MCL, mantle cell lymphoma. FL, follicular lymphoma. N/A, not available.f Deng et al., Cancer Cell 12: 171-185 (2007).g Dornan et al., Blood 114: 2721-29 (2009).h Dose-response curves from cell lines with growth IC50 values < 1 μM were evaluated for evidence of cytostasis or cytotoxicity (values below T0).i Not determined.j Not available.k D185H is a known SNP (rs2302427).

W W W. N A T U R E . C O M / N A T U R E | 4 7
SUPPLEMENTARY INFORMATION RESEARCH
332
6
2
e
e
) 57565
Supplementary Table 8 | Common up-regulated genes in at least 4 out of 5 sensitive mutant cell lines a
Probeset ID Symbol Description EntrezGene Unigene
PfeF
Ch
ifferoldange
WSU-DLCL2
FoldChange
KARPA422 FoChang
S-lde
SU-D
Ch
HL-10Foldange
HT Fold Change
SU-DHFold
Chang
L-6
e
DBch
Fold ange
OCI-LY-19Fold
Change
SU-DHL-4Fold
Change
ToledoFold
Change
PfeifferH3K27me3
Marked
KARPAS-422
H3K27me3Marked
WSU-DLCL2
H3K27me3Marked
201310_s_at C5orf13 chromosome 5 open reading frame 1 9315 Hs.483067 2.68 2.04 4.65 2.39 1.55 1.45 2.24 1.06 1.01 1.09 No No No201403_s_at MGST3 microsomal glutathione S-transferase 4259 Hs.191734 2.16 3.30 2.49 2.68 1.64 1.93 1.41 1.28 1.34 1.05 Yes Yes Yes201760_s_at WSB2 WD repeat and SOCS box-containing 55884 Hs.719911 1.54 4.89 5.83 2.43 1.38 2.58 0.84 0.95 2.24 1.07 Yes Yes Yes203504_s_at ABCA1 ATP-binding cassette, sub-family A (ABC1), member 1 19 Hs.429294 3.66 1.56 11.38 2.73 1.81 2.59 2.56 0.86 1.03 0.97 Yes Yes Yes203505_at ABCA1 ATP-binding cassette, sub-family A (ABC1), member 1 19 Hs.429294 3.26 1.48 11.53 2.50 3.79 2.37 2.77 1.06 1.02 0.88 Yes Yes Yes
206857_s_at FKBP1B FK506 binding protein 1B, 12.6 kDa 2281 Hs.709461 2.39 2.90 11.45 4.52 2.79 2.64 1.69 3.37 2.33 1.34 Yes Yes Yes207071_s_at ACO1 aconitase 1, soluble 48 Hs.567229 2.02 3.68 0.82 2.67 2.08 2.01 1.13 1.44 1.70 1.37 Yes Yes Yes208999_at SEPT8 septin 8 23176 Hs.522057 0.87 2.43 4.42 21.93 1.71 4.81 1.44 1.75 2.45 1.10 No No No
209459_s_at ABAT 4-aminobutyrate aminotransferase 18 Hs.336768 6.66 4.02 18.93 7.04 2.74 5.39 2.84 2.11 1.48 1.11 Yes Yes Yes209504_s_at PLEKHB1 pleckstrin homology domain containing, family B (evectins) member 1 58473 Hs.445489 2.63 6.62 4.45 2.88 1.79 2.92 1.95 1.68 1.53 1.00 Yes Yes Yes209605_at TST thiosulfate sulfurtransferase (rhodanese) 7263 Hs.474783 2.52 4.52 3.20 2.84 1.90 3.45 1.05 1.10 1.83 1.10 Yes Yes Yes
209995_s_at TCL1A T-cell leukemia/lymphoma 1A 8115 Hs.2484 2.47 37.87 9.18 3.79 1.17 1.26 1.10 1.04 1.16 1.04 Yes Yes Yes210778_s_at MXD4 MAX dimerization protein 4 10608 Hs.655020 3.50 3.48 2.09 2.68 2.29 3.44 1.11 1.49 0.91 0.85 Yes Yes Yes211474_s_at SERPINB6 serpin peptidase inhibitor, clade B (ovalbumin), member 5269 --- 2.02 2.02 1.11 5.86 2.87 2.95 1.12 1.61 2.13 1.46 Yes Yes Yes212778_at PACS2 phosphofurin acidic cluster sorting protein 2 23241 Hs.525626 1.63 2.58 3.01 2.33 1.59 3.15 1.26 1.73 1.28 1.09 Yes Yes Yes213309_at PLCL2 phospholipase C-like 23228 Hs.202010 3.21 2.17 1.95 3.01 1.82 2.03 1.05 1.16 2.07 0.92 Yes Yes Yes213436_at CNR1 cannabinoid receptor 1 (brain) 1268 Hs.709067 13.88 3.69 2.02 4.00 1.76 2.03 1.10 1.11 1.10 1.19 Yes Yes Yes
213901_x_at RBM9 RNA binding motif protein 9 23543 Hs.282998 9.09 2.35 3.94 3.31 1.03 2.85 1.14 4.31 1.21 1.12 Yes Yes Yes218175_at CCDC92 coiled-coil domain containing 92 80212 Hs.114111 2.67 2.72 4.91 4.05 2.73 2.38 1.80 1.45 1.42 1.07 Yes Yes Yes
218346_s_at SESN1 sestrin 1 27244 Hs.591336 2.29 6.75 1.62 4.84 2.41 2.73 1.58 1.50 1.95 0.99 Yes Yes Yes218773_s_at MSRB2 methionine sulfoxide reductase B2 22921 Hs.461420 2.53 4.68 4.86 4.69 1.72 6.19 1.69 1.43 1.74 1.10 No Yes Yes219841_at AICDA activation-induced cytidine deaminas 57379 Hs.149342 2.43 3.16 18.71 1.53 1.26 2.34 3.56 1.87 1.17 3.35 Yes No Yes
221676_s_at CORO1C coronin, actin binding protein, 1C 23603 Hs.330384 2.13 2.56 2.87 2.88 1.77 1.62 1.49 1.84 1.06 1.02 Yes Yes Yes221773_at ELK3 ELK3, ETS-domain protein (SRF accessory protein 2) 2004 Hs.46523 3.88 2.29 1.69 2.36 1.32 3.01 1.81 0.92 0.93 1.09 Yes Yes Yes222409_at CORO1C coronin, actin binding protein, 1C 23603 Hs.330384 2.02 2.31 3.08 2.47 1.58 1.72 1.65 1.51 1.02 1.02 Yes Yes Yes
224499_s_at AICDA activation-induced cytidine deaminas 57379 Hs.149342 2.53 3.04 27.88 0.47 1.27 2.46 1.15 0.65 1.22 0.98 Yes No Yes225123_at SESN3 sestrin 3 143686 Hs.659934 4.61 4.26 5.71 3.41 3.76 4.87 6.09 1.78 0.98 1.06 Yes No Yes226272_at RCAN3 RCAN family member 3 11123 Hs.656799 2.87 3.01 3.00 2.45 1.96 1.44 2.10 1.49 1.21 1.04 Yes Yes Yes227001_at NIPAL2 NIPA-like domain containing 2 79815 Hs.309489 2.73 2.86 2.90 2.90 1.13 2.30 1.20 1.24 1.33 1.02 Yes Yes Yes227478_at SETBP1 SET binding protein 1 26040 Hs.435458 2.76 5.63 3.32 2.04 2.38 2.11 1.83 0.37 1.73 1.53 Yes Yes Yes228377 KLHL14228377_at k l h lik 14 (DKLHL14 hil )kelch-like 14 (Drosophila 57565 H 446164Hs.446164 1 621.62 2 462.46 5 75.755 4 714.71 1 781.78 2 932.93 0 96 1 37 1 30 1 09 N Y Y0.96 1.37 1.30 1.09 No Yes Yes235352_at --- --- --- --- 3.33 2.24 6.47 2.16 1.63 1.99 1.18 1.37 1.49 0.94242448_at MAP4K3 mitogen-activated protein kinase kinase kinase kinase 3 8491 Hs.655750 2.93 3.29 5.67 2.04 2.53 2.47 1.66 1.12 1.89 0.78 Yes Yes Yes244166_at APLN apelin 8862 Hs.303084 1.31 5.52 5.33 5.38 1.36 2.12 1.48 1.12 1.56 0.73 No Yes Yes39318_at TCL1A T-cell leukemia/lymphoma 1A 8115 Hs.2484 3.11 31.65 10.47 4.41 1.10 1.34 1.10 1.03 1.20 1.03 Yes Yes Yes
a Pfeiffer, KARPAS-422, WSU-DLCL2, SU-DHL-10, and SU-DHL-6.

SUPPLEMENTARY INFORMATION
4 8 | W W W. N A T U R E . C O M / N A T U R E
RESEARCH
Supplementary Table 9 |Significantly enriched gene ontology terms
Up-regulated probe sets only-Log10(p-value) -Log10(p-value) -Log10(p-value) -Log10(p-value) -Log10(p-value)
GO Term Pfeiffer WSU-DLCL2 KARPAS-422 SU-DHL-10 SU-DHL-6GOTERM_BP_5 GO:0007242 intracellular signaling cascade 3.15 2.11 1.67 1.20 2.11GOTERM_MF_4 GO:0003779 actin binding 1.34 2.31 1.13 2.56 4.03GOTERM_BP_3 GO:0012501 programmed cell death 2.67 2.34 3.11GOTERM_BP_3 GO:0050794 regulation of cellular process 4.03 1.28 2.75 2.25 3.26GOTERM_BP_4 GO:0006915 apoptosis 2.78 2.19 3.34GOTERM_BP_4 GO:0048523 negative regulation of cellular process 3.07 2.52 2.11 3.92 2.49GOTERM_BP_3 GO:0048519 negative regulation of biological process 2.90 2.80 1.98 3.82 2.67
Up- and down-regulated probe sets-Log10(p-value) -Log10(p-value) -Log10(p-value) -Log10(p-value) -Log10(p-value)
GO Term Pfeiffer WSU-DLCL2 KARPAS-422 SU-DHL-10 SU-DHL-6GOTERM_BP_4 GO:0048523 negative regulation of cellular process 4.07 4.02 2.55 3.26 2.86GOTERM_BP_3 GO:0048519 negative regulation of biological process 3.54 4.14 2.28 3.02 3.00GOTERM_BP_3 GO:0050794 regulation of cellular process 3.72 2.88 3.34 1.16 3.12GOTERM_BP_4 GO:0007050 cell cycle arrest 2.24 2.15 3.46GOTERM_MF_5 GO:0003714 transcription corepressor activity 2.64 2.16 2.36GOTERM_BP_5 GO:0042981 regulation of apoptosis 2.52 3.08 2.24 1.58GOTERM_BP_5 GO:0043067 regulation of programmed cell death 2.45 2.99 2.16 1.53GOTERM_BP_3 GO:0050793 regulation of developmental process 2.12 2.63 2.23 3.09 1.07GOTERM_MF_3 GO:0008134 transcription factor binding 2.00 3.51 1.51 1.17 2.85GOTERM_BP_5 GO:0007242 intracellular signaling cascade 2.14 2.80 1.95 1.18 2.59GOTERM_BP_5 GO:0051172 neg reg of nitrogen cmpd metabolic process 2.10 2.13 2.32 1.00 1.25