Embed Size (px)
Citation preview
Index Solutions
Let your investments mirrormarket movementsPassive investment solutions by SBI Mutual Fund
REPORT AS ON APRIL 30, 2021
• SBI - ETF NIFTY 50• SBI - ETF SENSEX • SBI - ETF NIFTY BANK • SBI - ETF GOLD• SBI NIFTY INDEX FUND• SBI - ETF NIFTY NEXT 50• SBI - ETF QUALITY• SBI - ETF SENSEX NEXT 50• SBI - ETF BSE 100• SBI ETF PRIVATE BANK• SBI ETF IT• SBI - ETF 10-YEAR GILT
SP_2021_05_MAY_SBI MUTUAL FUND_PRODUCTS_SCHEMES_11580587_SIZE A4_INDEX SOLUTIONS FACTSHEET
All data as of April 30, 20212
^Investors should consult their financial advisers if in doubt about whether the product is suitable for them.
Product Labelling:
This product is suitable for investors who are seeking^:• Long-term capital appreciation• Investment in securities covered by Nifty 50 Index
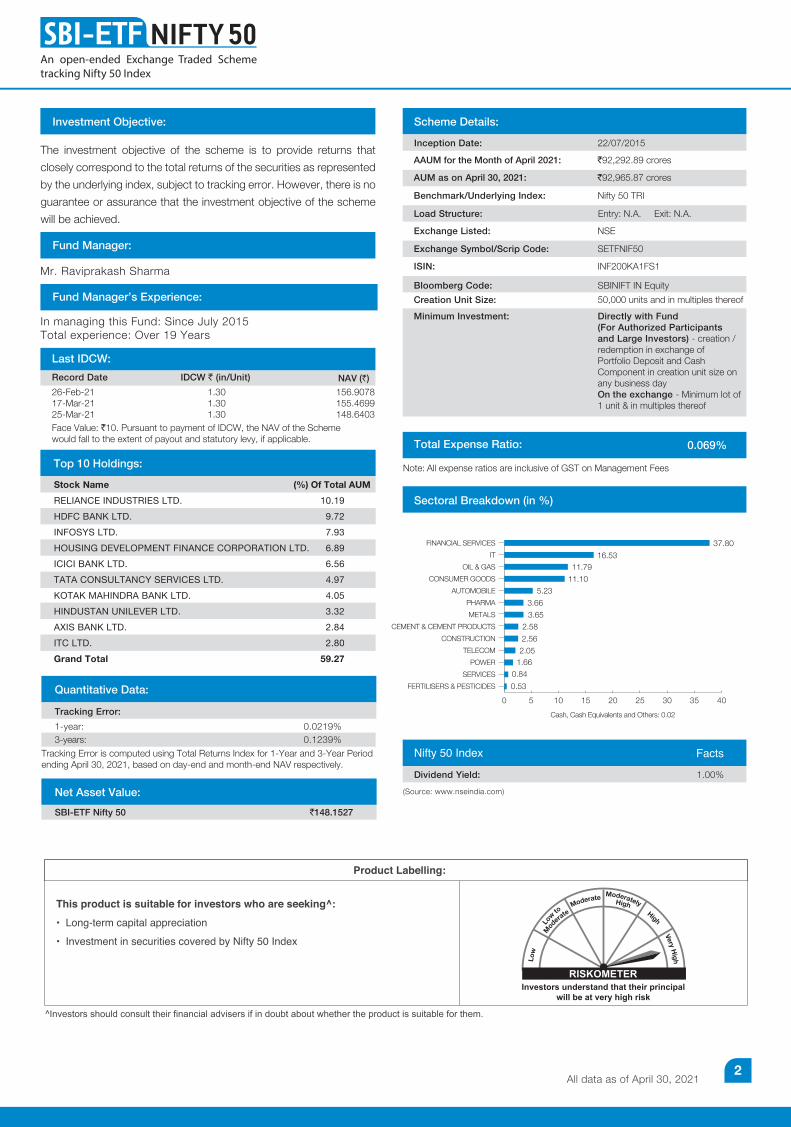
Investment Objective:
The investment objective of the scheme is to provide returns that closely correspond to the total returns of the securities as represented by the underlying index, subject to tracking error. However, there is no guarantee or assurance that the investment objective of the scheme will be achieved.
Fund Manager:
Mr. Raviprakash Sharma
Fund Manager’s Experience:
In managing this Fund: Since July 2015Total experience: Over 19 Years
0.069%Total Expense Ratio:
Note: All expense ratios are inclusive of GST on Management Fees
Nifty 50 Index
Dividend Yield: 1.00%(Source: www.nseindia.com)
Facts
Scheme Details:
22/07/2015Inception Date:
Nifty 50 TRIBenchmark/Underlying Index:
SETFNIF50Exchange Symbol/Scrip Code:
INF200KA1FS1ISIN:
SBINIFT IN EquityBloomberg Code:
AAUM for the Month of April 2021: `92,292.89 crores
Load Structure: Entry: N.A. Exit: N.A.
Exchange Listed: NSE
50,000 units and in multiples thereofCreation Unit Size:Minimum Investment: Directly with Fund
(For Authorized Participantsand Large Investors) - creation /redemption in exchange ofPortfolio Deposit and CashComponent in creation unit size onany business day On the exchange - Minimum lot of 1 unit & in multiples thereof
AUM as on April 30, 2021: `92,965.87 crores
Quantitative Data:
Tracking Error is computed using Total Returns Index for 1-Year and 3-Year Period ending April 30, 2021, based on day-end and month-end NAV respectively.
Tracking Error:1-year: 0.0219%3-years: 0.1239%
Sectoral Breakdown (in %)
Record Date IDCW ` (in/Unit) NAV ( )`
Last IDCW:
Face Value: `10. Pursuant to payment of IDCW, the NAV of the Scheme would fall to the extent of payout and statutory levy, if applicable.
26-Feb-21 1.30 156.907817-Mar-21 1.30 155.469925-Mar-21 1.30 148.6403
37.80 16.53
11.79 11.10
5.23 3.66 3.65
2.58 2.56
2.05 1.66
0.84 0.53
0 5 10 15 20 25 30 35 40
FINANCIAL SERVICESIT
OIL & GASCONSUMER GOODS
AUTOMOBILEPHARMAMETALS
CEMENT & CEMENT PRODUCTSCONSTRUCTION
TELECOMPOWER
SERVICESFERTILISERS & PESTICIDES
An open-ended Exchange Traded Scheme tracking Nifty 50 Index
-ETF NIFTY 50
Top 10 Holdings:
(%) Of Total AUMStock NameRELIANCE INDUSTRIES LTD. 10.19 HDFC BANK LTD. 9.72 INFOSYS LTD. 7.93 HOUSING DEVELOPMENT FINANCE CORPORATION LTD. 6.89 ICICI BANK LTD. 6.56 TATA CONSULTANCY SERVICES LTD. 4.97 KOTAK MAHINDRA BANK LTD. 4.05 HINDUSTAN UNILEVER LTD. 3.32 AXIS BANK LTD. 2.84 ITC LTD. 2.80 Grand Total 59.27
Net Asset Value:SBI-ETF Nifty 50 `148.1527
Investors understand that their principalwill be at very high risk
Low
M
oderate High
Very High
L
ow to
Moderately
Mod
erate High
RISKOMETER
Cash, Cash Equivalents and Others: 0.02
Mr. Raviprakash Sharma
Fund Manager:
In managing this Fund: Since March 2013Total experience: Over 19 Years
Fund Manager’s Experience:
^Investors should consult their financial advisers if in doubt about whether the product is suitable for them.
Product Labelling:
This product is suitable for investors who are seeking^:• Long-term capital appreciation• Investment in securities covered by S&P BSE SENSEX
Investment Objective:
The investment objective of the scheme is to provide returns, before expenses, that closely correspond to the total returns of the securities as represented by the S&P BSE SENSEX by holding S&P BSE SENSEX stocks in the same proportion. However, the performance of the scheme may differ from that of the underlying index due to tracking error.
Scheme Details:
15/03/2013
`42,827.15 crores`42,574.92 crores
S&P BSE SENSEX TRIEntry: N.A. Exit: N.A. BSESBISENSEX/535276INF200K01VT2
Inception Date:AAUM for the Month of April 2021:AUM as on April 30, 2021:Benchmark/Underlying Index:Load Structure:Exchange Listed:Exchange Symbol/Scrip Code:ISIN:
SBISENX IN EquityBloomberg Code:
4,000 units and in multiples thereofCreation Unit Size:
Quantitative Data:
Tracking Error:1-year: 0.0243%3-years: 0.0279%
Tracking Error is computed using Total Returns Index for 1-Year and 3-Year Period ending April 30, 2021, based on day-end and month-end NAV respectively.
3
Record Date IDCW ` (in/Unit) NAV ( )`
Last IDCW:
Face Value: `10. Pursuant to payment of IDCW, the NAV of the Scheme would fall to the extent of payout and statutory levy, if applicable.
An open-ended Scheme trackingS&P BSE SENSEX Index
-ETF SENSEX
Top 10 Holdings:
(%) Of Total AUMStock NameRELIANCE INDUSTRIES LTD. 12.10 HDFC BANK LTD. 10.80 INFOSYS LTD. 9.31 HOUSING DEVELOPMENT FINANCE CORPORATION LTD. 8.18 ICICI BANK LTD. 7.79 TATA CONSULTANCY SERVICES LTD. 5.90 KOTAK MAHINDRA BANK LTD. 4.29 HINDUSTAN UNILEVER LTD. 3.94 AXIS BANK LTD. 3.53 ITC LTD. 3.32 Grand Total 69.16
Minimum Investment: Directly with Fund(For Authorized Participantsand Large Investors) - creation /redemption in exchange ofPortfolio Deposit and CashComponent in creation unit size onany business dayOn the exchange - Minimum lot of 1 unit in multiples thereof
25-Feb-21 4.50 550.725016-Mar-21 4.50 543.526624-Mar-21 4.50 526.0265
All data as of April 30, 2021
Total Expense Ratio: 0.069%
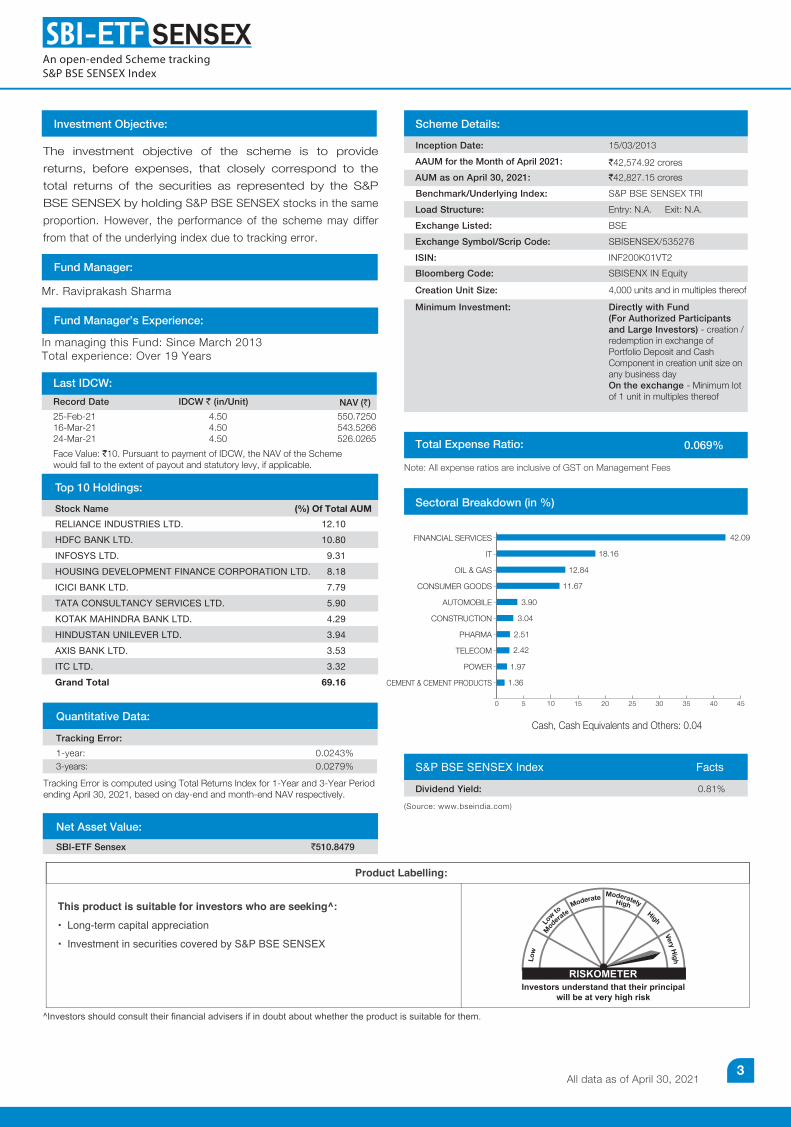
Sectoral Breakdown (in %)
42.09
18.16
12.84
11.67
3.90
3.04
2.51
2.42
1.97
1.36
0 5 10 15 20 25 30 35 40 45
FINANCIAL SERVICES
IT
OIL & GAS
CONSUMER GOODS
AUTOMOBILE
CONSTRUCTION
PHARMA
TELECOM
POWER
CEMENT & CEMENT PRODUCTS
Note: All expense ratios are inclusive of GST on Management Fees
Cash, Cash Equivalents and Others: 0.04
S&P BSE SENSEX Index Facts
(Source: www.bseindia.com)
Dividend Yield: 0.81%
Net Asset Value:SBI-ETF Sensex `510.8479
Investors understand that their principalwill be at very high risk
Low
M
oderate High
Very High
L
ow to
Moderately
Mod
erate High
RISKOMETER
An open-ended Exchange Traded Scheme tracking Nifty Bank Index
-ETF NIFTY BANK
^Investors should consult their financial advisers if in doubt about whether the product is suitable for them.
Product Labelling:
This product is suitable for investors who are seeking^:• Long-term capital appreciation• Investment in securities covered by Nifty Bank Index
Scheme Details:
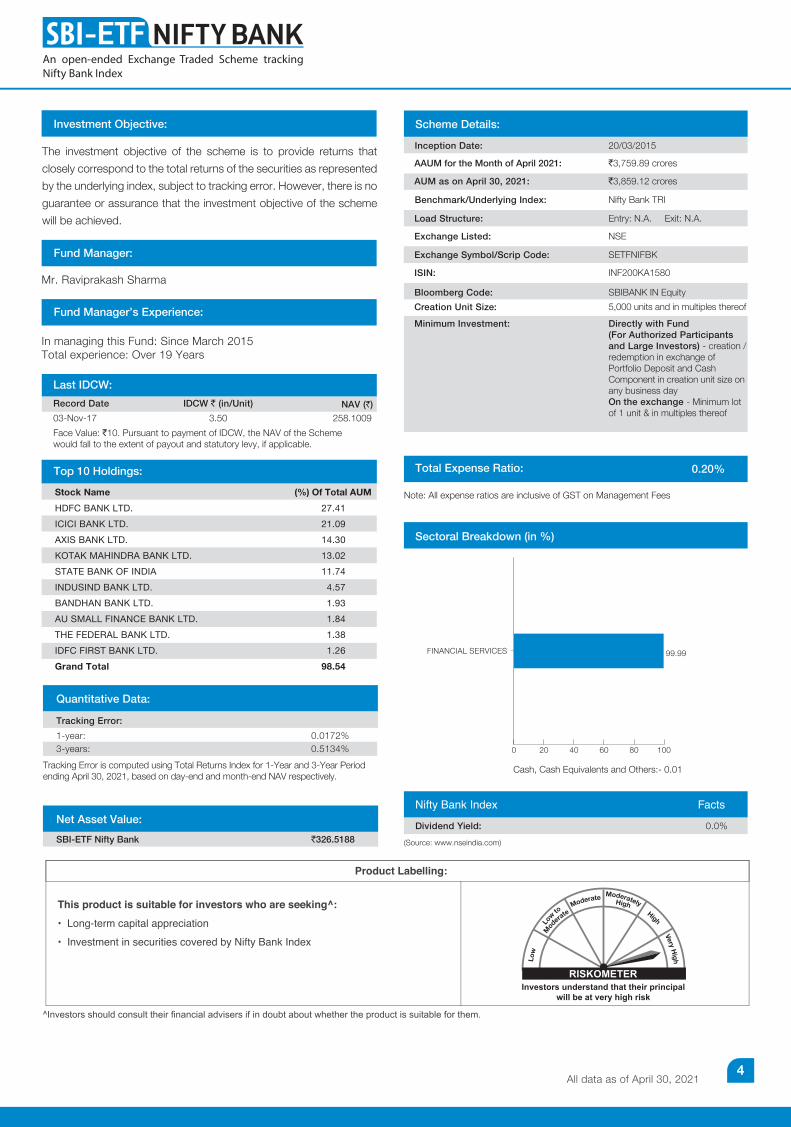
Sectoral Breakdown (in %)
20/03/2015Inception Date:
Nifty Bank TRIBenchmark/Underlying Index:
Entry: N.A. Exit: N.A. Load Structure:
NSEExchange Listed:
INF200KA1580ISIN:
5,000 units and in multiples thereofCreation Unit Size:
Investment Objective:
The investment objective of the scheme is to provide returns that closely correspond to the total returns of the securities as represented by the underlying index, subject to tracking error. However, there is no guarantee or assurance that the investment objective of the scheme will be achieved.
Fund Manager:
Mr. Raviprakash Sharma
Fund Manager’s Experience:
In managing this Fund: Since March 2015Total experience: Over 19 Years
AUM as on April 30, 2021: `3,859.12 crores
AAUM for the Month of April 2021: `3,759.89 crores
Total Expense Ratio: 0.20%
Note: All expense ratios are inclusive of GST on Management Fees
SBIBANK IN EquityBloomberg Code:
SETFNIFBKExchange Symbol/Scrip Code:
Quantitative Data:
Tracking Error:1-year: 0.0172%3-years: 0.5134%
Tracking Error is computed using Total Returns Index for 1-Year and 3-Year Periodending April 30, 2021, based on day-end and month-end NAV respectively.
4
0 20 40 60 80 100
FINANCIAL SERVICES 99.99
Record Date IDCW ` (in/Unit) NAV (`)03-Nov-17 3.50 258.1009
Last IDCW:
Face Value: `10. Pursuant to payment of IDCW, the NAV of the Scheme would fall to the extent of payout and statutory levy, if applicable.
Top 10 Holdings:
(%) Of Total AUMStock NameHDFC BANK LTD. 27.41 ICICI BANK LTD. 21.09 AXIS BANK LTD. 14.30 KOTAK MAHINDRA BANK LTD. 13.02 STATE BANK OF INDIA 11.74 INDUSIND BANK LTD. 4.57 BANDHAN BANK LTD. 1.93 AU SMALL FINANCE BANK LTD. 1.84 THE FEDERAL BANK LTD. 1.38 IDFC FIRST BANK LTD. 1.26 Grand Total 98.54
Nifty Bank Index Facts
(Source: www.nseindia.com)
Dividend Yield: 0.0%
Minimum Investment: Directly with Fund(For Authorized Participantsand Large Investors) - creation /redemption in exchange ofPortfolio Deposit and CashComponent in creation unit size onany business dayOn the exchange - Minimum lotof 1 unit & in multiples thereof
All data as of April 30, 2021
Net Asset Value:SBI-ETF Nifty Bank `326.5188
Investors understand that their principalwill be at very high risk
Low
M
oderate High
Very High
L
ow to
Moderately
Mod
erate High
RISKOMETER
Cash, Cash Equivalents and Others:- 0.01
^Investors should consult their financial advisers if in doubt about whether the product is suitable for them.
Product Labelling:
This product is suitable for investors who are seeking^:• Long-term capital appreciation• Investment in gold, gold bullion and gold-related securities
Scheme Details:
Load Structure:Exchange Listed: Exchange Symbol/Scrip Code: ISIN:
Creation Unit Size:Minimum Investment:
*The price here refers to, the morning fixing (AM) of Gold by London BullionMarket association (LBMA).
18/05/2009`2,144.55 crores
Price of Gold*Entry: N.A. Exit: N.A. NSESETFGOLDINF200K01099
Bloomberg Code: SGETS IN Equity
1,000 units
Investment Objective:
The investment objective of the Fund is to seek to provide returns that closely correspond to returns provided by the price of gold through investment in physical gold. However, the performance of the scheme may differ from that of the underlying asset due to tracking error.
Fund Manager:
Mr. Raviprakash Sharma
Fund Manager’s Experience:
In managing this Fund: Since February 2011Total experience: Over 19 Years
Inception Date:AAUM for the Month of April, 2021:AUM as on April 30, 2021:Benchmark/Underlying Index:
`2,197.03 crores
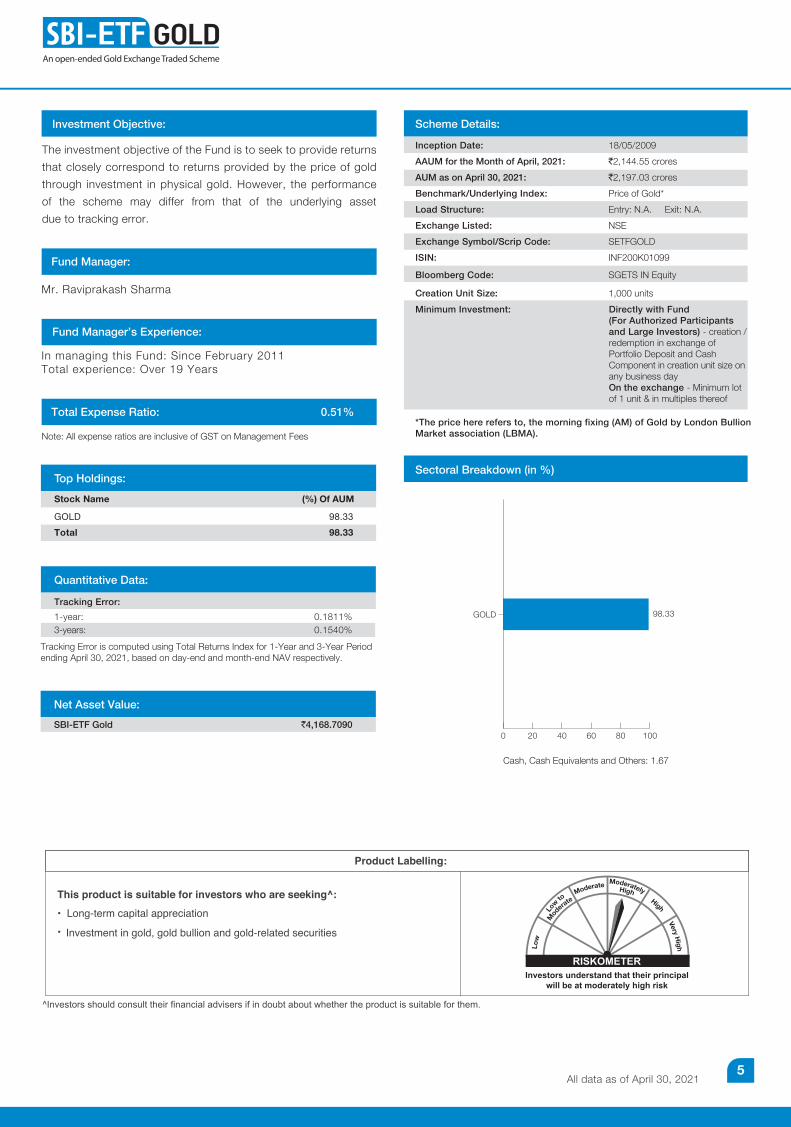
Sectoral Breakdown (in %)
0.51%Total Expense Ratio:
Note: All expense ratios are inclusive of GST on Management Fees
5
Quantitative Data:
Tracking Error:1-year: 0.1811%3-years: 0.1540%
Tracking Error is computed using Total Returns Index for 1-Year and 3-Year Period ending April 30, 2021, based on day-end and month-end NAV respectively.
0 20 40 60 80 100
GOLD 98.33
Top Holdings:(%) Of AUMStock Name
GOLD 98.33Total 98.33
An open-ended Gold Exchange Traded Scheme
-ETF GOLD
Directly with Fund(For Authorized Participantsand Large Investors) - creation /redemption in exchange ofPortfolio Deposit and CashComponent in creation unit size onany business dayOn the exchange - Minimum lotof 1 unit & in multiples thereof
Cash, Cash Equivalents and Others: 1.67
All data as of April 30, 2021
Net Asset Value:SBI-ETF Gold `4,168.7090
Investors understand that their principalwill be at moderately high risk
Low
M
oderate High
Very High
L
ow to
Moderately
Mod
erate High
RISKOMETER
Top 10 Holdings:
^Investors should consult their financial advisers if in doubt about whether the product is suitable for them.
Product Labelling:
•
•
Investment Objective:
Mr. Raviprakash Sharma
An open-ended Scheme tracking Nifty 50 Index
In managing this Fund: Since February 2011Total experience: Over 19 Years
Fund Manager:
Type of Scheme:
Fund Manager’s Experience:
Record Date IDCW ` (in/Unit) NAV ( )`
23-Mar-06 3.30 14.554128-Mar-05 3.80 15.0818
Last IDCW:
Face Value: `10. Pursuant to payment of IDCW, the NAV of IDCW Option ofschemes/plans would fall to the extent of payout and statutory levy, if applicable.
The scheme will adopt a passive investment strategy. The scheme invests in stocks comprising the Nifty 50 Index in the same proportion as in the Index, with the objective of achieving returns equivalent to Total Returns Index of Nifty 50 Index, by minimising the performance difference between the benchmark index and the scheme. The Total Returns Index is an index that reflects the returns on the index from index gain/loss plus dividend payments by the constituent stocks. However, there is no guarantee or assurance that the investment objective of the scheme will be achieved.
This product is suitable for investors who are seeking^: Long-term capital appreciation
Passive Investment in stocks comprising the Nifty 50 Index in the same proportion as in the index to achieve returns equivalent to the Total Returns Index of Nifty 50 Index
Net Asset Value:DIR PLAN - GROWTH `129.9794DIR PLAN - IDCW `66.763REG PLAN - GROWTH `125.4966REG PLAN - IDCW `64.3871
Scheme Details:
Plans Available:OptionsSIP:
Exchange Platform:
17/01/2002
NIFTY 50 TRI
BSE Star/MFSSRegular & DirectGrowth & Dividend
Inception Date:AAUM for the Month of April 2021: AUM as on April 30, 2021:Benchmark/Underlying Index:
`5,000 & in multiples of `1`1,000 & in multiples of `1
Minimum Investment:Additional Investment:
`1,186.77 crores
Load Structure:
'Any Day SIP' Facility is available for Monthly, Quarterly, Semi-Annual and Annual frequencies through electronic mode like OTM/Debit Mandate. Default SIP date will be 10th. In case the SIP due date is a Non Business Day, then the immediate following Business Day will be considered for SIP processing.• Daily - Minimum `500 & in multiples of `1 thereafter for minimum 12 installments• Weekly - Minimum `1,000 & in multiples of `1 thereafter for a minimum of 6 installments or minimum `500 & in multiples of `1 thereafter for a minimum of 12 installments• Monthly - Minimum ̀ 1,000 & in multiples of `1 thereafter for minimum six months (or) minimum `500 & in multiples of `1 thereafter for minimum one year• Quarterly - Minimum `1,500 & in multiples of `1 thereafter for minimum one year• Semi Annual - Minimum `3,000 & in multiples of `1 thereafter for a minimum of 4 installments• Annual - Minimum `5,000 & in multiples of `1 thereafter for a minimum of 4 installments
Entry: N.A. Exit:• For exit within 15 days from the date of allotment – 0.20%• For exit on or after 15 days from the date of allotment – Nil
`1,118.80 crores
*Portfolio Turnover = lower of total sale or total purchase for the last 12 months upon Avg. AUM of trailing twelve months. Tracking Error is computed using Total Returns Index for 1-Year and 3-Years period ending April 30, 2021, based on day-end and month-end NAV respectively. Tracking errors disclosed are of Regular Plan.
Regular: 0.48% Direct: 0.09%
Note: All expense ratios are inclusive of GST on Management Fees
Total Expense Ratio:
Quantitative Data:Portfolio Turnover*:Equity Turnover: 0.58Total Turnover: 0.88Total Turnover = Equity + Debt + Derivatives
Tracking Error1-Year 0.0880%3-Years 0.2286%
6
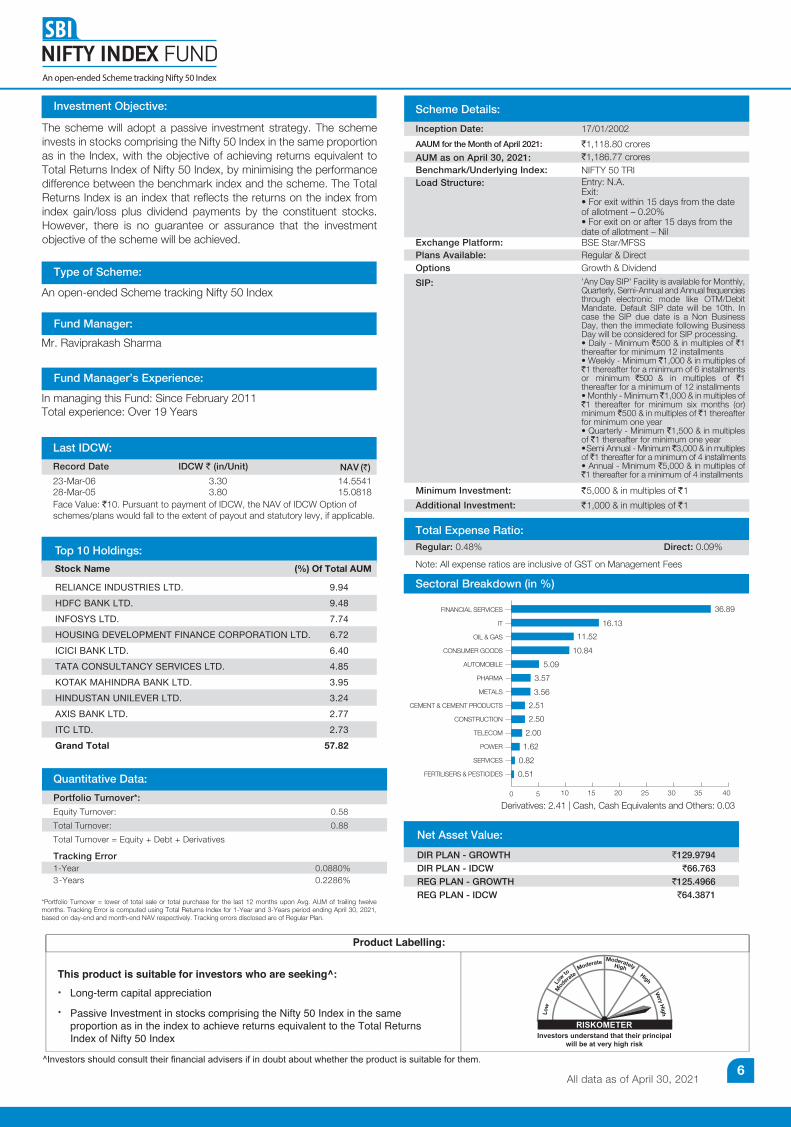
Sectoral Breakdown (in %)
NIFTY INDEX FUNDAn open-ended Scheme tracking Nifty 50 Index
(%) Of Total AUMStock Name
RELIANCE INDUSTRIES LTD. 9.94HDFC BANK LTD. 9.48INFOSYS LTD. 7.74HOUSING DEVELOPMENT FINANCE CORPORATION LTD. 6.72ICICI BANK LTD. 6.40TATA CONSULTANCY SERVICES LTD. 4.85KOTAK MAHINDRA BANK LTD. 3.95HINDUSTAN UNILEVER LTD. 3.24AXIS BANK LTD. 2.77ITC LTD. 2.73Grand Total 57.82
All data as of April 30, 2021
0 5 10 15 20 25 30 4035
36.89
1.62
2.50 2.00
0.82 0.51
2.51 3.56
16.13 11.52
10.84 5.09
3.57
FINANCIAL SERVICES
IT
OIL & GAS
CONSUMER GOODS
AUTOMOBILE
PHARMA
METALS
CEMENT & CEMENT PRODUCTS
CONSTRUCTION
TELECOM
POWER
SERVICES
FERTILISERS & PESTICIDES
Derivatives: 2.41 | Cash, Cash Equivalents and Others: 0.03
Investors understand that their principalwill be at very high risk
Low
M
oderate High
Very High
L
ow
to
Moderately
Mod
erate High
RISKOMETER
^Investors should consult their financial advisers if in doubt about whether the product is suitable for them.
Product Labelling:
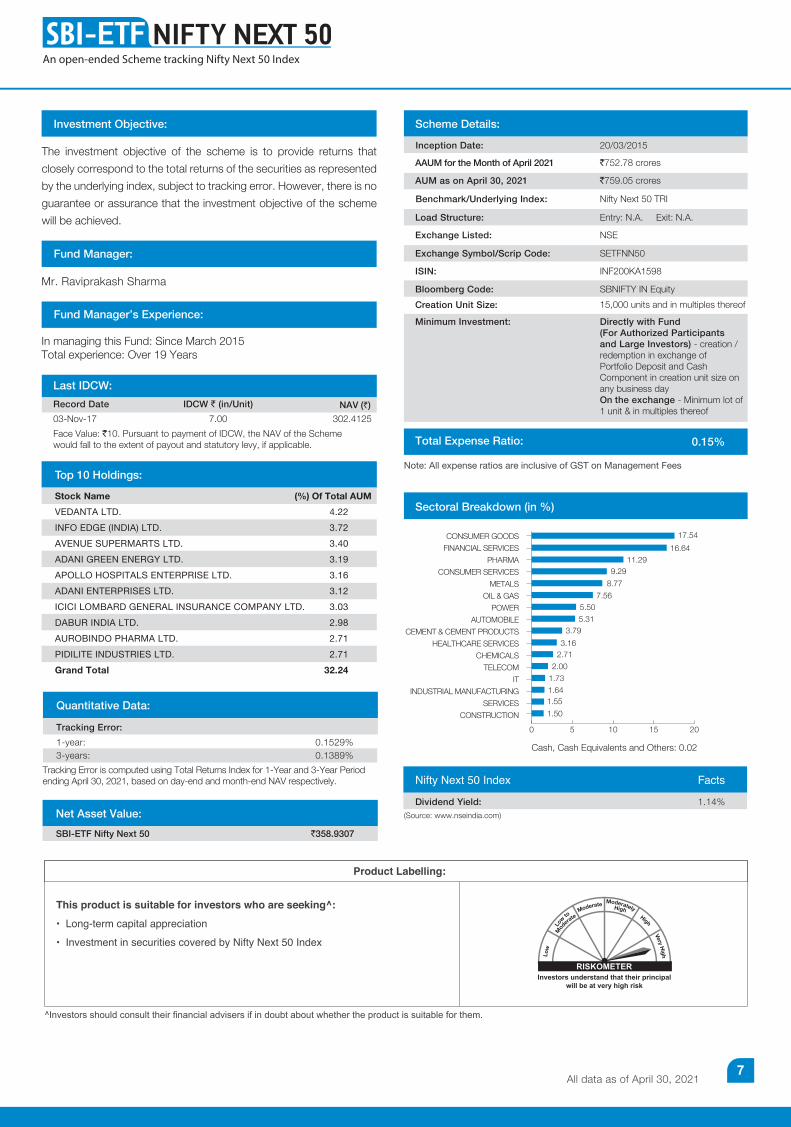
This product is suitable for investors who are seeking^:• Long-term capital appreciation• Investment in securities covered by Nifty Next 50 Index
Investment Objective:
The investment objective of the scheme is to provide returns that closely correspond to the total returns of the securities as represented by the underlying index, subject to tracking error. However, there is no guarantee or assurance that the investment objective of the scheme will be achieved.
Fund Manager:
Mr. Raviprakash Sharma
Fund Manager’s Experience:
In managing this Fund: Since March 2015Total experience: Over 19 Years
Sectoral Breakdown (in %)
Scheme Details:
20/03/2015Inception Date:
`752.78 croresAAUM for the Month of April 2021
Nifty Next 50 TRIBenchmark/Underlying Index:
Entry: N.A. Exit: N.A. Load Structure:
NSEExchange Listed:
SETFNN50Exchange Symbol/Scrip Code:
15,000 units and in multiples thereofCreation Unit Size:
AUM as on April 30, 2021 `759.05 crores
7
INF200KA1598ISIN:
SBNIFTY IN EquityBloomberg Code:
Quantitative Data:
Tracking Error:1-year: 0.1529%3-years: 0.1389%
Tracking Error is computed using Total Returns Index for 1-Year and 3-Year Periodending April 30, 2021, based on day-end and month-end NAV respectively.
Total Expense Ratio: 0.15%
Record Date IDCW ` (in/Unit) NAV ( )`
03-Nov-17 7.00 302.4125
Last IDCW:
Face Value: `10. Pursuant to payment of IDCW, the NAV of the Scheme would fall to the extent of payout and statutory levy, if applicable.
An open-ended Scheme tracking Nifty Next 50 Index
-ETF NIFTY NEXT 50
Note: All expense ratios are inclusive of GST on Management Fees
16.6417.54
11.29 9.29
8.777.56
5.50 5.31
3.793.16
2.712.00
1.73 1.64
0 5 10 15 20
1.551.50
CONSUMER GOODSFINANCIAL SERVICES
PHARMACONSUMER SERVICES
METALSOIL & GAS
POWERAUTOMOBILE
CEMENT & CEMENT PRODUCTSHEALTHCARE SERVICES
CHEMICALSTELECOM
ITINDUSTRIAL MANUFACTURING
SERVICESCONSTRUCTION
Top 10 Holdings:
(%) Of Total AUMStock NameVEDANTA LTD. 4.22INFO EDGE (INDIA) LTD. 3.72AVENUE SUPERMARTS LTD. 3.40ADANI GREEN ENERGY LTD. 3.19APOLLO HOSPITALS ENTERPRISE LTD. 3.16ADANI ENTERPRISES LTD. 3.12ICICI LOMBARD GENERAL INSURANCE COMPANY LTD. 3.03DABUR INDIA LTD. 2.98AUROBINDO PHARMA LTD. 2.71PIDILITE INDUSTRIES LTD. 2.71Grand Total 32.24
Nifty Next 50 Index Facts
(Source: www.nseindia.com)Dividend Yield: 1.14%
Minimum Investment: Directly with Fund(For Authorized Participantsand Large Investors) - creation /redemption in exchange ofPortfolio Deposit and CashComponent in creation unit size onany business dayOn the exchange - Minimum lot of1 unit & in multiples thereof
All data as of April 30, 2021
Net Asset Value:SBI-ETF Nifty Next 50 `358.9307
Investors understand that their principalwill be at very high risk
Low
M
oderate High
Very High
L
ow
to
Moderately
Mod
erate High
RISKOMETER
Cash, Cash Equivalents and Others: 0.02
8
^Investors should consult their financial advisers if in doubt about whether the product is suitable for them.
Product Labelling:
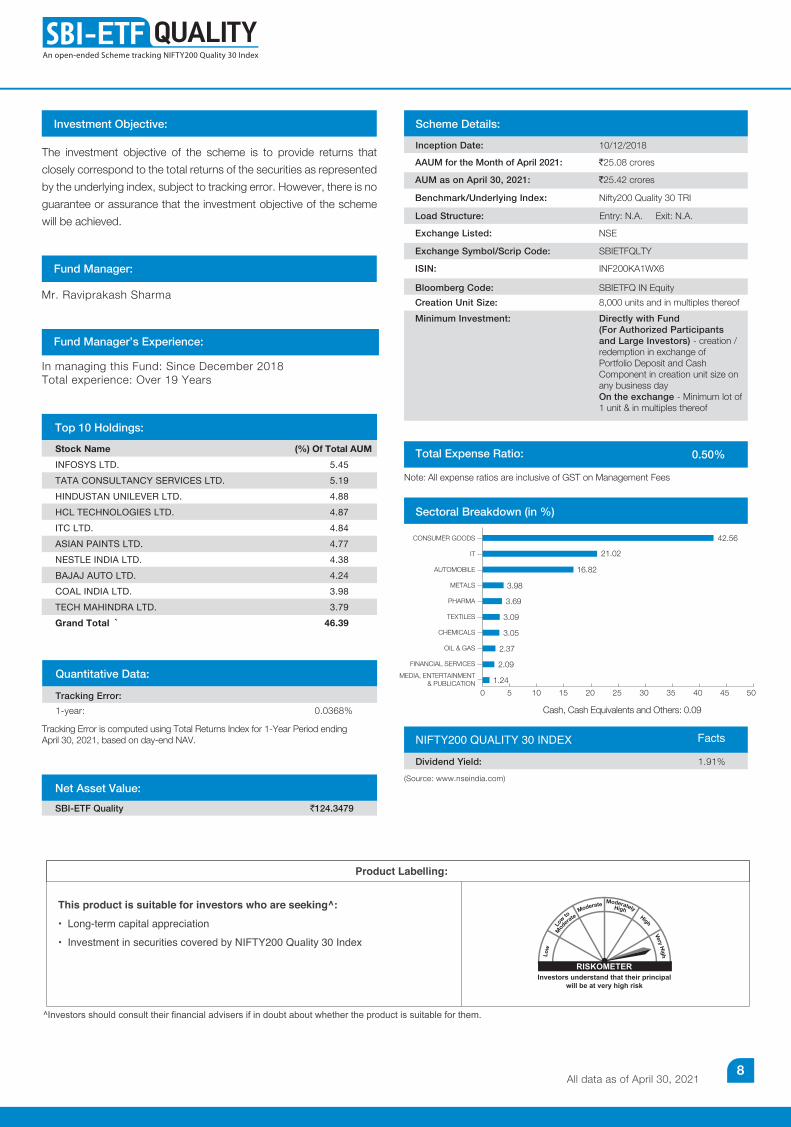
This product is suitable for investors who are seeking^:• Long-term capital appreciation• Investment in securities covered by NIFTY200 Quality 30 Index
Investment Objective:
The investment objective of the scheme is to provide returns that closely correspond to the total returns of the securities as represented by the underlying index, subject to tracking error. However, there is no guarantee or assurance that the investment objective of the scheme will be achieved.
Fund Manager:
Mr. Raviprakash Sharma
Fund Manager’s Experience:
In managing this Fund: Since December 2018Total experience: Over 19 Years
0.50%Total Expense Ratio:
Note: All expense ratios are inclusive of GST on Management Fees
NIFTY200 QUALITY 30 INDEX
Dividend Yield: 1.91%(Source: www.nseindia.com)
Facts
Scheme Details:
10/12/2018Inception Date:
Nifty200 Quality 30 TRIBenchmark/Underlying Index:
SBIETFQLTYExchange Symbol/Scrip Code:
INF200KA1WX6 ISIN:
SBIETFQ IN EquityBloomberg Code:8,000 units and in multiples thereofCreation Unit Size:
AAUM for the Month of April 2021: `25.08 crores
Load Structure: Entry: N.A. Exit: N.A.
Exchange Listed: NSE
AUM as on April 30, 2021: `25.42 crores
Sectoral Breakdown (in %)
Top 10 Holdings:
(%) Of Total AUMStock NameINFOSYS LTD. 5.45TATA CONSULTANCY SERVICES LTD. 5.19HINDUSTAN UNILEVER LTD. 4.88HCL TECHNOLOGIES LTD. 4.87ITC LTD. 4.84ASIAN PAINTS LTD. 4.77NESTLE INDIA LTD. 4.38BAJAJ AUTO LTD. 4.24COAL INDIA LTD. 3.98TECH MAHINDRA LTD. 3.79Grand Total ` 46.39
2.09
21.02
42.56
16.82
3.98
3.69
3.09
3.05
2.37
0 5 10 15 20 25 30 35 40 45 501.24
CONSUMER GOODS
IT
AUTOMOBILE
METALS
PHARMA
TEXTILES
CHEMICALS
OIL & GAS
FINANCIAL SERVICESMEDIA, ENTERTAINMENT
& PUBLICATIONQuantitative Data:
Tracking Error:1-year: 0.0368%
Tracking Error is computed using Total Returns Index for 1-Year Period endingApril 30, 2021, based on day-end NAV.
Minimum Investment: Directly with Fund(For Authorized Participantsand Large Investors) - creation /redemption in exchange ofPortfolio Deposit and CashComponent in creation unit size onany business dayOn the exchange - Minimum lot of 1 unit & in multiples thereof
Cash, Cash Equivalents and Others: 0.09
All data as of April 30, 2021
Net Asset Value:SBI-ETF Quality `124.3479
Investors understand that their principalwill be at very high risk
Low
M
oderate High
Very High
L
ow
to
Moderately
Mod
erate High
RISKOMETER
^Investors should consult their financial advisers if in doubt about whether the product is suitable for them.
Product Labelling:
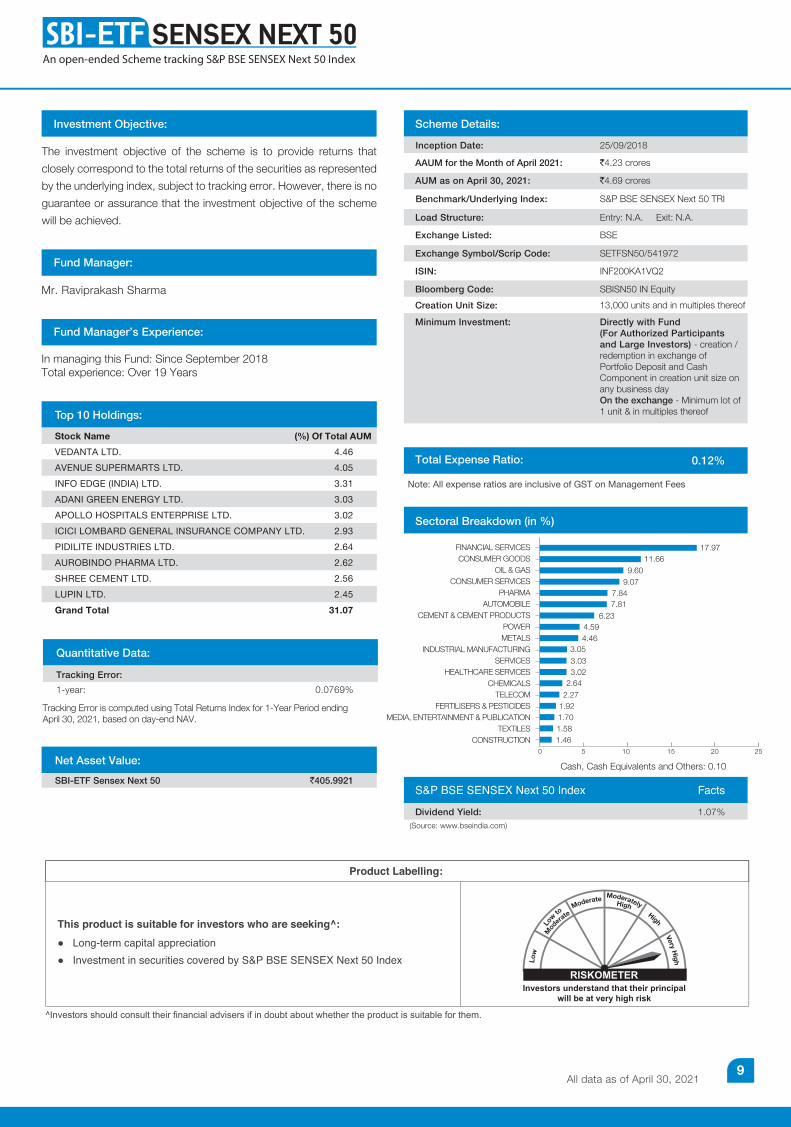
This product is suitable for investors who are seeking^: ● Long-term capital appreciation● Investment in securities covered by S&P BSE SENSEX Next 50 Index
Investment Objective:
The investment objective of the scheme is to provide returns that closely correspond to the total returns of the securities as represented by the underlying index, subject to tracking error. However, there is no guarantee or assurance that the investment objective of the scheme will be achieved.
Fund Manager:
Mr. Raviprakash Sharma
Fund Manager’s Experience:
In managing this Fund: Since September 2018Total experience: Over 19 Years
Sectoral Breakdown (in %)
Scheme Details:
25/09/2018Inception Date:
`4.23 croresAAUM for the Month of April 2021:
S&P BSE SENSEX Next 50 TRIBenchmark/Underlying Index:
Entry: N.A. Exit: N.A.Load Structure:
BSEExchange Listed:
SETFSN50/541972 Exchange Symbol/Scrip Code:
13,000 units and in multiples thereofCreation Unit Size:
AUM as on April 30, 2021: `4.69 crores
9
INF200KA1VQ2ISIN:
SBISN50 IN EquityBloomberg Code:
Total Expense Ratio: 0.12%
Note: All expense ratios are inclusive of GST on Management Fees
-ETF SENSEX NEXT 50An open-ended Scheme tracking S&P BSE SENSEX Next 50 Index
Investors understand that their principalwill be at very high risk
Low
M
oderate High
Very High
L
ow to
Moderately
Mod
erate High
RISKOMETER
S&P BSE SENSEX Next 50 Index Facts
(Source: www.bseindia.com)
Top 10 Holdings:
(%) Of Total AUMStock NameVEDANTA LTD. 4.46AVENUE SUPERMARTS LTD. 4.05INFO EDGE (INDIA) LTD. 3.31ADANI GREEN ENERGY LTD. 3.03APOLLO HOSPITALS ENTERPRISE LTD. 3.02ICICI LOMBARD GENERAL INSURANCE COMPANY LTD. 2.93PIDILITE INDUSTRIES LTD. 2.64AUROBINDO PHARMA LTD. 2.62SHREE CEMENT LTD. 2.56LUPIN LTD. 2.45Grand Total 31.07
Minimum Investment: Directly with Fund(For Authorized Participantsand Large Investors) - creation /redemption in exchange ofPortfolio Deposit and CashComponent in creation unit size onany business dayOn the exchange - Minimum lot of 1 unit & in multiples thereof
Quantitative Data:
Tracking Error:1-year: 0.0769%
Tracking Error is computed using Total Returns Index for 1-Year Period endingApril 30, 2021, based on day-end NAV.
Dividend Yield: 1.07%
Cash, Cash Equivalents and Others: 0.10
All data as of April 30, 2021
Net Asset Value:SBI-ETF Sensex Next 50 `405.9921
5
9.60 9.07
7.847.81
6.23 4.59
1.581.46
4.46 3.05 3.03 3.02
2.64 2.27
11.66 17.97
1.92 1.70
0 10 15 20 25
FINANCIAL SERVICESCONSUMER GOODS
OIL & GASCONSUMER SERVICES
PHARMAAUTOMOBILE
CEMENT & CEMENT PRODUCTSPOWERMETALS
INDUSTRIAL MANUFACTURINGSERVICES
HEALTHCARE SERVICESCHEMICALS
TELECOMFERTILISERS & PESTICIDES
MEDIA, ENTERTAINMENT & PUBLICATIONTEXTILES
CONSTRUCTION
^Investors should consult their financial advisers if in doubt about whether the product is suitable for them.
Product Labelling:
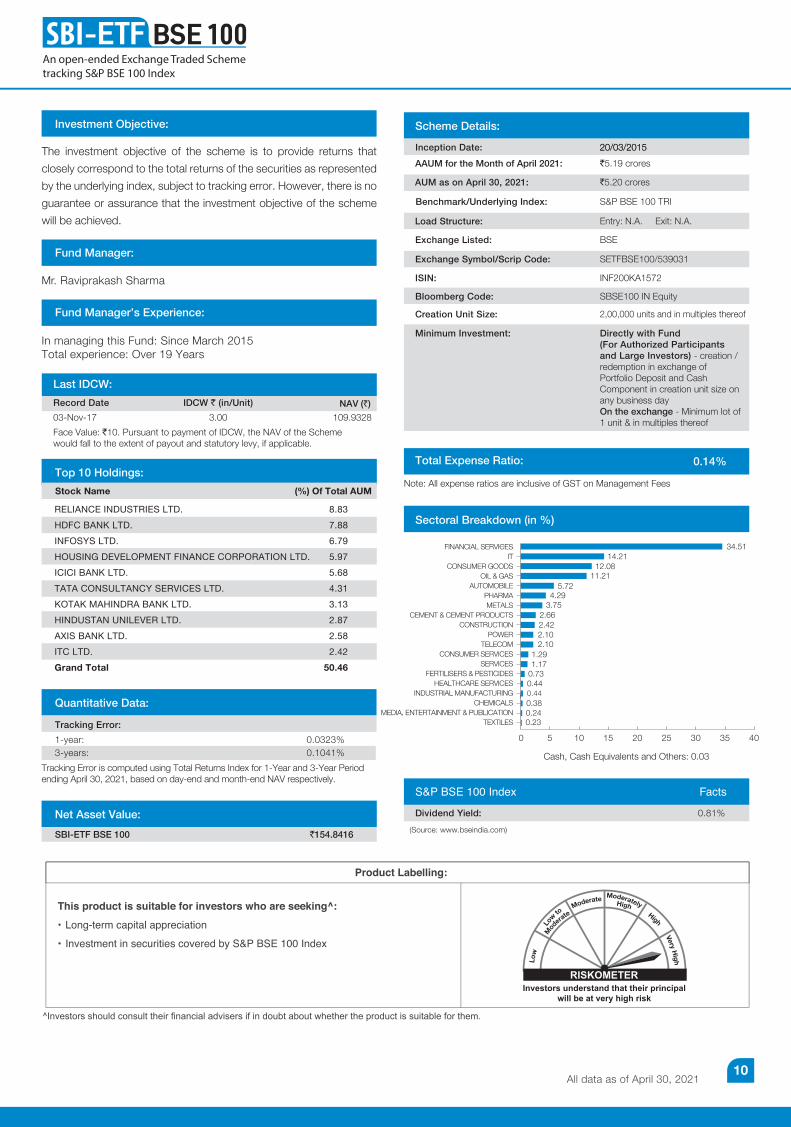
This product is suitable for investors who are seeking^:• Long-term capital appreciation• Investment in securities covered by S&P BSE 100 Index
Scheme Details:
Mr. Raviprakash Sharma
Fund Manager:
In managing this Fund: Since March 2015Total experience: Over 19 Years
Fund Manager’s Experience:
20/03/2015Inception Date:
S&P BSE 100 TRIBenchmark/Underlying Index:
Entry: N.A. Exit: N.A.Load Structure:
BSEExchange Listed:
SETFBSE100/539031Exchange Symbol/Scrip Code:
INF200KA1572ISIN:
Investment Objective:
The investment objective of the scheme is to provide returns that closely correspond to the total returns of the securities as represented by the underlying index, subject to tracking error. However, there is no guarantee or assurance that the investment objective of the scheme will be achieved.
AUM as on April 30, 2021: `5.20 crores
AAUM for the Month of April 2021: `5.19 crores
Total Expense Ratio: 0.14%
10
SBSE100 IN EquityBloomberg Code:
2,00,000 units and in multiples thereofCreation Unit Size:
Quantitative Data:
Tracking Error:1-year: 0.0323%3-years: 0.1041%
Tracking Error is computed using Total Returns Index for 1-Year and 3-Year Periodending April 30, 2021, based on day-end and month-end NAV respectively.
Record Date IDCW ` (in/Unit) NAV ( )`
03-Nov-17 3.00 109.9328
Last IDCW:
Face Value: `10. Pursuant to payment of IDCW, the NAV of the Scheme would fall to the extent of payout and statutory levy, if applicable.
Sectoral Breakdown (in %)
An open-ended Exchange Traded Scheme tracking S&P BSE 100 Index
-ETF BSE 100
Note: All expense ratios are inclusive of GST on Management Fees
20/03/2015
S&P BSE 100 Index Facts
(Source: www.bseindia.com)
Top 10 Holdings:(%) Of Total AUMStock Name
RELIANCE INDUSTRIES LTD. 8.83HDFC BANK LTD. 7.88INFOSYS LTD. 6.79HOUSING DEVELOPMENT FINANCE CORPORATION LTD. 5.97ICICI BANK LTD. 5.68TATA CONSULTANCY SERVICES LTD. 4.31KOTAK MAHINDRA BANK LTD. 3.13HINDUSTAN UNILEVER LTD. 2.87AXIS BANK LTD. 2.58ITC LTD. 2.42Grand Total 50.46
Minimum Investment: Directly with Fund(For Authorized Participantsand Large Investors) - creation /redemption in exchange ofPortfolio Deposit and CashComponent in creation unit size onany business dayOn the exchange - Minimum lot of1 unit & in multiples thereof
0 5 10 15 20 25 30 35 40
0.73
0.440.44
0.38 0.240.23
34.5114.21
12.0811.21
5.724.29
3.75 2.66 2.42 2.102.10
1.291.17
FINANCIAL SERVICESIT
CONSUMER GOODSOIL & GAS
AUTOMOBILEPHARMAMETALS
CEMENT & CEMENT PRODUCTSCONSTRUCTION
POWERTELECOM
CONSUMER SERVICESSERVICES
FERTILISERS & PESTICIDESHEALTHCARE SERVICES
INDUSTRIAL MANUFACTURINGCHEMICALS
MEDIA, ENTERTAINMENT & PUBLICATIONTEXTILES
Dividend Yield: 0.81%
Cash, Cash Equivalents and Others: 0.03
All data as of April 30, 2021
Net Asset Value:SBI-ETF BSE 100 `154.8416
Investors understand that their principalwill be at very high risk
Low
M
oderate High
Very High
L
ow to
Moderately
Mod
erate High
RISKOMETER
^Investors should consult their financial advisers if in doubt about whether the product is suitable for them.
Product Labelling:
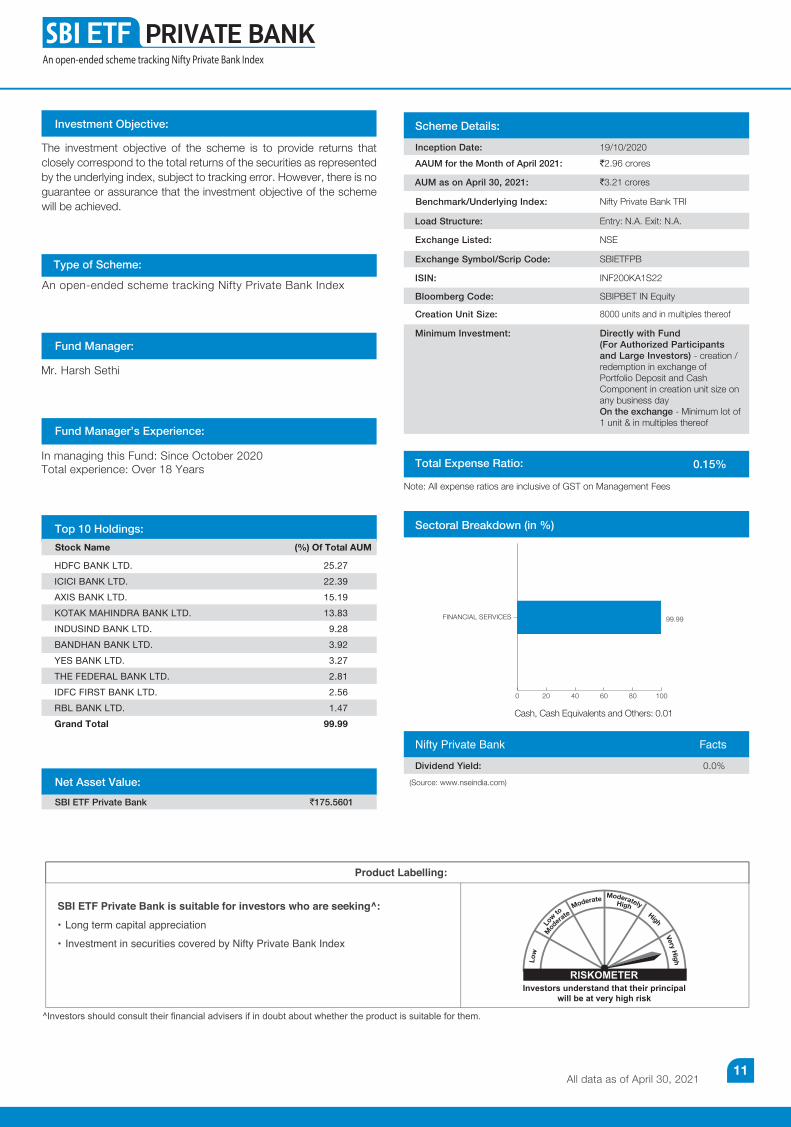
SBI ETF Private Bank is suitable for investors who are seeking^:• Long term capital appreciation• Investment in securities covered by Nifty Private Bank Index
Scheme Details:
Mr. Harsh Sethi
Fund Manager:
In managing this Fund: Since October 2020Total experience: Over 18 Years
Fund Manager’s Experience:
19/10/2020Inception Date:
Nifty Private Bank TRIBenchmark/Underlying Index:
Entry: N.A. Exit: N.A.Load Structure:
NSEExchange Listed:
SBIETFPBExchange Symbol/Scrip Code:
INF200KA1S22ISIN:
Investment Objective:
The investment objective of the scheme is to provide returns that closely correspond to the total returns of the securities as represented by the underlying index, subject to tracking error. However, there is no guarantee or assurance that the investment objective of the scheme will be achieved.
AUM as on April 30, 2021: `3.21 crores
AAUM for the Month of April 2021: `2.96 crores
11
SBIPBET IN EquityBloomberg Code:
8000 units and in multiples thereofCreation Unit Size:
Total Expense Ratio: 0.15%
Note: All expense ratios are inclusive of GST on Management Fees
Top 10 Holdings:(%) Of Total AUMStock Name
HDFC BANK LTD. 25.27ICICI BANK LTD. 22.39AXIS BANK LTD. 15.19KOTAK MAHINDRA BANK LTD. 13.83INDUSIND BANK LTD. 9.28BANDHAN BANK LTD. 3.92YES BANK LTD. 3.27THE FEDERAL BANK LTD. 2.81IDFC FIRST BANK LTD. 2.56RBL BANK LTD. 1.47Grand Total 99.99
Minimum Investment: Directly with Fund(For Authorized Participantsand Large Investors) - creation /redemption in exchange ofPortfolio Deposit and CashComponent in creation unit size onany business dayOn the exchange - Minimum lot of1 unit & in multiples thereof
Nifty Private Bank Facts
(Source: www.nseindia.com)
Dividend Yield: 0.0%
Sectoral Breakdown (in %)
0 20 40 60 80 100
FINANCIAL SERVICES 99.99
All data as of April 30, 2021
Type of Scheme:
An open-ended scheme tracking Nifty Private Bank Index
Net Asset Value:SBI ETF Private Bank `175.5601
Investors understand that their principalwill be at very high risk
Low
M
oderate High
Very High
L
ow to
Moderately
Mod
erate High
RISKOMETER
Cash, Cash Equivalents and Others: 0.01
^Investors should consult their financial advisers if in doubt about whether the product is suitable for them.
Product Labelling:
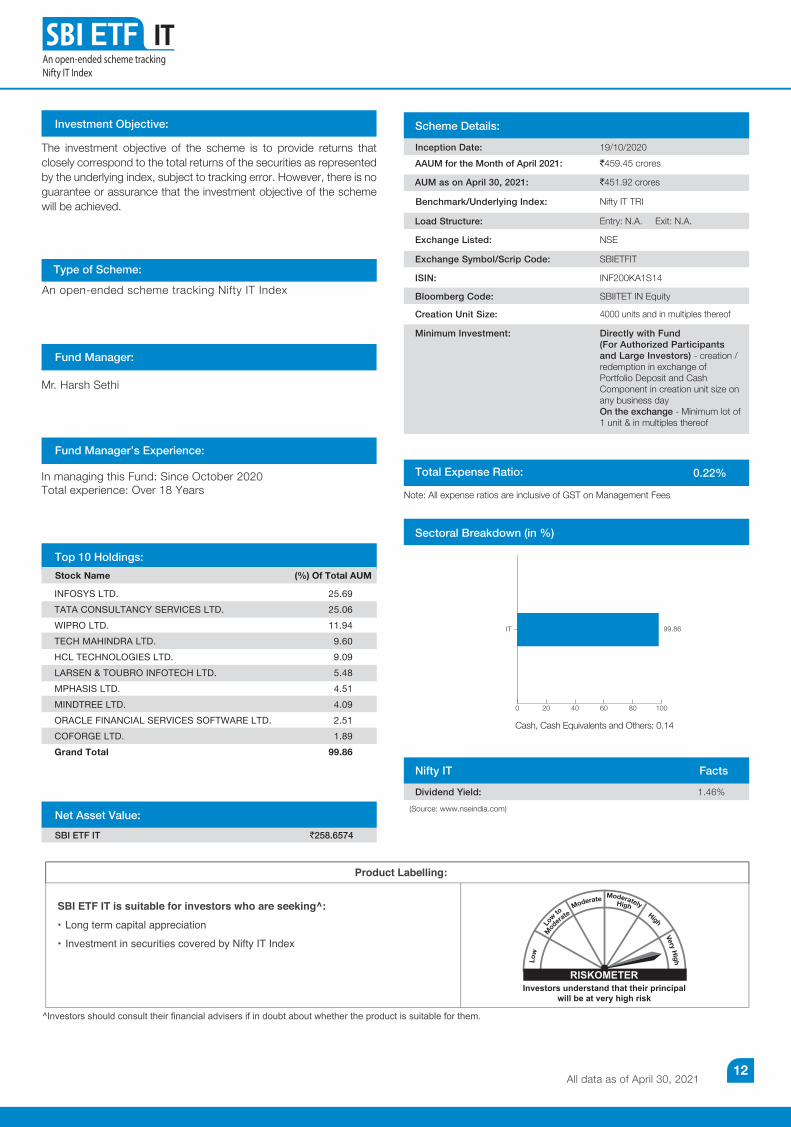
SBI ETF IT is suitable for investors who are seeking^:• Long term capital appreciation• Investment in securities covered by Nifty IT Index
Mr. Harsh Sethi
Fund Manager:
In managing this Fund: Since October 2020Total experience: Over 18 Years
Fund Manager’s Experience:
Investment Objective:
The investment objective of the scheme is to provide returns that closely correspond to the total returns of the securities as represented by the underlying index, subject to tracking error. However, there is no guarantee or assurance that the investment objective of the scheme will be achieved.
12
Total Expense Ratio: 0.22%
Note: All expense ratios are inclusive of GST on Management Fees
Top 10 Holdings:(%) Of Total AUMStock Name
INFOSYS LTD. 25.69TATA CONSULTANCY SERVICES LTD. 25.06WIPRO LTD. 11.94TECH MAHINDRA LTD. 9.60HCL TECHNOLOGIES LTD. 9.09LARSEN & TOUBRO INFOTECH LTD. 5.48MPHASIS LTD. 4.51MINDTREE LTD. 4.09ORACLE FINANCIAL SERVICES SOFTWARE LTD. 2.51COFORGE LTD. 1.89Grand Total 99.86
Scheme Details:
19/10/2020Inception Date:
Nifty IT TRIBenchmark/Underlying Index:
Entry: N.A. Exit: N.A. Load Structure:
NSEExchange Listed:
SBIETFITExchange Symbol/Scrip Code:
INF200KA1S14ISIN:
AUM as on April 30, 2021: `451.92 crores
AAUM for the Month of April 2021: `459.45 crores
SBIITET IN EquityBloomberg Code:
4000 units and in multiples thereofCreation Unit Size:
Minimum Investment: Directly with Fund(For Authorized Participantsand Large Investors) - creation /redemption in exchange ofPortfolio Deposit and CashComponent in creation unit size onany business dayOn the exchange - Minimum lot of1 unit & in multiples thereof
Nifty IT Facts
(Source: www.nseindia.com)
Dividend Yield: 1.46%
All data as of April 30, 2021
Sectoral Breakdown (in %)
0 20 40 60 80 100
IT 99.86
Type of Scheme:
An open-ended scheme tracking Nifty IT Index
Net Asset Value:SBI ETF IT `258.6574
Investors understand that their principalwill be at very high risk
Low
M
oderate High
Very High
L
ow to
Moderately
Mod
erate High
RISKOMETER
Cash, Cash Equivalents and Others: 0.14
Quantitative Data:
Tracking Error:1-year: 0.6017%3-years: 0.1706%
Tracking Error is computed using Total Returns Index for 1-Year and 3-Year Period ending April 30, 2021, based on day-end and month-end NAV respectively.
Mr. Dinesh Ahuja
Fund Manager:
In managing this Fund: Since January 2020Total experience: Over 20 Years
Fund Manager’s Experience:
Investment Objective:
The investment objective of the scheme is to provide returns that closely correspond to the total returns of the securities as represented by the underlying index, subject to tracking error. However, there is no guarantee or assurance that the investment objective of the scheme will be achieved.
13
Note: All expense ratios are inclusive of GST on Management Fees
0.14%Total Expense Ratio:
•
•
^Investors should consult their financial advisers if in doubt about whether the product is suitable for them.
Product Labelling:
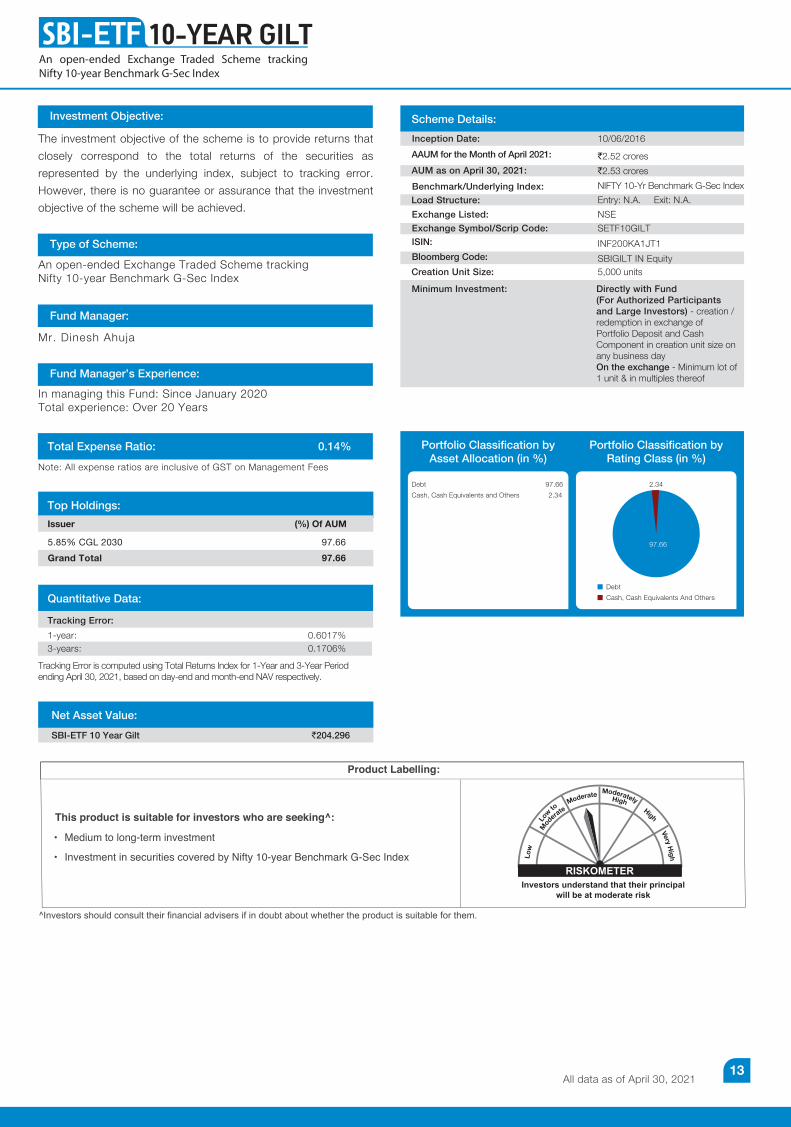
This product is suitable for investors who are seeking^:
Medium to long-term investment
Investment in securities covered by Nifty 10-year Benchmark G-Sec Index
An open-ended Exchange Traded Scheme tracking Nifty 10-year Benchmark G-Sec Index
-ETF 10-YEAR GILT
Type of Scheme:
An open-ended Exchange Traded Scheme tracking Nifty 10-year Benchmark G-Sec Index
Top Holdings:(%) Of AUMIssuer
5.85% CGL 2030 97.66Grand Total 97.66
All data as of April 30, 2021
Scheme Details:
Exchange Symbol/Scrip Code:Exchange Listed:
10/06/2016
NIFTY 10-Yr Benchmark G-Sec Index
NSESETF10GILT
ISIN: INF200KA1JT1Bloomberg Code: SBIGILT IN Equity
Inception Date:AAUM for the Month of April 2021:AUM as on April 30, 2021:Benchmark/Underlying Index:
`2.53 crores`2.52 crores
Creation Unit Size: 5,000 units
Entry: N.A. Exit: N.A.Load Structure:
Minimum Investment: Directly with Fund(For Authorized Participantsand Large Investors) - creation /redemption in exchange ofPortfolio Deposit and CashComponent in creation unit size onany business dayOn the exchange - Minimum lot of 1 unit & in multiples thereof
Debt 97.66Cash, Cash Equivalents and Others 2.34
2.34
97.66
DebtCash, Cash Equivalents And Others
Portfolio Classification byAsset Allocation (in %)
Portfolio Classification byRating Class (in %)
Net Asset Value:SBI-ETF 10 Year Gilt `204.296
Low
M
oderate High
Very High
L
ow to
Moderately
Mod
erate High
Investors understand that their principalwill be at moderate risk
RISKOMETER
Comparative Performance of Schemes
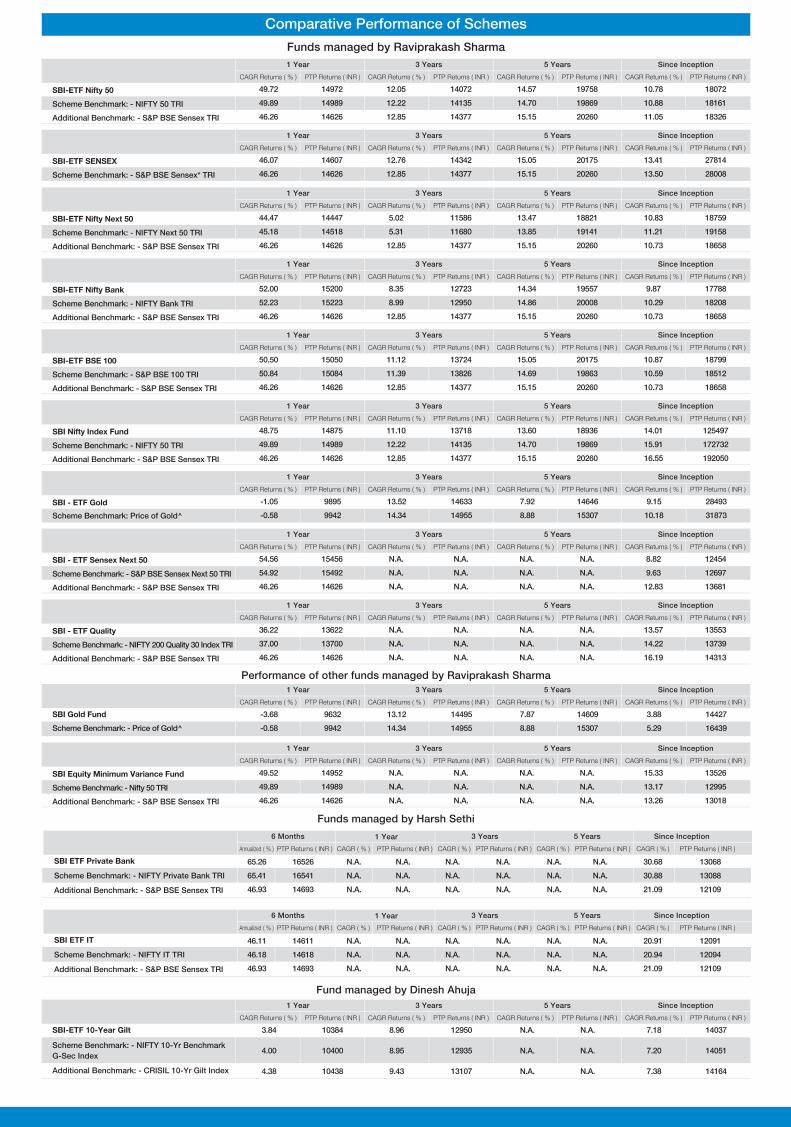
Fund managed by Dinesh Ahuja1 Year 3 Years 5 Years Since Inception
CAGR Returns ( % ) PTP Returns ( INR ) CAGR Returns ( % ) PTP Returns ( INR ) CAGR Returns ( % ) PTP Returns ( INR ) CAGR Returns ( % ) PTP Returns ( INR )
SBI-ETF 10-Year Gilt
Scheme Benchmark: - NIFTY 10-Yr Benchmark G-Sec Index
Additional Benchmark: - CRISIL 10-Yr Gilt Index
3.84 10384 8.96 12950 N.A. N.A. 7.18 14037
4.00 10400 8.95 12935 N.A. N.A. 7.20 14051
4.38 10438 9.43 13107 N.A. N.A. 7.38 14164
Funds managed by Raviprakash Sharma
1 Year 3 Years 5 Years Since InceptionCAGR Returns ( % ) PTP Returns ( INR ) CAGR Returns ( % ) PTP Returns ( INR ) CAGR Returns ( % ) PTP Returns ( INR ) CAGR Returns ( % ) PTP Returns ( INR )
-1.05 9895 13.52 14633 7.92 14646 9.15 28493 -0.58 9942 14.34 14955 8.88 15307 10.18 31873
SBI - ETF GoldScheme Benchmark: Price of Gold^
1 Year 3 Years 5 Years Since InceptionCAGR Returns ( % ) PTP Returns ( INR ) CAGR Returns ( % ) PTP Returns ( INR ) CAGR Returns ( % ) PTP Returns ( INR ) CAGR Returns ( % ) PTP Returns ( INR )
SBI-ETF Nifty 50Scheme Benchmark: - NIFTY 50 TRI Additional Benchmark: - S&P BSE Sensex TRI
49.72 14972 12.05 14072 14.57 19758 10.78 18072 49.89 14989 12.22 14135 14.70 19869 10.88 18161 46.26 14626 12.85 14377 15.15 20260 11.05 18326
1 Year 3 Years 5 Years Since InceptionCAGR Returns ( % ) PTP Returns ( INR ) CAGR Returns ( % ) PTP Returns ( INR ) CAGR Returns ( % ) PTP Returns ( INR ) CAGR Returns ( % ) PTP Returns ( INR )
SBI-ETF SENSEXScheme Benchmark: - S&P BSE Sensex* TRI
46.07 14607 12.76 14342 15.05 20175 13.41 27814 46.26 14626 12.85 14377 15.15 20260 13.50 28008
1 Year 3 Years 5 Years Since InceptionCAGR Returns ( % ) PTP Returns ( INR ) CAGR Returns ( % ) PTP Returns ( INR ) CAGR Returns ( % ) PTP Returns ( INR ) CAGR Returns ( % ) PTP Returns ( INR )
SBI-ETF Nifty Next 50Scheme Benchmark: - NIFTY Next 50 TRI Additional Benchmark: - S&P BSE Sensex TRI
44.47 14447 5.02 11586 13.47 18821 10.83 18759 45.18 14518 5.31 11680 13.85 19141 11.21 19158 46.26 14626 12.85 14377 15.15 20260 10.73 18658
1 Year 3 Years 5 Years Since InceptionCAGR Returns ( % ) PTP Returns ( INR ) CAGR Returns ( % ) PTP Returns ( INR ) CAGR Returns ( % ) PTP Returns ( INR ) CAGR Returns ( % ) PTP Returns ( INR )
SBI-ETF Nifty BankScheme Benchmark: - NIFTY Bank TRI Additional Benchmark: - S&P BSE Sensex TRI
52.00 15200 8.35 12723 14.34 19557 9.87 17788 52.23 15223 8.99 12950 14.86 20008 10.29 18208 46.26 14626 12.85 14377 15.15 20260 10.73 18658
1 Year 3 Years 5 Years Since InceptionCAGR Returns ( % ) PTP Returns ( INR ) CAGR Returns ( % ) PTP Returns ( INR ) CAGR Returns ( % ) PTP Returns ( INR ) CAGR Returns ( % ) PTP Returns ( INR )
SBI-ETF BSE 100Scheme Benchmark: - S&P BSE 100 TRIAdditional Benchmark: - S&P BSE Sensex TRI
50.50 15050 11.12 13724 15.05 20175 10.87 18799 50.84 15084 11.39 13826 14.69 19863 10.59 18512 46.26 14626 12.85 14377 15.15 20260 10.73 18658
1 Year 3 Years 5 Years Since InceptionCAGR Returns ( % ) PTP Returns ( INR ) CAGR Returns ( % ) PTP Returns ( INR ) CAGR Returns ( % ) PTP Returns ( INR ) CAGR Returns ( % ) PTP Returns ( INR )
SBI Nifty Index FundScheme Benchmark: - NIFTY 50 TRIAdditional Benchmark: - S&P BSE Sensex TRI
48.75 14875 11.10 13718 13.60 18936 14.01 125497 49.89 14989 12.22 14135 14.70 19869 15.91 172732 46.26 14626 12.85 14377 15.15 20260 16.55 192050
1 Year 3 Years 5 Years Since InceptionCAGR Returns ( % ) PTP Returns ( INR ) CAGR Returns ( % ) PTP Returns ( INR ) CAGR Returns ( % ) PTP Returns ( INR ) CAGR Returns ( % ) PTP Returns ( INR )
SBI - ETF Sensex Next 50Scheme Benchmark: - S&P BSE Sensex Next 50 TRIAdditional Benchmark: - S&P BSE Sensex TRI
54.56 15456 N.A. N.A. N.A. N.A. 8.82 12454 54.92 15492 N.A. N.A. N.A. N.A. 9.63 12697 46.26 14626 N.A. N.A. N.A. N.A. 12.83 13681
1 Year 3 Years 5 Years Since InceptionCAGR Returns ( % ) PTP Returns ( INR ) CAGR Returns ( % ) PTP Returns ( INR ) CAGR Returns ( % ) PTP Returns ( INR ) CAGR Returns ( % ) PTP Returns ( INR )
SBI - ETF QualityScheme Benchmark: - NIFTY 200 Quality 30 Index TRIAdditional Benchmark: - S&P BSE Sensex TRI
36.22 13622 N.A. N.A. N.A. N.A. 13.57 13553 37.00 13700 N.A. N.A. N.A. N.A. 14.22 13739 46.26 14626 N.A. N.A. N.A. N.A. 16.19 14313
1 Year 3 Years 5 Years Since InceptionCAGR Returns ( % ) PTP Returns ( INR ) CAGR Returns ( % ) PTP Returns ( INR ) CAGR Returns ( % ) PTP Returns ( INR ) CAGR Returns ( % ) PTP Returns ( INR )
SBI Equity Minimum Variance FundScheme Benchmark: - Nifty 50 TRIAdditional Benchmark: - S&P BSE Sensex TRI
49.52 14952 N.A. N.A. N.A. N.A. 15.33 13526 49.89 14989 N.A. N.A. N.A. N.A. 13.17 12995 46.26 14626 N.A. N.A. N.A. N.A. 13.26 13018
Funds managed by Harsh Sethi
Performance of other funds managed by Raviprakash Sharma1 Year 3 Years 5 Years Since Inception
CAGR Returns ( % ) PTP Returns ( INR ) CAGR Returns ( % ) PTP Returns ( INR ) CAGR Returns ( % ) PTP Returns ( INR ) CAGR Returns ( % ) PTP Returns ( INR )
SBI Gold FundScheme Benchmark: - Price of Gold^
-3.68 9632 13.12 14495 7.87 14609 3.88 14427 -0.58 9942 14.34 14955 8.88 15307 5.29 16439
1 Year 3 Years 5 Years6 Months Since InceptionAnnualized ( % ) PTP Returns ( INR ) CAGR ( % ) PTP Returns ( INR ) CAGR ( % ) PTP Returns ( INR ) CAGR ( % ) PTP Returns ( INR )
SBI ETF Private Bank
Scheme Benchmark: - NIFTY Private Bank TRI
Additional Benchmark: - S&P BSE Sensex TRI
65.26 16526 N.A. N.A. N.A. N.A. N.A. N.A. 30.68 13068 65.41 16541 N.A. N.A. N.A. N.A. N.A. N.A. 30.88 13088 46.93 14693 N.A. N.A. N.A. N.A. N.A. N.A. 21.09 12109
CAGR ( % ) PTP Returns ( INR )
1 Year 3 Years 5 Years6 Months Since InceptionAnnualized ( % ) PTP Returns ( INR ) CAGR ( % ) PTP Returns ( INR ) CAGR ( % ) PTP Returns ( INR ) CAGR ( % ) PTP Returns ( INR )
SBI ETF IT
Scheme Benchmark: - NIFTY IT TRI
Additional Benchmark: - S&P BSE Sensex TRI
46.11 14611 N.A. N.A. N.A. N.A. N.A. N.A. 20.91 12091 46.18 14618 N.A. N.A. N.A. N.A. N.A. N.A. 20.94 12094 46.93 14693 N.A. N.A. N.A. N.A. N.A. N.A. 21.09 12109
CAGR ( % ) PTP Returns ( INR )
1 Year 3 Years 5 Years Since InceptionCAGR Returns ( % ) PTP Returns ( INR ) CAGR Returns ( % ) PTP Returns ( INR ) CAGR Returns ( % ) PTP Returns ( INR ) CAGR Returns ( % ) PTP Returns ( INR )
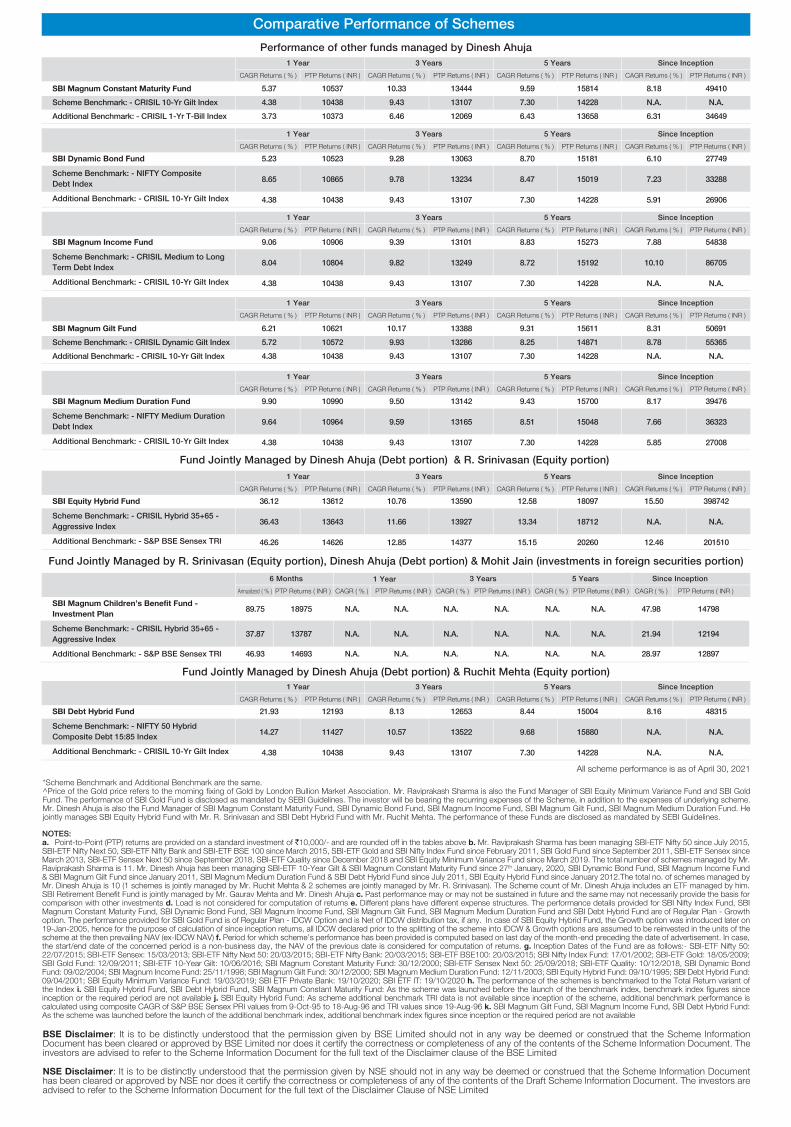
SBI Dynamic Bond Fund
Scheme Benchmark: - NIFTY Composite Debt Index
Additional Benchmark: - CRISIL 10-Yr Gilt Index
5.23 10523 9.28 13063 8.70 15181 6.10 27749
8.65 10865 9.78 13234 8.47 15019 7.23 33288
4.38 10438 9.43 13107 7.30 14228 5.91 26906
Performance of other funds managed by Dinesh Ahuja1 Year 3 Years
CAGR Returns ( % ) PTP Returns ( INR ) CAGR Returns ( % ) PTP Returns ( INR )
SBI Magnum Constant Maturity FundScheme Benchmark: - CRISIL 10-Yr Gilt IndexAdditional Benchmark: - CRISIL 1-Yr T-Bill Index
5.37 10537 10.33 13444 9.59 15814 8.18 49410 4.38 10438 9.43 13107 7.30 14228 N.A. N.A. 3.73 10373 6.46 12069 6.43 13658 6.31 34649
5 Years Since InceptionCAGR Returns ( % ) PTP Returns ( INR ) CAGR Returns ( % ) PTP Returns ( INR )
NOTES:a. Point-to-Point (PTP) returns are provided on a standard investment of `10,000/- and are rounded off in the tables above b. Mr. Raviprakash Sharma has been managing SBI-ETF Nifty 50 since July 2015, SBI-ETF Nifty Next 50, SBI-ETF Nifty Bank and SBI-ETF BSE 100 since March 2015, SBI-ETF Gold and SBI Nifty Index Fund since February 2011, SBI Gold Fund since September 2011, SBI-ETF Sensex since March 2013, SBI-ETF Sensex Next 50 since September 2018, SBI-ETF Quality since December 2018 and SBI Equity Minimum Variance Fund since March 2019. The total number of schemes managed by Mr. Raviprakash Sharma is 11. Mr. Dinesh Ahuja has been managing SBI-ETF 10-Year Gilt & SBI Magnum Constant Maturity Fund since 27th January, 2020, SBI Dynamic Bond Fund, SBI Magnum Income Fund & SBI Magnum Gilt Fund since January 2011, SBI Magnum Medium Duration Fund & SBI Debt Hybrid Fund since July 2011, SBI Equity Hybrid Fund since January 2012.The total no. of schemes managed by Mr. Dinesh Ahuja is 10 (1 schemes is jointly managed by Mr. Ruchit Mehta & 2 schemes are jointly managed by Mr. R. Srinivasan). The Scheme count of Mr. Dinesh Ahuja includes an ETF managed by him. SBI Retirement Benefit Fund is jointly managed by Mr. Gaurav Mehta and Mr. Dinesh Ahuja c. Past performance may or may not be sustained in future and the same may not necessarily provide the basis for comparison with other investments d. Load is not considered for computation of returns e. Different plans have different expense structures. The performance details provided for SBI Nifty Index Fund, SBI Magnum Constant Maturity Fund, SBI Dynamic Bond Fund, SBI Magnum Income Fund, SBI Magnum Gilt Fund, SBI Magnum Medium Duration Fund and SBI Debt Hybrid Fund are of Regular Plan - Growth option. The performance provided for SBI Gold Fund is of Regular Plan - IDCW Option and is Net of IDCW distribution tax, if any. In case of SBI Equity Hybrid Fund, the Growth option was introduced later on 19-Jan-2005, hence for the purpose of calculation of since inception returns, all IDCW declared prior to the splitting of the scheme into IDCW & Growth options are assumed to be reinvested in the units of the scheme at the then prevailing NAV (ex-IDCW NAV) f. Period for which scheme’s performance has been provided is computed based on last day of the month-end preceding the date of advertisement. In case, the start/end date of the concerned period is a non-business day, the NAV of the previous date is considered for computation of returns. g. Inception Dates of the Fund are as follows:- SBI-ETF Nifty 50: 22/07/2015; SBI-ETF Sensex: 15/03/2013; SBI-ETF Nifty Next 50: 20/03/2015; SBI-ETF Nifty Bank: 20/03/2015; SBI-ETF BSE100: 20/03/2015; SBI Nifty Index Fund: 17/01/2002; SBI-ETF Gold: 18/05/2009; SBI Gold Fund: 12/09/2011; SBI-ETF 10-Year Gilt: 10/06/2016; SBI Magnum Constant Maturity Fund: 30/12/2000; SBI-ETF Sensex Next 50: 25/09/2018; SBI-ETF Quality: 10/12/2018, SBI Dynamic Bond Fund: 09/02/2004; SBI Magnum Income Fund: 25/11/1998; SBI Magnum Gilt Fund: 30/12/2000; SBI Magnum Medium Duration Fund: 12/11/2003; SBI Equity Hybrid Fund: 09/10/1995; SBI Debt Hybrid Fund: 09/04/2001; SBI Equity Minimum Variance Fund: 19/03/2019; SBI ETF Private Bank: 19/10/2020; SBI ETF IT: 19/10/2020 h. The performance of the schemes is benchmarked to the Total Return variant of the Index i. SBI Equity Hybrid Fund, SBI Debt Hybrid Fund, SBI Magnum Constant Maturity Fund: As the scheme was launched before the launch of the benchmark index, benchmark index figures since inception or the required period are not available j. SBI Equity Hybrid Fund: As scheme additional benchmark TRI data is not available since inception of the scheme, additional benchmark performance is calculated using composite CAGR of S&P BSE Sensex PRI values from 9-Oct-95 to 18-Aug-96 and TRI values since 19-Aug-96 k. SBI Magnum Gilt Fund, SBI Magnum Income Fund, SBI Debt Hybrid Fund: As the scheme was launched before the launch of the additional benchmark index, additional benchmark index figures since inception or the required period are not available
Comparative Performance of Schemes
*Scheme Benchmark and Additional Benchmark are the same.^Price of the Gold price refers to the morning fixing of Gold by London Bullion Market Association. Mr. Raviprakash Sharma is also the Fund Manager of SBI Equity Minimum Variance Fund and SBI Gold Fund. The performance of SBI Gold Fund is disclosed as mandated by SEBI Guidelines. The investor will be bearing the recurring expenses of the Scheme, in addition to the expenses of underlying scheme. Mr. Dinesh Ahuja is also the Fund Manager of SBI Magnum Constant Maturity Fund, SBI Dynamic Bond Fund, SBI Magnum Income Fund, SBI Magnum Gilt Fund, SBI Magnum Medium Duration Fund. He jointly manages SBI Equity Hybrid Fund with Mr. R. Srinivasan and SBI Debt Hybrid Fund with Mr. Ruchit Mehta. The performance of these Funds are disclosed as mandated by SEBI Guidelines.
BSE Disclaimer: It is to be distinctly understood that the permission given by BSE Limited should not in any way be deemed or construed that the Scheme Information Document has been cleared or approved by BSE Limited nor does it certify the correctness or completeness of any of the contents of the Scheme Information Document. The investors are advised to refer to the Scheme Information Document for the full text of the Disclaimer clause of the BSE Limited
NSE Disclaimer: It is to be distinctly understood that the permission given by NSE should not in any way be deemed or construed that the Scheme Information Document has been cleared or approved by NSE nor does it certify the correctness or completeness of any of the contents of the Draft Scheme Information Document. The investors are advised to refer to the Scheme Information Document for the full text of the Disclaimer Clause of NSE Limited
1 Year 3 Years 5 Years Since InceptionCAGR Returns ( % ) PTP Returns ( INR ) CAGR Returns ( % ) PTP Returns ( INR ) CAGR Returns ( % ) PTP Returns ( INR ) CAGR Returns ( % ) PTP Returns ( INR )
SBI Magnum Income Fund
Scheme Benchmark: - CRISIL Medium to Long Term Debt Index
Additional Benchmark: - CRISIL 10-Yr Gilt Index
9.06 10906 9.39 13101 8.83 15273 7.88 54838
8.04 10804 9.82 13249 8.72 15192 10.10 86705
4.38 10438 9.43 13107 7.30 14228 N.A. N.A.
1 Year 3 YearsCAGR Returns ( % ) PTP Returns ( INR ) CAGR Returns ( % ) PTP Returns ( INR )
SBI Magnum Gilt FundScheme Benchmark: - CRISIL Dynamic Gilt IndexAdditional Benchmark: - CRISIL 10-Yr Gilt Index
6.21 10621 10.17 13388 9.31 15611 8.31 50691 5.72 10572 9.93 13286 8.25 14871 8.78 55365 4.38 10438 9.43 13107 7.30 14228 N.A. N.A.
5 Years Since InceptionCAGR Returns ( % ) PTP Returns ( INR ) CAGR Returns ( % ) PTP Returns ( INR )
1 Year 3 Years 5 Years Since InceptionCAGR Returns ( % ) PTP Returns ( INR ) CAGR Returns ( % ) PTP Returns ( INR ) CAGR Returns ( % ) PTP Returns ( INR ) CAGR Returns ( % ) PTP Returns ( INR )
SBI Magnum Medium Duration Fund
Scheme Benchmark: - NIFTY Medium Duration Debt Index
Additional Benchmark: - CRISIL 10-Yr Gilt Index
9.90 10990 9.50 13142 9.43 15700 8.17 39476
9.64 10964 9.59 13165 8.51 15048 7.66 36323
4.38 10438 9.43 13107 7.30 14228 5.85 27008
1 Year 3 Years 5 Years6 Months Since InceptionAnnualized ( % ) PTP Returns ( INR ) CAGR ( % ) PTP Returns ( INR ) CAGR ( % ) PTP Returns ( INR ) CAGR ( % ) PTP Returns ( INR )
SBI Magnum Children’s Benefit Fund - Investment Plan
Scheme Benchmark: - CRISIL Hybrid 35+65 - Aggressive Index
Additional Benchmark: - S&P BSE Sensex TRI
89.75 18975 N.A. N.A. N.A. N.A. N.A. N.A. 47.98 14798
37.87 13787 N.A. N.A. N.A. N.A. N.A. N.A. 21.94 12194
46.93 14693 N.A. N.A. N.A. N.A. N.A. N.A. 28.97 12897
CAGR ( % ) PTP Returns ( INR )
Fund Jointly Managed by R. Srinivasan (Equity portion), Dinesh Ahuja (Debt portion) & Mohit Jain (investments in foreign securities portion)
All scheme performance is as of April 30, 2021
1 Year 3 Years 5 Years Since InceptionCAGR Returns ( % ) PTP Returns ( INR ) CAGR Returns ( % ) PTP Returns ( INR ) CAGR Returns ( % ) PTP Returns ( INR ) CAGR Returns ( % ) PTP Returns ( INR )
SBI Debt Hybrid Fund
Scheme Benchmark: - NIFTY 50 Hybrid Composite Debt 15:85 Index
Additional Benchmark: - CRISIL 10-Yr Gilt Index
21.93 12193 8.13 12653 8.44 15004 8.16 48315
14.27 11427 10.57 13522 9.68 15880 N.A. N.A.
4.38 10438 9.43 13107 7.30 14228 N.A. N.A.
Fund Jointly Managed by Dinesh Ahuja (Debt portion) & Ruchit Mehta (Equity portion)
1 Year 3 Years 5 Years Since InceptionCAGR Returns ( % ) PTP Returns ( INR ) CAGR Returns ( % ) PTP Returns ( INR ) CAGR Returns ( % ) PTP Returns ( INR ) CAGR Returns ( % ) PTP Returns ( INR )
SBI Equity Hybrid Fund
Scheme Benchmark: - CRISIL Hybrid 35+65 - Aggressive Index
Additional Benchmark: - S&P BSE Sensex TRI
36.12 13612 10.76 13590 12.58 18097 15.50 398742
36.43 13643 11.66 13927 13.34 18712 N.A. N.A.
46.26 14626 12.85 14377 15.15 20260 12.46 201510
Fund Jointly Managed by Dinesh Ahuja (Debt portion) & R. Srinivasan (Equity portion)
Fund Manager: An employee of the asset management company such as a mutual fund or life insurer, who manages investments of the scheme. He is usually part of a larger team of fund managers and research analysts.
Application Amount for Fresh Subscription: This is the minimum investment amount for a new investor in a mutual fund scheme.
Minimum Additional Amount: This is the minimum investment amount for an existing investor in a mutual fund scheme.
SIP: SIP or systematic investment plan works on the principle of making periodic investments of a fixed sum. It works similar to a recurring bank deposit. For instance, an investor may opt for an SIP that invests `500 every 15th of the month in an equity fund for a period of three years.
NAV: The NAV or the net asset value is the total asset value per unit of the mutual fund after deducting all related and permissible expenses. The NAV is calculated at the end of every business day. It is the value at which the investor enters or exits the mutual fund.
Benchmark: A group of securities, usually a market index, whose performance is used as a standard or benchmark to measure investment performance of mutual funds, among other investments. Some typical benchmarks include the Nifty 50, S&P BSE Sensex, S&P BSE 200, S&P BSE 500, 10-Year Gsec.
Entry Load: A mutual fund may have a sales charge or load at the time of entry and/or exit to compensate the distributor/agent. Entry load is charged at the time an investor purchases the units of a mutual fund. The entry load is added to the prevailing NAV at the time of investment. For instance, if the NAV is `100 and the entry load is 1%, the investor will enter the fund at `101.
Note: SEBI, vide circular dated June 30, 2009 has abolished entry load and mandated that the upfront commission to distributors will be paid by the investor directly to the distributor, based on his assessment of various factors including the service rendered by the distributor.
Exit Load: Exit load is charged at the time an investor redeems the units of a mutual fund. The exit load is deducted from the prevailing NAV at the time of redemption. For instance, if the NAV is `100 and the exit load is 1%, the redemption price would be `99 Per Unit.
AUM: AUM or assets under management refers to the recent / updated cumulative market value of investments managed by a mutual fund or any investment firm.
Holdings: The holdings or the portfolio is a mutual fund's latest or updated reported statement of investments/securities. These are usually displayed in terms of percentage to net assets or the rupee value or both. The objective is to give investors an idea of where their money is being invested by the fund manager.
Nature of Scheme: The investment objective and underlying investments determine the nature of the mutual fund scheme. For instance, a mutual fund that aims at generating capital apprecia-tion by investing in stock markets is an equity fund or growth fund. Likewise, a mutual fund that aims at capital preservation by investing in debt markets is a debt fund or income fund. Each of these categories may have sub-categories.
Tracking Error: Measure that indicates how closely the portfolio return tracks the benchmark return. Tracking error is the standard deviation of the difference of returns between a portfolio and the benchmark over a specified holding period.
IDCW: IDCW stands for ‘Income Distribution cum Capital Withdrawal option’. The amounts can be distributed out of investors’ capital (Equalization Reserve), which is part of the sale price that represents realized gains.
Note: For details on IDCW, please refer notice cum addendum dated March 27, 2021. In line with SEBI Circular no. SEBI/HO/IMD/DF3/CIR/P/2020/194 dated October 05, 2020, nomenclature of Dividend plans / options has been rephrased w.e.f. April 01, 2021.
Mutual Fund investments are subject to market risks, read all scheme related documents carefully.
Toll-free: 1800 209 3333 Visit: www.sbimf.com Follow us:
HOW TO READ THE FACTSHEET?