Embed Size (px)
Citation preview

Dissertation
Let There Be LightGreen Industrial Policy and Energy Access in India
Tobi A. Oluwatola
This document was submitted as a dissertation in December 2016 in partial fulfillment of the requirements of the doctoral degree in public policy analysis at the Pardee RAND Graduate School. The faculty committee that supervised and approved the dissertation consisted of Aimee Curtright (Chair), Rafiq Dossani, and Shanthi Nataraj.
PARDEE RAND GRADUATE SCHOOL

For more information on this publication, visit http://www.rand.org/pubs/rgs_dissertations/RGSD388.html
Published by the RAND Corporation, Santa Monica, Calif.
© Copyright 2017 RAND Corporation
R® is a registered trademark
Limited Print and Electronic Distribution Rights
This document and trademark(s) contained herein are protected by law. This representation of RAND intellectual property is provided for noncommercial use only. Unauthorized posting of this publication online is prohibited. Permission is given to duplicate this document for personal use only, as long as it is unaltered and complete. Permission is required from RAND to reproduce, or reuse in another form, any of its research documents for commercial use. For information on reprint and linking permissions, please visit www.rand.org/pubs/permissions.html.
The RAND Corporation is a research organization that develops solutions to public policy challenges to help make communities throughout the world safer and more secure, healthier and more prosperous. RAND is nonprofit, nonpartisan, and committed to the public interest.
RAND’s publications do not necessarily reflect the opinions of its research clients and sponsors.
Support RAND Make a tax-deductible charitable contribution at
www.rand.org/giving/contribute
www.rand.org
iii
Abstract
Emerging economies expect to benefit by developing their manufacturing capabilities in high value-added sectors, especially in technologically advanced sectors. Governments often use industrial policy to stimulate a transition from low to high value-added manufacturing, especially in sectors in which the country may have a latent comparative advantage. The solar sector is one such sector that has been identified by the Indian government. A number of policies have been introduced to support the development of a solar industry in India with the goal of installing 100 GW of solar power by the year 2022. The policies cover the spectrum of industrial activity, from early stage manufacturing to generation, with a target of 5GW of annual manufacturing capacity by 2022.
This scenario raises several key policy questions: Which parts of the supply-chain are feasible for manufacture in India? Are the policies in place adequate to induce the realization of its latent comparative advantage? What specific policies need to be implemented to enable this transition, if any?
Focusing on the key components of the crystalline silicon photovoltaic (c-Si PV) supply chain (polysilicon, wafers, cells, modules), this study specifically asks the following targeted questions: First, what is competitiveness of India’s domestic manufacturing across the supply chain? Second, what are the barriers and enablers to developing a domestic industry? And, third, what is the cost of industrial policy support?
These three questions are answered with a mixed methods approach. First, we study trade data to identify revealed comparative advantage. Second, we analyze the results of face-to-face interviews with 27 senior industry practitioners, policy makers, and academics to obtain insights on the barriers and enablers of the domestic industry in India, along with related issues. Third, stochastic cost accounting and financial models were developed and used to estimate the cost and returns of setting up new manufacturing plants in India in different components of the c-Si PV supply chain.
The study of trade data revealed no comparative advantage in any of the components of the value-chain. Our interviews revealed that respondents felt that this was due to the early stage of the industry in India and that, as the industry matures, comparative advantages will surface. Interestingly, there was limited interest by manufacturers and developers in new policies or incentives from the Indian government. This again contrasted with some of our cost analyses, which found upstream manufacturing in certain key areas of potential growth; production of polysilicon, wafers and cells are not currently viable in India but modules could potentially be viable if barriers to input cost such as duties in imports and logistical costs are reduced.


v
Table of Contents
Abstract .......................................................................................................................................... iiiFigures............................................................................................................................................ ixTables ............................................................................................................................................. xiAcknowledgments........................................................................................................................ xiiiAbbreviations ................................................................................................................................ xv1. Introduction ................................................................................................................................. 1
1.1Motivation and Policy Relevance ...................................................................................................... 11.1.1 Jawaharlal Nehru National Solar Mission (JNNSM) ............................................................... 11.1.2 US-India World Trade Organization (WTO) Case .................................................................. 2
1.2General Aims and Research Questions .............................................................................................. 21.3Organization of Report....................................................................................................................... 4
2. Overview and Background ....................................................................................................... 52.1 India’s Socio-Economy ...................................................................................................................... 52.2Growth and Electrification ................................................................................................................. 6
2.2.1 State of Energy Access for India’s Poorest States ....................................................................... 92.2.2 Cost of Meeting India’s Energy Needs: Coal vs. Solar ......................................................... 10
2.3 India’s Solar Industrial Policy .......................................................................................................... 122.4Brief Overview of Solar PV Technologies ...................................................................................... 13
2.4.1 PV Production Chain ............................................................................................................. 132.5 Industrial Policy ............................................................................................................................... 14
2.5.1 Theoretical Foundations for Industrial Policy ........................................................................ 152.5.2 Problems with Industrial Policy ............................................................................................. 192.5.3 Desirability of Solar IP in India ............................................................................................. 21
2.6Solar Industrial Policies of Top Solar Manufacturing Countries ..................................................... 212.6.1 The United States ................................................................................................................... 222.6.2 China ...................................................................................................................................... 242.6.3 Germany ................................................................................................................................. 26
2.7Competitiveness Analysis Methodology: Revealed Comparative Analysis .................................... 292.8Discounted Cash Flow Analysis Using Capital Asset Pricing Model ............................................. 30
2.8.1 Capital Asset Pricing Model (CAPM) ................................................................................... 322.8.2 Reliability and Choice of Beta ............................................................................................... 33
2.9 Contributions to the Literature ......................................................................................................... 333.1 India’s Solar Electricity Policy Roadmap ........................................................................................ 353.2Solar PV Manufacturing Capacity in India ...................................................................................... 373.3Solar PV Development in India ....................................................................................................... 393.4 Impact of Domestic Content Policy on India’s PV Industry ............................................................ 403.5 India’s Competitiveness Across the PV Manufacturing Chain ........................................................ 41
vi
3.5.1 Data Sources .......................................................................................................................... 423.5.2 Methodology .......................................................................................................................... 433.5.3 PV Supply Chain Analysis ..................................................................................................... 443.6Conclusion ................................................................................................................................... 52
4. Barriers and Enablers: Stakeholder Analysis ............................................................................ 534.1Methodology .................................................................................................................................... 53
4.1.1 Interview Approach and Content ........................................................................................... 534.1.2 Analysis Methodology ........................................................................................................... 54
4.2Prevalence Analysis ......................................................................................................................... 554.2.1 General Views on the Solar Mission and the Domestic Content Requirement ...................... 554.2.2 Barriers to Domestic Industry Competitiveness .................................................................... 564.2.3 Enablers for Domestic Industry Competitiveness .................................................................. 574.2.4 Recommended Industrial Policy Focus .................................................................................. 58
4.3Stakeholder Views ........................................................................................................................... 594.3.1 Module Manufacturers ........................................................................................................... 594.3.2 Cell Manufacturers ................................................................................................................. 614.3.3 Developers ............................................................................................................................. 634.3.4 Government (MNRE, SECI, NTPC, KREDL, NISE) ........................................................... 644.3.5 Academic Sector .................................................................................................................... 66
4.4Stakeholder Analysis and Discussion .............................................................................................. 674.5Research and Innovation in the Industry: Role of Government in Innovation Policy ..................... 694.6Conclusions ...................................................................................................................................... 70
5. Potential Viability of the Solar PV Manufacturing in India ..................................................... 725.1Methodology .................................................................................................................................... 72
5.1.1 General Inputs and Assumptions ........................................................................................... 73The following sections discuss the analysis for each section of the manufacturing chain. .................... 785.2Polysilicon Cost Analysis ................................................................................................................ 78
5.2.1 Global Polysilicon Market ..................................................................................................... 785.2.2 Key Polysilicon Manufacturing Inputs and Assumptions ...................................................... 805.2.3 Minimum Viable Polysilicon Price for Indian Manufacturers ............................................... 815.2.4 Sensitivity Analysis of Polysilicon at Spot Price ................................................................... 825.2.5 Polysilicon Policy Incentive Analysis at Spot Price .............................................................. 82
5.3Wafer Manufacturing Cost Analysis ................................................................................................ 845.3.1 Wafer Market Analysis .......................................................................................................... 845.3.2 Key Wafer Cost Model Inputs and Assumptions ................................................................... 845.3.3 Minimum Sustainable Wafer Price ........................................................................................ 855.3.4 Wafer Sensitivity Analysis at Spot Price ............................................................................... 865.3.5 Wafer Policy Incentive Analysis at Spot Price ...................................................................... 87
5.4Cell and Module Cost Analysis ....................................................................................................... 875.4.1 Cell and Module Market ........................................................................................................ 875.4.2 Key Cell Model Inputs and Assumptions .............................................................................. 885.4.3 Cell Minimum Sustainable Price ........................................................................................... 89
vii
5.4.4 Cell Optimal Policy Analysis at Spot Price ........................................................................... 905.4.6 Module Manufacturing: Key Inputs and Assumptions .......................................................... 915.4.7 Minimum Sustainable Module Price ...................................................................................... 915.4.8 Module Policy Analysis at Spot Prices .................................................................................. 92
5.5State Policies .................................................................................................................................... 935.6Conclusion ....................................................................................................................................... 94
6. Recommendations and Conclusions ......................................................................................... 956.1 India’s Energy Access Challenge and the Potential for an Indian Domestic Solar Industry ........... 956.2 India’s Comparative Advantage in the Solar Manufacturing Chain ................................................ 966.3Cost of Industrial Policy across the Value Chain ............................................................................. 976.4 Limitations and Opportunities for Future Research ......................................................................... 976.5 Policy Relevance and Conclusions ................................................................................................... 99
Appendices .................................................................................................................................. 100Appendix I: Policies ............................................................................................................................. 100
Detailed Solar Policies ..................................................................................................................... 100Appendix II: Industrial Policy Theoretical Models .............................................................................. 105Appendix III: RCA Analysis ................................................................................................................ 109
Analysis Steps .................................................................................................................................. 109Data Extraction Script ...................................................................................................................... 109
Appendix IV: Interviews ...................................................................................................................... 120Interview Questions .......................................................................................................................... 121
Appendix V: Financial Assessment ...................................................................................................... 123Regional Manufacturing Prices ........................................................................................................ 123
Appendix VI: Jobs Assessment ............................................................................................................ 125Appendix VII: Solar vs Coal Cost Benefit Analysis ............................................................................ 126
References and EndNote ............................................................................................................. 127


ix
Figures
Figure 1: India’s Total Energy Consumption and Gross Domestic Product Trend ................... 7Figure 2: India’s Electricity Use Per Capita Relative to Pakistan and Bangladesh ................... 7Figure 3: Electricity Use Growth with Urbanization ................................................................. 8Figure 4: Installed Generating Capacity .................................................................................... 9Figure 5: CEEW Electricity Access in Six States ...................................................................... 9Figure 6: Solar PV Manufacturing Value Chain ...................................................................... 14Figure 6: Theoretical Models for Industrial Policy .................................................................. 19Figure 7: Justifications and Problems with Industrial Policy .................................................. 21Figure 8: India’s PV Annual Manufacturing and Installation Capacities (MW) .................... 35Figure 9: Average Bid Prices Over Time in Different Programs ............................................ 37Figure 10: Top Solar Cell Manufacturers in India (MW,%) .................................................. 38Figure 11: Top Solar Module Manufacturers in India (MW, %) ............................................. 38Figure 12: India’s Solar Capacity by State .............................................................................. 40Figure 13: Planned Capacity for 2016-2017 Under Various Scheme ...................................... 40Figure 14: Solar PV Manufacturing Process ........................................................................... 44Figure 15: Polysilicon Manufacturing ..................................................................................... 44Figure 16: Polysilicon - Silicon Purity>99.9% (280461) ........................................................ 46Figure 17: Ingot and Wafer Casting ......................................................................................... 46Figure 18: Ingot Casting Machines (845430) .......................................................................... 47Figure 19: Wafer Machines (8486) .......................................................................................... 48Figure 20: Cells ........................................................................................................................ 49Figure 21: Modules .................................................................................................................. 50Figure 22: India’s Module Imports from China and the United States (USD) ........................ 50Figure 23: Glass (700719) ....................................................................................................... 51Figure 24: Value Distribution in CSi PV Chain ...................................................................... 52Figure 25: Why Keep the Domestic Content Requirement ..................................................... 56Figure 26: Key Barriers for the Domestic Industry ................................................................. 57Figure 27: Key Enablers for the Domestic Manufacturing Industry ....................................... 58Figure 28: Stakeholder Recommended Focus Areas ............................................................... 58Figure 29: Cost Analytic Model Framework ........................................................................... 73Figure 30: Chart of Polysilicon Market Leaders ...................................................................... 79Figure 31: Regional Polysilicon Production Costs and Minimum Sustainable Price for India81Figure 32: Wafer Production Costs and Minimum Sustainable Price for India ...................... 86Figure 33: Cell Production Costs and Minimum Sustainable Price for India .......................... 89Figure 34: Module Production Costs and Minimum Sustainable Price for India .................... 92

x
Figure 35: Regional Polysilicon Production Costs and Minimum Sustainable Price for India123Figure 36: Regional Wafer Production Costs and Minimum Sustainable Price for India (with
projections for future cost savings) ................................................................................ 123Figure 37: Regional Cell Production Costs and Minimum Sustainable Price for India ........ 124Figure 38: Regional Module Production Costs and Minimum Sustainable Price for India .. 124

xi
Tables
Table 1: Methods Overview ....................................................................................................... 4Table 2: India’s Sectorial Contribution to GDP Compared to Other Large Economies ........... 6Table 3: Carbon Footprint of Growing India’s Generation to 3500TWh by 2030 using Coal and
Solar ................................................................................................................................. 11Table 4: Energy Poverty Removal Cost Analysis Coal vs. Solar ............................................ 11Table 5: India’s Solar Policy Roadmap ................................................................................... 35Table 6: Market Barriers for Potential PV Manufacturers Across Supply Chain .................... 38Table 7: Products Examined in Analysis ................................................................................. 43Table 8: Trade Measures Calculated in Analysis .................................................................... 43Table 9: Key Themes Covered by Category ............................................................................ 53Table 10: Steps to Thematic Analysis ..................................................................................... 54Table 11: Summary of Stakeholder Views .............................................................................. 67Table 12: Average Labor Estimates for India .......................................................................... 74Table 13: Calculated Weighted Cost of Capital for India compared to US and China ........... 75Table 14: Summary of General Assumptions .......................................................................... 77Table 15: Polysilicon Market Leaders (2015) ......................................................................... 79Table 16: Indian Polysilicon Manufacturing Inputs ................................................................ 80Table 17: Polysilicon Spot Price (2016-06-01) ....................................................................... 82Table 18: Threshold Policy Analysis at Average FBR Spot Price .......................................... 83Table 19: Threshold Policy Analysis at Average Siemens Spot Price .................................... 83Table 20: Wafer Market Leaders (2015) ................................................................................. 84Table 21: Wafer Inputs (India) ................................................................................................ 84Table 22: Wafer Spot Price (June 1 2016) ............................................................................... 86Table 23: Wafer Optimal Policy Analysis at Spot Price .......................................................... 87Table 24: PV Market Leaders (2015) ...................................................................................... 88Table 25: Cell Inputs and Assumptions (India) ....................................................................... 88Table 26: Cell Spot Price (June 1 2016) .................................................................................. 90Table 27: Cell Threshold Policy Analysis at Spot Price .......................................................... 90Table 28: Module Inputs and Assumptions ............................................................................. 91Table 29: Module Spot Price (June 1 2016) ............................................................................ 92Table 30: Module Optimal Policy Analysis at Spot Price ....................................................... 93Table 31: Industrial Policy Incentives in 10 most active states ............................................... 93Table 32: Summary of Findings by Research Question .......................................................... 96Table 33: Some Solar Manufacturing and Deployment Policies in China ............................ 100Table 34: US Policies to Support Solar Energy Manufacturing and Deployment ................ 102

xii
Table 35: German Policies to Support Solar Energy Manufacturing and Deployment ......... 103Table 36: Solar Policies of Key Indian States ....................................................................... 104Table 37: List of Interviewees ............................................................................................... 120Table 38: Estimate of Renewable Energy Jobs in India ........................................................ 125Table 39: Key Assumptions in Estimating RE Jobs .............................................................. 125

xiii
Acknowledgments
Writing a dissertation is hard, especially if you are me, and were it not for all the support I received, I never would have made it. I am confident I will miss out some important names, please charge it to my head and not my heart. First, I’d like to thank my dissertation committee: Aimee, Rafiq, Shanthi and Sharath. Thank you, Aimee Curtright, my chair and mentor through this process. I truly appreciate your kindness, generosity and leadership. I have learned a lot from you on solar, energy markets, and humor. Rafiq Dossani and Shanthi Nataraj, I cannot thank you both enough for thoroughly combing through every chapter and generously pointing out the flaws in my arguments and strengths to expound upon. I learned a lot from your deep understanding of industrial policy, finance and economics. Sharath Rao, thank you for your mentorship during my stay in India and insights on solar manufacturing.
I want to say thank you to all my advisers at RAND who helped hone my skills and shape my research interests, Ingo Vogelsang, Steve Popper, Rob Lempert, David Johnson, Nick Burger, Chaitra Hardison, and Nidhi Kalra, I say thank you. Thank you to everyone at CSTEP India, especially Mridula, Anshu, Jai, Bhupesh, Ganesh and Saptak, for sharing your insights, space and the content of your Rolodex in aid of my research. Thank you to Juhi Rajput for introducing me to valuable contacts in India. Thank to my SERIIUS colleagues Zhmin, Thiru and Srilakshmi for insights on those many calls. Thank you to my friends Folu, Ikepo, Marlon, Kaidi, Mayo, Gori, Yemi, Oye, Ervant, Cameron, Nelly, Mikhail, Luis, Aziza, Edmundo, Melissa, and many others who at various stages provided encouragement and ideas for improving the content and presentation. Thank you to Susan, Rachel, Stephanie, Gery and all PRGS staff for making it a conducive place to learn. Thank you to all PRGS colleagues, who listened to my ideas, helped with homework and shared good times on Main Street, Santa Monica beach and various homes in the awesome city of angels.
Most importantly I want to thank my family, my parents, Dr. & Mrs. Tunde and Titi Oluwatola; my beautiful sisters and their caring husbands; Tolu and Juwon Odutayo, Funto and Seun Oderinde, Tomi and Joseph Uwazota; my nephews and nieces TJ, Tide, Ayanfe and Afore; and my extended family especially Mrs Esther Elemide, the Olayinkas, the Akinleyes, the Ajayis, the Fafoworas, RDJ, Remi, Toks, Bunmi and Tutu – thank you all.
Finally I want to thank the John M. Cazier Award in Sustainability, for its generous financial support of this study. Also, this research was supported in part by the Solar Energy Research Institute for India and the U.S. (SERIIUS) funded jointly by the U.S. Department of Energy subcontract DE AC36-08G028308 (Office of Science, Office of Basic Energy Sciences, and Energy Efficiency and Renewable Energy, Solar Energy Technology Program, with support from the Office of International Affairs) and the Government of India subcontract IUSSTF/JCERDC-SERIIUS/2012 dated 22nd Nov. 2012. Specifically, time spent at CSTEP

xiv
India in the summer of 2015, was supported by the “MAGEEP Visiting Scholars Program,” co-organized with funds from SERIIUS and the McDonnell Academy Global Energy and Environmental Partnership (MAGEEP).

xv
Abbreviations
API Application Programming Interface
APIIC Andra Pradesh Industrial
ARPA-E Advanced Research Project Agency - Energy
ARRA American Recovery and Reinvestment Act
ASI Annual Survey of Industries
aSi Amorphous Silicon
BHEL Bharat Heavy Electricals Limited
BIPV Building Integrated Photovoltaic
BLS U.S. Bureau of Labor Statistics
BOS Balance of Systems
CAGR Compound Annual Growth Rate
CAPEX Capital Expenditure
CAPM Capital Asset Pricing Model
CAS China Academy of Sciences
CASM Coalition of American Solar Manufacturing
CDB China Development Bank
CDTe Cadmium Telluride
CEEW Center for Energy, Environment and Water
CERC Central Electricity Regulatory Commission
CIA US Central Intelligence Agency
CIGS Copper Indium Gallium Selenide
COP21 Un Conference of Parties Agreement Paris 2015
CPI Climate Policy Initiative
CRS Constant Returns to Scale
cSi Crystalline Silicon
CSTEP Center for Science and Technology Policy

xvi
CSP Concentrated Solar Thermal Power Technology
CVs Commercial Vehicles (Trucks)
DARPA Defence Advanced Research Project Agency
DCR Domestic Content Requirement (Local Content)
DOE US Department of Energy
DSSC Dye-sensitized Solar Cells
DSCR Debt Service Coverage Ratio
EBITDA Earnings Before Interest, Tax, Depreciation and Amortization
EBT Earnings Before Tax
EIA Energy Information Administration
EIRR Equity Internal Rate of Return
EPC Engineering, Procurement and Construction
EPIA European Photovoltaic Industry Association
EU European Union
EXIM Export-Import
FBR Fluidized Bed Reactor
FDI Foreign Direct Investment
FERA Foreign Exchange Regulation Act
FIT Feed In Tariffs
FOREX Foreign Exchange
GATT General Agreement on Tariffs and Trade
GBI Generation Based Incentive
GDP Gross Domestic Production
GOI Government of India
GW Giga Watts (1 Billion Watts)
HCl Hydrogen Chloride
HPAEs High Performing Asian Economies
IP Industrial Policy
IPR Industrial Policy Resolution

xvii
IREDA India Renewable Energy Development Agency
IRENA International Renewable Energy Agency
IRR Internal Rate of Return
ISA Indian Semiconductor Association
IT-BPM Information Technology, Business Process Management
ITC Investment Tax Credit
JNNSM Jawaharlal Nehru National Solar Mission
Kg Kilogram
kW Kilo Watts (1000 Watts)
kWh Unit of Energy Consumption (Kilo Watts used times hours used)
LCR Local Content Requirements
LCA Latent Comparative Advantage
LDCs Least Developed Countries
MFN Tariffs Most Favored Nation Tariff
MGSi Metallurgical Grade Silicon
MIRR Modified Internal Rate of Return
MNRE Ministry of New and Renewable Energy
MOFCOM Chinese Ministry of Commerce
MRTP Monopolies and Restrictive Trade Practices
MT Metric Tonnes
MW Mega Watt (1 Million Watts)
NCP National Computer Policy (India)
NPV Net Present Value
NRDC Natural Resources Defense Council
NSM National Solar Mission
O&M Operations and Maintenance
OPEX Operating Cost
PAT Profit After Tax
PPA Power Purchase Agreement

xviii
PV Photovoltaic
PVMI Advanced Solar Photovoltaic Manufacturing Initiative
R&D Research and Development
RAM Reverse Auction Mechanism
RBI Reserve Bank of India
RCA Revealed Comparative Advantage
Rd Interest rate (rate of debt)
RD Corporate spread
RE Renewable Energy
Re Cost of Equity
REC Rural Electrification Corporation Limited
REC Renewable Energy Certificates
REN21 Renewable Energy Policy Network for the 21st Century
RET Renewable Energy Technology
Rf Risk free rate
Rg Government bond rate
RPO Renewable Portfolio Obligation
RPS Renewable Portfolio Standards
SEIA Solar Energy Industries Association
SERC State Electricity Regulatory Commission
SG&A Sales, General Administration
SIAM Society for Indian Automobile Manufacturers
SQM Square Meters
STP Software Technology Park
TRIMs Trade Related Investment Measures
TWh Tera (10^12) * hours
UNEP United Nations Environment Programme
UNSE4All United Nations Sustainable Energy for All
VAT Value Added Tax

xix
VGF Viability Gap Funding
WACC Weighted Average Cost of Capital
WITS World Integrated Trading Solution
WNA World Nuclear Organisation
Wp Watts at Peak load
WTO World Trade Organization


1
1. Introduction
1.1 Motivation and Policy Relevance
Energy poverty is at the root of many economic development problems from healthcare and education, to transportation and industrialization. The UN’s Sustainable Energy for All’s Global Tracking Framework 2015 estimates that there are about 1.1 billion people without access to electricity with 263 million of these living in India alone [1]. India also has the highest electrification rate of countries with an electricity deficit in recent years, having provided electricity to an annual average of 24 million additional people and provided 20 million a year with access to modern cooking and heating fuels since 1990 [2]. The Government of India has set a goal for full rural electrification by March 2017, which it allows the public to track on an online dashboard [3].
Simply increasing capacity of conventional energy may not be the socially-optimal way to alleviate energy poverty due to the attendant environmental issues such as the risk of rapid depletion of raw materials such as coal and gas, global climate change, and local and regional air quality problems. Hence, renewable energies may be preferable [4-6]. However, some significant challenges attend the use of renewable sources of energy. Primarily, renewables are often more expensive than conventional energy. Further, although there are advantages with some forms of renewables, such as the ability to deploy distributed generation with solar energy, they may also have limitations such as intermittency (that is inability to reliably and predictably supply base load). Nevertheless, the challenges of providing energy security in the wake of rising prices of coal imports, the pressure to reduce balance of payments, global demand for reducing greenhouse gas emissions and the opportunity for domestic manufacturing all make renewables attractive to Indian policy makers.
1.1.1 Jawaharlal Nehru National Solar Mission (JNNSM)
To this end, India’s government announced the Jawaharlal Nehru National Solar Mission (JNNSM), which in its initial iteration aimed to add 22 GW of solar generating capacity by 2022 [7, 8]. In 2014, the new administration of President Modi increased the target to 100 GW [9], enough to serve half of its current energy-poor population and to increase the share of solar-based generation from less than 1% of its total electricity generation in 2014 to over 10% by the target year 2022. In addition to solar generation, there is also considerable political will to build a robust domestic energy manufacturing industry in order to attain energy independence and the resultant economic benefits, such as increased jobs and exports [10]. The mission includes a domestic content requirement

2
(DCR), which requires that a portion of the solar modules be manufactured in India. Policymakers are keen to use this push for solving energy poverty to develop India’s industrial capacity and international competitiveness in solar power generation, which they believe will be a strategic “priority” sector [11].
1.1.2 US-India World Trade Organization (WTO) Case
In February 2013, the US Department of Commerce brought a case to the World Trade Organization (WTO) against the Indian government, challenging its domestic content requirements in the solar sector. The WTO set up a dispute panel in May 2014 after a second US request was made. Previously, in November 2012, the Indian Ministry of Commerce had initiated anti-dumping investigations against China, Malaysia, Taiwan and the US, following a complaint from the Indian Solar Manufacturers’ Association. Dumping can be identified when a product is sold for export at prices below domestic prices or below average production costs. The Indian investigation confirmed Indian manufacturers’ suspicion of dumping activities from countries including China, Taiwan and the US. Despite this finding, in August 2014, India dropped its own anti-dumping complaint against a number of countries including the US. In February 2016, India further amended its DCR, limiting it to government procurements only and not private purchases. Nonetheless, later in February 2016, the WTO ruled in favor of the US1, precluding India’s use of DCRs to support its domestic manufacturing agenda. Indian policy makers however insist that they will find other ways to support the domestic energy market regardless of the ruling [12].
1.2 General Aims and Research Questions
India has made a policy choice to mandate large-scale solar deployment for the various social welfare benefits2 it can provide. Given this policy choice, India has an opportunity to shape implementation by understanding the benefits and drawbacks of domestic content requirement, and how these may be addressed through appropriate incentives. This research aims to help India’s policymakers more efficiently and effectively consider policy interventions in developing a domestic solar industry (or not), recognizing India’s constraints and capitalizing on the country’s strengths.
The research questions aim to characterize the following items: the current state of the industry; the motivations for policy intervention; and the cost of current policy and alternative policy paths. International or export competitiveness tends to be a signal of the 1 The US has brought 20 trade enforcement cases to WTO under the Obama administration and won all of them. 2 Social welfare benefits in this context refers generally to the widespread benefits of electrification (especially rural) and other second-order benefits such as increased jobs and incomes.

3
strength of a country’s industry. For example, in the auto industry, Germany and Japan are considered leaders because of the success of their exports, such as Mercedes-Benz, BMW, Toyota, and Honda, to mention but a few, which perform well in international markets. The relationship of export success and industrial growth often ends up being self-reinforcing. As Japanese cars succeed abroad, their stronger reputation attracts more resources for continuous growth, with likely spillover effects. Export success is commonly viewed as a good signal that a country’s products meet the minimum quality standards in the international market at their price level [13-15]; international demand, the logic goes, forces the industry to meet the often higher manufacturing standards and regulations of wealthy importing countries, such as the member states of the OECD. Therefore, it is useful for India’s solar manufacturing policy makers to periodically take stock of the sector’s international competitiveness. This study begins with this critical assessment by asking to what extent Indian firms are able to compete internationally in solar photovoltaic (PV) manufacturing. Specifically, the study asks:
1. To what extent are Indian firms able to compete internationally in solar
photovoltaic (PV) manufacturing? 2. What are the barriers and enablers to the competitiveness of Indian solar (PV)
manufacturing? 3. What is the cost of industrial policy support across the supply chain? Expert opinion was sought from stakeholders in describing the barriers and enabling
factors for the competitiveness of India’s solar manufacturing sector and developing policy alternatives, which are later tested in the analysis. Using data collected primarily from stakeholders and other secondary sources, the study estimates the cost of manufacturing in India and, subsequently, the cost of industrial policies required to stimulate domestic manufacturing in India’s solar sector across the supply chain. This is mainly achieved by estimating the cost of fiscal incentives that may be employed to improve cost structures for domestic firms. Table 1 below summarizes how the study’s research questions map to its methods.

4
Table 1: Methods Overview
The study acknowledges that there are several factors beyond pure costs that account
for international competitiveness. These are discussed at various points in the study but not quantified explicitly. The study discusses the pros and the cons of implementing incentives but does not explicitly recommend these incentives.
1.3 Organization of Report
The rest of this report is organized as such: chapter two sets the study within the context of previous studies of Industrial Policy with examples from the US, Germany, East Asia and other sectors in India. Chapter three answers the first research question and reviews the solar energy sector in India with a focus on the current competitive state of its production across the supply chain. Chapter four answers the second research question by discussing results of stakeholder analysis and interviews, with a focus on the barriers and enablers of the industry. Chapter five answers the third research question; it describes the parameters of the financial models as well as the inputs, assumptions and implementation for each step of the supply chain. It also discusses the results of this analysis within the context of each international sub-industry represented in the supply chain. Using this model, the study also assesses some current state policies and possible optimal fiscal interventions. Chapter six concludes with a summary of recommendations for policy makers and areas for further research.

5
2. Overview and Background
This chapter lays out the context and intellectual precedents for the study. It begins with a discussion of India’s economy with an emphasis on its electricity situation, addressing both supply and consumption. This pivots into a discussion of India’s solar mission and policy makers’ desire to stimulate local manufacturing of solar photovoltaic modules (PV). Next, it briefly discusses the solar PV manufacturing chain including polysilicon, ingots/wafers, cells and modules. A brief literature review of key theoretical concepts that underpin the study follows. Within this literature review, the first section reviews industrial policy (IP) - that is, government action to alter the production behaviors of firms. It presents a summary of the theoretical justifications for IP alongside problems with the use of IP. The second section contrasts solar industrial policy in India with policies in other industry-leading countries such as the US, Germany and China. The third section delves into the literature on analytical concepts used in the study, including the use of revealed comparative advantage to measure competitiveness, as used in Chapter 3. This section also discusses discounted cash flow analysis using the capital asset pricing method (CAPM), which underpins the work of Chapter 5. The chapter concludes with a brief discussion of the contribution of the study to the literature of the solar energy industry.
2.1 India’s Socio-Economy
At an estimated $2.18 trillion (2015), India’s economy was the 14th largest in the world in terms of nominal GDP and the fourth largest in purchasing power parity terms (PPP, est. $8.027T)3. Cheap labor and services account for the country’s high purchasing power parity. India’s is also one of the fastest growing economies in the world with annual real GDP growth rates of 6.9, 7.3 and 7.3 in 2013, 2014 and 2015 respectively. However, in absolute measures such as GDP per capita, India ranks 158th in the world at $6,300/person [16]. India also ranks 103rd out of 145 countries on the GINI index, which measures the distribution of incomes within a given population [16].
In terms of trade, India had an export-import (balance of payments) deficit of about $150B with exports estimated at $287.6B (17th in the world) and imports at $432.3 billion (11th in the world) in 2015. Its main exports were petroleum products, precious stones, vehicles, machinery, iron and steel, chemicals, pharmaceutical products, cereals
3 Data for socioeconomic background in Chapter Two is primarily sourced from the CIA Factbook except where otherwise referenced. The online data is available at https://www.cia.gov/library/publications/the-world-factbook/geos/in.html and was last accessed on April 12, 2016.

6
and apparel, mostly - in descending order of magnitude - to the US, UAE, Hong Kong, China and Saudi Arabia [17]. On the other hand, Indians imported mostly crude oil, precious stones, machinery, chemicals, fertilizer, plastics, iron and steel, mostly from the same trading partners – China, Saudi Arabia, UAE, the US and Switzerland. IT services also contributed a significant chunk of India’s exports, about $85 billion according to a Reserve Bank of India (RBI) survey [18]. However, this does not reflect in the official trade data [19]. In terms of overall contributions to the economy, as shown in Table 2 below, services comprise the largest component of India’s GDP at 54.4%. The IT sector alone contributes about 10% of the 54.4% in question (discussed later in the chapter). However, compared to other large economies, agriculture still represents a disproportionately large share of GDP, which is itself an indication of relative underdevelopment.
Table 2: India’s Sectorial Contribution to GDP Compared to Other Large Economies
India Pakistan Bangladesh USA China Japan Germany Agriculture 16.1% 25.5% 6% 1.6% 8.9% 1.2% 0.7% Industry 29.5% 19% 30.4% 20.8% 42.7% 26.6% 30.2% Services 54.4% 55.5% 53.6% 77.6% 48.4% 72.2% 69.1%
Source: CIA Fact Book, 2015
2.2 Growth and Electrification
To power India’s desired economic growth and industrial transformation; it must provide reliable energy to its industries and its growing population of over a billion people. By 2022, India is expected to overtake China as the world’s most populous nation4[20]. As a result of its considerable population, it is the third largest consumer of energy after the US and China. Its real GDP has grown at an average of 7.59% from 2005-20155 [21], and this growth is being powered by a simultaneous growth in consumption, which has doubled over the last decade and continues to grow at an impressive pace.
4 This date has been revised several times by the UN. The most recent revision brought the date closer by four years from 2028. 5 This analysis uses World Bank data as presented in 2016. It does not independently consider India’s February 2015 GDP rebasing exercise.

7
Figure 1: India’s Total Energy Consumption and Gross Domestic Product Trend
Source World Bank (GDP) and EIA (BTU), 2015 [22]
Figure 2: India’s Electricity Use Per Capita Relative to Pakistan and Bangladesh
Source: Data from World Bank, Real-time Chart by Google [23]
With increasing urbanization, Indians’ energy use also changes from traditional biomass and waste to modern energy sources such as hydrocarbons, nuclear, biofuels and other renewables [24]. Studies have found unidirectional granger causality between electricity use and urbanization [24-27]. This means that increased electricity use causes urbanization or urbanization causes increased electricity use with no feedback effects. For example, as electricity use increases in a rural area, less labor is required for otherwise manual tasks such as agriculture, wood and water collection; this also increases

8
business and industrial formation, transforming rural areas into urban (electricity to urbanization). Alternatively, as rural dwellers migrate to cities, they increase the pressure on modern amenities such as electricity as they transition from traditional sources of energy (urbanization to electricity). India is believed to have followed the latter model and China the former, with the gap between economic growth in urban and rural areas leading more to a migration to urban areas than a transition within the rural areas [24, 25]. Regardless of the model of transition, electricity use remains the largest and fastest-growing area of energy demand, increasing, in 20 years, from 22% to 36% of total energy consumption (1990-2011).
Figure 3: Electricity Use Growth with Urbanization
Source: Data from World Bank6
As of March 2016, India had 298 Gigawatts (GW) of utility-based, installed electricity generating capacity, mostly from coal-fired power plants – see Figure 4 below[28].
6 The sharp change in slope in electricity consumption and energy use in 2002-03 could possibly be a result of a change in the methodology used to collect household data by MOSPI, but this investigation was out of the scope of this research

9
Figure 4: Installed Generating Capacity
Source: EIA, 2016
2.2.1 State of Energy Access for India’s Poorest States
A 2015 energy access study, by the Center for Energy Environment and Water [29] that focused on some of the most energy-poor states of India (the lighter colored states of Bihar, Jharkhand, Madhya Pradesh, Uttar Pradesh, Odisha and West Bengal), found that even though connectivity (availability of power lines) rates tend to be high – over 90% in most states – a high proportion of people, 79% in Bihar, 73% in Jharkhand, 54% in Madhya Pradesh, 71% in Uttar Pradesh, 25% in West Bengal and 47% in Odisha, still lack electricity (actual energy through the lines)7. Challenges of quality, reliability and duration of supply persist in these communities [29].8
Figure 5: CEEW Electricity Access in Six States
Source: CEEW, 2015
7 These people are classified as tier 0, which means that they have no electricity capacity or enjoy less than four hours of supply and can barely afford the little they get. 8 Note also that electricity access discussed in the reference CEEW study refers to home electrification. It does not account for electricity connectivity for agricultural purposes (pump set connectivity), which is relatively high even in rural India.

10
The Government of India has prioritized providing electricity to all households by 20199 [30]. The Indian Government in April 2015 identified 18,452 un-electrified villages to rapidly electrify by this deadline. According to real time measurement by the Rural Electrification Corporation (REC), as of October 2016, 10,373 of these had been electrified (56%), 614 (3%) were un-inhabited and 7,465 (40%) had yet to be electrified [31]. 4,791 of these are to be connected to the grid, while another 2,538 are to be connected to mini-grids. Note however, India’s definition of electrification is limited to the provision of “Basic infrastructure such as distribution transformer and distribution lines; electricity is provided to public places like schools, panchayat office, health centers, dispensaries, community centers etc; and the number of households electrified should be at least 10% of the total number of households in the village”10[32]. These new connections will require significant investments in new capacity. The government is targeting investments of up to $250 B, $100 B of which is intended to focus on adding 175GW of renewable energy to the grid [33].
2.2.2 Cost of Meeting India’s Energy Needs: Coal vs. Solar
In order to sustain its GDP growth rate of approximately 8% over the last decade, India’s premier policy think tank, National Institution for Transforming India (NITI Auyog) has estimated the country will consume about 2500-3500 TWh of electricity annually by 2030, more than thrice its current generation [34]. At capacity factors (CF) of 60% and 21% respectively [35], this consumption level would require installation of 475-665GW coal plants or 1.3-1.9TW of solar capacity (Consumption = CF*365*24*Capacity). This would mean increasing India’s per capita consumption of energy, currently at about 1010 kWh/year [36]11 to near he global average of around 3,000 kWh/year.
To compute the total cost of electricity generation to meet India’s needs using either solar or coal, the analysis assumes that generation increases uniformly each year by 148.53TWh, from the baseline at the end of 2015 of 1272TWh to 3500TWh/year in 2030 (15 years). The analysis uses levelized cost of generation for each source – for coal, the CERC estimates annual levelized cost of about $5.5cents/kWh [37], and solar at $8.48cents/kWh [37].12 Costs are computed on an annual basis accounting for only 9 This target has shifted considerably under different administrations from 2012, 2022 and now 2019 10 This is based on the 2004 Ministry of Power declaration. Prior to that, a village was declared electrified for if electricity was used for any purpose in the village. 11 This is less than 10% of the average US resident whose consumption is 11,900 kWh/year and one sixth of the average German’s at 6,600 kWh/year 12 This is a conservative estimate for solar which has come down to about $6cents in India and as low as 2.34 cents in Abu Dhabi while the cost of coal continues to grow
11
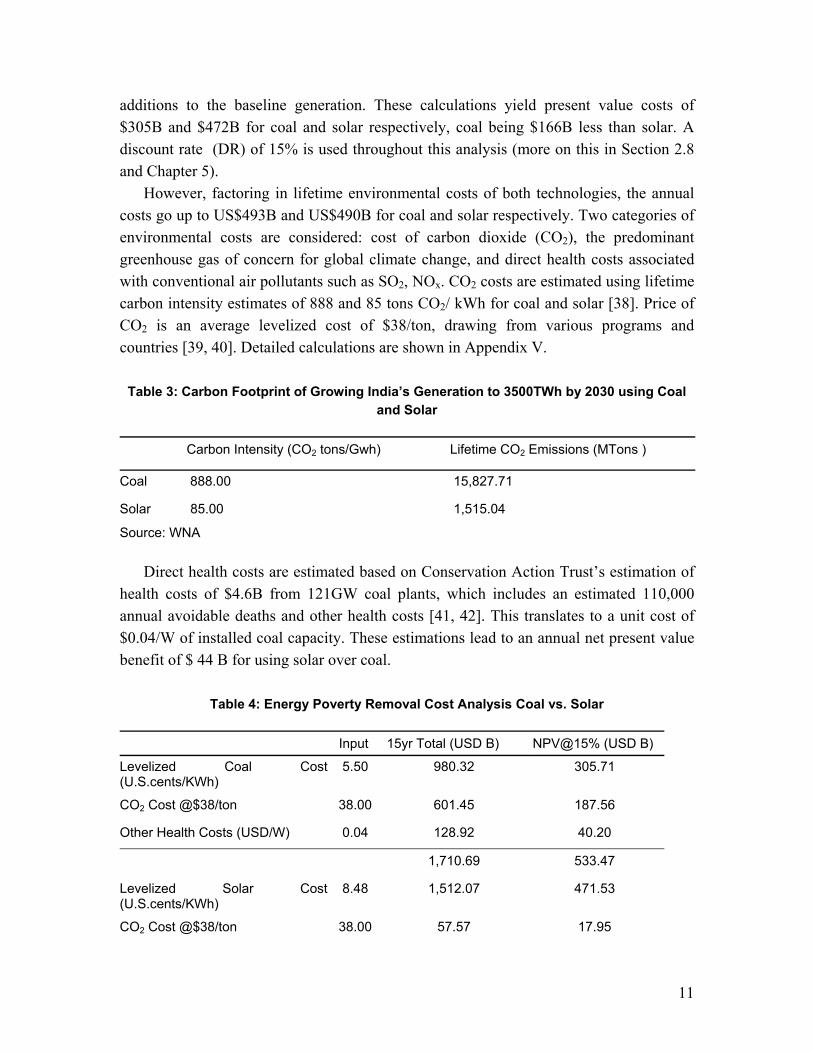
additions to the baseline generation. These calculations yield present value costs of $305B and $472B for coal and solar respectively, coal being $166B less than solar. A discount rate (DR) of 15% is used throughout this analysis (more on this in Section 2.8 and Chapter 5).
However, factoring in lifetime environmental costs of both technologies, the annual costs go up to US$493B and US$490B for coal and solar respectively. Two categories of environmental costs are considered: cost of carbon dioxide (CO2), the predominant greenhouse gas of concern for global climate change, and direct health costs associated with conventional air pollutants such as SO2, NOx. CO2 costs are estimated using lifetime carbon intensity estimates of 888 and 85 tons CO2/ kWh for coal and solar [38]. Price of CO2 is an average levelized cost of $38/ton, drawing from various programs and countries [39, 40]. Detailed calculations are shown in Appendix V.
Table 3: Carbon Footprint of Growing India’s Generation to 3500TWh by 2030 using Coal and Solar
Carbon Intensity (CO2 tons/Gwh) Lifetime CO2 Emissions (MTons )
Coal 888.00 15,827.71
Solar 85.00 1,515.04
Source: WNA Direct health costs are estimated based on Conservation Action Trust’s estimation of
health costs of $4.6B from 121GW coal plants, which includes an estimated 110,000 annual avoidable deaths and other health costs [41, 42]. This translates to a unit cost of $0.04/W of installed coal capacity. These estimations lead to an annual net present value benefit of $ 44 B for using solar over coal.
Table 4: Energy Poverty Removal Cost Analysis Coal vs. Solar
Input 15yr Total (USD B) NPV@15% (USD B)
Levelized Coal Cost (U.S.cents/KWh)
5.50 980.32 305.71
CO2 Cost @$38/ton 38.00 601.45 187.56
Other Health Costs (USD/W) 0.04 128.92 40.20
1,710.69 533.47
Levelized Solar Cost (U.S.cents/KWh)
8.48 1,512.07 471.53
CO2 Cost @$38/ton 38.00 57.57 17.95

12
Input 15yr Total (USD B) NPV@15% (USD B)
Other Health Costs (USD/W)
- 1,569.64 489.49
Difference (Coal – Solar Cost) 141.05 43.99
Source: Author’s analysis (WNA, EIA, CERC, WB, ITT)
While this study assumes uniform prices for both coal and solar, to be conservative,
NITI Aayog cited earlier in this study, estimate that the cost of coal and other fossil based generation will continually increase, making them even less financially viable than solar, before health and environmental costs, in the medium to long term [43].
In addition, a domestic coal supply shortage is spurring an increase in coal imports. As of 2014, more than 10% of India’s coal requirement in the power sector was imported. The share of imported coal is expected to increase to 25 per cent in 2017. India imported 179 million short tons of coal in 2012, the third-largest coal importer behind only China and Japan. Increasing dependence on imported coal may worsen India’s balance of payments and increase concerns about energy security, in addition to negatively impacting the environment. Furthermore, with many countries increasing their commitment to reducing their carbon footprints, taxes on coal in a number of countries13 could also increase the cost of electricity supply in India.
These combination of these factors is motivating Indian policy makers to exploit the substantial [44] potential of renewable energy. India’s solar energy mission, the Jawaharlal Nehru National Solar Mission (JNNSM) was created to provide environmentally benign energy to meet this demand gap. Indian policy makers favor solar over alternative renewable energies such as wind because the country has a higher estimated potential for solar. Recent estimates put the estimated solar potential at 750GW and wind at 302GW [43].
2.3 India’s Solar Industrial Policy
The Government of India expects to benefit from increasing industrial productivity by developing India’s manufacturing capabilities, especially in technologically advanced processes where India has a latent comparative advantage14. Governments often try to use industrial or trade policy to stimulate this transition. The desired evolution of India’s
13 Referring to the “global war on coal” which includes taxes in various countries including some of the mining activities. The World Bank has also stopped lending to coal projects. 14 Comparative advantage that could be realized with economies of scale. Or according to Richard Newfarmer, latent comparative advantage exists if the sector protected through industrial policy should soon be able to survive without protection.

13
solar sector informed the inclusion of a domestic content policy into India’s plan of installing 100GW of solar power by 2022. Policy makers hope that this policy will stimulate the local industry to provide about a tenth of the required equipment to meet the solar target.
If successful, India’s policy makers hope to 1) grow industrial productivity through sales of domestically-manufactured, high-purity silicon, solar cells, modules, and panels; (2) create new export opportunities to further improve its balance of payments position and foreign exchange earnings; 3) create jobs [45]; 4) increase the local tax base; and (5) achieve cost savings through technology learning-by-doing, searching (R&D) and interaction with developed markets [46-50]. This is an extensive list of ambitious goals, the combination of which some experts interviewed during this study consider unlikely to be achieved in tandem. Another less tangible but important benefit to manufacturing solar panels is the political desire for international recognition as a player in an emerging industry.
2.4 Brief Overview of Solar PV Technologies
Two PV technologies dominate the commercial solar industry presently: crystalline silicon (c-Si) and thin-film cells. c-Si is the most common, with close to 80% of the market share. c-Si is stable, delivers efficiencies in the range of 15% to 25%15, relies on established process technologies with an enormous database, and, in general, has proven to be durable and reliable. Its major disadvantage is that it does not absorb light well compared to other PV materials and therefore requires an extra thick layer. On the other hand, thin-film solar cells absorb light better, so they only require a thin layer, making them thinner and lighter. However, they are generally less efficient and less durable. The technology is also less mature, and therefore enjoys less support services. Some examples include: amorphous silicon (a-Si), cadmium telluride (CdTe), copper indium (gallium) diselenide (CIS or CIGS), and dye-sensitized solar cells (DSSC) and other organic materials [51] [19].
2.4.1 PV Production Chain
Below is a schematic illustration of the PV production chain, which corresponds to the various stages of PV manufacturing. The raw material and casting (ingot) processes represent the material phase; the wafer, cell and module processes are often referred to as the manufacturing phase, and the system design, financing and installation comprise the development phase.
15 For more information about ongoing research on solar cell efficiencies, readers may consult Martin Green’s solar efficiency tables and regular articles published in the progress in photovoltaics journal [19].

14
Figure 6: Solar PV Manufacturing Value Chain
This study focuses on the c-Si production chain, which begins with purification of silicon from quartz (sand) into what is known as polysilicon. The polysilicon rods created are then molded into ingots and sliced into wafers. These thin slices of pure silicon are then chemically treated (doping) to form cells. Crystalline silicon cells are thereafter wired together to form modules (a more detailed description of these processes is given in Chapter Three). Modules are then installed within panels to be connected and used in solar farms or on rooftops.
Presently, Indian firms produce cells, modules and panels, but not polysilicon. Manufacturers interviewed during this study argue that polysilicon is capital intensive and requires a lot of cheap energy to manufacture, which makes its production in India uncompetitive relative to countries where energy is cheaper. Policymakers’ stated goal is to become a significant player in all three sectors, including polysilicon manufacturing, and in time, encourage vertical integration. To achieve this, initial iterations of the Solar Mission included a domestic content requirement (DCR) that reserved about 33% of government procurement of grid-based c-Si solar panels for project developers that use domestically-manufactured panels. This is not dissimilar to policies in other countries (see section 2.6). Following the WTO ruling against India’s domestic content policy, however, policy makers are considering alternative industrial policy approaches to encourage the domestic manufacturing of solar panels. The next section explores the literature on industrial policy and some case studies that could provide some potential alternatives.
2.5 Industrial Policy
Industrial policy (IP) refers to “a government plan that is designed to encourage the development of industry or of a particular type of industry” [52]. Industrial policy is associated with government policies or activities “that distort trade and resource allocation across industries beyond the ones associated with optimal taxes or revenue constraints” [14]. Industrial policies are broadly categorized into hard and soft industrial policies. Hard IPs are direct incentives or charges that selectively favor one industry or

15
country over another such as tariffs, taxes, subsidies, DCR and other such similarly-intended incentives. Soft IP, by contrast, refers to the indirect use of governments’ convening powers, control of public goods or other means to nudge industrial production in a chosen sector or activity.
There is a debate in the relevant economic literature about whether industrial policy is effective in creating thriving industries at an acceptable cost, which includes welfare losses caused by its implementation [14, 53-59]. The following section discusses these issues.
2.5.1 Theoretical Foundations for Industrial Policy
The main argument for industrial policy is the notion that “infant” or developing industries are at a disadvantage against more developed ones, often in a competing “industrialized” country. From the Great Britain of old to the current-day United States to the newly-industrialized countries of East Asia, proponents of industrial policy argue that developed countries built out their industry by strategically favoring local manufacturing over imports from other countries, while at the same time promoting their own exports [59-64].
Modern proponents of IP cite the existence of “market failures” and competitive mercantilism as evidence for the need for government intervention in correcting these imbalances. A popular category of these market failures are the so-called Marshallian externalities, named after economist Alfred Marshall, who introduced many of these concepts in his 1920 book, Principles of Economics [65]. These have been further developed in the economic geography literature [66-68]. Some of these market failures include:
1) Knowledge spillovers and lack of appropriability. Developing new technology, training and research and development are not cheap but are often in the interest of the firms and countries exploring them in general. The solar sector particularly has seen many firms, and indeed countries, like China, Germany and the US (more in section 2.6) rise to leadership on the wings of innovation. The sector is poised for even more knowledge-spurred growth such as cell efficiency improvement and innovation in material costs. With increased intellectual property enforcements around the globe, India’s solar sector cannot depend on the imitation model employed by Korea, Taiwan and China in their early industrial development [69], therefore it must innovate to lead. However, firms, especially in developing countries like India, are wary of investing in research and development because the first mover company bears a disproportionate share of the cost, after which other companies take advantage of the knowledge that has been created. The knowledge developed naturally spills over locally and internationally to competitor firms who, not having made the initial investment

16
themselves, are able to deliver at reduced prices in the market, preventing first movers from recouping their investments. This principle also applies to training costs for staff, who can then move on to other domestic or overseas rivals to exploit their newfound expertise and resulting higher market value. Moreover, there is an inability to pool and spread the risks of innovation, which makes the social return from investing in innovation higher than the private returns (economic gains made by investing firm), thereby discouraging private investment in these fields [70, 71]. This creates an externality in the market that governments may help fix with IP, possibly by making public funding available for targeted research investment.
2) Marketing spillovers from social perception. Marketing spillovers have high societal returns, which are not easily appropriated by private investments. For instance, if there is a perception that Chinese goods are inferior, the perception affects even good firms in China, thereby eroding any incentive to invest in quality or branding. Singapore, Japan, Taiwan and Hong Kong notably invested in government programs to increase the perception of their domestic firms [72]. India’s solar sector currently does not have a reputation for being excellent or innovative, a situation that affects weak and strong firms alike in export markets. Building international brands often requires both private and public efforts. The Chinese public and private sectors have recognized this fact and continue to provide incentives to firms that are able to build an internationally recognizable brand, given that the existence and popularity of even a few is likely to spill over to benefit other local firms.
3) Product spillovers/ proximity. The location of companies in close geographic proximity to complementary services increases the productivity of and reduces costs for all associated firms. Because of the relative lack of industrial capacity, this type of co-location is often not present in developing countries [73]. Thus, when Taiwan and Malaysia developed industrial parks for high-technology industries, their governments provided explicit and implicit subsidies (through cheap credit)[13]. India’s solar firms have, up to this writing, mostly worked in isolation as opposed to their Chinese or German counterparts who have a number of clusters formed with government support. India’s policy makers are presently pushing to resolve this by building and encouraging the formation of solar parks.
4) Learning by doing. Firms get better at doing things by doing things. They also develop necessary relationships, technical partnerships and markets, which ultimately drives costs down. IP may pave the way for sectors with high entry costs to begin production and thereby the learning process. If these policies can kick start production, manufacturers can benefit from learning by doing, which delivers future reductions in marginal costs of production. Economies that never

17
start producing in a sector miss out on the associated future reductions in marginal costs in that sector [74]. Therefore, not developing the solar sector in India denies firms that could have reaped the benefits of growth by doing – which is why cell manufacturers interviewed insist that with a bit of start-up support and government procurement, the industry can learn by doing and outgrow its infancy and potential dependence on public funding.
5) Increasing returns to scale. India’s solar sector comprises many small firms, limiting the profitability of all firms in the sector. Most of these firms lack the capital to invest in expansion, thereby missing the benefits of scale such as lower average production costs [67, 75]. IP that focuses on firm expansion such as capital subsidies could help in this regard.
6) Coordination or sequencing failures. These occur when firms are co-dependent and the lack of one firm prevents the other from thriving. For example, a steel manufacturing industry would not exist if there is no market for large-scale construction; neither will the later thrive without a steel market. Another example is the effect of airfreight services on fresh flower industries in Ecuador and Ethiopia [76, 77]. IP could be needed to solve such coordination or sequencing limitations.
7) Capital market imperfections. India’s capital market is largely dominated by state-owned banks with limited technical understanding of the solar sector. Underdeveloped capital markets and high sovereign risk make firms less competitive in high capital-intensive activities such as polysilicon or wafer manufacturing because they are not inclined to fund these kinds of inherently risky ventures. India’s insurance markets are also not well developed to cover many of the specific solar manufacturing risks that firms face, which confounds the already challenging problem of access to finance [78, 79].
Theoretical models of industrial policy suggest that under certain conditions, it is socially optimal to use industrial policy to address these externalities. Mercantilist ideas of protecting infant industries in this way have been around for a while, but John Stuart Mill was the first prominent economist to give it intellectual credibility. He however cautioned that protection must be temporary and eventually lead to an industry capable of international competition without support. Charles F. Bastable further developed this reasoning by positing a cost-benefit condition for industrial policy support [59]. This conditionality has been codified in the economic literature [80] as the Mill-Bastable Test. The Mill Test evaluates whether the protection or subsidy will eventually lead to a sector capable of surviving competition in international markets (there is a latent comparative advantage), while the Bastable Test shows that aid is only justifiable if the discounted future benefit from the supported sector exceeds the present cost of support.
18
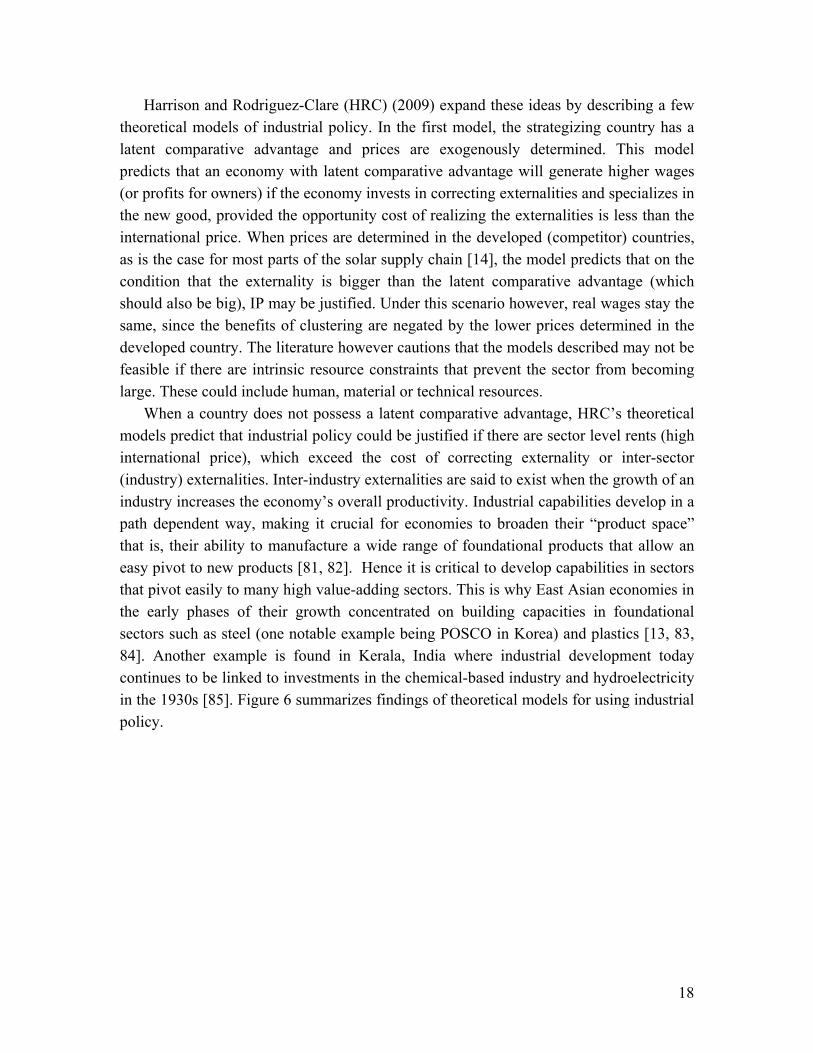
Harrison and Rodriguez-Clare (HRC) (2009) expand these ideas by describing a few theoretical models of industrial policy. In the first model, the strategizing country has a latent comparative advantage and prices are exogenously determined. This model predicts that an economy with latent comparative advantage will generate higher wages (or profits for owners) if the economy invests in correcting externalities and specializes in the new good, provided the opportunity cost of realizing the externalities is less than the international price. When prices are determined in the developed (competitor) countries, as is the case for most parts of the solar supply chain [14], the model predicts that on the condition that the externality is bigger than the latent comparative advantage (which should also be big), IP may be justified. Under this scenario however, real wages stay the same, since the benefits of clustering are negated by the lower prices determined in the developed country. The literature however cautions that the models described may not be feasible if there are intrinsic resource constraints that prevent the sector from becoming large. These could include human, material or technical resources.
When a country does not possess a latent comparative advantage, HRC’s theoretical models predict that industrial policy could be justified if there are sector level rents (high international price), which exceed the cost of correcting externality or inter-sector (industry) externalities. Inter-industry externalities are said to exist when the growth of an industry increases the economy’s overall productivity. Industrial capabilities develop in a path dependent way, making it crucial for economies to broaden their “product space” that is, their ability to manufacture a wide range of foundational products that allow an easy pivot to new products [81, 82]. Hence it is critical to develop capabilities in sectors that pivot easily to many high value-adding sectors. This is why East Asian economies in the early phases of their growth concentrated on building capacities in foundational sectors such as steel (one notable example being POSCO in Korea) and plastics [13, 83, 84]. Another example is found in Kerala, India where industrial development today continues to be linked to investments in the chemical-based industry and hydroelectricity in the 1930s [85]. Figure 6 summarizes findings of theoretical models for using industrial policy.
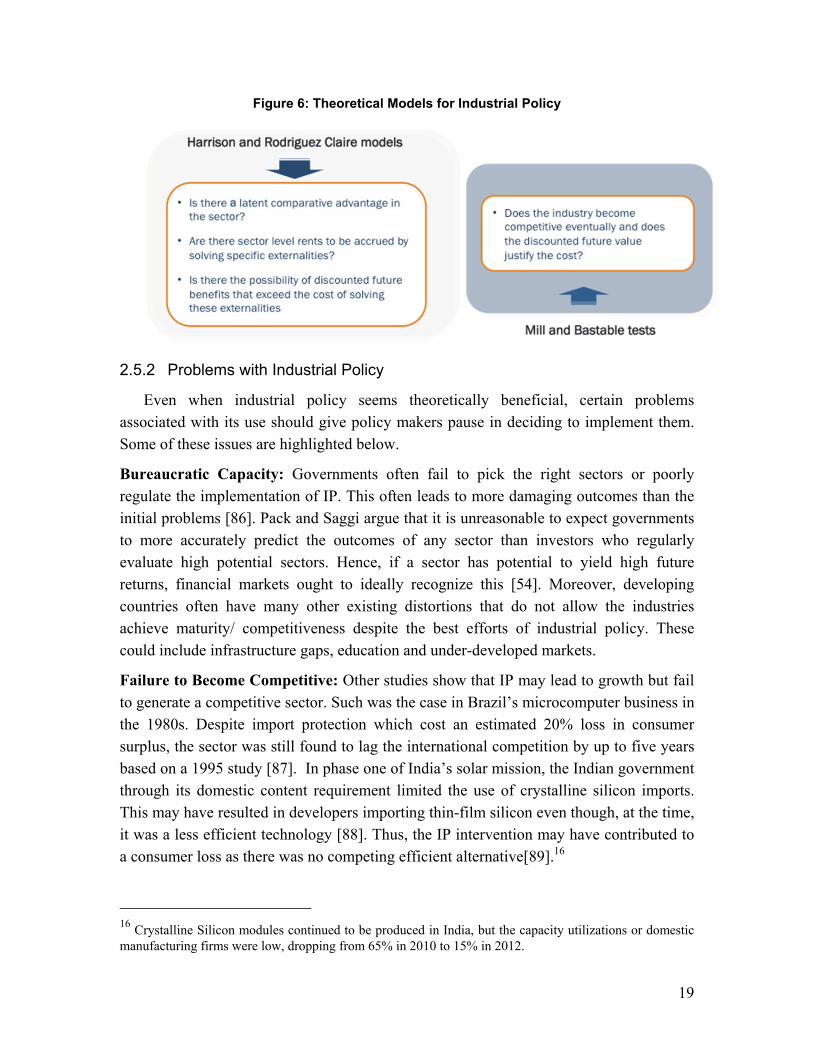
19
Figure 6: Theoretical Models for Industrial Policy
2.5.2 Problems with Industrial Policy
Even when industrial policy seems theoretically beneficial, certain problems associated with its use should give policy makers pause in deciding to implement them. Some of these issues are highlighted below.
Bureaucratic Capacity: Governments often fail to pick the right sectors or poorly regulate the implementation of IP. This often leads to more damaging outcomes than the initial problems [86]. Pack and Saggi argue that it is unreasonable to expect governments to more accurately predict the outcomes of any sector than investors who regularly evaluate high potential sectors. Hence, if a sector has potential to yield high future returns, financial markets ought to ideally recognize this [54]. Moreover, developing countries often have many other existing distortions that do not allow the industries achieve maturity/ competitiveness despite the best efforts of industrial policy. These could include infrastructure gaps, education and under-developed markets.
Failure to Become Competitive: Other studies show that IP may lead to growth but fail to generate a competitive sector. Such was the case in Brazil’s microcomputer business in the 1980s. Despite import protection which cost an estimated 20% loss in consumer surplus, the sector was still found to lag the international competition by up to five years based on a 1995 study [87]. In phase one of India’s solar mission, the Indian government through its domestic content requirement limited the use of crystalline silicon imports. This may have resulted in developers importing thin-film silicon even though, at the time, it was a less efficient technology [88]. Thus, the IP intervention may have contributed to a consumer loss as there was no competing efficient alternative[89].16
16 Crystalline Silicon modules continued to be produced in India, but the capacity utilizations or domestic manufacturing firms were low, dropping from 65% in 2010 to 15% in 2012.

20
Effect on Productivity: Many studies, including a number on India, have shown that protection may lead to productivity loss. Efforts at reducing protectionism by lowering final goods and input duties have also been found to increase productivity [90-93].The impact of input duties cuts on productivity is even larger than the impact of final goods (output) tariff cuts [92]. Using a panel study of 36 Korean industries, Kim 2000 showed that trade liberalization improved productivity, market competition, and scale efficiency while quota protection (a form of DCR) had a more significant negative impact than price protection measures on market structure [94]. Moreover, there is often large heterogeneity between firms in a sector, which are not adequately accounted for by most advocates of IP. Poorly implemented IP may end up encouraging low productivity firms, rather than maximizing high productivity firms.
Political Capture: IP is often subject to political capture and rent-seeking activities by powerful firms or constituencies, particularly in democracies. Rent seeking is said to occur when firms or individuals take advantage of their privileged information or access to extract economic gain from others without returning any benefits to society through wealth creation. Also, it is often politically challenging to roll back incentives or protections once implemented. This was found to be the case for India’s auto industry, discussed later in this chapter.
Changing Markets and Regulatory Environment: Multilateral agreements such as the WTO’s Trade Related-Investment Measures outlaw some of the interventions that East Asian countries or earlier industrializers used in their development. Moreover, reduced transportation and communication costs have led to more distributed production networks, which are difficult for new entrants to penetrate, as individual roles in these networks are increasingly more specialized. Also, rapidly changing quality requirements make attainment of competitive advantage in a technology fleeting, as obsolescence rates are rapid. Figure 7 summarizes justifying externalities and problems with industrial policy.
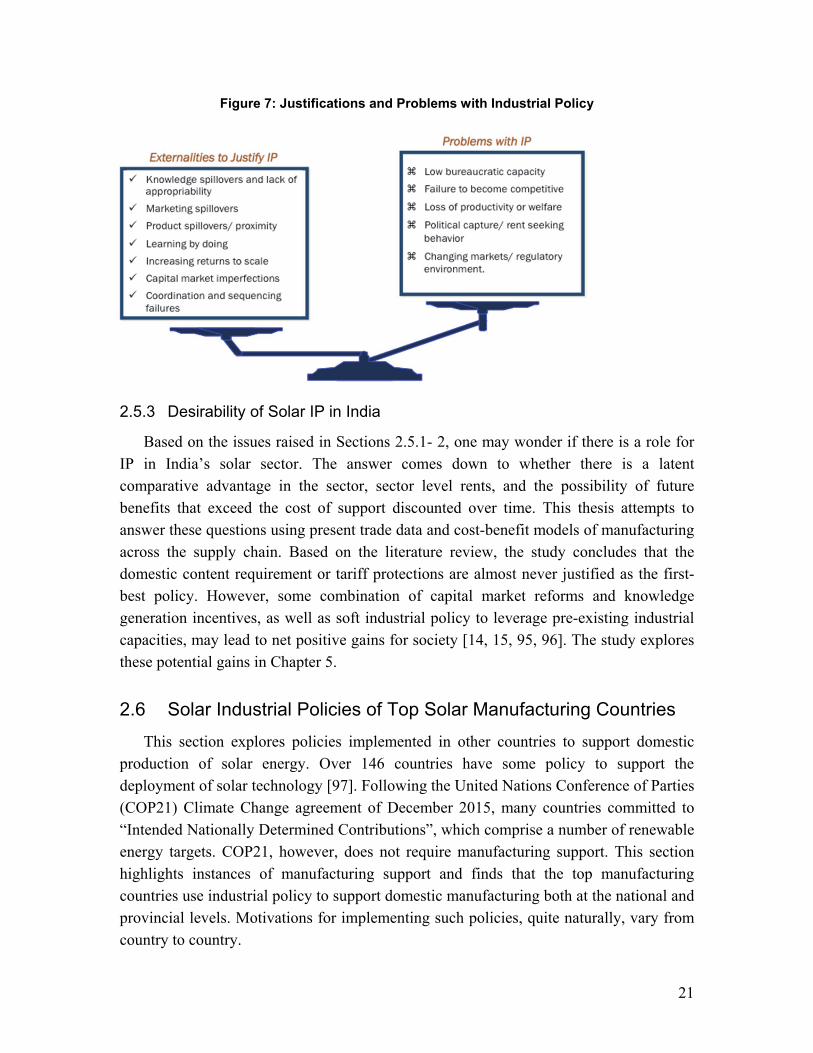
21
Figure 7: Justifications and Problems with Industrial Policy
2.5.3 Desirability of Solar IP in India
Based on the issues raised in Sections 2.5.1- 2, one may wonder if there is a role for IP in India’s solar sector. The answer comes down to whether there is a latent comparative advantage in the sector, sector level rents, and the possibility of future benefits that exceed the cost of support discounted over time. This thesis attempts to answer these questions using present trade data and cost-benefit models of manufacturing across the supply chain. Based on the literature review, the study concludes that the domestic content requirement or tariff protections are almost never justified as the first-best policy. However, some combination of capital market reforms and knowledge generation incentives, as well as soft industrial policy to leverage pre-existing industrial capacities, may lead to net positive gains for society [14, 15, 95, 96]. The study explores these potential gains in Chapter 5.
2.6 Solar Industrial Policies of Top Solar Manufacturing Countries
This section explores policies implemented in other countries to support domestic production of solar energy. Over 146 countries have some policy to support the deployment of solar technology [97]. Following the United Nations Conference of Parties (COP21) Climate Change agreement of December 2015, many countries committed to “Intended Nationally Determined Contributions”, which comprise a number of renewable energy targets. COP21, however, does not require manufacturing support. This section highlights instances of manufacturing support and finds that the top manufacturing countries use industrial policy to support domestic manufacturing both at the national and provincial levels. Motivations for implementing such policies, quite naturally, vary from country to country.

22
In the US and Germany, the government mostly provides fiscal support for research and development as well as start-up support for domestic solar manufacturers. However, in the event that there is perceived injury to domestic manufacturers, these countries use duties to curtail imports, especially in cells and modules but rarely in wafers, polysilicon and other inputs. Countries like China, India, South Africa, Saudi Arabia and even Canada and Italy favor local content requirements and promote policies related to infant industry protection in addition to fiscal incentives. Most countries, however, provide individual incentives to various firms in specific domains to stimulate local growth. An example of this is the $750 million support Solar City is getting for setting up a hybrid (vertically integrated) manufacturing firm in Buffalo, New York [98].
2.6.1 The United States
In general, support for local solar manufacturing has yielded mixed results. In the US, for example, a number of companies that benefited from various incentive programs have failed. Of the eight companies that benefited from the Advanced Energy Manufacturing Tax Credit (Abound Solar, Calisolar, MiaSole, First Solar, Sharp, Suniva, Suntech, and Yingli) which reached its funding cap of $2.3B in 2010, at least three - Xunlight, Abound, and Sharp—have closed their factories. The DOE Loan Guarantee Program (Section 1705) did not fare much better. The $13.27 billion program, which expired in 2011, funded sixteen solar projects, of which four were manufacturing projects. Of the four manufacturers, Solyndra declared bankruptcy in late 2011 and defaulted on its $535 million loan, Abound Solar received about $70 million of its $400 million loan before closing its solar panel operation and filing for bankruptcy in 2012, and SoloPower never met the requirements to initiate its $197 million loan guarantee. 1366 Technologies, which received a $150 million guarantee, is the only firm still operational [99]. Most failed for betting on technologies that never became commercially viable, especially against the back drop of sharp price drops caused by oversupply of cSi cells and modules from China.
The more common US programs are the deployment-focused incentives such as the Investment Tax Credit (ITC), which allows residential and commercial solar projects to offset 30% of their system costs from their taxes. This is in force until December 2016, after which time it can be renewed by Congress or allowed to expire with the credit will dropping to 10% in 2017 were this to happen. The Section 1603 Treasury Cash Grant Program, which expired in 2011, provided cash grants to projects in lieu of the 30% investment tax credit. About 95,000 projects benefited from this incentive totaling $7.3 billion.
The US, however, continues to lead the search for innovative projects to upend the current technology landscape through US Department of Energy initiatives such as Sunshot and Advanced Research Project Agency-Energy (ARPA-E). The SunShot

23
Initiative aims to provide 14% of US electricity by 2030. Programs under Sunshot include:
The PV incubator program which supports promising manufacturing processes;
PV supply chain and cross-cutting program which provides about $20.3million to fund non-solar companies that contribute to the supply chain;
Advanced Solar Photovoltaic Manufacturing Initiative (PVMI) which supports advanced manufacturing with up to $112.5m; and
SUNPATH, which supports domestic manufacturing through demonstration projects with up to $45m.
ARPA-E, analogous to the DOD’s DARPA, funds highly innovative projects. This initiative received funding in the amount of $280m in 2014. Applied Materials and 1366 Technologies have also received funding for polysilicon processing under ARPA-E.
US Import Restrictions and Trade Wars with China
In 2011, the US Department of Commerce, at the prodding of the Coalition for American Solar Manufacturing (CASM), led by Solar World, MX Solar, Helios Solar and four other companies, investigated dumping charges against Chinese manufacturers. This investigation led to various antidumping and countervailing duties being leveled against Chinese firms importing crystalline solar cells into the US. Solar World, a German firm, also led a similar petition to the EU, which led to a minimum import price for Chinese imports in Europe.
In retaliation, the Chinese imposed import duties of up to 57% on US polysilicon imports, effectively preventing US firms from selling to Chinese wafer manufacturers who control 80% of the wafer market. The US firms can however import to China only if the imports are raw materials for eventual Chinese module exports. The Chinese are also able to exploit a loophole in the US policy by producing cells in Taiwan, thereby avoiding the US duties.
The US Department of Commerce in 2015 elected to extend the investigation to include Taiwanese cells and modules. Since February 2015, the US has imposed antidumping and countervailing taxes of between 26.6-165% and 27.64-49.79% on Chinese imports, and 11.45%-27.55% on Taiwanese imports. The duties were opposed by the Solar Energy Industries Association (SEIA), which complains that duties increase prices for US consumers.
Meanwhile, a number of US polysilicon manufacturers such as REC and Sun Edison have been forced to close operations due to their lack of access to vital Chinese markets. German polysilicon manufacturer, Wacker Chemie, which recently opened a 20,000MT facility in Tennessee, remains in operation because it was able to negotiate an
24
independent agreement with the Chinese Ministry of Commerce (MOFCOM) to import at a minimum price[100].
US Export Promotion
Trade agreements such as the Information Technology Agreement ensure that US firms pay most favored nation (MFN) tariffs in most markets to which they export. The US Export-Import Bank also provides direct loans to solar manufacturers through its Environmental Products Program, which allocates funding to renewable energy. Some beneficiaries of this funding include MiaSole ($9 million loan) for the export of solar modules to India, SolarWorld ($6.4 million guarantee) to finance the export of solar modules to Barbados, and Suniva ($780,000 loan guarantee) for solar module exports to Mexico.
2.6.2 China
China leads the world in PV production across the value chain, with five of the big six module manufacturers--Trina Solar, JA Solar, Yingli Green, Jinko Solar and Hanhwa Q Cells--coming from China. Chinese manufacturers benefit from a range of government incentive initiatives. IRENA reports that the Government of China provides loans at very low interest rates (1-2%) with an extended credit limits (up to 20years). Between 2010 and 2011, Chinese manufacturers received $34-$40 billion in low interest loans[101]. Manufacturers also get inputs at subsidized rates. Polysilicon and land, for example, are provided to manufacturers at less than market rates by government-owned entities. For example Suntech and Trina Solar were awarded 3,000 and 7,000 acres respectively for such projects [102].
The “Two Free, Three Half” programme for foreign-invested enterprises allows full exemption of income tax for two years and a 50 per cent rebate on the third year for manufacturers setting up in China. Preferential tax program technology enterprises provide discounted tax rates of up to 15 per cent (from the usual 25%). Import tariff and value added tax (VAT) exemptions are also provided for equipment and raw materials. Lump sum cash grants are also provided to famous brands or Chinese firms that become famous internationally. This was challenged in the WTO by the US and other third parties, but a panel was never set up to investigate after direct consultations between the parties took place [103].
China also applied a Buy-Chinese procurement policy for its domestic infrastructure projects, which “favors” firms which use at least 50% domestically procured solar equipment except domestic equipment are produced more than 20% abroad [104]. The program was not challenged at the WTO since China is not a signatory to the WTO Agreement on Government Procurement (GPA). The program was discontinued in 2009 as there were concerns about potential WTO challenges. The Indians would subsequently

25
fail at using this argument in their case at the WTO on the grounds that the government procures solar energy, not modules and cells.
Chinese firms also benefitted from low interest financing, mostly from state-owned banks. For example, “of the USD 41.8 billion invested in the global solar industry in 2010, USD 33.7 billion came from the Chinese government” [2]; this funding mostly came from the China Development Bank (CDB), which alone provided $30B in low-cost loans to the top five PV manufacturers in the country.
The Government of China also provided free land or land transfer price refunds, electricity price refunds and multiple-year corporate tax reductions. The financial support coupled with growing demand enabled firms to expand their capacities; “poly-silicon production capacity increased from 5,000 T in 2007 to 190,000 T in 2012. The wafer production capacity increased from 4.5 GW in 2008 to 50 GW in 2012. The cell production has increased from 0.2 GW in 2005 to 21 GW in 2012. Module production capacity increased to 23 GW in 2012” [3]. Firms were also able to purchase equipment and pay for technology licenses and services of experts and collaborations with research institutions [2], which was critical for technology transfer.
In terms of research and development, the Chinese Ministry of Science and Technology (MOST) invested an average of $80 Million in R&D annually across the supply chain [105]. Through the Chinese Academy of Sciences (CAS), solar PV and small inverter testing laboratories were established in Beijing, Lhasa, Wuxi and Baoding to facilitate demonstration projects. In 2010 alone, up to 38 national energy R&D centers were approved and established by the National Energy Administration Under programs such as the Key Technology Program, 863 High Tech Program and 973 Basic Research Program and its Medium to Long Term Plans (MLPs), the Chinese government invested billions of dollars across the energy innovation process, from “research, development, demonstration, market formation, diffusion to the feedback loops” [106]. The 863 Key Technology, 863 and 973 programs invested up to $1 billion, $3 billion and $1.3billion respectively from 2001 to 2005, and another $585 million was approved in 2008 jointly for the 863 and 973 R&D programs. Leveraging the 863 Program, Trina Solar’s scientists developed cells with photoelectric conversion efficiency greater than 22% from the global average of about 19% in 2013. The 973 Program funded up to 382 projects between 1998 and 2008, with each project, on average, receiving up to $3.2m over a span of 5 years [107]. The government also funded a number of industry wide R&D demonstrations and sponsored licensing. For instance, state-owned Emei Semiconductor Research Institution successfully piloted and transferred polysilicon technology to Chinese manufacturers to meet demand. These research innovations and overall support generally helped Chinese firms increase capacities, drive down costs and increase efficiencies [107].

26
2.6.3 Germany
German companies benefit from a vibrant industrial base and strong infrastructure support [108]. The Joint Task and Investment Allowance programs provide manufacturers with financial incentives to manufacture domestically – both through cash grants to locate manufacturing in different parts of Germany [108]. For example, €650 million ($ 578m) was allocated in 2011 for a joint task program, investment allowance (in Eastern Germany), reduced-interest loan by KfW and state development bank and public guarantees at the state and federal level. Some other programs, which used government support include:
Innovation Alliance PV, which was founded in 2010 to foster alliances among specialized research institutions and the solar business community. Innovation projects range from the reduction of material costs for PV systems to production process optimization and the development of new products.
Solar Valley Mitteldeutschland: this initiative represents a cluster of solar energy stakeholders comprising more than 20 solar companies, ten specialized research institutions, five universities, five colleges and three state-level ministries from the participating federal states of Saxony, Saxony Anhalt and Thuringia.
Sixth Federal Energy Research Programme contributes to achieving national energy and climate targets, enhance the leading position of German companies and widen technological options[109].
A high-level comparison of policies in the various countries is shown in Table 5 below for ease of reference. It shows that India’s experience is similar to the other major countries as each, with the possible exception of Germany, has implemented some domestic content requirement, albeit limited to government procurement in the US for mostly naval applications. It is also the case that each country continues to provide a lot of research and development support, capital, electricity and land subsidies, and low-interest financing. India could possibly provide more of these instead of the domestic content requirement in a time-limited and cost-effective manner.

27
Table 5: Industrial Policy in Top Solar Manufacturing Countries
Category China USA Germany India
Balance Sheet Support Policies
BIPV subsidies Golden sun: 50-70% subsidy on projects (2009) Buy Chinese (80% DCR) Sub-central government development of “Famous Brands” lump sum awards
Solar manufacturing incentive under ARRA capped at $2.3B (2009) US Exim banks support US exports with cheap financing Domestic content requirement under the buy-American act
Joint task program cash grants Investment allowance for Eastern Germany cash grant Solar Valley (2008) – support for cluster formation
Domestic content requirement Special investment promotion schemes Joint venture/ Foreign investment/ Technology transfer requirement
Preferential lending Silicon at less than market rate Subsidized land
1603 Treasury Program – Federal grant in lieu of ITC DOE’s loan guarantee program
RE Loan program Solar PV storage loan program
Generation Based Incentive (GBIs) Reverse auction mechanism (RAM) Bundling of solar power (NVVN) Viability gap funding (VGF) Low cost financing State subsidies
Income Support Policies
Income tax exemption for 2 years, 50% 3 yrs VAT rebates for Chinese equipment bought by foreign companies Import tariffs for imported equipment
30% investment tax credit (2006-2016) Accelerated depreciation (MARCS) 38 and 29 states respectively offer property and state tax exemptions for RE
Accelerated depreciation Industrial clearances Tax holiday Excise duty exemption Custom duty exemption
Research and Development
Demonstration projects to support R&D Key technology R&D program 863 and 973 programs funding high technology and basic research respectively 5 year plans which list solar
National research council (2001) Stimulus funding Sunshot and other DOE programs
Sixth federal energy research program to widen technological options (2011) Innovation Alliance (2010)
MNRE R&D initiatives for solar PV DST R&D initiatives for solar PV Demonstration projects Resource data initiatives through CWET

28
Category China USA Germany India
as strategic
Demand Stimulation
Feed in tariffs (2009) Government direct purchasing
Net metering in 43 states and DC Property assessed clean energy fund Rebates and generation incentives DOE Appropriations Federal contracting Reverse auction mechanism (CA) Renewable energy standards in over 25 states
Feed in Tariffs (since 1991), last updated in 2012
Feed in Tariffs Renewable purchase obligations for states and distributors Renewable energy certificate (RECS)
Sources: Authors’ analysis from various sources referenced in detailed text below

29
2.7 Competitiveness Analysis Methodology: Revealed Comparative Analysis
The concepts of comparative advantage or international competitiveness are often used interchangeably in the economic literature but differ slightly in that while competitiveness measures trade success, comparative advantage suggests technological superiority. One of the foundational theories for comparative advantage is the Ricardian trade model, based on the work of David Ricardo and first presented in “The Essay on Profits” (a single-commodity version), then in “The Principles” (a multi-commodity version), and further developed by other economists [110-112]. The Ricardian model of comparative advantage suggests that technological superiority – the ability to produce more output with less labor input – should be the basis for comparative advantage. Other sources of comparative advantage include abundance of primary or intermediate inputs (input costs) [113], scale of production [67, 114] or a combination of these in the product cycle [115].
Balassa’s ‘revealed comparative advantage’ (RCA), which uses exports, has been widely used in the empirical trade literature to measure relative advantage between countries in an industry. It uses export market share as a key variable [116] [117]. RCA reflects a country’s export value relative to the average country or worldwide norm. It is computed as:
RCAkit = ,
Where ,is the country ’s export in good, k in unit at time, t. A calculated RCA value of greater than one (RCA>1) suggests that a country has
comparative advantage in the product. RCA, it should be noted, measures international “export” competitiveness and not necessarily comparative advantage [118, 119]. This is because, while competitiveness can be improved by the use of subsidies, exchange rate or other export incentives, it does not indicate comparative advantage or the sources of competitiveness. The RCA gives an ex-post assessment of a country’s competitiveness, and therefore is a good indicator to assess and discuss the current state of India’s international competitiveness across the solar value chain. Because trade data are also available for several years, it allows a longitudinal view of competitiveness [120].
One handicap of RCA as a measure of comparative advantage is that it does not capture trade within a country. This handicap, in the case of high demand countries such as China, the US or India could account for a lot of the value omitted. For example, if India is the leader in solar modules but most of its market is domestic, this value does not
30
get captured. It also does not reflect value captured in originating countries of global supply chains in the form of remittances from international subsidiaries.
Nonetheless, export success has been shown to be a useful measure of firm productivity and by inference an industry’s relative strength [84]. And indeed, if domestic firms are internationally competitive, the existence of a strong domestic market ought to bolster their export competitiveness and not hinder it, except if they are receiving support domestically that they do not get in international markets. To balance the weaknesses of RCA, a couple of other measures are used in the literature and will be applied in this study to analyze India’s trade in solar, namely specialization and trade balance. Specialization measures the ratio of export to import in a commodity relative to overall export to import ratio of the country:
s = ( *100%).
Trade balance, on the other hand, measures the difference between exports (E) and imports (I) over the sum of exports and imports.
TB = ( ∗ 100%).
Specialization and trade balance address the key drawbacks discussed earlier, as they give an indication of where most of the products consumed domestically come from by contrasting imports to exports [121].
A specialization (S) value of more than one (S>1) shows India is specialized in the trade. A positive trade balance (TB) (TB>0) shows the country is a net exporter.
It is unlikely that India would have a revealed comparative advantage in solar PV modules, as this is a relatively new sector in the country. Its trend over time and revealed comparative advantage in complementary sectors may however be instructive. RCA analysis also enhances our understanding of sectors/differentiates sectors and provides insight into which parts of the value chain may have latent comparative advantage. This study updates previous studies by Sahoo and Shrimali [88, 122-124], which evaluate the effectiveness of India’s domestic content policy. Sahoo and Shrimali also conduct a revealed comparative advantage (RCA) analysis of manufacturing solar modules and balance of system equipment up till 2010.
2.8 Discounted Cash Flow Analysis Using Capital Asset Pricing Model
The present study will utilize the discounted cash flow (DCF) approach to analyze the potential profitability of solar manufacturing across the value chain in India, building on the approach employed in NREL’s similar techno-economic modeling studies of the solar

31
c-Si chain in China and the United States [125-127]. Discounted cash flow (DCF) modeling is often used by businesses to determine if a project creates value [128]. DCF modeling calculates the net present value (NPV) of future cash flows discounted to the present time. The internal rate of return (IRR), which estimates the discount rate that attains a zero NPV, is a related metric for estimating project value that is commonly used as a more intuitive substitute measure for NPV. In a survey of Indian firms, eighty-five percent of the respondents consider IRR a “very important” or “important” (i.e., a response of 5 and 4 on a Likert scale) project choice criterion, compared with 66 percent for NPV [129].17
Discounted cash flow analysis is essentially an accounting cost-benefit analysis that estimates the net value of forecasted cash flows from an investment discounted over the life of the project. The discount rate used, however, has a significant impact on the outcome predicted, and the process for determining an appropriate discount rate is therefore a critical analysis input. The discount rate reflects the opportunity cost of making the investment or the returns that could be made from an alternative use of capital. A common metric used in literature to ascertain an appropriate discount rate is the Weighted Average Cost of Capital (WACC), and it is reported to be the most widely accepted approach for determining the discount rate [130]. It reflects the fact that different sources of financing have different costs for the same risk (largely due to tax effects). It is calculated based on the equation below [131]:
∗ 1
Where:
Re = equity rate Rd = cost of debt E = Value of private sector’s equity D = Value of debt
V = E + D = Total capital invesment E/V = percentage of financing that is equity D/V = percentage of financing that is debt t = corporate tax rate
The cost of both equity and debt are usually determined using market-based rates of similar obligations [129]. According to a survey of the cost of capital techniques used by a sample of 177 major U.S. industrial firms, more than two-thirds of firms use market rates to determine the cost of debt [129]. The key issue in determining the costs of equity and debt is how to price in the risk of a project. We discuss this further below in Section 2.8.1. Also, the debt–to-equity ratio is mostly determined by firms’ trade-off between the benefits of debt and equity [130]. The main benefit of a higher debt-to-equity ratio is the tax deductibility of debt [131] as shown in the WACC equation. The main drawback of a
17 IRR and NPV received mean Likert scores of 4.36 and 3.73, respectively.
32
relatively higher level of debt is that it raises the risk of bankruptcy due to large fixed obligations. In the case of India’s solar industry, government policy for providing finance restricts debt to 70% of project cost. We will therefore assume this ratio in our analysis. Ultimately, models for WACC often adopt the going market norms for debt-to-equity ratios. Indian regulators, through the Income Tax Act, do not prescribe debt-to-equity ratios. However, exchange control regulations stipulate a maximum permissible ratio of 4:1 for borrowings from foreign equity or debt holders [132]. Common debt equity ratios in India’s solar sector are about 70-30 [133, 134].
2.8.1 Capital Asset Pricing Model (CAPM)
The pricing of risk forms the main theoretical dilemma faced by firms in determining the value of financial assets. The capital asset pricing model (CAPM) [132-134] is the standard method for analyzing the cost of risky assets [135]. In firm surveys, 73.5% of U.S. and 45% of European firms use CAPM [136, 137]. Despite its widespread use, however, CAPM has flaws and fails to consistently predict return patterns in stocks. Moreover, many argue its applicability is limited in emerging markets, including India [138-141].
According to the CAPM, the appropriate cost of a risky asset, for example equity, (Re) is determined by the risk-free rate (Rf), a market risk premium (Rm) and the
sensitivity of the project or company to market fluctuations (the beta or ), as follows:
Cost of equity,
Risk-free rate ( ) for high-credit rated countries such as the United States is often
assumed as equivalent to the government bond yield rate. However, for a country like
India, the risk free rate is the government bond rate, , less the country risk premium, or
sovereign default spread, , or:
Risk-free rate
The market risk premium is the difference between the expected return on a market
portfolio, and the risk free rate, . The most important variable to estimate for each
investment is the firm’s systematic risk, beta, . For a publicly listed company with
sufficient data, the most common way to estimate beta is to regress a company’s returns (CR) against the returns to the market (MR), using the following regression equation:
where is the returns on company, stock in time t, MR is the market return at time,
t. , are the regression constant, beta and error terms for stock, [130].
In cases other than publicly listed companies, an alternative approach is needed to estimate beta. The most common approach for estimating the beta of a non-traded firm or for a division is to use the average of the betas of comparable publicly-listed companies (comparable company analysis) [142]. Most Indian companies, according to Anand

33
(2002), use industry beta to estimate cost of capital. One drawback is that the beta of a diversified firm (Tata for example) may not be representative of the beta for the industry.
After deriving equity beta, it is important to “unlever” the beta to remove the risk
associated with financial leverage to obtain the asset (unlevered) beta, u.; Hamada
(1972) provides a model for calculating unlevered beta as:
1 1
Where βe levered firm’s equity beta; βu= unlevered firm’s equity beta (asset beta); T= corporate income tax rate; D= market value of debt; and E= market value of equity [143].
2.8.2 Reliability and Choice of Beta
Blume (1971) found that the estimation of beta using extrapolative regression models, described above, is unreliable especially for individual securities (companies). The study showed that single security beta coefficients of one period were not good predictors of the corresponding betas in the subsequent period. However, as portfolio size increases, beta estimates become more reliable [144]. This is significant in the case of the few publically traded Indian solar companies, which do not have the many years of data necessary to produce reliable estimates. One way to get around this problem is a combination of a Bayesian predictor and a reasonable portfolio size [145], which is outside the scope of this study. Another method is to simply benchmark to a comparable company [142], which is what this study employs. The study estimates assumes unlevered beta of 1.46 arrived at by Donovan and Nunez (2012) for Indian renewable energy investors using an alternative approach they refer to as downside beta CAPM
[128] (note that unlevered for example traded parent companies of Indian solar
manufacturers are around Tata, 1.46 [146] and Moser Baer, 2.33[147]). This compares with the values of 1.4 and 1.6 for China and the US which are used in the comparable NREL 2015 report [125]. This unlevered beta is re-levered using the equation above to obtain an equity beta of 3.96, am equity rate of 30.55% and a WACC of 15.07%.
2.9 Contributions to the Literature
This dissertation makes a few notable contributions to the literature. First of all, this study extends the work of Sahoo and Shrimali by updating the values and analysis of this very dynamic market and to include the individual compoents of the value chain, i.e, polysilicon, wafer, and cell production separately. It also uses broad stakeholder interviews to analyze findings and provide further insights.
Chapter 5 builds on previous work by NREL [125, 126]. This study contributes to the Indian solar manufacturing literature as no such academic cost modeling has been done

34
on the solar manufacturing chain, to inform policy makers of the cost of supporting the sector, with capital, interest rate or input (electricity) subsidies and tax breaks and the amount of value that can be recovered from such an investment. It also evaluates the possible impact of removing input duties. The study also provides recommendations that could be useful in informing the implementation of arguably the most ambitious renewable energy drive in an emerging country.

35
3. Solar PV Industry in India
This chapter focuses on the solar photovoltaic industry in India. First, it provides an overview of India’s electricity policies in recent times with a particular focus on policies that have influenced the development of the solar PV industry – manufacturing and installation. The chapter then delves into the current state of the industry in India, identifying the big players and their respective productive capacities. The chapter ends with a discussion of the methodology and results of a revealed comparative analysis of India’s PV production chain and provides insights about the use of domestic content requirements.
3.1 India’s Solar Electricity Policy Roadmap
Figure 8: India’s PV Annual Manufacturing and Installation Capacities (MW)
Table 5: India’s Solar Policy Roadmap
Year Policy Key Implication
1992 MNRE established Charged with promoting renewable energy
2003 Electricity act Assigned state level renewable quotas
2005 National electricity policy Supports procurement of grid based RE
2006 National tariff policy Regulates pricing of RE
2008 National action plan on climate change
Set RE target at 15% generation by 2020
2009 Gujarat solar policy First large scale solar incentive program, closely mirrored by other states and national
2010 Solar mission Set target of 20 and 2GW grid based and rooftop solar by 2022
March2007
Dec2009
March2012
Dec2012
June2014
March2016
Cell(CSTEP) 45 192 700 848 1216 1212
Module(CSTEP) 80 300 1300 1952 2348 5620
Installation(MNRE) 95 267 1472 2476 3359 8503
0123456789
Capacity(MW)
Thousands

36
2011 National manufacturing policy Targets raising industrial production for 15 to 25% of GDP; supports industrial zones and technology acquisition for firms
2012 Modified special incentive scheme
Provides 20% capital subsidy up to $833M for tech manufacturing
2014 Updated JNNSM Target raised to 60GW and 40GW grid based and rooftop solar by 2022
Source: Author’s desktop compilation
As of March 31, 2016 [148], the total installed capacity of solar PV manufacturing in India was 5.62 GW, up from under 0.1GW less than a decade ago. Policy makers have attempted to support this manufacturing growth through a number of key policies interventions including:
The Electricity Act, 2003: De-licensed electricity generation and put it under a central regulator, the Central Electricity Regulatory Commission (CERC). This allowed for private sector entry into the electricity market. It also decentralized regulation, empowering states to generate their own electricity, without central authorization, engendering competition between states and more efficient state-by-state regulation. The act also empowered CERC to assign state-level renewable energy targets or Renewable Portfolio Obligations (RPOs), which are managed through a voluntary renewable energy certificate market.
National Electricity Policy, 2005: This policy supports the procurement of grid-based renewable energy through competitive bidding.
National Tariff Policy, 2006: Sets the framework for pricing renewable energy from the generation stage through to the end consumer. The policy was updated by the multi-year RE Tariff Regulations in 2009 and further revised in 2012.
National Action Plan on Climate Change, 2008: This policy set the first RE mandate at 15% of the electricity generation mix by 2020.
Solar Mission 2010: This set the landmark policy to add 22GW of solar electricity by 2022. In 2014, the target was changed to 100GW.
National Clean Energy Fund (NCEF), 2010: This was set up to fund the development and deployment of clean energy technologies. In the FY 2013-14, it was further tasked to support green infrastructure development through soft loans/interest subsidies. The fund is generated through a (Pigouvian) tax on coal, which as of 2016 had been raised from INR 50/ton to INR 200/ton on coal sales.
National Manufacturing Policy, 2011: This policy aimed to increase industrial manufacturing output from about 15% of GDP to at least 25% of GDP by 2022. The government expects that this would create 100 million additional jobs and increase domestic value addition and technological learning in manufacturing [149]. Under the policy, the central government will collaborate with states to set up National Investment and Manufacturing Zones (NIMZ), including solar parks. These parks would subsidize infrastructure services. One of the relevant incentives under this scheme includes reimbursement of technology acquisition costs up to INR 2M (~$30K) for firms in the parks [150].

37
Modified Special Incentive Package Scheme M-SIPS 2012: The scheme provides subsidies of up to 20% of capital costs to start-ups firms in special economic zones, SEZs or NIMZs (25% in non-SEZ) for electronics manufacturing up to a threshold of INR 50B ($833 M) depending upon the type of project. The incentives are available for ten years from the date of approval. The scheme was initially available until 2015 but was extended until 2020[151]. Policy makers expect the scheme to facilitate a minimum of INR 1 B ($15.7 m) investment in cSi cell and module manufacturing [152].
The Electricity Act of 2003 laid an important foundation, which other policies that followed, especially the Solar Mission, have built upon to ensure the rapid growth of solar energy in India. The act ensured the private sector was already well positioned to take on the challenge of rapid solar electrification, occasioned by the Solar Mission. The solar mission’s reverse bidding system has also been effective in exerting downward pressure on prices (see Figure 9).
Figure 9: Average Bid Prices Over Time in Different Programs
This reverse bidding system has now been replicated in several parts of the world,
including Abu Dhabi, where as of September 2016, the price of utility scale solar hit a record low of 2.3 cents/Kwh – much less than the price of utility scale coal of around 3.2 cents/Kwh.
3.2 Solar PV Manufacturing Capacity in India
As of April 1, 2016, India had fourteen cell manufacturers with a total production capacity of 1,212 MW/year and had 81 module manufacturers, with a total installed production capacity of 5,620 MW/year. This disconnect stems from the fact that cell

38
manufacturing is a more technically-rigorous and capital-intensive venture, a significant barrier to many Indian firms who simply import cells to assemble their modules (see Table 6). Cell capacity utilizations vary widely, between 20-50% for most firms interviewed. Eleven of the 81 companies above manufacture both cells and modules. Under the Solar Mission, policy makers have set a goal of manufacturing 4-5 GW of cells and modules domestically by 2022 [153]. While India is far from the target in the cell segment, it has met the goal in the module segment, in terms of capacity. With the exception of a few leading firms that are expanding their capacities to meet increasing demand, most firms operate below full capacity.
Module manufacturing is a lot more diversified than cell manufacturing in India, mainly because it is less costly and technology intensive to set up. India’s leading module manufacturers are Vikram and Waaree, each with 500 MW installed capacity, followed by Goldi Green with 450 MW, Tata with 300 MW, Moser Baer with 230 MW and XL Energy with 210 MW. The leading cell manufacturers include Moser Baer at 250 MW, followed by Indosolar at 200 MW, Websol at 150 MW, Tata Power at 140 MW and Jupitar Solar Pvt. Ltd at 132 MW. There is presently no capacity for manufacturing polysilicon or wafers.
Figure 10: Top Solar Cell Manufacturers in India (MW,%)
Figure 11: Top Solar Module Manufacturers in India (MW, %)
Source: MNRE 2016
Table 6: Market Barriers for Potential PV Manufacturers Across Supply Chain
Component Skill Requirement Capital Requirement Competition
Polysilicon High technical skill and complex production process
High capital costs ($500m-$1bn per plant), long lead times to add capacity, energy intensive
Dominated by 7 companies supplying about 90% global capacity
Ingots and wafers
As above High capital costs but standard production facilities can be bought off the shelf
Dominated by 5 companies sharing over 90 per cent of the market
Moser Baer, 250, 21%
Indosolar, 200, 16%
Websol, 150, 12%
Tata , 140, 12%
Jupiter, 132, 11%
Surana, 120, 10%
XL Energy, 60,
5%
Euro Multivision
, 50, 4%
Premier, 40, 3%
Others, 70, 6%
Moser Baer,
500, 9%Tata,
500, 9%
Websol, 450, 8%
XL Energy, 300, 5%
Surana,
230, 4%
Solar Semiconductor,
210, 4%
Others, 3410, 61%
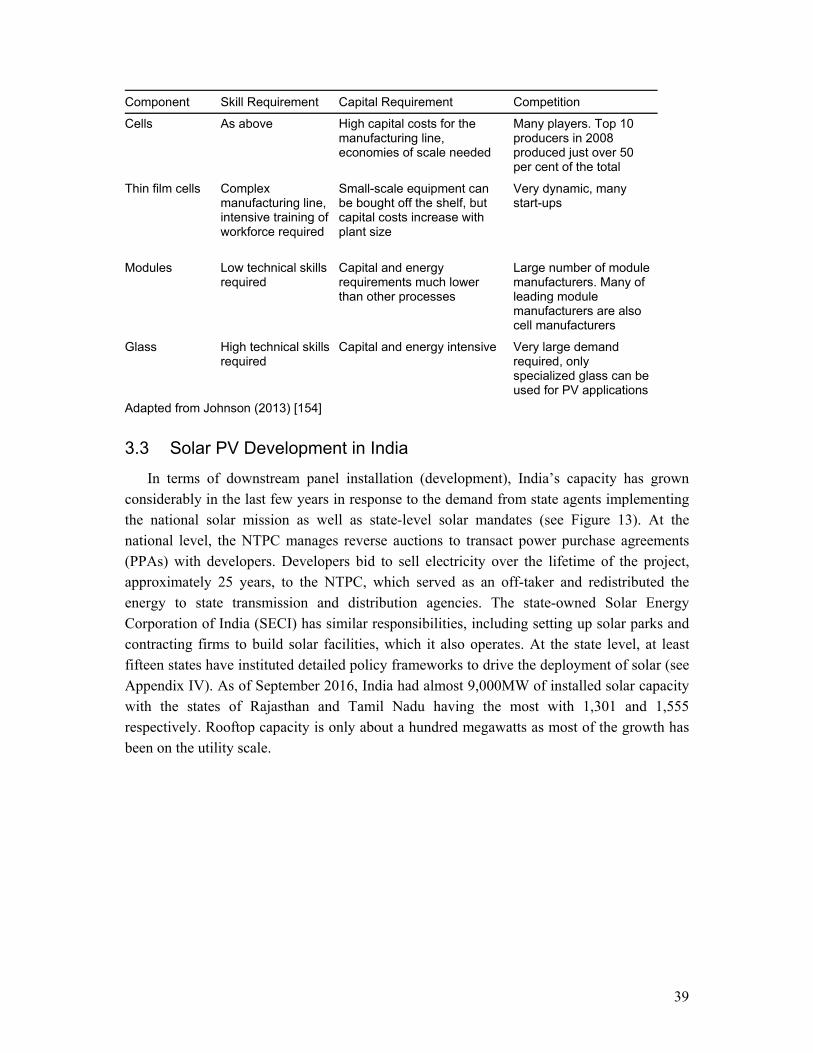
39
Component Skill Requirement Capital Requirement Competition
Cells As above High capital costs for the manufacturing line, economies of scale needed
Many players. Top 10 producers in 2008 produced just over 50 per cent of the total
Thin film cells Complex manufacturing line, intensive training of workforce required
Small-scale equipment can be bought off the shelf, but capital costs increase with plant size
Very dynamic, many start-ups
Modules Low technical skills required
Capital and energy requirements much lower than other processes
Large number of module manufacturers. Many of leading module manufacturers are also cell manufacturers
Glass High technical skills required
Capital and energy intensive Very large demand required, only specialized glass can be used for PV applications
Adapted from Johnson (2013) [154]
3.3 Solar PV Development in India
In terms of downstream panel installation (development), India’s capacity has grown considerably in the last few years in response to the demand from state agents implementing the national solar mission as well as state-level solar mandates (see Figure 13). At the national level, the NTPC manages reverse auctions to transact power purchase agreements (PPAs) with developers. Developers bid to sell electricity over the lifetime of the project, approximately 25 years, to the NTPC, which served as an off-taker and redistributed the energy to state transmission and distribution agencies. The state-owned Solar Energy Corporation of India (SECI) has similar responsibilities, including setting up solar parks and contracting firms to build solar facilities, which it also operates. At the state level, at least fifteen states have instituted detailed policy frameworks to drive the deployment of solar (see Appendix IV). As of September 2016, India had almost 9,000MW of installed solar capacity with the states of Rajasthan and Tamil Nadu having the most with 1,301 and 1,555 respectively. Rooftop capacity is only about a hundred megawatts as most of the growth has been on the utility scale.

40
Figure 12: India’s Solar Capacity by State
Figure 13: Planned Capacity for 2016-2017 Under Various Scheme
3.4 Impact of Domestic Content Policy on India’s PV Industry
The solar mission, as originally defined, was to be implemented in three phases. Phase I
had a target of 1,000MW by 2013, phase II’s target was 4,000MW by 2017 (cumulative) and

41
phase III’s target was 20GW by 2022. Phases I and II were implemented in batches of
reverse bid auctions, with some capacity set aside for the domestic content. In phase I, the
domestic-content mandate required that all c-Si modules be manufactured in India while thin-
film modules could “be sourced from any country, provided the technical qualification
criterion was fully met” [155]. This thin-film exemption biased developers towards importing
thin film technologies, against the global market trend towards c-Si [156].
Therefore, in phase II, the policy was updated, reducing the constraint on c-Si by
mandating that 375 MW of the total 750 MW production as domestic in batch one and 250
MW out of a total of 1,000 MW in the second batch be domestic. By domestic, what the
policy specifically requires in the case of crystalline silicon technology is that all process
steps and quality control measures involved in the manufacture of the cells and modules from
wafers through final assembly be sourced locally; the requisite P-type (or N-type) wafers and
other raw materials, however, are still allowed to be imported. For thin-film technologies, the
module assembly had to be completed in India, even though the starting substrate (without
any semiconductor junction) and other requisite raw materials could be imported as well
[157].
In an analysis of the phase I domestic content requirement in JNNSM, Sahoo and
Shrimali [88] predicted that even though the policy may not necessarily constrain solar
deployment goals, it would be unlikely to ensure the global competitiveness of the domestic
solar sector. The authors cite institutional gaps and India’s lack of an innovation system as
the key hindrances to long-term competitiveness. They also suggest that there might be a loss
in dynamic efficiency, which will be borne by project developers and electricity consumers
[88, 123, 154].
3.5 India’s Competitiveness Across the PV Manufacturing Chain
This section discusses the solar PV supply chain and reviews the export data over time to
assess the competitiveness of India’s exports. In Chapter 2, theoretical models were
presented that show that an economy may achieve a superior equilibrium from using
industrial policy to engender productivity in a sector where it has a latent comparative
advantage. The chapter also discussed the use of Balassa’s (1965) [117] ‘revealed
comparative advantage’ (RCA) in empirical trade literature to measure competitiveness. To
recap, the strengths and weaknesses of the Balassa measure are that it allows for an objective
42
comparison of the strength of a country in an industry to the international average, but it does
not account for domestic consumption.
This chapter utilizes Balassa’s measure of revealed comparative advantage ( ),
(where Ekit is the export from country i, of goods k at year t and I is the country’s import) but
balances its weaknesses by also measuring specialization and trade balance. Specialization
measures the ratio of exports to imports for a commodity relative to the country’s overall
export to import ratio (s = ( *100%)). Trade balance measures the difference between
exports and imports (I) over the sum of exports and imports ( .Specialization and
trade balance address the key drawbacks discussed earlier, as they give an indication of
where most of the products consumed domestically come from, by contrasting imports to
exports. These measures however, do not show that a country has a latent comparative
advantage in an industry.
A calculated RCA value of greater than one suggests that a country has a revealed
comparative advantage in the product. A specialization value of more than one also suggests
that the country is specialized in the sector as its export-to-import ratio in the product exceeds
its standard export-to-import ratio. A positive trade balance also shows competitiveness as it
shows the country exports more than it imports of the commodity.
3.5.1 Data Sources
World Trade Organization/ UN COMTRADE data, used in the following analysis, are
computed at varying levels of detail with a greater number of digits indicating a more
granular level of data. The analysis is based on data for the Harmonized System (HS) four
and six digit levels [158]. At the polysilicon, ingot and wafer levels, where India currently
has no operational capacity, proxies are used to assess the possibility of a pivot into these
sectors based on existing production. For instance, in the case of polysilicon, data for any
silicon production above 2N (i.e. >99.99% purity silicon) is used. Table 7 below shows the
products for which trade data were downloaded and analyzed for the years 2009-2014.

43
Table 7: Products Examined in Analysis
Key Component HS Code Product Description
Polysilicon 280461 Silicon, containing by weight not <99.99% of silicon
Ingot casting machine
845430 Casting machines of a kind used in metallurgy/in metal foundries
Wafer machines 848610 Machines & apparatus for the manufacture of boules/wafers.
Photovoltaic cells 381800 Chemical elements doped for use in electronics, in the form of discs, wafers or similar forms; chemical compounds doped for use in electronics. // Chemical elements doped for use in electronics, in the form of discs, wafers or similar forms; chemical compounds doped for use in electronics
Modules 854140 Photosensitive semiconductor devices, incl. photovoltaic cells whether/not assembled in modules/made up into panels; light emitting diode
Electric Motors 8501 Electric motors and generators (excluding generating sets)
Glass 700719 Glass and glassware // Safety glass, consisting of toughened (tempered) or laminated glass. // - Toughened (tempered) safety glass : // -- Other
3.5.2 Methodology
An R script (in appendix) was used to download and reshape the data from the UN
Comtrade application-programming interface (API).Table 8 shows how the data are analyzed
to arrive at the results.
Table 8: Trade Measures Calculated in Analysis
Measure Description Calculation
Revealed Comparative Advantage (RCA)
Measure of a country’s exports relative to a global average
Significance This measures the proportion of exports in the product to the country’s gross exports
∗ 100 %
Specialization This measures the ratio of export to import in a commodity relative to overall export to import ratio of the country
Trade balance Measures the difference between exports and imports (I) over the sum of exports and imports
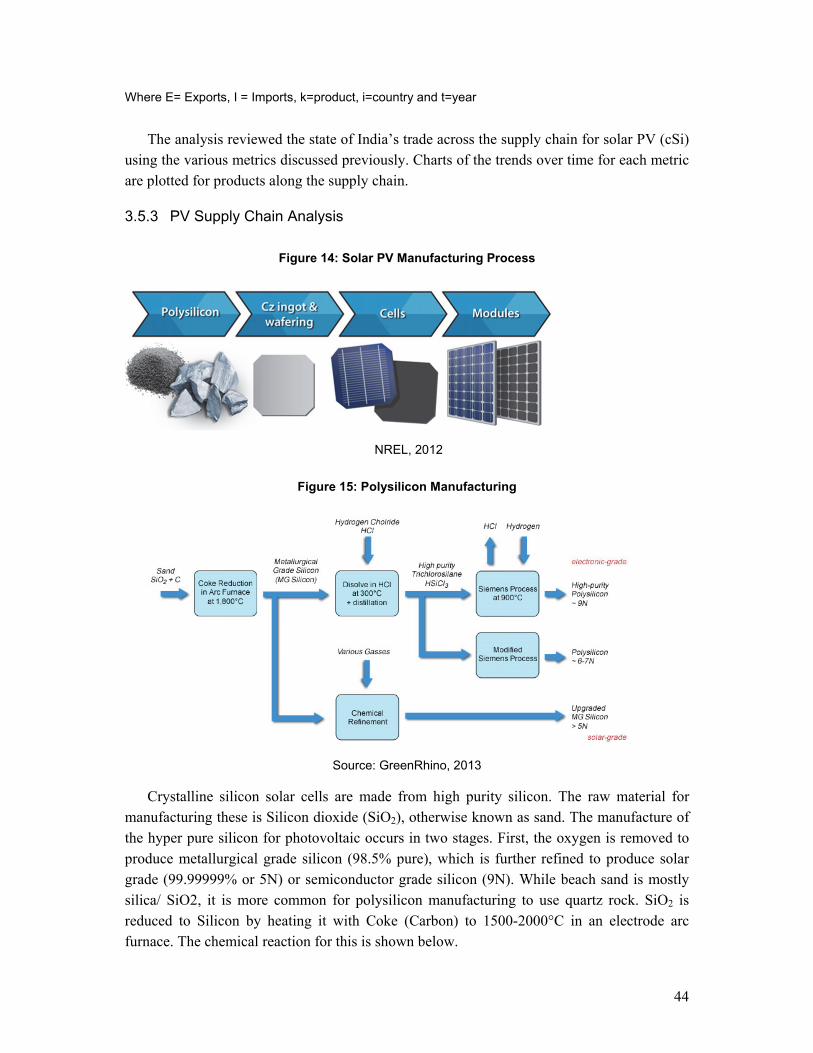
44
Where E= Exports, I = Imports, k=product, i=country and t=year
The analysis reviewed the state of India’s trade across the supply chain for solar PV (cSi) using the various metrics discussed previously. Charts of the trends over time for each metric are plotted for products along the supply chain.
3.5.3 PV Supply Chain Analysis
Figure 14: Solar PV Manufacturing Process
NREL, 2012
Figure 15: Polysilicon Manufacturing
Source: GreenRhino, 2013
Crystalline silicon solar cells are made from high purity silicon. The raw material for manufacturing these is Silicon dioxide (SiO2), otherwise known as sand. The manufacture of the hyper pure silicon for photovoltaic occurs in two stages. First, the oxygen is removed to produce metallurgical grade silicon (98.5% pure), which is further refined to produce solar grade (99.99999% or 5N) or semiconductor grade silicon (9N). While beach sand is mostly silica/ SiO2, it is more common for polysilicon manufacturing to use quartz rock. SiO2 is reduced to Silicon by heating it with Coke (Carbon) to 1500-2000°C in an electrode arc furnace. The chemical reaction for this is shown below.

45
SiO2 + C → Si + CO2 The resulting silicon is metallurgical grade silicon (MG-Si). It is 98.5% pure and is used
extensively in the metallurgical industry. For the purpose of this analysis, it is assumed that MG-Si is imported and is the raw material for the manufacture of high purity polysilicon used to make the panels.
Distillation process: The MG-Si is dissolved in hydrochloric acid (HCl) at 300°C to form SiHCl3. This process is called hydrochlorination and is used to remove impurities – mainly boron and phosphorous -- left in the Silicon.
Si (mg) + 3HCl → SiHCl3 + H2 The product of this process is silane gas also called trichlorosilane (TCS), SiHCl3.
Siemens Process: In the Siemens process, the SiHCl3 gas reacts with hydrogen in a Siemens reactor at about 1100°C for about 60 hours per batch to produce a very pure form of silicon and Hydrochloric acid which is recycled for the production of trichlorosilane.
SiHCl3 + H2 →Si + 3 HCl This is the most common process for purifying silicon for both the solar and electronic
industries. Its two main disadvantages are that the Siemens reactor is expensive and it requires a significant amount of energy and is therefore best done where electricity/heating energy is cheap. Alternative methods for producing less pure but cheaper polysilicon include the fluidized bed reactor (FBR), upgraded metallurgical grade silicon and vapor to liquid deposition. .
The Fluidized Bed Reactor Method is the most popular alternative to the Siemens process. Its main technical advantage is that it requires much less energy to produce, however it also has the disadvantage of being difficult, especially with regard to managing the heating process involved. As a result of this production difficulty, only a few companies have the technical ability to implement it successfully.
India currently has no manufacturing base for high purity silicon, but the trade data show that India does export a small amount of very low purity silicon (less than 99.99% or 2N purity). However, the existence of some production (albeit of low purity silicon) could demonstrate potential for building a globally competitive polysilicon manufacturing base. Lanco Infratech is said to be planning a 1,500 metric ton (MT) polysilicon plant in India. Debate continues in policy circles regarding the question of whether India should subsidize the building of a large plant [159].
Figure 16 below shows a stacked chart of the calculations for RCA (green line), significance (area), specialization (circles) and trade balance (bar charts) for polysilicon plotted over time. Reference lines denote whether India has an RCA in the product (RCA>1), a relative specialization in the product (specialization>1) or a positive trade balance in the product (trade balance>0).

46
Figure 16: Polysilicon - Silicon Purity>99.9% (280461)
Source: Data from UN Comtrade
The chart shows that India is not competitive in the manufacture of polysilicon for purity levels greater than 99.9% (1N), meaning that it is even less so at the purity level required which is 6-9N. Trade balance is more negative over time as Indian firms import more and specialization remained much lower than 0.01.
Figure 17: Ingot and Wafer Casting
Source: GreenRhino[160]
Producing crystalline silicon wafers (wafers) from polysilicon is the next important step in the cSi PV manufacturing process. The most popular process for producing wafers is the Czochralski process. This process may operate as a stand-alone or alongside a polysilicon plant. In this process, single, continuous crystal structure silicon (monocrystalline) is grown from a small seed crystal that is slowly pulled (drawn) out of a polysilicon melt into a cylindrical shaped ingot. The ingot is cut into wafers using a diamond saw. Silicon waste from the sawing process can be re-cycled into polysilicon. Polycrystalline wafers may also be

47
produced directly from cube-shaped ingots by casting molten polysilicon, which are then cut into wafers similar to monocrystalline wafers. Another method for producing wafers from polysilicon is silicon ribbon whereby thin ribbons or sheets of polycrystalline silicon are drawn from a polysilicon melt. The subsequent cutting into wafers does not produce waste, as the drawn sheets are already wafer-thin.
India does not presently have any crystalline silicon wafer production. So, as a proxy, data for ingot casting and wafer testing machines, which India does export, were analyzed.
Figure 18: Ingot Casting Machines (845430)
Source: Data from UN Comtrade
An ingot-casting machine is a chain conveyor-based mechanical arrangement, which is used in the handling of molten metal for casting of polysilicon into ingots with minimum human contact. The molten metal from the pot is conveyed to a casting machine, where the conveyor continuously moves in such a manner that the speed of the conveyor matches the flow of molten metal. The data shows that that ingot casting machine exports had a good year in 2013 with an RCA of 0.99, almost 1 denoting a significant comparative advantage. Ongoing data reported on Zauba.com, a website that tracks India’s exports (though not empirically analyzed) suggests that there is significant activity in the business, especially in lead casting. Zauba shows the top importers of India casting machines as Kenya, Bangladesh, and Tanzania [161]. This may, however, not translate well to polysilicon casting as the purity level and sophistication required is much harder to obtain in India.

48
Figure 19: Wafer Machines (8486)
Source: Data from UN Comtrade
Wafer machines are not presently competitive in India. However, as shown in Table 6, the facilities required for manufacturing may be acquired off the shelf. It is doubtful that the skills and production complexity required is readily available in India. It is also unclear that the margins available in this sector justify the high cost of setting up a facility. BHEL, a leading utility in India, is currently considering setting up a plant to manufacture ingots and wafers. Cells
The standard process employed by Indian manufacturers for making cells begins with texturing the crystalline silicon wafers in order to reduce reflectivity and hence increase solar absorption – better sunlight absorption means higher cell efficiency. The textured wafers are placed in a diffusion surface, where a layer of phosphorous is passed through them in gaseous form. This reaction is used to form the p-n junction and the process is known as doping. Phosphorus residues are then removed from the resulting doped silicon wafers through a process called etching.
After this, the product is sent to a plasma-enhanced chemical vapor deposition (PECVD) furnace where silicon nitride anti-reflective coating is applied to further increase sunlight absorption. Aluminum paste is applied to the rear surface of the cells produced to further increase efficiency and silver paste is screen printed onto the front and rear surfaces. These form the electrodes, which enable the passage of electricity from the cells. Cells are now tested and packaged for onward transportation to module manufacturing plants.

49
Figure 20: Cells
Source: Data from UN Comtrade
Beyond a small spike in exports in 2008, cell manufacturing in India does not seem to have picked up steam internationally. Interview evidence suggests that a number of firms closed or suspended operations after the Chinese supply glut of 2009-2010 but recently began to pick up again, in response to the solar mission, with many companies reviving their existing capacities and others expanding as well. The RCA analysis shown above, however, does not reveal that they are anywhere near competitive on the global scale. More stakeholder perceptions on why this is the case are discussed in Chapter 4.
Modules Module manufacturing usually begins with the sorting and interconnection of solar cells.
This can either be done either by manually or automatically soldering the cells in a series connection. While the manual soldering process creates more jobs, it is relatively prone to human error and hence not advisable. Interconnected cells are then placed in a sandwich structure comprising of tempered iron glass, a layer of Ethylene Vinyl Acetate (EVA), cells, another layer of EVA and a back sheet (usually made of plastic film).
The product is then laminated to protect from moisture and mechanical shock. This process is known as encapsulation. The encapsulated solar cells are then “cured”, which is a process of preheating, heating and heat cooling. During this curing process, the EVAs are interlinked through a chemical reaction that essentially seals the module elements together. Finally, the modules are fitted in aluminum frames and a weatherproof junction box is then attached for the module’s electrical connection. Finally, modules are tested, packaged and shipped.
Figure 21 below shows an analysis of modules shipped out of India from 2006 to 2015. The chart shows that the revealed comparative advantage in module exports for India exceeded 1 in 2008 but has otherwise been below one. However, specialization and trade balance were positive until 2010, when possibly due to the Chinese supply glut, India and the

50
rest of the world started to favor cheaper modules from China over Indian manufacturers as shown in Figure 22.
Figure 21: Modules
Source: Data from UN Comtrade
All metrics seem to have dropped progressively since that time, despite the solar mission and the domestic content requirement. This is consistent with the overall sentiment expressed in interviews-- even though production has increased recently, exports have decreased and domestic capacity is mostly consumed locally. Interviews also confirmed that imports have also increased significantly to meet the rising demand, from state and central governments as demonstrated in Figure 22.
Figure 22: India’s Module Imports from China and the United States (USD)

51
Solar Glass
Glass is an important component in the manufacture of solar modules, responsible for more than 33% of all module faults [162]. Interviewees highlighted glass as a potentially competitive input to examine.
Figure 23: Glass (700719)
Source: Data from UN Comtrade
Contrary to interviews, while the glass industry does exist and actively exports, it is not yet as competitive internationally as some have suggested. The reason for this seeming “discrepancy” may be that interviewees generally consider an industry to be successful exporters if they do so at all, whereas the RCA measures applied evaluated success if the industry exports more than other industries – a completely different level of “success”.
These findings imply that India is not presently well positioned based on its current state of industrial productivity and exports in upstream manufacturing. However, its performance in general electrical pieces of apparatus and machinery used in deployment and installation may suggest a value in focusing on deploying manufactured panels, rather than moving up the value chain where increasingly automated manufacturing and technical expertise are required for competitiveness. A study by India’s Natural Resources Defense Council estimated that, excluding manufacturing, deployment and maintenance of PV projects between 2011 and 2014 generated an estimated 23,884 jobs [163]; the study also found that 65-80% of solar jobs are at this end of the value chain (see Figure 24, supporting the notion that a downstream focus may be consistent with India’s native capabilities). These services may be exported to various countries around the world that are considering emulating India’s rapid solar deployment growth.

52
Figure 24: Value Distribution in CSi PV Chain
Source: Johnson (2013) [154]
3.6 Conclusion
The data suggests that India is not competitive in the upstream segments of the solar PV value chain, from polysilicon to modules. It shows that modules manufacturing is the most competitive section of the value chain. This could clearly be because the entry barriers to this market are much lower both in terms of capital costs and skill than any of the other steps in the chain from polysilicon to cells as shown in Table 6. The risk here is that this also means that the competition at this phase is tough. However, this is where India’s advantage of cheaper labor could also come into play. Module manufacturing could perhaps be more competitive if manufacturers at this phase are not prevented from sourcing the best value inputs that they can find in the market without being restricted by industrial policies (domestic content considerations or import tariffs).
These findings make support for upstream manufacturing difficult to justify, in part because domestic content requirement at the upstream stage could crowd out consumption at the downstream phase where India may have some competitiveness and, as Figure 24 shows, may be where the most value and jobs can be found. Equally important is the fact that upstream manufacturing of solar does not confer carbon or health benefits as downstream deployment does.
The findings in this chapter are limited in a few key ways. First, the conclusions get at revealed but not latent comparative advantage. Also, trade data are hardly representative of the actual nature of production, especially in a highly-populous country such as India with a large local consumer base. However, the trade balance and specialization metrics help address some of these limitations as they also examine imports. Furthermore, India’s solar industry is fairly new and the trade data in this study does not yet reflect ongoing capacity expansions, discussed in stakeholder interviews, in the next chapter.
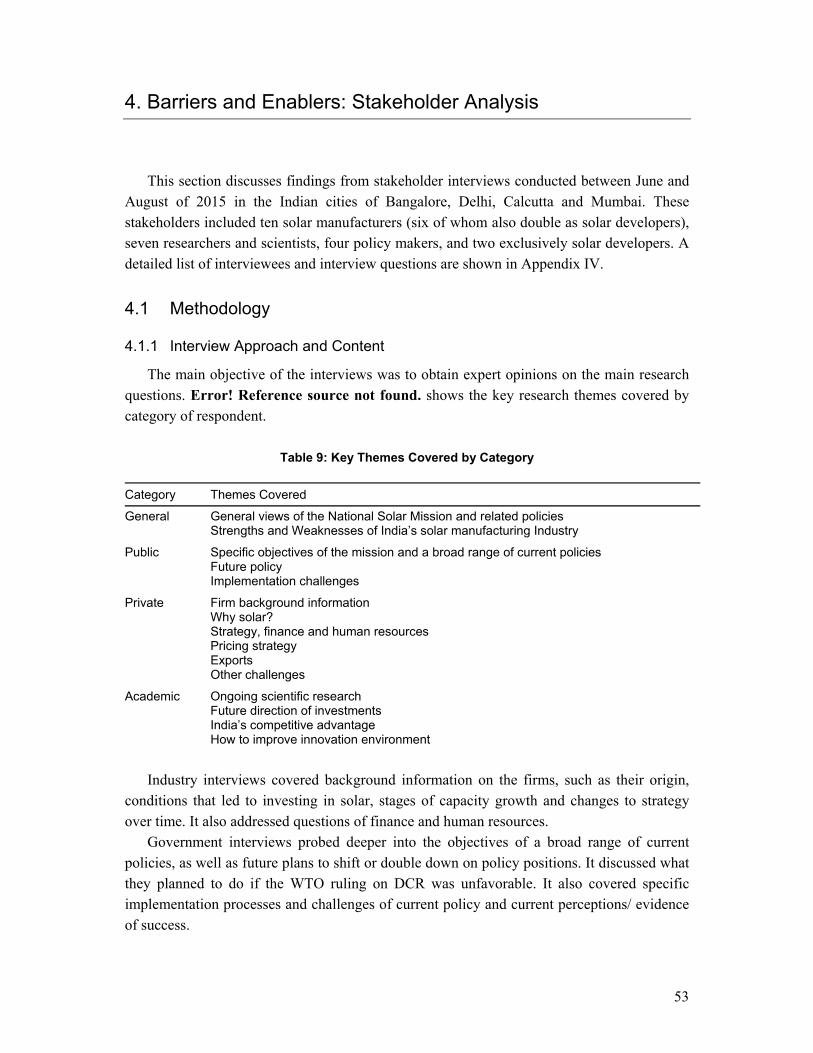
53
4. Barriers and Enablers: Stakeholder Analysis
This section discusses findings from stakeholder interviews conducted between June and August of 2015 in the Indian cities of Bangalore, Delhi, Calcutta and Mumbai. These stakeholders included ten solar manufacturers (six of whom also double as solar developers), seven researchers and scientists, four policy makers, and two exclusively solar developers. A detailed list of interviewees and interview questions are shown in Appendix IV.
4.1 Methodology
4.1.1 Interview Approach and Content
The main objective of the interviews was to obtain expert opinions on the main research questions. Error! Reference source not found. shows the key research themes covered by category of respondent.
Table 9: Key Themes Covered by Category
Category Themes Covered
General General views of the National Solar Mission and related policies Strengths and Weaknesses of India’s solar manufacturing Industry
Public Specific objectives of the mission and a broad range of current policies Future policy Implementation challenges
Private Firm background information Why solar? Strategy, finance and human resources Pricing strategy Exports Other challenges
Academic Ongoing scientific research Future direction of investments India’s competitive advantage How to improve innovation environment
Industry interviews covered background information on the firms, such as their origin,
conditions that led to investing in solar, stages of capacity growth and changes to strategy over time. It also addressed questions of finance and human resources.
Government interviews probed deeper into the objectives of a broad range of current policies, as well as future plans to shift or double down on policy positions. It discussed what they planned to do if the WTO ruling on DCR was unfavorable. It also covered specific implementation processes and challenges of current policy and current perceptions/ evidence of success.

54
During the scientific community interviews, in addition to their opinions on the main research questions, the researchers were asked for their views on the nature of ongoing research and any indication of what these could mean for the future direction of investments and India’s competitive advantage.
4.1.2 Analysis Methodology
This section uses deductive thematic analysis to code and analyze interview responses. Thematic analysis is a subset of content analysis methods. Content analysis approaches transform qualitative data into quantitative by simply counting occurrences of specific keywords or codes [164], which may be used in statistical analysis [165]. However, in thematic analysis the “unit of analysis tends to be more than a word or phrase”, even if some frequency counting is used to identify prevalence of ideas or relevant themes [166]. Content analysis mostly ignores context and sentiment expressed in the content count and therefore may offer misleading insight, whereas thematic analysis, not tied to arithmetic counts, allows the flexibility of uncovering context in coding and interpretation of data [167] [168]. Thematic analysis also has the advantages of being easy to learn and use to summarize key features of a large body of data and useful for producing qualitative analyses suited to informing policy development [169].
Thematic analysis differs from other analytic methods especially used in the field of psychology, such as narrative analysis, interpretative phenomenological analysis (IPA) or grounded theory that seek to describe patterns across qualitative data, IPA and grounded theory. Both IPA and grounded theory seek patterns in the data but are theoretically bounded. IPA gives experience primacy and is about understanding people’s everyday experience of reality, in great detail, in order to gain an understanding of the phenomenon in question [170]. Grounded theory requires analysis to be directed towards theory development [171] and narrative analysis, which focuses on individual stories as the unit of analysis [172]. Thematic analysis, on the other hand, in a broad sense transcends these limitations. In doing so, however, while results of thematic analysis are somewhat replicable, reliability is controversial as the outcomes are largely driven by how the questions are framed.
One of the first steps (see Table 10) in the analysis is theme development. “A theme captures something important about the data in relation to the research question” [169]. There are two broad methods of theme development in the literature - inductive or deductive. The inductive method is a ‘bottom up’ form of thematic analysis, similar to grounded theory, which focuses on coding the data without trying to fit it into a preexisting coding frame, or the researcher’s analytic preconception. The deductive or ‘top down’ way on the other hand starts with clear questions and themes to evaluate in the data. This study uses the deductive method. The steps used in the analysis are discussed below.
Table 10: Steps to Thematic Analysis
S/N Step Description
1 Familiarizing yourself Transcribing interviews, reading and re-reading the transcripts and

55
with your data noting down initial ideas
2 Generating initial codes and themes
Codes are generated using research questions
3 Defining and naming themes
Ongoing analysis to refine the specifics of each theme, and the overall story the analysis tells, generating clear definitions and names for each theme
4 Analyzing by pre-defined prevalence metric
Interviews are coded by theme in software (excel in this case) to extract prevalence (frequency) of themes across interviews. Reference(s) to a theme in an interview counts as one regardless of frequency of mention in the interview
5 Producing the report Visualization of themes by prevalence, selection of vivid, compelling extract examples, final analysis of selected extracts, relating back of the analysis to the research question and literature
Adapted from Braun and Clarke (2006) [169] The write-up that follows is divided into two sections: first, a prevalence study based on
count of theme-based perceptions of research questions and second, a summary narrative of responses by stakeholder category. For the prevalence study, as shown in Error! Reference source not found., interviews were coded according to the research questions to identify common answers. For the summary narrative, answers common to each category of stakeholder are analyzed and discussed. Stakeholder categories are defined as follows: academic, public and private: developers, cell and module manufacturers (since there were no polysilcon or appreciable ingot manufacturing in India at the time of interviewing).
4.2 Prevalence Analysis
The prevalence analysis of interviews reported in this section highlights the opinions of stakeholders on key themes explored in the interview. The themes to explore during the interviews were mostly pre-determined, and questions were posed in an open-ended fashion to allow interviewees to state their opinion while also providing context for their views. Interviews were transcribed, coded and analyzed to produce the summary views discussed herewith.
4.2.1 General Views on the Solar Mission and the Domestic Content Requirement
Stakeholders generally expressed positive views of the solar mission’s broad objectives and especially its reverse-bid concession and viability gap funding (VGF) programs. Of the 3,877MW installed grid based solar at the time of interviews, the reverse bid auction program was directly responsible almost 50% [173]. Several states also have their version of reverse bids to sign power purchase agreements with developers who bid the lowest tariff or request the lowest amount of viability gap funding for selling to distribution companies at the market price over the lifetime of the plant.
The interviewees, however, expressed mixed views of the domestic content requirement. One reason is that they had different views on the purpose of the domestic content section. Policy makers and manufacturers agreed that the most important justification for the requirement is the need for security of supplies, as shown in Figure 25. For instance one
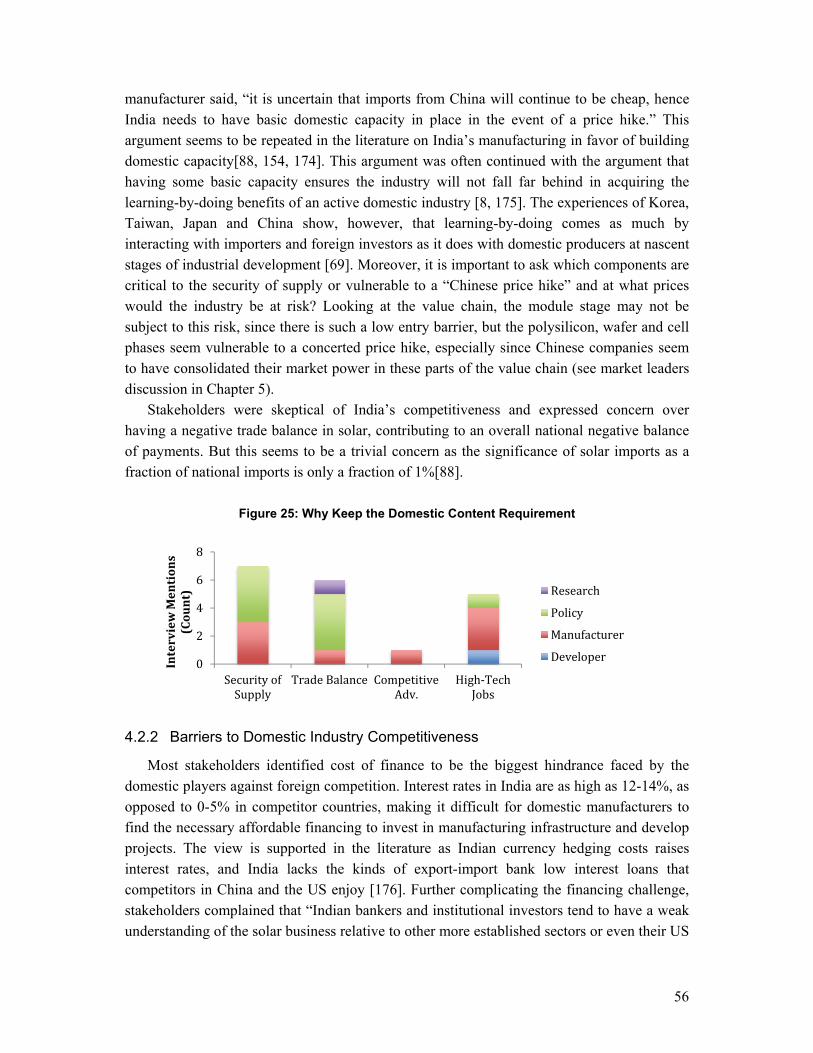
56
manufacturer said, “it is uncertain that imports from China will continue to be cheap, hence India needs to have basic domestic capacity in place in the event of a price hike.” This argument seems to be repeated in the literature on India’s manufacturing in favor of building domestic capacity[88, 154, 174]. This argument was often continued with the argument that having some basic capacity ensures the industry will not fall far behind in acquiring the learning-by-doing benefits of an active domestic industry [8, 175]. The experiences of Korea, Taiwan, Japan and China show, however, that learning-by-doing comes as much by interacting with importers and foreign investors as it does with domestic producers at nascent stages of industrial development [69]. Moreover, it is important to ask which components are critical to the security of supply or vulnerable to a “Chinese price hike” and at what prices would the industry be at risk? Looking at the value chain, the module stage may not be subject to this risk, since there is such a low entry barrier, but the polysilicon, wafer and cell phases seem vulnerable to a concerted price hike, especially since Chinese companies seem to have consolidated their market power in these parts of the value chain (see market leaders discussion in Chapter 5).
Stakeholders were skeptical of India’s competitiveness and expressed concern over having a negative trade balance in solar, contributing to an overall national negative balance of payments. But this seems to be a trivial concern as the significance of solar imports as a fraction of national imports is only a fraction of 1%[88].
Figure 25: Why Keep the Domestic Content Requirement
4.2.2 Barriers to Domestic Industry Competitiveness
Most stakeholders identified cost of finance to be the biggest hindrance faced by the domestic players against foreign competition. Interest rates in India are as high as 12-14%, as opposed to 0-5% in competitor countries, making it difficult for domestic manufacturers to find the necessary affordable financing to invest in manufacturing infrastructure and develop projects. The view is supported in the literature as Indian currency hedging costs raises interest rates, and India lacks the kinds of export-import bank low interest loans that competitors in China and the US enjoy [176]. Further complicating the financing challenge, stakeholders complained that “Indian bankers and institutional investors tend to have a weak understanding of the solar business relative to other more established sectors or even their US
0
2
4
6
8
SecurityofSupply
TradeBalance CompetitiveAdv.
High‐TechJobs
InterviewMentions
(Count) Research
Policy
Manufacturer
Developer

57
counterparts and are hence unwilling to lend at affordable rates”. Moreover, many small-scale manufacturers lack the credit history required for high-stakes lending [177].
Figure 26: Key Barriers for the Domestic Industry
Additionally, infrastructure costs tend to be high in India. For instance, due to poor road
conditions, check-post delays and old vehicle fleets, freight trucks in India can only cover a maximum of 250-400 km/day compared to 700-800 km in developed countries, increasing project time and transportation costs [42]. The World Bank estimates that the time costs alone amount to about Rs.9-23 billion ($0.15- $0.38 billion) per year [43]. Cost of electricity in India is approximately twice as much for industrial (Rs 9/kWh or $0.15) as for residential consumers (Rs 4/kWh or $0.067) and for developers in regard to the cost of connection to the electricity grid for transmission and distribution and is typically high, especially in remote areas.
Finally, a number of stakeholders identified land availability as a major challenge for developing utility –scale solar farms. Developers and policy makers alike expressed frustration with stalled land reforms which ought to ease land acquisition for industrial users [178].
4.2.3 Enablers for Domestic Industry Competitiveness
Most stakeholders noted that beyond the domestic content requirement, government’s power purchase agreements (PPAs) signed under the solar mission with state agents such as the NTPC (mostly through reverse bidding and VGF) have been significant drivers for domestic manufacturing growth. Manufacturers of both cells and modules discussed plans to increase their capacities and utilization levels to meet the demand. If these plans come online and start to produce, they may change India’s revealed comparative advantage. Beyond the solar mission, stakeholders attributed growth in the industry to strong political will – which is demonstrated in the government’s willingness to adapt policy in relation to the industry as required by key stakeholders. India’s cheap labor also makes it a suitable alternative to China, where labor rates are rising. A recent Green Tech Media report ranked India sixth in attractiveness of PV manufacturing behind only China, Singapore, Taiwan, Malaysia and the
02468101214
Research
Policy
Manufacturer
Developer

58
United States [43]. Lux research also rated India as both a financially attractive and stable destination for a solar deployment [179]. These endorsements and other market forces could be responsible for firms such as Trina Solar investing $500M in 2 GW cell and module manufacturing plants in India [180], without direct industrial policy incentives.
Many stakeholders also recommended better regulation of renewable purchase obligations and renewable energy certificates, which would allow states and the private sector to drive deployment rather than central government alone.
Figure 27: Key Enablers for the Domestic Manufacturing Industry
4.2.4 Recommended Industrial Policy Focus
Figure 28: Stakeholder Recommended Focus Areas
Stakeholders had a range of recommendations, most of which were linked to their
specific interests. While manufacturers would want more actions/interventions upstream, developers wanted India to focus mostly on downstream products such as storage systems, inverters and circuit design. Research scientists interviewed largely supported the view that India could leverage its software and engineering talent to focus on design and other technically-demanding tasks downstream. The RCA analysis shows India is not presently
01234567
Research
Policy
Manufacturer
Developer
01234567
InterviewMentions
(Count)
Research
Policy
Manufacturer
Developer

59
competitive in upstream manufacturing. It may have advantages best suited to downstream production. Software and engineering design tasks downstream are also somewhat supported by the analysis in Chapter 3.
4.3 Stakeholder Views
4.3.1 Module Manufacturers
Domestic manufacturers advocate domestic content support in some form. However, while some manufacturers, such as the Indian Solar Manufacturers Association, advocate duties on imports and domestic content quotas, others feel that more targeted incentives such as subsidies and cheap loans are more appropriate.
As an example of the seeming failure of the current domestic content quota, one manufacturer explained that most of the value from the domestic manufacturing content is actually obtained by the developers rather than the manufacturers. “When the governments give out a contract, under the domestic category, developers win these contracts, and make manufacturers bid for supply contracts, a process which is so competitive, it ends up squeezing out most of the margin intended for local manufacturers, especially those who source some materials domestically and actually manufacture as opposed to assemble finished goods.” This argument was used to justify the manufacturer’s call to replace domestic content requirements and duties with more targeted incentives. The manufacturer emphasized the need to support domestic manufacturing for its potential for job creation. “Manufacturing jobs are more sustainable than development/ installation/ plant maintenance based jobs. Manufacturing staff is also paid higher.” He supported this by claiming his firm “currently employ 400-500 full time employees to manage their 200MW cell and module manufacturing plants which operate at about 60% and 100% capacity utilizations respectively. These [workers] earn almost twice their part-time development staff working at stable jobs as opposed to a project based employment.”
On current duties and domestic content quotas, an advocate lamented what he called “an inverted duty structure, which taxes importation of cell manufacturing inputs but not the manufactured cells.” He advocated the removal of all duties on inputs and reinstatement of duties on completely built modules and cells. He also noted the need for export incentives. The stakeholder also supported capital subsidies and other incentives to attract large-scale manufacturing investment, stating that “in general, for a domestic industry to flourish, a big private sector player would have to stake a sizeable investment. Companies like Lanco and Reliance tried to manufacture upstream by investing in polysilicon plants but stopped because the economics were not favorable.”
The literature earlier discussed in Chapter 2 supports the call for removing import duties on inputs [90-93]. The general consensus also sides with the view that domestic content requirements and duties on finished goods are also damaging [94], especially in the Indian context as discussed earlier in Chapter 3 [88, 123, 154].
60
The Challenge of Demand in the Face of Chinese Competition
“The concept of JNNSM gives an assurance of demand to manufacturers. However, there is a need for a consistent flow of demand to make manufacturing at full capacity possible. NSM alone cannot do it. Developing export markets would be critical.” – Manufacturer
Most manufacturers complain of not being able to operate their plants at full capacity all year round, as there is no consistency of demand. One manufacturer said, “Right now, orders only come in six-month cycles. This is likely to change with increased NSM targets, but what happens to the plant capacity after the NSM demand? This is where exports are crucial”. Another said, “Implementation (of the solar mission) is slow and not happening as fast as industry wants. Our company is at best able to operate our 200MW cell and module manufacturing plants about 50% of the time because we do not have enough orders to run full time. We export a lot to Europe and Japan, and we consistently meet quality requirements of these countries. But national solar policies deployment in these countries are also slowing down which has affected demand.”
Other manufacturers added that the country’s exports have struggled a lot against Chinese manufacturers. For example, EMMVEE, the third largest module manufacturer, has had to close its German plant, which was opened to leverage the feed-in tariffs there, in the face of Chinese competition. Executives at the firm describe how their market was severely undercut by cheap modules from China both in Germany and in India. Most manufacturers, however, do not think that Chinese firms are intrinsically better or more efficient. A number attribute Chinese cheap products to subsidies and better access to finance in China and others to poor quality standards.
The cost analysis presented in Chapter 5 shows that Chinese modules are no longer significantly cheaper to produce (about 0.53 to India’s 0.55 cents) [126]. However, at current spot prices of 0.51cents [181], more established Chinese firms are able to out-compete most Indian firms because of their economies of scale and capital cost recovery. Low-interest finance provided by the Chinese Export-Import Bank also makes them more competitive in this regard [99]. A general poor quality argument against Chinese modules is not adequately supported, albeit plausible for the lower end of the market.
What Components Are Most Domestically Competitive
A manufacturer estimated “95% and 80% of raw materials for cell and module manufacturing respectively are generally imported”. However, most acknowledged growth in domestic component manufacturing. A manufacturer for example said; “Many of us now acquire inputs such as glass, back sheet, encapsulants, EVA, aluminum and junction box” from Indian component manufacturers. Cells are mostly imported, but the domestic capacity is growing.” Another wondered why smart inverter companies, storage and solar software services had not picked up steam in India. “Given our software success, why are US companies not investing in these areas in India”, he asked.

61
4.3.2 Cell Manufacturers
Most of the companies interviewed were focused on module manufacturing, with smaller or no cell capacity. However, two companies – Jupiter and Euromultivision - focus exclusively on cell manufacturing, which provided unique insights into that aspect of the value chain. “India’s effective cell capacity has grown from near zero only five years ago to about 1,200 MW now, due to the anticipation of DCR demand” said one cell manufacturer.
Motivation for Manufacturing Cells in India Despite “Adverse” Market Conditions
Two factors tend to have motivated most cell manufacturers in the sector: the expectation of government (domestic content) demand and the need to find new uses for equipment previously used in the compact disc business. One manufacturer said their firm repurposed their compact disc manufacturing plant to focus on solar cells because they felt optimistic the industry would grow quickly and wanted to get in “on the ground floor”. “We were in a sunset industry and wanted to be in a sunrise technology. Our optimism hasn’t paid off yet, but we remain positive.” Despite some hard times, motivated by the promise of NSM demand, the company has, since 2013, raised its manufacturing capacity from an initial 37MW (72 million cells per year) to 50MW and then to 130MW as of January 2015. The company has also enhanced average cell efficiency from 16% to 18%. The company is currently expanding with an additional 100MW of capacity. “We are not scaling because it improves the unit cost of manufacturing but because our size would help us make better deals with suppliers and the government under the solar mission.” The company is presently planning to vertically integrate downstream to module manufacturing. The other category is mostly firms with module manufacturing capacity that want to vertically integrate upstream, due to the expectation of domestic content demand. One cell manufacturer claimed that their plant was shut down for three years and only reopened in 2014 on the direct counsel of government officials. “Most of our production since we reopened has been exported to the US, since domestic orders under the solar mission were yet to materialize.” Most of these companies do not expect to thrive without government support either directly or by artificial demand through domestic content policies.
Barriers and Enablers to Competitiveness
Like incumbent module manufacturers, cell manufacturers mention the same issues of high interest rates and unfair competition with Chinese firms “as evidenced by China’s lack of transparent finance” as the factors impeding their success. “The Chinese do real damage by selling below cost. Government needs to protect against injury using anti-dumping duties,” said one cell manufacturer. This accusation was indeed investigated by India’s Directorate General of Anti-dumping and Allied Duties (DGAD) at the Ministry of Commerce and Industry, which reported that there had indeed been dumping and proposed duties of US$0.48-0.81/W on the cells imported from the US, China, Malaysia and Taiwan. However, the Ministry of Finance did not enforce the duty as it reasoned that the cell manufacturing business was relatively small and duties at this stage would impair the
62
government’s larger solar deployment ambitions [182]. Indeed, as the analysis in Chapter 5 demonstrates, imposing duties on cell imports would make the module business unviable, and will still struggle to find a market for $0.51/W cells at an international spot price of $0.29/W.
They also opined that “infrastructure in India is building up and there is lots of momentum in the industry, the industry just needs a financial push and sustained demand to attain an escape velocity to profitability. It would be great if a large firm like Tata or Reliance was to build a Polysilicon plant in India, but it’s a big-ticket item and banks tend to be very demanding in enforcing loan terms.” Another said, “the solar industry can’t survive on its own. Without government policy it will be tough. Government support by providing loan guarantees for five years through a dedicated Renewable Energy Bank, would be critical for competing with China.” Another interviewee added that “The sector has a potential to do very well if it gets financial support and demand from NSM DCR for at least one year, after which it can focus on exports to the US and Europe. Presently, the cost structure per cell is about US cents 42-43/Watt with wafers costing 18-20c/W, conversion cost, 17-20c/W and finance 3-5c/W. This could drop, after support, to about 34c/W (note that present spot price is 29c/W).” The impact of duties on imported Chinese cells and finance support demanded are further analyzed in Chapter 5.
Domestically-Competitive Cell Inputs and Chinese Competition
Cell manufacturers are generally heartened by the increasing availability of raw materials for cell manufacturing domestically. Silver and aluminums pastes, used for metallization as well as chemicals used in doping – phosphorus and silicon nitride--are mostly available in India but the polysilicon wafers, the most critical and expensive input, are still imported. “Whereas, before we temporarily shut down, we used to import all our inputs, a number of inputs are now available domestically. There are now numerous suppliers for chemicals required in the doping process. Wafers are still imported, due to polysilicon, and no one wants to risk this. In 2008, our company carried out a process audit of SRI International, a Polysilicon plant in San Francisco with EPC Company, Fluor (Engineering). The intent was to pilot a 200MT polysilicon plant and later expand to 5,000MT, using new proprietary technology that they paid for. At a cost of USD 125 million by our estimation, we expected to bring down the capital costs by 60% and manufacturing costs by 80%.” The firm, however, never went ahead with the plans as the financials did not work out. “We have suspended the plan for now, seeing we cannot compete with the subsidized materials coming from China.” Further buttressing the points made by module manufacturers about the Chinese competition, the manufacturer said the following: “I think the government is serious about a polysilicon plant this time and our process is still valid. If the Government were to invest some money, say over 40% of capital costs, we would be reconsidering it.”
The question of whether India’s government should get involved in supporting polysilicon manufacturing has been considered in a policy brief by the Center for Science and Technology Policy (CSTEP); they point out that the key obstacles to competitiveness are electricity and finance costs [159]. Chapter 5 further examines this question and what impact such as support will have, if any.

63
4.3.3 Developers
Developers generally expressed skepticism with the domestic content push, tending to favor of the option of greater imports of the cheapest panels available. They were more concerned with the government getting out of the way, by setting up renewable portfolio obligations and energy certificate markets that are rightly priced and addressing land concerns and grid infrastructure challenges, rather than domestic manufacturing. “India needs cheap energy more urgently than it needs solar manufacturing (to drive its industrial and economic agenda), so why not let China subsidize our energy supply,” one developer said.
This view that government needs to get out of the way, by imposing domestic content requirements, does not support the opinion expressed by manufacturers that developers take most of the value out of the domestic content requirement, a benefit developers appear to be unaware of. More importantly, they seemed resentful of the additional administrative requirement of screening new vendors for the domestic content requirement.
Cost and Quality of Domestic Products
Developers also noted that domestic manufacturing is hindered by cost, quality and speed of delivery. For example, on the issue of quality, one developer said, “our technical team tested several domestic companies’ modules, and only two domestic manufacturers, Tata’s and EMMVEE’s, passed our quality tests.” This is a different view from manufacturers who mostly insisted that the quality of India’s modules were not inferior to their international competitors. There is indeed significant concern in the industry about the quality of solar projects being deployed under the solar mission and whether developers are conducting sufficient tests before installing panels [183, 184]. However, the notion that Indian modules are inferior to their Chinese counterparts is not clearly supported. An ASU PV Test Lab study did find that new firms are more likely to produce poorer quality modules than older, more established ones, and since many Indian firms are new relative to their Chinese counterparts, ensuring quality at the gate should be a concern for them, as it should be for regulators [185]. Developers also noted considerable variance in the quality of modules manufactured in India. Some manufacturers attributed this issue to a lot of “manual manufacturing techniques”. “These are labor intensive, thereby creating jobs but process variables are high and hence we cannot guarantee compliance.”
With respect to costs, developers claim that domestic panels are 10-15% more expensive after shipping costs. This may be slightly exaggerated since domestic module production cost in India is only about 8% higher than the average international spot price ($0.55 to $0.51) before shipping costs (see Chapter 5). Moreover, developers feel that domestic manufacturing capacity would not be able to ramp up quickly enough to meet the demand for 100GW in seven to eight years, and the speed of delivery is crucial to ensuring project timelines.
Jobs Created in Development vs. Manufacturing
Regarding value added to the economy, local developers also felt strongly that since India’s big strength lies in its cheap labor, India should focus on activities that take advantage of this asset. “Given increased automation of manufacturing processes, whereas about 20

64
people can be employed in a 150MW/annum manufacturing plant, Sun Edison’s ongoing development in Karnataka employs 700-800 people.” This argument contrasts with the one made by manufacturers, who argue that the jobs in manufacturing - close to 500 people in a semi-automated 200MW plant – are more skilled and sustainable than development jobs. The literature sides with developers in this argument finding that 65-80% of solar jobs are in design, installation and maintenance of solar projects, as opposed to 15-40% in manufacturing [163] (also see Figure 24).
Development – Specific Issues: Land, Grid Integration and Solar Resource Measurement
Emphasizing the problems experienced in acquiring land, a developer claimed that “the reason the cost is low is not land but labor since land remains a major problem especially in Karnataka. The state is however planning a 10,000-acre solar park to accommodate a 2GW development to alleviate some of the land and infrastructure problems.”
Other problems that were identified that developers face include revenue assurance, poor yield estimates and ineffectual emissions/ solar trading markets. Regarding revenue assurance, one developer said, “the biggest problem is the poor financial health of distribution companies (DISCOS), which are supposed to serve as the ideal off-takers of grid-based electricity. Government guarantees are required to give developers confidence in purchase agreements signed with DISCOS. DISCOS should also be empowered and leveraged to get into such agreements to increase overall transaction efficiency.”
On solar resource yield estimates, a developer said “we find it difficult to plan as the precise predicted amount of sunshine an area will get are often incorrect, leading to long-term contracts being poorly priced.” Regarding emissions and solar markets, stakeholders decried the ineffectiveness particularly of net metering and renewable energy certificates. For instance, net metering, which has been very successful in driving solar rooftop deployment in the US, has not taken a firm root in India. This is essentially a pricing problem as at a levelized cost of electricity (LCOE) of about 9Rs/W ($0.15), installing a rooftop solar is not as profitable when grid electricity costs 5Rs/w ($0.083). A feed-in-tariff policy to bring the price of solar to about 9Rs/W ($0.15) is therefore being considered in a number of states. The same is true of renewable energy certificates. Again, stakeholders classified this as a pricing and enforcement problem. “REC does not work because of the pricing at 9Rs/W ($0.15). If the price were to come down to Rs3.5/W ($0.06), and be properly enforced, companies would be more likely to make trades,” a senior executive said. In summary, developers believe that solving these developer-specific problems is more important than focusing on manufacturing. Deploying solar modules quickly and cheaply, in order to provide electricity for industry as well as the poor, may indeed be a more urgent challenge than manufacturing.
4.3.4 Government (MNRE, SECI, NTPC, KREDL, NISE)
This section details interviews with senior policy makers at the central (federal) government and in one state – Karnataka--so as to get at least one state-level perspective. Policy makers interviewed were generally confident about the overall implementation of the Solar Mission. From NTPC’s NVVN, which managed the reverse bidding process for phases

65
I and II of the solar mission to the Solar Energy Corporation of India, which is in charge of implementing solar parks as well as building grid based solar facilities on behalf of the government, optimism with the pace of policy implementation was high.
Central Government Initiatives
This section summarizes some of the key themes discussed in the various central government interviews. At the time of the interview, a senior national official hinted that the plan was to have about 8-10% of its total deployment target of 100GW be domestically sourced. Recall that the solar mission set out to create a 5GW per year cell and module capacity, which ideally would be sufficient to supply the domestic content portion over the five-year timeframe. However, it is unclear if this goal is still attainable under the new WTO ruling if firms are not competitive in the open market (without DCR).
One senior policy maker said “the motivation for the DCR is to have some minimum production capacity domestically. This is strategically important from an energy security standpoint. Our objective is to give a clear policy/ regulatory framework to let businesses set up. We therefore incentivize firms, both local and foreign owned, to set up manufacturing facilities in India. Examples of these are the MSIPS and solar park schemes. We subsidize capital investment as well as infrastructure services.”
“The government also routinely holds formal and informal sessions with manufacturers to get a sense of what challenges firms face. Some of the recurring themes at these meetings are finance, land and frequency of demand.” Regarding finance, the government (as of the interview) had negotiated collaborations for low-interest rate finance from the World Bank and the Asia Development Bank and was planning to float a Green Bond. On land, solar parks were being implemented throughout the country through collaboration between SECI and state governments. On NSM demand frequency, plans were underway to request bids of up to 15,000MW/year until 2022. The level of the government’s willingness to convene and respond to the market’s demands was evident and commended by many manufacturers interviewed. This policy adaptability and government-stakeholder collaboration has been found in the literature to be critical to the rapid industrialization of the Asian tigers [13, 84] and deserves highlighting.
Finally, the Government is also investing heavily in building technical expertise in the solar sector across the value chain through its “Skill India” initiative, facilitated by the National Institute of Solar Energy (NISE). In addition, NISE is being built out as the ultimate intellectual anchor, in the mold of United States’ National Renewable Energy Laboratory (NREL) for reliable data and knowledge of the solar sector.
State Government Initiatives - Karnataka
At the state level, various states were making amendments to local laws to ease the acquisition of land for developers. In Karnataka, for instance, Section 109 of the state law forbade non-agriculturists from buying agricultural land. According to an official, “Karnataka’s Renewable Energy Development Limited (KREDL) has lobbied to amend these laws, thereby permitting the approval of less-irrigated land for solar purposes. Further, the

66
agency has signed an MOU with SECI for a 2GW solar park on eleven acres of land on a lease basis from agricultural landowners in Parvaga District (200km from Bangalore). The solar park will have a fixed-lease rate for developers, and KREDL will enter into an MOU with each developer (about 150 developers). KREDL and SECI will build the transmission/evacuation infrastructure.”
4.3.5 Academic Sector
The knowledge economy-based industry, like traditional industrial hubs, requires an abundant supply of raw materials and complementary industries to thrive. A critical raw material in engendering knowledge and technology-based industries are the products of universities: research, patents and graduates. Therefore this research included interviews with key professors and research practitioners to determine the direction of research and how these complement the efforts of the industry as well as the government.
The Indian Institute of Technology, Bombay is the leading technology research college in India. It is also the home of the National Center for Photovoltaic Research and Education (NCPRE), a research foundation sponsored by the government with the intent of promoting collaborations with the private sector. NCPRE was initiated in October 2010 as a five-year education and research outreach. It has 50 investigators from thirteen departments. Firms in the NCPRE consortium are allowed to use the lab resources for their internal research. Applied Materials, for example, use the nano-manufacturing lab, the Center for Excellence in Nanoelectronics, for a lot of their India-based research. Other firms in the consortium include Indosolar, Lanco, Reliance and Tata. According to some of the professors interviewed at the time of the study, NCPRE had yet to commercialize any notable collaborative projects. However, research was ongoing on a number of module/ cell efficiency increasing methodologies as well as testing of new (and cheaper) materials for PV cell and module manufacturing. In an example of ongoing work, one prominent scientist is conducting research into alternative materials to reduce the temperature coefficient effect of crystalline silicon cells in India’s hot temperatures.
Some of the academics interviewed did not believe that India has the technical or entrepreneurial skills to drive the domestic industry. “Companies in India have no R&D, and when they have problems, R&D is the first to go,” said a researcher. “India could probably also grow in silver and aluminum paste supply for cell manufacturing, but polysilicon should be done where electricity is cheap.” On the positive side, another researcher noted, “India has good engineering design and integrated circuits capabilities and hence would be good at the downstream end of the solar business.”
University of Calcutta is another center that used to host a lot of research but has faded in significance with the advent of cheap modules from China. Prior to 2010, there was a lot of research into amorphous silicon (ASi) thin film cells at the university, according to a university solar researcher interviewed. “Crystalline silicon was expensive at the time (close to $20/Wp). This has now changed due to large production volume to as low as ($0.36/Wp). Hence our funding started to dry up.” “The Department of Science and Technology (DST) and the Ministry of New and Renewable Energy DST fund a lot of India’s photovoltaic

67
research. This funding requires collaboration with industry and mostly covers fundamental research, which is not readily transferable to industry, as industry mostly does not manufacture from raw materials. For example, the University failed at collaboration with a French company in 2009-2010 on amorphous silicon as both institutions were unable to translate the research into commercial success.”
This failure of coordination between research and commercial interests was also the subject of conversation at the Observer Research Foundation. Researchers interviewed noted that “NCPRE is the right thing, and it has all the potential. But the way the research is done does not lend itself to a lot of dissemination. So even if an industry partner is interested, they are not aware. There are no requirements on the researchers to commercialize.” They also said that “this trend follows an historical pattern where professors were victimized for trying to commercialize their research.” They had concerns about the dearth of entrepreneurial talent growing out of India’s elite colleges, despite a strong heritage of cutting-edge research. However, they see a glimmer of hope from the leadership that IIT Bombay has taken with its in-house incubator and technology transfer office and recommend that this be replicated across the country.
4.4 Stakeholder Analysis and Discussion
Table 11 summarizes the views of key stakeholder categories and my analysis of the shared views. The next sections provide additional details.
Table 11: Summary of Stakeholder Views
Category Views Analysis
Manufacturers Most agree that DCR and duties are probably ill advised, but favor direct support such as subsidies, R&D demonstrations and low-interest loans
Chapter 2 showed from the literature that DCR and duties do not help the industry. Chapter 4 analyzes the cost and potential returns on some of these interventions at various stages of the value chain to arrive at recommendation.
Developers Against DCRs. Call for solar parks (land and infrastructure support), better grid integration and functional renewable portfolio obligations/ markets
Solar parks are already being implemented in various states. However, grid integration and renewable certificate markets still require action. Financial markets also need to be reformed for both manufacturers and developers
Academics More funding for R&D, and better coordination with Industry
This will be critical for India to take a leading role in the rapidly evolving industry to avoid obsolescence
Policy Makers Generally satisfied with pace of progress and adaptability of policy to the stated needs of the market players
This is largely acclaimed to be true by other stakeholders at the national level.
Manufacturing
Policy provides differential incentives for the various categories of stakeholders. The case has already been made that DCRs are not advisable. However, manufacturers and policy
68
makers alike remain convinced that some sort of direct support is necessary. In addition to public procurement and viability gap funding, which favor developers rather than manufacturers and are expected to continue, manufacturers want government to consider direct assistance such as capital subsidies for setting up or expanding manufacturing facilities, interest rate subsidies, tax preferences and infrastructure subsidies for services such as electricity, which would be critical for polysilicon manufacturing. These demands are not unprecedented in countries where solar is presently competitive, like China and the US as discussed in Chapter 3. For instance, in addition to capital subsidies as high as 50% and domestic content requirements which have now been discontinued, China continues to allow PV companies to pay a corporate income tax rate of 15%, provides a 50% reduction for R&D costs related to new techniques, products and processes, and a 17% added-value tax refund rate for solar cells. It also gives firms access to cheap loans, especially for export purposes [5] [6]. But these are not without drawbacks. As Kristinsson points out, the problems with transfer payments, subsidies and preferential taxes as incentives are that inadequate attention is paid to technical abilities and research and corruption and the fact that subsidies may be too expensive for the value they creates [186]. The literature on the role of government in enhancing technical abilities and research is discussed later in this chapter, and Chapter 5 examines the cost of these kinds of subsidies in the Indian context.
Development As developers in previously-cited interviews warned, India must be careful not to repeat
China’s mistake of emphasizing manufacturing at the expense of much-needed solar deployment – both for environmental and economic reasons. China’s initial policy focused too much on manufacturing with poor coordination with deployment policy. This led to oversupply of modules and consequently several manufacturers went out of business [187, 188]. These policies also failed to maximize opportunities in international markets due to trade conflicts, again a result of the poor use of industrial policy [5].
Land also emerged as an important problem for solar developers, as it has been for many investors seeking to establish facilities in India. For instance, ArcelorMittal, the world’s largest steelmaker owned by Indian-British billionaire Lakshmi Mittal, in 2013, cited land delays as the main reason for dropping its plan to build a plant in the eastern Indian state of Orissa. Investors seeking to buy large parcels of land for large-scale solar development had to negotiate with individual landowners to obtain the required 80% consent. This gives rise to a market failure known as the hold-out problem which occurs when one or more land owners decide to withhold from selling, in anticipation of more money as the value of their land increases when most of the pieces have already been bought. In addition to the hold out problem, the cost of negotiating with several sellers alone, coupled with the attendant red tape, is often too onerous for investors. The national government’s land reform bill of 2015 was intended to address this problem nationally, but it was defeated politically. As a work around, the government’s solar park policy seems to be addressing this problem for some developers. Based on Bridge to India’s CEO survey, land has mostly been replaced by grid reliability as the main concern for solar developers, who generally expressed satisfaction at the ease of acquiring land in these special economic zones around the country[189].
69
Industrial (solar) parks also offer opportunities to address the industrial energy, transmission of electricity and logistics simultaneously. Further, they create an opportunity for cluster formation, addressing supply chain deficiencies and targeted intervention, as required.
It has been severally argued in the solar literature that governments should intervene in formulating market mechanisms that correctly price externalities of energy generation, as prices alone do not adequately address the health and environmental externalities in energy markets discussed in Chapter 2 [190]. Developers and a few manufacturers with development businesses emphasized that this encourages policy makers to set better regulations and promote renewable portfolio obligations (RPOs) and renewable energy certificates (REC), which allow market mechanisms to function better in promoting solar deployment. Early Chinese policy was deficient in doing this and facilitating grid integration systems that liberate the private sector to expand the deployment of solar [5].
Now, the Chinese government is trying to re-emphasize the deployment side of energy policy in its 12th Five-year plan towards more demand-side policies. There is the chance that India could lead in these areas on the development side. Beginning in 2013, China made a range of policy changes to stimulate distributed solar PV as part of its demand-side push. However, it did not see a lot of uptake on the distributed self-consumption side of PV. Unlike the US where soft costs account for over 70% of rooftop solar cost, China’s soft cost is only about 30% - high when compared to utility scale installations but not prohibitive. However, the other reason is the uncertainty of future returns, which makes project financing high for small projects. In addition, grid operators in China, as in the US, are beginning to take issue with the fact that distributed generation consumers do not pay their fair share in grid maintenance despite utilizing the grid more than the average electricity consumer [191]. This has not discouraged China’s policy makers both at national and provincial levels from driving distributed generation, but Indian policy makers may take heed in order to focus more on utility scale development as these present less complications. This would suggest a reconsideration of the allocation of 40GW of India’s 100GW target to rooftop deployment to a smaller fraction and in its place prioritize mini-grids that do not require direct connection to the grid and the attendant high connection costs, but also takes advantage of economies of scale to power entire communities. This option may not be cost effective in highly dispersed communities as the cost of wiring could supersede the economics of scale from utility solar farms or mini-grids [192]18.
4.5 Research and Innovation in the Industry: Role of Government in Innovation Policy
One of the reasons identified in the literature for the lack of competitiveness in the Indian industry is the innovation environment [88, 124]. Therefore, it was important to get insights
18
For every kilometer in distance that an Indian household is from a substation, the wiring alone adds two cents per kilowatt-hour to the cost of power

70
from both the industry as well as academia toward a unified view of why the sector does not innovate its way to competitiveness.
The lack of active cutting edge research in the industry is a pernicious trend as the risk of obsolescence is very high in this industry. The literature supports a more active role for government in coordinating research and development in the sector and helping solve some of the knowledge-related externalities discussed in Chapter 2. The returns from such an investment may not seem apparent from a direct accounting returns framework of the industry, but the literature shows that there is a clear correlation between GDP and R&D spending [193]. Moreover, Zhang (2011) points out that the role of government is to provide long-term vision and coordinate different partners in acquiring and developing knowledge. This was found to be true for both the Chinese and Japanese Governments in their PV and overall industrial development. Japan's Ministry of International Trade and Industry (MITI) developed programs to aid the development of technology in the private sector, and the Chinese Government’s national innovation system (NIS) reform in the 1980s laid foundations for fundamental research and commercialization of technology [194]. China's reforms in the 1980s focused on pushing enterprises to be the driving force of S&T and R&D activities [195]. In Taiwan, public research institutes played a critical role in developing the first generation (1G) solar PV technologies in the early 1990s. However, the role was quickly taken over by semiconductor players in mid-1990s. The development of the new generation solar PV sector has been initiated by the private sector since 1996. In Korea, development of 1G solar PV is dominated by the large business conglomerates (chaebols), while the public research institute was significantly involved in the new generation solar PV sector as early as 1997 but withdraw gradually after 2002, when the chaebols Samsung and LG entered the sector [69]. In each of these cases, government played a role in funding and initiating early research thereby motivating the private sector to jump in.
The Indian government should take responsibility for laying out the broad vision and making funds available, but should leave it to the rest of the system to determine strategies and allocate resources, as opposed to being more actively involved, for instance, in selecting technologies or championing certain firms or stages of the value-chain. India’s NCPRE and NISE, discussed earlier, are positioned to provide such overall leadership, with their involvement possibly being rolled back as firms become more active in leading innovation.
4.6 Conclusions
The view of the overall objective of the solar mission (JNNSM) to add 100GW of grid based solar by 2022 was largely positive, even if most stakeholders do not consider it achievable. The mission has clearly energized the industry with many previously dormant firms reviving their manufacturing capacities. The domestic content requirement did not receive as much unanimous support as most stakeholders do not think it is efficiently subsidizing domestic manufacturers, nor solving the fundamental problems that developers face. This study does not find support for the DCR whatsoever, especially in the light of the WTO ruling against it. However, manufacturers desire incentives to stimulate the domestic

71
industry despite the apparent lack of comparative advantage, and policy makers seem intent on providing it. Chapter 5 turns to the question of what it would cost to make each part of the solar manufacturing chain viable.

72
5. Potential Viability of the Solar PV Manufacturing in India
This chapter discusses the financial viability of setting up new solar PV manufacturing plants in India. For each of the three major steps of the value chain—high-purity polysilicon production, wafer casting, and cell and module manufacturing—a cost-analytic model is developed to assess the competitiveness of Indian-based manufacturing of a significant output, defined in terms of a minimum MW/year output for each of these three stages.19 To motivate the discussion of financial viability, each section begins with a brief description of the global market size and demand, the competition in the sale of products, international spot prices, and current activity and capability in the market segment in India.
The analysis presented herein provides the minimum sustainable price (MSP) at which new firms set up in India could viably produce, compared with similar breakdowns developed by NREL for China and the United States, and illustrates the types and combinations of direct policy interventions that could help firms become sustainable at the present spot prices. Further, the analysis provides the cost of various policy interventions to the government and potential benefits that could result from such interventions.
5.1 Methodology
The objectives of the models used in this chapter are to estimate how much support is required to bring a domestic manufacturing firm to profitability in the short run, expressed in terms of the MSP as defined in the sections below. The models do not address long-run effects such as those of new firm entry, technology obsolescence, or demand volatility.
The cost-analytic models follow the schematic shown in Figure 29 below. For each technology, the model uses inputs (e.g., cost of labor, electricity, raw materials, capital cost) in order to provide an accounting of profitability over the lifespan of the manufacturing plant. The model calculates annual variable costs, cost of debt/ repayment, net profit and loss, a balance sheet, and key viability measures such as the net present value (NPV) of cash flows, the internal rate of return (IRR), and the sustainable price at which firms can produce under current conditions. It uses discounted cash flow (DCF) and the capital asset pricing model (CAPM) described in Chapter 2.
19
Specific capacities used are 24,000MT for polysilicon, 240 million wafers and 500MW cell/modules manufacturing capacities per year

73
Figure 29: Cost Analytic Model Framework
Adapted from Powell et al. 2015
A number of general accounting assumptions are utilized throughout the analysis. These are discussed first, followed by a discussion of the specific manufacturing processes, inputs and assumptions and the results of the analysis for each step of the production chain.
5.1.1 General Inputs and Assumptions
This section outlines some of the input costs that are used in each of the viability assessments. It also briefly explains the justification for the specific numbers used in the calculations. A number of the inputs were validated with industry stakeholders, and in cases where they were not, it was usually because there was no natural stakeholder with whom to validate the information.
Labor Costs
Cost of human capital is an important difference between manufacturing plants in developed versus developing countries. While human capital costs represent a significant share of the value in the former, they are generally only a fraction in the latter.20 The labor costs used for India in this study are based on India’s Annual Survey of Industries [196]. Chinese and U.S. costs, on the other hand, are based on previous studies on solar
20
BLS 2010 estimates India’s labor costs are approximately 3% of the United States’
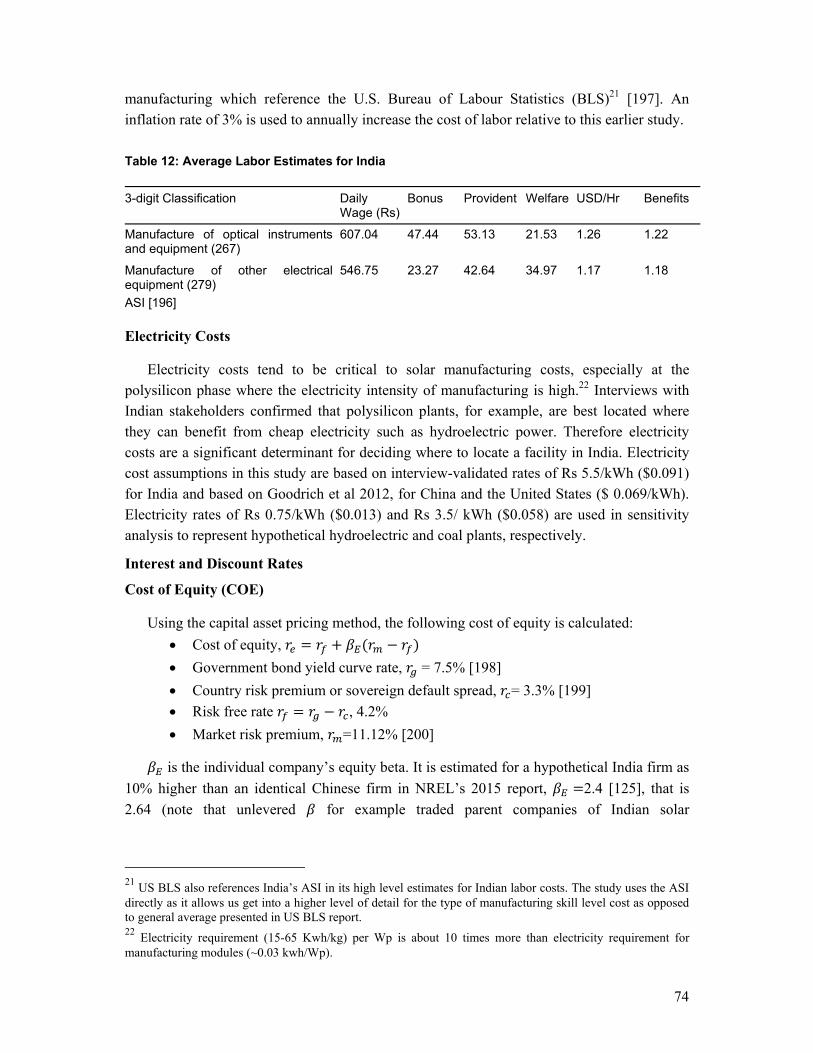
74
manufacturing which reference the U.S. Bureau of Labour Statistics (BLS)21 [197]. An inflation rate of 3% is used to annually increase the cost of labor relative to this earlier study.
Table 12: Average Labor Estimates for India
3-digit Classification Daily Wage (Rs)
Bonus Provident Welfare USD/Hr Benefits
Manufacture of optical instruments and equipment (267)
607.04 47.44 53.13 21.53 1.26 1.22
Manufacture of other electrical equipment (279)
546.75 23.27 42.64 34.97 1.17 1.18
ASI [196] Electricity Costs
Electricity costs tend to be critical to solar manufacturing costs, especially at the polysilicon phase where the electricity intensity of manufacturing is high.22 Interviews with Indian stakeholders confirmed that polysilicon plants, for example, are best located where they can benefit from cheap electricity such as hydroelectric power. Therefore electricity costs are a significant determinant for deciding where to locate a facility in India. Electricity cost assumptions in this study are based on interview-validated rates of Rs 5.5/kWh ($0.091) for India and based on Goodrich et al 2012, for China and the United States ($ 0.069/kWh). Electricity rates of Rs 0.75/kWh ($0.013) and Rs 3.5/ kWh ($0.058) are used in sensitivity analysis to represent hypothetical hydroelectric and coal plants, respectively.
Interest and Discount Rates
Cost of Equity (COE)
Using the capital asset pricing method, the following cost of equity is calculated:
Cost of equity,
Government bond yield curve rate, = 7.5% [198]
Country risk premium or sovereign default spread, = 3.3% [199]
Risk free rate , 4.2%
Market risk premium, =11.12% [200]
is the individual company’s equity beta. It is estimated for a hypothetical India firm as
10% higher than an identical Chinese firm in NREL’s 2015 report, 2.4 [125], that is
2.64 (note that unlevered for example traded parent companies of Indian solar
21
US BLS also references India’s ASI in its high level estimates for Indian labor costs. The study uses the ASI directly as it allows us get into a higher level of detail for the type of manufacturing skill level cost as opposed to general average presented in US BLS report. 22
Electricity requirement (15-65 Kwh/kg) per Wp is about 10 times more than electricity requirement for manufacturing modules (~0.03 kwh/Wp).

75
manufacturers are around Tata, 1.46 [146] and Moser Baer, 2.33[147], which are comparable to 1.6 in this analysis. Note that unlevered beta can be calculated as
1 1
COE, Re = 4.2% + 3.76 * (11.12-4.2%)= 30.55% Cost of Debt: Cost of debt is assumed at 12.5%, which was obtained from manufacturer
and bank interviews. Weighted Average Cost of Capital (WACC): The WACC is calculated based on the
equation below:
∗ 1
Where:
Re = equity rate (21%) Rd = cost of debt (12.5%) E = Value of private sector’s equity D = Value of debt
V = E + D E/V = percentage of financing that is equity D/V = percentage of financing that is debt t = corporate tax rate
Using the weighted average cost of capital model above and a 70:30 debt to equity ratio, we
arrive at a WACC of 15.07%. The WACC is used as discount rate throughout the analysis.
Table 13: Calculated Weighted Cost of Capital for India compared to US and China
US China India Source
Average regional unlevered beta 1.6 1.4 1.46 Tata, Donovan and Nunez
Industry’s debt-to-equity ratio 0.22 0.98 2.33 CPI based on interviews
Regional relevered beta 1.9 2.4 3.7595 Calculated
Estimated cost of equity, re 17.36% 21.00% 27.77% Calculated
Government bond yield curve rate, rG 2.96% 4.71% 7.50% Trading economics23
Sovereign default spread %, rD 0.29% 0.84% 3.30% Damodaran24
Market total return, rm 10.40% 11.00% 11.12% MSCI25
Estimated country risk-free rate, rf 2.67% 3.87% 4.20% Calculated
Estimated corporate spread, S 1.50% 2.60% 8.30% Damodaran
Estimated cost of debt (pretax), rd 4.20% 6.50% 12.50% CPI
Average effective corporate tax rates 27.70% 21.50% 32.50% Deloitte
23 Trading Economics, available online at http://www.tradingeconomics.com/india/government-bond-yield, last accessed July 2016 24 Damodaran, available online at http://pages.stern.nyu.edu/~adamodar/, last accessed July 2016 25
MSCI, available online at https://www.msci.com/resources/factsheets/index_fact_sheet/msci-india-index-inr-gross.pdf, last accessed July 2016

76
Share of Equity 82% 51% 30% CPI
Share of Debt 18% 49% 70% CPI
Estimated regional WACC 15% 13% 15% Calculated
Sources: NREL 2015 for US and China and authors analysis for India
Debt Repayment Timelines: The models assume total debt duration of about fourteen years including a construction period of one year, principal moratorium of one year, and a regular debt repayment period of twelve years. The principal moratorium is a period, after construction ends, where the borrower is only responsible for paying the interest portion of the loan and not the capital cost. Repayment of both interest and capital continue after the end of the capital moratorium.
Cost of Goods Sold/ OPEX: The cost of goods sold, or operating expenses (OPEX), includes the cost of raw materials, labor and electricity used to produce as well as equipment maintenance. Raw materials, labor, and electricity costs are computed based on specific requirements of each manufacturing process discussed later. Equipment maintenance or operation and maintenance (O&M) is assumed to be proportional to the original cost of the equipment. Hence, it is assumed as 1.5% of initial equipment cost annually as is the standard in the industry (NREL).
Fixed Costs: Fixed costs include depreciation and interest costs as well as overhead costs such as research and development (R&D) and selling and general administration (SG&A) costs. For India, R&D is assumed as 0.5% of annual revenues while SG&A is assumed as 1.5%. These are lower than the standard in the US of about 1.5% and 6.9% respectively (Powell). This cost reduction is because a result of the fact that Indian firms do not conduct a lot of R& D and the cost of sales and administration, like labor, is only about 3-10% of US costs.
Land and Facility Costs: Land and facility costs are estimated to be Rs 6000 per square meter ($100) based on average industrial land rates published by the states of Andra Pradesh [201], West Bengal [202], and verified by manufacturer interviews. Building facility costs are estimated at about $8,000, per square meter, based on manufacturer estimates and verified by independent estimator[203].
Tax: Effective tax rates of 30% and 32.5% are used for US and India respectively [204]. Depreciation: This is calculated using a straight line method over the useful life of the
equipment, which is assumed to be ten years, except for the module stage which is assumed to be seven years.
Net Present Value (NPV): Financial viability is measured based on the discounted cash flows over the recommended project duration. Net present values are calculated using a discount rate equal to the weighted average cost of capital (WACC).
1

77
Internal Rate of Return (IRR): The internal rate of return is the hypothetical WACC at which the NPV of the investment is zero. Investments with higher IRRs are considered more viable.
Debt Service Coverage Ratio: Debt Service Coverage Ratio is a parameter considered by lenders while looking at the ability of a project to service its debt obligations, including repayment of principal amount and interests. Typically, a DSCR of 1.5 and above is considered attractive by lenders. At the same time, lenders would also consider that DSCR during the project period, which should not go down below a threshold value. A minimum DSCR of 1.0 and above would be considered reasonable by lenders.
Minimum Sustainable Price: The MSP is the unit selling price at which the NPV at least equals zero or the IRR equals the WACC.
Table 14: Summary of General Assumptions
Variable Measure Value Source Reliability
Labor Daily wage *(1+Benefit multiplier) (USD/Hr)
1.26*(1.22) ASI (validated with BLS, BCG)
These are average rates, specific rates for high and low income brackets will vary
Working days per year
Days 350 NREL
Working hours per day
Hours 24 NREL
Electricity Average rate (USD/Kwh)
0.092 Interviews
Equity CAPM 30.55% Calculated Low, B values are assumed based on China’s
Debt Market rate 12.5% CPI quotes 12-14%
Interviews/ literature
Debt/Equity Ratio
Market rate 70:30 CPI
WACC % 15.07% See below Calculated
Working capital period
Months 3 Assumed
Debt Repayment
Years 14 Assumed Bank interviews
Maintenance % of fixed capital 1.5% NREL
R&D % of revenues 0.5% Assumed NREL varies from 0.9-1.5%
SG&A % of revenues 3.5% Assumed Less than NREL’s 6.9% for US because of labor costs
Inflation 2.9%
MFN inport 10% Zauba

78
duty
Land Cost RS/ Sqm 6000 APIIC Average for a number of Industrial lands
Facility Cost RS/Sqm 8000 GHAR Estimate
Conversion Rs to USD 60 XE26
Effective Tax 32.5% Deloitte27
Threshold policy analysis: The analysis estimates the cost of the minimum (threshold
policy package) required to make a firm viable. The linear optimization is written as follows: 0,
0 10
0 50%
8% 12.5%
0.75 5.5
The following sections discuss the analysis for each section of the manufacturing chain.
5.2 Polysilicon Cost Analysis
5.2.1 Global Polysilicon Market
The decision whether a polysilicon plant should be set up in India depends on a number of factors. Of paramount importance is the demand for the products both domestically and internationally. As discussed in the interviews analysis above in Chapter 4, despite India’s population and electricity needs, the near-term domestic cell or module industries will only be able to use so many kilograms of polysilicon. Assuming a domestic industry of 10,000 MW, India would need to add about 50,000 MT of polysilicon manufacturing capacity over five to six years to fully source polysilicon domestically [205].28 However, if an Indian polysilicon plant were competitive internationally, then it can export to meet its demand shortfalls and accrue some of the other benefits of exports discussed in Chapter 2.
Figure 30 shows an estimated global supply of polysilicon. Demand for the product is
about 300,000 MT, or 61GW of solar modules. A handful of existing companies, approximately fifteen, are presently able to meet this demand at a price of between ~11 and 17 USD/kg. This chart represents the estimated variable cost for each of these firms, which
26 Exchange rates from XE.com, available online at http://www.xe.com/currencycharts/?from=USD&to=INR, last accessed December 2015 27 Deloitte, available online http://www2.deloitte.com/content/dam/Deloitte/global/Documents/Energy-and-Resources/gx-er-oilandgas-india.pdf, last accessed July 2016 28 Assuming five tons of polysilicon are required to make 1MW solar modules

79
includes processing cost and SG&A, but excludes depreciation. However, these costs continue to drop as DAQO, for example, in its 2015 Q4 report claimed it was able to reduce its variable cost to about USD 9.74/kg. In order for a new India-based firm to be competitive, it needs to produce within this price range.
Table 15: Polysilicon Market Leaders (2015)
Country (HQ)
Company Production (MT) in 2015 Rank
China GCL 86,000 1
Germany Wacker Chemie 56,000 2
South Korea OCI 52,000 3
USA Hemlock Semiconductor
36,000 4
China Xinjiang TBEA 23,000 5
Norway REC Silicon 20,000 6
Japan Tokuyama Corp 21,600 7
China China Silicon 14,250 8
SunEdison USA 13,500 9
China DAQO 12,150 10
Source: PV Magazine
Figure 30: Chart of Polysilicon Market Leaders
Source: Bloomberg New Energy Finance [206]
Presently, Chinese polysilicon makers dominate the global market. The Chinese manufacturer GCL retained its top spot in the years 2013 – 2015 with 86,000MT at 85%
Fir
m C
apac
ity
(ton
nes)

80
capacity utilization. The firm is expected to grow its capacity to 100,000 in 2016. Chinese duties (discussed in Chapter 3) on polysilicon imports prevent U.S. companies like Hemlock from participating actively in the Chinese market. Hemlock only recorded a capacity utilization of 46% in 2015 according to IHS research and has abandoned its recent expansion plans. Wacker and OCI were able to negotiate different tariff agreements with the Chinese, allowing them to continually stay competitive in the Chinese market. Highly-reported oversupply of polysilicon seems to persist with the top producers expected to add more than 20,000MT of polysilicon in 2016, due to long-outstandingplans [207].
Presently, based on the Herfindah–Hirschman index (HHI), which estimates market power, there are about eight effective competitors in the polysilicon market (unconcentrated), but a new firm will need to produce at least 14,250 MT to be to have market power [125].
5.2.2 Key Polysilicon Manufacturing Inputs and Assumptions
India presently does not have any polysilicon manufacturing capacity. This section therefore reviews the hypothetical scenario of setting up 24,000 MT FBR and Siemens polysilicon plants. A cost accounting model is used to calculate the IRR on equity invested over the useful life of the plant. Table 16 below shows the key inputs specific to the polysilicon plant.
Table 16: Indian Polysilicon Manufacturing Inputs
Unit Value Reference
Annual production volume Kg/yr 24,000,000 Assumed
Working Days per Year days/ yr 350 NREL
Working Hours per Day hrs/ day 24 NREL
Size of Facility Per Tonne m2 500,000.00 Lanco estimate
Polysilicon Technology Siemens (9-11N) FBR (8N)
Installed equipment capex $/ kg $65 $100 NREL 2015
Electricity requirements kWh/ kg 65 15.00 NREL 2015
Electricity price INR/ kWh 5.50 5.50 CSTEP
Raw material (MGSi) INR 167.00 167.00 CSTEP
Import duties on raw material 10% 10% CSTEP
Direct-labor content ppl/ kg 6.7E-05 (4/15 of US)* 6.7E-05 NREL 2015
Overhead-labor content ppl/ kg 2.5E-04 2.5E-04 NREL 2015
Equipment Recovery Life (Depreciation Period)
years 10 10 NREL 2015
Building Recovery Life (Depreciation Period)
years 30 30 NREL 2015
SG&A (including freight) %-revenues 3.5% 3.5% Assumed

81
R&D %-revenues 1.0% 1.0% Assumed
Effective yield 75.0% 75.0% NREL
Source: NREL [126], CSTEP *Labor productivity is assumed to be lower in India than the US by a factor of 4:15, as skill level required is high. NREL uses the same labor productivity discount factor for rural China
A 24,000 MT capacity plant is assumed, as this allows the firm to benefit from economies and scale and have the requisite market power. Sales and general administration (S&GA) and research and development (R&D) are assumed to be about 3.5% and 1%, respectively, as opposed to the U.S. values of 11% and 5%. This is an adjustment for labor cost which is estimated to be less than 10% of labor costs in the United States [208].
5.2.3 Minimum Viable Polysilicon Price for Indian Manufacturers
Based on calculated production costs, Figure 31 shows the minimum sustainable price at which an Indian firm will break even (internal rate of return equals WACC or NPV is zero). The prices derived in this study are compared to NREL’s reported numbers for other countries in 2015.
Figure 31: Regional Polysilicon Production Costs and Minimum Sustainable Price for India
Sources: Financial analysis (India), NREL [125]
The chart shows that the cost of setting up new manufacturing in India is higher than that of competitors in the United States and China. Labor cost is expected to be high in the first few years of operation, despite the low average wages in India as labor productivity is significantly lower. The cost numbers reflected in the chart, for US and China, however, do not represent current production costs. Some firms reported production costs are even lower for a variety of reasons. First, most of the market leading firms such as GCL have mostly
NREL’s analysis

82
recovered their capital costs by now and can therefore compete on variable costs. Moreover, experienced firms are able to add capacity much quicker and cheaper. GCL for example reported costs of $16/kg for manufacturing the Siemens hydrochlorination process, Daqo $14/kg, Renesola $21/kg (all in China), and OCI $21/kg (in Korea) and Tokuyama $19/kg (in Japan). For the FBR process, SunEdison reported $17/kg and REC $12/kg (in the US) and $8/kg cash costs for REC (in China) [125]. India’s variable costs (total costs less interest and depreciation) are 18.92 (FBR) and 22.79 (Siemens) as shown in the chart, which is more than its competitors. The next sections evaluate what it would take for an Indian firm to compete in this market at the spot price.
5.2.4 Sensitivity Analysis of Polysilicon at Spot Price
Assuming Indian firms sold at average global spot prices shown in Table 17, this section provides an assessment of the financial viability of a hypothetical Indian polysilicon industry.
Table 17: Polysilicon Spot Price (2016-06-01)
Item High Low Average PV Grade Poly Silicon Price (9N / 9N+) 19.25 14.70 17.040 2nd Grade Poly Silicon Price (6N - 8N) 17.00 11.80 13.890
Source: PVInsights [181] At the spot price, the returns for the polysilicon plant, the analysis returns a net present
value of -$2.2B and -$1.8B each for FBR and Siemens process respectively.
5.2.5 Polysilicon Policy Incentive Analysis at Spot Price
As illustrated in the previous section, without some sort of support, a firm producing polysilicon in India would not be competitive at the current spot price. Assuming Indian policy makers desire the option to utilize a combination of incentives to ensure viability of the polysilicon plant, Table 18 shows an analysis of possible policies that could help incentivize firms. The threshold policy is the minimum combination of policies required for profitability. The high policy represents the highest level feasible based on offerings from various states in India. The default is the current baseline at the national level, while the low is simply a neutral level where the state spends nothing on firms. The cost section shows the respective costs of policy alternatives. For example, a high capital subsidy of 50% is used because the Golden Sun program in China [209] at some point gave this amount in subsidies and the state of Madhya Pradesh gives a 50% subsidy up to a limit of 25 lakh ($42k) for renewable energy projects [210]. The analysis estimates the threshold package as the combination of incentives (high, low or default levels for each variable) that achieves at least zero net present value.

83
Table 18: Threshold Policy Analysis at Average FBR Spot Price
Policies Cost
Threshold High Default Low Threshold High Default Low
Tax holiday (years)29 10 10 3 0 0.00 0.00 0.00 0.00
Capital subsidy (MSIPPS)
55% 50% 20% 0 1325.02 1214.73 485.89 0.00
Interest rate subsidy30
8.00% 8% 12.50% 12.50% 247.68 247.68 0.00 0
Electricity subsidy31 0.75 0.75 5.5 5.5 427.50 427.50 0.00 0.00
Table 19: Threshold Policy Analysis at Average Siemens Spot Price
Policies Cost
Threshold High Default Low Threshold High Default Low
Tax holiday (years) 3 10 3 0 0.00 0.00 0.00 0.00
Capital subsidy (MSIPPS)
81% 50% 20% 0 1280.33 790.43 316.17 0.00
Interest rate subsidy 8.00% 8% 12.50% 12.50% 114.54 114.54 0.00 0
Electricity subsidy 5.45 0.75 5.5 5.5 4.75 427.50 0.00 0.00
The tables show that there is no combination between the high and low estimates that
leads to viability and that the firms are only viable at 55% and 81% capital subsidies; 8% interest rate each; and 0.75 and 5.45 electricity for FBR and Siemens based plants respectively. At no point are the firms profitable as their variable costs are above the spot prices for each product. Hence the firm fails to add any value to the economy (negative NPV of EBITDA)32 despite costing the government $1.9B and $1.4B for 24,000 tons of FBR and Siemens facilities respectively. Therefore, if India were to choose to support the industry to produce polysilicon, it would likely come at a very high cost.
29
Corporate income tax is calculated as a percentage of profit. Which means it is zero when the company makes no profit. 30
Interest rate in the table represents the rate offered after subsidy i.e. 12.5% with no subsidy. 31 Electricity subsidy reflects the rate at which electricity is priced in rupees i.e. 5.5 with no subsidy. 32
Net present value of EBITDA (Earnings before tax, interest, depreciation and amortization) gives the net productivity based addition to GDP.

84
5.3 Wafer Manufacturing Cost Analysis
5.3.1 Wafer Market Analysis
Global wafer production increased to 61.9 GW in 2015, up from 47.6 GW in 2014 [211]. The global wafer market is relatively concentrated with nineteen effective competitors [126]. Chinese players dominate the market with nine of the top ten being Chinese. According to IHS top wafer manufacturer GCL and Taiwanese Green Energy, both operated at 96% capacity utilizations in 2015. Longi also continues to expand its capacity in anticipation of growing demand. Jinko and Yingli, on the other hand, are cell and module producers who mostly manufacture polysilicon for their own use. About 40% of total wafer supply volume comes from such vertically-integrated players and is therefore not available to the wafer market. Unlike polysilicon, IHS has warned that a global wafer shortage is imminent and top pure-play wafer suppliers may well increase their prices in 2016.
Table 20: Wafer Market Leaders (2015)
Country (HQ)
Company Production (MW) in 2015 Rank
China GCL 14,495 1
China Xi’An Longi Silicon 5,675 2
China LDK Solar 4,800 3
China Jinko Solar 3,225 4
China Yingli 2,452 5
Taiwan Green Energy 2,325 6
China Renesola 2,000 7
China Jiangxi Sornid Hi-Tech
2,000 8
China Trina Solar 1,800 9
China Huantai Silicon 1,600 10
Source: PV Magazine [207] *One wafer approximately equals 5Wp [212]
5.3.2 Key Wafer Cost Model Inputs and Assumptions
Table 21 below gives the key inputs into the wafer cost model. Most of the numbers are based on NREL’s 2015 estimates, adjusted for Indian conditions.
Table 21: Wafer Inputs (India)
Variable Unit Value Source
Ingot and Wafer Production Million 240,000,000.00 Assumed
Wafer area m2 0.0155 NREL
Wafer thickness microns 140 NREL
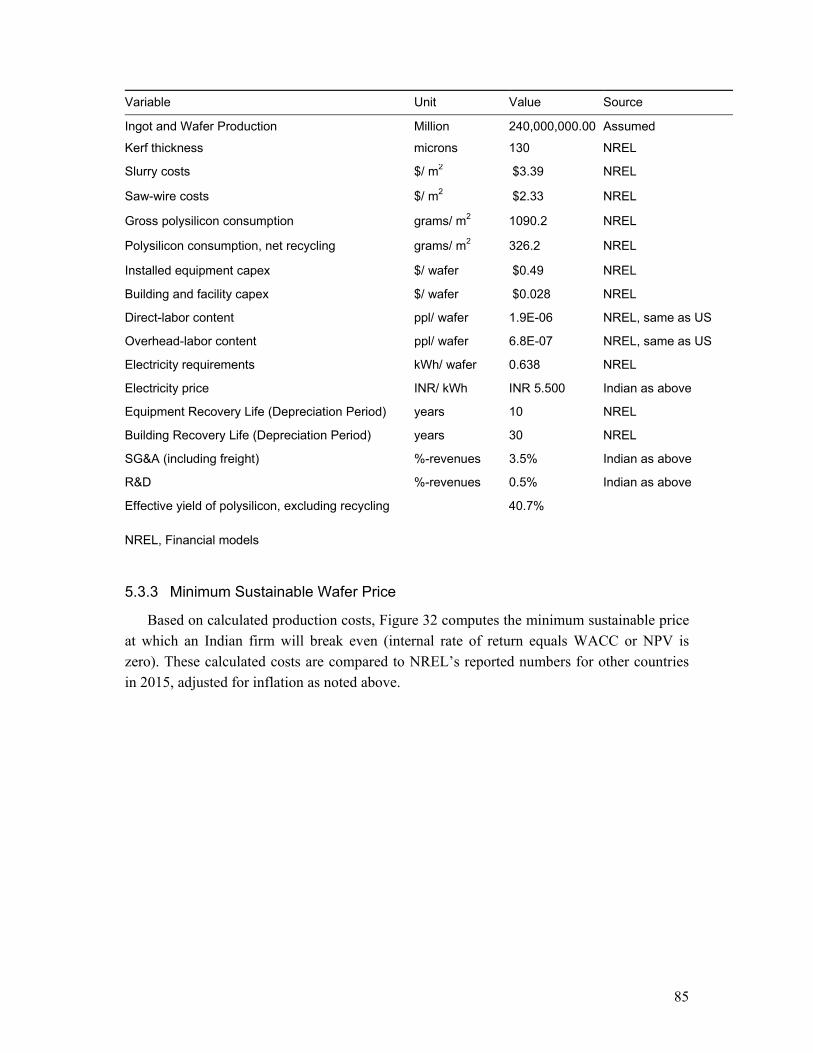
85
Variable Unit Value Source
Ingot and Wafer Production Million 240,000,000.00 Assumed
Kerf thickness microns 130 NREL
Slurry costs $/ m2 $3.39 NREL
Saw-wire costs $/ m2 $2.33 NREL
Gross polysilicon consumption grams/ m2 1090.2 NREL
Polysilicon consumption, net recycling grams/ m2 326.2 NREL
Installed equipment capex $/ wafer $0.49 NREL
Building and facility capex $/ wafer $0.028 NREL
Direct-labor content ppl/ wafer 1.9E-06 NREL, same as US
Overhead-labor content ppl/ wafer 6.8E-07 NREL, same as US
Electricity requirements kWh/ wafer 0.638 NREL
Electricity price INR/ kWh INR 5.500 Indian as above
Equipment Recovery Life (Depreciation Period) years 10 NREL
Building Recovery Life (Depreciation Period) years 30 NREL
SG&A (including freight) %-revenues 3.5% Indian as above
R&D %-revenues 0.5% Indian as above
Effective yield of polysilicon, excluding recycling 40.7%
NREL, Financial models
5.3.3 Minimum Sustainable Wafer Price
Based on calculated production costs, Figure 32 computes the minimum sustainable price at which an Indian firm will break even (internal rate of return equals WACC or NPV is zero). These calculated costs are compared to NREL’s reported numbers for other countries in 2015, adjusted for inflation as noted above.

86
Figure 32: Wafer Production Costs and Minimum Sustainable Price for India
The chart shows that India is somewhat comparable to the United States and China in production cost and, with some incentives as shown, could be competitive at the going spot price of $0.89. Market analysis also shows that there is a shortage in the wafer supply, creating space for new entrants. This is as a result of the fact that most wafer producers consume most of the wafers produced in their own associated solar cell plants. However, according to Swanson, author of the “Swanson effect”33, this opportunity in the wafer sector may be short-lived as market opportunities across the value chain have been dynamic in recent years and are expected to continue to be [213]. Shortages quickly get filled and lead to oversupply, which may be the case by the time any new plant in India comes online. Moreover, at an entry barrier of about $120M, countries that have long had a semiconductor business and thriving wafer manufacturing sector have an advantage, as was the case for polysilicon manufacture.
5.3.4 Wafer Sensitivity Analysis at Spot Price
Table 22 below shows wafer spot process used in calculations. At an average spot price of $0.89 for mono crystalline solar wafer, the model produces an internal rate of return of -11.23%, which is below the WACC of 15.07, making the firm unprofitable.
Table 22: Wafer Spot Price (June 1 2016)
Item High Low Average 156 mm Multi Solar Wafer 0.90 0.80 0.835 156 mm High Eff. Multi Solar Wafer 0.90 0.82 0.842 156 mm Mono Solar Wafer 0.96 0.85 0.890 125 mm Mono Solar Wafer 0.61 0.57 0.587
Source: PVInsights [23]
33
The Swanson Law predicts that the price of solar photovoltaic modules tends to drop 20 percent for every doubling of cumulative shipped volume.
NREL’s analysis

87
5.3.5 Wafer Policy Incentive Analysis at Spot Price
Assuming policy makers want Table 23 shows various policy alternatives and their respective costs.
Table 23: Wafer Optimal Policy Analysis at Spot Price
Policies Cost
Threshold High Default Low Threshold High Default Low
Tax holiday (years)
3.00 10 5 3 0.00 0.00 0.00 0.00
Capital subsidy (MSIPPS)
37% 50% 20% 0 55.19 75.57 30.23 0.00
Interest rate subsidy
9.00% 8% 12.50% 12.50% 15.01 15.01 0.00 0
Electricity subsidy 5.47 0.75 5.5 5.5 0.35 23.46 0.00 0
Threshold policy (recall the threshold subsidy solution in polysilicon discussion) in this
case requires a combination of a three-year tax holiday, 37% capital subsidy, 9% interest rate and electricity subsidy at 5.47. The total cost of this intervention is about $70.53 M for 240 million wafers or $0.3/ Wafer. However, the value added to the economy, which is computed using the production approach for GDP calculation (i.e. net present value of earning before tax, interest and depreciation (EBITDA)) is only about $55.03M (ten years at 15.07% WACC). Therefore even though the policy could help an Indian firm to break even at spot price under the circumstances described in the model, the returns estimated herein may not justify the cost.
This result however suggests that wafer manufacturing is more viable than polysilicon in India and could be even more viable if import duties on polysilicon inputs are reduced.
5.4 Cell and Module Cost Analysis
5.4.1 Cell and Module Market
Most of the big players in the cell and module markets have existing manufacturing capacity for both. At a 120 MW and $8-12 million basic minimum entry, the entry barrier for modules is much lower than for cells, which are around 400 MW and $100-130 million. This gives occasion for many more marginal players in the module market than the cell market. According to NREL, as of 2014, based on the Herfindahl–Hirschman index (HHI), there were 59 and 71 effective competitors in the cell and module markets respectively [126].
Nonetheless, only six producers control about 50% of the cell-module market share. These predominantly Chinese firms - Canadian Solar, Hanwha Q CELLS, JA Solar,

88
JinkoSolar, Trina Solar and Yingli Green – are known now as the ‘Silicon Module Super League’ [214].
Table 24: PV Market Leaders (2015)
Locations Company Technology Cell Capacity (MW)
Module Capacity (MW)
Rank
China/ Netherlands Trina Solar c-Si 3,700 5,100 1
China/ Germany/ Malaysia/ South Korea
Hanwha Q Cells c-Si 4,300 4,300 2
China/ Malaysia JA Solar c-Si 4,000 4,000 3
China Canadian Solar c-Si 2,700 4,300 4
Taiwan/ Malaysia Jinko Solar c-Si 3,000 4,700 5
US/ Malaysia First Solar CdTe/ c-Si 3,160 2,900 6
China Yingli Green c-Si 2,450 2,450 7
Taiwan/ China Motech Solar c-Si 2150 1400 8
Taiwan/ China Neo Solar c-Si 2,120 500 9
China/ US Shungfeng Suntech
c-Si 1,800 2,000 10
Source: Renewable Energy World [215]
5.4.2 Key Cell Model Inputs and Assumptions
For a new cell manufacturing plant in India, Table 25 below gives the key inputs into the cost model. Most of the numbers are based on NREL’s 2015 estimates, adjusted for Indian conditions.
Table 25: Cell Inputs and Assumptions (India)
Variable Unit Value Source
Cell Production Wp 500,000,000.00 Assumed
Wafer thickness microns 140
Wafer diameter m2 0.0155
Cell efficiency 22.0%
Wafer Price 0.22 Spot price plus MFN import duty of 10%
Metallization (including TCO for HIT cell) $/ WP DC $0.047 NREL
Other cell materials $/ WP DC $0.056 NREL
Installed equipment capex $/ WP DC $0.53 NREL
Building and facility capex $/ WP DC $0.03 NREL
Direct-labor content ppl/ MWP DC 0.101 NREL
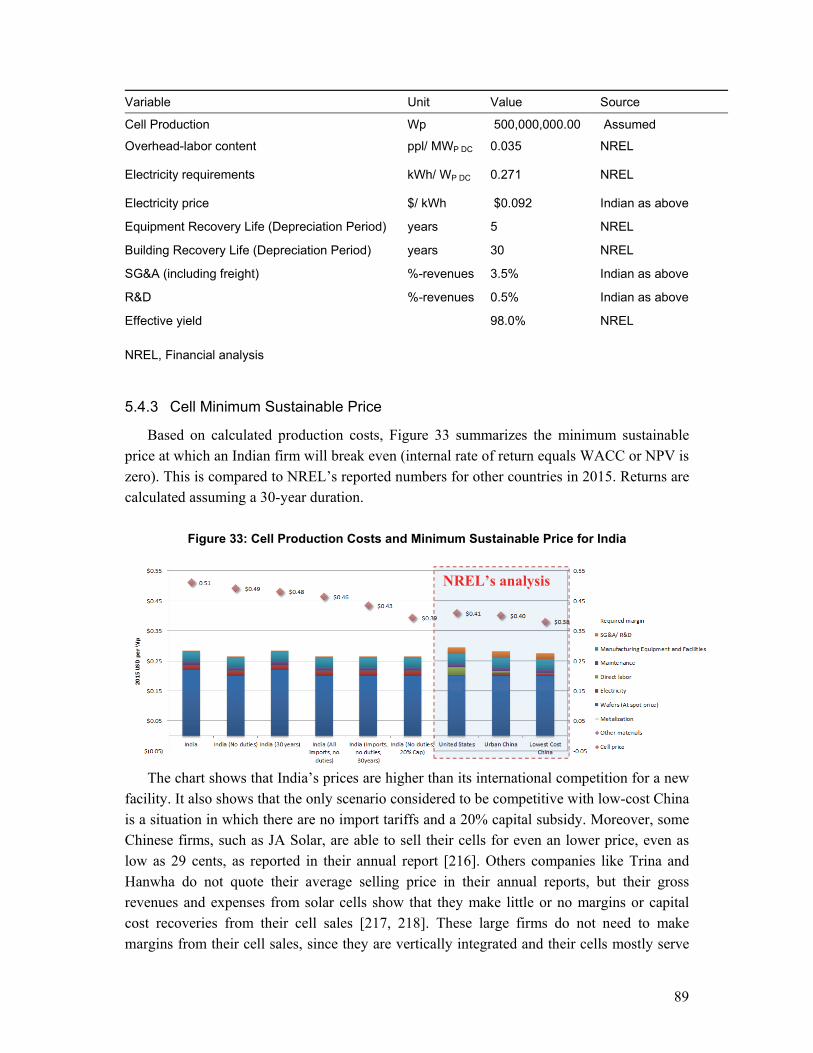
89
Variable Unit Value Source
Cell Production Wp 500,000,000.00 Assumed
Overhead-labor content ppl/ MWP DC 0.035 NREL
Electricity requirements kWh/ WP DC 0.271 NREL
Electricity price $/ kWh $0.092 Indian as above
Equipment Recovery Life (Depreciation Period) years 5 NREL
Building Recovery Life (Depreciation Period) years 30 NREL
SG&A (including freight) %-revenues 3.5% Indian as above
R&D %-revenues 0.5% Indian as above
Effective yield 98.0% NREL
NREL, Financial analysis
5.4.3 Cell Minimum Sustainable Price
Based on calculated production costs, Figure 33 summarizes the minimum sustainable price at which an Indian firm will break even (internal rate of return equals WACC or NPV is zero). This is compared to NREL’s reported numbers for other countries in 2015. Returns are calculated assuming a 30-year duration.
Figure 33: Cell Production Costs and Minimum Sustainable Price for India
The chart shows that India’s prices are higher than its international competition for a new
facility. It also shows that the only scenario considered to be competitive with low-cost China is a situation in which there are no import tariffs and a 20% capital subsidy. Moreover, some Chinese firms, such as JA Solar, are able to sell their cells for even an lower price, even as low as 29 cents, as reported in their annual report [216]. Others companies like Trina and Hanwha do not quote their average selling price in their annual reports, but their gross revenues and expenses from solar cells show that they make little or no margins or capital cost recoveries from their cell sales [217, 218]. These large firms do not need to make margins from their cell sales, since they are vertically integrated and their cells mostly serve
NREL’s analysis

90
as an input into their module businesses. Following this premise, a vertically-integrated Indian firm could probably be able to produce cells to serve its domestic module manufacturing business, but the value add of supporting this with policy is questionable as shown in the following section.
5.4.4 Cell Optimal Policy Analysis at Spot Price
Table 26 below shows the cell spot prices used in different calculations. At spot average spot price of $0.29 for standard solar cell, the model yields a negative net present value of -$323 M for the 500MW per year capacity cell plant.
Table 26: Cell Spot Price (June 1 2016)
Item High Low Average Multi Cell Price Per Watt 0.38 0.27 0.290 Taiwan Poly Cell Per Watt 0.38 0.28 0.293 156 mm Multi Solar Cell 1.71 1.13 1.281 156 mm Mono Solar Cell 2.00 1.46 1.553 125 mm Mono Solar Cell 1.24 0.86 0.938
Source: PVInsights [23]
Table 27 shows various policy alternatives and their respective costs. The table shows high, low and default (status quo) levels of corporate income tax holiday, capital subsidy, interest rate subsidy and electricity subsidy. The right section shows the cost to government to implement these policies.
Table 27: Cell Threshold Policy Analysis at Spot Price
Policies Cost (Mil USD)
Threshold High Medium Low Threshold High Medium Low
Tax holiday (years)
10 10 6 3 0.00 0.00 0.00 0.00
Capital subsidy (MSIPPS)
71% 50% 20% 0 248.69 349.91 69.98 0.00
Interest rate subsidy
9.00% 8% 10.50% 12.50% 1.11 1.11 0.64 0
Electricity subsidy 0.75 0.75 3.5 5.5 11.47 11.47 4.83 0
This analysis shows that the company is not viable even at the highest level of feasible
support and only becomes viable at a capital subsidy of 71%, an interest rate of 9% and subsidized electricity of INR 0.75. The total cost of this threshold policy combination is about $261 M for 500MW cell capacity, which is significantly more than the value added to the economy of approximately zero dollars (net present value of earnings before tax, interest and depreciation).

91
This finding verifies the interview finding that pure play cell firms in India would most likely not be profitable. Cash incentives, despite what some of the interviewed stakeholders believed, are not likely to solve this challenge.
5.4.6 Module Manufacturing: Key Inputs and Assumptions
Moving on to module manufacturing, Table 28 gives the key inputs and assumptions used in the module-manufacturing model. Most of the numbers are based on NREL’s 2015 estimates, adjusted for Indian conditions.
Table 28: Module Inputs and Assumptions
Variable Unit Value Reference
Plant Capacity Wp 200,000,000.00 Assumed
c-Si Cell $/Wp 0.38 CSTEP
Other inputs $/Wp 0.10 CSTEP
Direct-labor content ppl/ MWP DC 0.125 NREL
Overhead-labor content ppl/ MWP DC 0.044 NREL
Electricity requirements kWh/ WP DC 0.012 NREL
Electricity price $/ kWh $0.09 Assumed
Installed equipment Capex $/ WP DC $0.03 NREL
Estimated Cost of Factory INR/Sqm 8,000.00 Estimate validated by interview
Land Requirement Sqm/MWp 20 Based on Interviews
Size of Facility Per MWp Sqm 20 Based on Interviews
Effective yield 97.0%
Equipment Recovery Life (Depreciation Period)
years 7 NREL
Building Recovery Life (Depreciation Period)
years 30 NREL
5.4.7 Minimum Sustainable Module Price
Based on calculated production costs, Figure 34 shows the minimum sustainable price at which an Indian firm will break even (internal rate of return equals WACC or NPV is zero). This is compared to NREL’s reported numbers for other countries in 2015.

92
Figure 34: Module Production Costs and Minimum Sustainable Price for India
The chart shows that Indian firms are somewhat competitive, with the main gap being the
additional costs of obtaining raw materials. Firms that import face an MFT import duty of 10%, which raises their cost relative to the competition. Removing duties reduces costs and increases the competitiveness of firms.
5.4.8 Module Policy Analysis at Spot Prices
Table 29 below shows module spot prices used in calculations. At an average spot price of 0.512 for standard 60 180micron cell module, Indian firms are not competitive.
Table 29: Module Spot Price (June 1 2016)
Item High Low Average
Poly Silicon Solar Module 0.69 0.45 0.512
Thin Film Solar Module 0.69 0.45 0.537
Source: PVInsights [23]
Sensitivity analysis shows that the returns to firms are very sensitive to input costs. Just a 10% reduction in input cost leads to profitability even at a stiff spot price. If Indian firms simply import cells at the average spot price to produce modules, they would be profitable at the prevailing spot price.
Threshold policy analysis shows that at the spot price, the firm only becomes viable at a capital subsidy of 70% and electricity cost of 0.75 as shown in Table 30. However, the value added to the economy is negative, as the firm never makes a profit in its 10 years of operation at the present input prices, therefore the capital expenditure of about $11.61M (for 500MW) is not supported. However, compared to cells and polysilicon, module manufacturing is still closer to viability and is comparatively a safer bet for industrial policy support.
NREL’s analysis

93
Table 30: Module Optimal Policy Analysis at Spot Price
Policies Cost (Mil USD)
Threshold High Medium Low Max High Medium Low
Tax holiday (years)
10.00 10 5 3 -
- - -
Capital subsidy (MSIPPS)
70% 50% 20% 0% 5.08
3.63 1.45 -
Interest rate subsidy
12.50% 8% 12.50% 12.50% -
1.70 - -
Electricity subsidy INR 0.75 0.75 5.5 5.5 6.53
6.53
- -
The major cost driver for this part of the value chain is the input cost, and available policy
incentives are insufficient to make module production competitive if they do not directly subsidize raw materials or ease the cost of transportation or other costs that directly impact the cost of raw materials.
5.5 State Policies
This section illustrates the existing policy mechanisms available in various states to produce the required incentives discussed above. Table 31 below shows the industrial policy incentives available to solar manufacturers in the top ten Indian states identified for analysis. States were selected based on their comparatively higher level of activity in the solar industry as measured by solar resources, current deployment and policies and doing business index.
Table 31: Industrial Policy Incentives in 10 most active states
Capital Subsidy (%)
Capital Subsidy Limit (‘000 USD)
Interest Rate subsidy
VAT Exemption
Land Incentive
Stamp duty exemption
Electricity duty exemption
Gujarat 10% 25 7% for 5 years
- - - -
Andhra Pradesh
25% - - 50% for 7 years
- 100% -
Jharkhand 20% - 5% for 5 years
80% - - -
Chhattisgarh 35% 183 50% for 5 years
- 20% on land premium
100% 100% up to 7 years
Madhya Pradesh
50% 42 5% 75% for 10 years
100% -

94
Capital Subsidy (%)
Capital Subsidy Limit (‘000 USD)
Interest Rate subsidy
VAT Exemption
Land Incentive
Stamp duty exemption
Electricity duty exemption
Rajasthan 30% - - 50% on plant and machinery
50% on land tax
50% 50%
Odisha - 5% for 5 years
100% for 7 years
- 100% 100% for 5 years
Maharashtra - - 5% - - 100%
Karnataka - - Full VAT & CST (7-9 years)
50% on plant and machinery
- 75-100 % 100 % for 6 years
Uttar Pradesh
- - -5% - - - 100% for 7 years
Source: Industrial policy document of each state [210, 219-226] Analyses of various state industrial policies, using the financial models described in this
section, show that the incentives provided do not have a significant effect on firm viability in any of the states. This is often because the thresholds of support are insignificant relative to the scale of the investment required. However, it is possible that while the incentives do not help firms become profitable, firms may yet consider the scale of the incentive in determining their location. In this regard, Chhattisgarh and Rajasthan provide very compelling incentives for potential investors.
5.6 Conclusion
The analysis in this chapter shows that, from a financial viability standpoint, Indian firms are not viable across the value chain at present international spot prices. This is assessed in the context of calculation of MSP and NPV at spot prices. Across the scenarios considered herein, including use of capital subsidies, interest subsidy, electricity subsidy, tax holidays, and different combinations of these mechanisms, viability comes at a very high cost.
The study, however, finds that modules can be viably manufactured if input prices are allowed to drop. This could occur if MFN input tariffs on cell imports are removed and firms get the default 20% capital subsidy, which they already obtain under the MSIPPS program.
State policies in each of the ten states examined also do not lead to viability. States looking to attract investment might want to look beyond hard incentives to address functional activities that affect the cost of acquiring raw materials. This could include transportation, import duties, value-added taxes, market transparency to facilitate fair pricing, skill development and infrastructure provision.

95
6. Recommendations and Conclusions
6.1 India’s Energy Access Challenge and the Potential for an Indian Domestic Solar Industry
Solving energy poverty remains a foremost development challenge in India and one that the Indian government is determined to tackle in ways that include a focus on environmental sustainability. Indian policy makers have developed policies to pursue large-scale solar manufacturing and deployment of solar generation facilities, with the target of achieving the installation of 100 GW of solar power by 2022. The policies, developed under a policy mission termed the Jawaharlal Nehru National Solar Mission (JNNSM), include financial incentives for manufacturing and deployment. This thesis assesses the financial feasibility of locally manufacturing and deploying solar products.
The analysis in this study suggests that, while upstream raw material and component manufacture is not cost competitive and is unlikely to be competitive in the foreseeable future, the manufacture of downstream products is nearly competitive with global costs. could be cost competitive, relative to coal for instance, based on standard assumptions for the health and environmental costs of coal. The levelized costs of solar and coal are assumed to stay constant over 15 years. This is a conservative forecast as the cost of coal is widely expected to continue to increase, while the cost of solar may well continue to decrease over time.
The Indian Government has also been interested in leveraging large-scale solar deployment into development of a domestic solar industry, and has pursued policies that aim to stimulate, protect and incentivize the manufacturing facilities in India. These policies included a domestic content requirement in central government (JNNSM) solar generation tenders, larger viability gap funding for domestic projects and anti-dumping duties on imported solar modules and cells. The key finding of the study is that India is not presently competitive in production of polysilicon and cells but could potentially be competitive in manufacturing wafers and modules. We also use our findings to generate a discussion on the usefulness of industrial policy interventions in the solar industry. The study finds that the cost of industrial policy intervention may be high for the value added, from a strictly financial point of view. From a comparative advantage point of view, it finds that modules have been competitive in past years, but other steps in the supply chain are not. Table 32 below summarizes the research findings based on the specific research questions and analysis conducted. The “street light” color code shows the intensity of the research finding with deep red being the least favorable, green being favorable and orange being moderate. The text in the barriers and enablers section is also color coded with red representing barriers and green enablers.

96
Table 32: Summary of Findings by Research Question
Research Question
Polysilicon Wafer Cells Modules
Are Indian firms internationally competitive?
No No No Was competitive before 2010
What are the barriers/enablers? Up front
capital cost Electricity
intensity/ cost Finance Technical
Up front capital cost
Technical Labor
intensive
Up front capital cost
Finance Low
demand DCR MSIPS
Import duties on inputs Overcapacity in China
flooding the market Cheap labor Demand from solar
mission public procurement, VGF and state policies
Cost of Industrial Policy?
Very High Moderate Duty removal
High Moderate Duty removal 20% MSIPS capital
subsidy
The following sections reiterate the key results of the study and highlight its contributions
to literature, relevance to policy, limitations and potential areas for future research.
6.2 India’s Comparative Advantage in the Solar Manufacturing Chain
Based on a revealed comparative analysis (RCA), our study finds that India is not competitive in the upstream segments of the solar PV value chain, from production of polysilicon to module manufacturing. An RCA score of over one would show that India has a revealed comparative advantage in a sector. During the period evaluated (2006-2015) the study found that India’s RCA ranged from 0.13-1.07 for modules, 0.001-0.22 for cells, 0.01-0.07 for wafer machines, 0.42-0.99 for ingot casting machines and 0.00 for polysilicon.
An interesting finding is that, up to 2010, India had been competitive in module manufacturing. During the period, India had a peak RCA of 1.07 in 2008, which shows actual revealed comparative advantage. More importantly, trade balance and specialization were positive for the entire period 2006-2010. Changes in global markets subsequently removed this advantage. This finding suggests there may be some comparative advantage there, which may have been crowded out by industrial policy-induced economies of scale and overcapacity in China.
The RCA results, especially when coupled with interview findings, suggest that module manufacturing in India may be on par with manufacturing elsewhere, provided input costs are similar. Module manufacturing (or assembly) is a relatively less technically-rigorous process than other stages of PV production and hence is easier to develop, which probably explains the large number of players in the sector. Cell manufacturing, on the other hand, is technically rigorous and has thus not been very successful in India. It is also improbable given the level of research and development in the sector that current domestic firms would be able to cut down on costs through technology innovation, which could make them more

97
competitive internationally. Polysilicon ingots and wafers, while not currently produced in India, could potentially be competitive based on activity in complementary industries, but the high capital investment and skill required at this level may represent barriers.
6.3 Cost of Industrial Policy across the Value Chain
I argue in the thesis that the case for hard industrial policy (see Chapter 2) depends on the presence of public goods. I make the case that the question of whether industrial policy may be right for India’s solar industry comes down to a few factors: 1) is there a latent comparative advantage in the sector, 2) are there sector-level rents to be earned by solving specific externalities, and 3) is there the possibility of future benefits that exceed the cost of solving these externalities discounted over time.
As noted above, we found that India recently lost its (revealed) comparative advantage in module manufacturing. I also discussed how this finding is limited in that it does not adequately get at the question of latent comparative advantage. I next turn to the questions of sector-level rents and discounted future benefits of industrial policy. What will it cost the government if it chooses to support the sector’s viability? I find that the removal of import duties on inputs such as cells, coupled with 20% capital subsidy already budgeted under the government’s modified special incentive scheme (MISIPS), will accomplish this goal. Tax holidays, capital subsidies, interest rate rebate and electricity subsidies alone, without variable cost intervention such as removal of duties may not work. An exemption from import duties may be viewed unfavorably by cell manufacturers in India, as cells constitute the highest value input for module manufacturing, which may be sourced cheaper on the international market than in India.
Wafer manufacturing is another sector that is close to competitiveness, which could be made viable upon removal of the 10% import duties on polysilicon and stimulated by the facilitation of low-interest finance and the MSIPS capital subsidy. Although the viability study does not specifically require financial support, it may be found necessary, as a start-up cost of close to $120M may be considered high for potential investors.
Polysilicon and cell manufacturing do not appear to have enough margins to justify the cost of industrial policy actions that may lead to viability for firms playing in these sectors. These findings, and the fact that the skills (both commercial and technical) required to be competitive in each step of the supply chain are vastly different make the prospect of vertical integration unlikely.
6.4 Limitations and Opportunities for Future Research
One of the interesting findings of this study is the logical consistence of the results of the revealed comparative advantage, expert opinion and cost analysis. All three pieces of analysis indicated that module manufacturing in India is relatively viable and can be expected to grow with little or no government interference. Both RCA and cost analysis also agree that ingot/wafer production has the potential to be viable in India, while cells and polysilicon are less close to competitive. However, while what we found is consistent and logical, it is

98
necessarily limited in scope and other areas of research/inquiry could provide additional insight into alternative policies that might be more effective.
Chapter 3’s findings show that India does not have a revealed comparative advantage but does not show if it has a latent comparative advantage, which is considered a pre-requisite for considering industrial policy. To get at the question of latent comparative advantage, future research could consider growth in patents and skilled workforce produced over time in disciplines relevant to the value chain. These would include material sciences and engineering, electrical engineering, chemical engineering, applied physics, physics and chemistry, among others STEM disciplines. This is an emerging area of inter-disciplinary study, with leading research centers such as NREL in the US sponsoring ground-breaking research investigating questions such as modeling PV performance, methods for module recycling, new multi-junction solar cell architectures, designs and novel ways of charge separation and extraction, light trapping or device design. Other emerging areas of research include the use of big data and behavioral research in solar cost reduction. Big data for instance may be useful for material design, solar resource measurement and reliability forecasting. Behavioral research could be useful for customer acquisition, improving relationships between key stakeholders such as solar installers, customers, financiers, government and electric utilities [227].
Future studies may also want to examine what different technology options and specific software and downstream opportunities best lend themselves to India’s current and future technical abilities and therefore the potential to achieve international competitiveness. For instance, India could turn to thin-film technologies, which hold the potential to be more effective in India due to their better temperature coefficients34 and light-weight, provided India can quickly get ahead of the learning curve and improve the cost of the technology. Solar thermal energy was not considered in this study as its manufacturing value added is not high and the cost of deployment is higher than PV technologies. It is also less portable and hence inadequate for India’s unique problem of serving remote electrified villages with mini grids and standalone systems, due to high connection costs. Newer innovative technologies such as gas to wafer and fourth generation thin-film technologies represent areas of potential research that, though not yet commercial, have the potential to change the competitive landscape of solar like cSi did for China in the present era. India could also perhaps lead in the use of big data research in solar in addition to a number of smart grid solutions that it can develop and export, including leveraging its software and outsourcing dominance.
The cost of industrial policy findings are also limited in that they evaluate mostly from a financial viability standpoint and do not estimate the value of intangibles such as the prestige of having a vertically-integrated and internationally-competitive solar industry; benefits include potential future market power/ security of supplies spill-over effects and learning by doing. Developing methods to estimate these benefits for the solar supply chain was beyond the scope of this study but may represent an interesting area of future research.
34 Thin-film technologies like Amorphous Silicon perform better in high temperatures than cSi based PV

99
A key objective of the Make in India drive is jobs creation. This study does not value jobs created as these are counted as costs to the manufacturer. Moreover, other studies have shown that more jobs are created on the deployment end of the supply chain than the manufacturing end (1.7x and 3x job-years in utility scale rooftop respectively)[43], making it less of a factor for incentivizing manufacturing over deployment. Conversely, the jobs argument seems to favor focusing on deployment of the cheapest solar modules accessible, regardless of their origin, as this tends to create more job years. However, a detailed study of the implications of such a focus for long-term skill development is also beyond the scope of this work.
6.5 Policy Relevance and Conclusions
The pursuit of high value-added production is important for every country, and policy makers have a responsibility to their constituents, where reasonable, to support value creation. However, the findings of this study point out that well-intentioned policies to increase manufacturing in India’s solar sector may indeed be inefficient or harmful in certain instances, and policy makers need a reliable framework for assessing such alternatives. This study has presented a framework for conducting such an analysis for the solar manufacturing supply chain.
Policy makers should not lose sight of the original intentions of addressing energy poverty and increasing national productivity by moving to higher value work. There is the potential that other soft industrial policy approaches may be more effective in achieving these goals. A few of these areas of soft industrial policy are discussed throughout the study, especially in interviews, but not explicitly tested. These include research and development support to remove knowledge externalities, industrial parks (clusters) to avail firms of product, market and knowledge spillovers, and interventions to solve coordination and sequencing externalities and capital market imperfections. Future work may want to test the efficacy of soft industrial policies as more data becomes available.
Such a study could examine if there is an association to be found between policies being implemented, such as solar industrial parks, and growth in exports over the next few years. Future work could also explore patent data over the next few years following any significant R&D support. The efficacy of market coordination interventions such as enforcing warranties for solar projects and manufacturing, supporting solar insurance markets and standards testing to ensure the integrity of grid-based projects and hence their bankability, could also be examined by reviewing uptake and private sector co-funding attracted from such interventions.
India may not presently lead the world in solar manufacturing, but solving energy poverty, while preserving the environment through greater reliance on solar power, could be a worthy goal in and of itself. Solar energy may have the potential to stimulate future manufacturing competitiveness in this and other sectors as well.

100
Appendices
Appendix I: Policies
Detailed Solar Policies
China
China leads the world in PV production across the value chain, with five of the big six module manufacturers, Trina Solar, JA Solar, Yingli Green, Jinko Solar and Hanhwa Q Cells, coming from China. It also topped annual capacity additions for 2014. Policies for encouraging renewable energy in China are largely driven by the central government, and enacted through national and provincial and local government programs. These include:
Table 33: Some Solar Manufacturing and Deployment Policies in China
Category Description
Deployment support
BIPV (Building-integrated photovoltaics) subsidy program, offering upfront RMB20/watt for BIPV systems and RMB15/watt for rooftop systems
Golden Sun: $428 million (¥4,821 million), financed 50% subsidy for grid based and 70% off-grid solar
Feed-in tariff by Jiangsu Province: $268 million (¥3,017 million) Loan guarantees for utilities by government held parent group Reduced Corporate Income Tax (CIT) rate of 15% is given for qualified
advanced and new technology enterprises including solar 10 percent of the amount invested in the qualified equipment is credited
against CIT payable for the current year, with any unutilized investment credit eligible to be carried forward for the next five tax years if such equipment is qualified as special equipment related to environmental protection, energy
The Enterprise Income Tax law (EIT) provides tax exemptions for 2 years and a 50% tax reduction for the next three years to the registered PV companies.
Manufacturing
The Government of China provides loans at very low interest rates (1-2%) with an extended credit limits (up to 20years). Chinese manufacturers received $34-$40 billion between 2010- Q2 2011 alone Research and development on testing operations are limited to companies with design capacities while wind turbines manufacturers should meet the requirements of the wind power technology standards and follow the Environmental Impact Assessment law.
Chinese Ministry of Science and Technology through central government provided $18 million for R&D on solar technologies for the period of 11th Five Year Plan
The Chinese government initiated the International Science and Technology Cooperation Program in Renewable Energy to boost Chinese technological development. The program aims to introduce cutting-edge technologies in the national market, attract overseas scientists and develop exchange program with international research centers.
Buy Chinese procurement policy for domestic infrastructure projects.

101
Mandates that 80 per cent of the solar equipment and auxiliary materials for its own use to be produced domestically35
Provision of Polysilicon for LTAR (less than adequate remuneration): Polysilicon is provided to producers of solar cells at a lower cost than an adequate market-price36
Provision of Land for LTAR: Solar manufacturers were given subsidised land e.g. Suntech was awarded 3000 acres and Trina Solar was awarded 7000 acres for their respective projects.
“Two Free, Three Half” Programme for Foreign-Invested Enterprises: This programme allows full exemption of income tax for two years besides 50 per cent rebate for three years
Preferential Tax Programs for High or New Technology Enterprises: Income tax reduction from 25 per cent to 15 per cent
Import Tariff and Value Added Tax (VAT) Exemptions for Use of Imported Equipment
VAT Rebates on FIE Purchases of Chinese-Made Equipment: Value Added Tax exemption for Chinese Equipment bought by foreign-invested enterprises
Sub-Central Government Subsidies for Development of “Famous Brands” and “China World Top Brands”: Lumpsum awards to companies that become famous internationally (2010)
The government encourages early joint ventures with foreign manufacturers. Clean Energy Research and Development Programs
Key Technology R&D Program (1982): Almost $1 billion was invested between 2001 and 2005.19
863 Program, National High-Tech Development Plan (March 1986): Invested $3 billion in research from 2001 to 2005, and another $585 million was approved in 2008 jointly for the 863 and 973 R&D programs
973 Program, The National Basic Research Program: Funded 382 projects between 1998 and 2008, with a total investment of $1.3 billion
Five-Year Plans: The 11th FYP (2006 to 2010) and the 12th FYP (2011 to 2015) focus on seven new “Strategic Emerging Industries” supported with preferential tax, fiscal and procurement tools (Chinese government has dedicated a combined fund of US $1.5 trillion for its seven strategic emerging industries). These include biotechnology, new energy (i.e., nuclear, solar, wind power, biomass), High-end Equipment Manufacturing, Energy Conservation and Environmental Protection (i.e., energy efficiency, advanced environmental protection, recycling)
Sources:[101], [108], Other sources in text
USA
Much of the U.S. renewable electricity installed capacity is a result of state deployment initiatives rather than federal programs, with 30 states having a renewable portfolio standard (RPS) in place to encourage deployment. However, the availability of federal tax incentives has aided deployment in recent years, with the Investment Tax Credit 104 (ITC) being key to much of the investment in solar PV installations. The US also provides a range of incentives to manufacturers both at the state and national levels. These include but are not limited to the following:
35
http://www.downtoearth.org.in/content/sunshine-sector-loses-sheen?page=0,3 36
http://origin.www.uscc.gov/sites/default/files/Research/Staff%20Report_China's%20Wind%20and%20Solar%20Sectors.pdf

102
Table 34: US Policies to Support Solar Energy Manufacturing and Deployment
Category Description
Distributed Solar
Net Metering: Net metering allows residential and commercial customers who generate their own electricity from solar power to feed electricity they do not use back into the grid. 43 states and DC have net metering as at 2013
Property-Assessed Clean Energy: PACE is a voluntary program in which a home or business owner will receive financing from a local government to cover the up-front cost of qualified energy improvements, and in exchange, will repay the up-front cost through a special assessment on their property tax over a period of years or decades. The financing is secured with a lien on the property.
Rebates & Incentives: some states offer up-front rebates administered by state agencies or utilities, and still others offer performance-based incentives that are paid by an agency or utility over time based on kWh production
Finance & Tax
1603 Treasury Program: The 1603 Treasury Program is a technology-neutral finance mechanism that allows solar and other renewable energy project developers to receive a direct federal grant in lieu of the Section 48 Investment Tax Credit (ITC). As of December 2013, the Treasury Department had awarded more than 9,000 grants totaling $18.5 billion, $4.4 billion of which went to solar projects. A preliminary analysis by the National Renewable Energy Laboratory's (NREL) conservatively estimated that the 1603 Program has supported an average of 52,000 to 75,000 jobs over the period analyzed.
Depreciation of Solar Energy Property: Modified Accelerated Cost Recovery System (MACRS), established in 1986. Qualifying solar energy equipment is eligible for a cost recovery period of five years. For equipment on which an Investment Tax Credit (ITC) or a 1603 Treasury Program grant is claimed, the owner must reduce the project’s depreciable basis by one-half the value of the 30% ITC. This means the owner is able to deduct 85 percent of his or her tax basis.
DOE Loan Guarantee Program: The DOE Loan Guarantee Program was created in 2005 under the Energy Policy Act of 2005 to overcome the great challenges that large energy projects face in obtaining affordable long-term financing.
Solar Manufacturing Incentives: The 2009 American Recovery and Reinvestment Act (ARRA) included a competitive tax credit capped at $2.3 billion in total tax expenditures for advanced energy manufacturing projects (Section 48C).
Solar Investment Tax Credit: 30 percent tax credit for solar systems on residential (under Section 25D) and commercial (under Section 48) properties. ITC was implemented in 2006 – leading to a compound annual growth rate of 76 percent and continues till 2016
Solar Tax Exemptions: 38 states and 29 states offer property and state tax exemptions for renewable energy respectively.
Third-Party Financing: Third-party financing of solar energy primarily occurs through two models: power purchase agreements (PPAs) and solar leases.
Commence Construction Modification: Commence Construction Modification is an adjustment to allow projects covered under Section 48 to qualify for the ITC if construction on the project begins prior to the statutory expiration of the 30% ITC (Dec. 31, 2016).
Clean Energy Research and Development Programs
National Research Council (2001): From 1978 through 1999, the federal government expended $91.5 billion (2000 dollars) on energy R&D, mostly through DOE programs.
On balance, the government has been the largest single source and stimulus of energy R&D funding for more than 20 years.105 DOE continues to be responsible for the largest share of federal energy-related research dollars, and administers the national laboratories and technology centers which are key to the execution of U.S. national energy research strategies.

103
Renewable Energy Deployment
Federal Clean Energy Contracting: 2009, the Senate Committee on Energy and Natural Resources passed on a bipartisan basis S. 1462, the American Clean Energy Leadership Act. Among the provisions, the Committee included expansion of federal power purchase agreement (PPA) authority to allow federal agencies to enter into PPAs for renewable energy for up to 30 years.
Federal DOE Appropriations Performance-Based Incentives: example is the California Solar Initiative,
where incentives are paid monthly over a 5-year period of time (60 total payments) based on the actual energy (kWh) produced by your solar energy system. T
Renewable Energy Standards: More than half of all U.S. states have some type of renewable energy standard or goal in place. National RES policies have been considered by Congress but have yet to be signed into law
Reverse Auction Mechanism: Introduced in 2011, Californias RAM allows bidders to set their own price and provides a simple standard contract for each utility.
Source: [228]
Germany
Germany continues to lead the world in solar deployments, having pioneered with feed in tariffs since its first passing of the Renewable Energy Sources Act (EEG) in 1991. German companies also benefit from a vibrant industrial base and strong infrastructure support (GTAI, 2013b). The EEG, which codifies its Feed-in tariff program and mandates priority purchase of electricity from renewables over conventional sources continues to ensure, the countries’ lead in deployment of renewable energy. On the manufacturing end the Joint Task and Investment Allowance programs; provide manufacturers with financial incentives to manufacture domestically – both through cash grants to locate manufacturing in different parts of Germany (GTAI, 2013a).Table 35 below details some of Germany’s policies to support their local Solar PV industry:
Table 35: German Policies to Support Solar Energy Manufacturing and Deployment
Category Description
Deployment Support
Feed in tariffs paid under EEG was worth up to €4,270 million ($3 billion) in present value from 2003-2009 Renewable Energies Loan Programme (KfW) for PV investments: Funding is provided for up to 20 years
Manufacturing and Cluster Formation Support
Innovation Alliance PV was founded in 2010 fosters alliances of specialized research institutions and the solar business community. Innovation projects range from the reduction of material costs for PV systems to production process optimization and the development of new products. Solar Valley Mitteldeutschland (2008): this initiative represents a cluster of solar energy stakeholders comprising more than 20 solar companies, 10 specialized research institutions, five universities, five colleges and three state-level ministries from the participating federal states of Saxony, SaxonyAnhalt and Thuringia. Cluster activities cover joint technology development efforts as well as solar-related education programmes. €650 million ($ 578m) allocated in 2011 for joint task progra, investment allowance (in Eastern Germany), reduced-interest loan by KfW and state development bank and public guarantees at the state and federal level Silent/ direct partnerships
Research Sixth Federal Energy Research Programme contributes to achieving national

104
and Development Support
energy and climate targets, enhance the leading position of German companies and widen technological options. Labor related subsidies such as wage subsidies, and training loans
Sources:[108], [109]
Indian States
Table 36: Solar Policies of Key Indian States
State Policy and Date Instituted
1. Andhra Pradesh Andhra Pradesh Solar Power Policy, 2015
2. Chhattisgarh State Solar Energy Policy, 2012-17 (Notified in 2012) 3. Gujarat Solar Power Policy, 2015, Notified on 13th August, 2015 4. Haryana Solar Power Policy, 2014, Notified on 4th September, 2014 5. Jharkhand Solar Policy, 2015, Notified on 10th August, 2015 5. Himachal Pradesh Solar Policy, 2014, Himachal Pradesh Solar Power Policy, 2014 6. J&K Solar Power Policy , Notified on 18.03.2013 7. Karnataka KarnatakaSolar Policy, 2011-16 (Notified on 01.07.2011)
Karnataka Solar Policy, 2014-21 (Notified on 22.05.2014) 8. Kerala Solar Energy Policy, 2013 (Notified on 25.11.2013) 9. Madhya Pradesh Solar Power Policy, 2012 Notified in 2012 10. Odisha Draft Solar Policy,2013 notified in 2013
11. Rajasthan Solar Energy Policy, 2011i) Notified on 19th April,2011ii) First Amendment dated 09.08.2011iii) Second Amendment dated 18.09.2012
12. Tamil Nadu Solar Energy Policy, 2012Notified in 2012 13. Telangana Telangana Solar Power Policy 2015
14. Uttarakhand Solar Energy Policy, 2013 Notified on 27.06.2013 15. Uttar Pradesh Solar Power Policy, 2013 Notified in 2013

105
Appendix II: Industrial Policy Theoretical Models
IP with Latent Comparative Advantage Static Model with Exogenous Prices
Assume a developing economy, called South, producing two goods 1 and 2. Good 1 has constant returns to scale (CRS) and good 2 has CRS at firm level, but Marshallian
externalities at aggregate level such that a unit labor (w, ) invested in good 1 produces λ1
units, while a unit of labor in good 2 (w, ) produces 1 , , where 0, , is total labor units supplied to producing good 2 and is the threshold number of units that can be invested in in good 2 with full cluster benefit (positive and negative externalities realized or removed). However, total labor supply + > ; 1 1, is therefore the maximum benefit
of clustering; and ∗ ∗
∗
For complete specialization in good 1, ∗ . At market wage, w, unit cost of producing
good 2, must be greater than ∗, which is exogenously determined, for the economy to
completely specialize in good 1. Therefore, substituting for w and dividing both sides by ∗, ∗
Similarly, for complete specialization in good 2, ∗ , unit cost of good 1 is
which must be greater than ∗. Therefore substituting w and dividing by ∗; ∗
Combining the two equilibriums; ∗ ∗ (1)
Therefore, if the condition in equation 1 above, holds with strict inequality, equilibrium with specialization in good 2 would be superior to good 1, since overall wages will be higher
in that equilibrium ( ∗ ∗ )
This means the economy has a latent comparative advantage in good 2 if the opportunity
cost of realizing the externalities is less than the international price.
Static Model with Prices Determined in the North Assume a scenario where the South is small and prices are determined in the North.
Choosing labor in the North as numeraire (1), prices as the North’s labor requirements and
labor in the North is greater than , also assuming no differences in Ricardian productivity
i.e. 1 1,2 , , then, ∗ 1/ . and ∗ 1/ . Therefore
equilibrium condition described in equation 1 above becomes; 1/ 1 1. Under this scenario, wages stay the same, since the benefits of clustering are negated by the lower prices determined in the North. This is true of a significant portion of the solar PV supply chain.
Assuming Exogenous Productivity

106
We consider a scenario where there is an actual difference in productivity of firms in good 2 in the south to other products relative to the North, dropping the assumption that
1 1,2 , . For example, if specializing in good 2 is likely to
attract higher skilled workers or better technology such that; . Equilibrium
condition 1, becomes
For specialization in good 1 to occur first inequality,
Under these conditions, benefit of clustering (size of externality) must exceed the
comparative advantage. This could be used to justify investing in sectors that require high technical know how and finance such as manufacturing.
Dynamic Model In this model, Harrison and Rodriguez-Claire (Year or ref Number) extend the static
model to a dynamic situation where comparative advantage changes over time. They assume
that productivity in sector 1 remains , while productivity in sector 2 becomes 1
, . Define as the relative productivity of country j at time t, such that
max , 1] and max , 1 . , which is the dynamic factor of
productivity in good 2, and that this grows with learning by doing which will be represented
as ( / min , ) and international spillovers 1 . That is
min , 1
Note that in this equation 0, since the weaker country will grow faster in productivity than the stronger (benefit of backwardness). This defines a steady state
productivity gap between the countries , 1 and relative productivity of
North to South in steady state will be ∗ / . Such that as South achieves a cluster/
removes externalities, approaches 1 from . Assuming prices are determined in the
North, ∗ 1/ and ∗ 1/ , according to equilibrium condition derived in
equation 1, steady state equilibrium will be
1/ /

107
This demonstrates that, it is possible for South to attain specialization in good 2, with a
temporary protection/ support, until increases from to a level ́ defined by
1/ ́ , at which point protection/ subsidy would no longer be necessary and system approaches
steady state where 1. These models demonstrate that IP could be instrumental in forcing specialization in an
industry where a country has latent comparative advantage. The literature however prescribes tariff protection only when a production subsidy, preferably one targeted at the source of externality e.g. R&D subsidy for knowledge creation externalities, is not feasible [95]. The literature also cautions that the models described may not be feasible if there are intrinsic resource constraints that prevent the sector from becoming large. These could include human or material or technical resources.
Industrial Policy without Latent Comparative Advantage Sector-level rents
Consider that North has two regions and , with labor quantities and . Assume
, produces good 2 and is small relative to the world demand for , ∗can be strictly
greater than as opposed to being equal to it as in previous cases. Then:
∗
Therefore rent, R is defined as ≡∗
, with 1;
For a case where there is no latent comparative advantage in good 2,
, there is
still an equilibrium were R is greater than the comparative advantage in good 1 shown.
Inter-industry externalities
If productivity of good i in country j is 1 , , where > , i.e. intra-
industry externalities are stronger than inter-industry externalities. Let ≡ 1 and
Specialization in good 1 implies ∗ / and specialization in good 2
implies ∗ / . Therefore specialization in good 1 occurs only if
1
108
Showing that the gains from specializing in sector 2 outweigh the losses of rejecting the comparative advantage in sector 1 because of the economy wide externalities generated.
Industrial Policy as Sector Specific Collective Action In certain complex industries, subsidizing or protecting trade does not solve intrinsic
coordination problems, lending credence to the notion that it is not just what but how a country produces that matters. A simple model defined by Harrison and Rodriguez, shows that countries should focus efforts on industries that have higher complexity as these provide more gains from collective action. Also a larger demand combined with low prevalence will lead to rents and highly complex production processes lend themselves to these. The evidence also suggests that countries that focus onskill intensive sectors perform better [229].
Industrial Policy as Self Discovery and Diversification This shows that policies that encourage innovation and discovery lead to more
diversification and higher equilibrium wages. However, because of knowledge spillovers, private returns to individual firms investing in discovery are often limited.
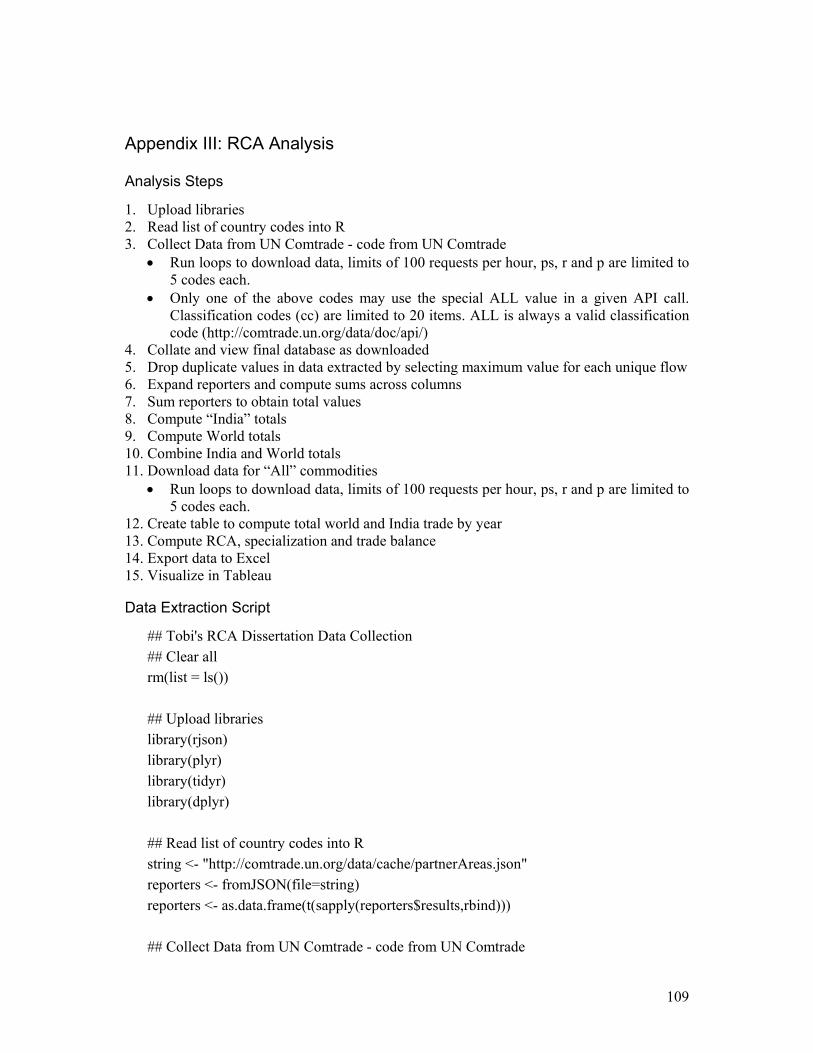
109
Appendix III: RCA Analysis
Analysis Steps
1. Upload libraries 2. Read list of country codes into R 3. Collect Data from UN Comtrade - code from UN Comtrade
Run loops to download data, limits of 100 requests per hour, ps, r and p are limited to 5 codes each.
Only one of the above codes may use the special ALL value in a given API call. Classification codes (cc) are limited to 20 items. ALL is always a valid classification code (http://comtrade.un.org/data/doc/api/)
4. Collate and view final database as downloaded 5. Drop duplicate values in data extracted by selecting maximum value for each unique flow 6. Expand reporters and compute sums across columns 7. Sum reporters to obtain total values 8. Compute “India” totals 9. Compute World totals 10. Combine India and World totals 11. Download data for “All” commodities
Run loops to download data, limits of 100 requests per hour, ps, r and p are limited to 5 codes each.
12. Create table to compute total world and India trade by year 13. Compute RCA, specialization and trade balance 14. Export data to Excel 15. Visualize in Tableau
Data Extraction Script
## Tobi's RCA Dissertation Data Collection ## Clear all rm(list = ls()) ## Upload libraries library(rjson) library(plyr) library(tidyr) library(dplyr) ## Read list of country codes into R string <- "http://comtrade.un.org/data/cache/partnerAreas.json" reporters <- fromJSON(file=string) reporters <- as.data.frame(t(sapply(reporters$results,rbind))) ## Collect Data from UN Comtrade - code from UN Comtrade
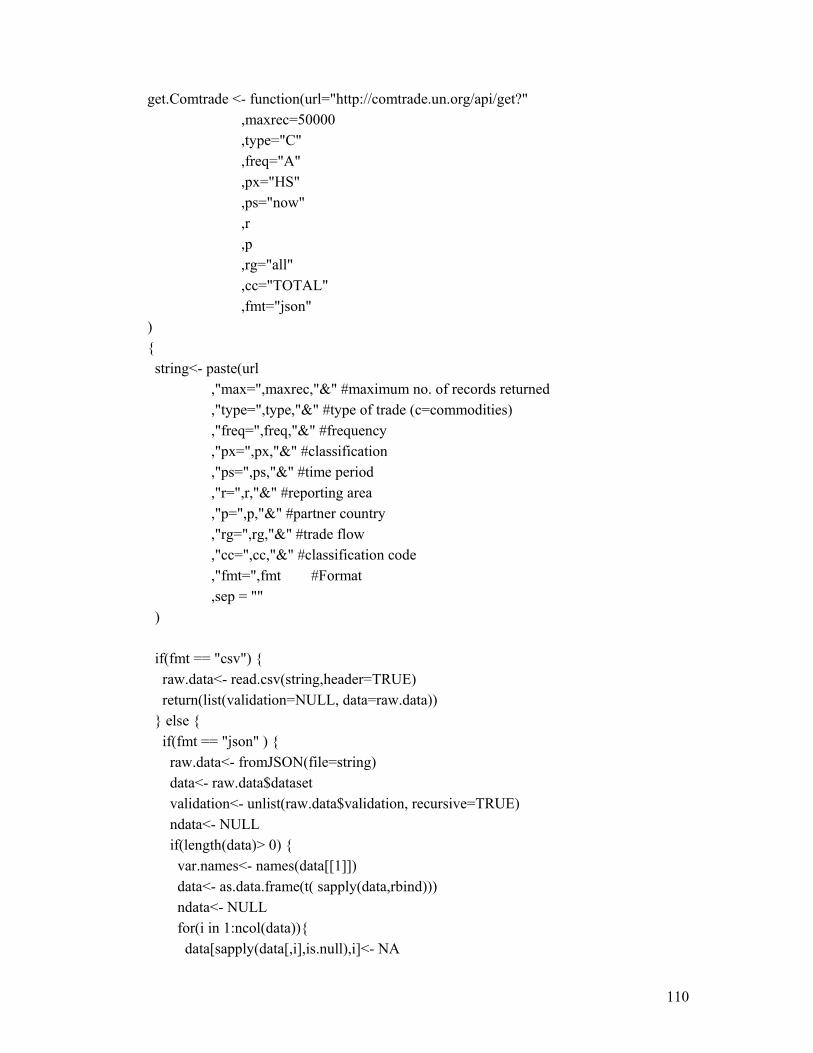
110
get.Comtrade <- function(url="http://comtrade.un.org/api/get?" ,maxrec=50000 ,type="C" ,freq="A" ,px="HS" ,ps="now" ,r ,p ,rg="all" ,cc="TOTAL" ,fmt="json" ) { string<- paste(url ,"max=",maxrec,"&" #maximum no. of records returned ,"type=",type,"&" #type of trade (c=commodities) ,"freq=",freq,"&" #frequency ,"px=",px,"&" #classification ,"ps=",ps,"&" #time period ,"r=",r,"&" #reporting area ,"p=",p,"&" #partner country ,"rg=",rg,"&" #trade flow ,"cc=",cc,"&" #classification code ,"fmt=",fmt #Format ,sep = "" ) if(fmt == "csv") { raw.data<- read.csv(string,header=TRUE) return(list(validation=NULL, data=raw.data)) } else { if(fmt == "json" ) { raw.data<- fromJSON(file=string) data<- raw.data$dataset validation<- unlist(raw.data$validation, recursive=TRUE) ndata<- NULL if(length(data)> 0) { var.names<- names(data[[1]]) data<- as.data.frame(t( sapply(data,rbind))) ndata<- NULL for(i in 1:ncol(data)){ data[sapply(data[,i],is.null),i]<- NA
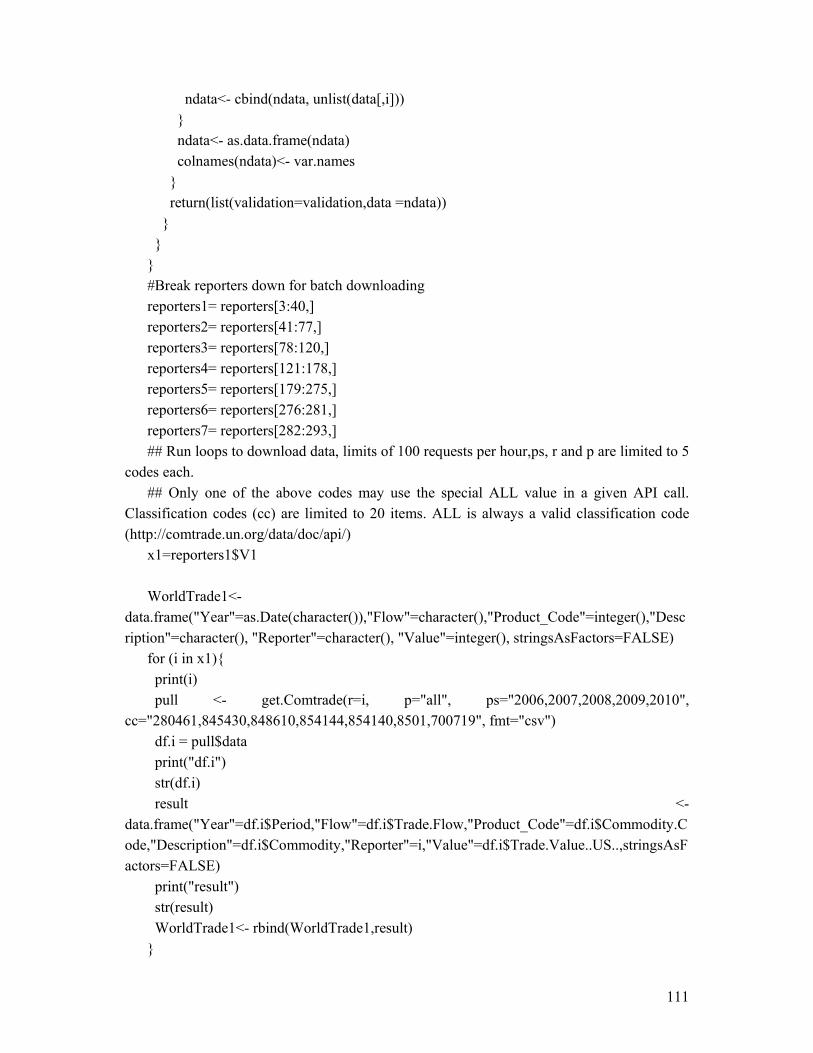
111
ndata<- cbind(ndata, unlist(data[,i])) } ndata<- as.data.frame(ndata) colnames(ndata)<- var.names } return(list(validation=validation,data =ndata)) } } } #Break reporters down for batch downloading reporters1= reporters[3:40,] reporters2= reporters[41:77,] reporters3= reporters[78:120,] reporters4= reporters[121:178,] reporters5= reporters[179:275,] reporters6= reporters[276:281,] reporters7= reporters[282:293,] ## Run loops to download data, limits of 100 requests per hour,ps, r and p are limited to 5
codes each. ## Only one of the above codes may use the special ALL value in a given API call.
Classification codes (cc) are limited to 20 items. ALL is always a valid classification code (http://comtrade.un.org/data/doc/api/)
x1=reporters1$V1 WorldTrade1<-
data.frame("Year"=as.Date(character()),"Flow"=character(),"Product_Code"=integer(),"Description"=character(), "Reporter"=character(), "Value"=integer(), stringsAsFactors=FALSE)
for (i in x1){ print(i) pull <- get.Comtrade(r=i, p="all", ps="2006,2007,2008,2009,2010",
cc="280461,845430,848610,854144,854140,8501,700719", fmt="csv") df.i = pull$data print("df.i") str(df.i) result <-
data.frame("Year"=df.i$Period,"Flow"=df.i$Trade.Flow,"Product_Code"=df.i$Commodity.Code,"Description"=df.i$Commodity,"Reporter"=i,"Value"=df.i$Trade.Value..US..,stringsAsFactors=FALSE)
print("result") str(result) WorldTrade1<- rbind(WorldTrade1,result) }

112
## Loop 2 reporters2= reporters[41:80,] x2=reporters2$V1 WorldTrade2<-
data.frame("Year"=as.Date(character()),"Flow"=character(),"Product_Code"=integer(),"Description"=character(), "Reporter"=character(), "Value"=integer(), stringsAsFactors=FALSE)
for (i in x2){ print(i) pull <- get.Comtrade(r=i, p="all", ps="2006,2007,2008,2009,2010",
cc="280461,845430,848610,854144,854140,8501,700719", fmt="csv") df.i = pull$data print(df.i) str(df.i) result <-
data.frame("Year"=df.i$Period,"Flow"=df.i$Trade.Flow,"Product_Code"=df.i$Commodity.Code,"Description"=df.i$Commodity,"Reporter"=i,"Value"=df.i$Trade.Value..US..,stringsAsFactors=FALSE)
print(result) str(result) WorldTrade2<- rbind(WorldTrade2,result) } ## Loop 3 - in an hour reporters3= reporters[78:120,] x3=reporters3$V1 WorldTrade3<-
data.frame("Year"=as.Date(character()),"Flow"=character(),"Product_Code"=integer(),"Description"=character(), "Reporter"=character(), "Value"=integer(), stringsAsFactors=FALSE)
for (i in x3){ print(i) pull <- get.Comtrade(r=i, p="all", ps="2006,2007,2008,2009,2010",
cc="280461,845430,848610,854144,854140,8501,700719", fmt="csv") df.i = pull$data print("df.i") str(df.i) result <-
data.frame("Year"=df.i$Period,"Flow"=df.i$Trade.Flow,"Product_Code"=df.i$Commodity.Code,"Description"=df.i$Commodity,"Reporter"=i,"Value"=df.i$Trade.Value..US..,stringsAsFactors=FALSE)
print(result) str(result) WorldTrade3<- rbind(WorldTrade3,result)

113
} ## Loop 4 x4=reporters4$V1 WorldTrade4<-
data.frame("Year"=as.Date(character()),"Flow"=character(),"Product_Code"=integer(),"Description"=character(), "Reporter"=character(), "Value"=integer(), stringsAsFactors=FALSE)
for (i in x4){ print(i) pull <- get.Comtrade(r=i, p="all", ps="2006,2007,2008,2009,2010",
cc="280461,845430,848610,854144,854140,8501,700719", fmt="csv") df.i = pull$data print("df.i") str(df.i) result <-
data.frame("Year"=df.i$Period,"Flow"=df.i$Trade.Flow,"Product_Code"=df.i$Commodity.Code,"Description"=df.i$Commodity,"Reporter"=i,"Value"=df.i$Trade.Value..US..,stringsAsFactors=FALSE)
print(result) str(result) WorldTrade4<- rbind(WorldTrade4,result) } ## Loop 5 x5=reporters5$V1 WorldTrade5<-
data.frame("Year"=as.Date(character()),"Flow"=character(),"Product_Code"=integer(),"Description"=character(), "Reporter"=character(), "Value"=integer(), stringsAsFactors=FALSE)
for (i in x5){ print(i) pull <- get.Comtrade(r=i, p="all", ps="2006,2007,2008,2009,2010",
cc="280461,845430,848610,854144,854140,8501,700719", fmt="csv") df.i = pull$data print("df.i") str(df.i) result <-
data.frame("Year"=df.i$Period,"Flow"=df.i$Trade.Flow,"Product_Code"=df.i$Commodity.Code,"Description"=df.i$Commodity,"Reporter"=i,"Value"=df.i$Trade.Value..US..,stringsAsFactors=FALSE)
print(result) str(result) WorldTrade5<- rbind(WorldTrade5,result) } ## Loop 6

114
x6=reporters6$V1 WorldTrade6<-
data.frame("Year"=as.Date(character()),"Flow"=character(),"Product_Code"=integer(),"Description"=character(), "Reporter"=character(), "Value"=integer(), stringsAsFactors=FALSE)
for (i in x6){ print(i) pull <- get.Comtrade(r=i, p="all", ps="2006,2007,2008,2009,2010",
cc="280461,845430,848610,854144,854140,8501,700719", fmt="csv") df.i = pull$data print("df.i") str(df.i) result <-
data.frame("Year"=df.i$Period,"Flow"=df.i$Trade.Flow,"Product_Code"=df.i$Commodity.Code,"Description"=df.i$Commodity,"Reporter"=i,"Value"=df.i$Trade.Value..US..,stringsAsFactors=FALSE)
print(result) str(result) WorldTrade6<- rbind(WorldTrade6,result) } ## Loop 7 x7=reporters7$V1 WorldTrade7<-
data.frame("Year"=as.Date(character()),"Flow"=character(),"Product_Code"=integer(),"Description"=character(), "Reporter"=character(), "Value"=integer(), stringsAsFactors=FALSE)
for (i in x7){ print(i) pull <- get.Comtrade(r=i, p="all", ps="2006,2007,2008,2009,2010",
cc="280461,845430,848610,854144,854140,8501,700719", fmt="csv") df.i = pull$data print("df.i") str(df.i) result <-
data.frame("Year"=df.i$Period,"Flow"=df.i$Trade.Flow,"Product_Code"=df.i$Commodity.Code,"Description"=df.i$Commodity,"Reporter"=i,"Value"=df.i$Trade.Value..US..,stringsAsFactors=FALSE)
print("result") str(result) WorldTrade7<- rbind(WorldTrade7,result) } ## Loop 8 x8=reporters8$V1

115
WorldTrade8<- data.frame("Year"=as.Date(character()),"Flow"=character(),"Product_Code"=integer(),"Description"=character(), "Reporter"=character(), "Value"=integer(), stringsAsFactors=FALSE)
for (i in x8){ print(i) pull <- get.Comtrade(r=i, p="all", ps="2006,2007,2008,2009,2010",
cc="280461,845430,848610,854144,854140,8501,700719", fmt="csv") df.i = pull$data print("df.i") str(df.i) result <-
data.frame("Year"=df.i$Period,"Flow"=df.i$Trade.Flow,"Product_Code"=df.i$Commodity.Code,"Description"=df.i$Commodity,"Reporter"=i,"Value"=df.i$Trade.Value..US..,stringsAsFactors=FALSE)
print("result") str(result) WorldTrade8<- rbind(WorldTrade8,result) } ## Saving the downloads write.csv(WorldTrade1,file="WT3a.csv") write.csv(WorldTrade2,file="WT3b.csv") write.csv(WorldTrade3,file="WT3c.csv") write.csv(WorldTrade4,file="WT3d.csv") write.csv(WorldTrade5,file="WT3e.csv") write.csv(WorldTrade6,file="WT3f.csv") write.csv(WorldTrade7,file="WT3g.csv") write.csv(WorldTrade8,file="WTh.csv") ## Collate and view final database as downloaded Trade <-
rbind(WorldTrade1,WorldTrade2,WorldTrade3,WorldTrade4,WorldTrade5,WorldTrade6,WorldTrade7)
View(Trade) ## Drop duplicate values in data extracted by selecting maximum value for each unique
flow Trade1<-
ddply(Trade,.(Year,Flow,Product_Code,Description,Reporter),summarise,Value=max(Value, na.rm=TRUE))
View(Trade1) ## Expand Reporters and Compute Sums Across Columns ByReporter <- spread(Trade1,Reporter,Value, fill=0) View(ByReporter)
116
## Sum reporters to obtain total values ByReporter$Value <- apply(ByReporter[,5:276], 1, function(x) sum(x)) ## Compute India Totals IndiaT <- cbind(ByReporter[,1:4],ByReporter["699"]) names(IndiaT) <- c("Year","Flow","Product_Code","Description","India") India <- spread(IndiaT, Flow, India,fill=0) India1 <- transform(India,"Export" = India [,4] + India[,6], "Import"= India[,5] +India[,7]) India <- India1[,1:5] ## Compute World Totals WorldT <- cbind(ByReporter[,1:4],ByReporter["Value"]) World <- spread(WorldT, Flow, Value,fill=0) WT <- transform(World,"Export" = World [,4] + World[,6], "Import"= World[,5] +World[,7]) World <- WT[,1:5] ##Combine India and World Totals TFinal <- cbind(India, World[,4:5]) names(TFinal) <- c("Year","Product_Code","Description","IExport","IImport",
"WExport", "WImport") ## Download Data for All Commodities ## Read list of country codes into R string <- "http://comtrade.un.org/data/cache/partnerAreas.json" reporters <- fromJSON(file=string) reporters <- as.data.frame(t(sapply(reporters$results,rbind))) reportersa= reporters[3:35,] reportersb= reporters[36:136,] reportersc= reporters[137:293,] ## First 100 requests x=reportersa$V1 WorldTradea<- data.frame("Year"=as.Date(character()), "Flow"=character(), "Product_Code"=integer(), "Description"=character(), "Reporter"=character(), "Value"=integer(), stringsAsFactors=FALSE) for (i in x){

117
print(i) pullall <- get.Comtrade(r=i, p="all", ps="2011,2012,2013,2014,2015",
fmt="csv") df.i = pullall$data print("df.i") str(df.i) result <-
data.frame("Year"=df.i$Period,"Flow"=df.i$Trade.Flow,"Product_Code"=df.i$Commodity.Code,"Description"=df.i$Commodity,"Reporter"=i,"Value"=df.i$Trade.Value..US..,stringsAsFactors=FALSE)
print("result") str(result) WorldTradea<- rbind(WorldTradea,result) } ## Second 100 requests xb=reportersb$V1 WorldTradeb<- data.frame("Year"=as.Date(character()), "Flow"=character(), "Product_Code"=integer(), "Description"=character(), "Reporter"=character(), "Value"=integer(), stringsAsFactors=FALSE) for (i in xb){ print(i) pullall <- get.Comtrade(r=i, p="all", ps="2011,2012,2013,2014,2015",
fmt="csv") df.i = pullall$data print("df.i") str(df.i) resultb <-
data.frame("Year"=df.i$Period,"Flow"=df.i$Trade.Flow,"Product_Code"=df.i$Commodity.Code,"Description"=df.i$Commodity,"Reporter"=i,"Value"=df.i$Trade.Value..US..,stringsAsFactors=FALSE)
print("resultb") str(resultb) WorldTradeb<- rbind(WorldTradeb,resultb) } ## Third 100 requests xc=reportersc$V1 WorldTradec<- data.frame("Year"=as.Date(character()), "Flow"=character(),
118
"Product_Code"=integer(), "Description"=character(), "Reporter"=character(), "Value"=integer(), stringsAsFactors=FALSE) for (i in xc){ print(i) pullall <- get.Comtrade(r=i, p="all", ps="2011,2012,2013,2014,2015",
fmt="csv") df.i = pullall$data print("df.i") str(df.i) resultc <-
data.frame("Year"=df.i$Period,"Flow"=df.i$Trade.Flow,"Product_Code"=df.i$Commodity.Code,"Description"=df.i$Commodity,"Reporter"=i,"Value"=df.i$Trade.Value..US..,stringsAsFactors=FALSE)
print("resultc") str(resultc) WorldTradec<- rbind(WorldTradec,resultc) } ## Bind 3 datasets and remove possible duplications AllC <- rbind(WorldTradea,WorldTradeb,WorldTradec) AllC<- distinct(AllC) # Create Table to Compute Total World and India Trade by Year y <- c(2011:2015) Totals <- data.frame("Year"=as.Date(character()), "Flow"=character(), "IndiaTotalEx"=as.numeric(), "IndiaTotalIm"=as.numeric(), "WorldTotalEx"=as.numeric(), stringsAsFactors = FALSE) for (i in y) { print(i) All.i <- filter(AllC, Year==i) AllE.i <- rbind((filter(All.i, Flow=="Export")), (filter(All.i, Flow=="Re-Export"))) WorldTotalEx <- as.numeric(colSums(AllE.i["Value"])) AllI.i <- rbind((filter(All.i, Flow=="Import")), (filter(All.i, Flow=="Re-Import")))

119
WorldTotalIm <- as.numeric(colSums(AllE.i["Value"])) IndiaE.i <- filter(AllE.i, Reporter==699) IndiaTotalEx <- as.numeric(colSums(IndiaE.i["Value"])) IndiaI.i <- filter(AllI.i, Reporter==699) IndiaTotalIm <- as.numeric(colSums(IndiaI.i["Value"])) result <- data.frame("Year"=i, "IndiaTotalEx"=IndiaTotalEx, "WorldTotalEx"=WorldTotalEx, "IndiaTotalIm"=IndiaTotalIm, "WorldTotalIm"=WorldTotalIm) Totals <- rbind(Totals,result) print(Totals) } ## Compute RCA, Significance, Specialization and Trade Balance for (i in 1:dim(TFinal)[1]) { ## Sum is removing NA errors in code TFinal$RCA[i] <- sum((TFinal$IExport[i] /
Totals$IndiaTotalEx[Totals$Year==TFinal$Year[i]]) / (TFinal$WExport[i] / Totals$WorldTotalEx[Totals$Year==TFinal$Year[i]]),na.rm=FALSE)
TFinal$Significance[i] <- sum(((TFinal$IExport[i] / Totals$IndiaTotalEx[Totals$Year==TFinal$Year[i]]))*100, na.rm=FALSE)
TFinal$Specialization[i] <- sum(((TFinal$IExport[i]/TFinal$IImport[i]) /(Totals$IndiaTotalEx[Totals$Year==TFinal$Year[i]]/Totals$IndiaTotalIm[Totals$Year==TFinal$Year[i]]), na.rm=FALSE)
TFinal$TradeBalance[i] <- sum((TFinal$IExport[i]-TFinal$IImport[i]) /(TFinal$IExport[i]+TFinal$IImport[i]),na.rm=FALSE)
} write.csv(TFinal,file="TF3.csv") write.csv(Totals,file="Totals.csv")

120
Appendix IV: Interviews
Table 37: List of Interviewees
S/N Name Organization Location Title Category
1 Rishi Thussu SunEdison – India Bangalore Director-Karnataka Operations
Developer
2 Mr Selvam Shan Solar Bangalore Developer
3 Chetan Solanki (Rep) Kwatts Solutions Bombay Founder Developer
4 Arul Shanmugasundram
Tata Solar Pvt. Ltd Bangalore CTO Manufacturer
5 Sunil Rathi Vikram Solar Ahmedabad, Gujarat
President Sales Manufacturer
6 Mr. Srinath T EMVEE Solar Bangalore Technical Director Manufacturer
7 Chowdury Kasturi Jupiter Solar Power Ltd. Baddi, Himachal Pradesh
CEO Manufacturer
8 Ajay Prakash Shrivastava
Maharishi Solar Delhi CEO Manufacturer
9 James Sanoj Juwi Solar – India Bangalore CEO Manufacturer
10 Vivek Singh Alpex Solar Delhi Marketing Manufacturer
11 Vijay Kumar Moser Baer Solar Ltd. Delhi VP Manufacturer
12 Mr. Raja Babu Euromultivision Bombay CEO Manufacturer
13 Dr Sandeep BHEL Bangalore Snr Scientist Manufacturer
14 Dr. Ashvini Kumar and Dr. Y.B.K. Reddy
Solar Energy Corporation of India
Director Policy
15 Dr A.N. Srinivasta Ministry of New & Renewable Energy
Delhi Director JNNSM Policy
16 Karndhar Sanjay Ministry of New & Renewable Energy
Delhi Scientist C Policy
17 G.V. Balaram and Dr. V.A. Rodrigues
Karnataka Renewable Energy Development Ltd
Bangalore MD Policy
18 Mr A. K. Maggu NTPC Vidyut Vyapar Nigam Limited
Delhi GM Policy
19 Juhi Rajput Power News Delhi CEO Research
20 Dr Shastry and Yogesh NISE Delhi Research
21 Partha Chaudhuri University of Calcutta Kolkatta Professor Research
22 Juzer Vasi IIT Bombay Bombay Professor Research
23 Anil Kottantharayil Professor Research

121
S/N Name Organization Location Title Category
24 Prof. K. L. Narasimhan Professor Research
25 Milind Atrey and SINE Team
SINE Bombay Professor Research
26 Leena Wadia and ORF Team
Observer Research Founation
Bombay Researcher Research
27 Alok Srivastava IgrenEnergi Bombay Director R&D Research
Interview Questions
Questions about the current state of the Industry, DCR and way forward
1. What are your general views on the National Solar Mission and its domestic content requirement? How has it helped or hindered the domestic solar industry?
2. What are the comparative strengths of India’s solar manufacturing Industry along the value chain? Is there a material that India is strategically positioned to manufacture and why?
3. What are hindrances to producing more, cheaper and being competitive internationally?
4. How can Indian firms do more and cheaper? a. Private initiative b. Industry initiatives c. Government support d. Collaborations (NGOs, universities, international etc.)
5. Thinking of the list from Q4 what is most essential and why?
Questions about historical prices and quantities for demand and supply curve estimation
Government 1. What has been the total quantity of domestic modules and cells deplored in each year
and at what module price 2. How has this compared with the open market? 3. What has the cost of this support for domestic been for government? Developers 1. What fraction of your total cost is the module cost (domestic and imported) over the
last 10 years? 2. What fraction of your total capacity is domestically sourced? 3. How did the influx of cheap Chinese modules and solar policies in other countries
affect your supply landscape and costs?
Sample Follow on Questions 1. What India-specific factors contribute to lack of competitiveness? 2. What are the drivers for international companies manufacturing in India? 3. How much is invested in R&D? How does that compare with competitors
internationally and domestically? 4. Are there knowledge or information externalities/ spillovers/ lack of appropriability
within the local and international industry? 5. How easy is it to access capital for expansion and innovation?

122
6. How important is scale in increasing productivity; what is the point of diminishing returns
7. How helpful will agglomeration economies (manufacturing hubs etc) 8. What has been the effect of inherent bias towards existing technology for the solar
business? 9. Are there important inputs and business conditions, currently lacking, that would
make the industry more viable (coordination or sequencing failures); 10. Is there an imperfect competition in international markets 11. Do you perceive significant private risks to innovation in this industry that could be
assuaged if shared? 12. What business environment reforms have been most relevant in increasing investment
in manufacturing in India? 13. Where should India focus its domestic solar production efforts? 14. What policies have the potential to have the most impact for driving solar demand? 15. Is domestic manufacturing a value-add for India’s solar sector? 16. Given the potential benefits of a domestic solar industry, and given the strengths and
weaknesses of India’s resource and industrial base, how should the industry be developed?
17. What financing and policy mechanisms can be utilized to support innovations in the most cost-effective domestic manufacturing areas for India?
18. Why is current manufacturing capacity dormant?

123
Appendix V: Financial Assessment
Regional Manufacturing Prices
Figure 35: Regional Polysilicon Production Costs and Minimum Sustainable Price for India
Sources: Financial analysis (India), NREL [125]
Figure 36: Regional Wafer Production Costs and Minimum Sustainable Price for India (with projections for future cost savings)

124
Figure 37: Regional Cell Production Costs and Minimum Sustainable Price for India
Figure 38: Regional Module Production Costs and Minimum Sustainable Price for India

125
Appendix VI: Jobs Assessment
Jobs assessment shown below is based on NITI Aayog’s expert group study [43]
Table 38: Estimate of Renewable Energy Jobs in India
Table 39: Key Assumptions in Estimating RE Jobs

126
Appendix VII: Solar vs Coal Cost Benefit Analysis
Year Count 0 1 2 3 4 5 6 7 8 9 10 11 12 13 14 15
Year 2015 2016 2017 2018 2019 2020 2021 2022 2023 2024 2025 2026 2027 2028 2029 2030
Growth (TwH) 1,272
1,421
1,569
1,718
1,866
2,015
2,163
2,312 2,460 2,609 2,757 2,906 3,054 3,203 3,351 3,500
Change (Twh) 149 297 446 594 743 891
1,040 1,188 1,337 1,485 1,634 1,782 1,931 2,079 2,228
Carbon Intensity (CO2 tonnes/Gwh)
Lifetime CO2 (MTonnes )
Coal 888 132 264 396 528 659 791 923 1,055 1,187 1,319 1,451 1,583 1,715 1,847 1,978 15,828
Solar 85 13 25 38 51 63 76 88 101 114 126 139 152 164 177 189 1,515
Input 15yr Total (USD B)
NPV@15% Discount Rate (USD B)
Levelized Coal Cost (UScents/KWh)
5.50 8.17 16.34
24.51
32.68
40.85
49.02
57.19
65.35 73.52 81.69 89.86 98.03 106.20
114.37
122.54
980.32 305.71
CO2 Cost (USD B) @$38/tonne
38.00 5.01 10.02
15.04
20.05
25.06
30.07
35.08
40.10 45.11 50.12 55.13 60.15 65.16 70.17 75.18 601.45 187.56
Other Health Costs (USD/W)
0.04 1.07 2.15 3.22 4.30 5.37 6.45 7.52 8.59 9.67 10.74 11.82 12.89 13.97 15.04 16.12 128.92 40.20
14.26
28.51
42.77
57.02
71.28
85.53
99.79
114.05
128.30
142.56
156.81
171.07
185.33
199.58
213.84
1,710.69 533.47
Levelized Solar Cost (UScents/KWh)
8.48 12.60
25.20
37.80
50.40
63.00
75.60
88.20
100.80
113.41
126.01
138.61
151.21
163.81
176.41
189.01
1,512.07 471.53
CO2 Cost (USD B) @$38/tonne
38.00 0.48 0.96 1.44 1.92 2.40 2.88 3.36 3.84 4.32 4.80 5.28 5.76 6.24 6.72 7.20 57.57 17.95
Other Health Costs (USD/W)
- 13.08
26.16
39.24
52.32
65.40
78.48
91.56
104.64
117.72
130.80
143.88
156.96
170.04
183.12
196.21
1,569.64 489.49
Difference 141.05 43.99
127
References and EndNote
1. Global Tracking Framework 2015. World Bank, 2015. Available from: http://trackingenergy4all.worldbank.org/~/media/GIAWB/GTF/Documents/GTF-2015-Summary-Report.pdf.
2. Benjamin, K.S., A qualitative factor analysis of renewable energy and Sustainable Energy for All (SE4ALL) in the Asia-Pacific. Energy Policy, 2013. 59.
3. India's Rural Electrification Status. Rural Electrification Corporation Limited, 2016. Available from: http://103.233.79.65/dashboard.
4. Jacobson, M.Z., Review of solutions to global warming, air pollution, and energy security. Energy & Environmental Science, 2009. 2(2): p. 148-173.
5. Stern, N.H. and H.M.s. Treasury, Stern Review: The economics of climate change. Vol. 30. 2006: HM treasury London.
6. Timilsina, G.R., L. Kurdgelashvili, and P.A. Narbel, Solar energy: Markets, economics and policies. Renewable and Sustainable Energy Reviews, 2012. 16(1): p. 449-465.
7. MNRE Ministry of New and Renewable Energy, Government of India. , 2010. Available from: http://www.mnre.gov.in/solar-mission/jnnsm/introduction-2/.
8. Huberty, M. and G. Zachmann, Green exports and the global product space: prospects for EU industrial policy. 2011, Bruegel working paper.
9. PIB, Press Information Bureau, Government of India. 2015. Available from: http://pib.nic.in/newsite/pmreleases.aspx?mincode=28.
10. GOI, Make in India. 2015. Available from: http://www.makeinindia.com/sector/renewable-energy/.
11. DIPP, Government of India, Ministry of Commerce and Industry, Department of Industrial Policy & Promotion. 2015. Available from: http://dipp.nic.in/English/questions/18032015/ru2245.pdf.
12. WTO ruling aside, India’s DCR was a badly designed policy tool. PV-Tech.org, 2016. Available from: http://www.pv-tech.org/guest-blog/wto-ruling-aside-dcr-was-a-badly-designed-policy-tool.
13. Stiglitz, J.E., Some lessons from the East Asian miracle. The world Bank research observer, 1996. 11(2): p. 151-177.
14. Harrison, A. and A. Rodríguez-Clare, Trade, foreign investment, and industrial policy for developing countries. 2009, National Bureau of Economic Research.

128
15. Aghion, P., et al., Industrial policy and competition. 2012, National Bureau of Economic Research.
16. World Fact Book. Central Intelligence Agency Library, 2012 est. Available from: https://www.cia.gov/library/publications/the-world-factbook/rankorder/2172rank.html.
17. WITS. India Trade at a Glance : Most Recent Values. 2015 [cited 2016 September 2015]; World Integrated Trade Solution]. Available from: http://wits.worldbank.org/CountrySnapshot/en/IND.
18. RBI, Survey on Computer Software & Information Technology Enabled Services Exports: 2014-15 – Data Release. 2015, DEPARTMENT OF COMMUNICATION. Available from: https://rbidocs.rbi.org.in/rdocs/PressRelease/PDFs/PR135223E9BC2394204C1EB944047DD6CC4FC2.PDF.
19. GOI. National Product Classification for Services Sector 2010 [cited 2016 October 2016]; Available from: http://mospi.nic.in/mospi_new/upload/npc_serv_sec-2010.pdf.
20. 2015 Revision of World Population Prospects. United Nations Department of Economic and Social Affairs, 2015. Available from: https://esa.un.org/unpd/wpp/.
21. Country Analysis Brief: India. US Energy Information Administration, 2016. Available from: https://www.eia.gov/beta/international/analysis_includes/countries_long/India/india.pdf.
22. India’s economic growth is driving its energy consumption. 2013. Available from: http://www.eia.gov/todayinenergy/detail.cfm?id=10611.
23. 2016. Available from: https://www.google.com/publicdata/explore?ds=d5bncppjof8f9_&ctype=l&strail=false&bcs=d&nselm=h&met_y=eg_use_elec_kh_pc&scale_y=lin&ind_y=false&rdim=region&idim=country:IND:PAK:BGD&ifdim=region&hl=en&dl=en&ind=false&xMax=127.41162075&xMin=30.731933249999997&yMax=-2.802945704225703&yMin=37.586097509990815&mapType=t&icfg&iconSize=0.5.
24. O'Neill, B.C., et al., The effect of urbanization on energy use in India and China in the iPETS model. Energy Economics, 2012. 34: p. S339-S345.
25. Ghosh, S. and K. Kanjilal, Long-term equilibrium relationship between urbanization, energy consumption and economic activity: Empirical evidence from India. Energy, 2014. 66: p. 324-331.
26. Xie, P.-j., et al., Analysis on dynamic relationship between urbanization and electricity consumption level in China. Power System Technology, 2009. 33(14): p. 72-77.
27. Luo, Q., The short-run and dynamic relationship between urbanization, electricity consumption and economic growth. Journal of Chemical and Pharmaceutical Research, 2014. 6(7): p. 2726-2732.

129
28. GOI Power Sector at a Glance ALL INDIA. Ministry of Power, Government of India, 2016. Available from: http://powermin.nic.in/power-sector-glance-all-india.
29. CEEW ACCESS TO CLEAN COOKING ENERGY AND ELECTRICITY Survey of States. CEEW, 2015. Available from: http://ceew.in/pdf/CEEW-ACCESS-Report-29Sep15.pdf.
30. GOI Houses, Household Amenities and Assets Data 2001 - 2011. Census India, 2011. Available from: http://censusindia.gov.in/2011-Common/NSDI/Houses_Household.pdf.
31. REC. Rural Electrification Dashboard. 2016 [cited 2016; Available from: http://103.233.79.65/dashboard.
32. GOI, in 42/1/2001-D(RE) M.o. Power, Editor. 2004, DDUGJY. Available from: http://www.ddugjy.gov.in/mis/portal/definition_electrified_village.html.
33. Watts, H., Energy sector will generate $250 billion investment potential: Piyush Goyal in Economic Times. 2015. Available from: http://economictimes.indiatimes.com/articleshow/50304328.cms?utm_source=contentofinterest&utm_medium=text&utm_campaign=cppst.
34. GOI, Report on India’s Renewable Electricity Roadmap 2030: Towards Accelerated Renewable Electricity Deployment. 2015, NITI Aayog (Central Planning Commission). Available from: http://niti.gov.in/writereaddata/files/document_publication/RE_Roadmap_ExecutiveSummary.pdf.
35. EIA. Electric generator capacity factors vary widely across the world. 2015 [cited 2016; Available from: http://www.eia.gov/todayinenergy/detail.php?id=22832.
36. CERC, Growth of Electricity Sector in India From 1947-2015. 2015. Available from: http://www.indiaenvironmentportal.org.in/files/file/growth_2015.pdf.
37. CERC, Central Electricity Regulatory Commission (Terms and Conditions of Tariff) Regulations, 2014, N.D.I. Central Electricity Regulatory Commission, Editor. 2014. Available from: http://cercind.gov.in/2014/regulation/reg21.pdf.
38. WNA, Comparison of Lifecycle Greenhouse Gas Emissions of Various Electricity Generation Sources. 2011, World Nuclear Association
Carlton House, 22a St. James’s Square, London SW1Y 4JH, UK. Available from: http://www.world-nuclear.org/uploadedFiles/org/WNA/Publications/Working_Group_Reports/comparison_of_lifecycle.pdf.
39. Synapse, 2016 Carbon Dioxide Price Forecast. 2016, Synapse Energy Economics
485 Massachusetts Avenue, Suite 2
Cambridge, Massachusetts 02139. Available from: http://www.synapse-energy.com/sites/default/files/2016-Synapse-CO2-Price-Forecast-66-008.pdf.

130
40. WorldBank, Carbon Pricing 2016 report. 2016, World Bank and ECOFYS. Available from: https://openknowledge.worldbank.org/bitstream/handle/10986/24288/CarbonPricingWatch2016.pdf?sequence=4&isAllowed=y.
41. CAT, Coal Kills: An Assessment of Death and Disease caused by India’s Dirtiest Energy Source. 2013, Conservation Action Trust , Urban Emmissions, Greenpeace. Available from: http://www.greenpeace.org/india/Global/india/report/Coal_Kills.pdf.
42. CAT, Coal Kills: Health Impacts of Air Pollution from India’s Coal Power Expansion, in Coal-fired TPPs in India. 2014, Conservation Action Trust and Urban Emmissions. Available from: http://www.indiaenvironmentportal.org.in/files/file/Air Pollution from India Coal TPPs.pdf.
43. Aayog, N., Report of the Expert Group on 175GW RE by 2022, S. Khullar, Editor. 2015, National Institute for Transforming India. Available from: http://niti.gov.in/writereaddata/files/writereaddata/files/document_publication/report-175-GW-RE.pdf.
44. NREL. India Solar Resource Maps & Data (updated March 2016). 2016; Available from: http://www.nrel.gov/international/ra_india.html.
45. CEEW 2015. Available from: (http://www.nrdc.org/international/india/files/renewable-energy-solar-jobs-report.pdf.
46. Lewis, J.I. and R.H. Wiser, Fostering a renewable energy technology industry: An international comparison of wind industry policy support mechanisms. Energy Policy, 2007. 35(3): p. 1844-1857.
47. Fudenberg, D. and J. Tirole, Learning-by-Doing and Market Performance. The Bell Journal of Economics, 1983. 14(2): p. 522-530.
48. Junginger, M., W. van Sark, and A. Faaij, Technological learning in the energy sector: lessons for policy, industry and science. 2010: Edward Elgar Publishing.
49. Kobos, P.H., J.D. Erickson, and T.E. Drennen, Technological learning and renewable energy costs: implications for US renewable energy policy. Energy policy, 2006. 34(13): p. 1645-1658.
50. Qiu, Y. and L.D. Anadon, The price of wind power in China during its expansion:
Technology adoption, learning-by-doing, economies of scale, and manufacturing localization. Energy Economics, 2012. 34(3): p. 772-785.
51. Luque, A. and S. Hegedus, Handbook of photovoltaic science and engineering. 2011: John Wiley & Sons.
52. Dictionary, C.; Available from: http://dictionary.cambridge.org/us/dictionary/english/industrial-policy.

131
53. Baldwin, R.E., The case against infant-industry tariff protection. The Journal of Political Economy, 1969: p. 295-305.
54. Pack, H. and K. Saggi, Is There a Case for Industrial Policy? A Critical Survey. The World Bank Research Observer, 2006. 21(2): p. 267-297.
55. Cohen, E., Theoretical foundations of industrial policy. EIB papers, 2006. 11(1): p. 84-106.
56. Altenburg, T., Industrial policy in developing countries: overview and lessons from seven country cases. 2011.
57. Livesey, F., Rationales for industrial policy based on industry maturity. Journal of Industry, Competition and Trade, 2012. 12(3): p. 349-363.
58. Rodrik, D., Industrial policy: don't ask why, ask how. Middle East Development Journal, 2009. 1(01): p. 1-29.
59. Irwin, D.A., Against the tide: An intellectual history of free trade. 1996: Princeton University Press.
60. Chang, H.-J., Kicking away the ladder: Infant industry promotion in historical perspective. Oxford Development Studies, 2003. 31(1): p. 21-32.
61. Chang, H.-J., 23 things they don't tell you about capitalism. 2012: Bloomsbury Publishing USA.
62. Irwin, D.A., Tariffs and growth in late nineteenth century America. The World Economy, 2001. 24(1): p. 15-30.
63. Shafaeddin, M., How did developed countries industrialize? The history of trade and industrial policy: the cases of Great Britain and the USA. 1998, United Nations Conference on Trade and Development.
64. Head, K., Infant industry protection in the steel rail industry. Journal of International Economics, 1994. 37(3): p. 141-165.
65. Marshall, A., et al., Principles of economics: an introductory volume. 1920.
66. Helpman, E. and P.R. Krugman, Market structure and foreign trade: Increasing returns, imperfect competition, and the international economy. 1985: MIT press.
67. Krugman, P.R., Increasing returns, monopolistic competition, and international trade. Journal of international Economics, 1979. 9(4): p. 469-479.
68. Krugman, P.R., Geography and trade. 1991: MIT press.
69. Wu, C.-Y. and J.A. Mathews, Knowledge flows in the solar photovoltaic industry: Insights from patenting by Taiwan, Korea, and China. Research Policy, 2012. 41(3): p. 524-540.
70. Cosbey, A., Green industrial policy and the world trading system. ENTWINED Issue Brief, 2013. 17.

132
71. Dasgupta, P. and J. Stiglitz, Learning-by-doing, market structure and industrial and trade policies. Oxford Economic Papers, 1988. 40(2): p. 246-268.
72. Feldman, M.P., The new economics of innovation, spillovers and agglomeration: Areview of empirical studies. Economics of innovation and new technology, 1999. 8(1-2): p. 5-25.
73. Rosenthal, S.S. and W.C. Strange, The determinants of agglomeration. Journal of urban economics, 2001. 50(2): p. 191-229.
74. Arrow, K.J., The economic implications of learning by doing. 1971: Springer.
75. Romer, P.M., Increasing returns and long-run growth. The journal of political economy, 1986: p. 1002-1037.
76. Hernández, I., et al., The discovery of new export products in Ecuador. 2010.
77. Gebreeyesus, M. and T. Sonobe, Global value chains and market formation process in emerging export activity: Evidence from Ethiopian flower industry. Journal of Development Studies, 2012. 48(3): p. 335-348.
78. Greenwald, B.C., M. Kohn, and J.E. Stiglitz, Financial market imperfections and productivity growth. Journal of Economic Behavior & Organization, 1990. 13(3): p. 321-345.
79. Stiglitz, J.E., Markets, market failures, and development. The American Economic Review, 1989. 79(2): p. 197-203.
80. Kemp, M.C., The Mill-Bastable infant-industry dogma. The Journal of Political Economy, 1960: p. 65-67.
81. Hausmann, R. and D. Rodrik, Economic development as self-discovery. Journal of development Economics, 2003. 72(2): p. 603-633.
82. Hidalgo, C.A., et al., The product space conditions the development of nations. Science, 2007. 317(5837): p. 482-487.
83. Chang, H.-J., The East Asian development experience: the miracle, the crisis and the future. 2006: Zed Books.
84. Stiglitz, J.E. and S. Yusuf, Rethinking the East Asian Miracle. 2001: World Bank Publications.
85. Thomas, J.J., Kerala’s industrial backwardness: a case of path dependence in industrialization? World Development, 2005. 33(5): p. 763-783.
86. Bank, W., The East Asian miracle: economic growth and public policy. AC00804425. 1993: Oxford University Press.
87. Luzio, E. and S. Greenstein, Measuring the performance of a protected infant industry: the case of Brazilian microcomputers. The Review of Economics and Statistics, 1995: p. 622-633.
133
88. Sahoo, A. and G. Shrimali, The Effectiveness of Domestic Content Criteria in India’s Solar Mission. 2013.
89. Subramaniam, K.N., Future of Solar Energy in India. 2013, Moser Baer Solar Ltd. Available from: http://www.cseindia.org/userfiles/Threat of global competition in the manufacturing sector and its resolve.pdf.
90. Amiti, M. and J. Konings, Trade liberalization, intermediate inputs, and productivity: Evidence from Indonesia. The American Economic Review, 2007. 97(5): p. 1611-1638.
91. Harrison, A.E., L.A. Martin, and S. Nataraj, Learning versus stealing: how important are market-share reallocations to India's productivity growth? The World Bank Economic Review, 2013. 27(2): p. 202-228.
92. Nataraj, S., The impact of trade liberalization on productivity: Evidence from India's formal and informal manufacturing sectors. Journal of International Economics, 2011. 85(2): p. 292-301.
93. Topalova, P. and A. Khandelwal, Trade liberalization and firm productivity: The case of India. Review of economics and statistics, 2011. 93(3): p. 995-1009.
94. Kim, E., Trade liberalization and productivity growth in Korean manufacturing industries: price protection, market power, and scale efficiency. Journal of Development Economics, 2000. 62(1): p. 55-83.
95. Melitz, M.J., When and how should infant industries be protected? Journal of International Economics, 2005. 66(1): p. 177-196.
96. Choi, H. and L.D. Anadón, The role of the complementary sector and its relationship with
network formation and government policies in emerging sectors: The case of solar photovoltaics between 2001 and 2009. Technological Forecasting and Social Change, 2014. 82(0): p. 80-94.
97. REN21 Renewables 2016 Global Status Report. 2016. Available from: http://www.ren21.net/status-of-renewables/global-status-report/.
98. PVTech, SolarCity breaks ground on 1GW Silevo fab in New York, Ben Willis. Available from: http://www.pv-tech.org/news/solarcity_breaks_ground_on_1gw_silevo_fab_in_new_york.
99. Platzer, M.D. U.S. Solar Photovoltaic Manufacturing: Industry Trends, Global Competition, Federal Support Federation of American Scientists, 2015. Available from: https://www.fas.org/sgp/crs/misc/R42509.pdf.
100. Press Releases. Wacker Chemie, 2016. Available from: https://www.wacker.com/cms/en/press_media/press-releases/pressinformation-detail_68992.jsp.
134
101. IEA/IRENA global renewable energy policies and measure Database, in International Energy Agency. 2013. Available from: http://www.iea.org/policiesandmeasures/renewableenergy/.
102. Iacob Koch-Weser, E.M. China's Wind and Solar Sectors: Trends in Deployment, Manufacturing and Energy Policy. US China Economic and Security Review Commission, 2015. Available from: http://origin.www.uscc.gov/sites/default/files/Research/Staff Report_China's Wind and Solar Sectors.pdf.
103. WTO, China — Grants, Loans and Other Incentives, in DISPUTE DS387, U. States, Editor. 2008, World Trade Organization. Available from: https://www.wto.org/english/tratop_e/dispu_e/cases_e/ds387_e.htm.
104. Chamber, E., Public Procurement in China: European Business Experiences Competing for Public Contracts in China. 2011, European Union Chamber of Commerce in China. Available from: http://www.cbichina.org.cn/cbichina/upload/fckeditor/EUCCC Public Procurement Study, April 2011.pdf.
105. IEA, National Survey Report of PV Power Applications in China 2013. 2014, International Energy Agency. Available from: http://iea-pvps.org/index.php?id=93&tx_damfrontend_pi1=&tx_damfrontend_pi1%5BcatPlus%5D=&tx_damfrontend_pi1%5BcatEquals%5D=&tx_damfrontend_pi1%5BcatMinus%5D=&tx_damfrontend_pi1%5BcatPlus_Rec%5D=87&tx_damfrontend_pi1%5BcatMinus_Rec%5D=&tx_damfrontend_pi1%5BtreeID%5D=201&tx_damfrontend_pi1%5Bid%5D=93.
106. Gallagher, K.S., et al., The energy technology innovation system. Annual Review of Environment and Resources, 2012. 37: p. 137-162.
107. Campbell, R.J., China and the United States—A Comparison of Green Energy Programs and Policies. 2014, Congressional Research Service Available from: https://www.fas.org/sgp/crs/row/R41748.pdf.
108. Grau, T., M. Huo, and K. Neuhoff, Survey of Photovoltaic industry and policy in Germany and China. 2011, Climate Policy Initiative: San Francisco.
109. Lutkenhorst, W. Germany’s Green Industrial Policy Stable Policies – Turbulent Markets: The costs and benefits of promoting solar PV and wind energy. IISD, 2014. Available from: https://www.iisd.org/gsi/sites/default/files/rens_gip_germany.pdf.
110. Eaton, J. and S. Kortum, Technology, geography, and trade. Econometrica, 2002. 70(5): p. 1741-1779.
111. Leamer, E.E. and J. Levinsohn, International trade theory: the evidence. Handbook of international economics, 1995. 3: p. 1339-1394.
112. Dornbusch, R., S. Fischer, and P.A. Samuelson, Comparative advantage, trade, and payments in a Ricardian model with a continuum of goods. The American Economic Review, 1977. 67(5): p. 823-839.

135
113. Heckscher, E.F. and B.G. Ohlin, Heckscher-Ohlin trade theory. 1991: The MIT Press.
114. Krugman, P., Scale economies, product differentiation, and the pattern of trade. The American Economic Review, 1980. 70(5): p. 950-959.
115. Vernon, R., International investment and international trade in the product cycle. The quarterly journal of economics, 1966: p. 190-207.
116. Mandeng, O.J., International competitiveness and specialization. CEPAL review, 1991.
117. Balassa, B., Trade liberalisation and “revealed” comparative advantage1. The Manchester School, 1965. 33(2): p. 99-123.
118. Siggel, E., International competitiveness and comparative advantage: a survey and a proposal for measurement. Journal of Industry, Competition and Trade, 2006. 6(2): p. 137-159.
119. Buckley, P.J., C.L. Pass, and K. Prescott, Measures of international competitiveness:
A critical survey�†. Journal of marketing management, 1988. 4(2): p. 175-200.
120. Cai, J. and P. Leung, Towards a more general measure of revealed comparative advantage variation. Applied Economics Letters, 2008. 15(9): p. 723-726.
121. Els Van de Velde, P.D., Christian Rammer, Paula Schliessler, Birgit Gehrke, Pia Wassmann, Marcel de Heide, Maurits Butter, Sven Wydra, Oliver Som and Nadezda Weidner, Key Enabling Technologies (KETS) Observatory Methodology Report, in KETs Observatory. 2015, European Commission. Available from: https://ec.europa.eu/growth/tools-databases/kets-tools/sites/default/files/about/final_report_kets_observatory_en.pdf.
122. Shrimali, G., et al., Solving India’s Renewable Energy Financing Challenge: Which Federal Policies can be Most Effective? Climate Policy Initiative, 2014.
123. Shrimali, G. and V. Nekkalapudi, How Effective Has India’s Solar Mission Been in Reaching Its Deployment Targets? Economic and Political Weekly, 2014. 49(42).
124. Sahoo, A. and G. Shrimali, An analysis of industrial policy support for the Indian solar photovoltaic manufacturing sector. Energy Policy, 2013: p. 1470-1480.
125. Fu, R., T.L. James, and M. Woodhouse, Economic Measurements of Polysilicon for the Photovoltaic Industry: Market Competition and Manufacturing Competitiveness. Photovoltaics, IEEE Journal of, 2015. 5(2): p. 515-524.
126. Goodrich, A., et al., A wafer-based monocrystalline silicon photovoltaics road map: Utilizing known technology improvement opportunities for further reductions in manufacturing costs. Solar Energy Materials and Solar Cells, 2013. 114: p. 110-135.
127. Powell, D.M., et al., Modeling the cost and minimum sustainable price of crystalline silicon photovoltaic manufacturing in the United States. IEEE Journal of Photovoltaics, 2013. 3(2): p. 662-668.

136
128. Donovan, C. and L. Nuñez, Figuring what’s fair: The cost of equity capital for renewable energy in emerging markets. Energy Policy, 2012. 40: p. 49-58.
129. Anand, M., Corporate finance practices in India: a survey. Vikalpa, 2002. 27(4): p. 29-56.
130. Bruner, R.F., et al., Best practices in estimating the cost of capital: survey and synthesis. Financial practice and education, 1998. 8: p. 13-28.
131. Farber, A., R.L. Gillet, and A. Szafarz, A General Formula for the WACC. International Journal of Business, 2006. 11(2).
132. Mossin, J., Equilibrium in a capital asset market. Econometrica: Journal of the econometric society, 1966: p. 768-783.
133. Sharpe, W.F., Capital asset prices: A theory of market equilibrium under conditions of risk. The journal of finance, 1964. 19(3): p. 425-442.
134. Lintner, J., The valuation of risk assets and the selection of risky investments in stock portfolios and capital budgets. The review of economics and statistics, 1965: p. 13-37.
135. Fama, E.F. and K.R. French, The capital asset pricing model: Theory and evidence. The Journal of Economic Perspectives, 2004. 18(3): p. 25-46.
136. Graham, J.R. and C.R. Harvey, The theory and practice of corporate finance: Evidence from the field. Journal of financial economics, 2001. 60(2): p. 187-243.
137. Brounen, D., A. De Jong, and K.C. Koedijk. Corporate finance in Europe confronting theory with practice. in EFA 2004 Maastricht Meetings Paper. 2004.
138. Abbas, Q., et al., From regular-beta CAPM to downside-beta CAPM. European Journal of Social Sciences, 2011. 21(2): p. 189-203.
139. Bajpai, S. and A.K. Sharma, An empirical testing of capital asset pricing model in India. Procedia-Social and Behavioral Sciences, 2015. 189: p. 259-265.
140. Cheung, Y.-L. and K.-T. Wong, An assessment of risk and return: some empirical findings from the Hong Kong stock exchange. Applied Financial Economics, 1992. 2(2): p. 105-114.
141. Gupta, O. and S. Sehgal, An empirical testing of capital asset pricing model in India. Finance India, 1993. 7(4): p. 863-874.
142. Bowman, R.G. and S.R. Bush, Using comparable companies to estimate the betas of private companies. Journal of Applied Finance, Forthcoming, 2007.
143. Hamada, R.S., The effect of the firm's capital structure on the systematic risk of common stocks. The Journal of Finance, 1972. 27(2): p. 435-452.
144. Blume, M.E., On the assessment of risk. The Journal of Finance, 1971. 26(1): p. 1-10.
145. Klemkosky, R.C. and J.D. Martin, The adjustment of beta forecasts. The journal of Finance, 1975. 30(4): p. 1123-1128.

137
146. Tata Power Company Ltd (TTPW.NS). Markets, 2016. Available from: http://in.reuters.com/finance/stocks/overview?symbol=TTPW.NS.
147. Moser Baer India Ltd (MOSR.NS). Markets, 2016. Available from: http://in.reuters.com/finance/stocks/overview?symbol=MOSR.NS.
148. Installed Capacity. 2016. Available from: http://mnre.gov.in/file-manager/UserFiles/grid-connected-solar-power-project-installed-capacity.pdf.
149. National Manufacturing Policy. 2011, Department of Industrial Policy and Promotion, India.
150. Make in India. Policies, 2016. Available from: http://www.makeinindia.com/policies.
151. Modified Special Incentive Package Scheme(M-SIPS) Department of Electronics and Information Technology (DeitY), 2016. Available from: http://deity.gov.in/esdm/incentive-schemes.
152. Global solar manufacturers look to India for new manufacturing capacity. Bridge to India, 2015. Available from: http://www.bridgetoindia.com/blog/global-solar-manufacturers-look-to-india-for-new-manufacturing-capacity/.
153. Solar Cells/Modules manufacturing capacities. Ministry of New and Renewable Energy, 2016. Available from: http://mnre.gov.in/file-manager/UserFiles/information-sought-from-all-Solar-Cell-&-Module-manufacturers.pdf.
154. Johnson, O., Exploring the effectiveness of local content requirements in promoting solar pv manufacturing in India. 2013.
155. MNRE, Jawaharlal Nehru National Solar Mission, Guidelines for Selection of New Grid Connected Solar Power Projects Batch II. 2011. Available from: http://mnre.gov.in/file-manager/UserFiles/jnnsm_gridconnected_24082011.pdf.
156. Ganesan, K., et al., Assessing Green Industrial Policy. 2014.
157. MNRE, National Solar Mission Phase II (2013-2017), Draft Guidelines for Selection of 3000 MW Gridconnected. 2014. Available from: http://mnre.gov.in/file-manager/UserFiles/Draft-Guidelines-for-Batch-II-Phase-II-Tranche-I.pdf.
158. WTO 2015. Available from: https://www.wto.org/english/res_e/statis_e/trade_data_e.htm.
159. Rao, B.V.G.P.S., Polysilicon Manufacturing in India: Go or No-Go CSTEP, Editor. 2015: Center for Science and Technology Policy. Available from: http://www.cstep.in/uploads/default/files/publications/stuff/e6b6ea9036335c4ae589f35cd0d3f86b.pdf.
160. PV Manufacturing. 2016. Available from: http://www.greenrhinoenergy.com/solar/industry/ind_02_wafers.php
138
161. Detailed Export Data of ingot casting machine under HS Code 8454. Zauba, 2016. Available from: https://www.zauba.com/export-INGOT+CASTING+MACHINE/hs-code-8454-hs-code.html.
162. India, B.t., DC cable design and performance issues, in INDIA SOLAR EXCELLENCE. 2016. Available from: http://www.bridgetoindia.com/wp-content/uploads/2016/11/BRIDGE-TO-INDIA_india-solar-excellence_-November-2016-Online.pdf.
163. NRDC, Solar Power Jobs: Exploring the Employment Potential of India's Grid Connected Solar Market. 2014. Available from: http://www.nrdc.org/international/india/files/renewable-energy-solar-jobs-report.pdf.
164. Berelson, B., Content analysis in communication research. 1952.
165. Ryan, G.W. and H.R. Bernard, Data management and analysis methods. 2000.
166. Boyatzis, R.E., Transforming qualitative information: Thematic analysis and code development. 1998: Sage.
167. Joffe, H. and L. Yardley, 4. Content and thematic analysis. Research methods for clinical and health psychology. California: Sage, 2004: p. 56-68.
168. Krippendorff, K., Content analysis: An introduction to its methodology. 2004: Sage.
169. Braun, V. and V. Clarke, Using thematic analysis in psychology. Qualitative research in psychology, 2006. 3(2): p. 77-101.
170. McLeod, J. and S. Balamoutsou, A method for qualitative narrative analysis of psychotherapy transcripts. Psychological Test and Assessment Modeling, 2001. 43(3): p. 128.
171. Holloway, I. and L. Todres, The status of method: flexibility, consistency and coherence. Qualitative research, 2003. 3(3): p. 345-357.
172. Riessman, C.K., Narrative analysis. Vol. 30. 1993: Sage.
173. MNRE, Performance analysis of Grid Connected Solar Power projects commissioned
under Phase – I of
JNNSM for the period of January 2014 to December 2014. 2015. Available from: http://mnre.gov.in/file-manager/UserFiles/Performance-analysis-of-Grid-Connected-Solar-Power-Projects-Commissioned-under-Phase %E2%80%93I.pdf.
174. Mathews, J.A. and H. Tan, Manufacture renewables to build energy security. Nature, 2014. 513(11): p. 166-168.
175. Kristinsson, K. and R. Rao, Interactive Learning or Technology Transfer as a Way to Catch�Up? Analysing the Wind Energy Industry in Denmark and India. Industry and Innovation, 2008. 15(3): p. 297-320.
139
176. Series, A., Solving India’s Renewable Energy Financing Challenge: Instruments to Provide Low-cost, Long-term Debt. 2014.
177. Agrawal, A., Risk mitigation strategies for renewable energy project financing. Strategic Planning for Energy and the Environment, 2012. 32(2): p. 9-20.
178. Sud, N., Governing India’s Land. World Development, 2014. 60: p. 43-56.
179. Policy and Emerging Markets: Setting the Stage for the Next Wave of Solar Deployment. Lux Research Inc., 2016. Available from: http://www.luxresearchinc.com/sites/default/files/Solar_KTA_7_8_16.pdf.
180. Trina Solar signs MoU for $518m fab in India's Andhra Pradesh Read more: http://www.pv-magazine.com/news/details/beitrag/correction--trina-solar-signs-mou-for-518m-fab-in-indias-andhra-pradesh_100022023/ - ixzz4Gl6Vbucs. PV Magazing, 2015. Available from: http://www.pv-magazine.com/news/details/beitrag/correction--trina-solar-signs-mou-for-518m-fab-in-indias-andhra-pradesh_100022023/ - axzz4Gl4M37rZ.
181. PVInsights. Spot Prices. 2016 [cited 2016 June 1 2016]; Available from: http://pvinsights.com/.
182. Kenning, T. Indian solar cell manufacturers request second anti-dumping investigation. 2015 September 29, 2015; Available from: http://www.pv-tech.org/news/indian_solar_cell_manufacturers_request_second_anti_dumping_investigation.
183. BridgetoIndia INDIA SOLAR HANDBOOK, 2016 EDITION. Bridge to India, 2016. Available from: http://www.bridgetoindia.com/reports/india-solar-handbook-2016/.
184. Kenning, T. India solar target progress ‘satisfactory’ but quality issues remain. 2016 November 24, 2016 [cited 2016 December 14, 2016]; Available from: http://www.pv-tech.org/news/india-solar-target-progress-satisfactory-but-quality-issues-remain.
185. Saha, I., Quality of PV modules to define India’s Solar Dream, in Energetica. 2015. Available from: http://www.energetica-india.net/download.php?seccion=articles&archivo=5R76qcZ0ZBOA3nJncGpj7HdqfTWz2QFxLwOkvompdmyFD6EteAsl.pdf.
186. Shen, J. and C. Luo, Overall review of renewable energy subsidy policies in China–Contradictions of intentions and effects. Renewable and Sustainable Energy Reviews, 2015. 41: p. 1478-1488.
187. Zhang, S., et al., Interactions between renewable energy policy and renewable energy industrial policy: A critical analysis of China's policy approach to renewable energies. Energy Policy, 2013. 62: p. 342-353.
188. Wang, Y.-h., G.-l. Luo, and Y.-w. Guo, Why is there overcapacity in China's PV industry in its early growth stage? Renewable Energy, 2014. 72: p. 188-194.
140
189. INDIA SOLAR HANDBOOK, 2016 EDITION. Bridge to India, 2016. Available from: http://www.bridgetoindia.com/reports/india-solar-handbook-2016/.
190. Hallegatte, S., M. Fay, and A. Vogt-Schilb, Green industrial policies: When and how. Policy Research Working Paper Series, 2013. 6677.
191. Zhang, F., et al., Analysis of distributed-generation photovoltaic deployment, installation time and cost, market barriers, and policies in China. Energy policy, 2015. 81: p. 43-55.
192. Pope, C. Powering the World’s Poorer Economies: A Response to Bill Gates and Jigar Shah. 2014 August 24 2014; Available from: https://www.greentechmedia.com/articles/read/powering-the-worlds-poorer-economies-a-response-to-bill-gates-and-jigar-s.
193. Group, W.B., World Development Indicators 2012. 2012: World Bank Publications.
194. Fu, X. and J. Zhang, Technology transfer, indigenous innovation and leapfrogging in green technology: the solar-PV industry in China and India. Journal of Chinese Economic and Business Studies, 2011. 9(4): p. 329-347.
195. Fan, P. and C. Watanabe, Promoting industrial development through technology policy: Lessons from Japan and China. Technology in Society, 2006. 28(3): p. 303-320.
196. STATISTICS ON EMPLOYMENT & LABOUR COST. Annual Survey of Industries, 2012. Available from: http://labourbureau.nic.in/ASI_VOL1_2011_12.pdf.
197. The Shifting Economics of Global Manufacturing. BCG Perspectives, 2014. Available from: https://www.bcgperspectives.com/Images/The_Shifting_Economics_of_Global_Manufacturing_Aug_2014.pdf.
198. India Government Bond 10Y (1994-2016). Trading Economics, 2016. Available from: http://www.tradingeconomics.com/india/government-bond-yield.
199. Damodaran Data: Tools and Support. Damodaran Online, 2016. Available from: http://pages.stern.nyu.edu/~adamodar/.
200. MSCI India Index (INR). 2016. Available from: https://www.msci.com/resources/factsheets/index_fact_sheet/msci-india-index-inr-gross.pdf.
201. Land Rates for Industrial Parks. 2016. Available from: http://www.apiic.in/wp-content/uploads/2016/07/land_rates_31.05.2016.pdf.
202. DETAILS OF LAND / MODULES AVAILABLE IN DIFFERENT INDUSTRIAL PARKS OF WBIDC. West Bengal Investment Development Corporation, 2016. Available from: http://www.wbidc.com/industrial_parks/available_land.htm.

141
203. GHARExpert Estimator. 2016. Available from: http://www.gharexpert.com/Estimator/Estimator_Finish.aspx?Area=43560&ClientId=374536&TabID=8&BID=1&T_Typ=53&Est_Id=525814.
204. Deloitte, Oil and Gas Taxation in India: Deloitte Investment and Taxation Guide. 2014, Deloitte India. Available from: http://www2.deloitte.com/content/dam/Deloitte/global/Documents/Energy-and-Resources/gx-er-oilandgas-india.pdf.
205. Sontakke, M. China: The new silicon valley. Investing in renewable energy: The solar power industry PART 8 OF 24 2015; Available from: http://marketrealist.com/2015/02/china-new-silicon-valley/.
206. Bloomberg New Energy Finance. 2015 PV Market Outlook, 2015. Available from: http://about.bnef.com/landing-pages/q2-2015-pv-market-outlook/.
207. 2015 Poly and Wafer Rankings. 2016. Available from: http://www.bernreuter.com/fileadmin/user_upload/library/2015-poly-and-wafer-rankings_pv-magazine-04-2016.pdf.
208. International Comparisons of Hourly Compensation Costs in Manufacturing. Bureau of Labout Statistics, US Department of Labor, 2012. Available from: http://www.bls.gov/news.release/pdf/ichcc.pdf.
209. Zhi, Q., et al., China’s solar photovoltaic policy: An analysis based on policy instruments. Applied Energy, 2014. 129: p. 308-319.
210. Pradesh, G.o.M., Industrial Promotion Policy. 2014. Available from: http://www.indianchamber.org/wp-content/uploads/2015/06/MP-Industry-Policy-2014.pdf.
211. IHS confirms solar wafer supply shortage in 2016. IHS Markit, 2016. Available from: https://technology.ihs.com/571152/ihs-confirms-solar-wafer-supply-shortage-in-2016.
212. 1366 Bets on Silicon Wafer Innovation with New Solar Plant. Technology Review, 2015. Available from: https://www.technologyreview.com/s/542416/1366-bets-on-silicon-wafer-innovation-with-new-solar-plant/.
213. Swanson, R.M., A vision for crystalline silicon photovoltaics. Progress in Photovoltaics: Research and Applications, 2006. 14(5): p. 443-453.
214. ‘Silicon Module Super League’ big-six to reach 50% global market share in 2016. PVTECH, 2015. Available from: http://www.pv-tech.org/editors-blog/42568.
215. Mints, P. 2015 Top Ten PV Cell Manufacturers. Renewable Energy World, 2016. Available from: http://www.renewableenergyworld.com/content/dam/rew/onlinearticles/2016/04/REW_2015Top10PV2.png.

142
216. Investor Relations. JASolar, 2015. Available from: http://investors.jasolar.com/phoenix.zhtml?c=208005&p=irol-reportsannual.
217. Investor Relations. Trina Solar, 2015. Available from: http://ir.trinasolar.com/phoenix.zhtml?c=206405&p=irol-reportsAnnual.
218. Investor Relations. Hanwha Q Cells, 2016. Available from: http://investors.hanwha-qcells.com/sec.cfm?view=all.
219. Rajasthan, G.o., Rajasthan MSME Policy 2015. 2015. Available from: http://swcs.rajasthan.gov.in/%5CUpload%5Ca9305176-cf8f-4494-86f9-c3983f022d68rajasthan-msme-policy-2015.pdf.
220. Pradesh, G.o.U., Key Fiscal Incentives under Uttar Pradesh Infrastructure & Industrial Investment Policy (IIIP) 2012. 2012, Government of Uttar Pradesh. Available from: http://www.upkvib.gov.in/IIIP_Highlight_2012.pdf.
221. Pradesh, G.o.A., Industrial Development Policy 2015-20 2014. Available from: http://www.apiic.in/wp-content/uploads/2016/02/Indl-dev-policy-2015-20.pdf.
222. KPMG, Karnataka Industrial Policy 2014-19. 2014. Available from: https://home.kpmg.com/content/dam/kpmg/pdf/2014/12/Karnataka-Industrial-Policy-2014-19.pdf.
223. KPMG, Maharashtra Industrial Policy 2013. Available from: http://www.kpmg.com/IN/en/services/Tax/FlashNews/MaharashtraIndustrialPolicy2013.pdf.
224. Jharkhand, G.o., Jharkhand Industrial And Investment Promotion Policy 2016. 2016, Government of Jharkhand. Available from: http://jharkhandindustry.gov.in/JIIPP2016.pdf.
225. Gujarat, G.o., New Industrial Policy Scheme for MSME Assistance. 2015. Available from: http://ic.gujarat.gov.in/wp-content/uploads/2015/01/102014-924840-CH.pdf
226. Chhattisgarh, G.o., Industrial Policy 2014-19. 2013. Available from: http://nagarnigamraipur.nic.in/Document/304528eb-1f7d-468a-b447-e6c5541ac26b__4 Industrial_Policy2014-19_English.pdf.
227. NREL. Research Topics. 2016 [cited 2016; Available from: https://energy.gov/eere/education/research-topics.
228. SEIA Solar Energy Industries Association. 2015. Available from: http://www.seia.org/policy/.
229. Nunn, N. and D. Trefler, The political economy of tariffs and long-term growth. Cambridge, MA: Harvard University. Mimeo. Available at www. economics. harvard. edu/faculty/nunn/files/lobbying. pdf, 2007.