Embed Size (px)
Citation preview

PLANNING COMMISSION
Working Paper No. 2/2006-PC
LESSONS OF GOVERNMENT FAILURE:
Public Goods Provision and Quality of Public Investment
Arvind Virmani
February 2006

LESSONS OF GOVRNMENT FAILURE: PUBLIC GOODS PROVISION AND QUALITY OF PUBLIC INVESTMENT
Arvind Virmani∗
FEBRUARY 2006
∗ Any views expressed in the paper are those of the author and do not represent those of the organisation for which he works.


CONTENTS Page No.
1 INTRODUCTION 1
2 LESSONS OF INTERVENTION 2
3 SUB-PHASES OF INDIAN SOCIALISM 5
4 ECONOMETRIC RESULTS 10
5 BACK TO BASICS 12 5.1 Focus Govt Attention & Resources 14 5.2 Public Goods & Services 14 5.3 Quasi-Public Goods & Services 16 5.4 Notorious Bureaucracy 17
6 PRIVATE GOODS AND SERVICES 18 6.1 Infrastructure development 18
7 CONCLUSIONS 19
8 REFERENCES 21
TABLES
TABLE 1: COMPARATIVE ECONOMIC PERFORMANCE DURING TWO DEVELOPMENT PHASES 5
TABLE 2: COMPARATIVE PERFORMANCE IN SUB-PHASES OF INDIAN SOCIALISM 6 TABLE 3: COMPARATIVE PERFORMANCE DURING SUB-PHASES OF MARKET REFORM 10 TABLE 4: REFOCUSING GOVERNMENT EXPENDITURES AND ADMINISTRATION 15

1
1 INTRODUCTION
Virmani (2004c) statistically defines two major phases of economic growth in
India’s post-independence history. These are associated with different policy
regimes, which can be termed the ‘Indian version of Socialism (IVS)’ or simply
‘Indian Socialism’ and ‘Experiments in Market Reform (EMR).’ The turning point
occurred around 1980-81. Each of these two regimes was associated with a set of
economic policies. Virmani (2005) shows that in the 55 year economic history of
India several conventionally assumed drivers of growth such as agriculture and public
investment have not had a significant effect on growth. In this paper we focus on
government investment and expenditure policies.
Going beyond the growth experience, Virmani(2005c) also tries to relate the
policy experience to the issues of aggregate poverty, income distribution and hunger
at an aggregate level. The broad theme that emerges from the analysis and which is
the focus of the current paper is that the failures on this front, apart from the indirect
effects of growth, are linked directly to the failure of governance. This failure has
many dimensions; the misallocation of government resources, the failure to follow
norms of social benefit-cost analysis that were the reason-de-tar for the introduction
of national planning, the neglect of public and quasi-public goods that are the most
fundamental justification for the existence of government and a gradual (over
decades) but progressive deterioration in the quality of governance.
Section 2 and 3 summarise the lessons that emerge from the history of
government intervention in India. Section 2 derives the lessons by comparing the
socialist period with the market reform period. Section 3 delves a little deeper into
the sub-phases of Indian socialism. Section 4 presents a more rigorous analysis
showing the effect of government investment on growth. Section 5 and 6 draws out
the implications for policy of the fifty years of experience of government intervention.
Section 5 focuses on government expenditure policy while section 6 touches on the
role of private sector in infrastructure development. Section 7 concludes the paper.

2
2 LESSONS OF INTERVENTION There are significant lessons from comparing the policy regime and its outcome
during phase I (1950-1 TO 1979-80) with that during phase II (1980-1 to present).
The most important lesson for Indian academics and policy advisors is that,
Lesson 1.1: The government is neither omniscient (all knowing) nor omnipotent (all
powerful) nor omni-competent. Even with the best of intentions and motivations it
can and does fail spectacularly. More commonly it has traits that are the opposite of
those commonly assumed by those who expect government to solve any and all
problems.
The post-independence political and administrative leadership was highly
motivated, educated and honest. This situation prevailed for at least 15 years or half
the phase of Indian socialism (after which it perhaps started atrophying gradually).
Despite its sincere efforts to develop India and rid it of the scourge of poverty, the
proportion of citizens below the poverty increased. Despite drawing on the best
development economists in the world and pioneering the concept of mixed economy
and non-communist (sometimes referred to as ‘Fabian’) socialism, development
performance as measured by the rate of per capita income was extremely poor
compared to other countries.1 The problem lay in the policy regime, the Indian
version of socialism, as the dramatic improvement of performance during phase II
demonstrates.
One of the philosophical foundations of Indian socialism was that private
consumption of the rich (‘well off’ or ‘better off’) must be reduced and their resources
diverted into the public sector (directly through taxes or indirectly through the
financial system). The result, contrary to assumptions was an increase in poverty. The
puzzle is that poverty increased despite a growth of per capita income! Government
was clearly appropriating too much resource, leaving little for the general public.
Growth of government consumption was much higher (average 5.8% per year) than
the growth of GDP (3.5% per annum). Private consumption grew even slower (3.2%
per annum) than economic growth. Logically this would mean that, the consumption
distribution worsened, at least around (and just above) the middle of the income
distribution. Alternatively either (a) the NAS data on income and consumption is 1 Its performance when measured by other human development indicators such as literacy was even worse.

3
wrong or (b) poverty is not appropriately measured because of incorrect or
inappropriate deflators used in adjusting the poverty line over time or (c) the NSS data
is not capturing the time trends correctly. It is highly unlikely that per capita GDP or
average private consumption declined over the 30 years till 1979-80, so the problem
must lie in the poverty estimates as Bhalla (2003a) has argued. The same problem in
fact continues into subsequent years.
The second lesson is that,
Lesson 1.2: The role of Private consumption in economic growth and poverty
reduction can be more important than that of Government/Public Consumption.
One of the important pillars of the economic strategy under Indian socialism was to
control private consumption (through controls on, production of and investment in,
consumer goods and taxation of such goods) and divert resources into the government
through steep/exorbitant income taxes. For instance the effective marginal tax on
income from capital (including wealth tax) rose to 100% in the mid-seventies. As a
consequence government consumption grew at 5.8% per annum, much faster than the
rate of GDP growth. Though government consumption has continued to grow at over
6% per annum, the anti-consumer policy was gradually diluted during phase II and
finally abandoned in the nineties. Faster growth of private consumption has therefore
driven the poverty reduction in phase II and probably contributed to the acceleration
in growth through increased aggregate demand and consequent higher capacity
utilisation and increase in expected profitability of private investment in new
consumer goods.
The third lesson is,
Lesson 1.3: Government Investment is neither necessary nor sufficient for Growth.
Corollary 1.3.1: The importance of government investment as a driver of growth has been overrated and the importance of private investment underrated. Government investment in ‘private goods and service’ is a substitute for private investment and will have zero direct effect on growth (assuming equal efficiency). The net effect is negative if we take account of tax distortions to raise funds for government investment.
Corollary 1.3.2: The efficiency of investment is critical to growth. Government investment that is not driven by social benefit-cost considerations can be highly inefficient. A monopolistic government sector is likely to be highly inefficient and can retard growth.

4
Between phase I (1950-1 to 1979-80) and phase II (1980-1 to present) the average rate
of growth of Public investment declined to 2.8% per annum a third of its earlier
average of 7.5%, while the rate of growth of private investment almost doubled from
4.3% to 8.4% per annum (table 1). Thus the decline in the rate of growth of
government/public investment did not have a negative effect on growth and may have
had a positive effect by creating space for an acceleration of private investment.
Private investment clearly played a positive role in the growth acceleration. The
reason for this result is that unlike private investment the allocation of public
investment and its efficiency is neither responsive to profits nor disciplined by losses.
Gresham’s law applies with a vengeance. Pet theories and vested interest can drive
public investment not only into the most unprofitable activities but also into the most
socially unproductive channels, with everything being justified in the name of the
poor and the public.2
The fourth lesson,
Lesson 1.4: Though investment is necessary for growth the key driver of total productivity growth and overall growth is investment in machinery.
Between phases I and II the rate of growth of investment increased marginally
from 6.1% to 6.3% while the rate of growth of fixed investment and machinery
investment accelerated by 31% and 34% respectively. The acceleration in investment
and GDP growth was driven by the acceleration in machinery investment from an
average of 6.6% per annum to an average of 8.8% per annum. Mis-allocation of
public investment and its efficiency are the primary reasons for this outcome:
2 As the acting/temporary incharge of the Program evaluation organisation (PEO) in the Planning Commission during 2001-2002 I was shocked to find that the social cost benefit analysis of programs even of the kind discussed in the literature (eg Little-Mirlees) in the fifties was virtually non-existent for social programs.

5
Table 1: Comparative Economic Performance During Two Development Phases (Average Growth Rate of variable during the period)
Phase=> I: Indian Socialism II: Market Reform Period=> 1951-2 to 1979-80 1980-1 to 2003-4
No Variable 1 GDP at factor cost 3.5% 5.8% 2 World rank in GDP growth 60/74* 9/88 3 Per capita GDP 1.3% 3.7% 4 World rank in per capita
growth 66/76* 9/88
5 Poverty rate (HCR) 0.2% -0.8%
8 Total Factor Productivity Growth
0.9% 2.7%
9 Consumption: Private 3.2% 4.6%
10 Consumption: Government 5.8% 6.0%
11 Investment: Total 6.1% 6.3% 12 Investment: Public 7.5% 2.4% 13 Investment: Private 3.6% 8.7% 14 Investment: Fixed 4.8% 6.2% 15 Machinery 6.6% 8.8% 16 Structures 4.4% 4.5% 17 Private (fixed) 3.6% 8.7% 18 Electricity, Gas & Water 15.2% 4.4% 19 Railways 2.4% 3.7% 20 Communications 9.7% 11.5%
3 SUB-PHASES OF INDIAN SOCIALISM The phase of Indian Socialism can be further sub-divided into two sub-phases.
In sub-phase IA (1950-1 to 1965-6) government investment in Public and
Quasi-public goods vied with investment in production of private goods classified as
commanding heights. The distinction between ‘private goods’ and “public goods”
seems to have been missing from the Indian discourse in Phase I. The former are
goods & services (G&S) for which private markets routinely exist and production of
which by the government merely displaces private production. The latter are G&S for
which there are no markets and therefore government supply can add to total output.
“Quasi-public” goods and services, which fall in the grey area between the two, can
be defined as those “private goods having substantial externalities e.g. Drinking
water, irrigation dams, primary education (see also chart 4 in appendix). In 1960-61,
30% of public investment went into Administration and Defence, 19% into Railways
6
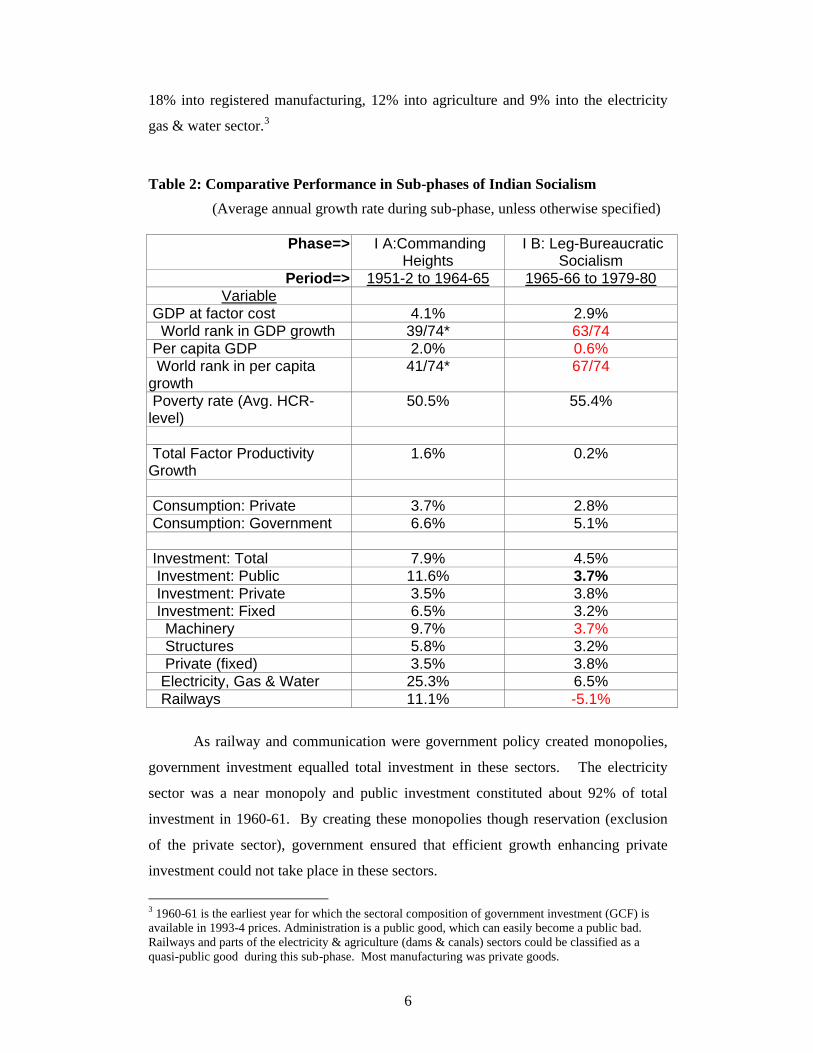
18% into registered manufacturing, 12% into agriculture and 9% into the electricity
gas & water sector.3
Table 2: Comparative Performance in Sub-phases of Indian Socialism
(Average annual growth rate during sub-phase, unless otherwise specified)
Phase=> I A:Commanding Heights
I B: Leg-Bureaucratic Socialism
Period=> 1951-2 to 1964-65 1965-66 to 1979-80 Variable
GDP at factor cost 4.1% 2.9% World rank in GDP growth 39/74* 63/74 Per capita GDP 2.0% 0.6% World rank in per capita growth
41/74* 67/74
Poverty rate (Avg. HCR-level)
50.5% 55.4%
Total Factor Productivity Growth
1.6% 0.2%
Consumption: Private 3.7% 2.8% Consumption: Government 6.6% 5.1%
Investment: Total 7.9% 4.5% Investment: Public 11.6% 3.7% Investment: Private 3.5% 3.8% Investment: Fixed 6.5% 3.2% Machinery 9.7% 3.7% Structures 5.8% 3.2% Private (fixed) 3.5% 3.8% Electricity, Gas & Water 25.3% 6.5% Railways 11.1% -5.1%
As railway and communication were government policy created monopolies,
government investment equalled total investment in these sectors. The electricity
sector was a near monopoly and public investment constituted about 92% of total
investment in 1960-61. By creating these monopolies though reservation (exclusion
of the private sector), government ensured that efficient growth enhancing private
investment could not take place in these sectors.
3 1960-61 is the earliest year for which the sectoral composition of government investment (GCF) is available in 1993-4 prices. Administration is a public good, which can easily become a public bad. Railways and parts of the electricity & agriculture (dams & canals) sectors could be classified as a quasi-public good during this sub-phase. Most manufacturing was private goods.

7
The growth of Government consumption at 6.6% also far exceeded economic
growth. In contrast the growth rate of private consumption was a very modest 3.7%
per annum a rate slower than that of GDP growth. Thus the ratio of government to
private consumption also rose sharply during this sub-phase.
Many analysts of the slowdown in economic growth during the sixties have
attributed it either to the decline in government investment or to a slowdown in
agriculture. Rate of growth of public investment certainly declined sharply during
sub-phase IA. But the rate of growth was even lower during the second phase when
growth picked up significantly (table 1). Further, the rate of growth of public
investment continued to decline during both sub-phases of the second phase while
growth accelerated. The railway and telecommunication sectors were completely
monopolised by the government, while in the electricity government instituted a
public monopoly on Greenfield investment. In 1960 investment by existing private
companies was less than 8% of the total. Deceleration of investment in these
infrastructure sectors was therefore largely due to a deceleration in public investment.
Growth in fixed investment in railways fell from 11.1% per annum in sub-phase IA to
-5.1% per annum in sub-phase IB, in telecom from 13.1% to 6.8% and in electricity
from 25.3% per annum to 6.5% per annum. Telecom growth recovered in phase II and
remained strong, while in railway and electricity it recovered in sub-phase IIA and
decelerated again in sub-phase IIB. Given the government created monopoly (i.e. little
or no opportunity for private investment) a deceleration of public investment in these
sectors could have had a negative effect on growth.
It must be remembered, however, that the massive expansion of public
investment, though it did build needed infrastructure, was seldom based on allocating
resources where the highest social return was to be found. Further, public
monopolies, once built by the government, had little incentive to behave better than
any private monopoly. This led to a build-up of X-inefficiency in public monopolies
and gradual deterioration in the supply of public and quasi-public goods. Though
initially government investment may have complemented private investment, over
time an increasing proportion began substituting for and crowding out private
investment and consumption. The dead weight loss of taxation in transferring
consumption from private to public account contributed to the crowding out of private
by public activity. The solution to slowing investment in these infrastructure sectors

8
did not necessarily lie in greater public investment but in allowing private entry into
these infrastructure sectors, stimulating competition in whichever segment possible
and regulating natural monopoly segments like electricity distribution and railway
lines.
Despite the deceleration in the growth of public investment in each of the four
sub-periods, growth increased dramatically in phase II (i.e. sub-phase IIA).
Lesson 2.4: The sharp slowdown in public investment in phase IB had no perceptible affect on the growth rate of the economy. Government investment is neither a sufficient nor a necessary condition for growth.
There are two critical dimensions to public investment in the production of
goods and services (G&S). (a) Whether it is for a Private, Public or Quasi-public
(private with significant externalities) good. (b) The degree of competition permitted
by the government e.g. a monopoly (oligopoly) created by banning private production
(entry or investment). (c) The degree of substitution with other services (e.g.
transport-road, rail, air) or the potential for competition from under ground sources of
supply (illegal private generator sets). Creation of government monopoly in Quasi-
public and private goods (electricity, railway, telephone network before the advent of
‘mobile’) made economic growth dependent on government investment in these
sectors. The efficiency of public governance deteriorated over time and X-
inefficiency rose unchecked in the absence of independent regulation.
Lesson 2.5: The effect of government investment depends on the category of goods & services in which it is made, the policy framework (e.g. entry barriers) and the presence of (legal & illegal) substitutes. Changes in government investment in the production of private goods and services in a competitive industry have no direct effect on growth (assuming ownership does not affect efficiency)
Corollary 2.5.1 The net effect of a reduction of government investment in private goods on growth could therefore be positive if it is financed by (distorting) tax revenues.
Lesson 2.6: A slowdown of fixed investment in govt-monopolised Quasi-public services has a negative impact on GDP growth, but the impact is reduced over time (ipso facto).4 As the monopoly ages, X-inefficiency increases, governance deteriorates and substitutes (legal & illegal) develop.
4 Time being measured from the point at which the government monopoly was created.

9
The solution is a policy framework that, (a) facilitates efficient production &
regulation. (b) An independent professional regulatory system that promotes
competition & minimises regulatory costs. (c) Institutional innovation that
breaks/reverses the deteriorating trend in efficiency & governance and (d) government
investment focussed on public & quasi-public goods with the highest social return.
The first two have been seen in Telecom (of and on /in fits and starts) and the last two
in Highways (NHAI).
Externalities in ‘natural monopoly’ sectors can be represented by a bell curve
(inverted U) with population density on the horizontal (X) axis and the gap between
social and private return on the vertical (Y) axis. The relatively high-density rural
areas in the middle have the largest externality (gap between social and private
returns) and thus are the most worthy of government intervention.
The constitution enjoined the State to provide education. The courts
interpreted these to create a government monopoly over Primary and Secondary
education (State list) and degree granting colleges/universities (Central list). The
government(s) took 40 years to set up a network of schools, where on average 25% of
teachers are absent from school, another 25% are absent from the class, and 5% or
more are just sitting in class. (Choudury et all (2005)). Overall the quality of teaching
is abysmal, despite teachers getting much higher salary than in the reluctantly
permitted, bureaucratically oppressed, non-profit schools. A government monopoly
coupled with low accountability and poor governance is the worst possible solution to
any economic or social problem. Our constitutionally mandated and court interpreted
education system is an approximation of this hypothetical one. The solution is greater
accountability (via user groups) to those who are directly affected by this failure,
namely the parents and grandparents of school age children. Sustained accountability
also requires the involvement of Panchayati Raj institutions (local level for primary,
block for secondary) and non-govt organisations.

10
Table 3: Comparative Performance During Sub-Phases of Market Reform
Phase=> II A: Basic Reform II B: Wider Reform Period=> 1980-1 to1991-2 1992-3 to 2003-4
Variable GDP at factor cost 5.5% 6.1% World rank in GDP growth 12/88 9/107 Per capita GDP 3.2% 4.1% World rank in per capita growth
14/88 9/107
Poverty rate (HCR-level) 38.0% 35.3% Total Factor Productivity Growth
2.6% 2.8%
Consumption: Private 4.5% 4.8% Consumption: Government 6.0% 6.1%
Investment: Total 5.0% 7.6% Investment: Public 2.9% 2.0% Investment: Private 7.3% 10.3% Investment: Fixed 5.6% 6.9% Machinery 8.5% 9.2% Structures 3.7% 5.4% Private (fixed) Electricity, Gas & Water 7.8% 0.3% Railways 5.0% 2.2% Communications 12.3% 10.6%
4 ECONOMETRIC RESULTS Another factor that has often been asserted as a driver of growth in India is
public investment. Empirically we find that the effect of public investment is either
statistically insignificant (OLS) or negative (simple TSLS).
Equation: GrGdp=0.035+0.024 D81 + 0.196 drainm – 0.11drainm(-1) -0.0*GrIpub
(10)*** (5.4)*** (6.5)*** (-3.4)*** (0) -0.35 AR(1) (-2.5)**
R2 = 0.63, R2 (adj) = 0.59, DW = 2.1.
GrIpub is the rate of growth of Public investment (at constant prices). Neither
this variable nor the rate of growth of fixed investment by the public is significant
when introduced into equation 3. Thus growth equations do not provide any support

11
to the contention that government investment per se is an important determinant of
GDP growth in India.
These results could be either because the allocation of public investment is bad
or because public investment is inefficient in India or both. It therefore leaves open
the possibility that investment in public goods (e.g. connecting roads, modern courts
& police systems), utilities (e.g. electricity) or infrastructure (e.g. ports, airports, and
railway lines) has a positive effect on other sectors. The systems of allocation of
funds as well as the incentives of publicly run organisations have not, however, been
able to capitalise on these externalities. A policy framework that promotes private
entry and competition in these sectors and reduces policy risk through professional
regulation of monopoly elements is likely to produce much better results than larger
public investment in public monopolies riddled with X-inefficiency.
The monopolisation of infrastructure sectors by the government also had the
unfortunate effect of converting a technical issue into an ideological one. The
technical issue was one of degree of complementarily between production of and
investment in infrastructure (or utility) services and the other sectors of the economy.
This was converted into an ideological issue of the complementarily between public
investment and private investment. A priori one would expect that electricity and to a
lesser extent modern communications and transport are complements to modern
industrial production and market systems. The technical possibility of
complementarily or substitutability does not, depend on whether one or other or both
are private or government owned.5 The fact that these sectors were under government
monopoly misled many economists into thinking and arguing as if the issue was one
of complementarily between private and government investment in all sectors (i.e.
including manufacturing, mining, agriculture and other services).
One existing initiative that will contribute to structural transformation of the
economy is the building of National & State highways and their inter linkage to towns
and villages.
5 The best way to estimate substitutability can however depend critically on the ownership pattern and consequently the incentives and behaviour of the managers.

12
5 BACK TO BASICS The conventional wisdom is that the role of government was curbed by the
new economic policy introduced in 1991-92. In fact, the public sector’s share of GDP
rose to its peak of 26.7% in 1998-99.6 The public sector’s share of Gross Fixed
Capital Formation peaked several years before the 1990’s reforms (at 52.8% in 1987-
88) because the government had no savings left to invest. Since then the public share
in GDP has indeed gone down to about a fourth and its share of fixed investment
(GFCF) has gone down to less than a third.
The government’s thirst for intervention in all spheres of economic and social
activity has far exceeded its ability to achieve positive outcomes in any of them. The
high moral fervour that characterised the political leaders and the positive motivations
that drove the administration at the time of independence has long since faded. There
is a large gap between the theory of Government intervention and the Practice of
governance in a low income democratic country. In theory market failure has been
used to justify the production of all kinds of goods and services by the government.
In practice the problem of government failure is now much more serious. In theory
ownership of the means of production by the government should result in efficiency
equal to private ownership and greater equity. In practice government production and
supply is characterised by lower efficiency and either no gains in equity or a few
gains coupled with the creation of new inequity. The high moral purpose assumed to
be present in public functionaries does not exist in general and incentives systems for
motivating desired behaviour (e.g. profit maximisation or cost minimisation) cannot
be sustained in the public sector because of political over lord ship. This should not be
taken to mean that there are no honest and/or dedicated individuals in government!
Those that honestly and genuinely continue to serve the public often do so with little
hope of recognition or reward.
The theoretical accountability of politicians to voters is often thwarted in
practice by sharing misappropriated public resources with special interest groups
whose vote is critical to re-election.7 All interventions are justified by the ministers
6 The variables are in 1993-94 prices, with appropriate deflators applied to public and total values. The ratios may differ if current prices are used. 7 Means (laws, rules) and Ends (objectives/goals) are inverted resulting in the infamous Bureaucratic Red Tape; Means (rules, procedures) become Ends in themselves and the original Ends are sometimes used to justify the means (the new goals) even if these ends are being met by others.

13
and administrations as in the public interest or in the name of the poor or both. This
professed concern of government for the public, contrasts sharply with the neglect of
public goods & services that are the traditional & accepted responsibilities of every
government. One such responsibility is the security of life and property (policing).
The theft of electricity, represented by the data on T&D losses of 40% to 50% and the
visibly poor quality of Urban roads, drains, sewerage and water supply systems are
just a few of the many indicators of State Government failure.
An over whelming proportion of public functionaries (including peoples
representatives), do not care about the public interest. About 80% of them (from the
peon up to the top political level) are corrupt.8 “Corrupt” is used here in the wider
sense that they have little or no interest in the job per se or the institution’s objectives
and public purpose. The government job (for too many of them) is merely an
instrument to further their personal interests, whether a promotion, a posting, a seat in
a university/ job for their children, a bribe, election fund or votes (see Virmani
(2002)). The principle-agent problem is compounded in such low quality government
systems, because nobody has the clear incentive to promote the organisation’s
objectives. For instance when the minister’s objective is (at best) to maximise votes
for himself, there is no sustainable incentive scheme for PSU managers to maximise
PSU profits rather than their own welfare. The deterioration of the quality of
governance is the most important cause of growing interstate disparities in Poverty
rates.9 The absence of any genuine/sincere desire to accelerate growth and poverty
reduction has the greatest negative impact on the least developed States, including on
their supply of social services and safety nets. In several States (particularly the
poorest) the provision of public goods like courts/judiciary, policing and unbiased
administration has deteriorated so badly that expropriation risk is too high for most
new investment and danger of kidnapping for ransom too high for anyone with skills
that can be marketed elsewhere to remain there.10 It is worth noting that many of the
remaining 10% or so who are not ‘corrupt’ in the sense defined above, may work
above and beyond the call of duty.
8 This estimate is based on conversations with a sample of retired senior IAS officers, IB officials and SSI proprietors and industrialists. The other 10% are neutral towards the job, perhaps because there are no incentives and many disincentives. 9 Though the deterioration started many decades ago, it reached a tipping point with the entry of criminals into the legislatures of the heartland States. 10 Resulting in large scale out-migration.

14
5.1 Focus Govt Attention & Resources
The solution to this problem of governance is to free the people, non-profit
organisation, entrepreneurs and companies to do what they can do best and to focus
the government’s limited resources, attention span and time on functions that only the
government can do. This is to supply public goods & services and to ensure the
supply of quasi-public goods (particularly those having production externalities) up to
a level at which the social benefits equals cost of provision.11 The supply of public
goods like local & connecting roads, aquifer recharge & management, agricultural
R&D and its dissemination (‘extension services’) control of disease vectors, quasi-
public goods like irrigation & drainage, railway network are inadequate to the
demands of modern agriculture & commerce. Similarly public services like
communicable diseases, public health education, sewage systems, and quasi-public
goods like drinking water, public sanitation services, primary education, is inadequate
to the demands of modern, healthy, disciplined labour force. Governments,
particularly in the poorest States, must focus on these basics of government and use
public-private partnerships wherever possible to improve efficiency in supply of
quasi-public goods and lift all controls (bureaucratic red tape) on the non-govt sector
(see table 1). A reduced span of activity also reduces the information requirements
for transparency and accountability to voters. The media can therefore play a more
effective role in monitoring performance and exposing corruption.
5.2 Public Goods & Services
It is useful to classify all government expenditure including that on physical
infrastructure into three categories.12 These are Public goods [e.g. Roads, Urban
(Town & Village) planning and infrastructure, Agricultural R&D, Public health &
communicable diseases], Quasi-public goods (Major Irrigation, Waterways, Rural
electricity/telecom) and Private goods & services (Telecom, Ports, Airports, Urban
electricity, Railways). The issues connected with public goods are quite different
from those for Private goods with Quasi-public goods being in between.
11 Strictly, “are not lower than the social costs of provision.” 12 Sections 5.2, 5.3 and 6 are based on Virmani(2004d).

15
Table 4: Refocusing Government Expenditures And Administration Non-profit
Regulators Companies Public-Pvt Societies Co-operative CommercialPolicy Planning Finance Supply Produce (professional) PSUs Partnership (NGO)
or SubsidiseI
1 Defence# A+2 Courts A+ JudicialCom3 Police Autonomy Police Com @4 Roads4.1 Central Highways Center Partial NHA A Const/maint4.2 State Roads State A B SHA B Const/maint4.3 Local,Conecting State A+ Const/maint5 Public Education5.1 Preventive Health A+ A A+ A Yes Yes
(nutrition,cleanliness)5.2 Scientific approach A+ A A+ A Yes Yes
(supertition)5.3 Agri/crop(Extension) Yes A Yes e chaupal6 Disease Control6.1 Communicable/Vector A+ A+6.2 Epedemic/Environment A+ A+7 Population Control A A+8 Town & Village8.1 Water Drains A A+ Run Set up Rural Rural Rural Mgt Manage8.2 Sewers,treatment A A+ Run Set up Rural Rural Rural Mgt Manage8.3 Solid Waste disp A A+ Run Set up Rural Rural Rural Mgt Manage9 Irrigation9.1 Aquifier Mgmt A A yes9.2 Drainage systems A A State Local Yes Yes Yes
II Quasi-Public G&S: (prod externalities)
1 Defence Equipment Major Sys HiTech Eqp Genrl Equip2 Irrigation2.1 Dams Yes Yes A Construction2.2 Canal arteries Yes Yes Yes A Maintain Construction2.3 Distribution canals Yes Yes A Maintain Farmers Construction3 Rural3.1 Elect Transmission Yes Yes Yes A+ Yes Yes Yes3.2 Elect Distribution Yes Yes Yes A+ Yes Yes Yes Yes Yes3.3 Telephony,Internet No Tax;USO OpenAccess Competition3.4 Postal network Yes India Post SupplyChain Front end4 Water-drinkable Yes Yes Yes Rural Urban Yes Urban Mgt5 Education5.1 Schooling* A A A UrbPoor Rural A+:InfoAsym Yes Yes Yes6 UrbanMassTransit* Yes Yes Yes Subway Busses Busses
III Private Goods & Services:1 Health1.1 Insurance* Grants Poor Info Asym Compete Yes Poor Rural All1.2 Services* Grants Urb poor Rural Info Asym Poor Poor Rural All1.3 Hospitals Poor Info Asym Yes Yes Yes Yes2 Education
2.1 Technical B Certification Institutes Yes2.2 Higher* Grants Centr/stat Rating Yes Yes Yes2.3 Professional* Grants Centr/stat Rating Yes Yes Yes3 Electricity3.1 Production Un convn B B Un convn Un convn Un convn Competition3.2 Transmission Eliminate A+ Yes Yes Benchmark3.3 Distribution -Theft A+ All Yes -competition4 Ports Yes B Yes Yes Yes "5 Airports Yes B Yes Yes Yes "6 Railway
7.1 Rail line & Signals B Strategic Yes Open Access Yes Local lines7.2 Trains/service Yes Competition8 Telecom: Urban Yes Competition9 Pipeline:Gas/Oil B Open Acess Open Acess
Notes: The importance of the governments role in the subjest is represented by the grade (A, B) # = Defence Equipment is a public good monopsony; * = Social/Merit arguments for subsidy(in addition) @ = The T&D mafia in SEBs and the Coal mafia in Bihar are examples of failure to protect public property (family jewels?).
Profit MakingAdministration
Regulate Non-Government Agents, Promote competition
Public Goods & Services: Primary & Major Responsibility of Govt
Government Responsible for Correcting Externality
Government and Public Sector

16
The relative social return (benefit-cost ratio) on investment in different public
goods and the efficiency of institutions providing public goods and services are the
two key issues for this category. By and large investment in public goods should be
funded from government revenues. In a world characterised by corruption the social
return also depends on the quality and efficiency of the public provider. Given the
deterioration in the quality of government organisations that invest in and manage
such public goods the issue of institutional reform is paramount.
The national highway program has been reasonably successful in improving
the quality of major national highways because of the innovation of creating and
empowering a National Highway authority and removing it from the clutches of the
Central Public Works Department (CPWD) and State public works departments
[Virmani(2004a)]. Even the NHAI is not perfect and lacuna should be identified and
corrected. Autonomous organisations should be set up for comprehensive upgrade of
Major Urban centres. Simultaneously efforts would have to be made to convert
Nagarpalikas from being appendages of the State to become accountable to their
residents. The recommendations of the Bangalore Task Force would be helpful in this
regard.
When the FRBM requires a reduction of the fiscal deficit and there are several
new demands for expenditure enjoined on the new government by the CMP (EGS,
Education, Health), where are the revenues to be found to fund additional investment
in roads and urban infrastructure? The classical techniques of social benefit-cost
analysis must be revived and applied to every old and new/proposed program. The
available revenues must then be allocated to those programs with the highest social
return, eliminating programs with low social returns. Piling on a slew of new
inefficient programs on the existing slate of inefficient programs will in our
judgement neither increase economic growth nor accelerate poverty reduction. If
after 20 years of ‘poverty alleviation programs’ (pioneered by Mrs. Indira Gandhi)
critics are still talking about terrible hunger and malnutrition, ‘more of the same’
actions will result in ‘more of the same’ results (i.e. criticism).
5.3 Quasi-Public Goods & Services
We define Quasi-public goods as private goods with substantial externality.
The externalities we are most concerned about relate to supply of critical physical

17
infrastructure like major irrigation, clean drinking water and electricity in rural areas.
The externalities arise because of high fixed costs/minimum efficient scale of the
infrastructure (e.g. electricity transmission network) and low population density
and/or low average income in rural areas. The solution is a combination of policy,
regulation and government subsidy. Traditional approaches such as internal cross tax-
subsidy (eg. USO) and institutional innovation such as public-private partnerships can
also play a role. The general policy and regulatory system for the whole sector has
therefore to be modified for rural supply. For instance the TRAI is in the process of
formulating the modifications that need to be made in general Telecom policy to
promote efficient extension of supply in the rural areas. Special regulations may also
be needed in some sectors, for instance to promote public-private partnerships in
canal irrigation and drinking water supply.
Given the limited resources, public subsidies should not be spread thin across
all rural areas. We would hypothesise that the degree of externality (gap between
social rate of return and the private rate of return) varies in an inverted U-shape
pattern with population density (& average income). The externality is low in high-
density (i.e. semi-urban) areas and there is no need for a government subsidy. The
peak is reached in middle density areas and available subsidy should be focussed in
these areas. When density and average income is too low it may not be socially
beneficial. The peak will also differ with technology (e.g. regular versus
decentralised gobar gas or solar electricity; Fixed line vs. wireless telephony). So that
a wider band of rural areas can be beneficially covered with different technologies
and delivery mechanisms.
5.4 Notorious Bureaucracy
To motivate administration, administrators should be judged by the increase in
value added within their area and sphere of responsibility (Economic Sub-objectives:
production, investment, productive employment). This would provide an incentive to
shift from ‘red tape’ to ‘green tape.’ Professional regulation of State highways, canal
networks, electricity transmission & distribution and primary & secondary education
by independent regulators would multiply the social gains from private entry into
these sectors. Together such focussed improvements in governance have the potential
to eliminate inter-State differences in poverty and growth and thus raise the growth
rate of the entire economy.

18
6 PRIVATE GOODS AND SERVICES
6.1 Infrastructure development
The key issues in private infrastructure development are policy and regulation.
The policy framework must provide incentives for private investment while
enhancing consumer welfare through competition. Thus the policy framework must
be such as to mimic competition to the extent possible. A good policy must be
supported by a regulatory system that promotes competition (including benchmark
competition) and regulates natural monopoly elements efficiently and effectively.
This requires an independent professional approach to regulation. These two
together reduce policy and regulatory risk and thus reduce overall risk below the
threshold necessary for normal private investment (i.e. one that does not require ad
hoc sops and guarantees). In my judgement there will be no dearth of private
(domestic and international) finance once this is done. As the long-term debt market
is essential for sustained growth of infrastructure, but is currently almost non-existent
we recommend that incentives for infrastructure investment be focussed on the long-
term debt market. A rise in the FDI cap in insurance to 49% is also needed urgently
to accelerate the growth of the insurance industry and thus add to the supply of long
term funds into the debt market.
The Telecom policy and regulatory system, despite many past false steps and
hiccups, has crossed this threshold in the last few years [Virmani(2004a)]. It has been
able to attract sufficient investment funds while promoting consumer welfare through
intense competition (though the FDI limit is a problem awaiting correction). In
contrast, the Electricity sector has just taken the first major step in the correct
direction with the passing of The Electricity Regulatory Act (2003). An appropriate
regulatory system must be set-up at the Centre and the States. For instance the
Central Electricity Regulatory Commission (CERC) does not have an economist
member, as active professional economists (with knowledge of modern regulatory
economics) are not willing to retire and become full time members. The CERC act
should be amended to allow the appointment of part time professional members. The
regulatory systems at the State level are even more inadequate. For instance, though
Delhi has privatised distribution it is not at all clear that the Delhi Electricity
Commission has the professional knowledge and drive to efficiently regulate the
private sector. The electricity sector also has the special problem of T&D losses,

19
sometimes described as Theft & Dacoity losses [Virmani (2004b)]. Unless private
electricity distributors and the government tackle the T&D Mafia jointly and
effectively to eliminate this rip-off of the honest user, privatisation of electricity
distribution will be dogged by the possibility of a revolt against high prices that
exceed Marginal long range costs (MLRC).
7 CONCLUSIONS Government policies that suppressed or limited competition or created
government monopolies retarded TFPG and GDP growth. One of the vital lessons of
Indian experience is that government monopoly is, in a low income democracy, more
inimical to efficiency and growth than a private monopoly because regulatory capture
is much easier in the former. This is because either policy, regulation and ownership
functions are vested in the same government department (monolith) or regulation and
ownership functions are overseen/ controlled by the same department. In contrast, in
the case of private monopoly, regulatory capture can be impeded by two layers of
accountability; First an independent professional regulator and then the government
department (to appoint & over see the regulator).
To enhance the benefit from increased public investment in infrastructure and
thus make the costs of financing them worthwhile, we need, (a) A pro-competition
infrastructure policy and a professional independent regulatory framework for
electricity, railways, ports, airports and dams & canals. (b) Institutional reform of
public infrastructure monopolies, like State electricity boards, irrigation departments
public works departments (for State highways and village roads).
Where we have failed as a nation is in improving our basic social indicators like
literacy and mortality rates. Much of the failure is a legacy of the socialist period.
The rate of improvement of most indicators has accelerated during the market period.
The gap between our level and that of global benchmarks is still wide and our global
ranking on most of these social parameters remains very poor. This is the result of
government failure. Government overstretch, misplaced priorities and deteriorating
quality (corruption) has resulted in a failure to full fill the traditional, accepted
functions of government like public safety & security, universal literacy and primary
education, public health education (superstition & quackery), provision of drinkable
water, sanitation drains & sewage facilities, public health (infectious & epidemic

20
diseases), building roads and creating & disseminating agricultural technology.
Consequently the improvement in social indicators has not kept pace with economic
growth and poverty decline and has led to increasing interstate disparities in growth
and poverty.
The paper showed that government total expenditure or investment expenditure
has not had a positive effect on growth. This is because government
expenditure/investment does not maximise social benefit-cost ratios. The dead weight
cost of taxation and crowding out of private investment from the production of private
goods increases the negative effects. It can only be beneficial if it is directed towards
accelerating growth through investment in public and quasi-public goods. It was also
shown that greater allocation of expenditures to agriculture (per se) will not increase
overall growth rate and is likely to reduce it. Acceleration of rural growth and
poverty reduction requires greater attention to productivity enhancing activities such
as aquifer (ground water) management & recharge, better drainage systems, water
shed management, training of farmers in water harvesting and other scientific
practices, revival of extension systems/information flows, and better agriculture
related R&D.
The only practical solution is to focus and restrict the government to those
activities that others cannot do (production of public goods, addressing externalities)
and open up all other activities to the non-governmental sector (commercial, non-
profit, social). The government must shed the role of producer of “private” goods and
services, regulating those that need it and watching over both producers and
regulators as the ultimate authority. Further it is not necessary to address externalities
by producing the goods and services in the public sector. Financial instruments (taxes
and subsidies) should be used wherever they are effective. In the case of basic health
and education and rural public utilities, where government has an obligation to supply
target groups, private production and public-private partnerships can and should be
used to minimise costs and thus maximise the social benefit-cost ratio.

21
8 REFERENCES 1. Virmani, Arvind, (2002), ‘A New Development Paradigm: Employment,
Entitlement and Empowerment’, Economic and Political Weekly, June 1, 2002. 2. Virmani, Arvind (2004a), Accelerating Growth and Poverty Reduction – A Policy
Framework for India’s Development, Academic Foundation, New Delhi, January 2004.
3. Virmani, Arvind (2004b), “Economic Reforms: Policy and Institutions Some Lessons From Indian Reforms,” Working Paper No. 121, ICRIER, January 2004. www.icrier.org/wp121.pdf .
4. Virmani, Arvind (2004c), “India’s Economic Growth: From Socialist Rate of Growth to Bharatiya Rate of Growth,” Working Paper No. 122, ICRIER, February 2004. www.icrier.org/wp122.pdf .
5. Virmani, Arvind (2004d), “Forex for Infrastructure, Economic and Political Weekly, Vol. XXXIX No. 52, December 25-31, 2004, pp. 5559-5562.
6. Virmani, Arvind (2005a), “Customs Tariff Reform,” Economic and Political Weekly, Vol. XL Nos. 11, March 12-18, 2005, pp. 1006-1008.
7. Virmani, Arvind (2005b), ‘Institutions, Governance and Policy Reform: A Framework for Analysis,” Economic and Political Weekly, Vol. XL Nos. 22 & 23, May 28-June 03/June 04-June 10, 2005, pp. 2341-2350.
8. Virmani, Arvind (2005c), ‘Policy Regimes, Growth and Poverty in India: Lessons of Government Failure and Entrepreneurial Success!, Working Paper No. 170, ICRIER, October 2005. http://www.icrier.org/WP170GrPov9.pdf
9. Virmani, Arvind (2006), Propelling India From Socialist Stagnation to Global Power: Growth Process, Vol. I (Policy Reform, Vol. II), Academic Foundation, March 2006 (forthcoming).