Embed Size (px)
Citation preview
World Journal of Social Sciences
Vol. 6. No. 2. July 2016 Special Issue. Pp. 13 – 28
Lessons Learned on Credit Risk Grading Model Designing
Tahrima Faruq*, Tanjila Mahboob**, Mohiuddin Rasti Morshed*** and Syed Ehsan Quadir****
The purpose of this paper is to share United Finance Limited’s
1
experience of overcoming pitfalls that impact the effectiveness of Credit Risk Grading Model
2. It was observed from a sample
of 1609 clients of year 2011 and 2012 that the model is not estimating credit risk precisely. Further review of the model reveals that the construction of attributes of the model gives scopes to include biased information emphasizing the significance of formatting attributes properly. Besides, the logic of adopting multi-model approach in designing the model is under scrutiny which deters presenting universal model. These learning imply that to make the model effective in decision making, continuous development is needed.
Keywords: Finance, Credit Risk, Credit Risk Grading Model, Financial Institution, Borrower, CRG
1. Introduction
Risks that are inherent to Financial Institutions‟ most fundamental and traditional role of lending and borrowing include credit risk, interest risk, liquidity risk and operational risk. Among these, credit risk, which is associated with the potential variability of the stream of cash flows from an asset, is crucial. Poor credit risk mismanagement is often the cause of a FI's failure. Potential defaults and consequent losses due to missed loan payments lead to reduction in cash flow and profitability. A bad loan may arise due to a combination of factors. The major factor according to Vong and Patricio (2005), is the absence of an adequate system for the selection of loans proper classification of loans and identification of problem loans promptly. Credit Risk Grading provides such a systematic, standardized and scientific process for evaluating a borrower. It is a step toward establishing an effective management of credit risk which requires that the risk is identified and measured properly. Although the usage of external credit ratings is increasing but still loans to unrated clients forms a significant portion of FIs‟ credit portfolio. This necessitates that FIs should develop their own Credit Risk Grading Model (CRGM) using their internal resources in order to know their customers to such extent and in such a manner, which will help them to effectively and efficiently manage their portfolios. In this study, prediction capability of such a Credit Risk Grading model was assessed. Also, the model was reviewed to find out the possible reasons accountable for its imprecise estimation. This study, _____________________ * Ms. Tahrima Faruq, Department: Advisory Services, United Finance Limited, Camellia House, 22, Kazi Nazrul Islam Avenue, Dhaka 1000; Cell ph.: +880-17159-00809; Tel: +880-2-9669006, ext: 1081; E-mail: [email protected] ** Ms. Tanjila Mahboob, Department: Advisory Services, United Finance Limited, Camellia House, 22, Kazi Nazrul Islam Avenue, Dhaka 1000; Cell ph.: +880-17303-73628; Tel: +880-2-9669006, ext: 1080; E-mail: [email protected] *** Mr. Mohiuddin Rasti Morshed, Chief Risk Officer, United Finance Limited, Camellia House, 22, Kazi Nazrul Islam Avenue, Dhaka 1000, E-mail: [email protected] **** Syed Ehsan Quadir, Managing Director, United Finance Limited, Camellia House, 22, Kazi Nazrul Islam Avenue, Dhaka 1000, E-mail: [email protected]

Faruq, Mahboob, Morshed & Quadir
14
revolves around a developed and established model of a FI to check the model‟s effectiveness and to discover the hurdles needed to overcome with the aim of making it more effective. Previous studies found out the need to include judgemental insights in the model and the impact of judgemental bias resulted by this judgemental ratings. However, this study looks for the sources of this judgemental bias in judgemental ratings. Besides this, other drawbacks of the model were found which were not addressed in prior studies. Literature review in the next section elaborately discussed the difference of this study with previous studies. The rest of the paper is organized as follows: Section three provides the methodology adopted in this study. A brief description of the United Finance Limited‟s Credit Risk Grading Model is provided in Section four. Section five is the analysis and findings part of the study given in the form of assessment of the model. Finally, the implications of the findings and recommendations are discussed in the conclusion.
2. Literature Review Credit Risk Grading (CRG) is a quantitative method of assessing the credit risk associated with a credit transaction. Well-designed CRG systems promote safety and soundness of FIs‟ by facilitating informed decision making (Treacy & Carey, 2000; Altman & Saunders, 1997). The aggregation of such grading across the borrowers, activities and the lines of business can provide better assessment of the quality of credit portfolio. Although the major objective of credit rating is to determine the ability and willingness of a borrower to pay at the agreed terms, the rating does a bit more than just classifying the borrowers into “pass” and “fail” categories (Vong & Patricio, 2005). Such a system enables FIs to grasp the creditworthiness of borrowers and the quality of credit transactions using a single yardstick (Oyama; Yoneyama, 2005). This single yardstick not only helps to decide whether to lend or not to a borrower, but also what should be the pricing if a lending decision is made, based on the concept “the higher the risk, the higher the expected return” (Asarnow & Edwards, 1995) (Kabir, et al., 2010). Moreover, the assessment of the credit quality of the entire portfolio becomes possible by monitoring changes in the amount of credit exposure and number of borrowers in each rating grade. The system also allows for measuring the probability of default thereby helping the FI to improve its loan loss provision estimates. Thus, the CRG system is vital to take decisions both at the pre-sanction stage as well as post-sanction stage. Also predict the probability of default at each rating grade and make better provision estimates. Marrison (2002) in his book articulated the importance of Credit Risk Grading in gaining competitive advantages in the banking industry. For that an effective and efficient Credit Risk Grading system should be implemented in the pecuniary organizations. He mentioned bad loan as one of the main reasons of failure among the banks and Credit Risk Grading delivers an additional control measure in preventing bad loans. Favoring the credit risk grading, Anderson (2009) suggests to create score cards even for the smallest of the firms because it helps to measure and categorize the risks borrowers according to their risk scores. Regarding the logic and designing of a credit risk model, Treacy and Carey identified two ways of ratings: One Dimensional and Two Dimensional. But they believe that the latter system ensures better accuracy, which was also supported by Crouhy et al. (2000). But none of the literatures considered adopting multi-model approach depending on different nature (manufacturing, trading, and service) and sizes (large, medium, small) of the business. First significant analysis on effectiveness of risk grading has been done by Altman and Saunders (1997). In their analysis they evaluated the statistical models used in credit risk
Faruq, Mahboob, Morshed & Quadir
15
grading. They found that in many banks the use of statistical models in risk grading is not successful as it deemed. They proposed judgemental rating system to be incorporated in credit risk grading. Goodhart (1998) also mentioned that poor risk grading system increases the credit risk and lack of judgmental insight plays a role in making a credit risk grading poor. Another analysis conducted by Treacy & Carey (2000) proves the importance of this proposition. They conducted analysis on 50 large banks of USA and illuminated the differences of credit rating system of those banks highlighting the fact that most of the rating systems are affected by the judgmental bias. They have also attributed the absence of effective internal rating review and control systems to the biasness of rating assignments. Anderson (2009) also mentioned the succinctness of the risk grading model. He says, the reduced form, applying scoring and structural model can be used instead of the traditional risk grading system. Here we can infer that not only grading but also its unambiguity and comprehensibility are required for CRG to be successful. Opinions from Treacy and Carey (2000) is also consistent with this inference. Gestel & Baesens (2009) in their book again described the importance of Credit Risk Grading theoretically. They attributed the quality and relevance of past experience, the quality of the model, the developers and the rating analysts behind any rating to be effective. The use of non-representative data and a poor model or wrong human expert judgment are resulted in wrong ratings. This is consistent with the opinion of Anderson (2009). Therefore, we see the pervasiveness of human judgment in credit risk grading. Above literatures unanimously support the role of human judgment in credit risk grading. But human judgment is often biased. For economic activities the most common bias is called comparative optimism (Shepperd, et al., 2002). According to this type of bias, human mind tends to think they are exposed to less market risk and take their decisions based on this optimism. From Shepperd, et al., (2002) analysis, it can be inferred that if people are provided with three options, one is good, another is medium and the other is bad, they are less likely to select the bad option unless there is concrete evidence. This idea can be applied to CRG Model design to make the model free of human judgment bias. From this perspective, the design of CRG model can be attached with its effectiveness. And this biasness is needed to be addressed in order for studies to be able to produce accurate result (Furnham, 1986) (Podsakoff, 2003). Beside this fact, the response bias can be attributed to the improper designing and construction of the questionnaire also according to the book of Bryman and Bell (2007). Any kind of rating design needed to be done carefully in order to achieve accurate and precise result (Fadem, 2008). This is a very critical element in this case as we have seen in the literatures, most of the credit rating data are qualitative, contingent on the judgment of credit officers and if the rating design is devoid of considering this response bias critically, the whole rating system may get corrupted with optimism bias. Along with addressing this biasness, proper formation of the questions and adopting accurate logic in designing a model is imperative for a model to work. None of the above literatures regarding Credit Risk Grading shade any light over these aspects.
3. Methodology of the Study The study has two parts. The first part is descriptive and it provides a brief overview of the model while the second part assesses the model which is an explorative study based on primary data.
Faruq, Mahboob, Morshed & Quadir
16
In order to obtain a clear understanding about the model, in depth interview was conducted face to face using unstructured questionnaire. To assess the model, a sample of 1609 clients/borrowers of year 2011 and 2012 was taken using convenience sampling process. Enterprises of different size (small, medium and large) and different natures (manufacturing, trading and service) of business were taken in this sample.
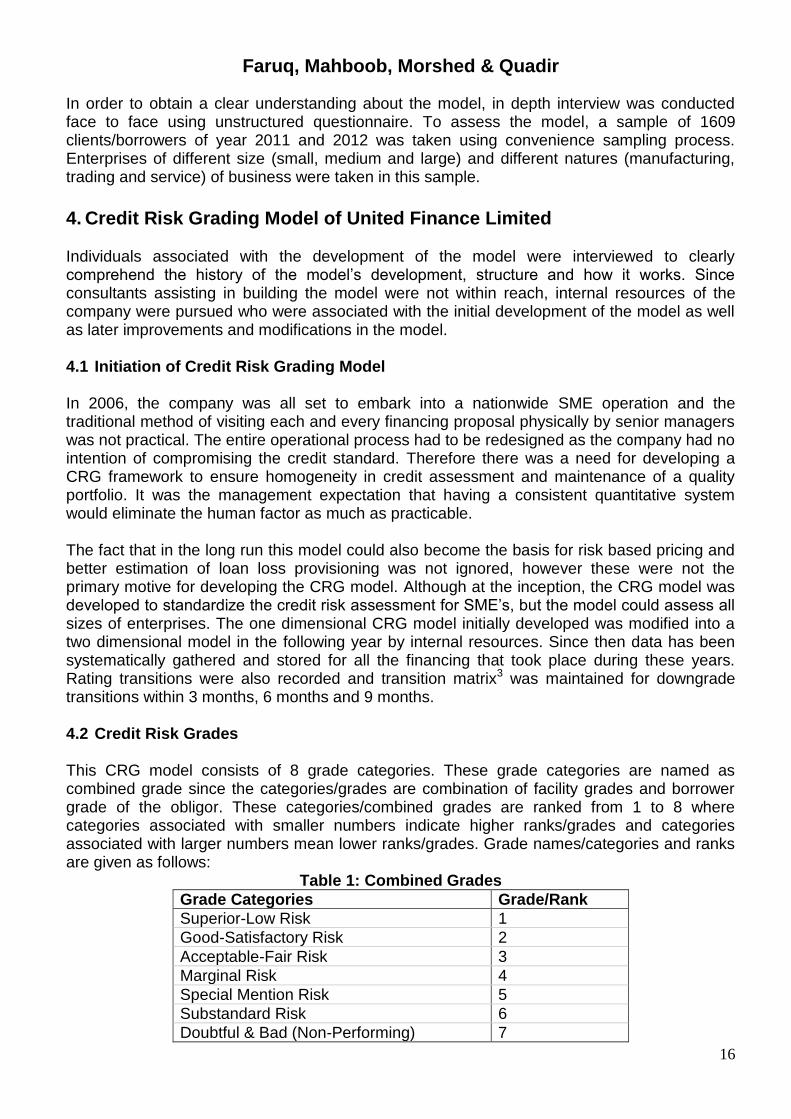
4. Credit Risk Grading Model of United Finance Limited Individuals associated with the development of the model were interviewed to clearly comprehend the history of the model‟s development, structure and how it works. Since consultants assisting in building the model were not within reach, internal resources of the company were pursued who were associated with the initial development of the model as well as later improvements and modifications in the model. 4.1 Initiation of Credit Risk Grading Model In 2006, the company was all set to embark into a nationwide SME operation and the traditional method of visiting each and every financing proposal physically by senior managers was not practical. The entire operational process had to be redesigned as the company had no intention of compromising the credit standard. Therefore there was a need for developing a CRG framework to ensure homogeneity in credit assessment and maintenance of a quality portfolio. It was the management expectation that having a consistent quantitative system would eliminate the human factor as much as practicable. The fact that in the long run this model could also become the basis for risk based pricing and better estimation of loan loss provisioning was not ignored, however these were not the primary motive for developing the CRG model. Although at the inception, the CRG model was developed to standardize the credit risk assessment for SME‟s, but the model could assess all sizes of enterprises. The one dimensional CRG model initially developed was modified into a two dimensional model in the following year by internal resources. Since then data has been systematically gathered and stored for all the financing that took place during these years. Rating transitions were also recorded and transition matrix3 was maintained for downgrade transitions within 3 months, 6 months and 9 months. 4.2 Credit Risk Grades This CRG model consists of 8 grade categories. These grade categories are named as combined grade since the categories/grades are combination of facility grades and borrower grade of the obligor. These categories/combined grades are ranked from 1 to 8 where categories associated with smaller numbers indicate higher ranks/grades and categories associated with larger numbers mean lower ranks/grades. Grade names/categories and ranks are given as follows:
Table 1: Combined Grades
Grade Categories Grade/Rank
Superior-Low Risk 1
Good-Satisfactory Risk 2
Acceptable-Fair Risk 3
Marginal Risk 4
Special Mention Risk 5
Substandard Risk 6
Doubtful & Bad (Non-Performing) 7
Faruq, Mahboob, Morshed & Quadir
17
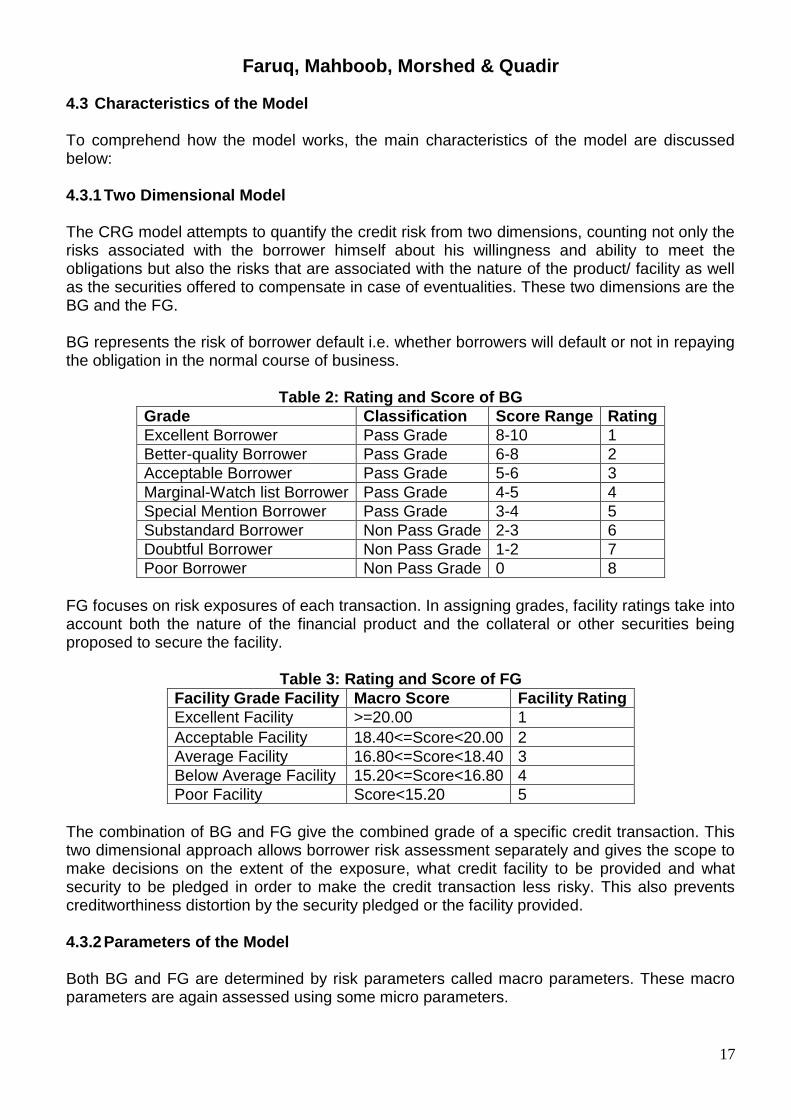
4.3 Characteristics of the Model To comprehend how the model works, the main characteristics of the model are discussed below: 4.3.1 Two Dimensional Model The CRG model attempts to quantify the credit risk from two dimensions, counting not only the risks associated with the borrower himself about his willingness and ability to meet the obligations but also the risks that are associated with the nature of the product/ facility as well as the securities offered to compensate in case of eventualities. These two dimensions are the BG and the FG. BG represents the risk of borrower default i.e. whether borrowers will default or not in repaying the obligation in the normal course of business.
Table 2: Rating and Score of BG
Grade Classification Score Range Rating
Excellent Borrower Pass Grade 8-10 1
Better-quality Borrower Pass Grade 6-8 2
Acceptable Borrower Pass Grade 5-6 3
Marginal-Watch list Borrower Pass Grade 4-5 4
Special Mention Borrower Pass Grade 3-4 5
Substandard Borrower Non Pass Grade 2-3 6
Doubtful Borrower Non Pass Grade 1-2 7
Poor Borrower Non Pass Grade 0 8
FG focuses on risk exposures of each transaction. In assigning grades, facility ratings take into account both the nature of the financial product and the collateral or other securities being proposed to secure the facility.
Table 3: Rating and Score of FG
Facility Grade Facility Macro Score Facility Rating
Excellent Facility >=20.00 1
Acceptable Facility 18.40<=Score<20.00 2
Average Facility 16.80<=Score<18.40 3
Below Average Facility 15.20<=Score<16.80 4
Poor Facility Score<15.20 5
The combination of BG and FG give the combined grade of a specific credit transaction. This two dimensional approach allows borrower risk assessment separately and gives the scope to make decisions on the extent of the exposure, what credit facility to be provided and what security to be pledged in order to make the credit transaction less risky. This also prevents creditworthiness distortion by the security pledged or the facility provided. 4.3.2 Parameters of the Model Both BG and FG are determined by risk parameters called macro parameters. These macro parameters are again assessed using some micro parameters.
Faruq, Mahboob, Morshed & Quadir
18
4.3.2.1 Factors determining Borrower Grade (BG) Both qualitative and quantitative factors are evaluated to determine BG. Credit Risk of a borrower is measured quantifying 4 risks, 3 qualitative and 1 quantitative, separately which are macro parameters of this model. The macro parameters of Borrower Grade are:
Qualitative Evaluation
Business Risk
Management Risk
Industry Risk
Quantitative Evaluation:
Financial Risk
4.3.2.2 Factors determining Facility Grade (FG) A single counterparty may have a number of credit facilities against different collaterals, having different priority rules and legal recourse to the recovery in case of default. FG considers the relevant transaction's specific facts, based on the type of facility and collateral, while assigning the FG. This process may result in different facility ratings for the same entity. Some attributes of Facility Grading are:
It has 6 macro parameters. Each macro parameter has micro parameters that assess the risk factor of that macro parameter.
Not all of the macro parameters would be applicable to a single borrower for a specific facility. Depending on the facility and collateral pledge, some of the macro parameters are assessed.
4.3.2.3 Multi-Model Approach In developing the CRG model, a multi-model approach was adopted. Six different models for six different types of businesses were developed depending on the size and nature of the business by assigning different weights for different type of business. These six models were:
Table 4: Multi-model approach
Size of Business
Nature of Business
Manufacturing Trading Service
Small Model 1 Model 2 Model 3
Large and Medium Model 4 Model 5 Model 6
Weights of the macro parameters vary according to the size and nature of the business. Each micro parameter‟s weight under each macro parameter differs depending on the importance and contribution in assessing the macro parameters to which it belongs to.
Faruq, Mahboob, Morshed & Quadir
19
4.3.2.4 Qualitative Attributes of Three Macro Parameters and Quantitative Attributes of One Macro Parameters of Borrower Grade
Most of the Attributes/categories of the micro parameters of business risk, management risk and industry risk are qualitative. Only the financial risk is assessed through quantitative attributes. 4.3.2.5 Use of Financial Information of Last 3 years Financial information on only 1 year may sometimes fail to present the correct financial situation of a company. Last 3 years financial information gives a broader view of the financial performance.
5. Assessment of the Model
Table 5: Frequency and Percent of Borrowers in Different Borrower Grades
Borrower Grade Grade explanation Frequency Percentage
1 Excellent Borrower 0 0%
2 Better-quality Borrower 1295 80.5%
3 Acceptable Borrower 314 19.5%
4 Marginal-Watch list Borrower 0 0%
5 Special Mention Borrower 0 0%
6 Substandard Borrower 0 0%
7 Doubtful Borrower 0 0%
8 Poor Borrower 0 0%
Total 1609 0%
Given that the transition matrix was indicating that the model behaviour was diverging from actual rating, a study on a sample of 1609 clients was done. The distribution of the BG at the inception of each of the finance is shown in Table 5. It can be seen that the clients are identified as either “Better Quality Borrower” or “Acceptable Borrower”. 80.5% clients are assigned with “Better Quality Borrower” which indicates that these clients have strong repayment capacity. This huge concentration in one category and all responses in two categories out of all 8 categories is another indicator of the model‟s distortion. Since this data consisted of clients of all sizes (small, medium and large) and all natures (manufacturing, trading and services), the frequency distribution shows that, there is no variation of credit risk among different sizes and natures of business which is contrary to the real scenario. This in itself questions the appropriateness of a multi-model approach adopted in the design of the model. The concern about the prediction capability of the model increases on observing the number of non-repayment occurrences per client as shown in Table 6.
Faruq, Mahboob, Morshed & Quadir
20
Table 6: Prediction Capability of CRG Model
BG
No. of Non repayment Occurrences
0 1 2 3 4 5 6 7 or more
Total
2
No. of Clients
838 190 59 31 24 17 14 122 1295
% of BG 2 64.71 14.67 4.56 2.39 1.85 1.31 1.08 9.42 100
3 No. of Clients
193 45 14 8 4 4 4 42 314
% of BG 3 61.46 14.33 4.46 2.55 1.27 1.27 1.27 13.38 100
Total Total 1031 235 73 39 28 21 18 164 1609
The data shows that, out of 1609 clients, 578 clients (36%) have record of non-repayment. Where BG suggested all the clients have strong repayment capabilities, the actual outcome based on the number of non-repayment occurrences contradict the model‟s prediction. It is also noticeable that the deviation of the prediction is quite high. For example, 9.42% clients of BG 2 and 13.38% of BG 3 have record of 7 or more non-repayment occurrences. These evidences suggest that the models are not estimating accurately. 5.1 Analysis of the Risk Parameters The risk parameters were analysed to improve the model's predictive behaviour. The frequency distribution of business risk‟s and management risk‟s parameters were focused. Most parameters‟ frequency distribution showed huge concentration in a single category which suggests that they are source of the model's divergent behaviour. According to Oyama and Yoneyama (2005), validation of a model is dependent mainly on three factors.
Structure of the model: The structure of the model indicates the nature and characteristics of the components in the model which includes the parameters, categories of the parameters, scoring and weights of the parameters.
Reliability of the collected information on client: The information to be provided in the model is collected from various sources. The reliability of these collected information depends on the reliability of these sources. The unreliability of the information is the source of 1st biasness in the model.
Unbiased data input the in the model (internal): This is the source of 2nd biasness in the model. Collected information on the client could be subjected to biasness by the person accountable for data input in the model.
Here, assumption has been made that the data collected on the clients were reliable and client did not provide any biased information. Hence, concentration in a single category and non-variability could be attributed to both faulty structure of the model and biased data input in the model. The parameters in question are discussed elaborately in the following part for clear understanding.

Faruq, Mahboob, Morshed & Quadir
21
5.1.1 Position of the Entity in its Target Market
Figure 1: Frequency Distribution of Position of the Entity in Its Target Market
Position of the entity in its target market is a micro parameter of business risk macro parameter. To assess the risk associated with borrower‟s business; this parameter is used to represent the current reputation of the borrower‟s entity in the market. As per data, 56% responses are in the “Above Average” category. Remaining responses are dispersed in the other categories but only 0.3% responses are in “Weak Player” category. This indicates that the responses are skewed to the positive answers which can be explained by concept of comparative optimism (Shepperd, et al., 2002). Since in this case, single category concentration is not very high, this skewness could be attributed to the qualitative characteristic of the categories which are not clearly comprehendible and also subjected to the judgmental bias of an individual. 5.1.2 Future Prospect
Figure 2: Frequency distribution of Future Prospect
Faruq, Mahboob, Morshed & Quadir
22
Another parameter used to assess business risk is future prospect of the business but neither the question nor the categories of the parameters elaborate how to judge an entity‟s future prospect. 93.3% borrowers‟ entities are said to have a “stable” future prospect. This huge response in a single category refers to biased answer. But, it is not easy to assess future prospect of an entity, also without any clear guideline on how to assess the future prospect of an entity, the assessment procedure differs from individual to individual. This also conform with findings of Treacy and Carey (2000) that the key reason for the models to be tempered with judgment and common sense is because they do not fully explain the subjective factors involved in the rating. 5.1.3 Assessment of Immediate Buyers
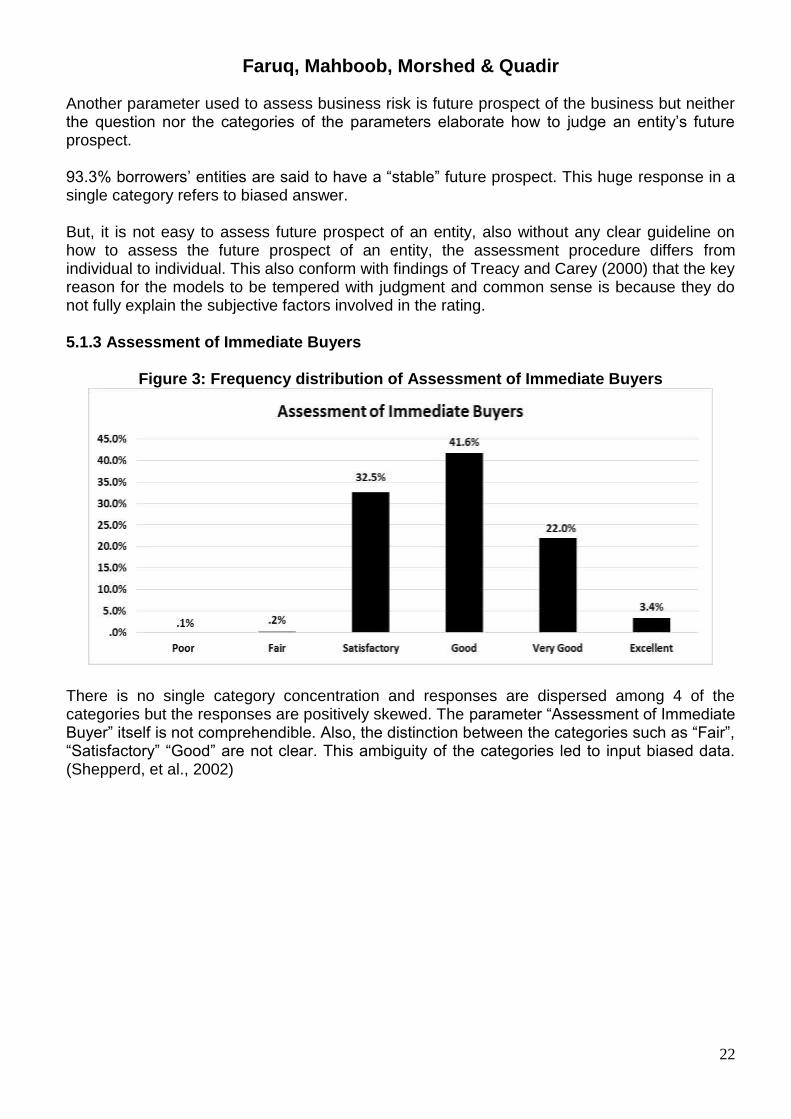
Figure 3: Frequency distribution of Assessment of Immediate Buyers
There is no single category concentration and responses are dispersed among 4 of the categories but the responses are positively skewed. The parameter “Assessment of Immediate Buyer” itself is not comprehendible. Also, the distinction between the categories such as “Fair”, “Satisfactory” “Good” are not clear. This ambiguity of the categories led to input biased data. (Shepperd, et al., 2002)

Faruq, Mahboob, Morshed & Quadir
23
5.1.4 Marketing and Selling Arrangements
Figure 4: Frequency distribution of Marketing and Selling Arrangements
Although more than 85% responses belong to a single category here, it is not entirely unusual. But the observation here is that, categories are not exhaustive, i.e. possible categories are missing, leading to distorted data (Fadem, 2008). Example of such a missing category could be: No formal contracts but stable relationship with customers over a medium /long period). 5.1.5 Employee Turnover
Figure 5: Frequency distribution of Employee Turnover
98.2% response in one category as well as that category being a positive response strongly suggests that the data input was biased (Shepperd, et al., 2002). Categories being qualitative in nature also could be responsible for this biasness (Treacy & Carey, 2000) since there is no clear definition on “low” and “high”. It is also noticeable than the categories are not mutually exclusive and exhaustive. An entity‟s employee turnover could be high and also gradually increasing.

Faruq, Mahboob, Morshed & Quadir
24
5.1.6 Payment Track Record
Figure 6: Frequency distribution of Payment Track Record
Payment track record, used to assess management risk is one of the most important parameters of the model. It is one of the parameters of the model which tries to infer both to the character as well as capacity of the borrower using the history of payment transaction. But 87% responses in a single category are not being very useful in representing the character and capacity of the borrower. Use of ambiguous language such as “Few payments”, “Occasionally” “A few days” in these categories encourages biased response since the meaning of these ambiguous words vary from person to person. Also, more than one information is asked in this parameter like-no. of non-payments, no. of delayed payments, no. of days settled within. Hence, being a double barrelled question/categories, along with the ambiguous language, it creates confusion (Fadem, 2008).
Faruq, Mahboob, Morshed & Quadir
25
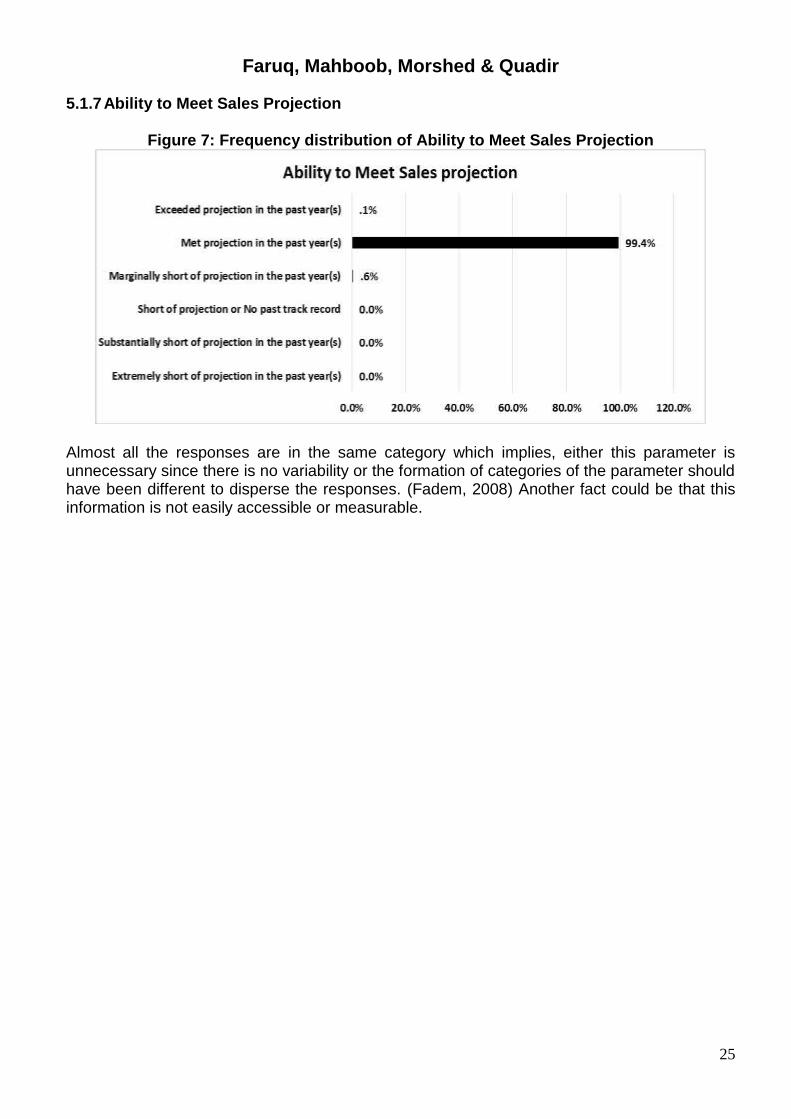
5.1.7 Ability to Meet Sales Projection
Figure 7: Frequency distribution of Ability to Meet Sales Projection
Almost all the responses are in the same category which implies, either this parameter is unnecessary since there is no variability or the formation of categories of the parameter should have been different to disperse the responses. (Fadem, 2008) Another fact could be that this information is not easily accessible or measurable.
Faruq, Mahboob, Morshed & Quadir
26
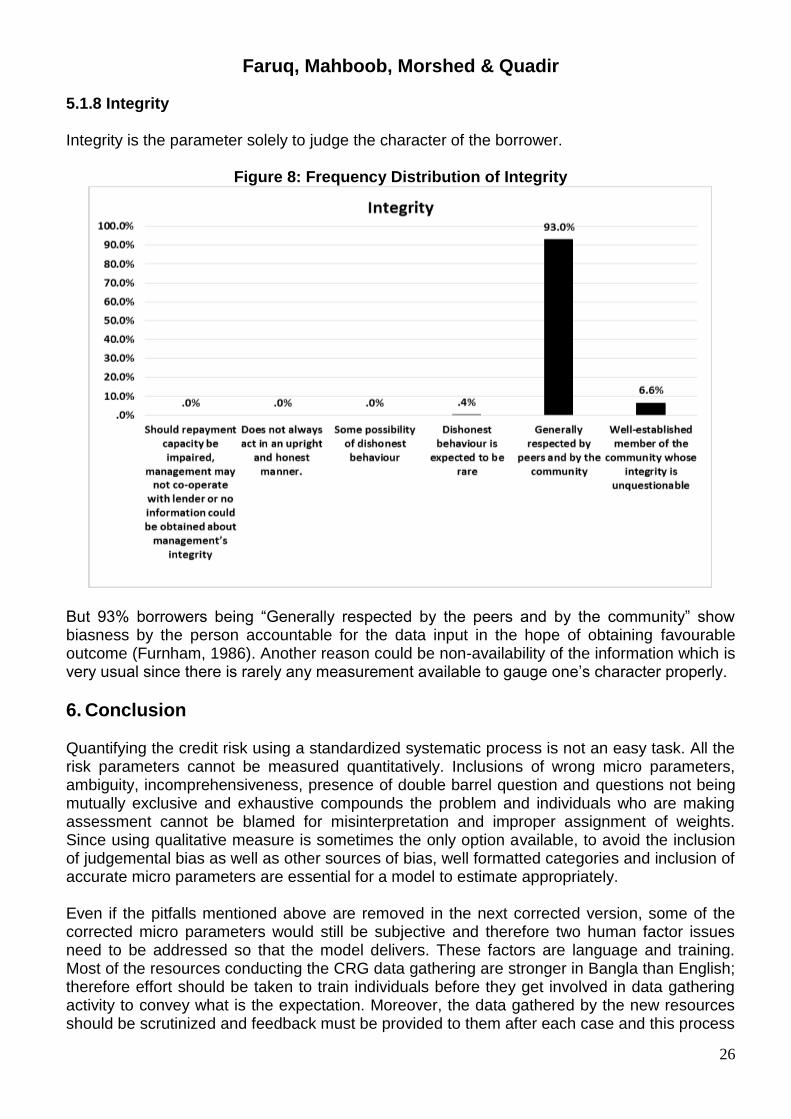
5.1.8 Integrity Integrity is the parameter solely to judge the character of the borrower.
Figure 8: Frequency Distribution of Integrity
But 93% borrowers being “Generally respected by the peers and by the community” show biasness by the person accountable for the data input in the hope of obtaining favourable outcome (Furnham, 1986). Another reason could be non-availability of the information which is very usual since there is rarely any measurement available to gauge one‟s character properly.
6. Conclusion
Quantifying the credit risk using a standardized systematic process is not an easy task. All the risk parameters cannot be measured quantitatively. Inclusions of wrong micro parameters, ambiguity, incomprehensiveness, presence of double barrel question and questions not being mutually exclusive and exhaustive compounds the problem and individuals who are making assessment cannot be blamed for misinterpretation and improper assignment of weights. Since using qualitative measure is sometimes the only option available, to avoid the inclusion of judgemental bias as well as other sources of bias, well formatted categories and inclusion of accurate micro parameters are essential for a model to estimate appropriately. Even if the pitfalls mentioned above are removed in the next corrected version, some of the corrected micro parameters would still be subjective and therefore two human factor issues need to be addressed so that the model delivers. These factors are language and training. Most of the resources conducting the CRG data gathering are stronger in Bangla than English; therefore effort should be taken to train individuals before they get involved in data gathering activity to convey what is the expectation. Moreover, the data gathered by the new resources should be scrutinized and feedback must be provided to them after each case and this process
Faruq, Mahboob, Morshed & Quadir
27
should be continued till there is an alignment in the understanding of the model keepers and model user. Going forward, the two areas of CRG model improvement are (1) the inclusion of industry risk as a variable macro parameter and (2) move towards a universal model from the current multi-model approach. Currently for each industry sub sector, a single score is used for all companies. If industry risk is incorporated in the model like the other macro parameters such as the business risk and management risk a more realistic risk measurement can be done. At what stage the industry is in an economy is a variable that impacts entities differently, for example when an industry sub sector is at the consolidation stage, the industry risk for large operators is not the same as that for small operators. The complexity of working with a multi-model CRG at the portfolio level for decisions, such as capital allocation or loan loss provisioning estimate or product group pricing bands, increases investment in the model. The less the number of models the less the investment in model management and maintenance. In conclusion, CRG models are not a one-time implementation exercises but should be subjected to continuous scrutiny and development.
7. Limitations of the Study The review and assessment of the Credit Risk Grading Model of United Finance was limited to some major parts of the model, not all the dimensions, parameters and components were reviewed.
Endnotes 1. A Non- Banking Financial Institution which started its journey as United Leasing Company Limited in 1989. 2. This model was developed with the assistance of South Asia Enterprise Development Facility (SEDF) who helped in identifying Credit Rating Information Services of India Limited (CRISIL) as consultant. 3. Transition matrix is a matrix used to show the transitions of borrowers from initially assigned Credit Risk Grading to Revised Grading based on repayment performance of that borrower.
References Altman, E and Saunders, A 1997, 'Credit risk measurement: Developments over the last 20
years', Journal of Banking and Finance, Vol.21, pp. 1721-1742. Asarnow, E and Edwards, D 1995, 'Measuring loss on defaulted bank loans: A 24-year study',
The Journal of Commercial Lending, Vol. 77, pp. 11-23. Chen, M and Huang, S 2003, „Credit scoring and rejected instances reassigning through
evolutionary computation techniques‟, Expert Systems with Applications, Vol.24, No. 4, pp. 433-441.
Crouhy, MG, D and Mark, R 2000, „A comparative analysis of current credit risk‟, Journal of Banking and Finance, Vol. 24, pp. 60 – 117.
Fadem, TJ 2008, „The Art of Asking: Ask Better Questions, Get Better Answers‟, FT Press, New Jersey.
Furnham, A 1986, 'Response bias, social desirability and dissimulation‟, Personality and individual differences, Vol 7, No.7, pp. 385-400.
Faruq, Mahboob, Morshed & Quadir
28
Kabir, G, Jahan, I, Chisty, MH and Hasin, MAA 2010, 'Credit Risk Assessment and Evaluation System for Industrial Project', International Journal of Trade, Economics and Finance, Vol.1, No.4, pp. 332-341.
Kalton, GSH 1982, 'The effect of the question on survey responses: a review', Journal of Royal Statistical Society, Vol 145, pp. 42-73.
Khandani, A, Kim, A and lo, A 2010, 'Consumer credit models via machine learning algorithms', Journal of banking and finance, Vol.34, pp. 2367-2787.
Nederhof, A 1985, 'Methods of coping with social desirability bias: a review', European Journal of Social Psychology, Vol. 15, pp. 263-280.
Oyama, Y 2005, In: Advancing Credit Risk Management through Internal Rating System, Bank of Japan, Japan.
Podsakoff, P, MacKenzie, S, Lee, J and Podsakoff, N 2003, 'Common method biases in behavioral research: A critical review of the literature and recommended remedies', Journal of Applied Psychology, Vol. 88, No. 5, pp. 879-903.
Shepperd, JA, Carroll, P, Grace, J and Terry, M 2002, 'Exploring the Causes of Comparative Optimism', Psychologica Belgica, Vol. 42, No. 1, pp. 65-98.
Treacy, WF and Carey, M 2000, 'Credit risk rating systems at large US banks', Journal of Banking & Finance, Vol.24, pp. 167-201.
Vong, API and Patricio, AP 2005, 'Internal Credit Risk Rating Systems in the Macao Banking Sector', Euro Asia Journal of Management, Vol. 15, No. 2, pp.123-136.
West, D, Dellana, S and Qian, J 2005, „Neutral networks ensemble strategies for financial decisions applications‟, Journal of Computer and Operation Research, Vol.32, No.10, pp. 2543-2559.