Embed Size (px)
Citation preview

“Lessons Learned from the Copper Industry Applied to Gold Extraction”
John O. Marsden
Keynote Presentation at World Gold 2009 Conference, Johannesburg, South Africa, October 30th, 2009
MetallurgiumTM
Overview
• Introduction
• Managing the innovation process
• Cost control & business improvement
• Material Characterization
• Comminution
• Biological heap leaching
• Pressure leaching of copper-gold concentrates (& ores)
• Flowsheet innovation
• Conclusions
MetallurgiumTM
Introduction – The Copper Industry
• Large volume– 17 million tons per year copper production
– Typical ore value between $20 and $40/ton ($2.00/lb)
• Supply-demand balance, cyclical by nature
• Cycle periodicity is 6-9 years
• Cycles drive major business trends– Exploration, new mine development, mine closures,
process improvements, R & D, technology innovation
MetallurgiumTM

Copper Price for 1900-2008
Introduction – The Gold Industry
• Small volume– 2,600 tons per year gold production
– Typical ore value between $50 and $200/ton ($750/oz)
• Supply-demand balance plays lesser role
• Global/regional financial conditions, political stability, future global economic outlook are major drivers
• Near term pricing and changes tend to play a dominant role in industry developments ……………… but should they?
MetallurgiumTM
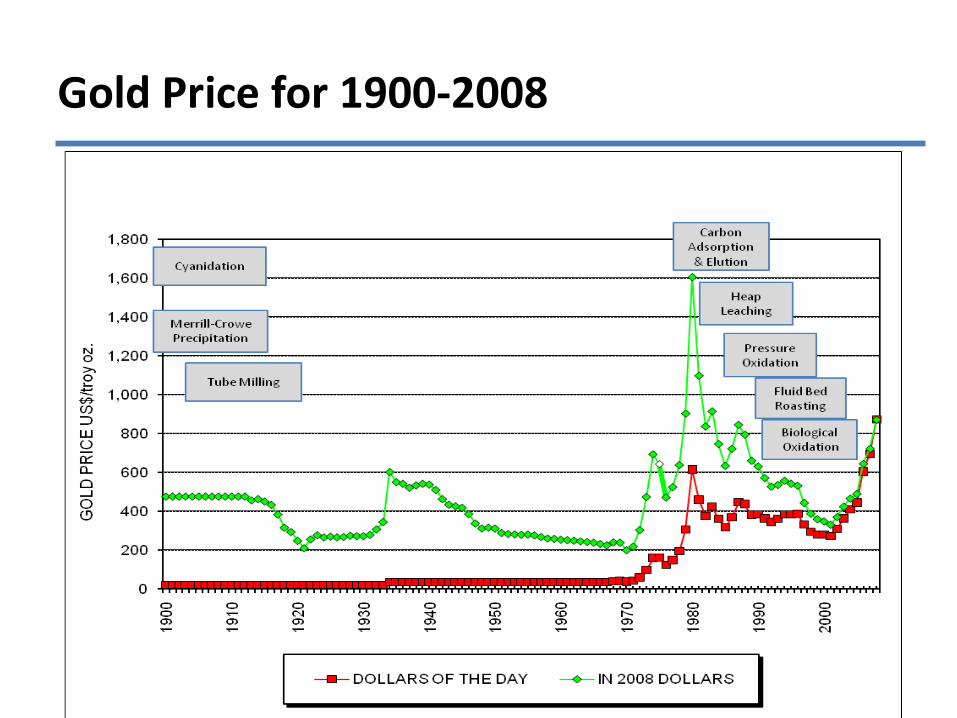
Gold Price for 1900-2008
Drivers for improvement & innovation
• Changing value of metal in today’s currency?
MetallurgiumTM
Drivers for improvement & innovation
• Changing value of metal in today’s currency?– Depends on point in the cycle – Do sustained high prices or sustained low prices drive
innovation?
MetallurgiumTM

Drivers for improvement & innovation
• Changing value of metal in today’s currency?– Depends on point in the cycle – Do sustained high prices or sustained low prices drive
innovation?
• Declining ore grades– Between 1988 and 2006, average copper head grade
declined from 1.08% to 0.84%– 22% decrease in grade; 45% decrease in margin
MetallurgiumTM
Drivers for improvement & innovation
• Changing value of metal in today’s currency?– Depends on point in the cycle – Do sustained high prices or sustained low prices drive
innovation?
• Declining ore grades– Between 1988 and 2006, average copper head grade
declined from 1.08% to 0.84%– 22% decrease in grade; 45% decrease in margin
• Increasing complexity of ores– Increased capital and operating costs– Decreased metallurgical recoveries
• Quality of people– Limited availability of graduates– Losing expertise through retirements Metallurgium
TM

Drivers for improvement & innovation
• Burning platform syndrome– Necessity is the mother of invention
• Gold industry challenges– Difficult to replace ore reserves
– Limited ore resource opportunities
– Severe competition amongst gold producers for resources and reserves
– Declining ore grades, fixed tails grade effects
– Increasing ore complexity
– Availability of expertise and skills
– Increasing energy cost
– Environmental and social pressures
MetallurgiumTM
Managing the Innovation Process
• Experienced, dedicated and self-motivated staff to lead
• Centralized, applied technology development group– Operations do not have the time, resources nor imperative
• Develop & maintain strategic plan for innovation
• Well-coordinated, operationally-focused approach– Operators involved at every step
• Strong focus on effective commercial application/ technology transfer
• Communicate process clearly and often
• Make timely go-no go decisions
• Every innovation needs a champion
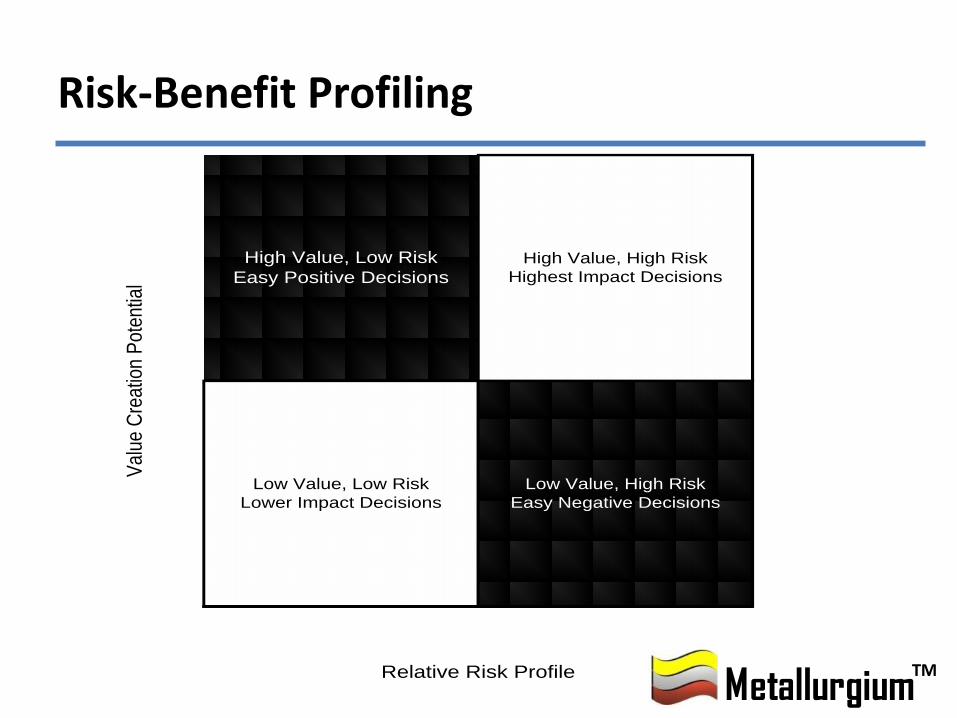
Risk-Benefit Profiling
MetallurgiumTM
Low Value, Low Risk
Lower Impact Decisions
Low Value, High Risk
Easy Negative Decisions
High Value, High Risk
Highest Impact Decisions
Relative Risk Profile
Val
ue C
reat
ion
Pot
entia
l
High Value, Low Risk
Easy Positive Decisions

Cost Control & Business Improvement
• Several initiatives implemented in copper industry– “Continuous Improvement”
– “Six Sigma”
– “Lean Production”
• Establish leadership and accountability
• Determine what process to be used
• Define how the initiative will be executed
• Establish metrics to measure progress
• Set a timeline for execution
• Measure and communicate results regularly
MetallurgiumTM
Improvement in Operating Efficiency
• Reduction in operating cost of existing process
• Improvement in metal(s) recovery
• Increase in throughput– Debottlenecking or expansion
• Improvement in ore quality (grade) to process
• Implementation of a new technology
• Other improvements – Safety, health & environmental
– Sustainable development
– Social responsibility aspects
MetallurgiumTM
Business Improvement Initiatives
• Team-based approach
• Rank and prioritize opportunities
• Cross-functional; cross-operations
• Cost-center focus
• Best practices – identification/implementation
• Benchmarking
MetallurgiumTM
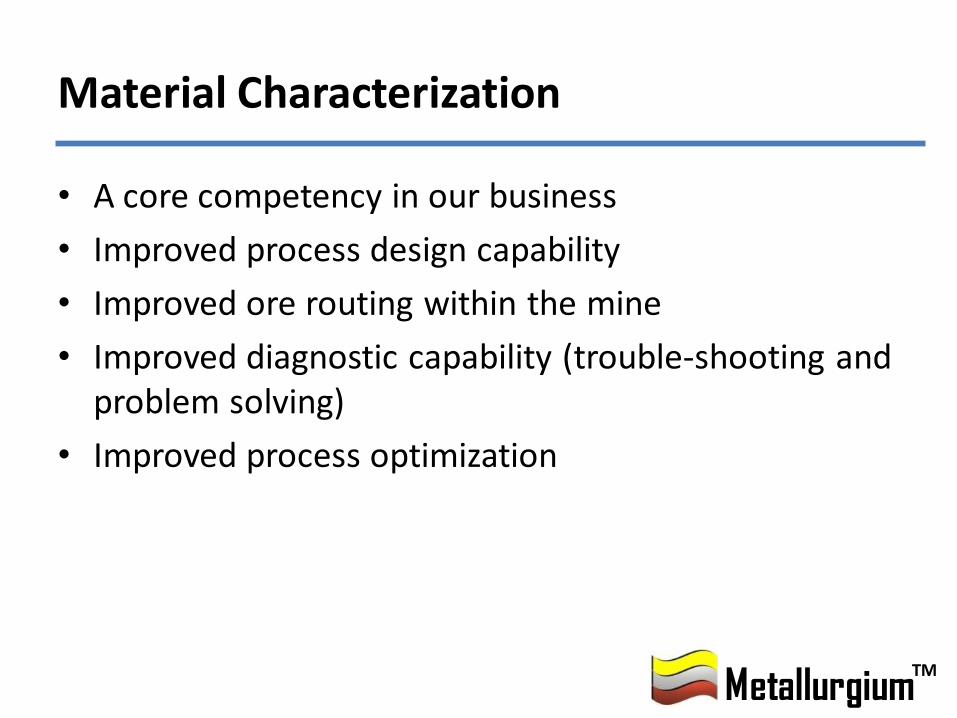
Material Characterization
• A core competency in our business
• Improved process design capability
• Improved ore routing within the mine
• Improved diagnostic capability (trouble-shooting and problem solving)
• Improved process optimization
MetallurgiumTM
Material Characterization
Material Characterization
TickMarks
Triangle lines
COR AC2
COR AC3
MET AC3
MET AC4
MET AC5
NWX AC2
NWX AC3
NWX AC4
NWX AC5
Ksp
Qz
Se
TickMarks
Triangle lines
COR QSAC1
MET QSAC1
MET QSAC2
MET QSAC3
NWX QSAC1
NWX QSAC2
Ksp
Qz
Se
TickMarks
Triangle lines
COR QSAC1
MET QSAC1
MET QSAC2
MET QSAC3
NWX QSAC1
NWX QSAC2
Ksp
Qz
Se
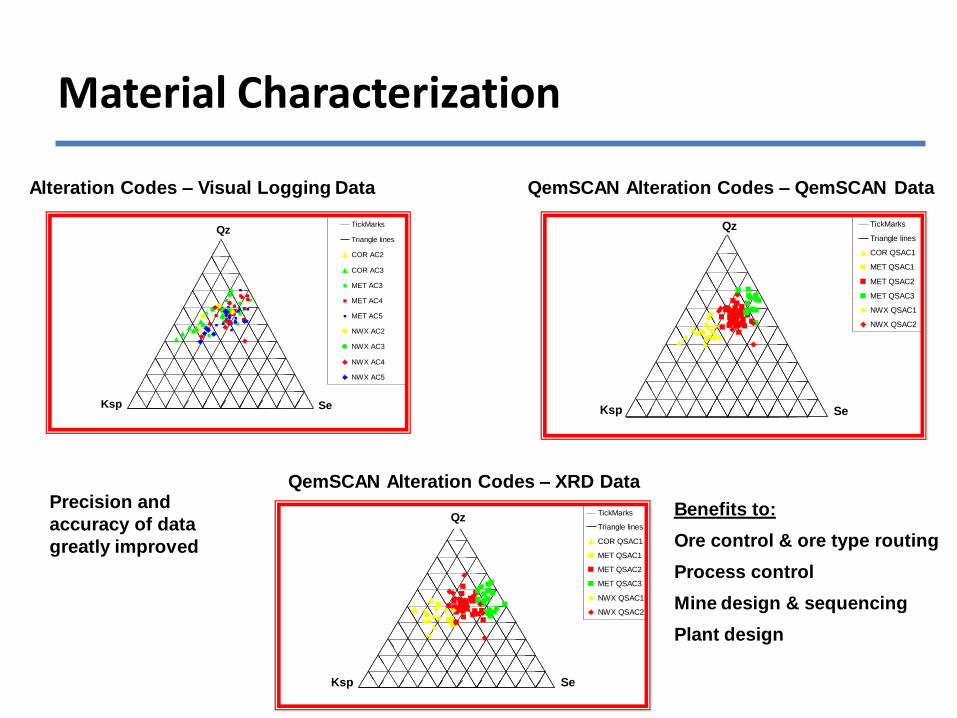
Alteration Codes – Visual Logging Data QemSCAN Alteration Codes – QemSCAN Data
QemSCAN Alteration Codes – XRD DataPrecision and
accuracy of data
greatly improved
Benefits to:
Ore control & ore type routing
Process control
Mine design & sequencing
Plant design

Comminution
• Scales of economy
• Optimal grind size for NPV versus cash flow
• Stirred milling
• High pressure grinding rolls (HPGR)
• HPGR and stirred milling
MetallurgiumTM
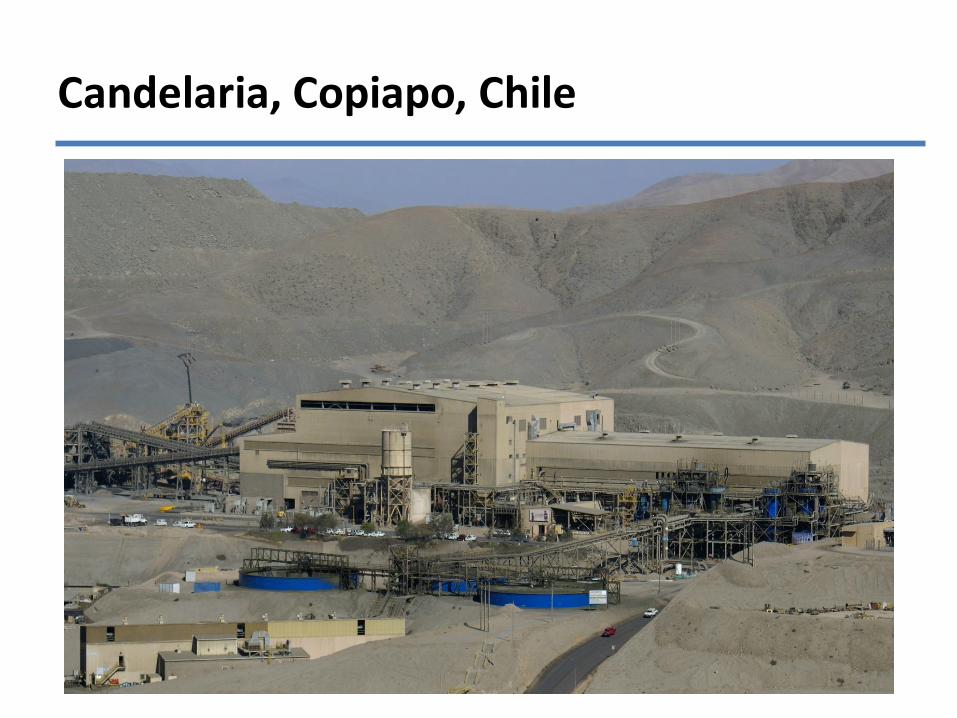
Candelaria, Copiapo, Chile
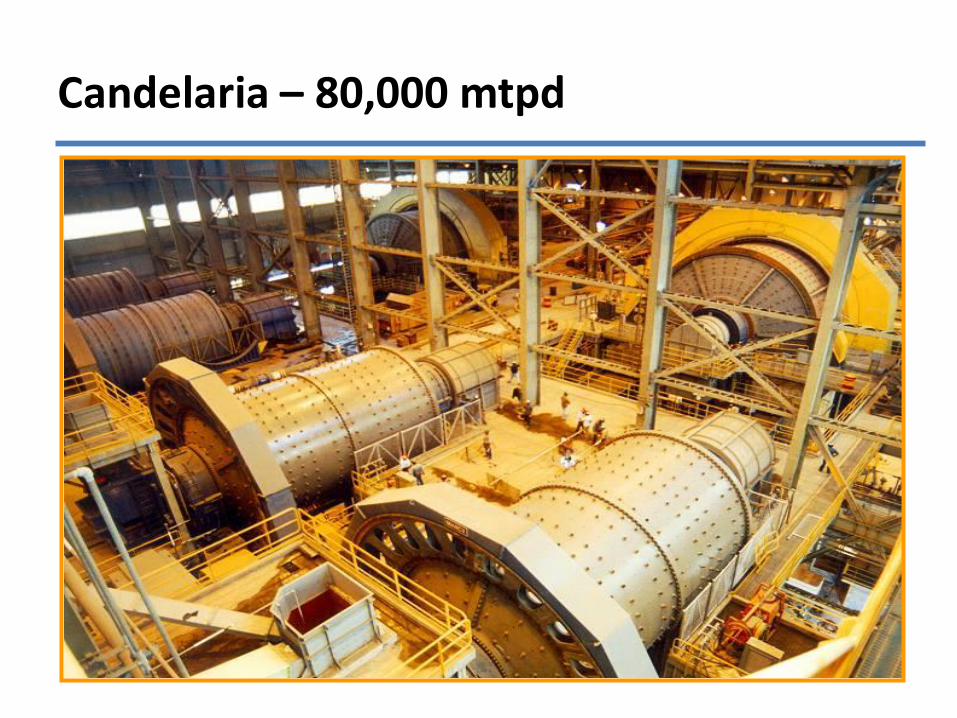
Candelaria – 80,000 mtpd
Grind Size versus Recovery
• Do you know the optimal grind size?
• What metal price are you using?
• How well is your process controlled?
MetallurgiumTM

Chino, New Mexico
Chino Grinding Optimization
• Optimal grind size was 80% -150 microns• Actual grind size through the 1980’s and into the 1990’s was
80% -300 microns– Approximately 8-9% copper recovery difference
• Added four VTM-1250 Vertimills as a tertiary grinding stage– 20-25% energy improvement vs. ball milling
• Design modifications were critical for success– Height:diameter ratio reduced– Shaft strengthened– Door access modified– Slurry entry point changed
• VTM-3000 (and larger) in design
MetallurgiumTM
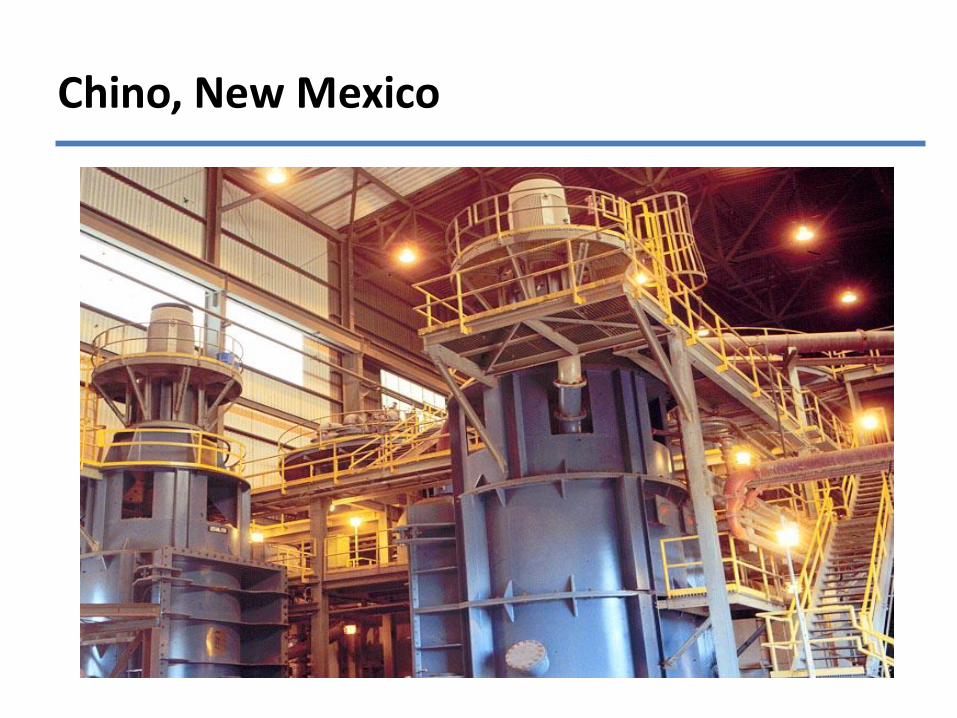
Chino, New Mexico
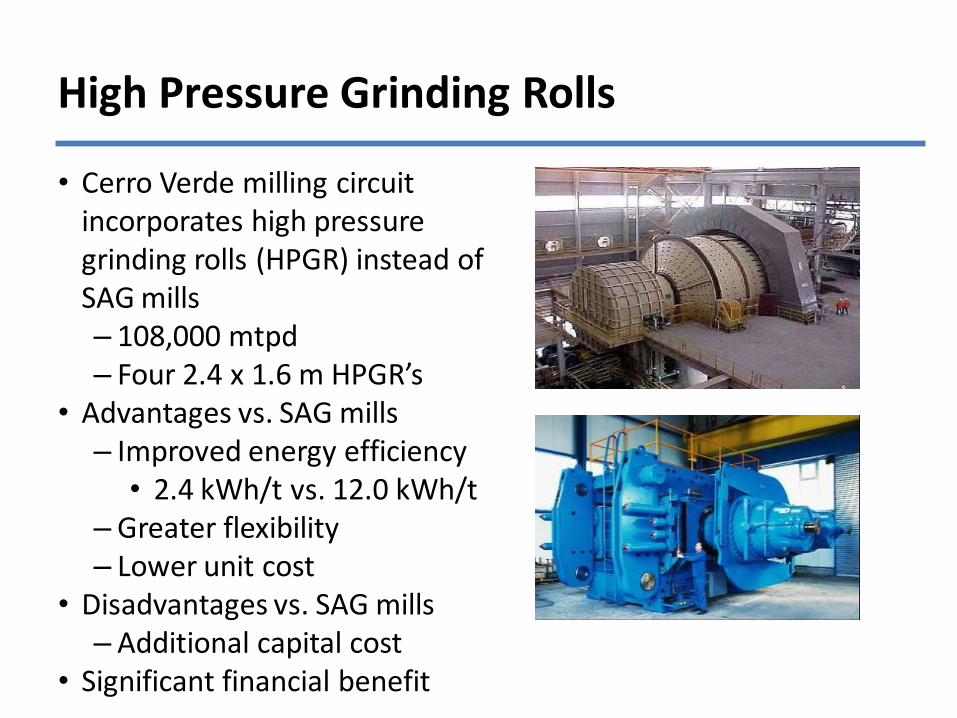
High Pressure Grinding Rolls
• Cerro Verde milling circuit incorporates high pressure grinding rolls (HPGR) instead of SAG mills– 108,000 mtpd– Four 2.4 x 1.6 m HPGR’s
• Advantages vs. SAG mills– Improved energy efficiency
• 2.4 kWh/t vs. 12.0 kWh/t – Greater flexibility– Lower unit cost
• Disadvantages vs. SAG mills– Additional capital cost
• Significant financial benefit
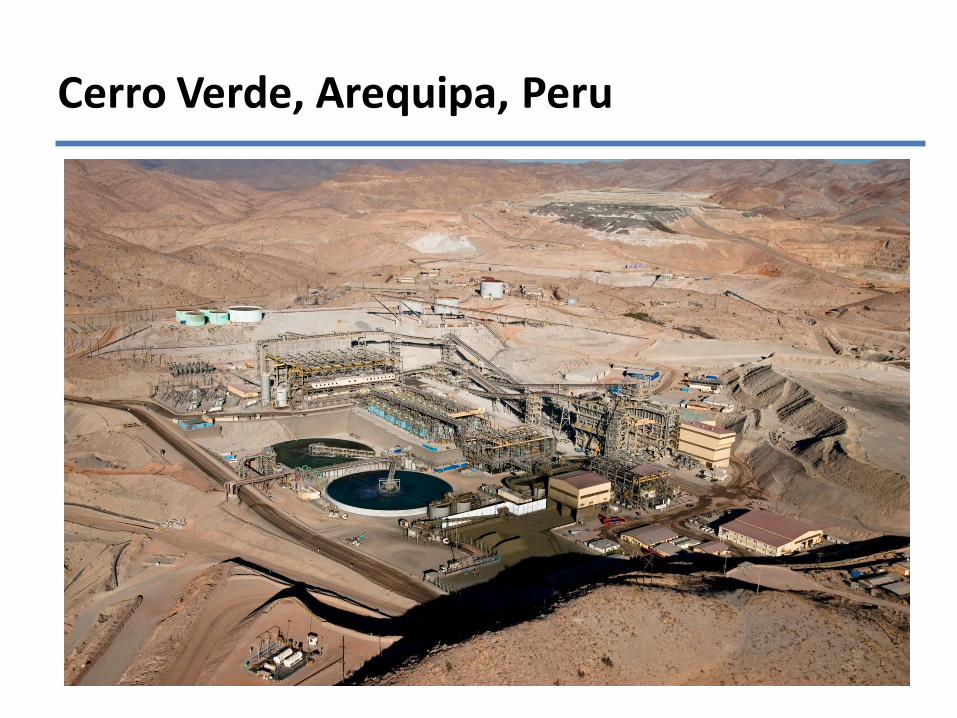
Cerro Verde, Arequipa, Peru

HPGR at Cerro Verde

HPGR at Cerro Verde
Biological Heap & Stockpile Leaching
• Ore stacking systems
• Air injection distribution
• Solution application rate & distribution
• Solution chemistry control
• Temperature control
• Bacteria developments
• Heap modelling & simulation
MetallurgiumTM
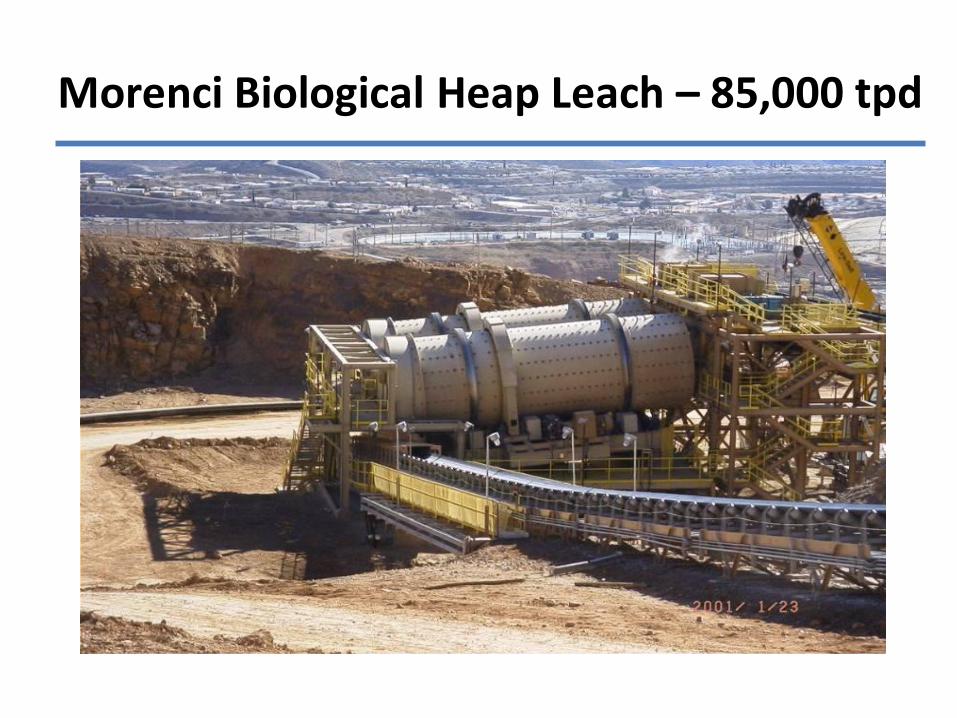
Morenci Biological Heap Leach – 85,000 tpd
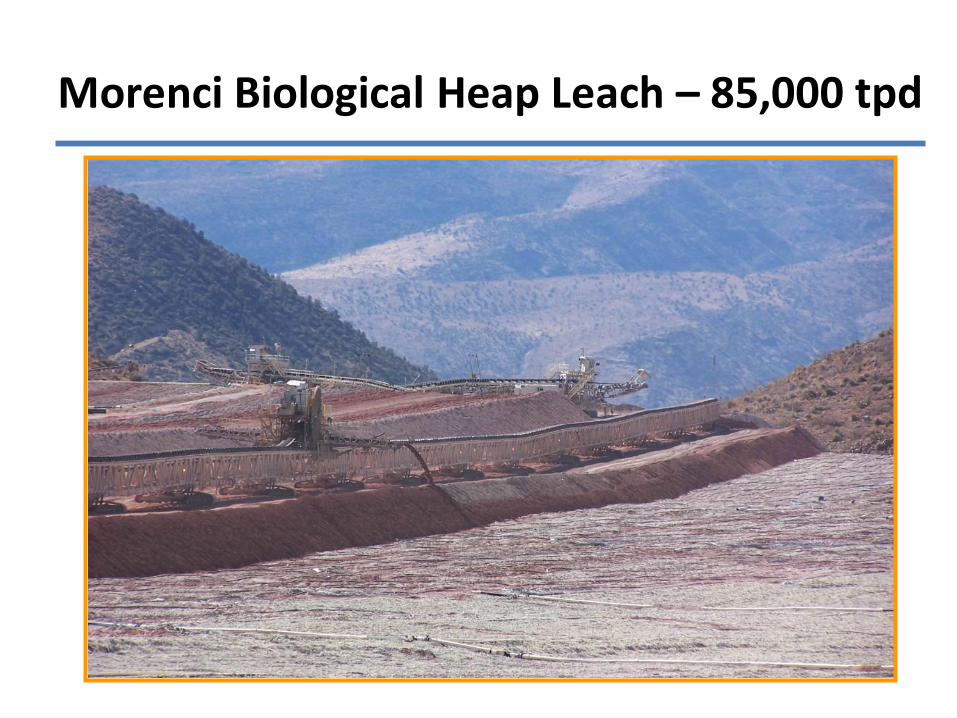
Morenci Biological Heap Leach – 85,000 tpd

Cerro Verde Biological Heap Leaching

Pressure Leaching of Cu-Au Concentrates
• Potential application to treat sulphide copper-gold ores
• High temperature and medium temperature applications
– 210-225°C versus 150-165°C
– Elemental sulphur formation and effect
MetallurgiumTM

Elemental Sulphur Formation
Proportion of
sulfide sulfur in
feed converted to
elemental sulfur (%)
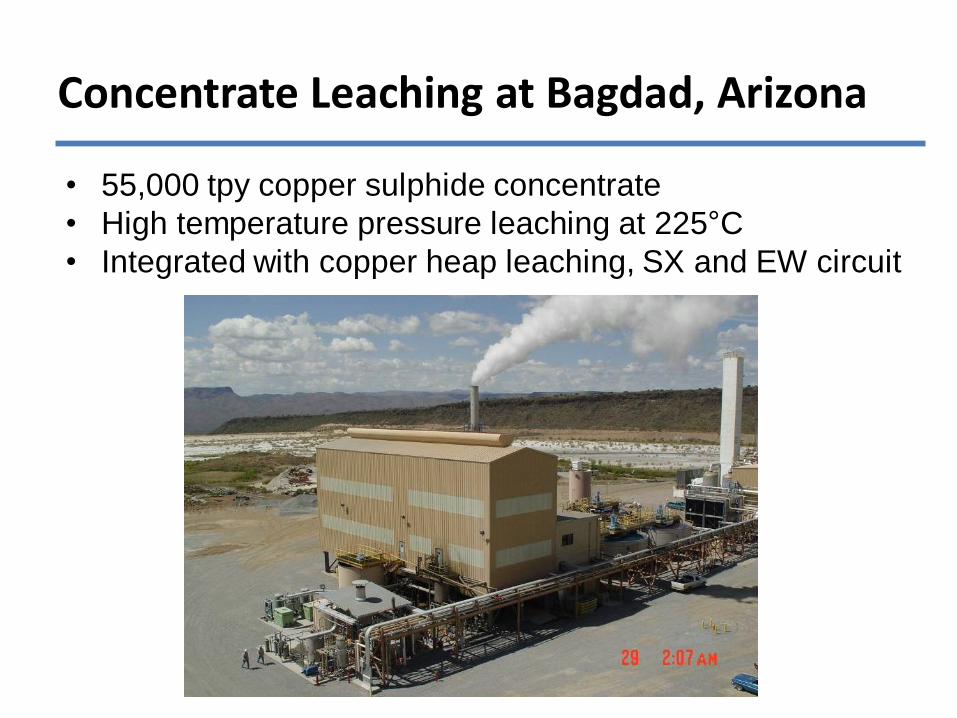
Concentrate Leaching at Bagdad, Arizona
• 55,000 tpy copper sulphide concentrate
• High temperature pressure leaching at 225°C
• Integrated with copper heap leaching, SX and EW circuit

Concentrate Leaching at Morenci, Arizona
• 200,000 tpy copper sulphide concentrate
• Medium temperature pressure leaching at 160°C
• Super-fine grinding to 98% <15 µm; 80% <7 µm
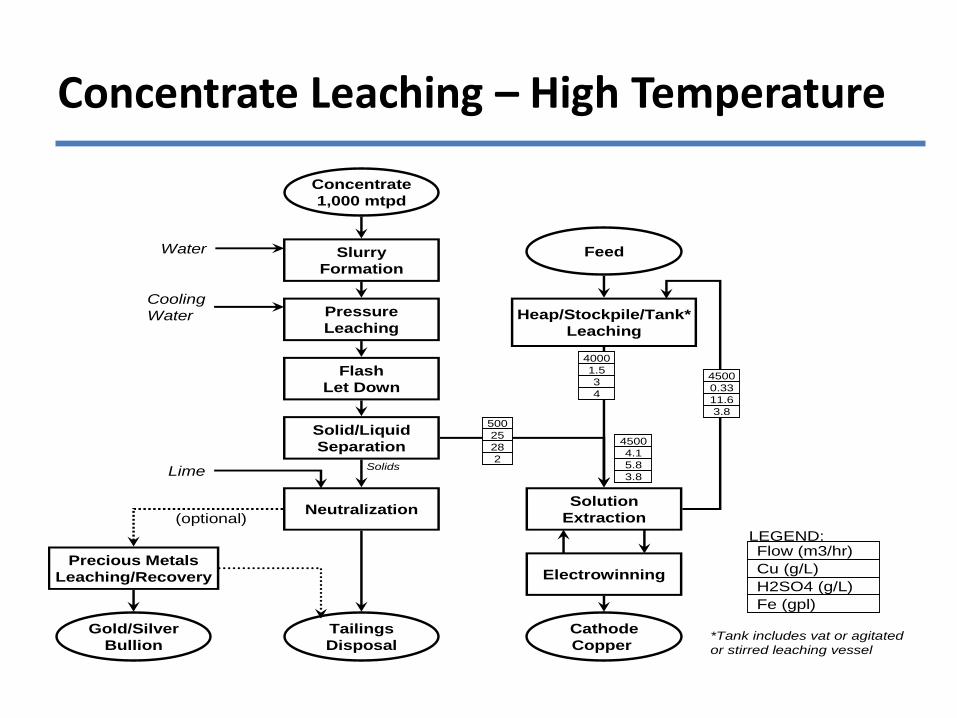
Concentrate Leaching – High Temperature
Slurry
Formation
Pressure
Leaching
Flash
Let Down
Solid/Liquid
Separation
Neutralization
Tailings
Disposal
Gold/Silver
Bullion
Cathode
Copper
Heap/Stockpile/Tank*
Leaching
Solution
Extraction
ElectrowinningPrecious Metals
Leaching/Recovery
Water
Lime
Cooling
Water
(optional)
500
25
28
2
4000
1.5
3
4
4500
4.1
5.8
3.8
4500
0.33
11.6
3.8
Concentrate
1,000 mtpd
*Tank includes vat or agitated
or stirred leaching vessel
Flow (m3/hr)
Cu (g/L)
H2SO4 (g/L)
Fe (gpl)
Feed
Solids
LEGEND:
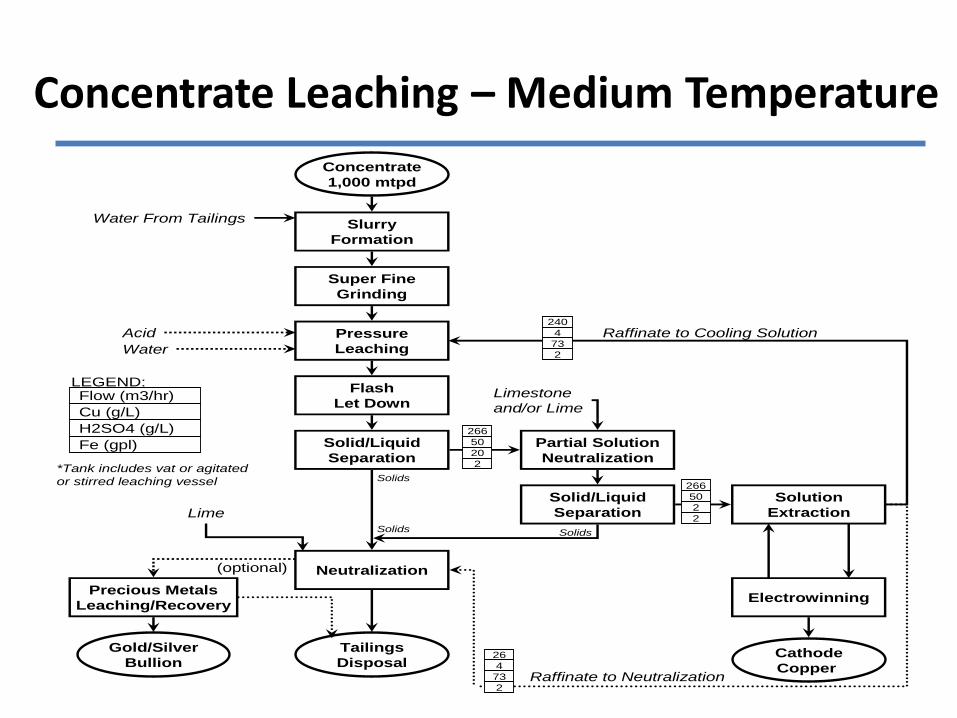
Concentrate Leaching – Medium Temperature
Slurry
Formation
Concentrate
1,000 mtpd
Pressure
Leaching
Flash
Let Down
Solid/Liquid
Separation
Neutralization
Tailings
Disposal
Gold/Silver
Bullion
Water From Tailings
(optional)
Super Fine
Grinding
Lime
Cathode
Copper
Solution
Extraction
Electrowinning
Acid
Partial Solution
Neutralization
Limestone
and/or Lime
Raffinate to Cooling Solution
Raffinate to Neutralization
Precious Metals
Leaching/Recovery
266
50
20
2
26
4
73
2
240
4
73
2
*Tank includes vat or agitated
or stirred leaching vessel
Flow (m3/hr)
Cu (g/L)
H2SO4 (g/L)
Fe (gpl)
Solids
Solid/Liquid
Separation
Solids
266
50
2
2Solids
LEGEND:
Water
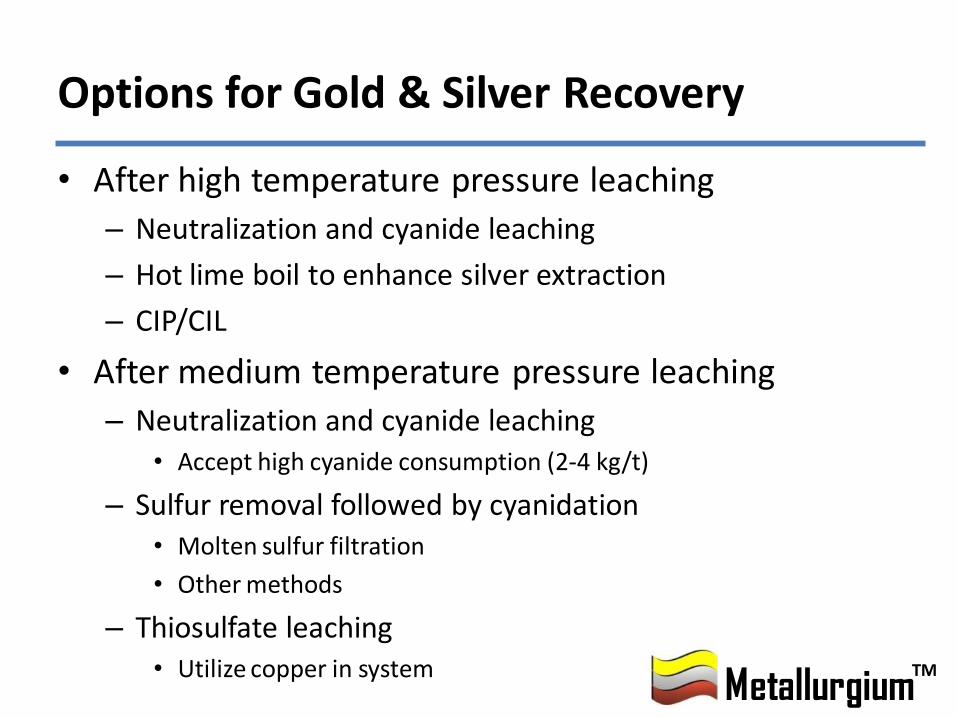
Options for Gold & Silver Recovery
• After high temperature pressure leaching
– Neutralization and cyanide leaching
– Hot lime boil to enhance silver extraction
– CIP/CIL
• After medium temperature pressure leaching
– Neutralization and cyanide leaching • Accept high cyanide consumption (2-4 kg/t)
– Sulfur removal followed by cyanidation• Molten sulfur filtration
• Other methods
– Thiosulfate leaching• Utilize copper in system
MetallurgiumTM

Innovation in Flowsheet Design
• Integration of milling & cyanide leaching with heap leaching in gold
• Integration of milling, flotation & concentrate leaching with heap leaching in copper
• Copper-gold ore pressure leaching options
– Treatment of rougher concentrates • Lower grade, higher recovery
– Selective flotation• Pyrite/chalcopyrite/chalcocite separations
– Co-extraction of uranium, other metals
MetallurgiumTM
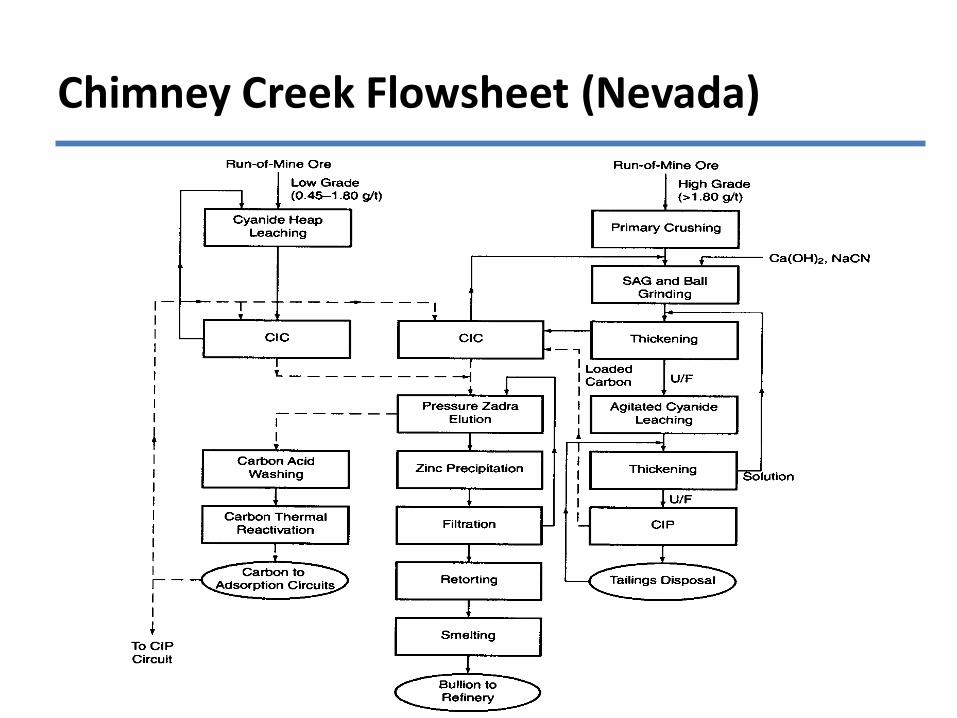
Chimney Creek Flowsheet (Nevada)

Conclusions
• Significant opportunities exist to apply lessons learned from the copper industry (and others) to gold
• Managing the innovation process• Cost control & business improvement• Technological advances
– Material characterization– Comminution– Biological heap leaching – Concentrate leaching
• Innovation in flowsheet design– Critical for complex, lower grade ores
MetallurgiumTM