Embed Size (px)
Citation preview

Injection Induced Seismicity and Geothermal Energy:
Lessons Learned from Past Injection Projects
Induced Seismicity in Energy TechnologiesJune 15, 2012
Testimony of Susan Petty, AltaRock Energy, Inc.T. Cladouhos1, S. Petty1, G. Foulger2, B. Julian2 and M. Fehler3
1AltaRock Energy, 2Foulger Consulting, 3MIT
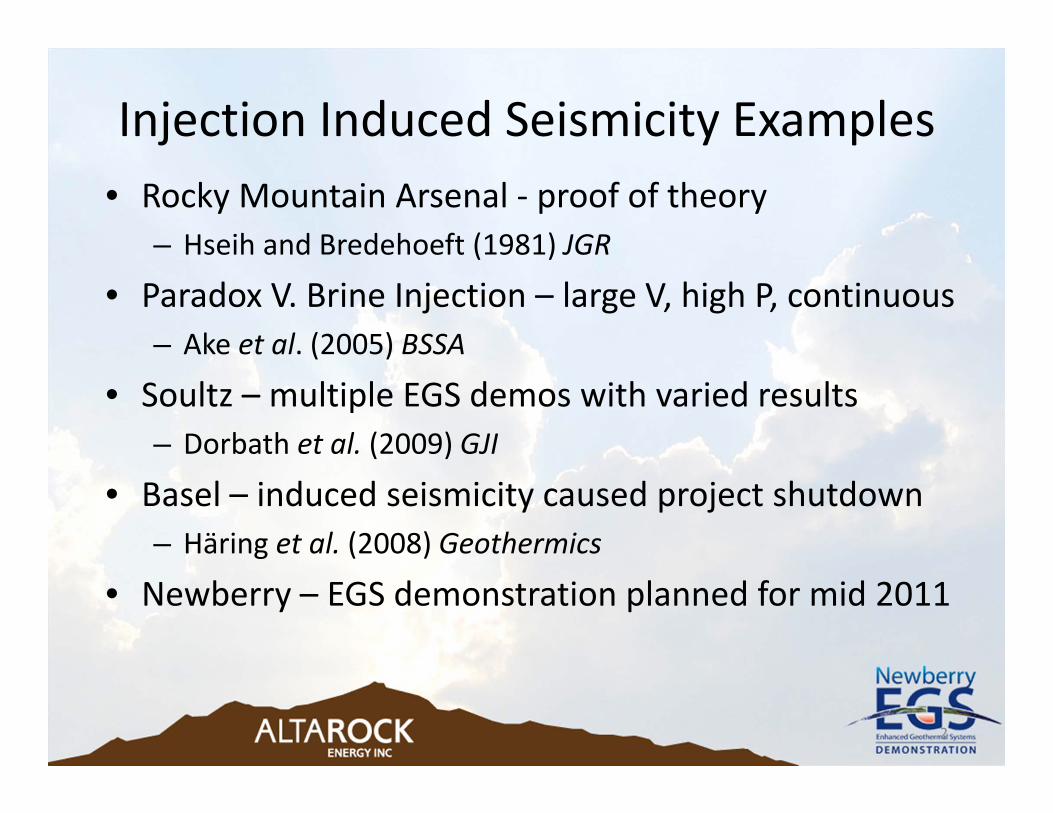
Injection Induced Seismicity Examples• Rocky Mountain Arsenal ‐ proof of theory
– Hseih and Bredehoeft (1981) JGR
• Paradox V. Brine Injection – large V, high P, continuous– Ake et al. (2005) BSSA
• Soultz – multiple EGS demos with varied results– Dorbath et al. (2009) GJI
• Basel – induced seismicity caused project shutdown – Häring et al. (2008) Geothermics
• Newberry – EGS demonstration planned for mid 2011
2

Parameters affecting rate and size distribution IIS
• In situ stress and natural fluid pressure• Frictional strength of faults and fractures• Critical pressure to initiate hydroshear• Tensile fracture pressures (minimum principle stress)• G‐R seismicity relation (b value)• Characteristics of faults & fractures in the BH• Well head pressure• Injection rate, steps, and duration• Total injected volume
3

Rocky Mountain Arsenal
4
• Depth = 3.7 km (12000 ft)• Fractured gneiss • Max P = 7.2 MPa (1000 psi)• Eventual gravity feed• 4 years of injection
• Max R > 6.3 L/s (250 gpm)• Mmax = 5.3
0
1
2
3
4
5
6
7
8
9
10
1962 1963 1964 1965 1966 1967 1968 1969
Million gallo
ns injected
Year
* **
0
20
40
60
80
100
120
140
1962 1963 1964 1965 1966 1967 1968 1969
# of earthqu
akes
Year
* M > 5

Later Observations
5
• Natural reservoir was under‐pressured (925 m bgs)
• Seismicity didn’t stop until WL dropped bgs
• ΔPc = 3.2 MPa(Δ325 m head)
• 25 newspapers reported a similar earthquake in 1882

Lessons Learned• Faults can be weakened by injection (Hubbert & Rubey, 1959)
• Avoid injecting into known faults• Know the critical pressure
6

Paradox Valley Brine Injection
7
•Depth = 4.5 km (14750’)•Fractured dolomitic limestone•Continuous since 1996
•ΔPc = 17 MPa (2465 psi)•Max Pwh = 34.2 MPa (4960 psi)•Max Rate = 21.5 L/s (340 gpm)

8
21.5 L/s | 14.5 L/s
M=4.3 *M<2.8
Sr
Ir
Sr = 0.27 Ir – 3.1 R=96%

9
Soultz• 3 deep stimulations• Depth = 5.0 km • Granite
•ΔPc ≈ 12 Mpa• Max Pwp ≈ 14‐16 MPa• Max rate = 50 l/s• 7‐11 days of injection
hydrofrac
critical pressure

Structure of GPK2 vs. GPK3
10
Side view of GPK2 stim Side view of GPK3 stim
20‐fold injectivity improvement
70% of flow into one fracture:little injectivity improvement
many fractures

11
GPK3B=0.94 (tectonic)Mmax =2.9GPK2
B=1.23Mmax =2.5
Lessons Learned•Avoid injecting into fracture zones with already high transmissivity(GPK3)•Higher b‐value results in lower maximum event size and better fracture network for EGS

12
Basel DHM
•Depth = 5 km•Granite
•ΔPc ≈ 11 Mpa•Max Pwh = 29.6•Max Rate = 55 L/s•Mmax = 3.4
bleed‐off
~hydrofrac
ML 2.6
critical pressure

Basel Deep Heat Mining Project
13
3 km

14
Lessons Learned• Avoid injecting into faults • If pressure builds, wait to increase rate• Bleed off works to slow felt IIS

0
500
1000
1500
2000
2500
3000
3500
4000
4500
5000
0 100 200 300 400 500 600 700 800 900 1000
Surface Pressure, psig
Flow Rate, gpm
Paradox Valley Brine (14000')
Basel (16000')
RMA (12000') est. – 4 years
Soultz (16000')GPK4
GPK3
Newberry (6500')
GPK2
Paradox Valley Brine (14000‘ ‐ 14 years)
Soultz (16000')GPK4
GPK3
Newberry (6500')
GPK2
Before Stimulation
After Stimulation
Injectivity

Theoretical Model (Shapiro et al. 2010)log NM(t) = log Qc(t) − bM + {a ‐ log (CS/N)}
where Σ• NM(t) is number of events greater than M• Qc(t) is cumulative injected volume• b and a are constants in Gutenburg‐Richter relation• Σ , the seismogenic index, is independent of the injection• Σ characterizes the rock mass (seismicity rate, critical pressure, fracture density, and poroelastic coefficient)
• Σ can be determined from ongoing stimulation results
16

Seismogenic Index for injection projects
17
the seismicity induced by the same quantity of injected volume will depend upon the inherited local geomechanical setting

Newberry EGS Demonstration Project Experience:Strategy for Mitigation of Induced Seismicity
• EGS Demonstration Project with DOE 50% funding• NEPA permitting process through BLM, Forest Service
and DOE• State and local permitting through BLM as lead agency• Environmental Assessment includes Induced Seismicity
Mitigation Plan
18

Newberry EGS Demonstration – Pre‐stimulation• Baseline injection tests• Surface shot calibration survey ‐ USGS• Monitor background seismicity• LiDAR collection for neotectonic data• Examine mud‐logs & cuttings for evidence of faults• Borehole televiewer survey• Model expected seismicity with AltaStim• Induced Seismicity Mitigation Plan• Install permanent borehole MSA• Monitor background data
19

Permanent Microseismic Array Design • Phase II array – stimulation
• 15‐station array of borehole and surface sensors
• Nine borehole sensors at 700‐900 feet, with hole‐lock
• Six surface sensors• Real‐time telemetry
• Strong motion sensor (SMS) at Paulina Lake Visitor Center
• BH drilling and installation: March‐June 2012

• Methodology: C.A. Cornell (1968)• Software: HAZ38 (PG&E)• Analysis: I. Wong, URS• Seismic Sources
– Natural and EGS– Source geometry– Earthquake recurrence
• PGA>0.028 g has cosmetic damage potential, probability of exceeding threshold is– 5% per year for natural events– 0.2% per year for EGS events
Probablistic Seismic Hazard Assessment
Annu
al Probability of Exceedance
Peak Ground Acceleration (g)
10%
1%
.1%
.001%
.01%
10.50.25 0.75
Total hazard
EGS Hazard
0.028 g

Risk from induced event
• Historical / theoretical maximum magnitude = 3.5‐4.0
• Mw 3.5 probability < 0.3% within 30 day stimulation period
• Shake Map shows predicted shaking from M 3.5 at well
• Nearest structures, cabins in NNVM: MMI V (felt, light damage potential)
• Nearest town MMI<III (barely felt, no damage potential)

Seismic Triggers• Outliers
– horizontal– Vertical– NNVM
3 km
1 km
• Magnitude• PGA on SMS

• Regulator approval• MSA/SMS active Start
• Event >1 km from well• Shallow (<6000 ft) event• Within 500 m of NNVM
Outlier Alert
• M 2.0 to 2.6 within 3 km No Flow Increase
• M 2.7 to 3.4 within 3 km• PLVC PGA: 0.014 to 0.028 g• MMI: IV (Light, no damage)
Decrease Flow
• M ≥ 3.5 within 3 km• PLVC PGA ≥ 0.028 g• MMI: IV (Light, no damage)
Stop Injection –Flow Well
Initiate stimulation planConduct step‐rate test
Confirm, then apply diverterNo flow or pressure increaseAssess result for 24 hours
No flow or pressure increase
Reduce flow to reduce P Wait 12 hours
Stop injectionFlow to surface (sump)
Event Characteristics Field Operation
Seismic Triggers and Mitigation Steps
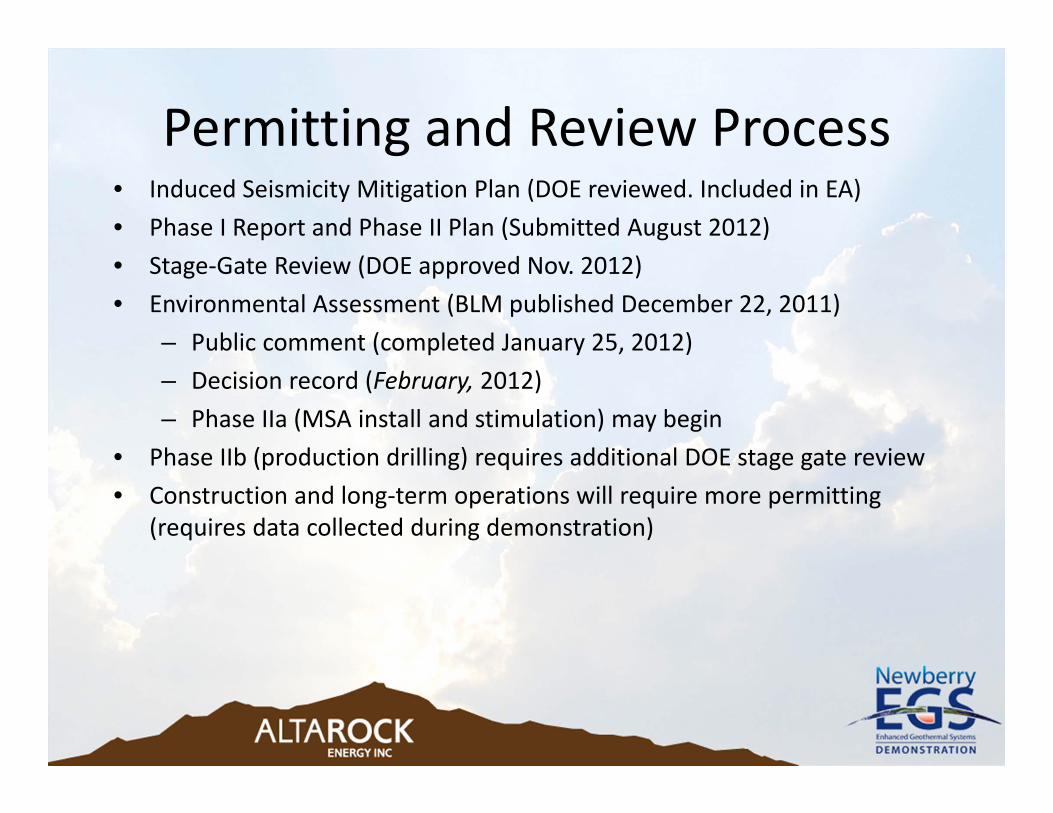
Permitting and Review Process• Induced Seismicity Mitigation Plan (DOE reviewed. Included in EA)• Phase I Report and Phase II Plan (Submitted August 2012)• Stage‐Gate Review (DOE approved Nov. 2012)• Environmental Assessment (BLM published December 22, 2011)
– Public comment (completed January 25, 2012)– Decision record (February, 2012)– Phase IIa (MSA install and stimulation) may begin
• Phase IIb (production drilling) requires additional DOE stage gate review• Construction and long‐term operations will require more permitting
(requires data collected during demonstration)

Public Outreach• Community meetings• Print and radio interviews• TV segments
– Oregon Field Guide (Feb. 16)– Seattle news stations
• Documents posted online• 855‐USA4EGS• Animated project video• NNVM displays• Facebook.com/NewberryEGS

Acknowledgments
Funded by AltaRock Energy and Development of a Geological and Geomechanical Framework for the
Analysis of MEQ, DOE/Recovery Act grant to A. Ghassemi, Texas A&M and N. Davatzes, Temple University.


![Senate Untitled]1.pdf
Senate](https://img.pdfslide.us/doc/110x75/5fd08a690c749d0f6b2c6587/-senate-untitled1pdf-senate.jpg)