Embed Size (px)
Citation preview

Lessons Learned from CCS Demonstration and Large Pilot Projects
An MIT Energy Initiative Working Paper
May 2016
Howard Herzog1*
1MIT Energy Initiative, Massachusetts Institute of Technology
MIT Energy Initiative, 77 Massachusetts Ave., Cambridge, MA 02139, USA
*Corresponding Author
MITEI-WP-2016-06

Table of Contents
Summary 3
Overview 4
Background 5
Review of CCS Demonstration Programs 9
Analysis of Selected CCS Projects 24
Lessons Learned 38
References 43
H. Herzog, 2016
2
Acknowledgement The Carbon Sequestration Initiative, an industrial consortium housed in the MIT Energy Initiative (MITEI), has been tracking the progress of large-scale Carbon Dioxide Capture and Storage (CCS) projects for many years.1 The knowledge and data obtained in that project formed the basis of this paper. The original version of this paper was done for the Coal Utilization Research Council (CURC). It was one of three white papers for a CURC report entitled “Analysis Of Options For Funding Large Pilot Scale Testing Of Advanced Fossil-Based Power Generation Technologies With Carbon Capture And Storage.” This project was sponsored by the New Energy and Industrial Technology Development Organization (NEDO) of Japan. Disclaimer This paper contains significant information about dozens of CCS pilot and demonstration projects worldwide. Every effort was made to be as accurate as possible. However, many of these projects are in a state of flux and the references used are quite varied. Therefore, some of the project details may have changed or be in error. However, any such problems will not change the analyses or findings in this paper.
1 See http://sequestration.mit.edu/tools/projects/index.html
H. Herzog, 2016
3
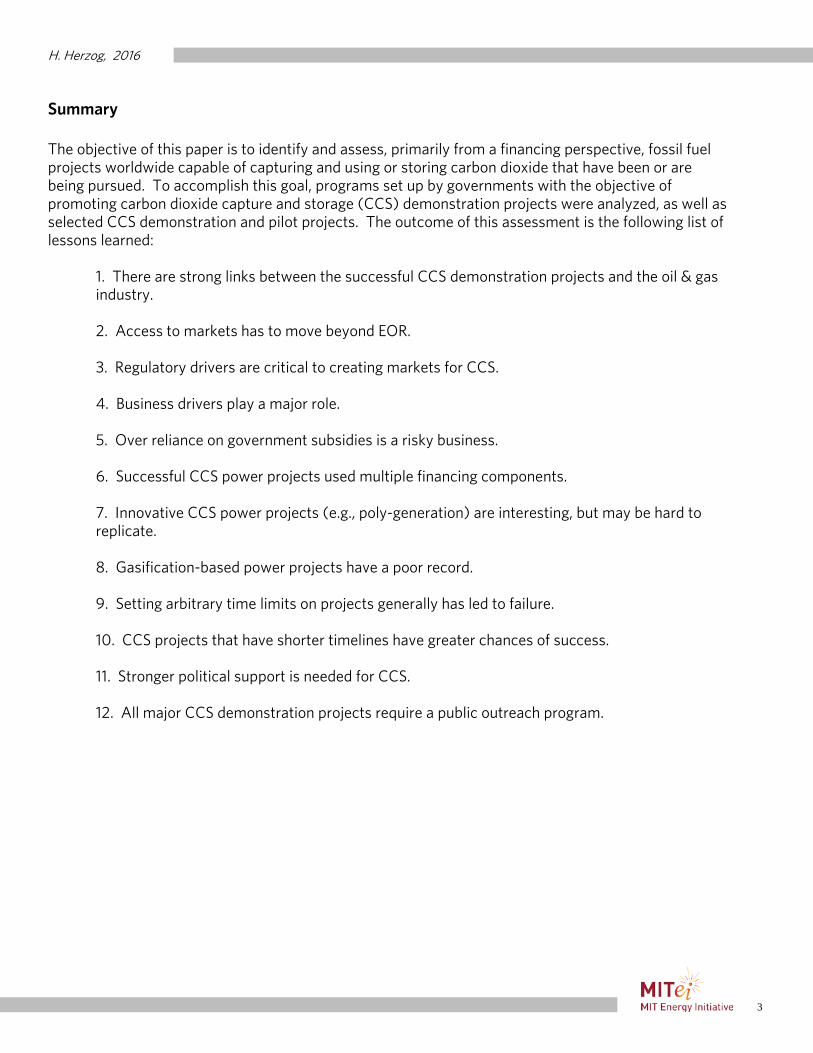
Summary The objective of this paper is to identify and assess, primarily from a financing perspective, fossil fuel projects worldwide capable of capturing and using or storing carbon dioxide that have been or are being pursued. To accomplish this goal, programs set up by governments with the objective of promoting carbon dioxide capture and storage (CCS) demonstration projects were analyzed, as well as selected CCS demonstration and pilot projects. The outcome of this assessment is the following list of lessons learned:
1. There are strong links between the successful CCS demonstration projects and the oil & gas industry. 2. Access to markets has to move beyond EOR. 3. Regulatory drivers are critical to creating markets for CCS. 4. Business drivers play a major role. 5. Over reliance on government subsidies is a risky business. 6. Successful CCS power projects used multiple financing components. 7. Innovative CCS power projects (e.g., poly-generation) are interesting, but may be hard to replicate. 8. Gasification-based power projects have a poor record. 9. Setting arbitrary time limits on projects generally has led to failure. 10. CCS projects that have shorter timelines have greater chances of success. 11. Stronger political support is needed for CCS. 12. All major CCS demonstration projects require a public outreach program.
H. Herzog, 2016
4
1. Overview The objective of this paper is to identify and assess fossil fuel projects worldwide capable of capturing and using or storing carbon dioxide that have been or are being pursued. The focus of this assessment is large scale demonstrations (>1 million tons CO2/yr). However, Section 4.3 examines large pilot projects (>10MWe or equivalent). The assessment includes not only projects that have been successful, but also projects that have been abandoned and why (i.e. lessons learned). Note that the paper’s objective is not to include every carbon dioxide capture and storage (CCS) project ever announced, but to include enough projects to generate a set of lessons learned concerning project financing, as well as legal and regulatory issues. Section 2 of this paper presents background material on two key topics: (1) options for financing CCS projects and (2) the current status of CCS demonstration projects. Section 3 reviews major CCS demonstration programs worldwide. These are programs set up by governments with the objective of promoting CCS demonstration projects. Section 4 analyzes selected CCS projects primarily from a financing perspective. Projects are also presented where other issues (e.g., regulatory, public acceptance) were important. Finally, Section 5 synthesizes the information in Sections 2-4 in order to summarize the lessons learned and to draw conclusions.
H. Herzog, 2016
5
2. Background 2.1. Financing Demonstration Projects While project financing can be very complex, its purpose is very simple – project financing must pay for the project. In this paper, we focus on the income streams that must cover both the capital and operating costs of the project. For commercial technology, markets are generally the sole source of income. With emerging technologies like CCS, markets are usually insufficient, so they must be supplemented with what can be referred to as “technology push” programs. These programs can create revenue streams to partially aid in the financing. Beyond the revenue streams provided by markets and technology push programs, there are other drivers that affect a project’s economic viability. As will be seen in Section 4, two important drivers for CCS projects are what we term as business drivers and regulatory drivers. Below is a list that summarizes the main components that have been used to help finance CCS projects.
• Market Pull Carbon markets Electricity markets Enhanced Oil Recovery (EOR) Others (e.g., poly-generation)
• Technology Push Direct subsidies Tax credits (e.g., investment, production) Loan guarantees Mandates (e.g., portfolio standards) Others (e.g., feed-in tariffs, contracts-for-differences)
• Other Drivers Regulatory Business
In this paper, the term “access to electricity markets” is used. While projects will have no trouble selling their electricity at market prices, “access to electricity markets” in this paper means getting special compensation from these markets. To gain this access usually requires that special permission is obtained from electricity regulators or that a special law or regulation is in effect. 2.2. Status of CCS Demonstration Projects The Global CCS Institute has presented annual lists of CCS projects in various stages of development, going from announced projects (“identify”) all the way to completed projects (“operate”). Note that within the CCS community there are different definitions of what is or is not a “CCS demonstration project”. This paper neither endorses nor rejects the GCCSI definitions. We use their lists for two reasons: (1) they represent a consistent time series (used in Table 1) and (2) they contain the most inclusive list of projects in operation or under construction (used in Tables 2 through 4). One can look at these lists as a project pipeline, as presented in Table 1. While the number of completed projects has risen over the past 3 years, the number of projects in the pipeline has significantly decreased. As will be documented later in this paper, this is primarily due to the difficulty in financing these projects.
H. Herzog, 2016
6
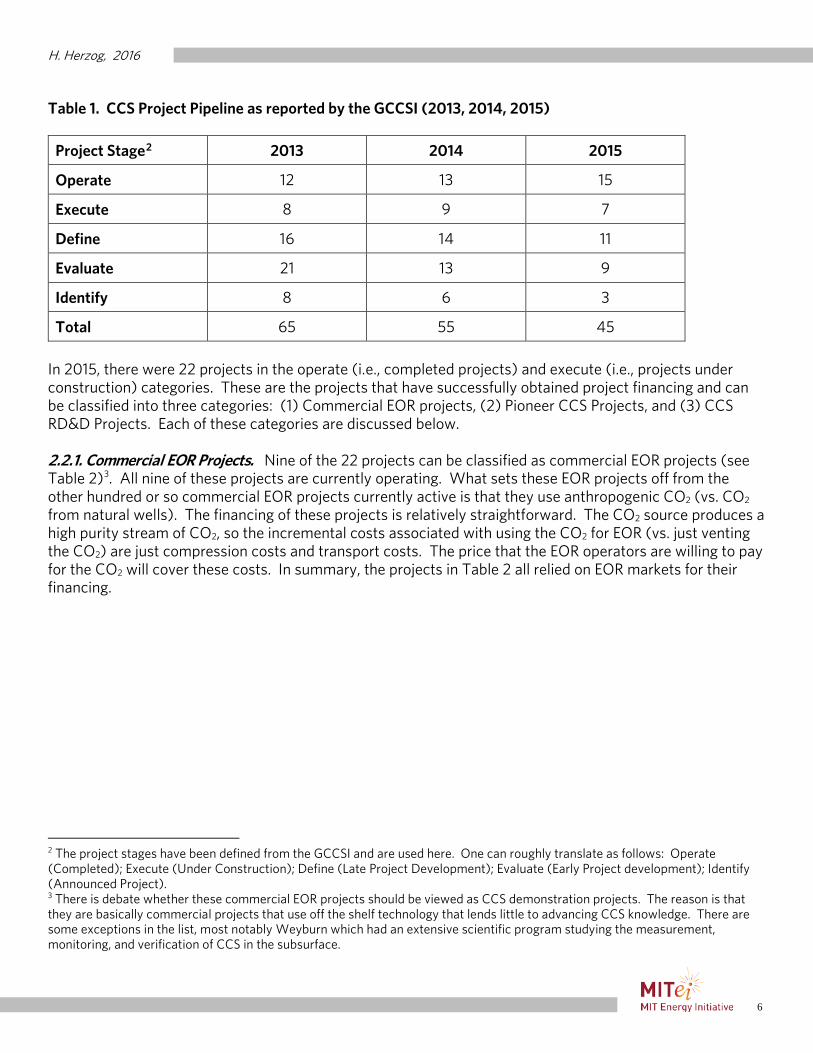
Table 1. CCS Project Pipeline as reported by the GCCSI (2013, 2014, 2015)
Project Stage2 2013 2014 2015
Operate 12 13 15
Execute 8 9 7
Define 16 14 11
Evaluate 21 13 9
Identify 8 6 3
Total 65 55 45
In 2015, there were 22 projects in the operate (i.e., completed projects) and execute (i.e., projects under construction) categories. These are the projects that have successfully obtained project financing and can be classified into three categories: (1) Commercial EOR projects, (2) Pioneer CCS Projects, and (3) CCS RD&D Projects. Each of these categories are discussed below. 2.2.1. Commercial EOR Projects. Nine of the 22 projects can be classified as commercial EOR projects (see Table 2)3. All nine of these projects are currently operating. What sets these EOR projects off from the other hundred or so commercial EOR projects currently active is that they use anthropogenic CO2 (vs. CO2 from natural wells). The financing of these projects is relatively straightforward. The CO2 source produces a high purity stream of CO2, so the incremental costs associated with using the CO2 for EOR (vs. just venting the CO2) are just compression costs and transport costs. The price that the EOR operators are willing to pay for the CO2 will cover these costs. In summary, the projects in Table 2 all relied on EOR markets for their financing.
2 The project stages have been defined from the GCCSI and are used here. One can roughly translate as follows: Operate (Completed); Execute (Under Construction); Define (Late Project Development); Evaluate (Early Project development); Identify (Announced Project). 3 There is debate whether these commercial EOR projects should be viewed as CCS demonstration projects. The reason is that they are basically commercial projects that use off the shelf technology that lends little to advancing CCS knowledge. There are some exceptions in the list, most notably Weyburn which had an extensive scientific program studying the measurement, monitoring, and verification of CCS in the subsurface.
H. Herzog, 2016
7
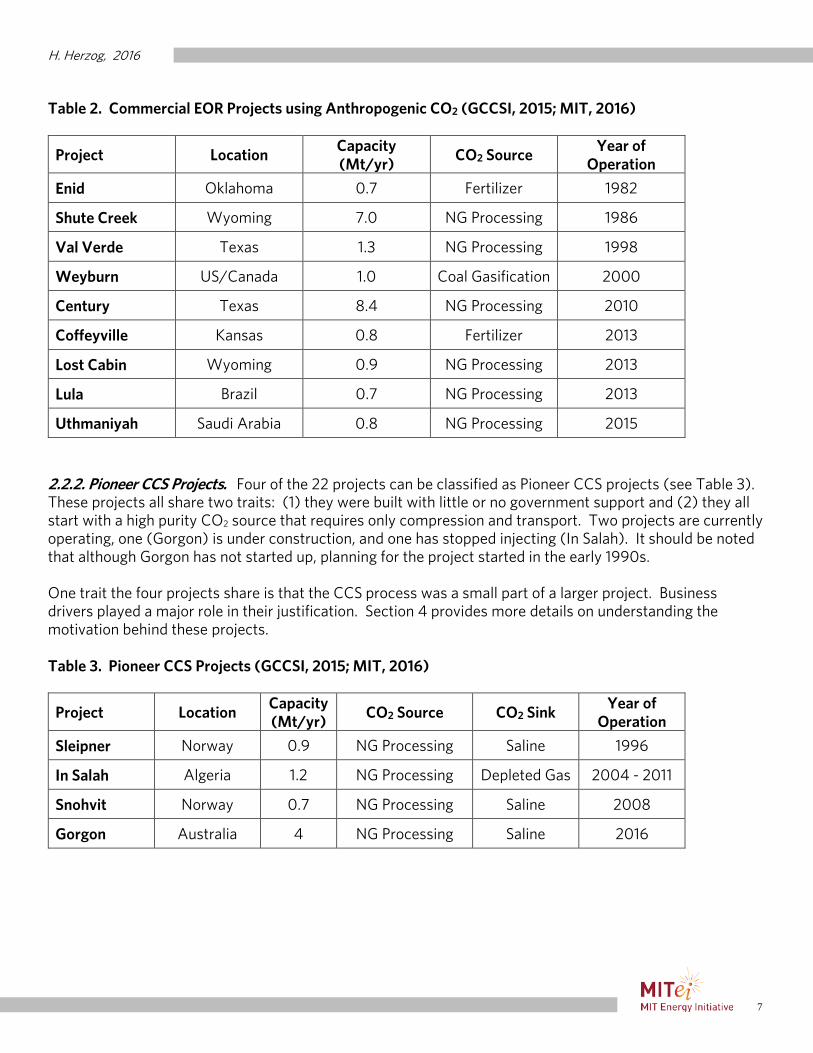
Table 2. Commercial EOR Projects using Anthropogenic CO2 (GCCSI, 2015; MIT, 2016)
Project Location Capacity (Mt/yr)
CO2 Source Year of
Operation
Enid Oklahoma 0.7 Fertilizer 1982
Shute Creek Wyoming 7.0 NG Processing 1986
Val Verde Texas 1.3 NG Processing 1998
Weyburn US/Canada 1.0 Coal Gasification 2000
Century Texas 8.4 NG Processing 2010
Coffeyville Kansas 0.8 Fertilizer 2013
Lost Cabin Wyoming 0.9 NG Processing 2013
Lula Brazil 0.7 NG Processing 2013
Uthmaniyah Saudi Arabia 0.8 NG Processing 2015
2.2.2. Pioneer CCS Projects. Four of the 22 projects can be classified as Pioneer CCS projects (see Table 3). These projects all share two traits: (1) they were built with little or no government support and (2) they all start with a high purity CO2 source that requires only compression and transport. Two projects are currently operating, one (Gorgon) is under construction, and one has stopped injecting (In Salah). It should be noted that although Gorgon has not started up, planning for the project started in the early 1990s. One trait the four projects share is that the CCS process was a small part of a larger project. Business drivers played a major role in their justification. Section 4 provides more details on understanding the motivation behind these projects. Table 3. Pioneer CCS Projects (GCCSI, 2015; MIT, 2016)
Project Location Capacity (Mt/yr)
CO2 Source CO2 Sink Year of
Operation
Sleipner Norway 0.9 NG Processing Saline 1996
In Salah Algeria 1.2 NG Processing Depleted Gas 2004 - 2011
Snohvit Norway 0.7 NG Processing Saline 2008
Gorgon Australia 4 NG Processing Saline 2016
H. Herzog, 2016
8
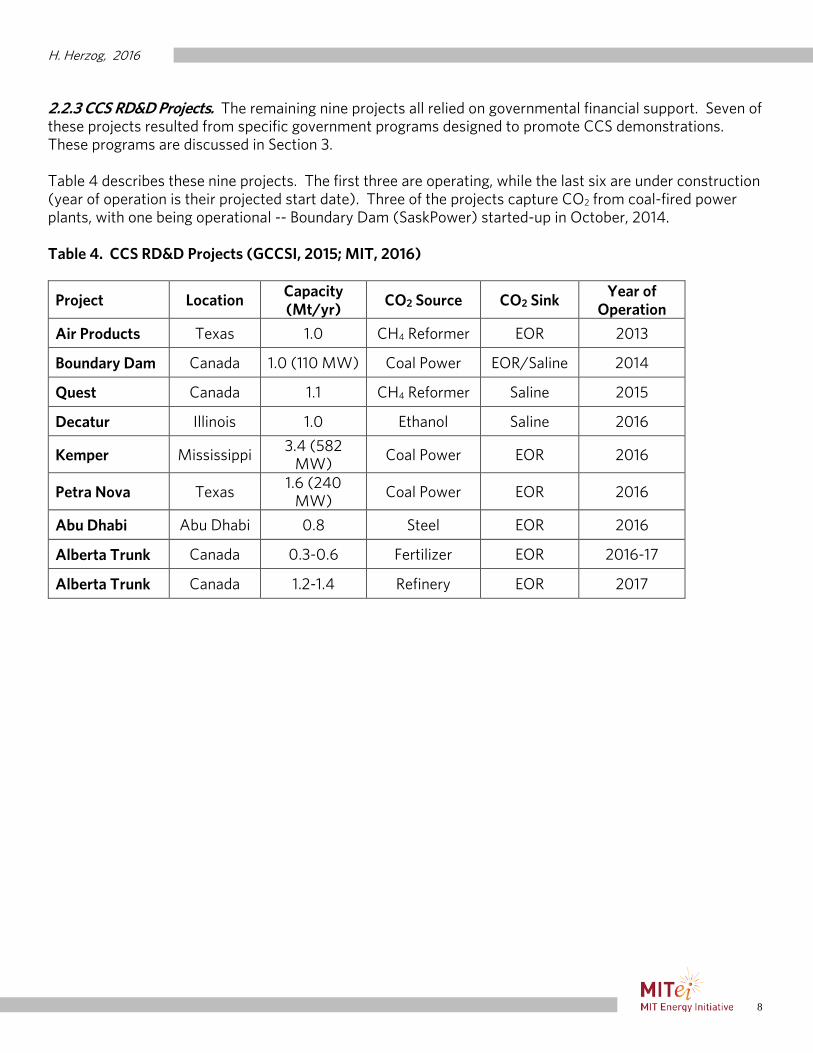
2.2.3 CCS RD&D Projects. The remaining nine projects all relied on governmental financial support. Seven of these projects resulted from specific government programs designed to promote CCS demonstrations. These programs are discussed in Section 3. Table 4 describes these nine projects. The first three are operating, while the last six are under construction (year of operation is their projected start date). Three of the projects capture CO2 from coal-fired power plants, with one being operational -- Boundary Dam (SaskPower) started-up in October, 2014. Table 4. CCS RD&D Projects (GCCSI, 2015; MIT, 2016)
Project Location Capacity (Mt/yr)
CO2 Source CO2 Sink Year of Operation
Air Products Texas 1.0 CH4 Reformer EOR 2013
Boundary Dam Canada 1.0 (110 MW) Coal Power EOR/Saline 2014
Quest Canada 1.1 CH4 Reformer Saline 2015
Decatur Illinois 1.0 Ethanol Saline 2016
Kemper Mississippi 3.4 (582
MW) Coal Power EOR 2016
Petra Nova Texas 1.6 (240
MW) Coal Power EOR 2016
Abu Dhabi Abu Dhabi 0.8 Steel EOR 2016
Alberta Trunk Canada 0.3-0.6 Fertilizer EOR 2016-17
Alberta Trunk Canada 1.2-1.4 Refinery EOR 2017
H. Herzog, 2016
9
3. Review of CCS Demonstration Programs 3.1. United States The United States officially started an R&D program in CCS in 1997 through the Department of Energy’s (DOE) Office of Fossil Energy’s Clean Coal Program. This program grew significantly over the next decade, but has plateaued in recent years. While this budget did help support pilot projects, it was not meant to support demonstration projects. The mechanism to support demonstration projects is the Clean Coal Power Initiative (CCPI), which provides direct subsidies to demonstration projects. A minimum 50% cost sharing is required by recipients. The way the CCPI works is that funds gets allocated to it through annual budgets. Once enough money is collected in the program, a request for proposals can be issued and awards can be made. Requiring funds through the annual appropriations process can be perilous. So while the funding was steady early on, no funds have been allocated to the CCPI since 2009. There have been three rounds of funding through the CCPI, as follows (NCC, 2015):
• Round 1 (2003) – focused on “advanced coal-based power generation and efficiency, environmental and economic improvements”
• Round 2 (2004) – focused on “focused on gasification, mercury (Hg) control and carbon dioxide (CO2) sequestration”
• Round 3 (2009) – focused on “CO2 capture and sequestration/beneficial reuse (CO2 EOR)” In 2009, Congressed passed the American Reinvestment and Recovery Act (ARRA), also known as the stimulus bill. Some of the stimulus funds were targeted specifically for CCS demonstration projects as follows:
• The CCPI received $850 million to help fund their Round 3 call. Awards were made to six projects.
• An Industrial CCS program was allocated $1.52 billion, part of which went to fund three industrial CCS demonstrations in 2010.
• The FutureGen project was “reconfigured” as FutureGen 2.0 and allocated $1 billion. The combination of CCPI and ARRA formed the basis of the CCS demonstration program in the US. The power projects involved are listed in Table 5, while the industrial projects can be found in Table 6.
H. Herzog, 2016
10
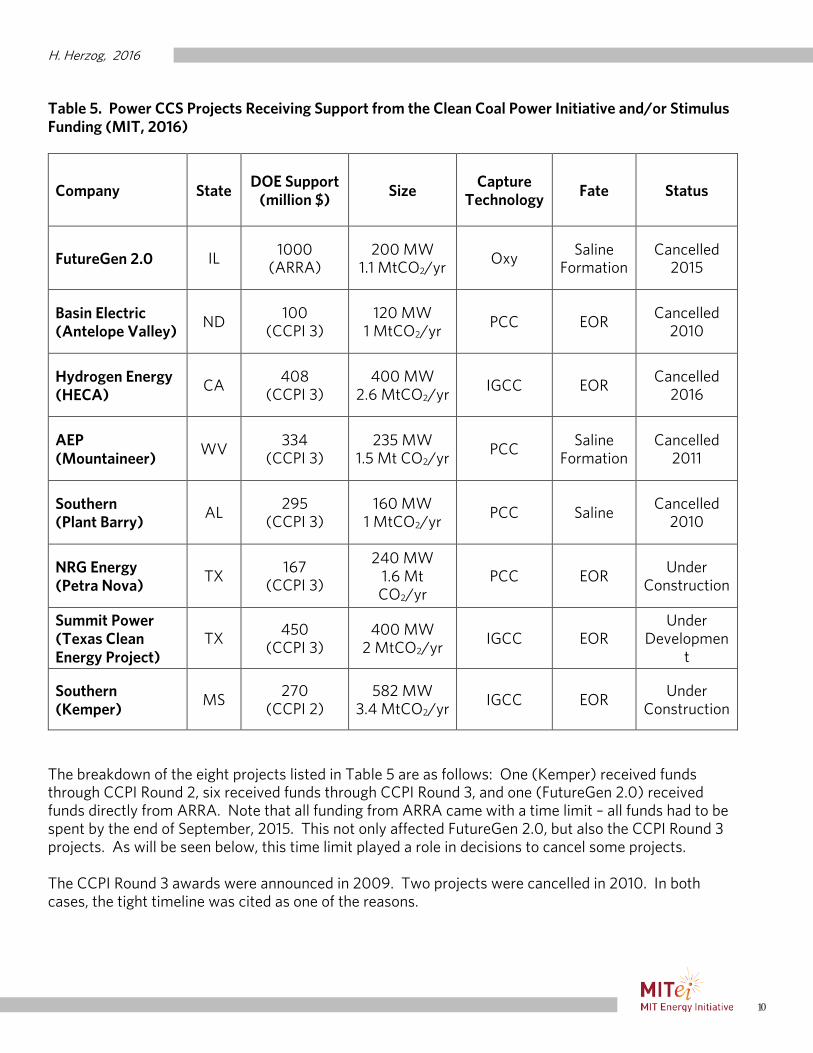
Table 5. Power CCS Projects Receiving Support from the Clean Coal Power Initiative and/or Stimulus Funding (MIT, 2016)
Company State DOE Support
(million $) Size Capture
Technology Fate Status
FutureGen 2.0 IL 1000 (ARRA)
200 MW 1.1 MtCO2/yr
Oxy Saline Formation
Cancelled 2015
Basin Electric (Antelope Valley)
ND 100
(CCPI 3) 120 MW
1 MtCO2/yr PCC EOR
Cancelled 2010
Hydrogen Energy (HECA)
CA 408
(CCPI 3) 400 MW
2.6 MtCO2/yr IGCC EOR
Cancelled 2016
AEP (Mountaineer)
WV 334
(CCPI 3) 235 MW
1.5 Mt CO2/yr PCC
Saline Formation
Cancelled 2011
Southern (Plant Barry)
AL 295
(CCPI 3) 160 MW
1 MtCO2/yr PCC Saline
Cancelled 2010
NRG Energy (Petra Nova)
TX 167
(CCPI 3)
240 MW 1.6 Mt CO2/yr
PCC EOR Under
Construction
Summit Power (Texas Clean Energy Project)
TX 450
(CCPI 3) 400 MW
2 MtCO2/yr IGCC EOR
Under Developmen
t
Southern (Kemper)
MS 270
(CCPI 2) 582 MW
3.4 MtCO2/yr IGCC EOR
Under Construction
The breakdown of the eight projects listed in Table 5 are as follows: One (Kemper) received funds through CCPI Round 2, six received funds through CCPI Round 3, and one (FutureGen 2.0) received funds directly from ARRA. Note that all funding from ARRA came with a time limit – all funds had to be spent by the end of September, 2015. This not only affected FutureGen 2.0, but also the CCPI Round 3 projects. As will be seen below, this time limit played a role in decisions to cancel some projects. The CCPI Round 3 awards were announced in 2009. Two projects were cancelled in 2010. In both cases, the tight timeline was cited as one of the reasons.
H. Herzog, 2016
11
• Plant Barry (Southern). Southern was awarded $295 million in December, 2009, and cancelled the project in February, 2010. They did proceed with their 150,000 tCO2/yr pilot plant. The overall strategy was to learn from the pilot plant before they proceeded with a commercial scale demonstration plant. However, the accelerated timeline required by the stimulus funds would have required Southern to commit to the demonstration project before the pilot plant was even built. “Because of the needed financial commitment and the tight timeline for securing funding, it was "not in our best interest to move forward" with the endeavor at the north Mobile County electric generating plant, said Pat Wylie, a spokesman for Alabama Power Co., a subsidiary of Atlanta-based Southern” (AL.com, 2010).
• Antelope Valley (Basin Electric). Basin Electric was awarded $100 million in July, 2009, and cancelled the project in December, 2010. It was planned to use the existing pipeline to the Weyburn fields to sell its CO2. “The cost and timing of a proposed carbon capture project at the coal-fired Antelope Valley Station near Beulah have caused the plant’s directors to table the project indefinitely” (Bismarck Tribune, 2010).
Another significant cancellation was AEP’s Mountaineer Project. AEP’s plan was to help finance the project through the electricity market, but cancelled the project when this approach was not approved by a jurisdictional public utility commission.
• Mountaineer (AEP). AEP was awarded $334 million in December, 2009, and cancelled the project in July, 2011. A Phase 1 pilot project of about 100,000 tCO2/yr was already active at the site. This was to be Phase 2 to scale up to 1.5 tCO2/yr (235 MWe). The financing of the project required AEP to recover costs from its ratepayers. This required approval of the Public Utility Commissions (PUCs) of both Virginia and West Virginia. “Company officials … said they were dropping the larger, $668 million project because they did not believe state regulators would let the company recover its costs by charging customers, thus leaving it no compelling regulatory or business reason to continue the program” (NY Times, 2011). One reason the PUCs did not grant approval was lack of a national climate policy. "So far, [regulators] have not been willing to support cost recovery for CCS ahead of a federal mandate to cut carbon emissions from power plants," said Melissa McHenry, an AEP spokesperson (Gallucci, 2011).
Of the remaining five projects, two are under construction (Petra Nova and Kemper), two have been cancelled (FutureGen 2.0 and Hydrogen Energy), and one is still under development (Summit Power). Summit Power’s Texas Clean Energy Project (TCEP) is nearing a go/no go decision. Hydrogen Energy was officially cancelled in March, 2016 (Examiner.com, 2016). FutureGen 2.0 was effectively cancelled in February 2015 by the US DOE when it became clear that they could not meet the September 2015 deadline and that Congress would not grant an extension. The official cancellation announcement was issued in January, 2016 (Marshall, 2016a). More details on these 5 projects are contained in Section 4.
H. Herzog, 2016
12
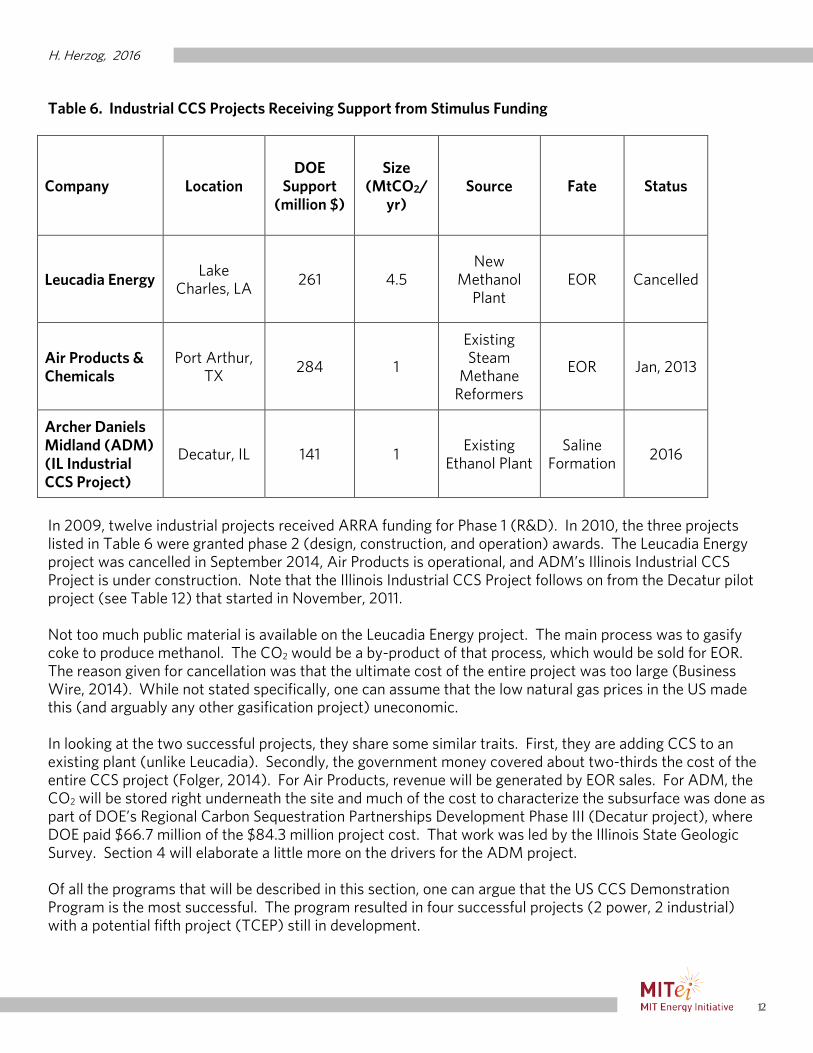
Table 6. Industrial CCS Projects Receiving Support from Stimulus Funding
Company Location DOE
Support (million $)
Size (MtCO2/
yr) Source Fate Status
Leucadia Energy Lake
Charles, LA 261 4.5
New Methanol
Plant EOR Cancelled
Air Products & Chemicals
Port Arthur, TX
284 1
Existing Steam
Methane Reformers
EOR Jan, 2013
Archer Daniels Midland (ADM) (IL Industrial CCS Project)
Decatur, IL 141 1 Existing
Ethanol Plant Saline
Formation 2016
In 2009, twelve industrial projects received ARRA funding for Phase 1 (R&D). In 2010, the three projects listed in Table 6 were granted phase 2 (design, construction, and operation) awards. The Leucadia Energy project was cancelled in September 2014, Air Products is operational, and ADM’s Illinois Industrial CCS Project is under construction. Note that the Illinois Industrial CCS Project follows on from the Decatur pilot project (see Table 12) that started in November, 2011. Not too much public material is available on the Leucadia Energy project. The main process was to gasify coke to produce methanol. The CO2 would be a by-product of that process, which would be sold for EOR. The reason given for cancellation was that the ultimate cost of the entire project was too large (Business Wire, 2014). While not stated specifically, one can assume that the low natural gas prices in the US made this (and arguably any other gasification project) uneconomic. In looking at the two successful projects, they share some similar traits. First, they are adding CCS to an existing plant (unlike Leucadia). Secondly, the government money covered about two-thirds the cost of the entire CCS project (Folger, 2014). For Air Products, revenue will be generated by EOR sales. For ADM, the CO2 will be stored right underneath the site and much of the cost to characterize the subsurface was done as part of DOE’s Regional Carbon Sequestration Partnerships Development Phase III (Decatur project), where DOE paid $66.7 million of the $84.3 million project cost. That work was led by the Illinois State Geologic Survey. Section 4 will elaborate a little more on the drivers for the ADM project. Of all the programs that will be described in this section, one can argue that the US CCS Demonstration Program is the most successful. The program resulted in four successful projects (2 power, 2 industrial) with a potential fifth project (TCEP) still in development.
H. Herzog, 2016
13
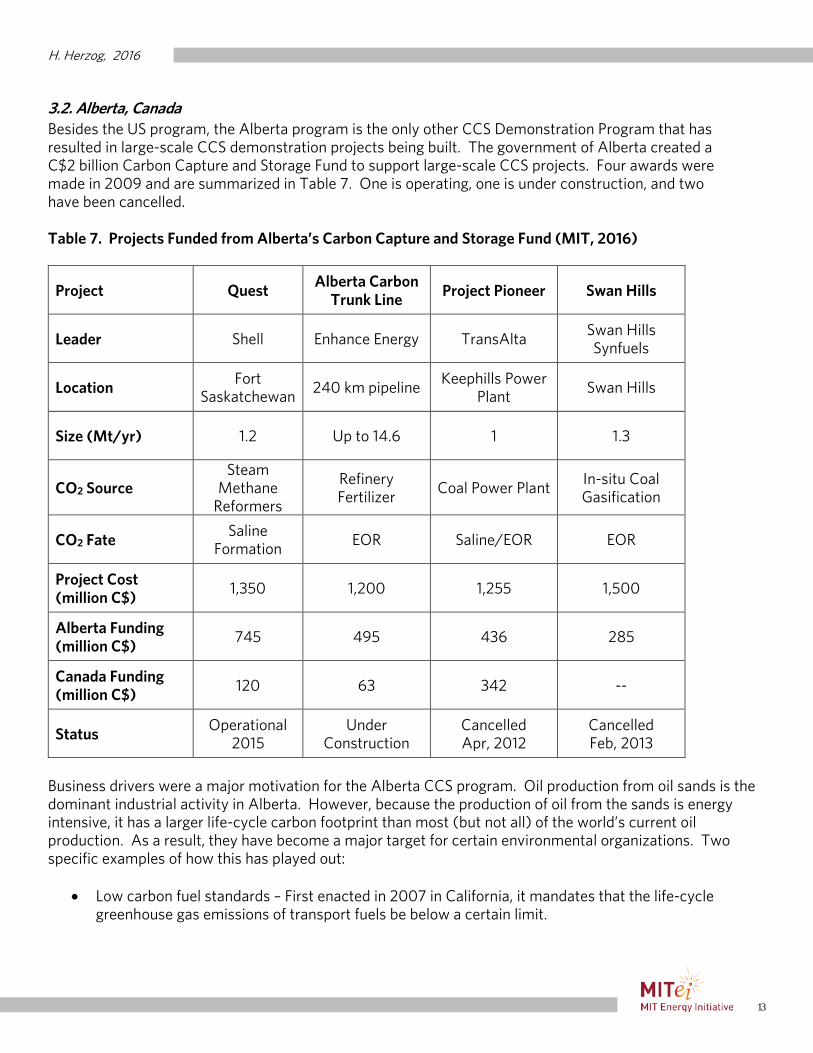
3.2. Alberta, Canada Besides the US program, the Alberta program is the only other CCS Demonstration Program that has resulted in large-scale CCS demonstration projects being built. The government of Alberta created a C$2 billion Carbon Capture and Storage Fund to support large-scale CCS projects. Four awards were made in 2009 and are summarized in Table 7. One is operating, one is under construction, and two have been cancelled. Table 7. Projects Funded from Alberta’s Carbon Capture and Storage Fund (MIT, 2016)
Project Quest Alberta Carbon
Trunk Line Project Pioneer Swan Hills
Leader Shell Enhance Energy TransAlta Swan Hills Synfuels
Location Fort
Saskatchewan 240 km pipeline
Keephills Power Plant
Swan Hills
Size (Mt/yr) 1.2 Up to 14.6 1 1.3
CO2 Source Steam
Methane Reformers
Refinery Fertilizer
Coal Power Plant In-situ Coal Gasification
CO2 Fate Saline
Formation EOR Saline/EOR EOR
Project Cost (million C$)
1,350 1,200 1,255 1,500
Alberta Funding (million C$)
745 495 436 285
Canada Funding (million C$)
120 63 342 --
Status Operational
2015 Under
Construction Cancelled Apr, 2012
Cancelled Feb, 2013
Business drivers were a major motivation for the Alberta CCS program. Oil production from oil sands is the dominant industrial activity in Alberta. However, because the production of oil from the sands is energy intensive, it has a larger life-cycle carbon footprint than most (but not all) of the world’s current oil production. As a result, they have become a major target for certain environmental organizations. Two specific examples of how this has played out:
• Low carbon fuel standards – First enacted in 2007 in California, it mandates that the life-cycle greenhouse gas emissions of transport fuels be below a certain limit.
H. Herzog, 2016
14
• The Keystone pipeline – The project was to bring oil from Alberta to US Gulf Coast refineries, but was blocked by the Obama administration under great pressure from environmental groups.
One strategy to lower the carbon footprint of the oil sands is through the use of CCS. Alberta took several steps to implement such a strategy, including establishing the Carbon Capture and Storage Fund and enacting a $15/tCO2 carbon levy on large emitters, with the proceeds going a technology fund.4 Additional information on the four projects receiving money from the Carbon Capture and Storage Fund follow:
• Quest. Arguably the best CCS Demonstration Project in being on-time and under budget. Reasons for success include: (1) A high amount of direct government funding as a percentage of projected project cost (64%), (2) Receiving two-for-one carbon credits (credits currently $15/tCO2, rising to $30/tCO2 by 2017) for a ten year period, (3) “Support from the local community was essential to building Quest. Shell initiated public consultation in 2008, two years before submitting a regulatory application” (Shell.com, 2015), (4) CCS is an important part of Shell’s business strategy to reconcile fossil fuel use and climate change. “Shell proceeded with a final investment decision on the Quest project in the oil sands on a zero net-present-value basis (a decision few other companies could or would be willing to carry on their balance sheet).” (Reiner, 2016).
• Alberta Carbon Trunk Line. The government subsidy covered 47% of the projected costs. Other stated reasons for moving project forward were “the benefits of royalties, taxes, job creation and a lasting CCS infrastructure will significantly outweigh all project costs”.
• Project pioneer. Here the government funding covered 62% of the projected costs. Don Wharton, vice-president of policy and sustainability at TransAlta said “Our decision was essentially based on the fact that we could not see a way to make the economics of our CCS project work as we originally intended.” This reinforces the fact that applying CCS at power plants is much more difficult than certain industrial applications.
• Swan Hills. The government funding covered only 19% of projected costs. The official reason for cancellation was given as low natural gas prices. As was the case with Leucadia Energy in the US, gasification projects appear to be a non-starter with today’s low natural gas prices. Adding to the problem, in-situ (or underground) coal gasification is a commercially unproven technology.
3.3. United Kingdom (UK) In November, 2007, the UK government announced a £1 billion competition to support the design, construction and operation of commercial scale CCS projects. The competition was limited to coal-fired
4 From http://www.greenenergyfutures.ca/blog/what-alberta-doing-its-carbon-tax-money, Jan 31, 2014: Back in 2007 in an effort to get out in front of the issue Alberta passed a law requiring large emitters of greenhouse gases (100,000 tonnes of GHGs a year or more) to scale back the intensity of their emissions by 12 per cent below an agreed upon baseline. The emitters were then required to pay a $15 so-called carbon levy on any emissions over their targets. Since 2009, $380 million has been collected with $212 million of it being invested so far. Of the money that’s been spent $98 million has been invested in renewables, $38.7 million in energy efficiency with the rest going to greening fossil fuel production and carbon capture and storage.
H. Herzog, 2016
15
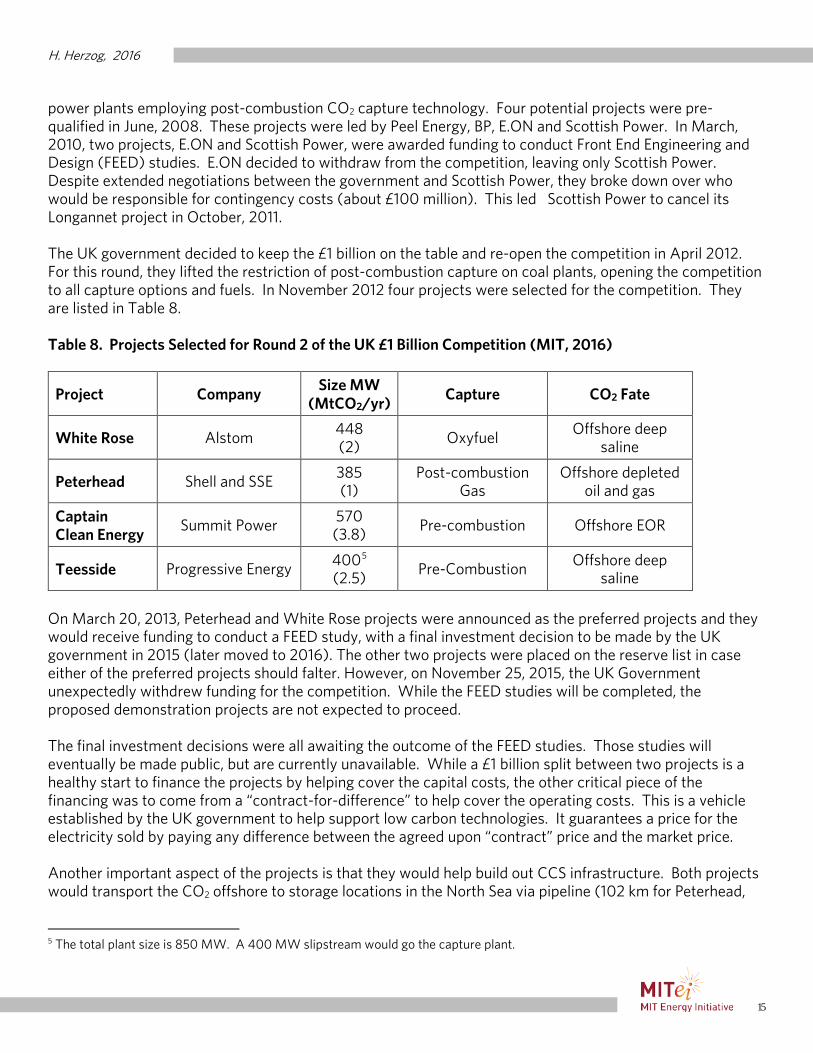
power plants employing post-combustion CO2 capture technology. Four potential projects were pre-qualified in June, 2008. These projects were led by Peel Energy, BP, E.ON and Scottish Power. In March, 2010, two projects, E.ON and Scottish Power, were awarded funding to conduct Front End Engineering and Design (FEED) studies. E.ON decided to withdraw from the competition, leaving only Scottish Power. Despite extended negotiations between the government and Scottish Power, they broke down over who would be responsible for contingency costs (about £100 million). This led Scottish Power to cancel its Longannet project in October, 2011. The UK government decided to keep the £1 billion on the table and re-open the competition in April 2012. For this round, they lifted the restriction of post-combustion capture on coal plants, opening the competition to all capture options and fuels. In November 2012 four projects were selected for the competition. They are listed in Table 8. Table 8. Projects Selected for Round 2 of the UK £1 Billion Competition (MIT, 2016)
Project Company Size MW
(MtCO2/yr) Capture CO2 Fate
White Rose Alstom 448 (2)
Oxyfuel Offshore deep
saline
Peterhead Shell and SSE 385 (1)
Post-combustion Gas
Offshore depleted oil and gas
Captain Clean Energy
Summit Power 570 (3.8)
Pre-combustion Offshore EOR
Teesside Progressive Energy 4005 (2.5)
Pre-Combustion Offshore deep saline
On March 20, 2013, Peterhead and White Rose projects were announced as the preferred projects and they would receive funding to conduct a FEED study, with a final investment decision to be made by the UK government in 2015 (later moved to 2016). The other two projects were placed on the reserve list in case either of the preferred projects should falter. However, on November 25, 2015, the UK Government unexpectedly withdrew funding for the competition. While the FEED studies will be completed, the proposed demonstration projects are not expected to proceed. The final investment decisions were all awaiting the outcome of the FEED studies. Those studies will eventually be made public, but are currently unavailable. While a £1 billion split between two projects is a healthy start to finance the projects by helping cover the capital costs, the other critical piece of the financing was to come from a “contract-for-difference” to help cover the operating costs. This is a vehicle established by the UK government to help support low carbon technologies. It guarantees a price for the electricity sold by paying any difference between the agreed upon “contract” price and the market price. Another important aspect of the projects is that they would help build out CCS infrastructure. Both projects would transport the CO2 offshore to storage locations in the North Sea via pipeline (102 km for Peterhead,
5 The total plant size is 850 MW. A 400 MW slipstream would go the capture plant.
H. Herzog, 2016
16
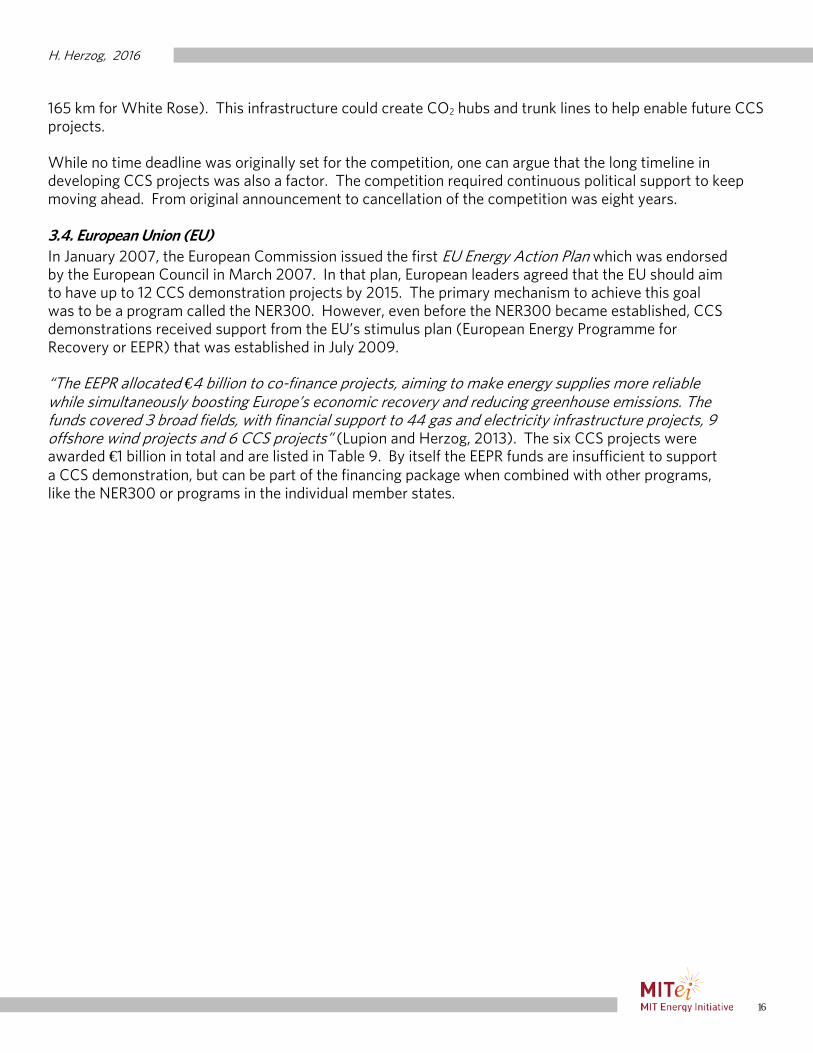
165 km for White Rose). This infrastructure could create CO2 hubs and trunk lines to help enable future CCS projects. While no time deadline was originally set for the competition, one can argue that the long timeline in developing CCS projects was also a factor. The competition required continuous political support to keep moving ahead. From original announcement to cancellation of the competition was eight years. 3.4. European Union (EU) In January 2007, the European Commission issued the first EU Energy Action Plan which was endorsed by the European Council in March 2007. In that plan, European leaders agreed that the EU should aim to have up to 12 CCS demonstration projects by 2015. The primary mechanism to achieve this goal was to be a program called the NER300. However, even before the NER300 became established, CCS demonstrations received support from the EU’s stimulus plan (European Energy Programme for Recovery or EEPR) that was established in July 2009. “The EEPR allocated €4 billion to co-finance projects, aiming to make energy supplies more reliable while simultaneously boosting Europe’s economic recovery and reducing greenhouse emissions. The funds covered 3 broad fields, with financial support to 44 gas and electricity infrastructure projects, 9 offshore wind projects and 6 CCS projects” (Lupion and Herzog, 2013). The six CCS projects were awarded €1 billion in total and are listed in Table 9. By itself the EEPR funds are insufficient to support a CCS demonstration, but can be part of the financing package when combined with other programs, like the NER300 or programs in the individual member states.
H. Herzog, 2016
17
Table 9. The six CCS Demonstration Projects receiving funding from the EEPR (Lupion and Herzog, 2013; MIT, 2016).
Company Location EU
Contribution (million €)
Size Technology Fate
Vattenfall Jänschwalde
Germany 180 385 MW
2.7 MtCO2/yr Oxy EGR
E.ON Rotterdam
Netherlands 180
250 MW 1.43 MtCO2/yr
PCC EGR
PGE & Alstom
Belchatow Poland
180 250 MW
0.1 MtCO2/yr PCC
Saline Formation
ENDESA Compostilla
Spain 180
30-320 MW 1 MtCO2/yr
Oxy Saline
Formation
Powerfuel Hatfield
UK 180
900 MW 4.5 MtCO2/yr
IGCC EOR
Enel Porto Tolle
Italy 100
250 MW 1 MtCO2/yr
PCC Saline
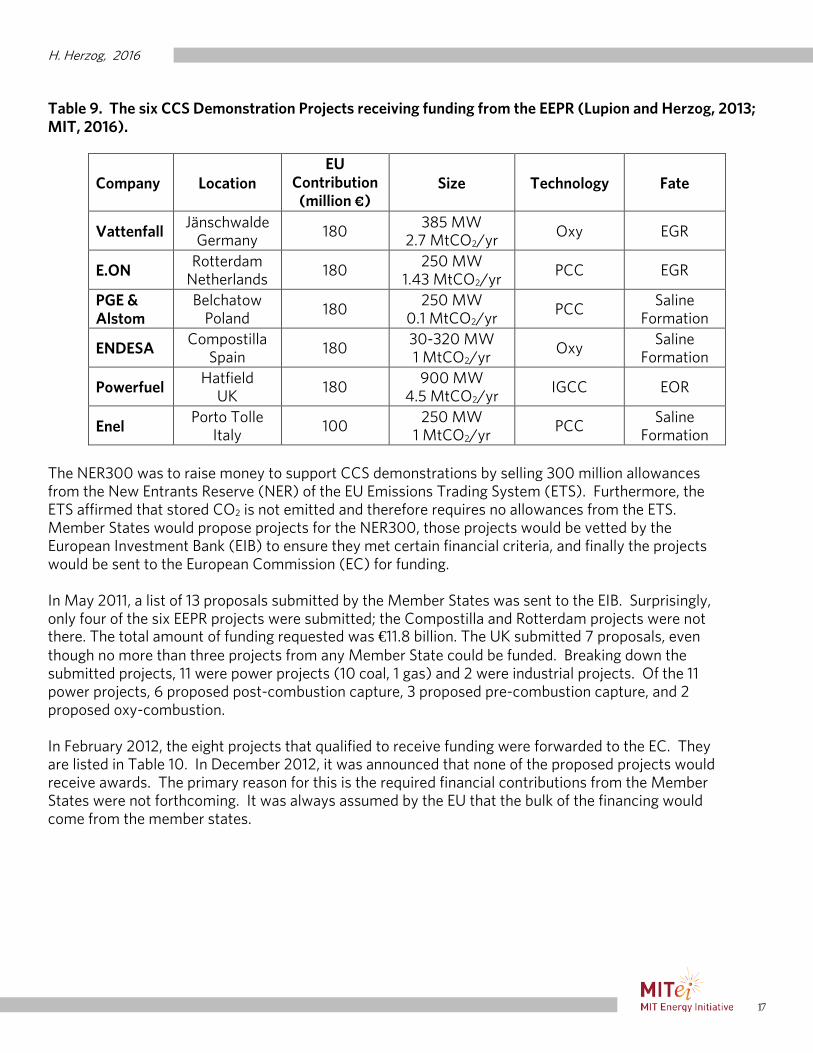
Formation The NER300 was to raise money to support CCS demonstrations by selling 300 million allowances from the New Entrants Reserve (NER) of the EU Emissions Trading System (ETS). Furthermore, the ETS affirmed that stored CO2 is not emitted and therefore requires no allowances from the ETS. Member States would propose projects for the NER300, those projects would be vetted by the European Investment Bank (EIB) to ensure they met certain financial criteria, and finally the projects would be sent to the European Commission (EC) for funding. In May 2011, a list of 13 proposals submitted by the Member States was sent to the EIB. Surprisingly, only four of the six EEPR projects were submitted; the Compostilla and Rotterdam projects were not there. The total amount of funding requested was €11.8 billion. The UK submitted 7 proposals, even though no more than three projects from any Member State could be funded. Breaking down the submitted projects, 11 were power projects (10 coal, 1 gas) and 2 were industrial projects. Of the 11 power projects, 6 proposed post-combustion capture, 3 proposed pre-combustion capture, and 2 proposed oxy-combustion. In February 2012, the eight projects that qualified to receive funding were forwarded to the EC. They are listed in Table 10. In December 2012, it was announced that none of the proposed projects would receive awards. The primary reason for this is the required financial contributions from the Member States were not forthcoming. It was always assumed by the EU that the bulk of the financing would come from the member states.
H. Herzog, 2016
18
Table 10. The eight CCS Demonstration Projects qualifying for Round 1 of the NER300 (Lupion and Herzog, 2013; MIT, 2016).
Candidates Developer Size Feedstock Technology
Don Valley UK
2Co Energy 920 MW Coal Pre-combustion
Belchatow Poland
PGE 260 MW Coal Post-combustion
Green Hydrogen Netherlands
Air Liquide 0.55 Mt/Yr Industrial H2 Production
Teesside UK
Progressive Energy
400 MW Coal Pre-combustion
White Rose UK
Alstom 426 MW Coal Oxy-combustion
Killingholme UK
C.GEN NV 430 MW Coal Pre-combustion
Porto Tolle Italy
ENEL 250 MW Coal Post-combustion
ULCOS France
ArcelorMittal 0.7 Mt/ Yr Industrial Steel Production
In April, 2013, Round 2 of the NER300 opened and only the White Rose project (see Table 8) qualified. With demise of UK Competition, the White Rose project will not proceed. So the net result of the NER300 and the EEPR is not the twelve projects the Europeans pronounced in 2007, but no projects at all. Given the scope of projected funding and the anticipated participation of so many countries, the failure of the NER300 program can be judged the most disappointing of the CCS demonstration programs. So what happened? There are a myriad of reasons for failure, as discussed in length in Lupion and Herzog (2013). Some key points are summarized below. A big issue was financial. Basically, there was not enough money made available to help fund the projects. The biggest component of this was the price of a permit in the ETS. When the program was put in place, it was anticipated permit prices would be at least €20 and probably much higher. However, prices plummeted to less than €5. The lower than anticipated prices had a double impact; not only was significantly less money available to finance projects, but the operating savings from not needing to purchase permits also shrunk dramatically. Add on top of this the dividing of the pie to help finance renewable energy projects under the NER300, one can only conclude that the NER300 was woefully underfunded. The funding from the NER300 was supposed to be supplemented with additional funds from the member states. However, the member states did not step up. One reason was the weak economies during this time period. Also, many countries in the EU did not prioritize climate action as a budget priority. In the UK, where the government was willing to make a significant financial contribution, there
H. Herzog, 2016
19
was no alignment between the UK government and the EU on the criteria for ranking the projects. As a result, the number one ranked project in the NER300, Dom Valley, did not even qualify for the UK competition. Many member states were ambivalent about CCS. Germany is a good example. Vattenfall spent $100 million of their own money to build the Schwarze Pumpe pilot plant to capture CO2 via oxy-combustion. They wanted to implement this technology at commercial scale at their Jänschwalde power plant and received EEPR funding. However, they needed the German government to transpose6 the European CCS Directive to allow underground storage of CO2. The German Bundesrat refused, essentially killing any CCS demonstration projects in Germany (see Section 4.2.5). It should be noted that unlike North America, where a majority of the successful projects tapped into EOR markets, that option is very limited in Europe. Therefore, it is expected that direct government support of CCS demonstration projects has to be a major part of a financial package. Another problem with the EEPR and the NER300 was the lack of flexibility. Program parameters did not recognize the cost and complexity of CCS projects. The strict timetable is one example. They were fine for the relatively smaller and straightforward renewable energy projects, but unrealistic for the larger and more complex CCS projects. Once in place, these timelines could not be revised. Another example is when a project like Jänschwalde was cancelled, the EEPR funds could not be reallocated to another project, but instead reverted back to the EC. Finally, the whole EU program brings up the issue of the relationship between CCS and renewables. The NER300 was originally designed for CCS, but renewables were eventually included. This shows the power of the constituencies for renewables and the relative weakness of constituencies for CCS. 3.5. Norway Norway has a long history with CCS demonstration projects. It is home to two of the pioneer CCS demonstration projects, Sleipner and Snohvit. CCS is a natural result for a country that is heavily dependent on the oil and gas industry, but also wants to be a leader in addressing climate change. This later desire can be traced to Gro Harlem Brundtland, who was Prime Minister of Norway for part of 1981, May 1986 to October 1989, and November 1990 to October 1996. “In 1983, Brundtland was invited … to establish and chair the World Commission on Environment and Development, widely referred to as the Brundtland Commission. She developed the broad political concept of sustainable development in the course of extensive public hearings, that were distinguished by their inclusiveness. The commission, which published its report, Our Common Future, in April 1987, provided the momentum for the 1992 Earth Summit” Wikipedia (2016). A major outcome of the Earth Summit was the UN Framework Convention on Climate Change. A major challenge for CCS in Norway is the scarcity of appropriate CO2 sources. The power sector is almost carbon-free, due to an abundance of hydroelectric power. When it was proposed to build a natural gas power plant at Kårstø, it turned into a major political battle (Quiviger, 2001). Should the plant be required to have CCS? Should the plant be delayed until CCS was more mature? Should the plant be built without CCS, but retrofitted at some future time? After many years of political battles, including the bringing down of a
6 Countries transpose directives from the EU by turning them into law at the national level.
H. Herzog, 2016
20
government, the later path was chosen. In 2007, the Kårstø plant went on-line with 420 MWe of gas-fired power. Though the original idea was to eventually retrofit the plant with CCS, today it is not considered a viable candidate for CCS. In 2006, a gas turbine combined heat and power plant (CHP) was built at the Mongstad refinery. As a condition to obtain the CO2 emissions permit, Statoil and the government agreed to pursue CCS at Mongstad. The first stage of this agreement was to build a pilot plant called Technology Centre Mongstad (TCM). TCM was to the test various capture technologies to eventually be used in a second phase, full-scale CCS at Mongstad. CO2 would be captured from both the CHP plant’s gas turbines and the refinery’s Cat Cracker. In 2013, it was decided to discontinue work on phase 2 because of doubts related to the future viability of the Mongstad refinery (i.e., there was talk about closing the refinery) (Gassnova, 2015). However pilot plant operations at TCM continue to this day. The Norwegian government has the goal to “realize at least one full-scale CCS demonstration facility by 2020”. Gassnova, in cooperation with Gassco and the Norwegian Petroleum Directorate (NPD), completed a pre-feasibility study on potential full-scale CCS projects in Norway in May, 2015. “The target segment for potential CO2 capture sites was mainly existing land-based emissions sources with emissions above 400,000 tons of CO2 per year”. A summary of the most important findings and recommendations were made public, but the full report was not because it contained sensitive business information (Gassnova, 2015). The report recommended three possible CCS demonstration options, one at a cement plant, one at an ammonia plant, and one at a waste-to-energy facility. Below are the descriptions quoted from the summary report. Norcem Brevik. In the mapping from 2012, Norcem considered itself relevant for further CO2 capture studies. Norcem has also provided input to the pre-feasibility study. The CO2 concentration in the flue gas emissions from cement production is high (16-19 percent), and there is residual heat for CO2 capture. According to Gassnova, the cement industry needs more information on the potential for CCS. At the pilot facility in Brevik, Norcem has tested several different capture technologies with public support from the research and development programme Climit. Yara Porsgrunn. In connection with the mapping from 2012, Yara considered the ammonia plant in Porsgrunn as relevant for further CO2 capture studies. Yara has provided input to the pre-feasibility study. Yara has total emissions of approximately 1.1 million tons of CO2 a year at full production, some of this is sold to the food industry. Klemetsrud. Gassnova has also been in touch with the Waste-to-Energy Agency of Oslo, which is considering CO2 capture from the waste incineration facility at Klemetsrud. Gassnova indicates that it may be realistic to capture approximately 400,000 tons of CO2 per year. Klemetsrud may be a relevant facility for CO2 capture, which could potentially be combined with other capture projects. Further studies are required before concluding on the viability of the Klemetsrud plant for CCS and Gassnova will continue its dialogue with Oslo municipality on the issue. While no details on how these projects will be financed, the government of Norway has shown willingness in the past to be very generous with direct subsidies. The government funded pilot project at TCM turned out
H. Herzog, 2016
21
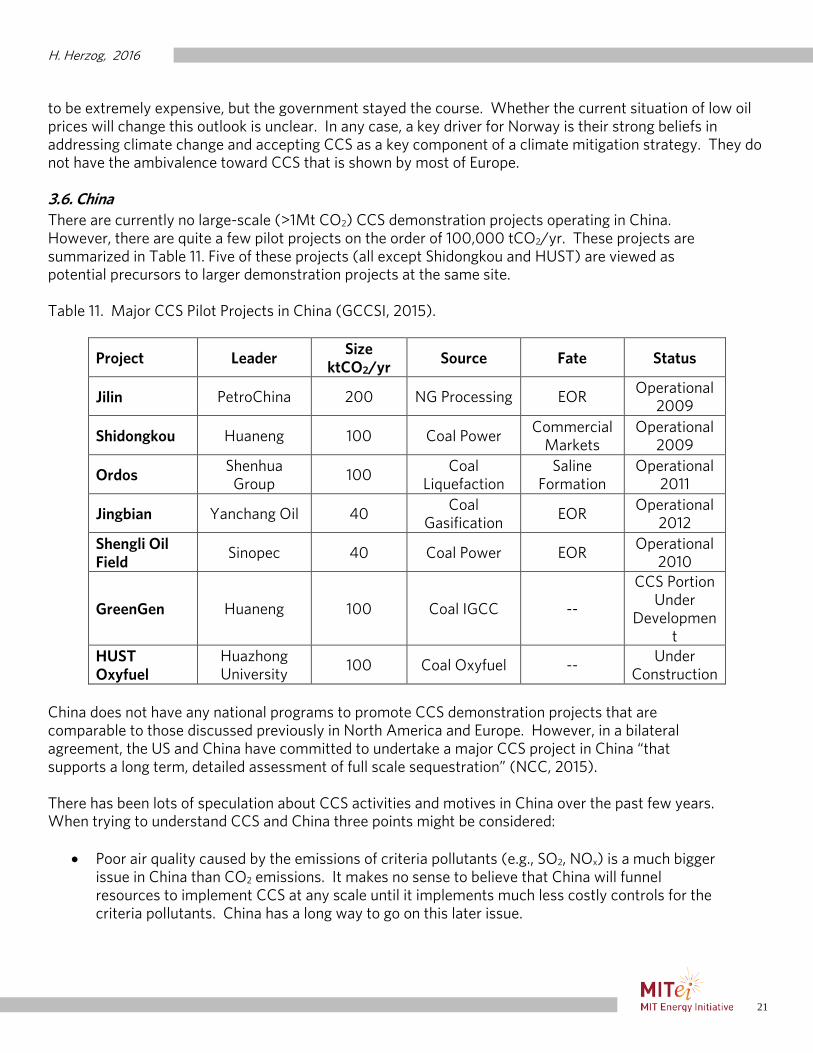
to be extremely expensive, but the government stayed the course. Whether the current situation of low oil prices will change this outlook is unclear. In any case, a key driver for Norway is their strong beliefs in addressing climate change and accepting CCS as a key component of a climate mitigation strategy. They do not have the ambivalence toward CCS that is shown by most of Europe. 3.6. China There are currently no large-scale (>1Mt CO2) CCS demonstration projects operating in China. However, there are quite a few pilot projects on the order of 100,000 tCO2/yr. These projects are summarized in Table 11. Five of these projects (all except Shidongkou and HUST) are viewed as potential precursors to larger demonstration projects at the same site. Table 11. Major CCS Pilot Projects in China (GCCSI, 2015).
Project Leader Size
ktCO2/yr Source Fate Status
Jilin PetroChina 200 NG Processing EOR Operational
2009
Shidongkou Huaneng 100 Coal Power Commercial
Markets Operational
2009
Ordos Shenhua
Group 100
Coal Liquefaction
Saline Formation
Operational 2011
Jingbian Yanchang Oil 40 Coal
Gasification EOR
Operational 2012
Shengli Oil Field
Sinopec 40 Coal Power EOR Operational
2010
GreenGen Huaneng 100 Coal IGCC --
CCS Portion Under
Development
HUST Oxyfuel
Huazhong University
100 Coal Oxyfuel -- Under
Construction China does not have any national programs to promote CCS demonstration projects that are comparable to those discussed previously in North America and Europe. However, in a bilateral agreement, the US and China have committed to undertake a major CCS project in China “that supports a long term, detailed assessment of full scale sequestration” (NCC, 2015). There has been lots of speculation about CCS activities and motives in China over the past few years. When trying to understand CCS and China three points might be considered:
• Poor air quality caused by the emissions of criteria pollutants (e.g., SO2, NOx) is a much bigger issue in China than CO2 emissions. It makes no sense to believe that China will funnel resources to implement CCS at any scale until it implements much less costly controls for the criteria pollutants. China has a long way to go on this later issue.
H. Herzog, 2016
22
• Initially, a big motivation for China to develop and implement CCS technology was to become a low cost supplier to the world, similar to what they have become in supplying solar panels. With expectations for the worldwide demand of CCS much diminished compared to a decade ago, one would expect CCS activity in China to be more restrained.
• An area of interest today for CCS in China is a source of CO2 for EOR. Due to cost considerations, the source of the CO2 is more likely to be coal-to-liquids or coal-to-gas plants rather than coal-fired power plants.
In summary, there are two areas where business drivers in China are aligned with CCS, (1) being a supplier to the world and (2) providing CO2 for EOR. Today, the later reason is the primary motivator. The idea of large-scale CCS implementation in China for the primary purpose of reducing CO2 emissions may be decades away. 3.7. Australia In the early 2000s, Australia was an international leader in CCS. However, more recently, Australia has cut back on its activities. This is due in large part to the Abbott government, which came into power in September 2013 and has not been supportive to actions addressing climate change. The most visible example is the repeal of the Australian carbon tax (A$23/tCO2). The only commercial scale CCS project in Australia is the Gorgon project, a pioneer CCS project that is scheduled to start up in 2016 (see Table 3). Another notable project was ZeroGen, which was initiated in 2003 and cancelled in 2010. An analysis of ZeroGen is contained in Section 4. Additionally, two major pilot projects were carried out (MIT, 2016):
• Otway started in 2008 and studied injection of CO2. The tests concluded in December 2011 with a total of 65,000 tCO2 injected. The source of CO2 was from natural gas processing. The project is now in phase 2, which is monitoring and studying the CO2 storage.
• Callide Oxyfuel is a 30 MWe capture pilot in Queensland which was conceived in 2003, started operation in 2012 and closed in 2015.
A Low Emissions Technology Demonstration Fund (LETDF) was set up, but only issued one round of funding in 2006 (Zeroco2.no, 2016). Gorgon got A$60 million and Callide got A$50 million. In 2009, The Global Carbon Capture and Storage Institute (GCCSI) was established to help support CCS demonstrations worldwide. It had an A$100 million annual budget. By 2011, the Australian government began cutting the GCCSI budget and eventually eliminated its government support. The GCCSI has continued as a private organization. Two projects are active in a planning stage. Both are aimed at developing CO2 hubs, Carbon Net in Victoria and South West Hub in Western Australia. Neither is near the point where they can make a final investment decision. 3.8. Japan Japan was an early leader in CCS R&D. In 1990, it established a research institute, RITE, to focus on CCS technologies. Because Japan has few geologic storage resources, but does have access to deep water, a
H. Herzog, 2016
23
major focus of the Japanese program was storage of CO2 in the deep ocean. Deep ocean storage started becoming problematic in the 2000s because it was concluded that the storage was not permanent and because of lack of international acceptance of this storage option. There are no large-scale CCS demonstration projects in Japan. Two pilot projects are worth mentioning (GCCSI, 2015):
• Tomakomai will capture CO2 from hydrogen production for injection into two saline formations. Size is 100,000 MtCO2/yr and injection is scheduled to start in 2016.
• Osaki CoolGen is planned to capture CO2 from a 166 MW oxygen-blown IGCC power plant under construction in Osaka.
3.9. South Korea “The South Korean Government is currently revising its CCS Master Plan, which includes a large-scale CCS demonstration project operating within certain cost parameters by 2020, and commercial CCS deployment thereafter. The Government’s policy includes support for a number of testing and pilot plants involving a wide variety of agencies and technology providers in the power generation and steel making industry. This includes the Korea Electric Power Corporation (KEPCO) testing of post combustion capture technologies at its Boryeong and Hadong Power Stations. Both projects were increased in scale in 2013 to test the capture of CO2 from flue gas at 10 MW generation units” (GCCSI, 2015).
H. Herzog, 2016
24
4. Analysis of Selected CCS Projects This section will look at some selected CCS demonstration projects in more depth to try and better understand the motivation and financing for a project. A key determination for selection of projects for this section was whether sufficient information was available in the open literature. Also included are projects that contribute important messages for lessons learned, even if specific data is fairly sparse. In section 4.1, projects that received a positive financial decision (i.e., are in operation or under construction) are analyzed. Section 4.2 examines projects that did not receive a positive financial decision, most of which have been cancelled, but a couple are still under development. Section 4.3 discussed projects at the pilot scale. 4.1. Demonstration Projects with a Positive Financial Decision This section examines:
• The pioneer CCS projects (see Section 2.2.2) • The three CCS projects at a power plant, Boundary Dam, Kemper, and Petra Nova • The Decatur project
4.1.1. Pioneer Projects. Clark (2015) did an analysis of the Gorgon project. This section will start with that analysis, as much of it applies to all the pioneer projects. From Clark (2015): The changes in climate legislation [in Australia] had seemingly no impact on Gorgon, as preparations for CCS at Gorgon have been in progress for over two decades. Instead of a carbon tax, what drove the use of CCS was the fact that a collaborative decision was made by Chevron and the government of Australia to develop resources at Gorgon using CCS7. Specific project costs for Gorgon are difficult to locate, but two reasons can be documented that explain how the economics worked out at Gorgon:
1. The cost to add CCS was a relatively small fraction of total costs (compared to power plant projects)
2. There are high market prices for the LNG product8 Costs of CCS for the Gorgon project were less than 10% of the total capital costs (“Discussions with Chevron Representatives,” 2014). In essence, the inclusion of CCS into the Gorgon project was part of the cost of doing business. While no law or regulation required CCS at Gorgon, there was still a general concern about greenhouse gas emissions, especially a single source that would emit over 3 MtCO2/yr. While adding to the project costs, the determination was made that the costs were relatively small and acceptable. One can assume that a benefit
7 International Energy Agency. (2013). Global Action to Advance Carbon Capture and Storage. Annex to Tracking Clean Energy Progress 2013. Retrieved from http://www.chevronaustralia.com/docs/default-source/default-document-library/rev_o_ch13_23aug05.pdf?sfvrsn=0 8 In 2012, LNG was selling for almost $17/MMBtu. However, LNG prices in Asia are linked to the world oil price, which has dropped significantly since 2012. Therefore, this statement is no longer accurate for the current markets.
H. Herzog, 2016
25
to voluntarily agreeing to limit greenhouse gas emissions is that the project approval and permitting process would proceed much more smoothly. The Sleipner and Snohvit projects had similar motivations. While there was a carbon tax for offshore operations in Norway (approximately $50/tCO2 when Sleipner was built), the primary decision was as a result of discussions between the government and Statoil9. As discussed in section 3.5, Norway had a strong commitment to climate change mitigation. These projects would showcase its commitment to the world. BP’s In-Salah project fit in very well with BP’s overall strategy at the time it was built. BP had a marketing campaign with the theme “Beyond Petroleum”. Basically, BP was trying to market itself as a green company, and CCS was a tactic in that strategy. At about the same time as In-Salah, BP organized and led the CO2 Capture Project10, a consortium of petroleum companies. It also followed up In-Salah by announcing a set of three CCS demonstration projects focused on “decarbonized fuel” (see Section 4.2.4). In summary, the four pioneer projects shared the following characteristics, which helped drive the projects:
• The cost of adding CCS was a small percentage (roughly 10%) of overall project costs. • The project could afford to absorb those costs and still be profitable. • The companies could justify the costs as a cost of doing business and/or because the project
aligned well with a broader business strategy. 4.1.2. Boundary Dam. For this project to be successfully completed, it took a combination of business drivers, regulatory drivers, market pull, and technology push. On the one hand, it is a nice roadmap on how to put together a successful project. On the other hand, it shows why it is so hard to develop CCS projects at a power plant and why Boundary Dam is not easy to replicate. Boundary Dam was a retrofit to boiler unit 3. The net power output after capture is 110 MWe. The original projected cost for the boiler retrofit and CCS was projected to be C$1.1 billion, though that rose to C$1.3 billion. The CO2 was to be sold for EOR, but any unsold CO2 would be injected into a saline formation developed by the Aquistore Project. Fly ash and sulfuric acid would also be sold. Below is an analysis of the project from Clark (2015)11: Canada’s 2012 update to the Environmental Protection Act requires new coal plants to be compliant with an emissions limit of 420 tonnes of CO2 emitted per GWh of electricity produced, as well as existing plants when they turn 40 years old. Lignite coal has a high emission factor (~1050 t CO2/GWh for a PC plant12), and therefore would not be able to meet this requirement without CCS. This policy left SaskPower only two choices: include CCS in their project or allow regulations to strand some of their lignite assets. Saskatchewan has a valuable 300-year supply of coal that SaskPower does not want to be wasted or kept underground.13 9 Note that the Norwegian government owns 67% of Statoil, which means the company is generally responsive to government suggestions. 10 http://www.co2captureproject.org/ 11 For a more detailed description of the Boundary Dam economics, see Clark (2015). 12 Calculated using average heat rates from US power plants generating more than 300,000 MWh/yr, totaling 347 PC plants and average emission factors from United States lignite (data from the US Energy Information Administration). 13 SaskPower. (2012). Boundary Dam Integrated Carbon Capture and Storage Demonstration Project. Retrieved from http://www.saskpower.com/wp-content/uploads/clean_coal_information_sheet.pdf
H. Herzog, 2016
26
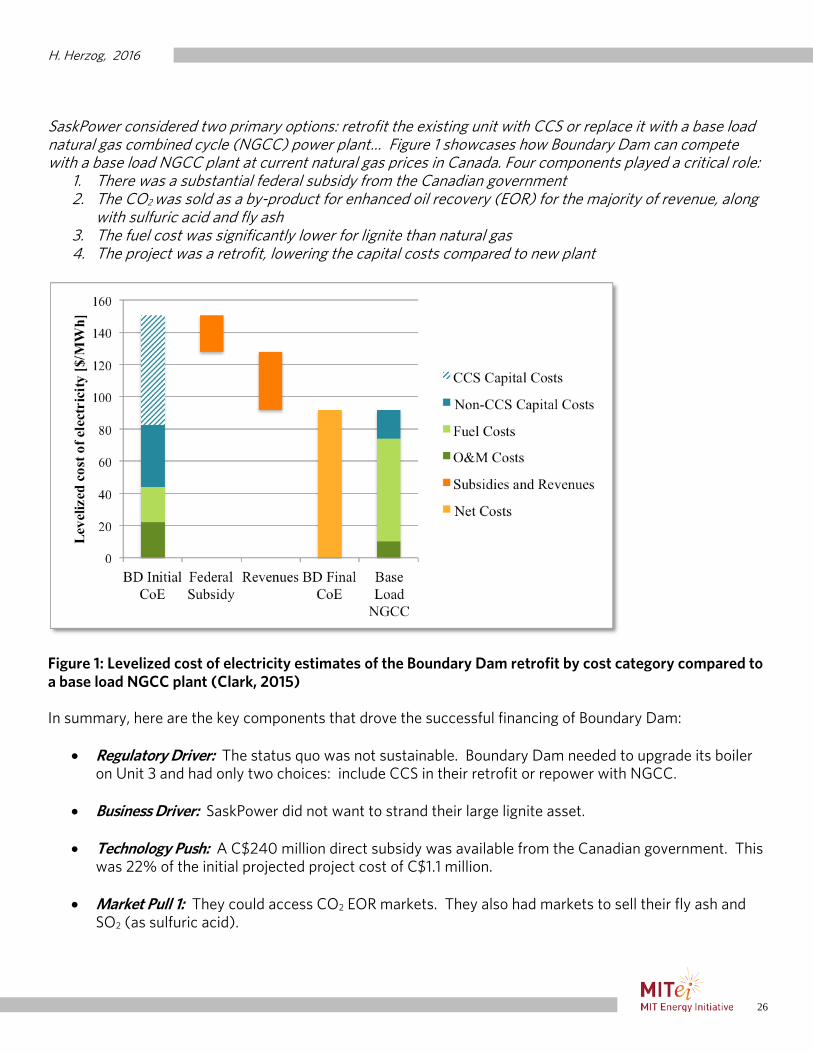
SaskPower considered two primary options: retrofit the existing unit with CCS or replace it with a base load natural gas combined cycle (NGCC) power plant… Figure 1 showcases how Boundary Dam can compete with a base load NGCC plant at current natural gas prices in Canada. Four components played a critical role:
1. There was a substantial federal subsidy from the Canadian government 2. The CO2 was sold as a by-product for enhanced oil recovery (EOR) for the majority of revenue, along
with sulfuric acid and fly ash 3. The fuel cost was significantly lower for lignite than natural gas 4. The project was a retrofit, lowering the capital costs compared to new plant
Figure 1: Levelized cost of electricity estimates of the Boundary Dam retrofit by cost category compared to a base load NGCC plant (Clark, 2015) In summary, here are the key components that drove the successful financing of Boundary Dam:
• Regulatory Driver: The status quo was not sustainable. Boundary Dam needed to upgrade its boiler on Unit 3 and had only two choices: include CCS in their retrofit or repower with NGCC.
• Business Driver: SaskPower did not want to strand their large lignite asset.
• Technology Push: A C$240 million direct subsidy was available from the Canadian government. This was 22% of the initial projected project cost of C$1.1 million.
• Market Pull 1: They could access CO2 EOR markets. They also had markets to sell their fly ash and SO2 (as sulfuric acid).
H. Herzog, 2016
27
• Market Pull 2: They gained access to the electricity markets by convincing the authorities that retrofitting with CCS is no more costly than repowering with an NGCC14. Gaining access to the electricity markets meant that they could pass on the costs to the ratepayers.
4.1.3. Kemper. The Kemper project is introduced in Section 3.1. When Southern Company got the original award from Round 2 of the CCPI in 2004, the plan was to build the plant in Florida. The project was not motivated by CCS, but the desire to commercialize a new gasification technology, Transport Integrated Gasification or TRIG. A key feature of TRIG is that it can work well with low rank coals like lignite. The gasifier had been under development for years by Southern Company under contract from the US DOE. A pilot plant of the gasification system was in operation at Southern’s Power Systems Development Facility (PSDF) in Wilsonville, AL15. When new edicts were issued from the Florida government, the environment for building a new coal plant in that state became problematic. However, Mississippi proved to be a desirable venue where Mississippi lignite and potential for using CO2 for enhanced oil recovery were valuable attributes to the project. Further, the Mississippi Public Utilities Commission (PUC) was amenable to rate-base this project, thereby giving Kemper access to the electricity markets. So the project went forward with the following drivers:
• Business Drivers: Southern wants to develop markets for its TRIG technology, especially in China and other Asian countries. The state of Mississippi wanted to exploit their natural resources, such as their lignite. Fuel diversity was a consideration and a hedge against natural gas price volatility.
• Technology Push: A $295 million award from the CCPI Round 2. In addition, the project originally qualified for $133 million in investment tax credits (but missed the in-service date deadline and had to return them), as well as a loan guarantee (which they decided to decline).
• Market Pull 1: They could access CO2 EOR markets. • Market Pull 2: They gained access to the electricity markets by approval of the Mississippi PUC.
However, the cost recovery was capped to protect ratepayers from cost overruns. The story at Kemper is the large increase in project costs, with total costs now estimated at over $6.6 billion (Marshall, 2016b)16. These cost increases are NOT primarily due to CCS, but to a variety of issues. However, much can be attributed to implementing multiple first-of-a-kind technologies and the complexity of integrating them together, especially in moving from a pilot plant to a scale of nearly 600 MWe. In summary, Kemper shares some similarities with Boundary Dam in that it accesses both electricity and EOR markets, as well as having a business driver to use local lignite. However, there is a major difference: where Boundary Dam was a retrofit using proven technology, Kemper is a new build using
14 Note that SaskPower is owned by the Provence of Saskatchewan, making some critics speculate on the independence of the regulating authorities. 15 The facility has since been renamed the National Carbon Capture Center (NCCC). 16 Approximately $4.2 billion are eligible for recovery from customers. The remaining costs are Southern Company write downs.
H. Herzog, 2016
28
a first-of-a-kind gasification technology. While there were some technical issues at Boundary Dam, they were at a much smaller and manageable scale. 4.1.4. Petra Nova. Petra Nova was introduced in Section 3.1. Unlike the power projects at Boundary Dam and Kemper, this project is taking place in a de-regulated market. Therefore, access to electricity markets will be only through the market price. However, the Petra Nova project does rely heavily on EOR markets as part of its financial package. There are two features of the Petra Nova project that make it unique:
• This is a retrofit that uses a post-combustion capture process from the exhaust gas of a coal boiler. The capture process requires a significant amount of low pressure steam. The standard design (as done at Boundary Dam) is to integrate the capture process with the power plant’s steam cycle. In Petra Nova’s case, they installed a HRSG on an existing gas turbine to generate steam from the turbine exhaust. This has several advantages, including not losing plant capacity, taking advantage of low natural gas prices, and easier system integration. See Bashadi (2010) for an in-depth analysis of this approach.
• This is a vertically integrated project. Instead of simply selling the CO2 to an EOR operator, Petra Nova bought their own oil field to operate.
This project was initiated under the watch of David Crane, then CEO of NRG (Petra Nova is a joint venture between NRG Energy and JX Nippon Oil & Gas Exploration). Some insight into the business driver can be obtained by understanding where David Crane was taking NRG. This is an excerpt from his letter of resignation as head of NRG: The new frontier of the energy business that I pushed the company into, [was] then, and [is] still now, in the long-term best interest of the company's employees, its shareholders, its customers and the earth we all inhabit. As a company that aspires to growth, there is no growth in our sector outside of clean energy; only slow but irreversible contraction following the path of fixed-line telephony (Lacey, 2016). There is not much additional information on this project in the open literature. So we can summarize what we do know:
• Business Driver: A company that wants to be an innovator in clean energy.
• Technology Push: A $167 million award from the CCPI Round 3. Probably other incentives, but not readily available.
• Market Pull: Access to CO2 EOR markets. • Innovated Strategy 1: Use the exhaust from a gas turbine to provide steam to the capture process.
This simplifies the capture plant integration, avoids reducing the plant’s electricity generation, and takes advantage of today’s low gas prices.
H. Herzog, 2016
29
• Innovated Strategy 2: Vertically integrate the project by becoming owner and operator of oil field for EOR.
In a presentation17, NRG suggested some other reasons for the success of the project:
• The DOE grant award included a phased approach with some early cash funding during project definition.
• The commercial value proposition (10% unlevered IRR, a typical hurdle) that was based on strong revenue from EOR.
• The choice of “Well‐understood and proven technology with experienced OEM”. • The project cost protections were via “Fixed price under lump‐sum turn‐key (LSTK) EPC agreement”
and the timing protections were via “Guaranteed completion with liquidated damages through EPC agreement”
4.1.5. Decatur. The Decatur project is really two projects:
• Illinois Basin – Decatur Project. A pilot project to inject a million tons of CO2 over a three year period. The project was undertaken as part of the US DOE’s Regional Partnership Program (see section 4.3).
• The Illinois Industrial CCS Project. This is the project in Table 6 led by Archer Daniels Midland (ADM).
The Decatur project is unique in at least three ways:
• It is the only project worldwide that started as a pilot project and then evolved into a large-scale CCS demonstration project.
• It is the first and only project to inject CO2 under a Class VI permit from the US EPA’s Underground Injection Control Program. The Class VI permit was developed specifically for long-term storage of CO2 in geologic formations. Note that FutureGen 2.0 was also awarded a Class VI permit, but it was never used.
• It is the only CCS demonstration project that can claim negative emissions. While the project is the exception for North America, in that it does not access EOR markets, it does have some significant advantages in the storage situation: (1) The CO2 will be stored under the site, so no pipelines costs are involved. (2) All the geologic characterization, as well as the MMV (measurement, monitoring, and verification) protocols, was essentially done by the pilot project. As discussed in section 3.1, about two-thirds of the project costs were covered by a grant from the US government. As seen with other demonstration projects, business drivers are also critical. This project was vetted and approved by the top management at ADM and was motivated by climate change concerns. “ADM, as part of its comprehensive strategy for energy sustainability and environmental responsibility, is implementing the Illinois ICCS project to reduce carbon footprint of industrial processes, e.g., by permanently storing the CO2 generated during ethanol production in deep underground rock formations, rather than releasing it into the atmosphere” (Gollakota and McDonald, 2014).
17http://www.jcoal.or.jp/coaldb/shiryo/material/2_Session%202_speech%202_US%20NRG.pdf
H. Herzog, 2016
30
In summary, Decatur has quite a bit of similarity with the pioneer projects. The capture cost was relatively small because the process produces a pure stream of CO2. This just leaves costs for compression and any pipelines. The project was aligned with the company’s business strategies and the price tag was affordable once they obtained the government support. 4.2. Demonstration Projects without a Positive Financial Decision 4.2.1. FutureGen. The FutureGen project has a very long history. First announced in 2003, an alliance of coal companies and coal burning utilities were to build an IGCC power plant with CCS. This initial project was considered an R&D project, as opposed to a demonstration project, with the US government contributing up to a $1 billion. The project would store 1 MtCO2/yr for 4 years. The project was cancelled in January, 2008; just a month after Mattoon, IL was selected as the plant site. Whatever the reasons for withdrawal of support, what is clear is that political support over a long period of time, just as in the UK’s billion pound competition (see section 3.3), is a factor in the fate of a project that is high cost and requires substantial government assistance. Before the project was cancelled, the MIT Future of Coal study (MIT, 2007) suggested another problem, a lack of clarity of purpose. Specifically, they said: First, there is continuing lack of clarity about the project objectives. Indeed, the DOE and consortium insist that FutureGen is a research project and not a demonstration project. This distinction appears to be motivated by the fact that higher cost sharing is required for a demonstration project, typically 50% or more from the private sector. However, the main purpose of the project should be to demonstrate commercial viability of coal-based power generation with CCS; it would be difficult to justify a project of this scale as a research project. The ambiguity about objectives leads to confusion and incorporation of features extraneous for commercial demonstration of a power plant with CCS, and to different goals for different players (even within the consortium, let alone between the consortium and the DOE, Congress, regulators, and others). Second, inclusion of international partners can provide some cost-sharing but can further muddle the objectives; for example, is Indian high-ash coal to be used at some point? This effort to satisfy all constituencies runs the risk of undermining the central commercial demonstration objective, at a project scale that will not provide an agile research environment. The project was reconfigured in August 2010 as FutureGen 2.0, with funding of a $1 billion from the stimulus bill (see section 3.1). Some original alliance members dropped out, while some new members joined. The new plan was to retrofit a recently idled 65 year old coal-fired boiler owned by Ameren in Meredosia, IL. The chosen CCS technology pathway was oxy-combustion capture. The previous site of Mattoon, IL was to be used as the storage site. While the FutureGen 2.0 project moved ahead and completed many significant milestones, progress was slow. There were several unexpected hurdles that had to be overcome, including (MIT 2016):
• Mattoon was no longer the site of the power plant, so they no longer had interest in being the storage site and withdrew, requiring FutureGen 2.0 to find, characterize, and permit a new storage location.
H. Herzog, 2016
31
• Ameren pulled out of the project, requiring the alliance to acquire the power plant. • The permit process for the storage wells lasted about 2 years, in part because this was the first
time a permit for CO2 storage wells was issued under the new Class VI category. • The project faces a lawsuit from the Sierra Club over the lack of a Prevention of Significant
Deterioration permit (NCC, 2015). In the end, time ran out on spending the funding from the stimulus bill. As stated in section 3.1, FutureGen 2.0 was effectively cancelled in February 2015 by the US DOE when it became clear that they could not meet the September 2015 deadline. The official cancellation announcement was issued in January, 2016. "We are deeply disappointed that an expiration date for federal funding unnecessarily ended one of the most important clean energy projects of this decade," said alliance CEO Ken Humphreys. Sean Major, chairman of the alliance board, added, "If the federal funding continued, the Alliance Board of Directors had confidence that construction would have been successfully completed" (Marshall, 2016a). In summary, some lessons can be drawn from the FutureGen experience:
• Large complex projects require clarity of purpose in order to keep costs in-line. • Projects that have very large government subsidies can become politicized. In FutureGen 2.0,
the political environment made an extension of the spending deadline essentially impossible. • Large complex projects will almost certainly face challenges as they go forward that require
time to resolve. Setting strict time deadlines is generally a recipe for disaster. 4.2.2. ZeroGen. The original FutureGen project in the US inspired similar efforts around the globe, including GreenGen (China) and ZeroGen (Australia). The ZeroGen effort was documented with a case history (ZeroGen, 2012), which provided information from the summary below. March 2006, ZeroGen Proprietary Limited was incorporated. In 2008, it was decided to conduct a prefeasibility study for a 500 MWe IGCC power plant with CCS in Central Queensland. It would store 60-90 MtCO2 over a 30 year period. The project was cancelled at the end of 2010. Two major reasons were cited:
• High cost, estimated at AUS$6.9 billion. • Lack of finding a suitable storage site during the prefeasibility study, despite 70% of the
prefeasibility funds being spent on this effort. ZeroGen is yet another example of gasification projects being too expensive for the power sector. It also brings up a new issue – having an acceptable storage site. Most of the proposed CCS demonstration projects discussed in this paper were sited with known storage locations available. In the case of ZeroGen, they had some potential sites targeted, but it was not known whether they would be acceptable until field data was collected, which is an expensive task. Only so many sites could be explored in the prefeasibility study, and these sited proved unacceptable. 4.2.3. Poly-generation. Two of the projects that received CCPI awards can be classified as poly-generation projects. These are the Texas Clean Energy Project (TCEP) and Hydrogen Energy California (HECA). They are based on coal gasification technology, but produce additional products in addition
H. Herzog, 2016
32
to electricity and CO2. In general, these products need to be of higher value to obtain revenues to help pay for the project. HECA has been cancelled and though TCEP is still active, it is unclear whether or when it will proceed. TCEP plans to produce urea in addition to electricity and CO2. The project is led by Summit Energy, who has done a very good job of project development. They have completed most agreements necessary, including off-take agreements for electricity, CO2, and urea, as well as engineering, procurement, and construction agreements (MIT, 2016). The missing piece is the equity partners needed to complete the financing of the project. HECA had planned to produce fertilizer and other products in addition to electricity and CO2. They had planned to use petroleum coke as a feedstock, which can be significantly less expensive than coal. However, it appears that HECA had very few agreements in place and had lost their DOE funding (MIT, 2016), as well as the potential buyer of their CO2 (Examiner.com, 2016). In notifying the State of California Energy Resources Conservation and Development Commission,18 HECA cited “the timeframe for deploying a project such as HECA has been longer than was anticipated” and “the U.S. Supreme Court’s February 9, 2016 decision to stay implementation of the Obama Administration’s Clean Power Plan … have cast additional uncertainty over the timing of such projects.” While the poly-generation concept has been around for a while, TCEP and HECA show how difficult it is to implement. A major reason is the recurring theme of the high cost of gasification. The current technologies just seem too expensive for the power sector. The poly-generation idea tries to somewhat counter this with high value added products. When these projects started, they may have had a reasonable chance to succeed. But in the six or so years that they have been under development, first gas, then oil prices decreased dramatically. This means their products have become less valuable: CO2 prices for EOR are linked to the oil prices and natural gas is the primary feedstock for fertilizer, urea, hydrogen, and other potential poly-generated products. Low natural gas prices mean lower prices for these products. 4.2.4. BP’s Decarbonized Fuel Projects. BP proposed three projects in the mid-2000s around the concept of decarbonized fuels. The idea was to produce “decarbonized” fuels (DF) from hydrocarbon feedstocks. BP created a Hydrogen Energy unit to pursue the projects. This concept of selling clean fuels to the world was very much in-line with BP’s “Beyond Petroleum” marketing strategy. The three proposed projects were:
• DF1, located at the Peterhead Power Plant19 in Scotland. The project would capture CO2 from natural gas via pre-combustion and use the CO2 for EOR in the Miller field in the North Sea. By using pre-combustion capture, hydrogen is sold to the power plant to produce electricity (Paxman, 2007). This project is discussed further below.
• DF2, located in Carson, CA, was to gasify PetCoke to produce electricity and CO2. The CO2 would be used for EOR. The hydrogen produced by the gasifier would be sent to a turbine to produce electricity (MIT, 2016). This project ran into public acceptance issues and is discussed further in the next section.
18 See http://docketpublic.energy.ca.gov/PublicDocuments/08-AFC-08A/TN210603_20160303T162841_Withdrawal_of_Revised_Application_for_Certification.pdf 19 This is the same power plant that later was a finalist in the UK competition, but for a completely different project.
H. Herzog, 2016
33
• DF3, located in Kwinana, Western Australia, was to gasify coal to produce electricity. The CO2 would be stored in an offshore saline formation. The project was to be in partnership with Rio Tinto. The project never really got very far, in part because it was determined that the targeted storage site was inadequate (MIT, 2016).
DF1 provides some good insights into how these projects may fit in well with a company’s business strategy. BP was pushing DF1 for at least two major reasons. First, it was to be the flagship project for what would be a set of projects worldwide that produced “decarbonized fuels”, essentially hydrogen. Even though hydrogen was an intermediate product in all three DF projects (the hydrogen would be used to produce electricity), this fit the image BP wanted to convey. The second reason had a more direct impact on the project’s financing. The project would use existing infrastructure in the Miller’s field (pipelines, platforms, etc.). Not only would revenue be generated by life extension of the field, BP would avoid decommissioning of the field, which would have a major impact on the corporate balance sheets. For the project to go ahead, BP required some government support to proceed. Further, they needed a relatively quick answer from the UK government because the oilfield was fast approaching its end of life. It was reported that BP requested the same subsidy that was being paid to wind at that time. Since the size of DF1 was about as big as all the wind projects to that time, the UK government was concerned about how such a large lump sum subsidy would be viewed. Instead, the UK announced its billion pound competition and invited BP to apply. This not only delayed the timing, it added uncertainty. As a result, BP cancelled the project in May 2007 (Royal Society of Chemistry, 2007). Even though DF1 had a good chance of being completed if the UK government provided support, the overall decarbonized fuel concept was probably headed for failure. The idea of selling a clean fuel (i.e., hydrogen) to a utility fit in well with BP’s business strategy. However, for both natural gas and coal, the cost of “decarbonizing” fuel (i.e., pre-combustion capture) is more expensive than simply combusting the fuel and capturing and storing the CO2 from the flue gases (i.e. post-combustion capture). 4.2.5. Projects derailed due to public acceptance. As with any technology, public acceptance problems will arise. There has not been enough experience yet to tell whether CCS projects will be exceptional with regard to public acceptance. A nice review of CCS and public acceptance is given by Ashworth et al. (2012). They stress that “the importance of communication and stakeholder engagement.” Examples of successful public outreach efforts include Decatur, Lacq, and Quest. “Community self-selection” is also important as happened with FutureGen and Otway. On the other hand, a few CCS projects have died because of lack of public acceptance, both at the local level and the national level. They are briefly described below. Barendrecht. This project has become the poster child for public opposition to CCS. About 0.4 MtCO2/yr from the Shell Pernis refinery was to be stored in two depleted gas fields near Barendrecht in the Netherlands. It appears that neither Shell nor the Dutch government had a real public outreach effort until it was too late. The town saw no local benefits, but did see risks, as CCS demonstrations on this scale were not yet “proven”. This project has brought home the point that public outreach and stakeholder engagement is an essential part of a large-scale CCS project. Shell learned the lesson well, as seen by their excellent outreach program for the Quest project.
H. Herzog, 2016
34
Carson. In hindsight, one can criticize BP for selecting the greater Los Angeles area as the site for one of the first CCS demonstration projects in the world. However, BP looked at this as a “green” project and Carson was an industrial area with a good source of PetCoke and opportunities for EOR. It was California’s environmental justice movement that opposed the project because it put an industrial facility in a lower income neighborhood. It is unclear if better stakeholder engagement would have helped. Besides protest from the environmental justice movement, BP could not get Occidental Petroleum to agree to buy their CO2 for EOR. Eventually, the project was moved to Bakersfield, CA and became the HECA project (BP is no longer involved in the project). At least two lessons can be learned here. First, good site selection is important and should have identified the environmental justice movement as an issue. Early engagement was called for. Second, announcing the project without at least some discussions regarding the sale of CO2 appears to have been detrimental to the project as well.
Jänschwalde. The two projects discussed above are cases of lack of public acceptance at the local level. Jänschwalde is a case of what can happen with lack of public acceptance at the national level. Vattenfall wanted to build a 250 MWe oxyfuel CCS power plant in Germany. An oxyfuel pilot project at Schwarze Pumpe had started up in 2009 and this was the next logical step. However due to failure of the German government to transpose the EU CCS Directive, Vattenfall had no options for storing the CO2, so the project was cancelled. From Lupion and Herzog (2013): Nearly all Member States with planned CCS projects adopted the Directive by January 2012. However, a clear candidate to host CCS demonstration projects like Germany failed to fully transpose the European Directive. The lack of public acceptance was the main reason for the delayed transposition of the CCS directive. In July 2011, Germany’s lower house approved a bill allowing the underground storage of CO2 but it was rejected by the upper house on September 2011. Following the rejection of the bill by the Bundesrat, a mediation committee was formed without result. This caused Vattenfall to abandon its CCS demonstration project in Jänschwalde, Brandenburg, and stop the planned €1.5 billion investment. The project had been awarded with €180 million from EEPR and submitted an application for the NER300 funding programme. 4.3. Large Pilot Projects Table 12 lists large CCS pilot projects that are either operating today or have operated in the past. By large, it is meant that the feed stream is at least as big as the flue gas from 10 MWe of a coal-fired power plant. Roughly, this corresponds to 50,000 tCO2/yr or greater. There are 23 pilot projects listed in Table 12 The listed pilot projects had information readily available in the open literature, so there may be some pilots missing from the list. For example, major equipment suppliers like Alstom and Babcock&Wilcox had in-house pilot plants for their R&D efforts. They tended to keep their results as trade secrets and not publish in the open literature. The first 11 projects listed in Table 12 are focused on storage. The last 12 have a capture focus. Note that there were three sets of linkage:
• Plant Barry is sending its CO2 to Citronelle • Callide-A sent its CO2 to Otway
H. Herzog, 2016
35
• Schwarze Pumpe wanted to send its CO2 to Ketzin, but was prevented because Germany did not transpose the EU CCS Directive (see Section 4.2.5).
Linking a capture project to a storage project provides good synergy and helps financing. For example, Citronelle was developed under the US DOE’s Regional Partnership Program, where the majority of the funding came from DOE. It gave Plant Barry, funded in large part by Southern Company and jointly constructed with MHI, a ready-made storage option without the development expenses. Meanwhile, Citronelle can take advantage of a “free” (from their vantage point) source of CO2. Projects where MIT (2016) reports costs are listed in Table 13. Comparing the CCS pilot projects with large-scale CCS demonstrations, it can be seen that they had significantly lower project costs and, in most cases, had a higher fraction of government cost-sharing. The costs for most of the pilot projects are $100 million or less and many pilot projects received over 60% in government support.
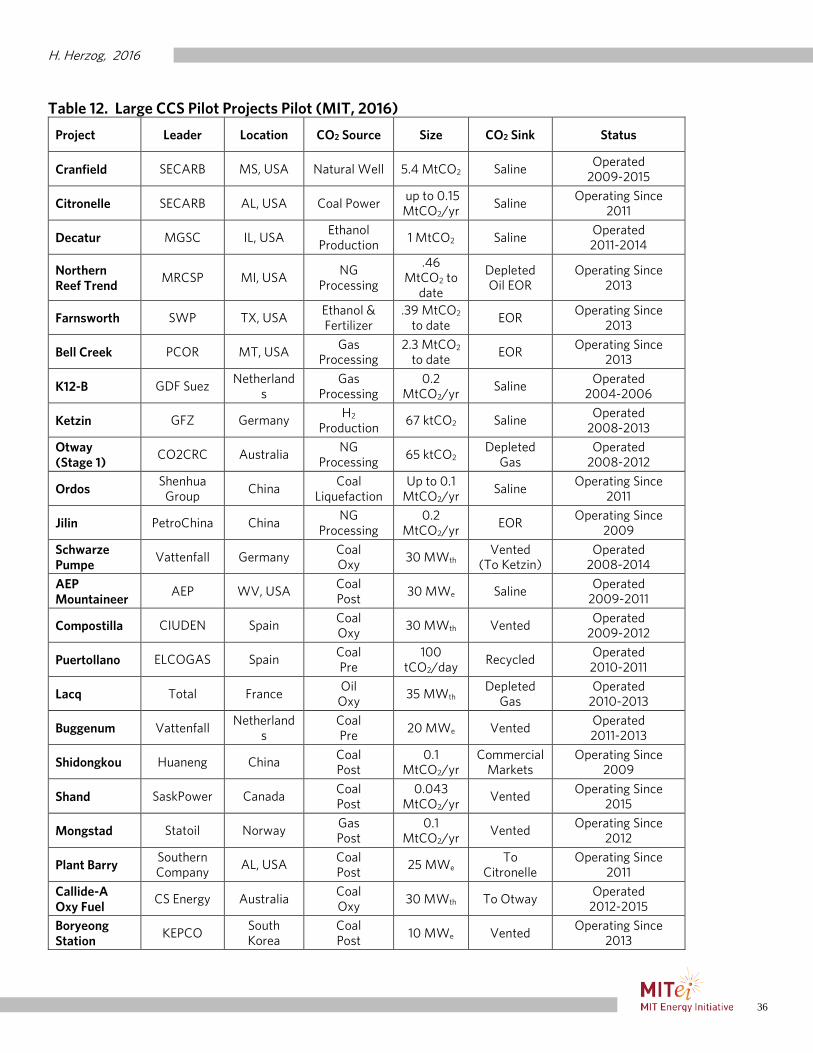
H. Herzog, 2016
36
Table 12. Large CCS Pilot Projects Pilot (MIT, 2016)
Project Leader Location CO2 Source Size CO2 Sink Status
Cranfield SECARB MS, USA Natural Well 5.4 MtCO2 Saline Operated 2009-2015
Citronelle SECARB AL, USA Coal Power up to 0.15 MtCO2/yr Saline
Operating Since 2011
Decatur MGSC IL, USA Ethanol
Production 1 MtCO2 Saline Operated 2011-2014
Northern Reef Trend
MRCSP MI, USA NG Processing
.46 MtCO2 to
date
Depleted Oil EOR
Operating Since 2013
Farnsworth SWP TX, USA Ethanol & Fertilizer
.39 MtCO2 to date EOR
Operating Since 2013
Bell Creek PCOR MT, USA Gas Processing
2.3 MtCO2 to date EOR Operating Since
2013
K12-B GDF Suez Netherlands
Gas Processing
0.2 MtCO2/yr
Saline Operated 2004-2006
Ketzin GFZ Germany H2 Production
67 ktCO2 Saline Operated 2008-2013
Otway (Stage 1)
CO2CRC Australia NG Processing
65 ktCO2 Depleted Gas
Operated 2008-2012
Ordos Shenhua
Group China Coal
Liquefaction Up to 0.1
MtCO2/yr Saline Operating Since
2011
Jilin PetroChina China NG
Processing 0.2
MtCO2/yr EOR Operating Since
2009
Schwarze Pumpe
Vattenfall Germany Coal Oxy 30 MWth Vented
(To Ketzin) Operated
2008-2014
AEP Mountaineer
AEP WV, USA Coal Post
30 MWe Saline Operated 2009-2011
Compostilla CIUDEN Spain Coal Oxy
30 MWth Vented Operated 2009-2012
Puertollano ELCOGAS Spain Coal Pre
100 tCO2/day
Recycled Operated 2010-2011
Lacq Total France Oil
Oxy 35 MWth Depleted
Gas Operated
2010-2013
Buggenum Vattenfall Netherland
s Coal Pre 20 MWe Vented
Operated 2011-2013
Shidongkou Huaneng China Coal Post
0.1 MtCO2/yr
Commercial Markets
Operating Since 2009
Shand SaskPower Canada Coal Post
0.043 MtCO2/yr
Vented Operating Since 2015
Mongstad Statoil Norway Gas Post
0.1 MtCO2/yr
Vented Operating Since 2012
Plant Barry Southern Company
AL, USA Coal Post
25 MWe To
Citronelle Operating Since
2011
Callide-A Oxy Fuel
CS Energy Australia Coal Oxy 30 MWth To Otway
Operated 2012-2015
Boryeong Station
KEPCO South Korea
Coal Post 10 MWe Vented
Operating Since 2013
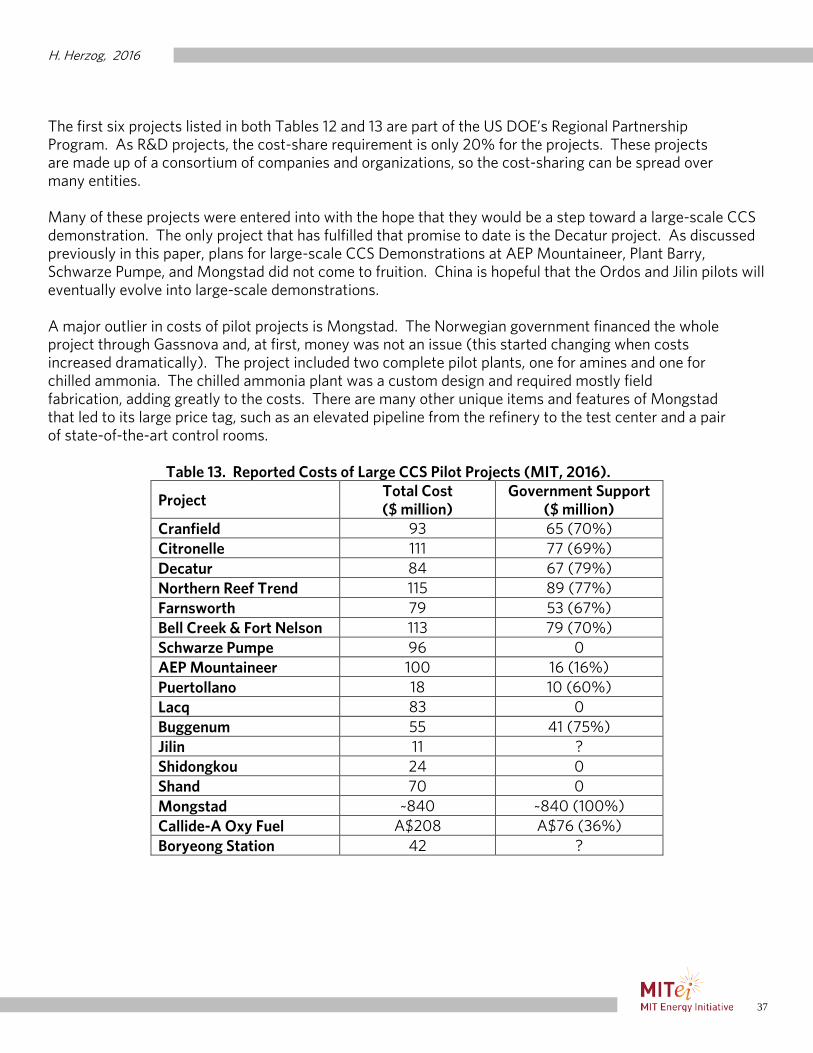
H. Herzog, 2016
37
The first six projects listed in both Tables 12 and 13 are part of the US DOE’s Regional Partnership Program. As R&D projects, the cost-share requirement is only 20% for the projects. These projects are made up of a consortium of companies and organizations, so the cost-sharing can be spread over many entities. Many of these projects were entered into with the hope that they would be a step toward a large-scale CCS demonstration. The only project that has fulfilled that promise to date is the Decatur project. As discussed previously in this paper, plans for large-scale CCS Demonstrations at AEP Mountaineer, Plant Barry, Schwarze Pumpe, and Mongstad did not come to fruition. China is hopeful that the Ordos and Jilin pilots will eventually evolve into large-scale demonstrations. A major outlier in costs of pilot projects is Mongstad. The Norwegian government financed the whole project through Gassnova and, at first, money was not an issue (this started changing when costs increased dramatically). The project included two complete pilot plants, one for amines and one for chilled ammonia. The chilled ammonia plant was a custom design and required mostly field fabrication, adding greatly to the costs. There are many other unique items and features of Mongstad that led to its large price tag, such as an elevated pipeline from the refinery to the test center and a pair of state-of-the-art control rooms.
Table 13. Reported Costs of Large CCS Pilot Projects (MIT, 2016).
Project Total Cost ($ million)
Government Support ($ million)
Cranfield 93 65 (70%) Citronelle 111 77 (69%) Decatur 84 67 (79%) Northern Reef Trend 115 89 (77%) Farnsworth 79 53 (67%) Bell Creek & Fort Nelson 113 79 (70%) Schwarze Pumpe 96 0 AEP Mountaineer 100 16 (16%) Puertollano 18 10 (60%) Lacq 83 0 Buggenum 55 41 (75%) Jilin 11 ? Shidongkou 24 0 Shand 70 0 Mongstad ~840 ~840 (100%) Callide-A Oxy Fuel A$208 A$76 (36%) Boryeong Station 42 ?
H. Herzog, 2016
38
5. Lessons Learned This section discusses some of the lessons learned from this review of the past two decades of CCS demonstration projects. 1. There are strong links between the successful CCS demonstration projects and the oil & gas industry. Twenty-one of the 22 successful CCS demonstration projects have occurred in a region with a significant oil & gas industry. The only exception is Decatur in Illinois. EOR provided the financial incentive for all nine commercial EOR projects using anthropogenic CO2 (see Table 2). All four pioneer projects (see Table 3) were operated by oil companies and with the CO2 being a by-product of natural gas processing. Finally, seven of the 9 CCS RD&D projects (see Table 4) accessed EOR markets to help with project financing, with one of the remaining two projects being located at an oil refinery. 2. Access to markets has to move beyond EOR. Lesson 1 has shown the importance of EOR markets to date. For CCS projects to grow numerically and geographically, they will need to access other markets. The two markets that offer the most potential are carbon markets and electricity markets. While somewhat limited today, new regulatory drivers (see Lesson 3) can increase their role. Today, there are limited carbon markets and they generally have low carbon prices, much lower than needed to incentivize a CCS project at a power plant. So while they can be part of a bigger financing package, at current carbon prices they will play a minor role. Electricity markets have played a larger role to date than carbon markets. Two of the three successful CCS demonstrations on power plants (Boundary Dam and Kemper) did access electricity markets by gaining approval of their utility regulators to put some (Kemper) or all (Boundary Dam) of the costs in the rate base. However, without policy in place to reduce CO2 emissions (or the likelihood that these policies would be put in place), gaining access to electricity markets will be difficult. AEP tried to gain access for their Mountaineer project and were denied by their regulators, in part because there was no “federal mandate to cut carbon emissions from power plants”. Policies that qualify CCS for access to electricity markets would be beneficial. Examples of these types of policies include portfolio standards or feed-in tariffs. The example of this type of policy currently in place for CCS is the UK’s “contracts for differences”. This policy allows CCS projects to contract a price for the electricity they produce. They would then be paid the difference between this contract price and the market price. The projects in the UK’s £1 billion competition were qualified to use this program as part of their financial package.
H. Herzog, 2016
39
3. Regulatory drivers are critical to creating markets for CCS. As discussed in Lesson 2, regulatory drivers are needed to grow carbon markets and give CCS better access to electricity markets. In the case of Boundary Dam, their access to electricity markets was dependent on a regulatory driver being in place. This regulatory driver was a performance standard limiting the amount of carbon emissions coming from certain coal-fired power plants. This did not guarantee CCS would be deployed, but it did require a change from business as usual, allowing CCS to compete. On the other side of the coin, AEP Mountaineer was denied access to electricity markets because there was no regulatory driver in place. Going forward, new carbon policies will be put in place around the world to follow through on the agreement reached at COP-21 in Paris. The key question is whether the policies will be strong enough to help move CCS forward. If policies are market oriented, will they create large enough carbon markets that can help finance CCS projects? If the policies are more command and control, will the regulatory drivers be sufficient to allow CCS projects to tap into electricity or other commercial markets? The exact formulation of these policies will be critical to the future of CCS. For example, in the US, it does not appear that the Clean Power Plan by itself will provide much incentive for CCS projects. This is because the targets are relatively modest and will be met primarily with increased use of renewables (which are heavily subsidized and have portfolio standards in many states) and a switch from coal to natural gas (driven in large part by low natural gas prices). In general, a more stringent the regulation in terms of emissions reduction will generally be more beneficial to CCS’s competitive position. Even if regulations are implemented slowly, the message that more stringent regulations will be coming in the future can help incentivize CCS because it will send a strong signal to the private sector (see Lesson 4 below). 4. Business drivers play a major role. It is crystal clear from the review of CCS projects in this paper that business drivers have been critical to the successful CCS projects. Another way to say this is that projects can greatly improve their chances of success if they align with business interests and/or have a persuasive business case. This can take many forms, as shown by these examples discussed in this paper:
• Protecting or promoting assets, including the oil sands in Alberta or lignite in Mississippi, Saskatchewan, or Germany.
• Going “beyond petroleum” at BP • The push for clean energy at NRG • The goal of “energy sustainability and environmental responsibility” at ADM
As mentioned in Lesson 3, when regulatory drivers send a message that carbon emissions must be cut, it can create business drivers to adopt low carbon technologies. As seen by the examples above, CCS will fit well into many business strategies. On the other hand, we presently have the opposite happening because the regulatory drivers are weak and there is great uncertainty about when they will be strengthened. The result is that many companies have either reduced or eliminated their efforts in developing CCS technologies.
H. Herzog, 2016
40
5. Over reliance on government subsidies is a risky business. Many successful projects have benefited from government support. For many smaller projects (e.g., pilot projects), the government support was well over 50% of the financing. However, the government support for successful larger projects was a smaller fraction. The projects that required very large government payments have not succeeded. They include:
• FutureGen and FutureGen 2.0 (from US) • Shell Peterhead and White Rose (from UK) • BP Peterhead (DF1) (from UK) • Mongstad (from Norway)
These projects take years to develop. During that time, politics change. These large projects can become easy targets. In the case of the cancellation of the UK competition, it has generated mistrust of the government by industry, which may have a chilling effect on industry participation for future government programs to support CCS. This analysis tends to show that a more secure path forward for CCS is to have government create the regulatory environment to create business drivers. For initial projects, government support will probably still be required to overcome first mover costs. However, this support can be more balanced, such as a program like the CCPI in the US. 6. Successful CCS power projects used multiple financing components. Power sector CCS in the current regulatory regime is expensive. It is one reason while there are only 3 successful CCS demonstration projects at power plants. If there was a carbon price at a sufficiently high level, perhaps that would be sufficient to finance a CCS project. However, that is not the case today and is unlikely to happen in the foreseeable future. As a result, financing these projects will remain complex and require multiple financing components, as seen at Boundary Dam and Kemper. This leads some people to question the current approach to CCS demonstration projects in the power sector and wonder whether there is a better approach to CCS technology development, especially if we want deployable results in a relatively short timeframe (see Lesson 10). 7. Innovative CCS power projects (e.g., poly-generation) are interesting, but may be hard to replicate. Innovation in the business model has been attempted in several power sector projects. Petra Nova is the only successful example to date. TCEP and HECA have both been innovative in their approach, but TCEP has yet to come to a financial close and HECA has been cancelled. Questions have been raised about these projects. Petra Nova bought a pipeline and oil field as part of the project, eliciting comments that this is not a commercial model most power generators could replicate. The poly-generation concept of HECA and TCEP can be looked at as an industrial (chemical) CCS project with electricity as a by-product, as opposed to a power sector project. Given current markets and the long-term projections of price and supply for both oil and natural gas in the U.S., there is a question about subsequent broad commercial application or replication of these project models.
H. Herzog, 2016
41
8. Gasification-based power projects have a poor record. Fifteen years ago, the conventional wisdom was that a near zero emission coal-fired power plant would be based on coal gasification (IGCC) plus CCS. This paper reviewed many gasification projects proposed for the power sector, but only one was actually implemented, Kemper. While there may still be a role for IGCC in the future, the pendulum today has swung back to pulverized coal (PC) plants with either post-combustion or oxy-combustion capture. The primary reason gasification is in trouble in the power sector is that it has proven uncompetitive with PC plants. Until costs for IGCC can be brought more in line with PC, its future in the power sector will remain shaky. The innovative concept of poly-generation is based on gasification. Perhaps in the future that can be a path forward. However, it is not that attractive today in the U.S. because of low natural gas prices. Natural gas is the primary feedstock for the products that would be produced by poly-generation. As long as natural gas prices remain low, there will be low prices for the commodities it produces. As a result, it makes poly-generation less financially attractive. 9. Setting arbitrary time limits on projects generally has led to failure. There were two government programs that were set up that had strict time limits, ARRA in the US and the NER300 in the EU. These time limits essentially made the NER300 program a non-starter. In the US, FutureGen 2.0 stated they would have succeeded if given more time. Southern (Plant Barry) realized from the start that the timeline was going to be too tight for them, and immediately cancelled their project under the CCPI (funded by ARRA). A recurring theme is that CCS projects in the power sector are complex and have many moving parts. It takes time to address them in a rational manner. Programs that set arbitrary time limits are generally not helpful. In some cases these time limits can be very detrimental. The best example is FutureGen 2.0. “Ken Humphreys, chief executive of the FutureGen Industrial Alliance Inc., spelled out in testimony to the Illinois Pollution Control Board that major construction spending can't begin until the alliance secures a remaining $650 million in private capital. And investors won't commit financing under the cloud of uncertainty presented by the air permit challenge [brought by the Sierra Club]” (Energy Wire, 2014). The Sierra Club did not need to win the challenge to kill the project; all they needed to do was delay the project so it could not spend its ARRA funds by the deadline. 10. CCS projects that have shorter timelines have greater chances of success. We live in a dynamic world, so projects with long timelines can be subject to changes that adversely affect them. Politics change, as illustrated by the UK competition. Economics change, as illustrated by the dramatic drop in US natural gas prices over the past several years and the world oil price the past two years. The longer the timeline, the more risk and uncertainty a project may face. As a result, it may be wise for future CCS project demonstrations to have shorter timelines for development. Examples of successful CCS projects with relatively short development timelines include Boundary Dam and Quest. In both of these cases, an established company was in charge (SaskPower and Shell,
H. Herzog, 2016
42
respectively). The project took place on their existing industrial sites. They did not need to look outside for an equity partner (as in the case of TCEP). In general, here are some characteristics to help reduce a projects timeline:
• Develop smaller scale projects • Use brownfield sites • Minimize the technical risks (e.g., do the technology development at the pilot scale) • Work with government for a streamlined permitting process • Avoid complicated business arrangements
11. Stronger political support is needed for CCS. Unlike renewables, CCS does not have a strong constituency that can sway political support. There have been many examples of how this has adversely impacted CCS projects, including:
• Cancellation of the UK’s £1 billion competition • Forcing the EU’s NER300 to include renewable projects • The UK not supporting BP’s Peterhead (DF1) project • Germany not transposing the EU’s CCS Directive
Going forward, as new regulations and laws are put in force to reduce greenhouse gas emissions, politics will play an important role as to their impact on CCS. Therefore, it is important to have stronger political support for CCS going forward than there has been in the past. To gain political support, it is important to define the role of CCS as complementary to renewables and not in competition. As long as there is the perception among decision-makers that renewables can solve the climate issue by itself (as in Germany), it will be very difficult for CCS to progress. An “all of the above” strategy as stated by the Obama administration is more amenable to CCS. 12. All major CCS demonstration projects require a public outreach program.
One can only speculate on whether or not public acceptance will be an impediment to CCS going forward. There is just not enough past experience to extrapolate. This paper highlighted two projects that ran into public acceptance issues. However, those early projects did not do public outreach until it was too late. Projects that have adopted best practices with regard to public outreach have an excellent record. We have learned that a good public outreach program needs to be part of every major CCS project. Only time will tell if that will be sufficient.
H. Herzog, 2016
43
6. References AL.com, Southern Company pulls out of carbon capture project at Barry Steam Plant, Feb 23 (2010). http://blog.al.com/live/2010/02/southern_company_pulls_out_of.html Ashworth, Peta, Judith Bradbury, Sarah Wade, C.F.J. Ynke Feenstra, Sallie Greenberg, Gretchen Hund, and Thomas Mikunda, “What’s in store: Lessons from implementing CCS,” International Journal of Greenhouse Gas Control 9:402–409 (2012). Bashadi, S., "Using Auxiliary Gas Power for CCS Energy Needs in Retrofitted Coal Power Plants," M.I.T. Master’s Thesis, June (2010). http://sequestration.mit.edu/pdf/SarahBashadi_Thesis_June2010.pdf Bismarck Tribune, Basin shelves lignite's first carbon capture project, Dec 10 (2010). http://bismarcktribune.com/news/local/a5fb7ed8-0a1b-11e0-b0ea-001cc4c03286.html Business Wire, Leucadia Ceasing Development of Lake Charles Clean Energy Project, Sept 24 (2014). http://www.businesswire.com/news/home/20140924006203/en/Leucadia-Ceasing-Development-Lake-Charles-Clean-Energy Clark, V. "An analysis of how climate policies and the threat of stranded fossil fuel assets incentivize CCS deployment," M.I.T. Master’s Thesis, May (2015). EnergyWire, “FutureGen officials say Sierra Club complaint jeopardizes project,” August 18 (2014). http://midwestenergynews.com/2014/08/18/futuregen-officials-say-sierra-club-complaint-jeopardizes-project/ Examiner.com, “HECA is officially dead, Hydrogen Energy California withdraws permit application,” March 3 (2016). http://www.examiner.com/article/heca-is-officially-dead-hydrogen-energy-california-withdraws-permit-application Folger, Peter, Carbon Capture and Sequestration: Research, Development, and Demonstration at the U.S. Department of Energy, Congressional Research Service (2014). Gallucci, Maria, “Financial Shortfall at America's First CCS Plant Highlights Absence of Carbon Price,” Reuters.com, April 14 (2011). http://www.reuters.com/article/idUS375884024020110414 Gassnova, Pre-feasibility study on potential full-scale CCS projects in Norway (2015). https://www.regjeringen.no/contentassets/3652c303169e46e7815617adab685710/gassnovas-pre-feasibility-study.pdf GCCSI, The global status of CCS, Global CCS Institute, Melbourne, Australia (2013). GCCSI, The global status of CCS, Global CCS Institute, Melbourne, Australia (2014).
H. Herzog, 2016
44
GCCSI, The global status of CCS, Vol 2 Projects, Policy and Markets Global CCS Institute, Melbourne, Australia (2015). Gollakota, Sai and Scott McDonald, “Commercial-Scale CCS Project in Decatur, Illinois – Construction Status and Operational Plans for Demonstration,” Energy Procedia 63:5986 – 5993 (2014). Lacey, Stephen, “David Crane Exits NRG with a Warning”, Green Tech Media, January 08 (2016). http://www.greentechmedia.com/articles/read/david-crane-exits-nrg-with-a-warning Lupion, M. and H. Herzog, "NER300: Lessons learnt in attempting to secure CCS projects in Europe," International Journal of Greenhouse Gas Control, 19, pp 19-25, (2013). NCC (National Coal Council), Fossil Forward: Revitalizing CCS Bringing Scale and Speed to CCS Deployment (2015). Marshall, Christa, “FutureGen Alliance tosses in the towel”, Greenwire, January 22 (2016a). http://www.eenews.net/greenwire/stories/1060031055/feed Marshall, Christa, “Kemper plant delayed until 2nd half of year”, Greenwire, February 3 (2016b). http://www.eenews.net/greenwire/stories/1060031719/feed MIT, "The Future of Coal – Options for a Carbon Constrained World," MIT Interdisciplinary Report. March (2007). http://web.mit.edu/coal/ MIT, CCS On-Line Project Database (2016). http://sequestration.mit.edu/tools/projects/index.html NY Times, Utility Shelves Ambitious Plan to Limit Carbon, Jul 13 (2011). http://www.nytimes.com/2011/07/14/business/energy-environment/utility-shelves-plan-to-capture-carbon-dioxide.html?_r=2 Quiviger, G., "Building New Power Plants in a CO2 Constrained World: A Case Study from Norway on Gas-Fired Power Plants, Carbon Sequestration, and Politics," M.I.T. Master’s Thesis, (2001). Paxman, Jane, “Hydrogen Power (with CCS) at Peterhead,” presentation (2007). http://www.ccsassociation.org.uk/docs/2007/Monday%201415%20-%20Jane%20Paxman.pdf
Reiner, David M., “Learning through a portfolio of carbon capture and storage demonstration projects,” Nature Energy, 1 (2016). Royal Society of Chemistry, “BP pulls out of carbon capture plans”, May, 24 (2007). http://www.rsc.org/chemistryworld/News/2007/May/24050703.asp
Shell.com (2015). http://www.shell.com/media/news-and-media-releases/2015/shell-launches-quest-carbon-capture-and-storage-project.html#vanity-aHR0cDovL3d3dy5zaGVsbC5jb20vZ2xvYmFsL2Fib3V0c2hlbGwvaW52ZXN0b3IvbmV3cy1hbmQtbGlicmF
H. Herzog, 2016
45
yeS8yMDE1L3NoZWxsLWxhdW5jaGVzLXF1ZXN0LWNhcmJvbi1jYXB0dXJlLWFuZC1zdG9yYWdlLXByb2plY3QuaHRtbA Swartz, Kristi E., “Carbon capture projects get $160M federal infusion,” E&E News, December 21 (2015). http://www.eenews.net/energywire/stories/1060029815 Wikipedia (2016). https://en.wikipedia.org/wiki/Gro_Harlem_Brundtland Zeroco2.no (2016). http://www.zeroco2.no/projects/support-mechanisme/low-emission-technology-demonstration-fund ZeroGen, ZeroGen IGCC with CCS A Case History, The State of Queensland Department of Employment, Economic Development and Innovation (2012).