Embed Size (px)
Citation preview

Rangan Banerjee
Forbes Marshall Chair Professor
Department of Energy Science and Engineering
IIT Bombay
Lessons from Green Finance in India
CEP Workshop on Green Finance, IIT Bombay, April 25-26, 2013
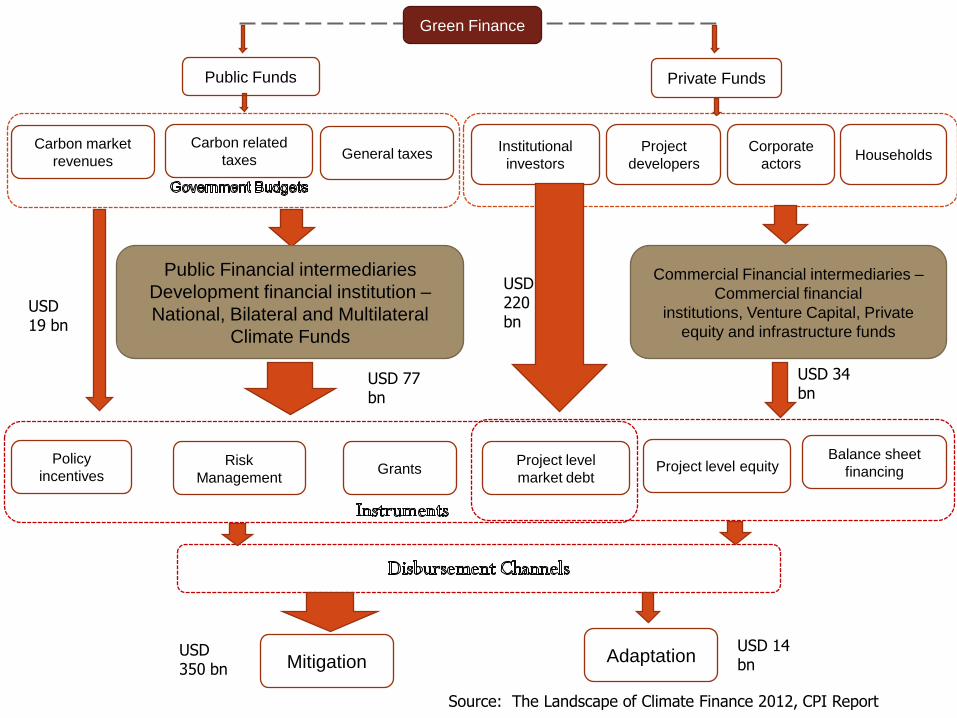
Public Financial intermediaries
Development financial institution –
National, Bilateral and Multilateral
Climate Funds
USD 77 bn
USD 19 bn
General taxesCarbon related
taxesCarbon market
revenuesCorporate
actors
Private Funds
Project
developers
Institutional
investorsHouseholds
Commercial Financial intermediaries –
Commercial financial
institutions, Venture Capital, Private
equity and infrastructure funds
USD 34 bn
USD 220 bn
Risk
Management
Policy
incentivesGrants Project level equity
Balance sheet
financingProject level
market debt
Mitigation AdaptationUSD 14 bn
USD 350 bn
Source: The Landscape of Climate Finance 2012, CPI Report
Public Funds
Green Finance

3
Green Finance
Mitigation Adaptation
Renewable
Energy
DSM
Smart Grids
Energy
Efficiency
CCS
Energy Transport Housing Forestry
Wind Power Biomass
Biofuels
Solar PV Solar Thermal Tidal / Wave Small Hydro
Green Buildings
Forestry Energy Housing
Green Finance by project type
Centralised/Distributed
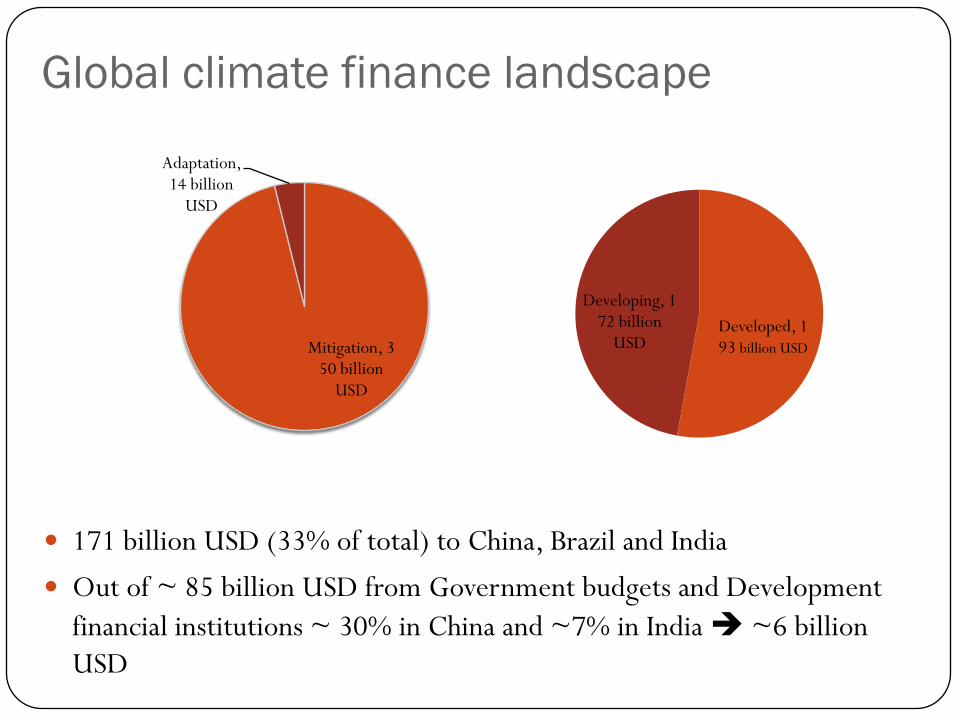
Global climate finance landscape
Mitigation, 350 billion
USD
Adaptation, 14 billion
USD
Developed, 193 billion USD
Developing, 172 billion
USD
171 billion USD (33% of total) to China, Brazil and India
Out of ~ 85 billion USD from Government budgets and Development
financial institutions ~ 30% in China and ~7% in India ~6 billion
USD

Cost Of Finance – India and US
5Source: Nelson et al, 2012
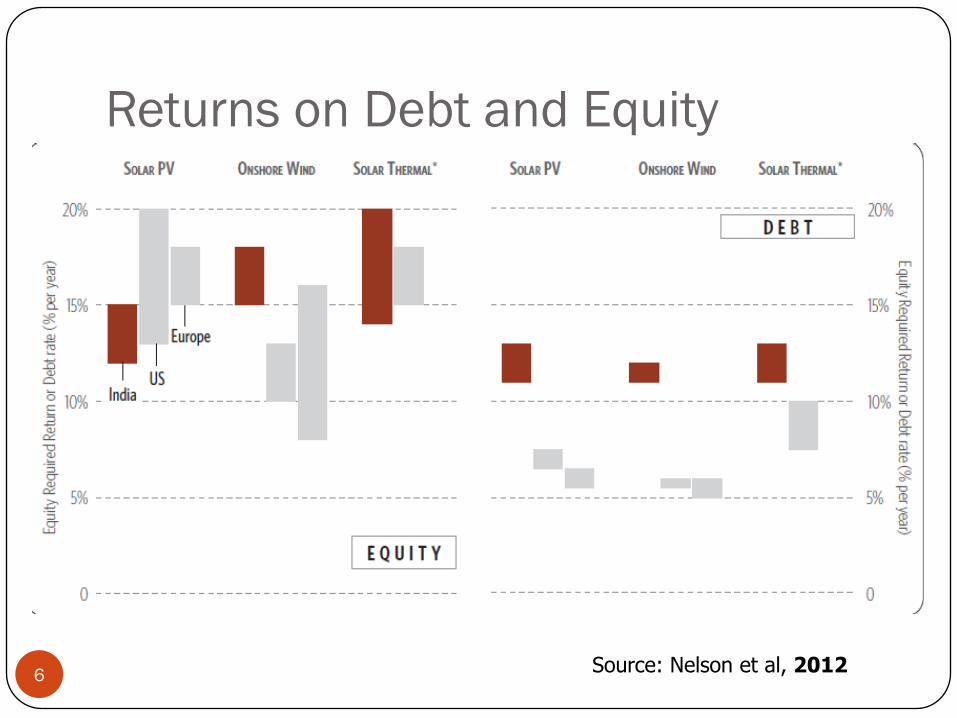
Returns on Debt and Equity
6Source: Nelson et al, 2012

Impact of Debt and Equity
7Source: Nelson et al, 2012

Comparison of Renewable Projects
8 Source: Nelson et al, 2012
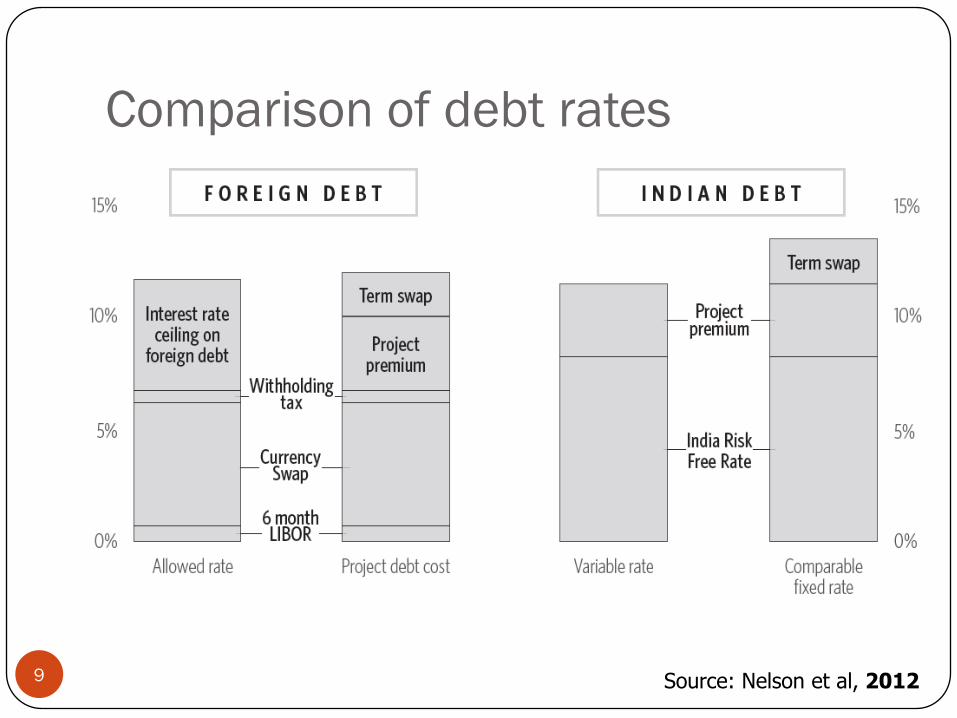
Comparison of debt rates
9 Source: Nelson et al, 2012

10Source: Nelson et al, 2012
Debt : Summary
CO
ST
AN
D T
ER
MS
High general Indian interest rate environment
Longer tenor debt is generally unavailable
Fixed interest rate debt is difficult to find
Debt is usually offered on a relationship basis
Shortage of debt
AV
AIL
AB
ILIT
Y
Bank place limits
Renewable energy debt is often included within power or
energy sector limits
Some banks are not lending to renewable energy
Limits on foreign debt
Technology risk
State-level policy
Fin
an
cia
l
Mark
et
Re
ne
wa
ble
Sp
ecific
Fo
reig
n
Inve
stm
en
t
Te
ch
.
Sp
ecific
Sta
te.
Sp
ecific
C L C L C L C L C L
Low
Medium
High
Very High
C Current
L Long term

11
CO
ST
AN
D
TE
RM
S
Equity returns appear reasonable for good projects
Technology maturity and strategic positioning affects
required project returns
AV
AIL
AB
ILIT
Y
Equity is generally available
Equity from foreign investors is also available
Equity availability is heavily skewed towards a few states
Lack of debt may reduce available equity in the medium
term
Equity : Summary
Source: Nelson et al, 2012
Fin
an
cia
l
Ma
rke
t
Re
ne
wa
ble
Sp
ecific
Fo
reig
n
Inve
stm
en
t
Te
ch
.
Sp
ecific
Sta
te
Sp
ecific
C L C L C L C L C L
Low
Medium
High
Very High
C Current
L Long term

12 Source: Nelson et al, 2012
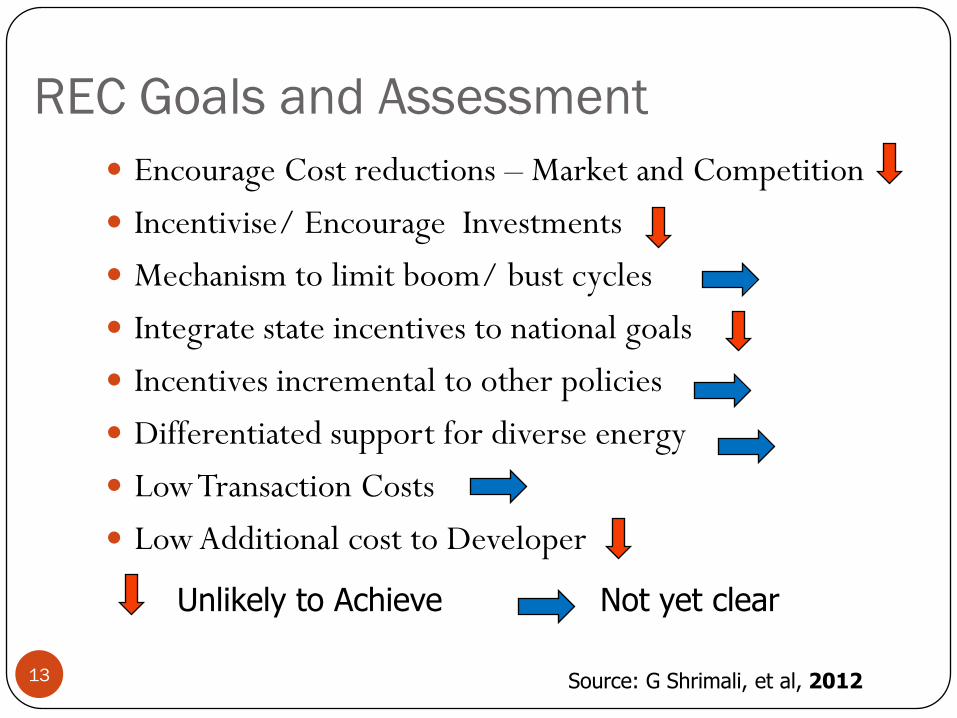
REC Goals and Assessment
13
Encourage Cost reductions – Market and Competition
Incentivise/ Encourage Investments
Mechanism to limit boom/ bust cycles
Integrate state incentives to national goals
Incentives incremental to other policies
Differentiated support for diverse energy
Low Transaction Costs
Low Additional cost to Developer
Unlikely to Achieve Not yet clear
Source: G Shrimali, et al, 2012

14Source: G Shrimali, et al, 2012

15Source: G Shrimali, et al, 2011

Grid connected power case studies
Project Technology Size
(MW)
Estimated
cost
Financing Status
Tuppadahalli
wind park,
Karnataka
Wind power 56.1 INR 339.4
Crore
CDM, Domestic
debt (11.8%, 14
years), IDFC -60%
Completed
construction
Dahanu solar
PV project,
Rajasthan
Solar PV 40 INR 560
Crore
Debt financing by
U.S. EXIM bank and
ADB for tenors of
16.5 and 17.5 years;
12%
Operational
LANCO’s
Chinnu solar
thermal
project
Solar Thermal 100 INR 1800
Crore
Domestic debt,
11%, 13-14 years,
Axis; JNNSM
Request for
Extension
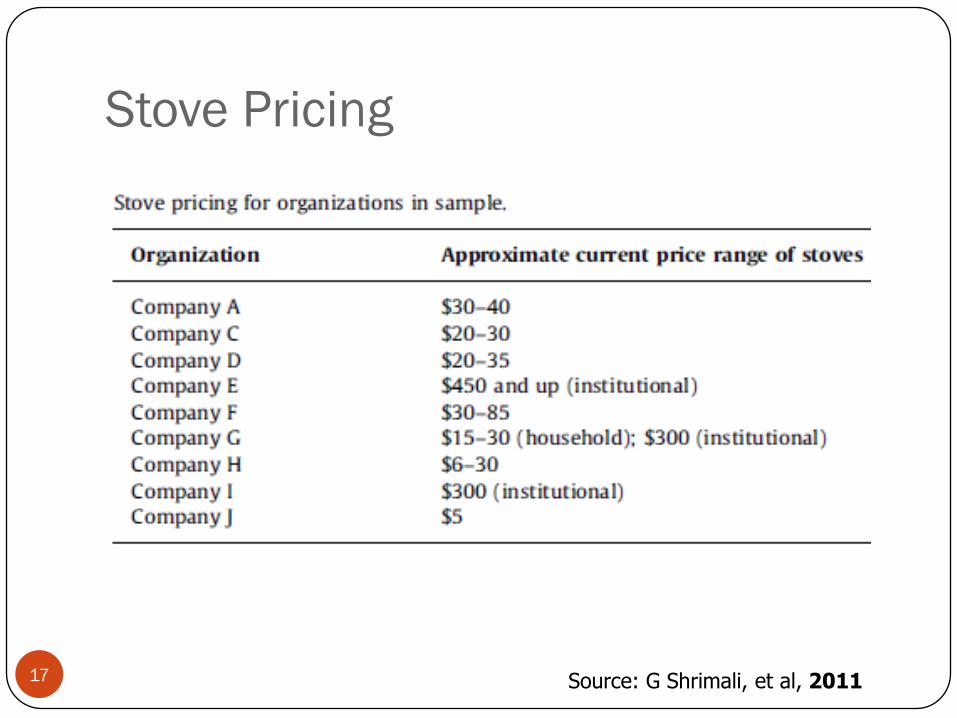
Stove Pricing
17 Source: G Shrimali, et al, 2011
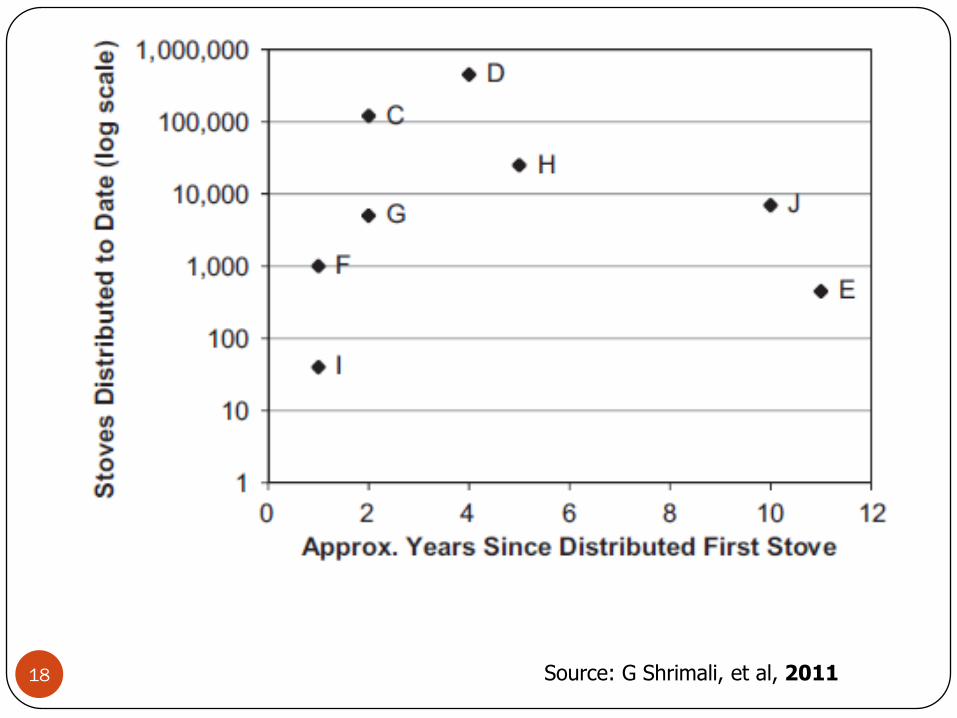
18 Source: G Shrimali, et al, 2011

19Source: G Shrimali, et al, 2011

20 Source: G Shrimali, et al, 2011

Case Study : Capacitor Leasing
21 Source: Taylor et, al, 2008

DSM: Financing through Utility Bill
22 Source: BESCOM, 2006
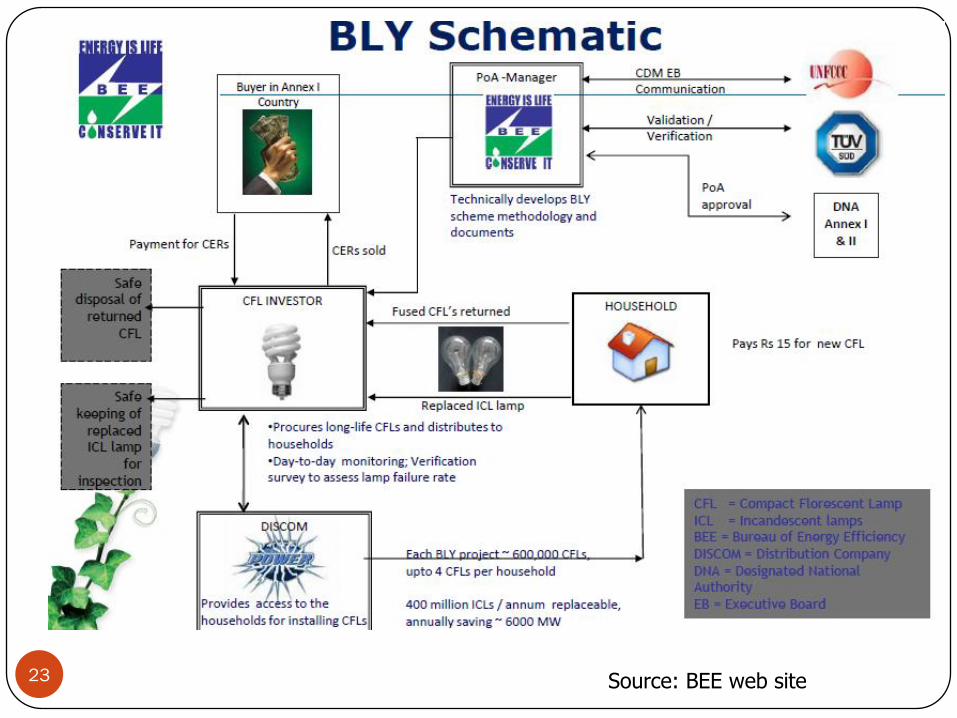
23 Source: BEE web site

Bachat lamp yojana
Dependence on the carbon market ($12/ tonne initial CER
price – reduced to 5$/ tonne)
Payments to CFL manufacturers and/or utilities take 3-4 years
Kerala, Andhra Pradesh, Karnataka, Punjab and Delhi
Target 400 million bulbs
Actual about 25 million bulbs
Lack of investors
24

25
Decentralized
Renewable
Energy: Biomass
and Small Hydro
Solar Home
Systems
Solar Lanterns Energy-Efficient
Cookstoves
Potential Market
/yr
Rs 94.06 billion Rs 1.26 billion Rs 855 million Rs 1.11 billion
Avg Price IRs 8 to 13 /kWh
(B)
INR 2 to 2.5 /kWh
(H)
Rs 7,000 - 20,000 Rs500 -1,600 Rs 150 -1,100
Competitive
Advantage
operational
reliability , low
upfront cost.
Customised
solution.
Kerosene
replacement
Reduced fuel
costs; health
benefits
Business Model B: Company-
owned minigrids;
electricity priced to
existing fuel
expenditure levels.
H:using existing
grid infrastructure;
paid at
government-
tariffs.
Sold on credit, in
partnership with
local banks. Users
typically pay 10 to
25 percent upfront
and the rest in
installments.
Bulk sales to
corporate, NGO,
and (MFI)
partners; sold
directly to
consumers
through local
retailers.
Sold through
multiproducts rural
distributors and
retailers;
partnerships with
MFIs and NGOs.
Source:IFMR- WRI, 2010

Selco Case study
26
For profit company – Solar Home
systems – started 1996 – sold about
100,000 SHS
90% of products – credit schemes
Partnership with 9 banks – interest rates
between 12-17%
Financing Institutions pay 85% of the
amount- monthly payments of Rs 300-
400 over a period of 5 years
Financing/ repayment options –
tailormade to end users – paddy farmers
– repayment schedule based on crop
cycle, street vendors – daily payments –
Rs 10
Funding from REEP – meet margin
amount for poor customers, reduce
interest rate
Source: SELCO, 2011

DESI Power
27
Biomass based power solutions – Bihar- 25 kW to 100 kW
Local distributors – decide pricing
Registered under CDM and sold CERs to Swiss buyer
MNRE funds, Promoters Equity, ICICI Loan
Monthly rate based on no of bulbs / loads, Circuit breaker to limit consumption
Irrigation pump users Rs 50/ hour, Household Rs 120- 150 per month
Underground trunk wiring-distribution
Enabling micro-enterprises –battery charging station, flour mill, workshop etc
Tie up with Telecom towers – increasing capacity factor

Husk Power
28
Initial funding – prize money
30-100 kW – biomass gasifiers- based on rice husk
Energy audit of households
Focus on household demand for lighting
Lower production, operating costs – use of bamboo, asbestos
Overhead pole wiring
Directly reach end user
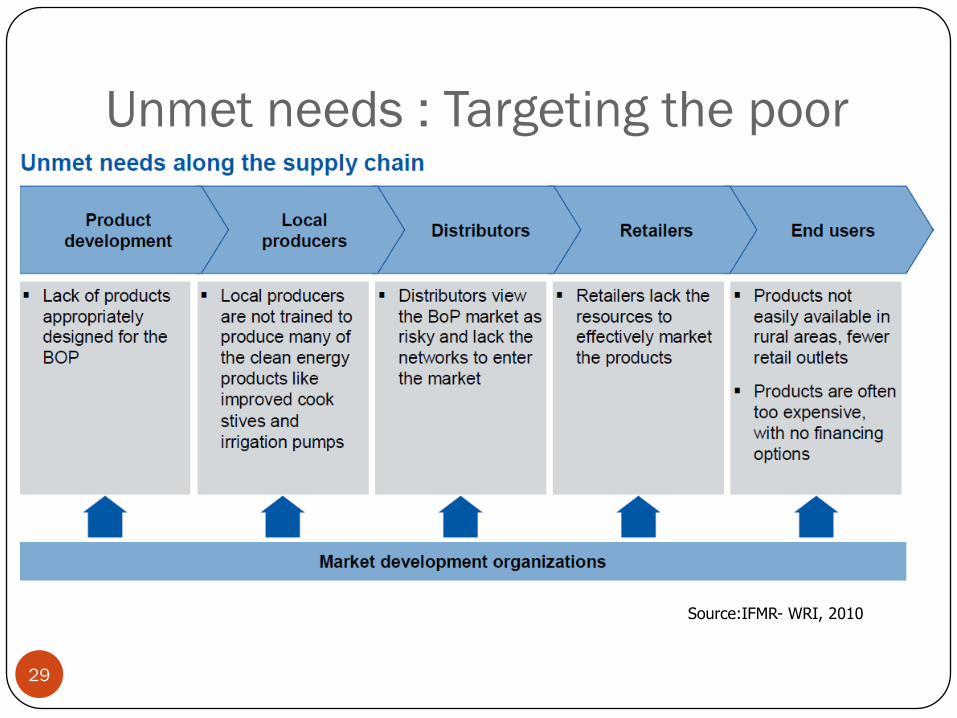
Unmet needs : Targeting the poor
29
Source:IFMR- WRI, 2010

Solar Tower
30
E-Solar – Acme partnership
First grid connected plant in India 2011
2.5 MW out of 10 MW installed Bikaner Rajasthan
Double-axis software-mirror tracking system Lightweight, small size 1 m2 flat mirrors
Plant output not stabilised – insolation, auxiliary consumption
http://acme.in/solar/thermal.html

National Solar Thermal Power Facility – Consortium supported
by MNRE and led by IIT Bombay
Thermal
Storage
Solar Field
Expansion
Vessel
Heat
Exchanger
Generator
Condenser
Turbine
PumpPump
Cooling
Water
Circuit
Water/
Steam
Loop
Thermic
Oil Loop
CLFR
Direct
Steam
Schematic of 1 MW Solar Power PlantSimulator snapshot
Parabolic Trough Solar FieldLinear Fresnel Reflector Solar Field at Gwalpahari site
Consortium Members
KIE Solatherm
31

Summary
32
Problem with debt in India– high interest rates, variable, short tenor (adds 20-28% to cost of project)
Technology uncertainty, Data uncertainty – e.g JNNSM
Policy Mechanism – REC not having desired effect
Innovative business, technology models – cookstoves – large untapped market
Efficiency – CFL – BLY – dependence on CER market, not achieving the scale planned
Untapped – Bottom of Pyramid potential – innovative financing targettedto local needs, end –users
Technology Development- Consortia approaches, Venture capital-Financing early technology

References
33
G Shrimali, et al,Improved stoves in India: A study of sustainable business models Energy Policy, Volume 39, Issue 12, December 2011, Pages 7543-7556
Nelson et al, 2012 Meeting India’s Renewable Energy Targets: The Financing Challenge, Climate Policy Initiative, December 2012
G Shrimali, et al, Falling Short: An Evaluation of the Indian Renewable Energy Certificate Market,Climate Policy Initiative, December 2012
ECO-II Project Design Document, BESCOM Efficient Lighting Programme, 2006
Taylor et al, Financing Energy Efficiency, Lessons from Brazil, China, India and Beyond, World Bank, Washington D.C., USA, 2008
http://www.beeindia.in/schemes/documents/bly/presentations/Presentation-VandanaThakur.pdf (BEE web site)
Case Study: SELCO: Solar Lighting for the Poor- UNDP, 2011
IFMR-WRI-Power to the People, September 2010
http://acme.in/solar/thermal.html