Embed Size (px)
Citation preview
CASE STUDY | OCTOBER 2016
Using Information as a Driver of Change: Lessons from FinScope South AfricaCASE STUDY SERIES: THE ART OF FINANCIAL MARKET FACILITATION
1
Foreword
Since January 1949, when U.S. President Truman speech ushered in the modern era of international development, successive generations of theorists and practitioners have wrestled to determine the best means to deliver international development assistance to the world’s poor.
Progress has followed a steady trajectory with the number of people living in extreme poverty falling from 1.99 billion in 1981 to 896 million in 2012. In spite of such progress, many questioned the prevailing relief-based approach to poverty reduction. The direct delivery by international aid agencies of welfare-enhancing goods and services to the poor would, they argued, lead to a temporary spike in poverty impact, but leave little behind once priorities changed or the money ran out.
It is against this backdrop that the ‘making markets work for the poor’ approach was born. This approach – also known as ‘M4P’, ‘market systems development’ or ‘market facilitation’ – gathered momentum during the late 1990s and 2000s. In July 2008, the Springfield Centre ran its inaugural ‘Making Markets Work’ training course in Glasgow, Scotland. In September 2015, the World Bank’s Consultative Group for the Assistance of the Poor (CGAP) issued: ‘A Markets Systems Approach to Financial Inclusion: Guideline for Funders.’
Today, ‘making markets work for the poor’ is a rela-tively well-understood concept. It focuses on harnessing the power of market systems, including their full range of participants – from suppliers and consumers to rule-mak-ers and support services providers – to deliver benefits for poor men and women on a lasting basis. It seeks to achieve and maintain a careful balance between public and private sector interests, between the bottom-line and the bottom of the pyramid.
To do this, M4P programmes work closely with market players to understand market dynamics and test wheth-er or not necessary behaviour changes can endure (see Adopt, Adapt below). At other times, M4P programmes work with a diversity of players to encourage behaviour and practice changes to deepen and broaden the market system responses and improve the functioning of support systems (see Expand, Respond below).
None the less, evidence from the field about how to apply the market facilitation approach in practice remains fairly limited and is often poorly documented. Despite some good examples,1 there is a general dearth of mate-rial that captures which interventions work, which do not, and why. Accordingly, there remain important unanswered questions, such as: How to balance pressure for short-term results with slow-burn market development activities? What
does effective communication and measurement look like, and what can it achieve? What attributes do successful mar-ket facilitators possess? How does crowding in and replica-tion take place in practice? How and when do market facili-tators look to exit? How is it best to select, engage and work with partners? What to measure, when and why?
This case study process emerged as a response to this challenge – a desire to learn more about the art of market facilitation in the field. In June 2015, FSD Afri-ca commissioned the Springfield Centre to produce: a) one comprehensive case study of FSD Kenya – a financial market facilitation agency in Nairobi, Kenya; and b) six mini-case studies of financial market facilitation interven-tions from the wider FSD Network, by the FinMark Trust, FSD Kenya, FSD Tanzania and FSD Zambia.
This particular case study looks at the essential role FinMark Trust has played in the initiation, development and continuing conduct of FinScope in South Africa. FinScope, a research tool developed by FinMark Trust, is a nationally representative survey of how individuals source their income and manage their financial lives in South Africa. The FinScope survey arose in response to the dearth of data on financial inclusion in South Afri-ca and has effectively served to fill this information gap ever since. While changes in financial inclusion cannot be attributed wholly to the survey, FinScope made ‘access to financial services’ a legitimate objective, and initiated a high-profile discussion about financial inclusion.
Taken together, we hope that these case studies con-tribute useful learning to the theorists and practitioners that work in the field of ‘making markets work for the poor’, and beyond. For FSD Africa, the case study materi-al will be put to immediate use in the FSD Academy M4P course – a five-day training programme for staff from the FSD Network and beyond. We warmly invite others to use and share them as appropriate.
Throughout, this process has benefitted greatly from input by FSD Network staff, as well as colleagues at CGAP – Barbara Scola and Matthew Soursourian, and at DCED – Jim Tanburn. We’re also extremely grateful to the case study authors – Alan Gibson, David Elliott and Diane Johnson of the Springfield Centre. The views included in the case studies are their own.
We hope that you find them engaging and informative, and that they refine and strengthen our ongoing effort to reduce poverty by making markets work for the poor.
Joe HuxleyCo-ordinator, Strategic Partnerships & OpportunitiesFSD Africa
1. “The Operational Guide for the Making Markets for the Poor Approach”, 2014. SDC, DFID, Springfield Centre
Contents
1 Introduction 3 2 FinScope: examining the extent of market system change 5 2.1 Adopt: has the initial pro-poor innovation been taken up and is it viable? 5 2.2 Adapt – has the market partner continued the innovation without further aid-funded support? 5 2.3 Expand – has the innovation spread across the system? 7 2.4. Respond – has the innovation stimulated wider changes within the system? 8 3. FMT: Strategy and approach 9 3.1 Strategy 9 3.2 Diagnosis 9 3.3 Vision 9 3.4 Intervention 9 3.5 Measurement 10 3.6 Lessons in facilitating systemic change 10
Front cover image: © FinMark Trust
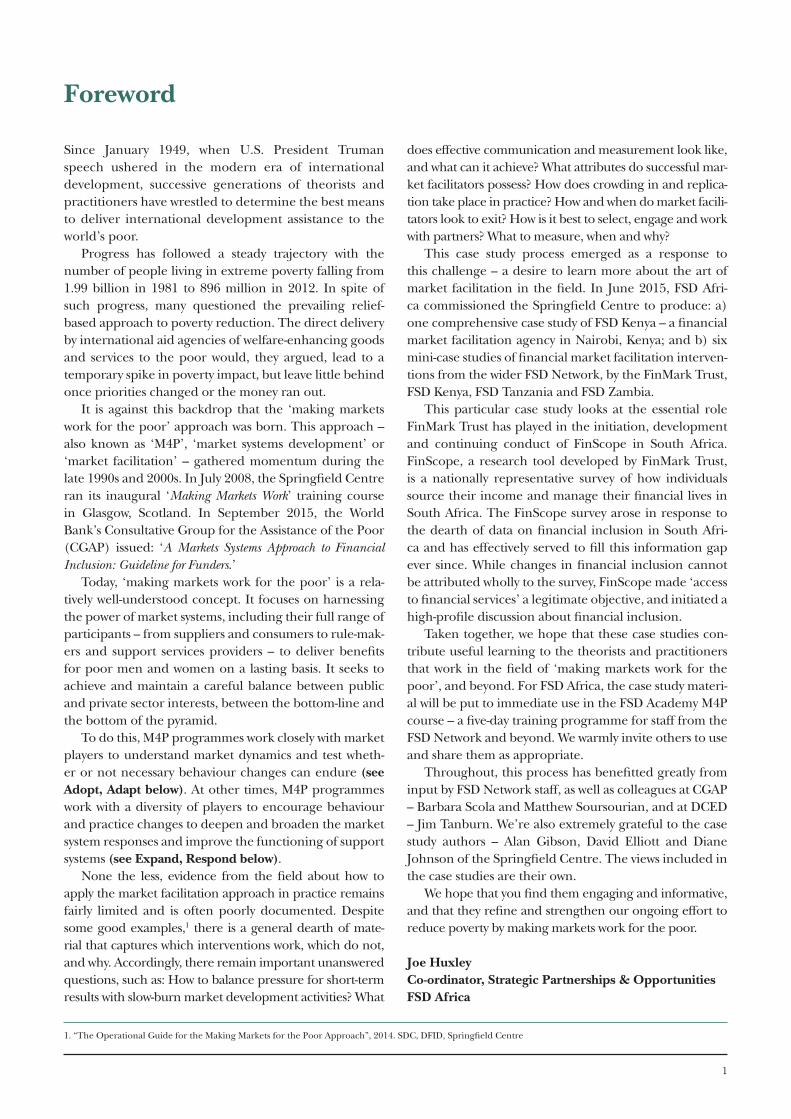
AAER: Systemic Change Framework
The AAER framework aims to codify the process of systemic change. It helps us to recognise market system evolution and the role of development actors, such as FSDs, within it. To ensure coherence and the emergence of common facilitation lessons across the six mini-cases studies, the AAER Systemic Change Framework is used as the main organising structure. However, it can only be a guide. Market system change is messy – hard to instigate, detect and attribute to specific actors. Though we attempt to use the framework as an organising the narrative, there are a number of exceptions.
ADOPT
ADAPT
EXPAND
RESPOND
Piloting phase Crowding-in phase
4. Non-competing players adjust their own practices in reaction to the presence of the pro-poor change (supporting functions and rules)
3. Similar or competing players copy the pro-poor change or add diversity by offering variants of it
2. Initial partner(s) has ‘invested’ in the pro-poor change adopted independently of programme support
1. Partner(s) takes up a pro-poor change that is viable and has concrete plans to continiue it in the future
3
1 Introduction
This section outlines what FinScope2 is and why it is rele-vant to financial inclusion in South Africa.
‘Financial services were emerging as a hot topic in South Africa in 2002. In the context of a previously divided society, more inclusive financial services were seen as essential to promote mainstreaming of poor (especially black) people. With some 39% of the over 16 years adult population holding a bank account, access was a major issue. The industry was characterised by a number of features:
– Turmoil and (slight) retreat: the micro-lending boom in the late-1990s ended in disaster with a tightening of regulations, the collapse of one major bank and the forced merger of another. Following this, major banks were more reluctant to take risks and innovate to develop new products for low-income groups. In-deed, the gradual rise in access to services witnessed from 1994 to 2000 reversed in 2001-2002.
– Domination by a small number of formal sector play-ers: increasing consolidation meant that there were only four main banks, all listed on the stock market. Unlike in other African countries, there had never been a substantial not-for-profit microfinance move-ment in South Africa although indigenous stokvels3 were widespread.
– A growing political/consumer campaign: the voice of the Financial Services Campaign Coalition had been heard with increasing volume and regularity since its formation in 2000. By 2002, their nationwide Red October campaign of street protests outside banks had received massive publicity and generated considerable political support.’4
The FinMark Trust (FMT) was established in 2002 as an independent trust at the instigation of DFID with the purpose of ‘making financial markets work for the poor’.5 In August of the same year, the National Economic Devel-opment and Labour Council (NEDLAC), a multi-stake-holder dialogue forum on social, economic and labour policy, held a Financial Sector Summit to discuss a trans-formation charter in terms of the Broad-based Black Economic Empowerment Act. The South Africa Finan-cial Sector Charter came into effect in January 2004 as a voluntary commitment for financial service providers to: ‘actively promote a transformed, vibrant and globally com-
petitive financial sector that reflects the demographics of South Africa, and which contributes to the establishment of an equi-table society by providing accessible financial services to black people and by directing investment into targeted sectors of the economy.’ 6
FinScope, a research tool developed by FinMark Trust, is a nationally representative survey of how indi-viduals source their income and manage their financial lives in South Africa. It emerged in the context of the Financial Sector Charter and the politicisation of the issue of financial access. The obligations of the Charter meant that financial service providers needed data that was virtually non-existent at the time. ‘The information gap regarding low-income groups and financial services was damaging in two main ways: (a) the debate over public actions was taking place in an information vacuum and (b) the banks didn’t have the information base to allow growth into new mar-kets.’ 7 Existing consumer surveys, such as the All Media Products Survey (AMPS), were not focused on financial services specifically, and consequently were insufficient-ly detailed.
The FinScope survey was piloted in 2002 with the objective to increase evidence-based policy and decision making in the financial sector. The survey measured the levels of access to and uptake of financial products (both formal and informal) across income ranges and other demographics. The objectives and the content of FinScope surveys, in South Africa and elsewhere, have widened over time to reflect financial market develop-ment and to incorporate analysis of the cultural and atti-tudinal factors influencing the financial behaviour and needs of the population.8
2. There are two types of FinScope: a consumer and MSME survey. This case study focuses on the consumer survey. 3. Stokvel is an Afrikaans term for an informal savings group.4. A Gibson; Developing Financial Service Markets for the Poor; FinMark South Africa; Nov 2006.5. www.finmark.org.za 6. www.fscharter.co.za 7. A Gibson; Developing Financial Service Markets for the Poor; FinMark South Africa; Nov 2006.8. OPM Questionnaire Study 2012.
“More inclusive financial services
were seen as essential to promote
mainstreaming of poor people”
4
Case Study Series: The Art of Financial Market Facilitation
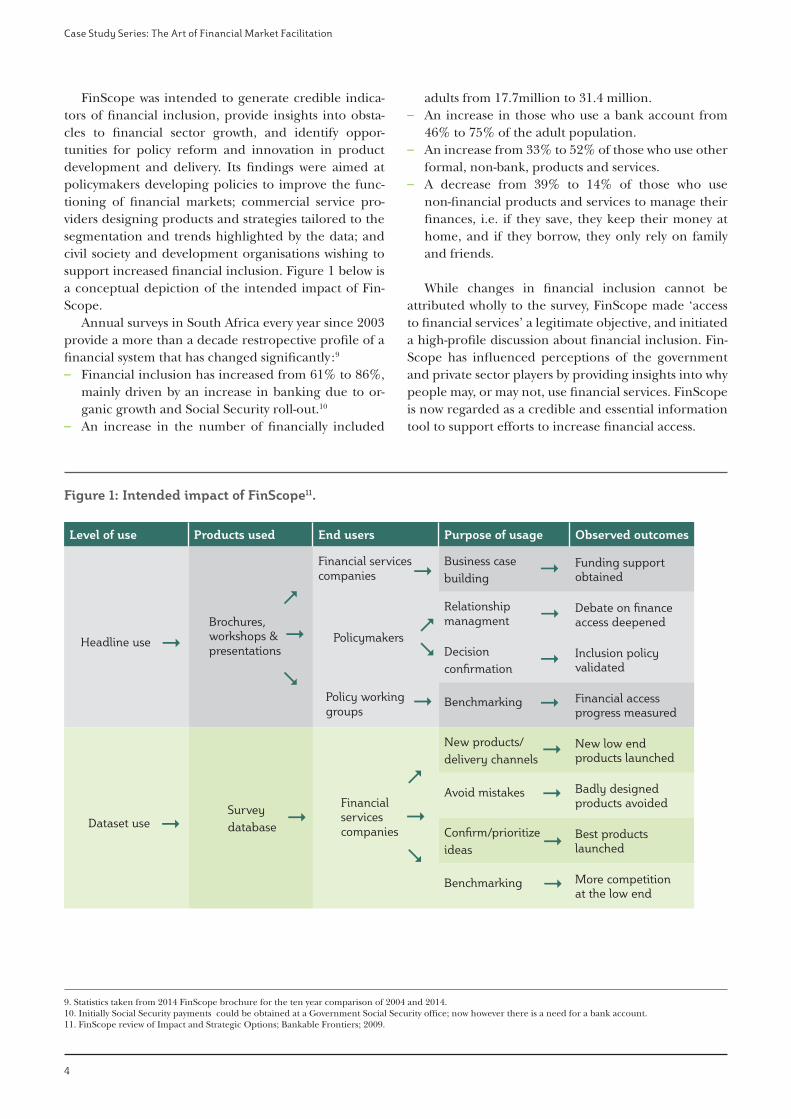
FinScope was intended to generate credible indica-tors of financial inclusion, provide insights into obsta-cles to financial sector growth, and identify oppor-tunities for policy reform and innovation in product development and delivery. Its findings were aimed at policymakers developing policies to improve the func-tioning of financial markets; commercial service pro-viders designing products and strategies tailored to the segmentation and trends highlighted by the data; and civil society and development organisations wishing to support increased financial inclusion. Figure 1 below is a conceptual depiction of the intended impact of Fin-Scope.
Annual surveys in South Africa every year since 2003 provide a more than a decade restropective profile of a financial system that has changed significantly :9
– Financial inclusion has increased from 61% to 86%, mainly driven by an increase in banking due to or-ganic growth and Social Security roll-out.10
– An increase in the number of financially included
adults from 17.7million to 31.4 million. – An increase in those who use a bank account from
46% to 75% of the adult population. – An increase from 33% to 52% of those who use other
formal, non-bank, products and services. – A decrease from 39% to 14% of those who use
non-financial products and services to manage their finances, i.e. if they save, they keep their money at home, and if they borrow, they only rely on family and friends.
While changes in financial inclusion cannot be attributed wholly to the survey, FinScope made ‘access to financial services’ a legitimate objective, and initiated a high-profile discussion about financial inclusion. Fin-Scope has influenced perceptions of the government and private sector players by providing insights into why people may, or may not, use financial services. FinScope is now regarded as a credible and essential information tool to support efforts to increase financial access.
9. Statistics taken from 2014 FinScope brochure for the ten year comparison of 2004 and 2014. 10. Initially Social Security payments could be obtained at a Government Social Security office; now however there is a need for a bank account.11. FinScope review of Impact and Strategic Options; Bankable Frontiers; 2009.
Figure 1: Intended impact of FinScope11.
Level of use Products used End users Purpose of usage Observed outcomes
Headline use "Brochures, workshops & presentations
"
Financial services companies "
Business case building "
Funding support obtained
Policymakers
Relationship managment "
Debate on finance access deepened
Decision confirmation "
Inclusion policy validated
Policy working groups
" Benchmarking " Financial access progress measured
Dataset use "Survey database "
Financial services companies
"
New products/ delivery channels "
New low end products launched
Avoid mistakes " Badly designed products avoided
Confirm/prioritize ideas "
Best products launched
Benchmarking " More competition at the low end
&(
&
&
(
(
5
FinScope, from FinMark Trust – Using information as a driver of change
2 FinScope: examining the extent of market system change
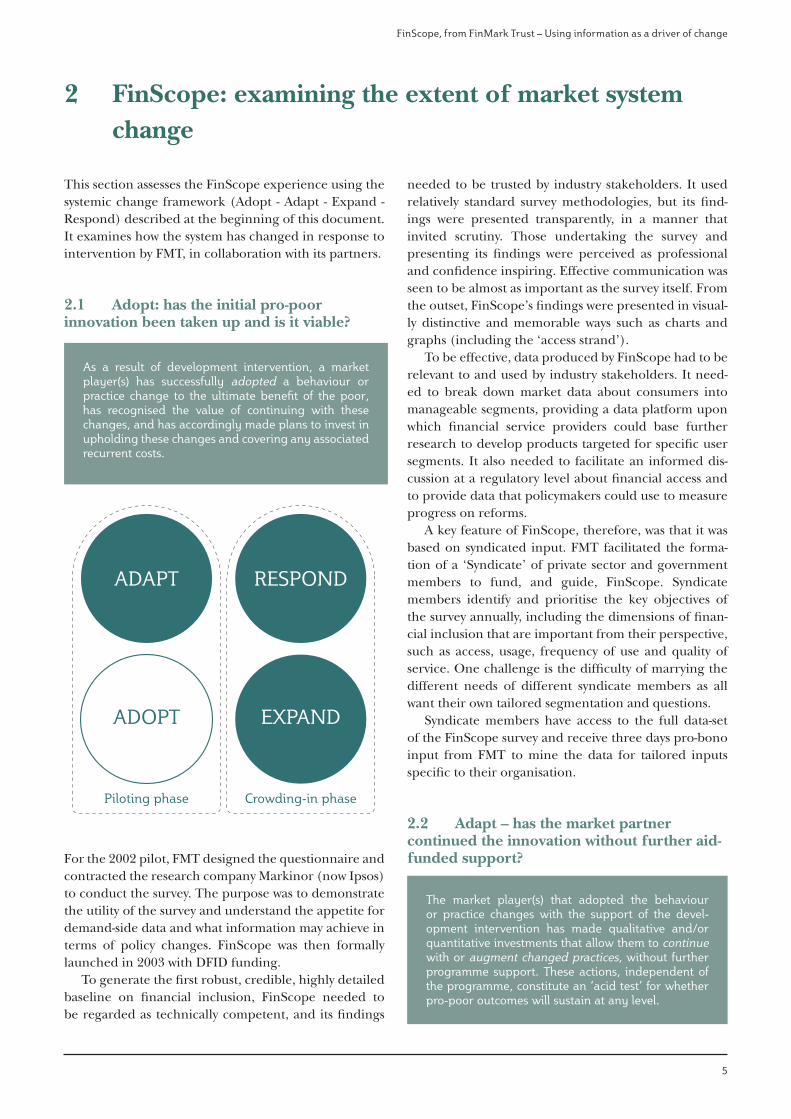
This section assesses the FinScope experience using the systemic change framework (Adopt - Adapt - Expand - Respond) described at the beginning of this document. It examines how the system has changed in response to intervention by FMT, in collaboration with its partners.
2.1 Adopt: has the initial pro-poor innovation been taken up and is it viable?
As a result of development intervention, a market player(s) has successfully adopted a behaviour or practice change to the ultimate benefit of the poor, has recognised the value of continuing with these changes, and has accordingly made plans to invest in upholding these changes and covering any associated recurrent costs.
Piloting phase Crowding-in phase
ADOPT
ADAPT
EXPAND
RESPOND
For the 2002 pilot, FMT designed the questionnaire and contracted the research company Markinor (now Ipsos) to conduct the survey. The purpose was to demonstrate the utility of the survey and understand the appetite for demand-side data and what information may achieve in terms of policy changes. FinScope was then formally launched in 2003 with DFID funding.
To generate the first robust, credible, highly detailed baseline on financial inclusion, FinScope needed to be regarded as technically competent, and its findings
needed to be trusted by industry stakeholders. It used relatively standard survey methodologies, but its find-ings were presented transparently, in a manner that invited scrutiny. Those undertaking the survey and presenting its findings were perceived as professional and confidence inspiring. Effective communication was seen to be almost as important as the survey itself. From the outset, FinScope’s findings were presented in visual-ly distinctive and memorable ways such as charts and graphs (including the ‘access strand’).
To be effective, data produced by FinScope had to be relevant to and used by industry stakeholders. It need-ed to break down market data about consumers into manageable segments, providing a data platform upon which financial service providers could base further research to develop products targeted for specific user segments. It also needed to facilitate an informed dis-cussion at a regulatory level about financial access and to provide data that policymakers could use to measure progress on reforms.
A key feature of FinScope, therefore, was that it was based on syndicated input. FMT facilitated the forma-tion of a ‘Syndicate’ of private sector and government members to fund, and guide, FinScope. Syndicate members identify and prioritise the key objectives of the survey annually, including the dimensions of finan-cial inclusion that are important from their perspective, such as access, usage, frequency of use and quality of service. One challenge is the difficulty of marrying the different needs of different syndicate members as all want their own tailored segmentation and questions.
Syndicate members have access to the full data-set of the FinScope survey and receive three days pro-bono input from FMT to mine the data for tailored inputs specific to their organisation.
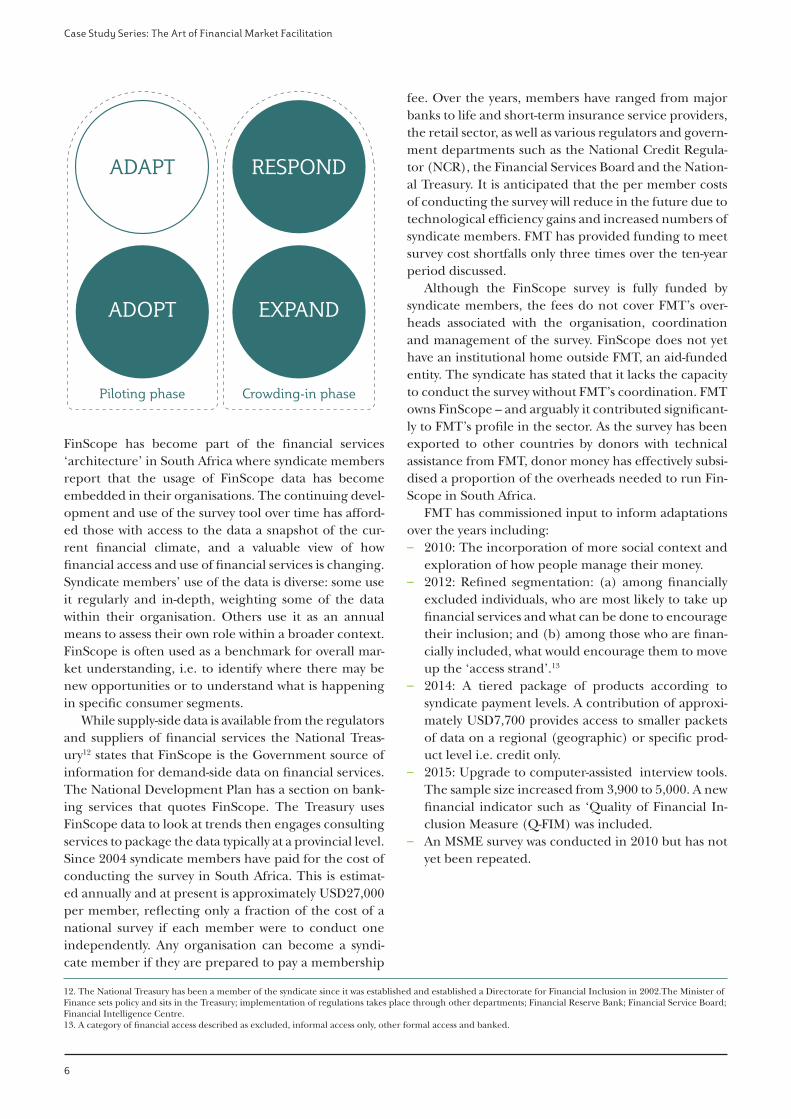
2.2 Adapt – has the market partner continued the innovation without further aid-funded support?
The market player(s) that adopted the behaviour or practice changes with the support of the devel-opment intervention has made qualitative and/or quantitative investments that allow them to continue with or augment changed practices, without further programme support. These actions, independent of the programme, constitute an ‘acid test’ for whether pro-poor outcomes will sustain at any level.
6
Case Study Series: The Art of Financial Market Facilitation
12. The National Treasury has been a member of the syndicate since it was established and established a Directorate for Financial Inclusion in 2002.The Minister of Finance sets policy and sits in the Treasury; implementation of regulations takes place through other departments; Financial Reserve Bank; Financial Service Board; Financial Intelligence Centre. 13. A category of financial access described as excluded, informal access only, other formal access and banked.
Piloting phase Crowding-in phase
ADOPT
ADAPT
EXPAND
RESPOND
FinScope has become part of the financial services ‘architecture’ in South Africa where syndicate members report that the usage of FinScope data has become embedded in their organisations. The continuing devel-opment and use of the survey tool over time has afford-ed those with access to the data a snapshot of the cur-rent financial climate, and a valuable view of how financial access and use of financial services is changing. Syndicate members’ use of the data is diverse: some use it regularly and in-depth, weighting some of the data within their organisation. Others use it as an annual means to assess their own role within a broader context. FinScope is often used as a benchmark for overall mar-ket understanding, i.e. to identify where there may be new opportunities or to understand what is happening in specific consumer segments.
While supply-side data is available from the regulators and suppliers of financial services the National Treas-ury12 states that FinScope is the Government source of information for demand-side data on financial services. The National Development Plan has a section on bank-ing services that quotes FinScope. The Treasury uses FinScope data to look at trends then engages consulting services to package the data typically at a provincial level. Since 2004 syndicate members have paid for the cost of conducting the survey in South Africa. This is estimat-ed annually and at present is approximately USD27,000 per member, reflecting only a fraction of the cost of a national survey if each member were to conduct one independently. Any organisation can become a syndi-cate member if they are prepared to pay a membership
fee. Over the years, members have ranged from major banks to life and short-term insurance service providers, the retail sector, as well as various regulators and govern-ment departments such as the National Credit Regula-tor (NCR), the Financial Services Board and the Nation-al Treasury. It is anticipated that the per member costs of conducting the survey will reduce in the future due to technological efficiency gains and increased numbers of syndicate members. FMT has provided funding to meet survey cost shortfalls only three times over the ten-year period discussed.
Although the FinScope survey is fully funded by syndicate members, the fees do not cover FMT’s over-heads associated with the organisation, coordination and management of the survey. FinScope does not yet have an institutional home outside FMT, an aid-funded entity. The syndicate has stated that it lacks the capacity to conduct the survey without FMT’s coordination. FMT owns FinScope – and arguably it contributed significant-ly to FMT’s profile in the sector. As the survey has been exported to other countries by donors with technical assistance from FMT, donor money has effectively subsi-dised a proportion of the overheads needed to run Fin-Scope in South Africa.
FMT has commissioned input to inform adaptations over the years including:
– 2010: The incorporation of more social context and exploration of how people manage their money.
– 2012: Refined segmentation: (a) among financially excluded individuals, who are most likely to take up financial services and what can be done to encourage their inclusion; and (b) among those who are finan-cially included, what would encourage them to move up the ‘access strand’.13
– 2014: A tiered package of products according to syndicate payment levels. A contribution of approxi-mately USD7,700 provides access to smaller packets of data on a regional (geographic) or specific prod-uct level i.e. credit only.
– 2015: Upgrade to computer-assisted interview tools. The sample size increased from 3,900 to 5,000. A new financial indicator such as ‘Quality of Financial In-clusion Measure (Q-FIM) was included.
– An MSME survey was conducted in 2010 but has not yet been repeated.
7
FinScope, from FinMark Trust – Using information as a driver of change
14. The Global FinDex database provides in-depth data on how individuals save, borrow, make payments, and manage risks. Collected in partnership with the Gal-lup World Poll, the database is based on interviews with about 150,000 adults in over 140 countries (www.worldbank.org)
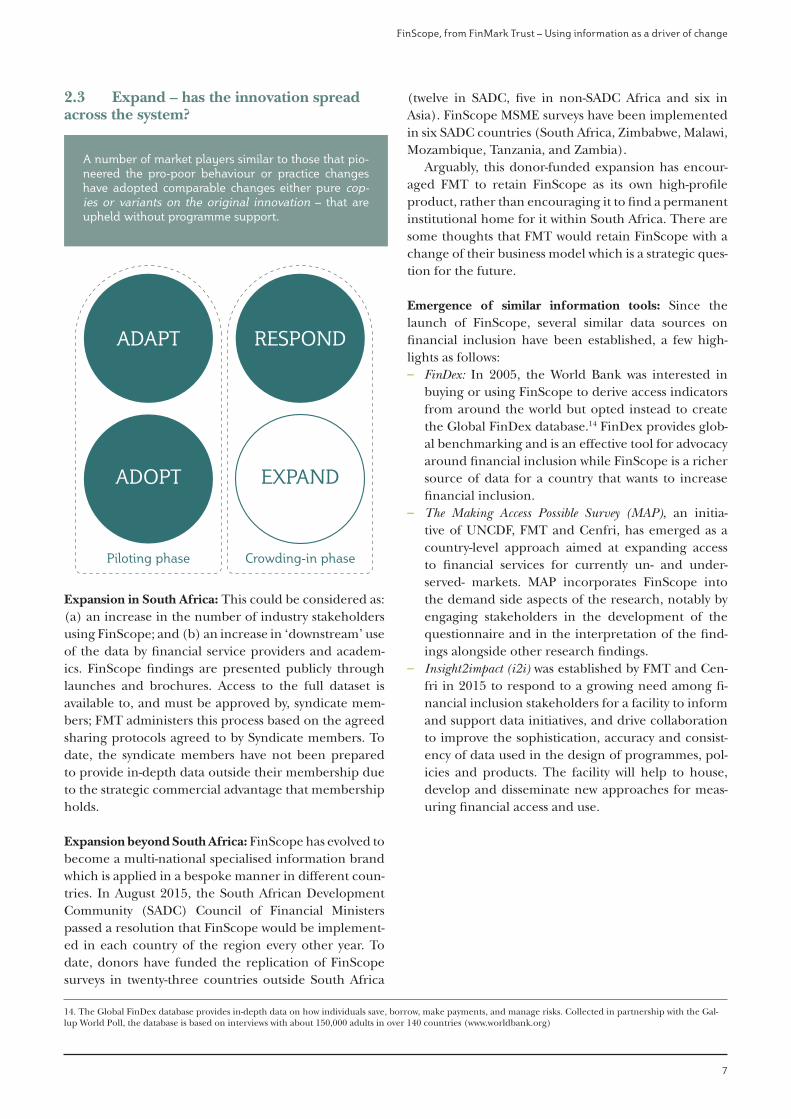
2.3 Expand – has the innovation spread across the system?
A number of market players similar to those that pio-neered the pro-poor behaviour or practice changes have adopted comparable changes either pure cop-ies or variants on the original innovation – that are upheld without programme support.
Piloting phase Crowding-in phase
ADOPT
ADAPT
EXPAND
RESPOND
Expansion in South Africa: This could be considered as: (a) an increase in the number of industry stakeholders using FinScope; and (b) an increase in ‘downstream’ use of the data by financial service providers and academ-ics. FinScope findings are presented publicly through launches and brochures. Access to the full dataset is available to, and must be approved by, syndicate mem-bers; FMT administers this process based on the agreed sharing protocols agreed to by Syndicate members. To date, the syndicate members have not been prepared to provide in-depth data outside their membership due to the strategic commercial advantage that membership holds.
Expansion beyond South Africa: FinScope has evolved to become a multi-national specialised information brand which is applied in a bespoke manner in different coun-tries. In August 2015, the South African Development Community (SADC) Council of Financial Ministers passed a resolution that FinScope would be implement-ed in each country of the region every other year. To date, donors have funded the replication of FinScope surveys in twenty-three countries outside South Africa
(twelve in SADC, five in non-SADC Africa and six in Asia). FinScope MSME surveys have been implemented in six SADC countries (South Africa, Zimbabwe, Malawi, Mozambique, Tanzania, and Zambia).
Arguably, this donor-funded expansion has encour-aged FMT to retain FinScope as its own high-profile product, rather than encouraging it to find a permanent institutional home for it within South Africa. There are some thoughts that FMT would retain FinScope with a change of their business model which is a strategic ques-tion for the future.
Emergence of similar information tools: Since the launch of FinScope, several similar data sources on financial inclusion have been established, a few high-lights as follows:
– FinDex: In 2005, the World Bank was interested in buying or using FinScope to derive access indicators from around the world but opted instead to create the Global FinDex database.14 FinDex provides glob-al benchmarking and is an effective tool for advocacy around financial inclusion while FinScope is a richer source of data for a country that wants to increase financial inclusion.
– The Making Access Possible Survey (MAP), an initia-tive of UNCDF, FMT and Cenfri, has emerged as a country-level approach aimed at expanding access to financial services for currently un- and under-served- markets. MAP incorporates FinScope into the demand side aspects of the research, notably by engaging stakeholders in the development of the questionnaire and in the interpretation of the find-ings alongside other research findings.
– Insight2impact (i2i) was established by FMT and Cen-fri in 2015 to respond to a growing need among fi-nancial inclusion stakeholders for a facility to inform and support data initiatives, and drive collaboration to improve the sophistication, accuracy and consist-ency of data used in the design of programmes, pol-icies and products. The facility will help to house, develop and disseminate new approaches for meas-uring financial access and use.
8
Case Study Series: The Art of Financial Market Facilitation
FinAccess Kenya: Taking Inspriation from FinScope
In 2005, FSD Kenya (a sister organisation of FMT) also identified the need to define and measure financial inclusion as a financial market development priority. In response, FSD Kenya has since led the management, financing and delivery of four FinAccess surveys in 2006, 2009, 2013 and 2016. It is a nationally representative financial inclusion survey modelled on FinScope, albeit with a more public sector facing target audience.This is reflected in the membership of the FinAcess Management (FAM) Committee, which comprises the Central Bank of Kenya (CBK) and FSD Kenya, as well as the Kenya National Bureau of Statistics (KNBS), which joined in November 2015. It is difficult to isolate the financial market outcomes that relate to the FinAccess surveys. However, it is clear that financial inclusion is now part of the fabric in Kenya. As one ex-CEO of a major Kenyan bank put it: “For the industry as a whole the greatest thing [from FSD Kenya] has been FinAccess. It has made it [inclusion] real. Everyone believes it”. Indeed, with careful negotiation by FSD Kenya, greater visibility and increased longitudinal data, FinAccess has also become
increasingly valued by the public sector. For FinAccess 2016, KNBS co-ordinated the fieldwork and helped to design the sampling framework. And from 0% in 2006 and 9% in 2009, CBK and KNBS together made a finan-cial contribution of 60% of the total cost to FinAccess 2016. Using FinAccess data, KNBS also included a spe-cial financial inclusion chapter in the annual Kenyan Economic Survey in 2016. Mindful of its exit strategy, FSD Kenya describes a two-tiered approach to FinAccess sustainability: a) financial, and b) management. FSD Kenya is confident that its share of the financial cost of the survey will continue to decrease. However, it is expected that FSD Kenya’s role in the management of FinAccess will remain in the immediate future. For FinAccess 2016, FSD Kenya contributed approximately 1.1 full-time equivalent (FTE) to the management and dissemination of the survey. Going forward, FSD Kenya plans to engage the private sector more directly through a series of events with the objective of increasing its par-ticipation in the FAM, but also an increased role in the resourcing of future FinAccess surveys.
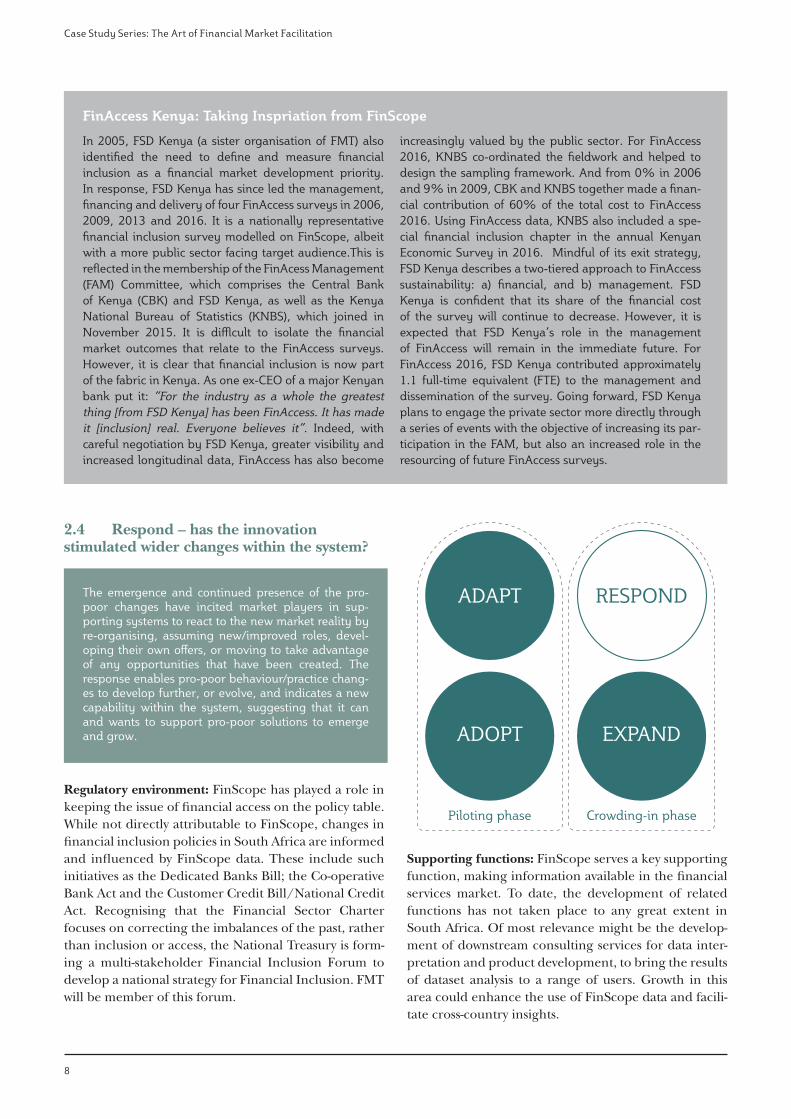
2.4 Respond – has the innovation stimulated wider changes within the system?
The emergence and continued presence of the pro-poor changes have incited market players in sup-porting systems to react to the new market reality by re-organising, assuming new/improved roles, devel-oping their own offers, or moving to take advantage of any opportunities that have been created. The response enables pro-poor behaviour/practice chang-es to develop further, or evolve, and indicates a new capability within the system, suggesting that it can and wants to support pro-poor solutions to emerge and grow.
Regulatory environment: FinScope has played a role in keeping the issue of financial access on the policy table. While not directly attributable to FinScope, changes in financial inclusion policies in South Africa are informed and influenced by FinScope data. These include such initiatives as the Dedicated Banks Bill; the Co-operative Bank Act and the Customer Credit Bill/National Credit Act. Recognising that the Financial Sector Charter focuses on correcting the imbalances of the past, rather than inclusion or access, the National Treasury is form-ing a multi-stakeholder Financial Inclusion Forum to develop a national strategy for Financial Inclusion. FMT will be member of this forum.
Supporting functions: FinScope serves a key supporting function, making information available in the financial services market. To date, the development of related functions has not taken place to any great extent in South Africa. Of most relevance might be the develop-ment of downstream consulting services for data inter-pretation and product development, to bring the results of dataset analysis to a range of users. Growth in this area could enhance the use of FinScope data and facili-tate cross-country insights.
Piloting phase Crowding-in phase
ADOPT
ADAPT
EXPAND
RESPOND
9
15. FMT presentation to Nedlac; Nov 2014.
3 FMT: strategy and approach
In this section, we consider the wider FMT strategy and approach within which their engagement and support to the FinScope consumer survey in South Africa took place and to which programme level objectives it was seen to contribute. This section is structured according to the M4P project cycle.
3.1 Strategy
FMT was established with the goal of ‘making financial markets work for the poor by promoting financial inclusion and regional financial integration’. The goal of FinScope is articulated as: ‘Making financial markets work for the poor across Africa and beyond by increasing access to financial ser-vices for the unserved and underserved that will ultimately lead to the development of inclusive financial systems that can ben-efit all people’.15
FinScope surveys have an ambitious range of objec-tives, from tracking access and usage to highlighting product development opportunities and providing insights for policy reform and the regulatory frame-work. By providing a means to measure financial inclu-sion, FinScope has a pathway connecting to the ultimate goal and objectives of FMT. The FMT logical framework lists FinScope as an output, ie. something that FMT does. A more strategic conceptualisation of FinScope is as an information permanent function in the financial services market system; i.e. a source of data used in the policy-making and product-development processes of financial inclusion.
3.2. Diagnosis
FinScope arose in response to the dearth of data on financial inclusion in South Africa and has effective-ly served to fill this information gap ever since. FMT’s analysis led it to understand that lack of information causes sub-optimal decision-making, by policy makers, advocacy organisation and financial service providers.
However, it is less clear how well FMT understood the root causes inhibiting the emergence of this kind of information function developing within the industry. If information is so vital to a host of industry players, why hadn’t a function emerged? This question may be the basis of a future study including the question of the role of information as a ‘public good’ or a commercial use, or both.
3.3 Vision
Since 2008, a number of important issues have resur-faced in FMT’s strategic deliberations over FinScope:
– Ownership of FinScope, including intellectual prop-erty rights.
– Functional i.e. FinScope needs FMT’s administrative and oversight function to be implemented.
– Sustainability, both financial and operational. – Extent to which FinScope should be demand-led
(i.e. responsive) or supply-driven (i.e. shaping)
Some observers note that in recent years FinScope data has not changed significantly because the market itself is not changing that much. Access is no longer a pressing issue. Financial inclusion in South Africa has reached 80%; the remaining 20% constitute those who are most difficult to reach. More important than access per se is improving the quality of access, i.e. a wider range of services better tailored to individual needs. The dialogue is evolving from monitoring and under-standing the depth of inclusion to determining what effects financial inclusion has on the lives of people.
3.4 Intervention
FMT used its credibility, convening power and some start-up funding to test and prove FinScope’s value to the industry. This combination of an injection of an innovation (i.e. accurate data on inclusion) and FMT’s credibility and neutrality as a broker was instrumental to
“More important than access per se is
improving the quality of access”
10
Case Study Series: The Art of Financial Market Facilitation
the fundamental shift in the dialogue around financial inclusion that FinScope originated.
FMT does not conduct the surveys. It has contracted a market research company annually. TNS has conducted the survey each year starting in 2003, with the exception of 2009-2010 when it was conducted by Ask Afrika.
However, since FinScope’s inception FMT has per-formed a project management role consisting of:
– Providing technical expertise on the FinScope meth-odology
– Constitution and coordination of the syndicate. – Design of the questionnaire. – Management of the survey. – Raising funds to implement FinScope through en-
gaging current and new members – Contracting and management of surveying company. – Data analysis – Creation of data materials for dissemination. – Presentation of data in public events.
The syndication of FinScope and the involvement of syndicate members in its design and implementation has been critical to its effectiveness, shaping its relevance and utilising its data.
3.5 Measurement
Over the years, there have been several studies commis-sioned which are related to or directly focused on Fin-Scope:
– In 2006, The Springfield Centre conducted a review of FinMark as part of a series of case studies on ‘Mak-ing Financial Services Markets Work for the Poor’.
– In 2009, Bankable Frontiers conducted the ‘Fin-Scope Review of Impact and Strategic Options’.
– In 2012, the Oxford Policy Management Group con-ducted a review and provided recommendations for the process of revising FinScope questionnaires glob-ally.
– In 2015, Eighty20 conducted an impact study of Fin-Scope across multiple countries.
An important insight from the OPM assessment is that there may be perhaps unrealistic ambitions for what comes out of the FinScope survey. We tend to expect it to produce comprehensive answers in all three areas simulta-neously – when, in fact, each of these objectives (policy, innova-tion, poverty) would merit their own dedicated survey.16
FinScope does not, in and of itself, answer the ques-tion of how to make financial markets work for the poor but serves as one important set of data. While it is
clear that FinScope has become a benchmark for finan-cial inclusion in South Africa, it is difficult to attribute impact in terms of changes in financial inclusion to FinScope directly. “Disentangling the impact of information on changes from other causal factors is nearly impossible.” 17
It may be worthwhile to try to answer this question in a specific study in the future.
The FinScope questionnaire has been designed and conducted using a market research lens, in terms of what products are available, who uses them and who does not. FinScope is statistically robust, but it is not designed to provide qualitative insights. Moreover, Fin-Scope data is difficult to disaggregate for poverty impact. So, whilst financial inclusion has clearly increased, and FinScope is perceived to have contributed to this, it is difficult to ascertain what impact financial inclusion has had on the lives of the poor. To address this, FMT has launched a ‘quality of financial inclusion’ measure as part of the FinScope survey to try to understand the pov-erty impact of increased financial inclusion. FMT also did some quality of access work to complement the Fin-Scope results.
3.6 Lessons in facilitating systemic change
FinScope is widely perceived to have been transforma-tive. It has become a robust methodological framework and a well-recognised brand across Africa and beyond. FMT’s approach to stimulating this process has generat-ed some useful lessons of wider relevance:
Technical understanding and influence are central to a facilitator’s offer: FMT’s technical credibility and neutrality enabled it to convene stakeholders at a time when the financial inclusion discussion was not promi-nent. Subsequently, it allowed FMT to create and man-
16. Review of FinScope questionnaires; Oxford Policy Management Group; 2012. 17. FinScope review of Impact and Strategic Options; Bankable Frontiers; 2009.
“Technical understanding and
influence are central to a facilitator’s offer”
11
FinScope, from FinMark Trust – Using information as a driver of change
age annual implementation of the surveys. Bringing in a capable, well-respected survey company has also been vital to establishing FinScope’s credibility.
Smart communication is vital: Insightful analysis can-not serve it’s strategic purpose unless it is communicat-ed effectively, reaching the right people with the right information. FMT, learning from a widespread tenden-cy to present survey data in an inaccessible and boring manner, strove ‘to make its findings “real” – to be an accurate and insightful mirror on reality – for different types of users.’ 18
Importance of industry decision making and co-invest-ment: FinScope data had to be relevant to and used by industry stakeholders, and needed to facilitate an informed discussion at a regulatory level about finan-cial access. The formation of the syndicate has served to ensure that FinScope has a constituency able to input into its design and willing to pay for the survey costs annually.
Importance of monitoring and results measurement: FinScope data has clearly played an influencing role in financial inclusion in South Africa. Syndicate members use FinScope data and clearly find value in it as they continue to fund it annually. However, there is no data
clearly linking the use of FinScope data to Syndicate members, or other actors using FinScope data, and spe-cific changes in financial inclusion-related policies and product development. Determining a vision for use of the data and its’ pro-poor impact, and designing related results chains and measurement plans will contribute to the evidence-base of the pro-poor impact of FinScope.
Defining the facilitation role and exit plans: FMT has been essential to the initiation, development and con-tinuing conduct of FinScope in South Africa. Howev-er, FMT was not established to become a global survey implementer, it was established to catalyse processes of change that lead to greater financial inclusion. This raises a question about what FMT’s role should be now, given that FinScope has become a global brand. On the one hand, there is a risk that with diversion of resources into survey implementation, FMT might become less insightful about constraints to access or the quality of access, less able to engage in complex policy issues and less effective as a change agent. On the other hand, there is a risk that FinScope’s institutional home in South Africa is an entity largely funded by foreign aid, which might be a threat to its longevity and under-mine the development of a permanent information or research function in the market system.
18. A Gibson; Developing Financial Service Markets for the Poor; FinMark South Africa; Nov 2006.
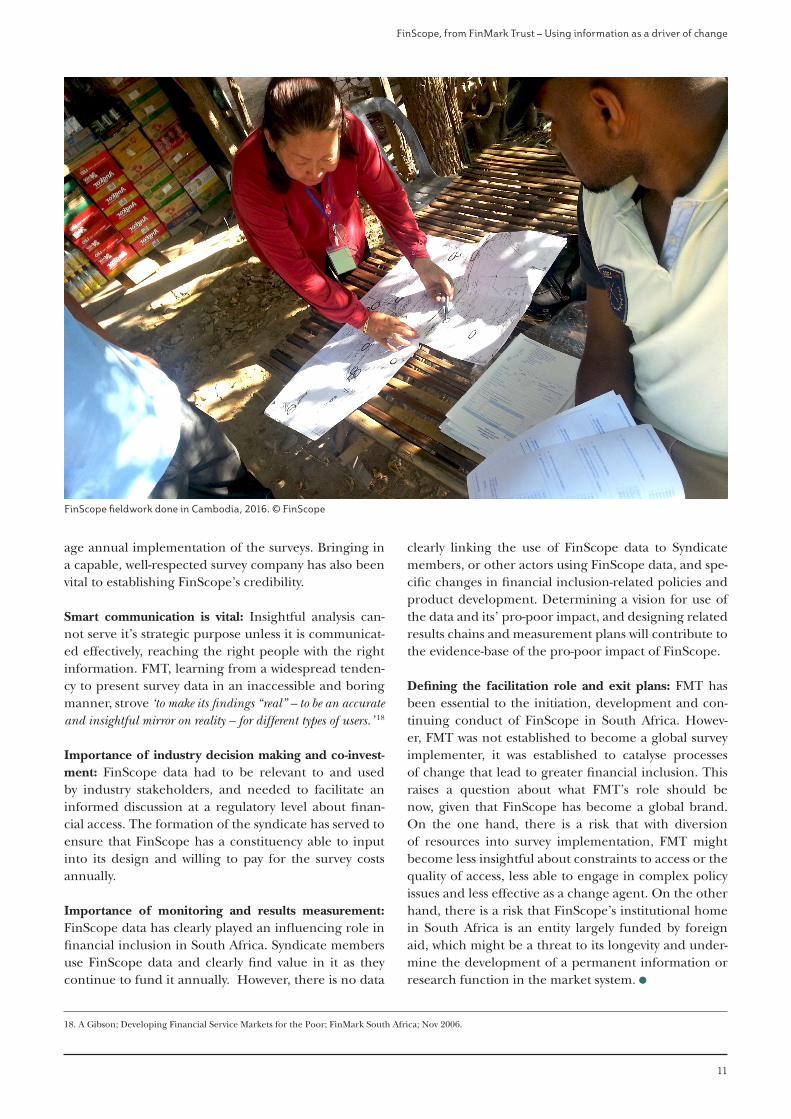
FinScope fieldwork done in Cambodia, 2016. © FinScope
FSD Africa
FSD Africa is a non-profit company, funded by the UK’s Department for International Development, which promotes financial sector development across sub-Saharan Africa. FSD Africa is based in Nairobi, Kenya. It sees itself as a catalyst for change, working with partners to build financial markets that are robust, efficient and, above all, inclusive. It uses funding, research and technical expertise to identify market failures and strengthen the capacity of its partners to improve access to financial services and drive economic growth. It believes strong and responsive financial markets will be central to Africa’s emerging growth story and the prosperity of its people.
FSD Africa also provides technical and operational support to a family of ten financial market development agencies or ‘FSDs’ across sub-Saharan Africa called the FSD Network.
FSD Network
The FSD Network is an alliance of organisations or ‘FSDs’ that reduce poverty through financial sector development in sub-Saharan Africa.
Today, the FSD Network:
– Comprises two regional FSDs in South Africa (est. 2002) and Kenya (est. 2013) and eight nation-al FSDs in Ethiopia (est. 2013), Kenya (est. 2005), Moçambique (est. 2014), Nigeria (est. 2007), Rwanda (est. 2010), Tanzania (est. 2005), Uganda (est. 2014) and Zambia (est. 2013).
– Is a leading proponent of the ‘making markets work for the poor’ approach. – Specialises in a number of themes from agriculture finance and savings groups to payments,
SME finance and capital market development. – Represents a collective investment of $450+ million by DFID; Bill & Melinda Gates Foundation;
SIDA; DANIDA; Foreign Affairs, KfW Development Bank; the MasterCard Foundation; RNE (Netherlands); Trade and Development Canada; and the World Bank.
– Spends $55+ million per year, predominantly through grant instruments – Employs over 150 full time members of staff and uses a wide range of consultants
FSDs do not deliver financial services to the poor directly. Instead, they deploy financial resources, expertise and insights in collaboration with a range of public and private sector actors – from central banks and commercial banks to specialist training providers, telecommunication firms and microfinance networks – to create the market conditions that deliver financial inclusion, not only during the FSD intervention, but also beyond.
FSD Africa, Nairobi, Kenya
@FSDAfrica
fsdafrica.org
The Springfield Centre
@TheSpringfieldC
springfieldcentre.com
Department for International Development
@DFID_UK
gov.uk