Embed Size (px)
Citation preview

Lessons for Education Policy in Africa
Evidence from Randomized Evaluations in developing countries
James HabyarimanaGeorgetown University
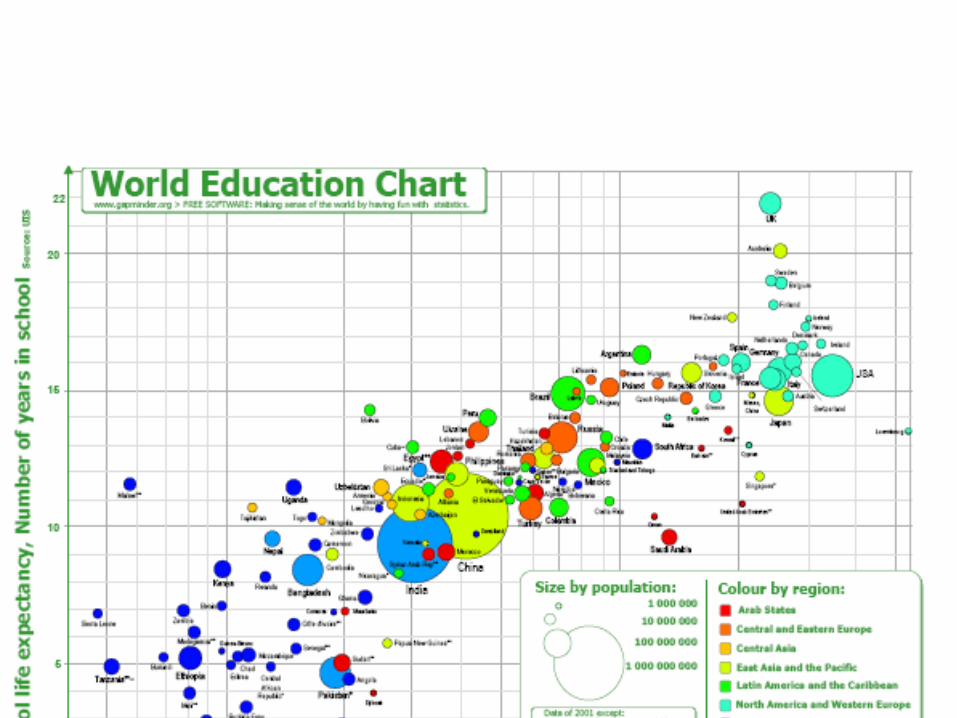
The Main Policy Challenges
1) Bring children to school [PARTICIPATION]– MDGs for education seek to get 100%
enrollment in primary school and gender equality in education participation more general
• Keep them in school
2) Teach them something when they are there. [QUALITY]
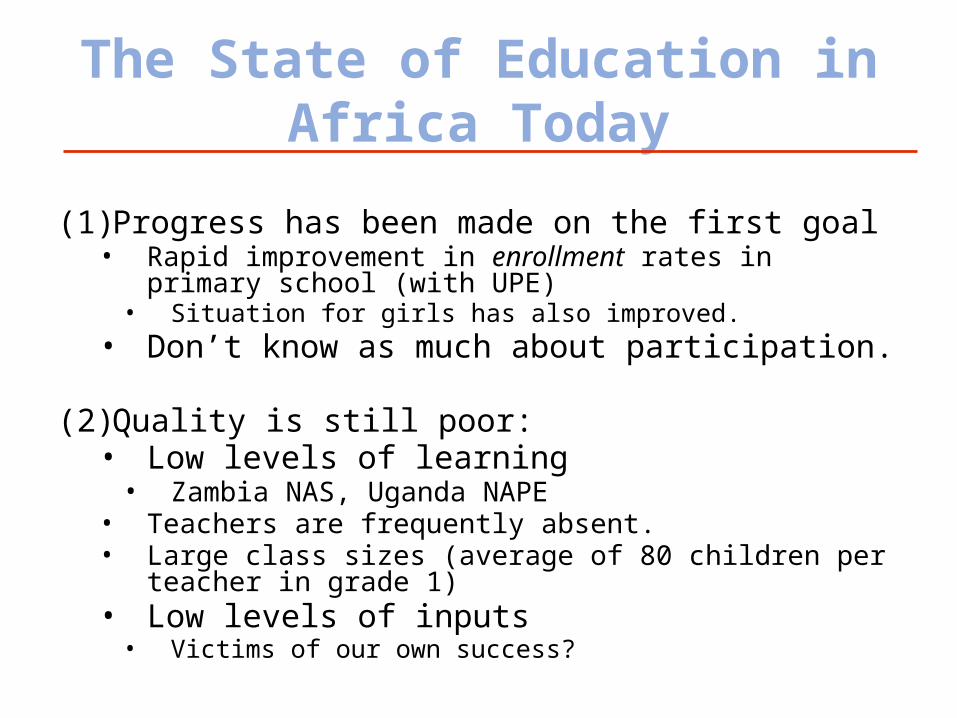
The State of Education in Africa Today
(1) Progress has been made on the first goal• Rapid improvement in enrollment rates in primary school (with
UPE)• Situation for girls has also improved.
• Don’t know as much about participation.
(2) Quality is still poor:• Low levels of learning
• Zambia NAS, Uganda NAPE • Teachers are frequently absent.• Large class sizes (average of 80 children per teacher in grade 1)
• Low levels of inputs
• Victims of our own success?
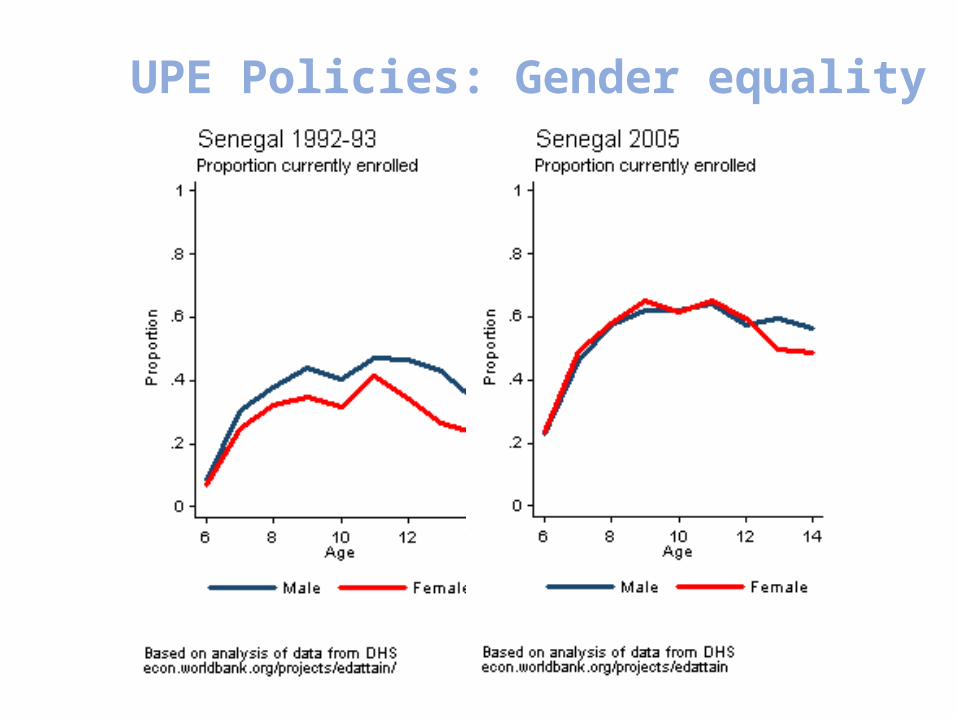
UPE Policies: Gender equality
What should the policy maker do?
• Theory predicts that – improving the level and quality of inputs
should improve the level of learning (Q).• Reducing costs of schooling increases participation (P)
• A review of policies across both developed and developing countries reveals very mixed results
• There are no clear win-win programs or interventions
• If theory is not informative, then we must rely on experience– Systematic
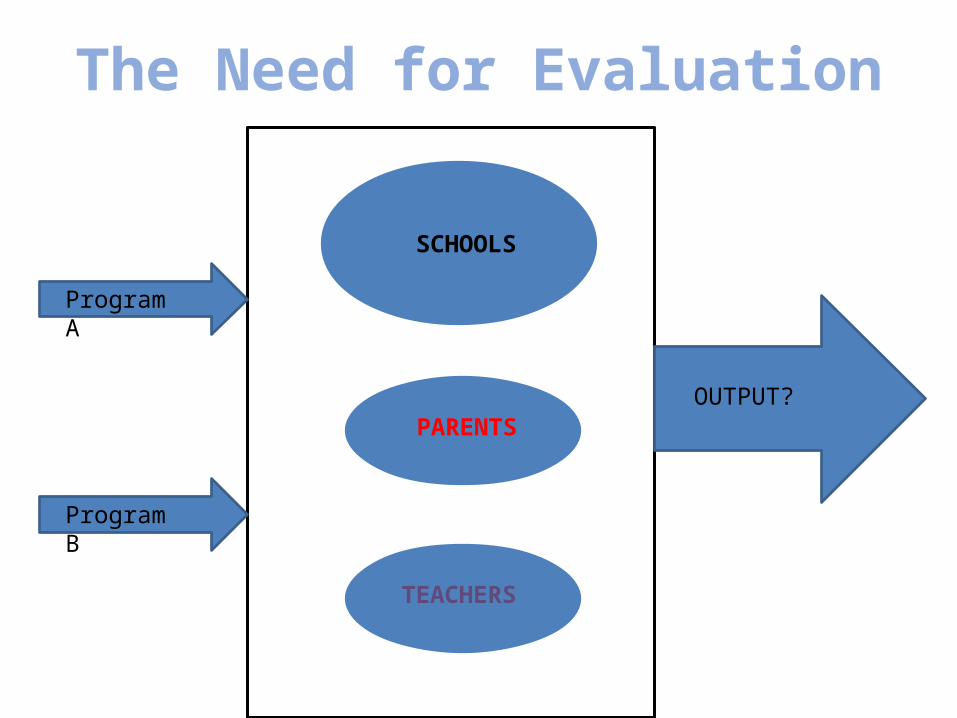
The Need for Evaluation
Program A
OUTPUT?
Program B
SCHOOLS
PARENTS
TEACHERS
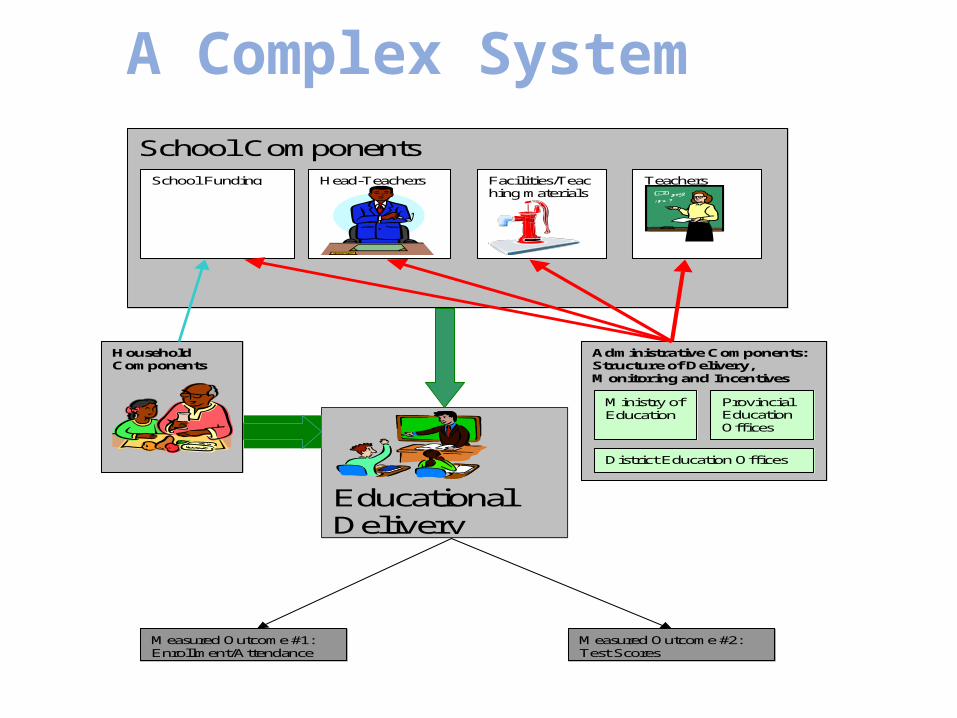
A Complex System
Educational Delivery
Measured Outcome #1: Enrollment/Attendance
Measured Outcome #2: Test Scores
School Components
Teachers
Head-Teachers
Facilities/Teaching materials
School Funding
Household Components
Administrative Components: Structure of Delivery, Monitoring and Incentives
Ministry of Education
Provincial Education Offices
District Education Offices
What have we learnt from impact evaluations in education
• Participation– A household decision
• Quality:– Traditional Inputs
– Teachers
– Management
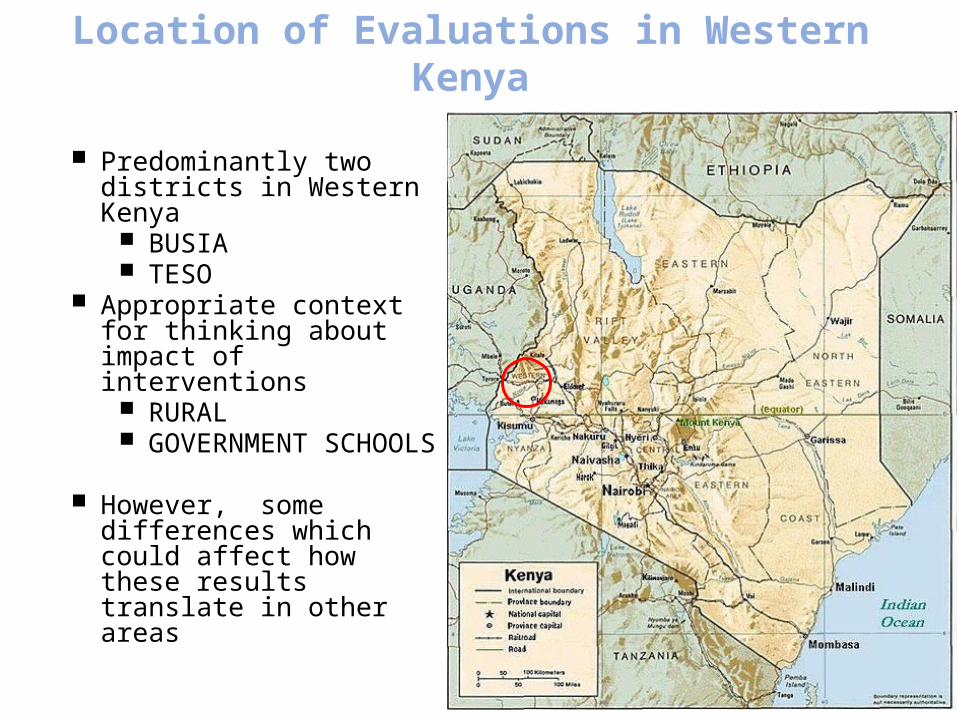
Location of Evaluations in Western Kenya
Predominantly two districts in Western Kenya
BUSIA TESO
Appropriate context for thinking about impact of interventions
RURAL GOVERNMENT SCHOOLS
However, some differences which could affect how these results translate in other areas
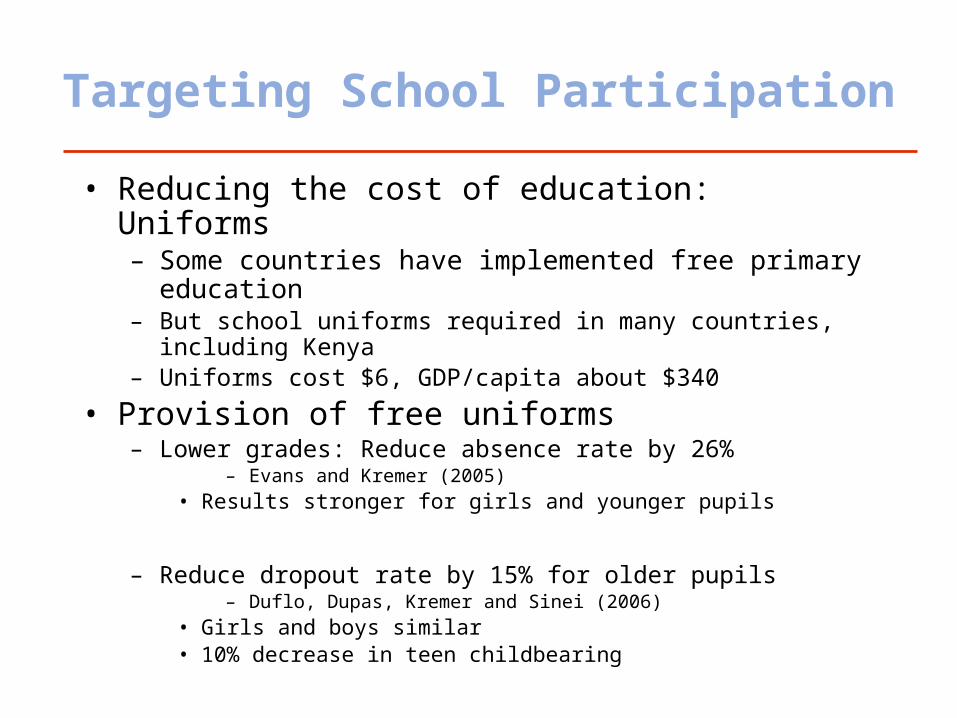
Targeting School Participation
• Reducing the cost of education: Uniforms– Some countries have implemented free primary education– But school uniforms required in many countries, including Kenya– Uniforms cost $6, GDP/capita about $340
• Provision of free uniforms– Lower grades: Reduce absence rate by 26%
– Evans and Kremer (2005)• Results stronger for girls and younger pupils
– Reduce dropout rate by 15% for older pupils – Duflo, Dupas, Kremer and Sinei (2006)
• Girls and boys similar• 10% decrease in teen childbearing

• School feeding programs – Implemented in pre-schools only– Participation was 30% higher in program
schools (where free breakfast was provided)
– But: • Higher fees and payments to teachers in project schools• Lowered fees in nearby competing schools:
Targeting School Participation
Targeting School Participation
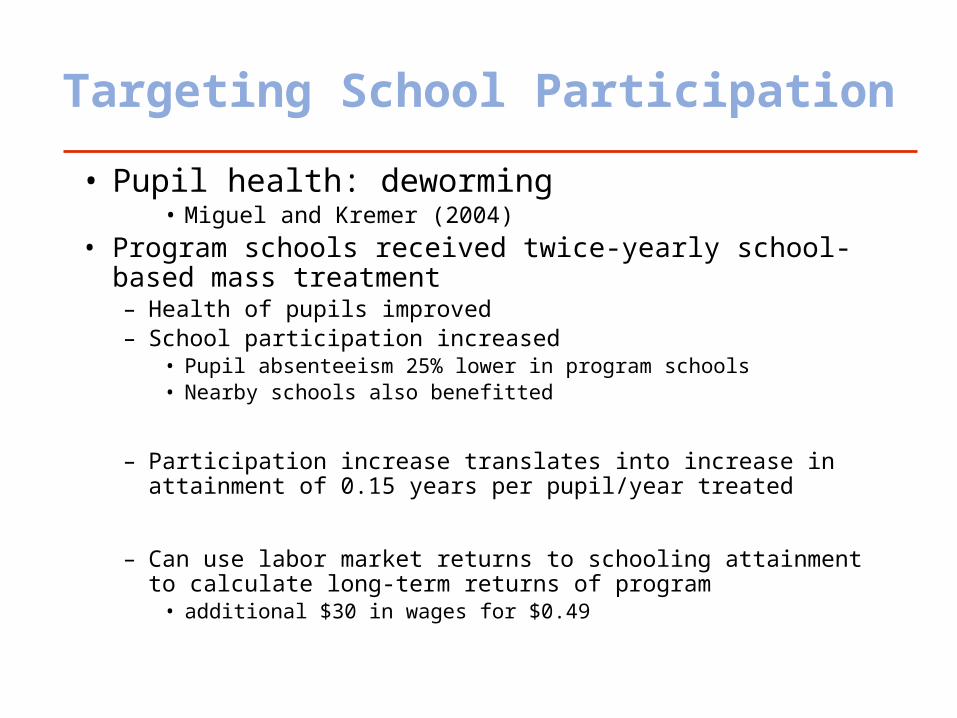
• Pupil health: deworming• Miguel and Kremer (2004)
• Program schools received twice-yearly school-based mass treatment – Health of pupils improved– School participation increased
• Pupil absenteeism 25% lower in program schools• Nearby schools also benefitted
– Participation increase translates into increase in attainment of 0.15 years per pupil/year treated
– Can use labor market returns to schooling attainment to calculate long-term returns of program
• additional $30 in wages for $0.49
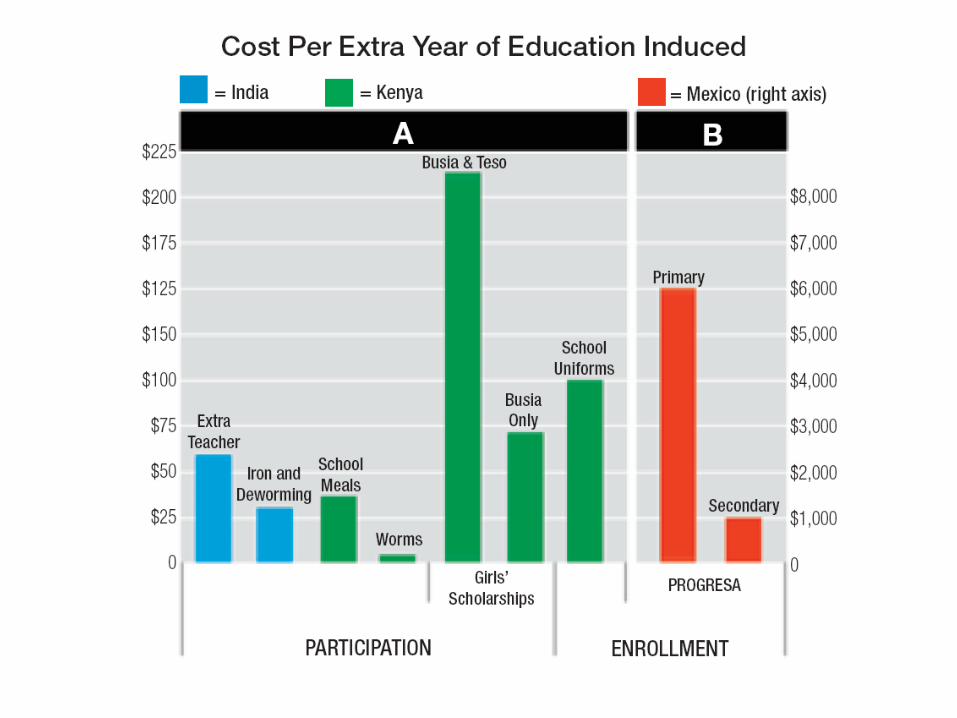
Targeting School Participation: Comparing Costs
• Since resources are scarce, we want to know which of the programs A, B, or C had the lowest cost per extra year of participation induced– Require that programs are implemented in similar settings
• Schools, parents, teachers, pupils– Reliable measure of the causal impact of each program
• This is different from the cost per child of the program
• Take the overall cost of program i and divide by the increase in the number of pupil-years that can be attributed to the program.
• The results are sometimes counter-intuitive.
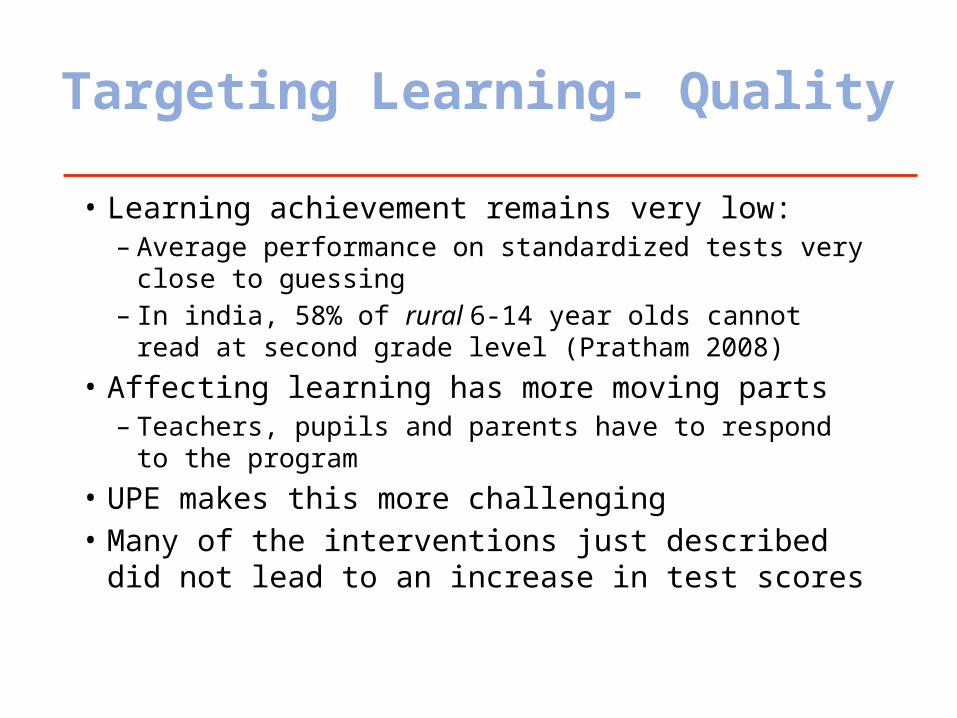
Targeting Learning- Quality
• Learning achievement remains very low: – Average performance on standardized tests very close to
guessing– In india, 58% of rural 6-14 year olds cannot read at second
grade level (Pratham 2008)• Affecting learning has more moving parts
– Teachers, pupils and parents have to respond to the program
• UPE makes this more challenging• Many of the interventions just described did not lead
to an increase in test scores
Targeting Learning-Quality
• A number of randomized evaluations have been conducted on how to improve school quality
• Can be classified into three broad categories– Increasing level of instructional materials– Changing levels of teacher effort– Changing the learning environment
• New programs have built on the lessons of previous disappointing programs
• As with participation, can compare cost per unit of output
Increasing the level of Inputs
• Disappointing results from– Textbooks
• Only the best pupils benefited
– Flipcharts– Extra days in school (e.g. deworming)
• While results were disappointing, they suggested some modifications
• Target effort levels of pupils and teachers
Increasing Teacher Effort• Paying for output—incentives based on test scores• Kenya:
– Teacher incentive program based on scores at KCPE (more on Wednesday)
• Short run increases in test scores but no improvement in learning• No difference in teacher attendance
• India: Andra Pradesh– Group-based incentives vs individual level incentives– Both incentives increased test scores in years 1 and 2
• Individual incentives do much better in year 2– Increased success on both “rote” and “conceptual” items in the
test• And on non-incentive subjects too!
– Teacher absence no different in program schools
Increasing Teacher Effort
• Paying for inputs:– Incentives can work: Camera project (Duflo and
Hanna – non-formal schools in India).• Teachers paid as a function of “valid days
attended”– Time between pictures– 5 hours of class time– Minimum number of kids in the picture
• Teacher absenteeism reduced by 50%• Test scores went up by 0.17 SD after a year
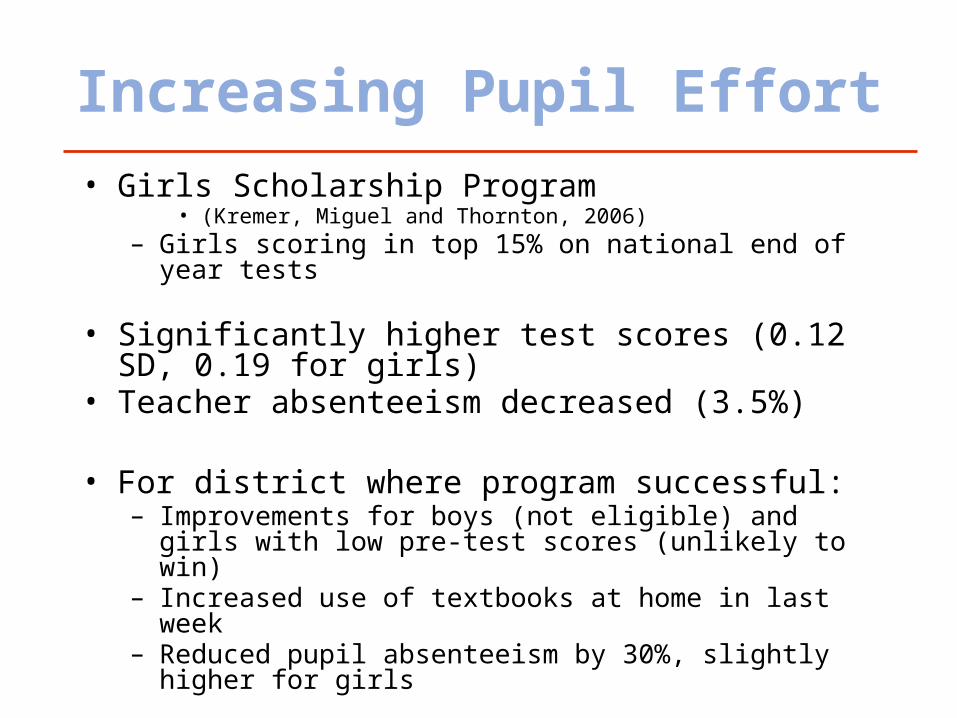
Increasing Pupil Effort• Girls Scholarship Program
• (Kremer, Miguel and Thornton, 2006)– Girls scoring in top 15% on national end of year tests
• Significantly higher test scores (0.12 SD, 0.19 for girls)• Teacher absenteeism decreased (3.5%)
• For district where program successful: – Improvements for boys (not eligible) and girls with low pre-test
scores (unlikely to win)– Increased use of textbooks at home in last week– Reduced pupil absenteeism by 30%, slightly higher for girls
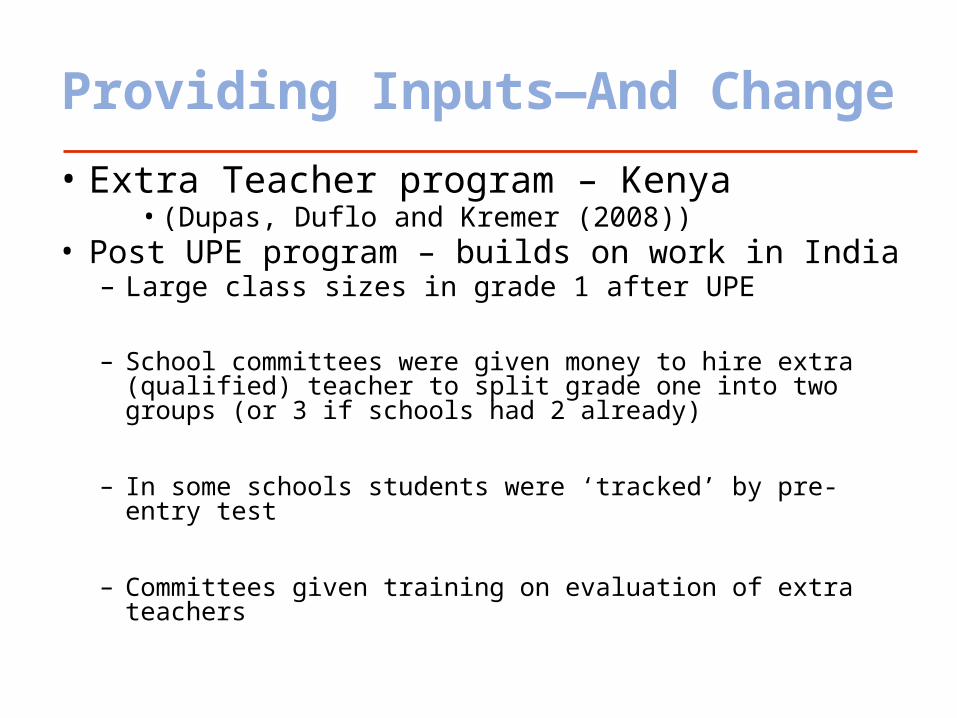
Providing Inputs—And Change• Extra Teacher program – Kenya
• (Dupas, Duflo and Kremer (2008))• Post UPE program – builds on work in India
– Large class sizes in grade 1 after UPE
– School committees were given money to hire extra (qualified) teacher to split grade one into two groups (or 3 if schools had 2 already)
– In some schools students were ‘tracked’ by pre-entry test
– Committees given training on evaluation of extra teachers
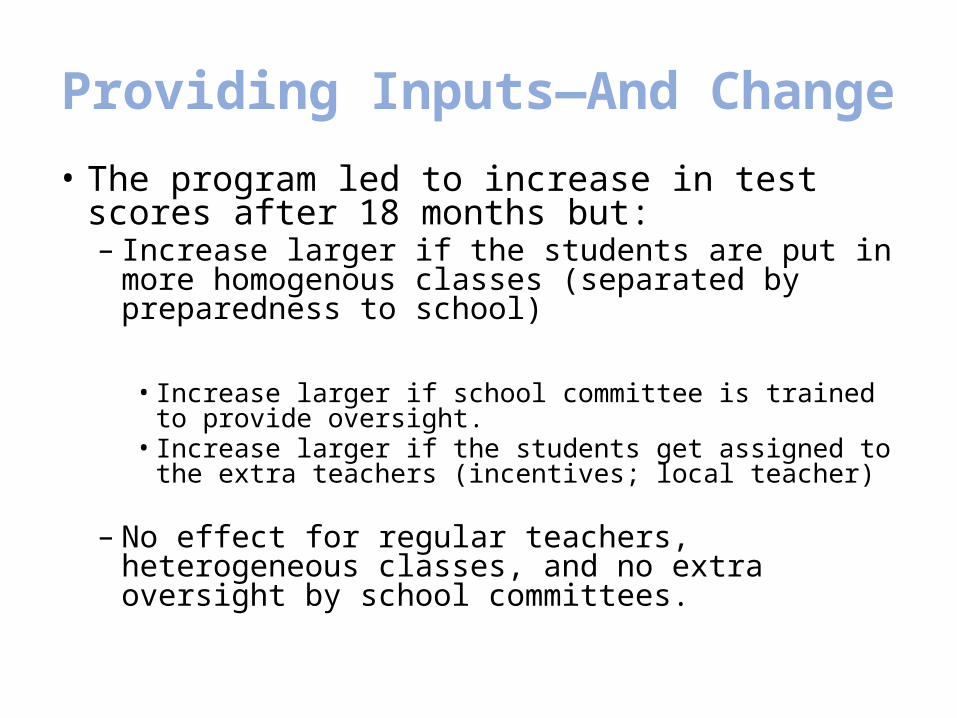
Providing Inputs—And Change• The program led to increase in test scores after
18 months but:– Increase larger if the students are put in more
homogenous classes (separated by preparedness to school)
• Increase larger if school committee is trained to provide oversight.
• Increase larger if the students get assigned to the extra teachers (incentives; local teacher)
– No effect for regular teachers, heterogeneous classes, and no extra oversight by school committees.

Providing Inputs—And Change
• Extra Teacher program – India – (Muralidharan and Sundararaman (2008))
• Designed to complement incentives paper– Extra teacher assigned to 100 program schools
• Generally less qualified and about 20% of wages of civil service teacher
• Contract renewable
• Extra teacher schools improve learning by 0.15 sd in Math and 0.09 in Language
Cost Benefit Comparisons
• Since all programs are evaluated in a similar way, and outputs are expressed in terms of standard deviation, we can compute and compare the Cost per 0.1 Sd increase in test scores
• (The graphs include only programs that had positive effects on learning)
• This is does not tell us about the welfare effects of these programs, but this can tell us where to invest scarce resources to arrive at a given objective
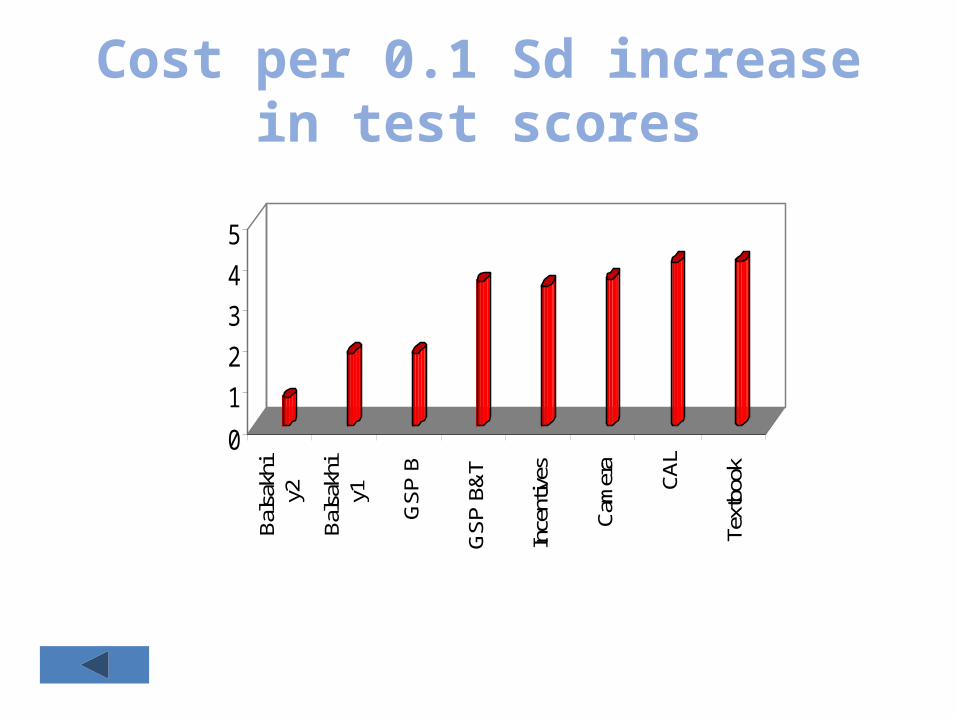
Cost per 0.1 Sd increase in test scores
0
1
2
3
4
5B
alsa
khi
y2
Bal
sakh
iy1
GS
P B
GS
P B
&T
Ince
ntiv
es
Cam
era
CA
L
Text
book
Conclusions • Rigorous evidence is starting to accumulate on what works
and what does not in education access and quality. – Results are influencing policy (PROGRESA, deworming)
• There is greater interest in Ministries of education across Africa in this approach
• Requires a willingness to learn-by-doing –even if that might include many disappointments
• Doing this more will build a repository of lessons that can be combined–to produce more effective programs