Embed Size (px)
DESCRIPTION
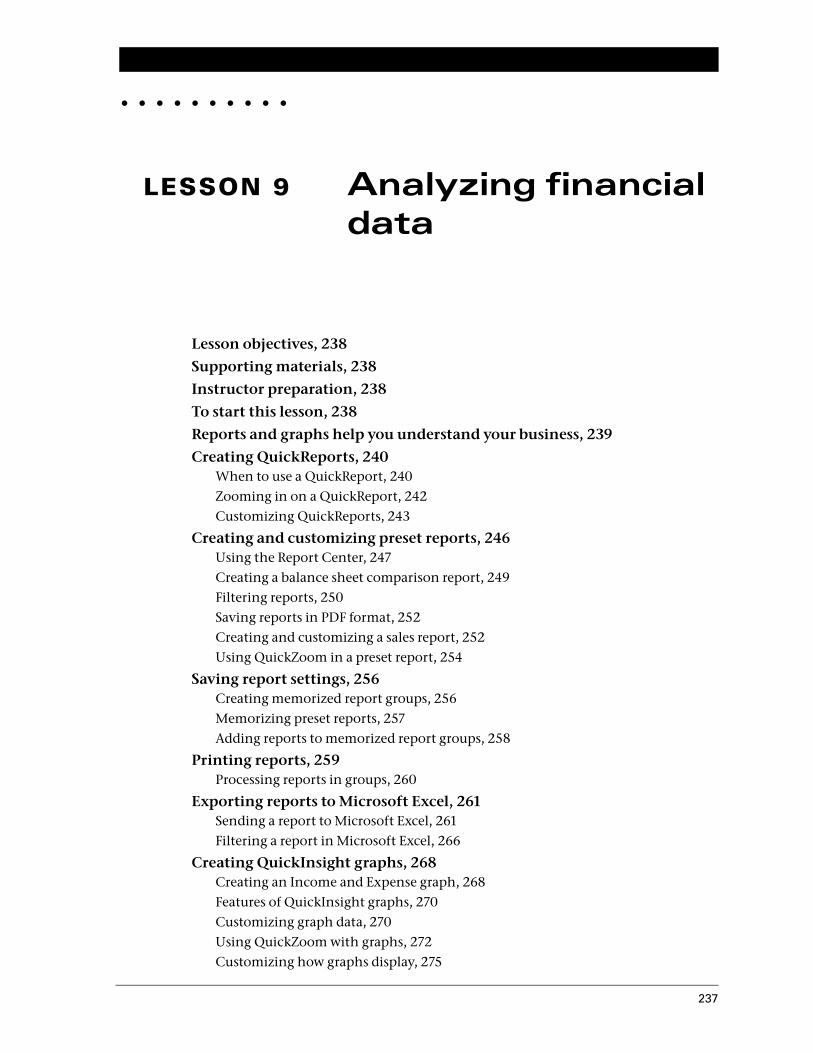
Creating memorized report groups, 256 Memorizing preset reports, 257 Adding reports to memorized report groups, 258 When to use a QuickReport, 240 Zooming in on a QuickReport, 242 Customizing QuickReports, 243 Creating QuickInsight graphs, 268 Creating and customizing preset reports, 246 Exporting reports to Microsoft Excel, 261 Printing reports, 259 Saving report settings, 256 Sending a report to Microsoft Excel, 261 Filtering a report in Microsoft Excel, 266 •••••••••• 9
Citation preview
• • • • • • • • • •
LESSON 9 Analyzing financial data
9
Lesson objectives, 238
Supporting materials, 238
Instructor preparation, 238
To start this lesson, 238
Reports and graphs help you understand your business, 239
Creating QuickReports, 240When to use a QuickReport, 240Zooming in on a QuickReport, 242Customizing QuickReports, 243
Creating and customizing preset reports, 246Using the Report Center, 247Creating a balance sheet comparison report, 249Filtering reports, 250Saving reports in PDF format, 252Creating and customizing a sales report, 252Using QuickZoom in a preset report, 254
Saving report settings, 256Creating memorized report groups, 256Memorizing preset reports, 257Adding reports to memorized report groups, 258
Printing reports, 259Processing reports in groups, 260
Exporting reports to Microsoft Excel, 261Sending a report to Microsoft Excel, 261Filtering a report in Microsoft Excel, 266
Creating QuickInsight graphs, 268Creating an Income and Expense graph, 268Features of QuickInsight graphs, 270Customizing graph data, 270Using QuickZoom with graphs, 272Customizing how graphs display, 275
237
A n a l y z i n g f i n a n c i a l d a t a
Lesson objectives To discuss some of the tools QuickBooks gives you for analyzing
financial data: QuickReports, preset reports, and graphs
To create a QuickReport
To add a column to a report
To learn how to move a column in a report
To learn about the types of preset reports QuickBooks offers
To practice creating reports and viewing them onscreen
To customize a report by changing how it looks and the data it covers (filtering)
To learn how to process reports in batches
To save reports as Portable Document Format (PDF) files
To learn how to export a report to Microsoft Excel
To practice filtering reports in Microsoft Excel
To learn about the types of graphs QuickBooks offers
To create and customize several graphs
Supporting materials PowerPoint file: Lesson 9
Video tutorial: Reports
Instructor preparation Review this lesson, including the examples, to make sure you’re familiar with the
material.
Ensure that all students have a copy of qblesson.qbb on their computer’s hard disk.
To start this lesson
Before you perform the following steps, make sure you have installed the exercise file (qblesson.qbb) on your hard disk. See “Installing the exercise file” in the Introduction to this guide if you haven’t installed it.
The following steps restore the exercise file to its original state so that the data in the file matches what you see on the screen as you proceed through each lesson.
238
L E S S O N 9
To restore the exercise file (qblesson.qbb):1 From the File menu in QuickBooks, choose Open or Restore Company.
QuickBooks displays the Open Company: Type window.
2 Select “Restore a backup copy (.QBB) and click Next.
3 In the Restore Backup: Method window, select Local Backup and click Next.
4 In the Open window, navigate to your c:\QBtrain directory.
5 Select the qblesson.qbb file, and then click Open.
6 In the “Restore Backup: To Location” window, click Next.
7 Navigate to your c:\QBtrain directory.
8 In the File name field of the Restore To window, type lesson 9 and then click Save.
9 Click OK when you see the message that the file has been successfully restored.
Reports and graphs help you understand your business
So far, you’ve been learning ways to track your data in QuickBooks. In this lesson, you’ll work with two of the most valuable tools in QuickBooks reports and graphs. Reports and graphs give you insight into your finances; they’re two of the most important benefits of tracking your data in QuickBooks.
Often, people’s perceptions of their business profitability don’t match the facts. If you enter your data in QuickBooks, but don’t take the time to analyze the data, your business decisions are based on incomplete knowledge. Reports let you summarize your financial data so you make decisions based on analysis of the numbers.
Reports give you the bottom line—you can see exactly how profitable your business is. If it’s not doing as well as you’d hoped, you can create reports that show you which areas need improvement. QuickBooks has dozens of preset reports, but if you have specific reporting needs, you can customize any QuickBooks report to show exactly the data you want. And if you’re interested in getting quick information, you can use a QuickReport that lets you summarize information from your lists, forms, or registers with one click of a button.
Some people find it easier to see a visual picture of their financial data. If you’re interested in learning more about trends or patterns in your business data (for example, what proportion of your income comes from consulting services as compared to product sales), QuickBooks offers six types of QuickInsight graphs.
Note: Some versions of QuickBooks include additional reports that are not available in all other versions.
239
A n a l y z i n g f i n a n c i a l d a t a
Creating QuickReports
One of the fastest ways to see a report on your QuickBooks data is to create a QuickReport. QuickReports are predesigned reports that give you information about the items you’re currently viewing on screen. Whenever you have a list, a register, or a form displayed, you can click a button to have QuickBooks create a QuickReport.
When to use a QuickReport
Suppose you’re viewing the Vendor list in the Vendor Center and you want to see a history of all transactions for a certain vendor. Select the vendor’s name, then click the QuickReport link at the top right section of the window. You’ll see a report listing information about each bill for that vendor.
Suppose that Rock Castle Construction wants to see what it owes to Patton Hardware.
240
L E S S O N 9
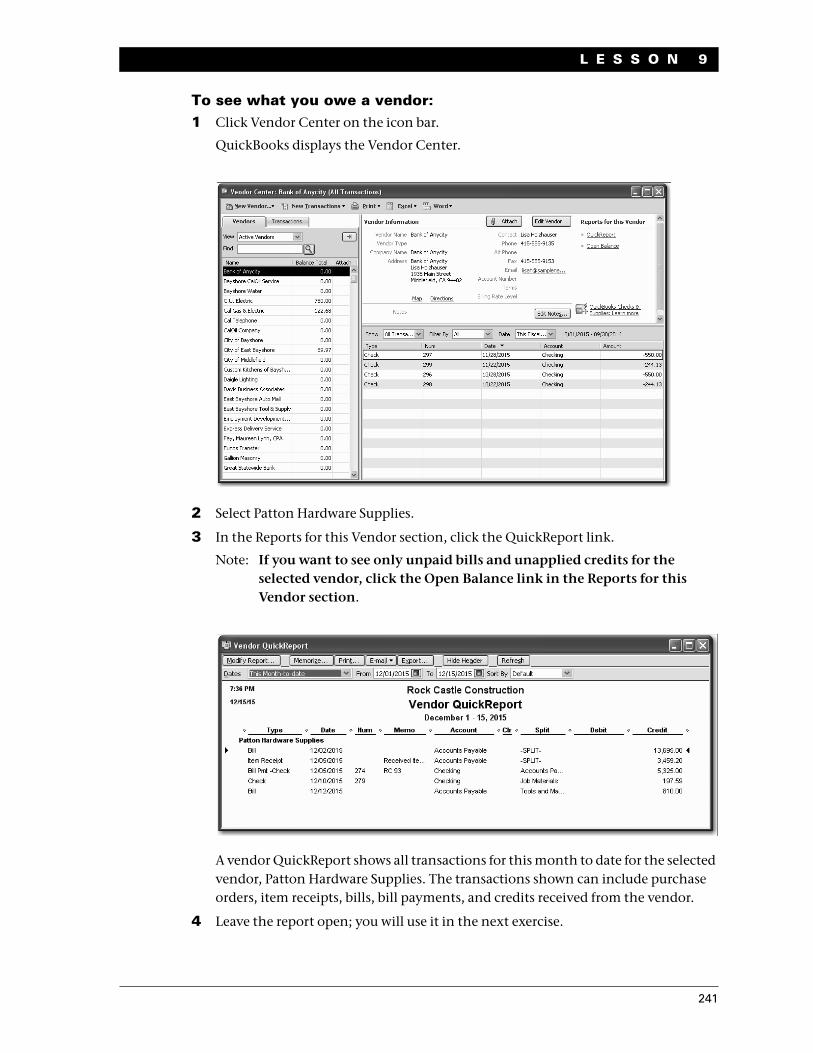
To see what you owe a vendor:1 Click Vendor Center on the icon bar.
QuickBooks displays the Vendor Center.
2 Select Patton Hardware Supplies.
3 In the Reports for this Vendor section, click the QuickReport link.
Note: If you want to see only unpaid bills and unapplied credits for the selected vendor, click the Open Balance link in the Reports for this Vendor section.
A vendor QuickReport shows all transactions for this month to date for the selected vendor, Patton Hardware Supplies. The transactions shown can include purchase orders, item receipts, bills, bill payments, and credits received from the vendor.
4 Leave the report open; you will use it in the next exercise.
241
A n a l y z i n g f i n a n c i a l d a t a
Zooming in on a QuickReport
All QuickReports contain a summary of individual transactions. To help you better understand the information presented in reports, QuickBooks lets you trace report data to the individual transaction level using QuickZoom.
When you position the mouse pointer over a number in a report and you see the QuickZoom symbol (a magnifying glass with a Z in it), you can double-click the number to display the original transaction in QuickBooks.
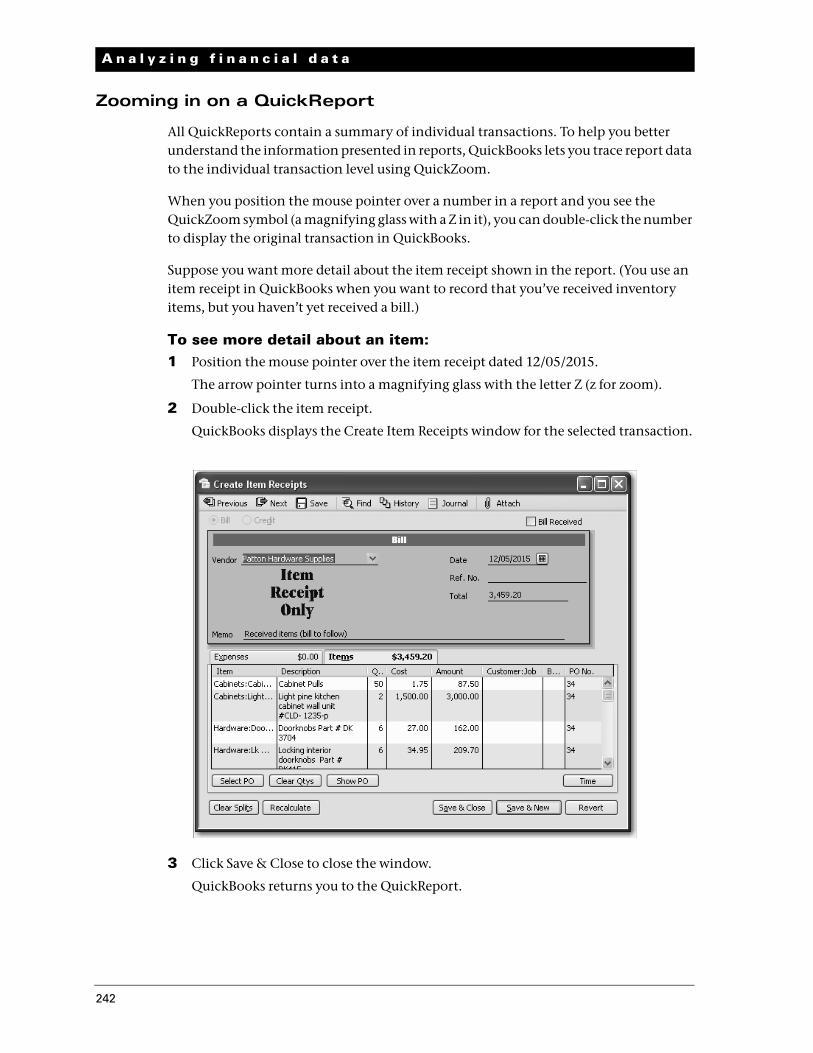
Suppose you want more detail about the item receipt shown in the report. (You use an item receipt in QuickBooks when you want to record that you’ve received inventory items, but you haven’t yet received a bill.)
To see more detail about an item:1 Position the mouse pointer over the item receipt dated 12/05/2015.
The arrow pointer turns into a magnifying glass with the letter Z (z for zoom).
2 Double-click the item receipt.
QuickBooks displays the Create Item Receipts window for the selected transaction.
3 Click Save & Close to close the window.
QuickBooks returns you to the QuickReport.
242
L E S S O N 9
Customizing QuickReports
Each QuickReport window has a buttonbar at the top of the report for customizing report content and layout.
In this exercise, you’ll customize the QuickReport you just created to display transaction numbers in the report.
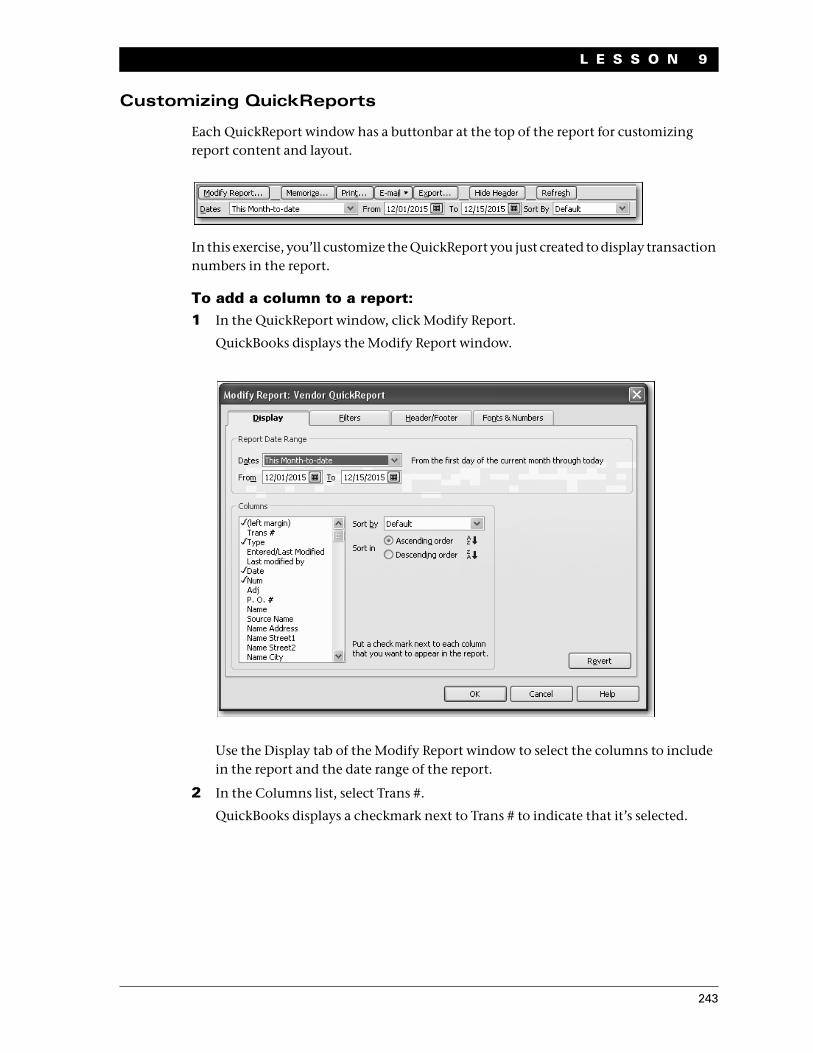
To add a column to a report:1 In the QuickReport window, click Modify Report.
QuickBooks displays the Modify Report window.
Use the Display tab of the Modify Report window to select the columns to include in the report and the date range of the report.
2 In the Columns list, select Trans #.
QuickBooks displays a checkmark next to Trans # to indicate that it’s selected.
243
A n a l y z i n g f i n a n c i a l d a t a
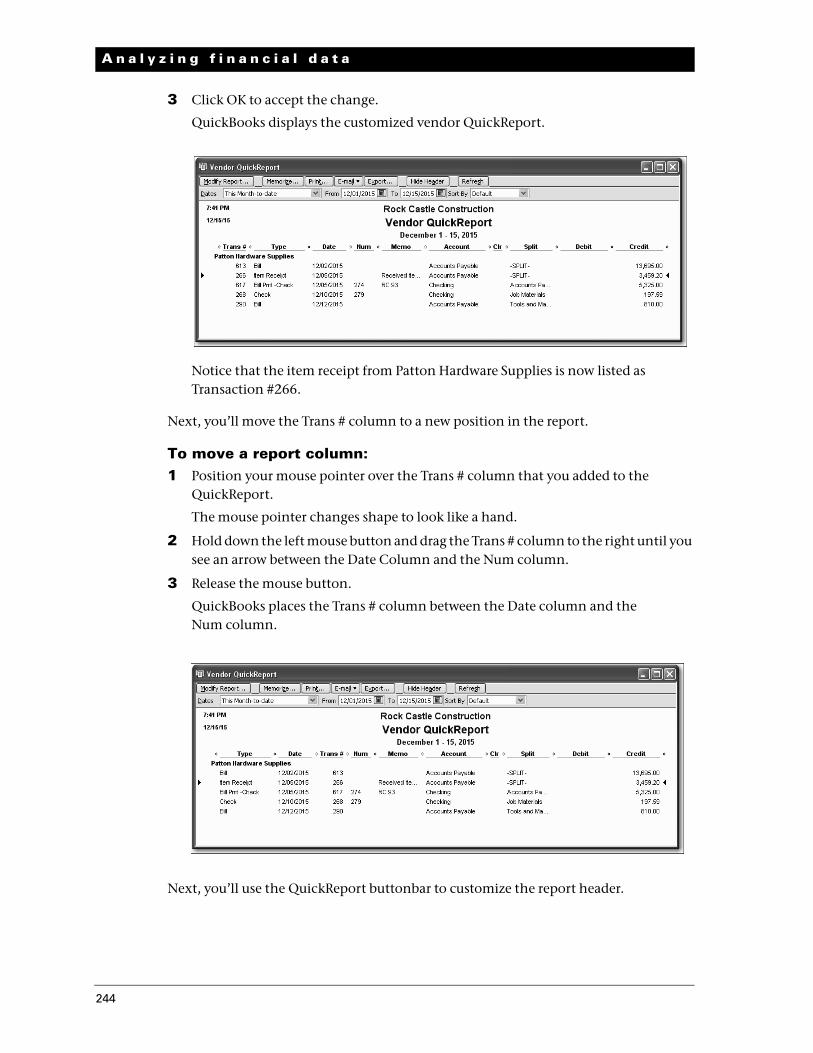
3 Click OK to accept the change.
QuickBooks displays the customized vendor QuickReport.
Notice that the item receipt from Patton Hardware Supplies is now listed as Transaction #266.
Next, you’ll move the Trans # column to a new position in the report.
To move a report column:1 Position your mouse pointer over the Trans # column that you added to the
QuickReport.
The mouse pointer changes shape to look like a hand.
2 Hold down the left mouse button and drag the Trans # column to the right until you see an arrow between the Date Column and the Num column.
3 Release the mouse button.
QuickBooks places the Trans # column between the Date column and the Num column.
Next, you’ll use the QuickReport buttonbar to customize the report header.
244
L E S S O N 9
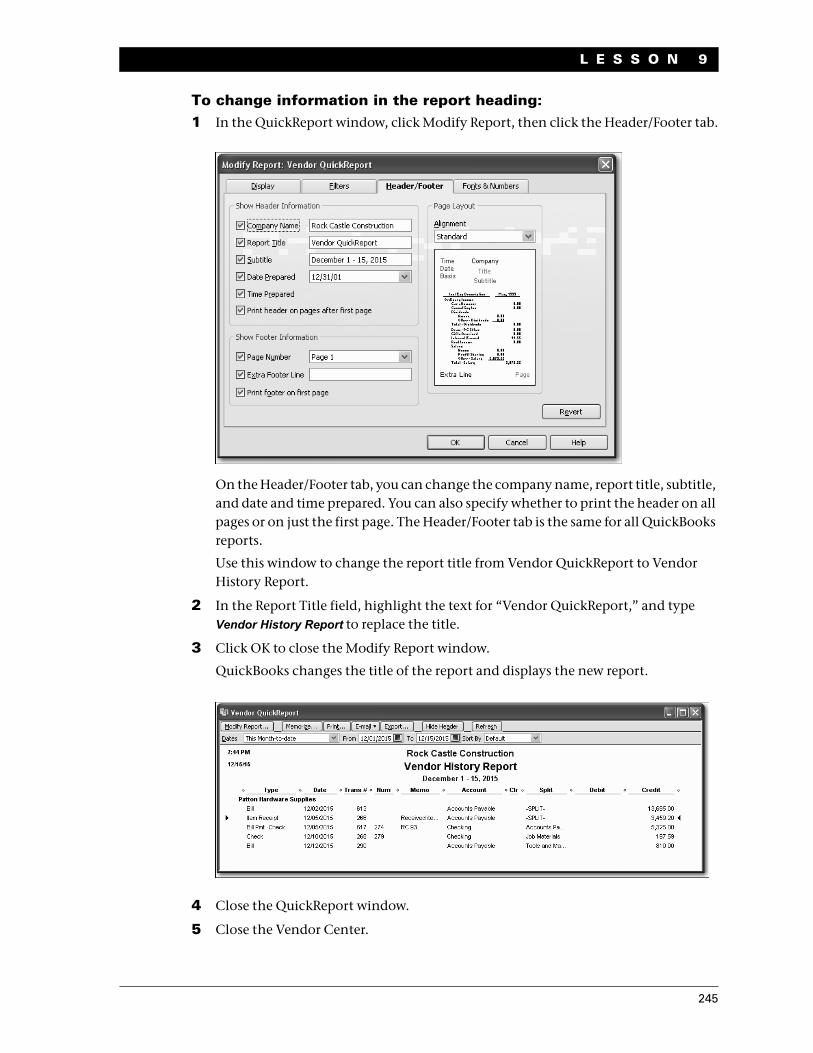
To change information in the report heading:1 In the QuickReport window, click Modify Report, then click the Header/Footer tab.
On the Header/Footer tab, you can change the company name, report title, subtitle, and date and time prepared. You can also specify whether to print the header on all pages or on just the first page. The Header/Footer tab is the same for all QuickBooks reports.
Use this window to change the report title from Vendor QuickReport to Vendor History Report.
2 In the Report Title field, highlight the text for “Vendor QuickReport,” and type Vendor History Report to replace the title.
3 Click OK to close the Modify Report window.
QuickBooks changes the title of the report and displays the new report.
4 Close the QuickReport window.
5 Close the Vendor Center.
245
A n a l y z i n g f i n a n c i a l d a t a
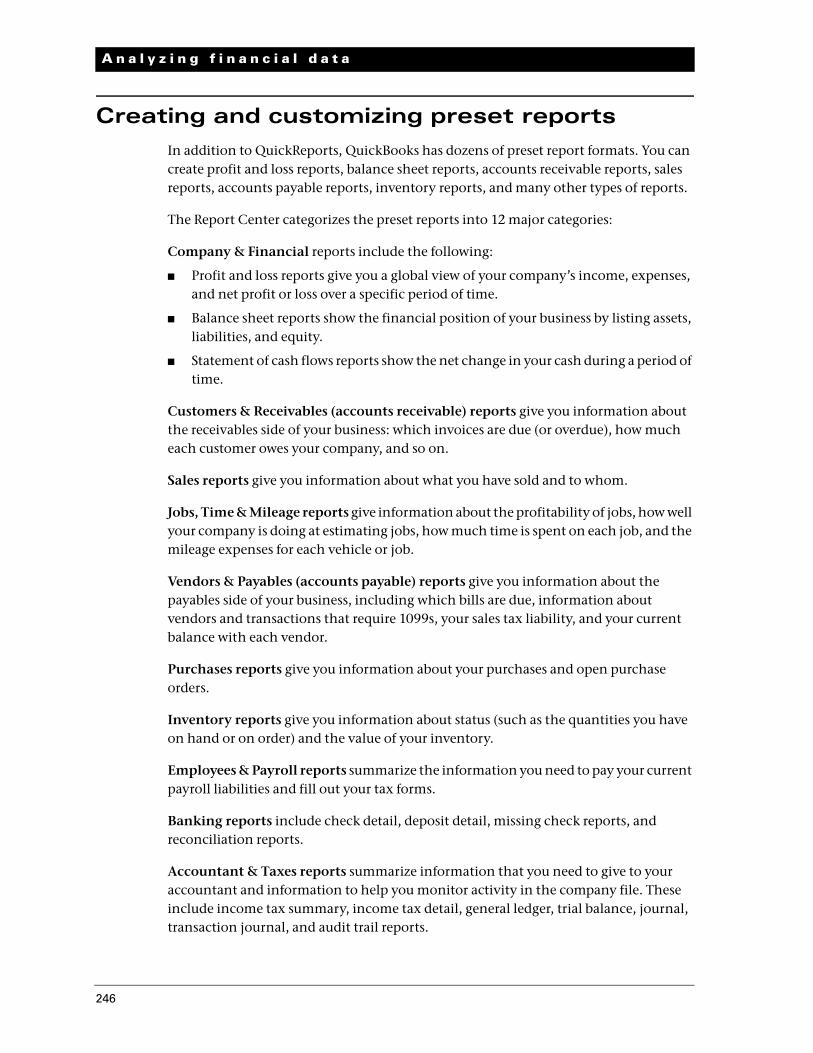
Creating and customizing preset reports
In addition to QuickReports, QuickBooks has dozens of preset report formats. You can create profit and loss reports, balance sheet reports, accounts receivable reports, sales reports, accounts payable reports, inventory reports, and many other types of reports.
The Report Center categorizes the preset reports into 12 major categories:
Company & Financial reports include the following:
Profit and loss reports give you a global view of your company’s income, expenses, and net profit or loss over a specific period of time.
Balance sheet reports show the financial position of your business by listing assets, liabilities, and equity.
Statement of cash flows reports show the net change in your cash during a period of time.
Customers & Receivables (accounts receivable) reports give you information about the receivables side of your business: which invoices are due (or overdue), how much each customer owes your company, and so on.
Sales reports give you information about what you have sold and to whom.
Jobs, Time & Mileage reports give information about the profitability of jobs, how well your company is doing at estimating jobs, how much time is spent on each job, and the mileage expenses for each vehicle or job.
Vendors & Payables (accounts payable) reports give you information about the payables side of your business, including which bills are due, information about vendors and transactions that require 1099s, your sales tax liability, and your current balance with each vendor.
Purchases reports give you information about your purchases and open purchase orders.
Inventory reports give you information about status (such as the quantities you have on hand or on order) and the value of your inventory.
Employees & Payroll reports summarize the information you need to pay your current payroll liabilities and fill out your tax forms.
Banking reports include check detail, deposit detail, missing check reports, and reconciliation reports.
Accountant & Taxes reports summarize information that you need to give to your accountant and information to help you monitor activity in the company file. These include income tax summary, income tax detail, general ledger, trial balance, journal, transaction journal, and audit trail reports.
246
L E S S O N 9
Budget & Forecast reports show how your income and expenses compare to the budgets you’ve set up and help you forecast income and expenses and compare actual values to forecasts.
List reports let you report on any information stored in a QuickBooks list.
Industry Specific reports are available in each of the industry-specific editions of QuickBooks. Accountant Edition includes the reports from all of the industry-specific editions.
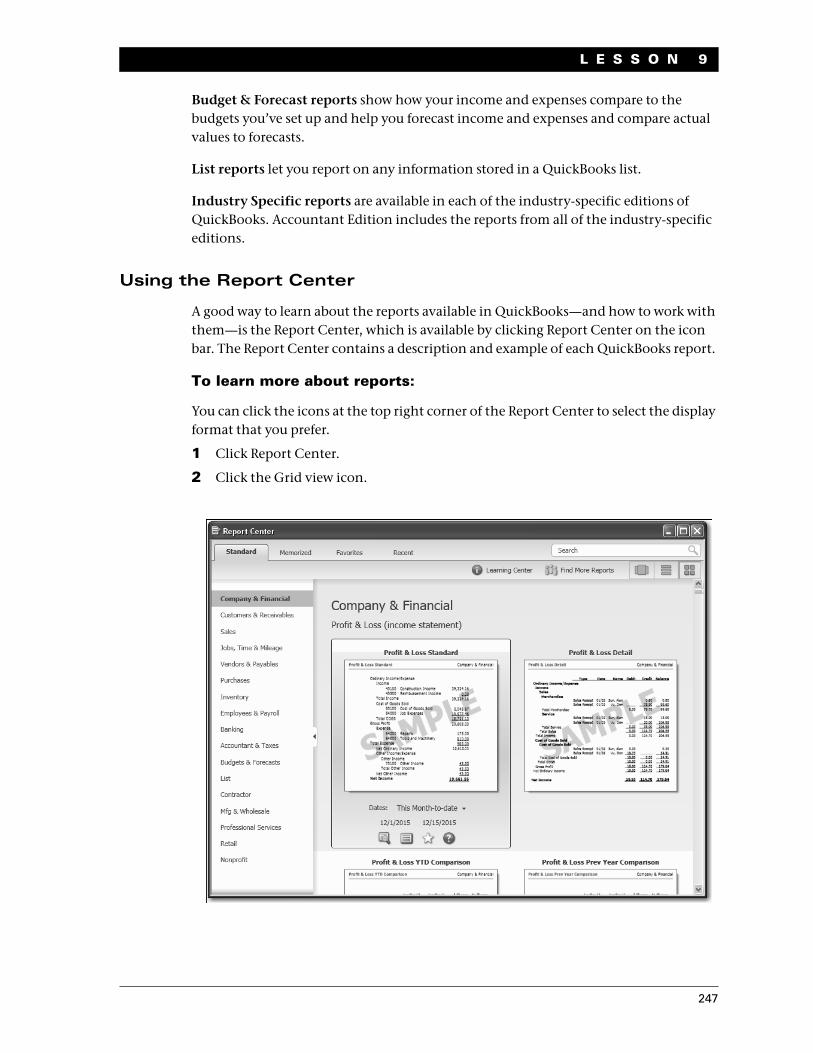
Using the Report Center
A good way to learn about the reports available in QuickBooks—and how to work with them—is the Report Center, which is available by clicking Report Center on the icon bar. The Report Center contains a description and example of each QuickBooks report.
To learn more about reports:
You can click the icons at the top right corner of the Report Center to select the display format that you prefer.
1 Click Report Center.
2 Click the Grid view icon.
247
A n a l y z i n g f i n a n c i a l d a t a
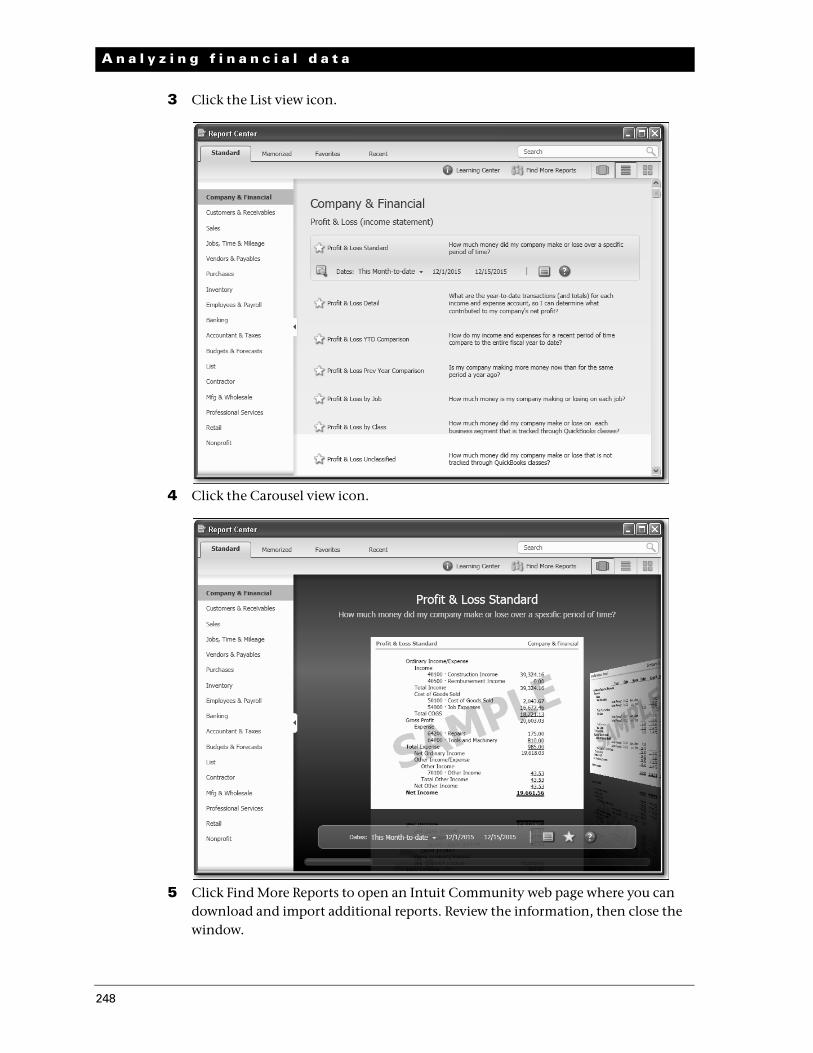
3 Click the List view icon.
4 Click the Carousel view icon.
5 Click Find More Reports to open an Intuit Community web page where you can download and import additional reports. Review the information, then close the window.
248
L E S S O N 9
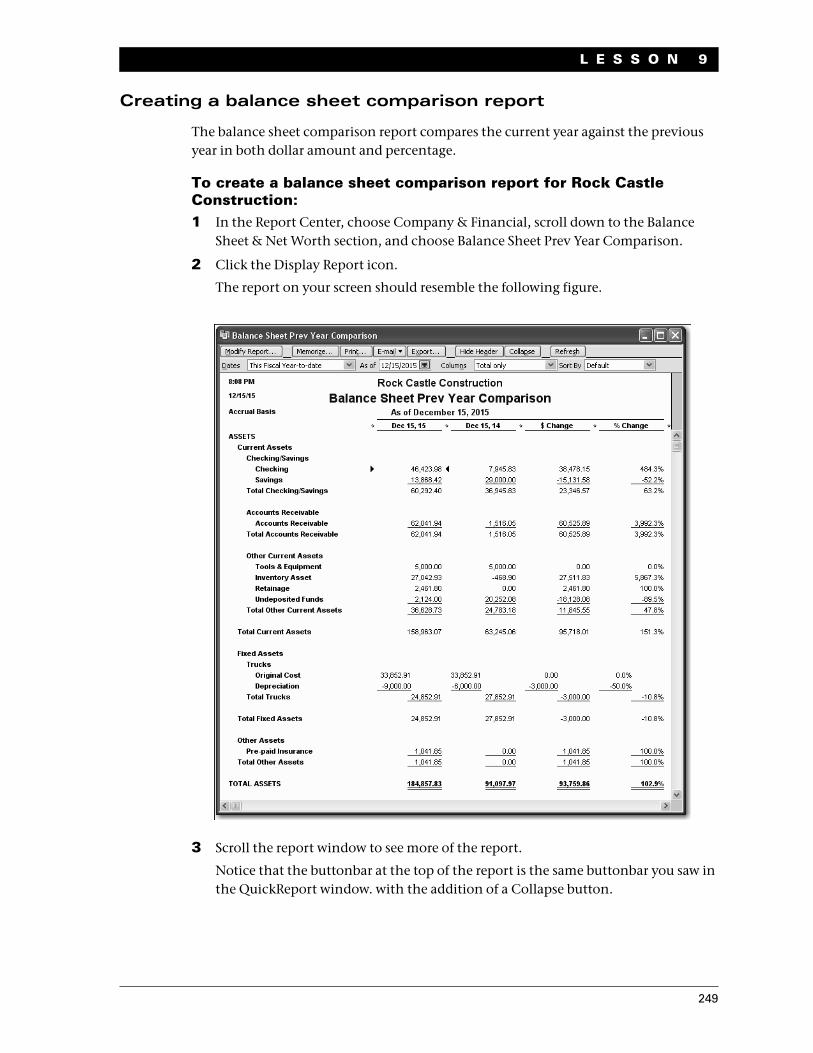
Creating a balance sheet comparison report
The balance sheet comparison report compares the current year against the previous year in both dollar amount and percentage.
To create a balance sheet comparison report for Rock Castle Construction:1 In the Report Center, choose Company & Financial, scroll down to the Balance
Sheet & Net Worth section, and choose Balance Sheet Prev Year Comparison.
2 Click the Display Report icon.
The report on your screen should resemble the following figure.
3 Scroll the report window to see more of the report.
Notice that the buttonbar at the top of the report is the same buttonbar you saw in the QuickReport window. with the addition of a Collapse button.
249
A n a l y z i n g f i n a n c i a l d a t a
4 Click the Collapse button to see the difference.
The Collapse button hides subaccounts, jobs, and subclasses. Amounts are summarized under the main heading. This button affects both the onscreen and printed report.
5 Click Expand to return to the original report display.
6 Keep the report displayed on your screen. You’ll use it in the next exercise.
Filtering reports
You can customize preset reports the same way you customize QuickReports. In this exercise you’ll customize the balance sheet comparison report and filter it to include only the transactions you specify.
Report filters let you set custom criteria for the transactions you want included in a report. When you filter a report, QuickBooks includes only those transactions that match the rules you create.
To filter a preset report:1 With the balance sheet prev year comparison report displayed, click Modify Report
on the report buttonbar.
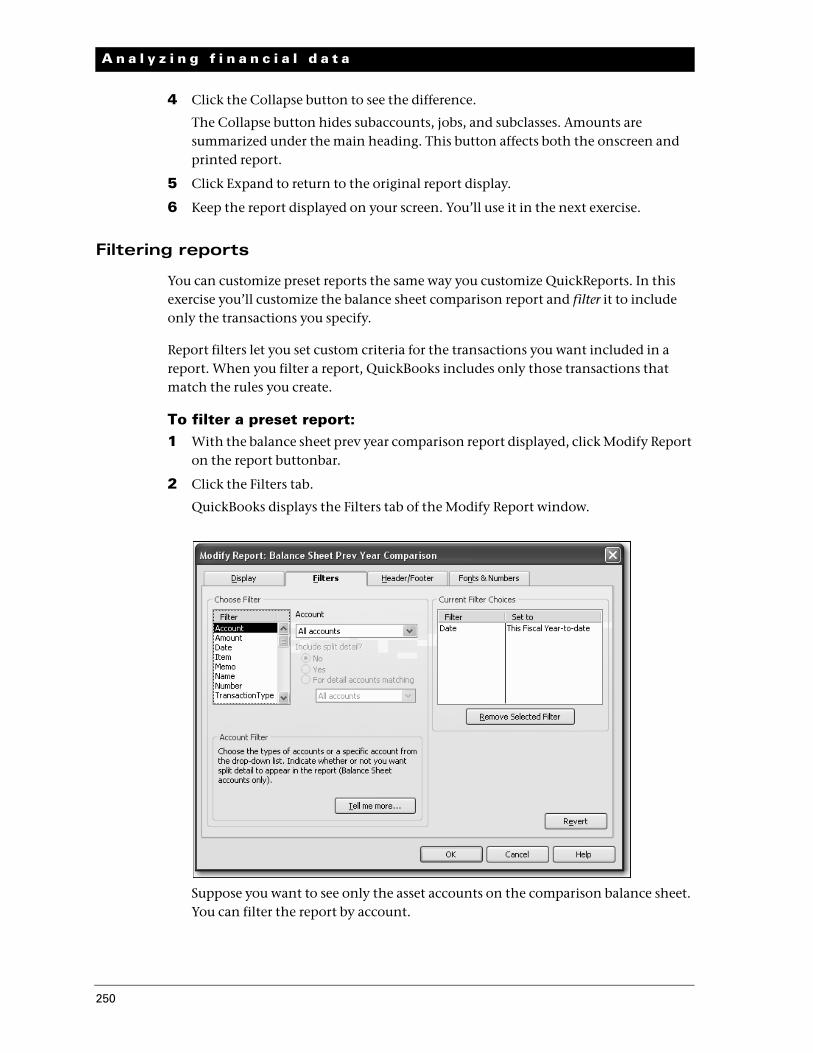
2 Click the Filters tab.
QuickBooks displays the Filters tab of the Modify Report window.
Suppose you want to see only the asset accounts on the comparison balance sheet. You can filter the report by account.
250
L E S S O N 9
3 In the Filter scroll box, make sure Account is selected.
Notice that QuickBooks provides a description of the selected filter below the list of filters. If you need more information about how applying a particular filter will affect the report, click Tell me more.
4 In the Account field, choose All assets from the drop-down list.
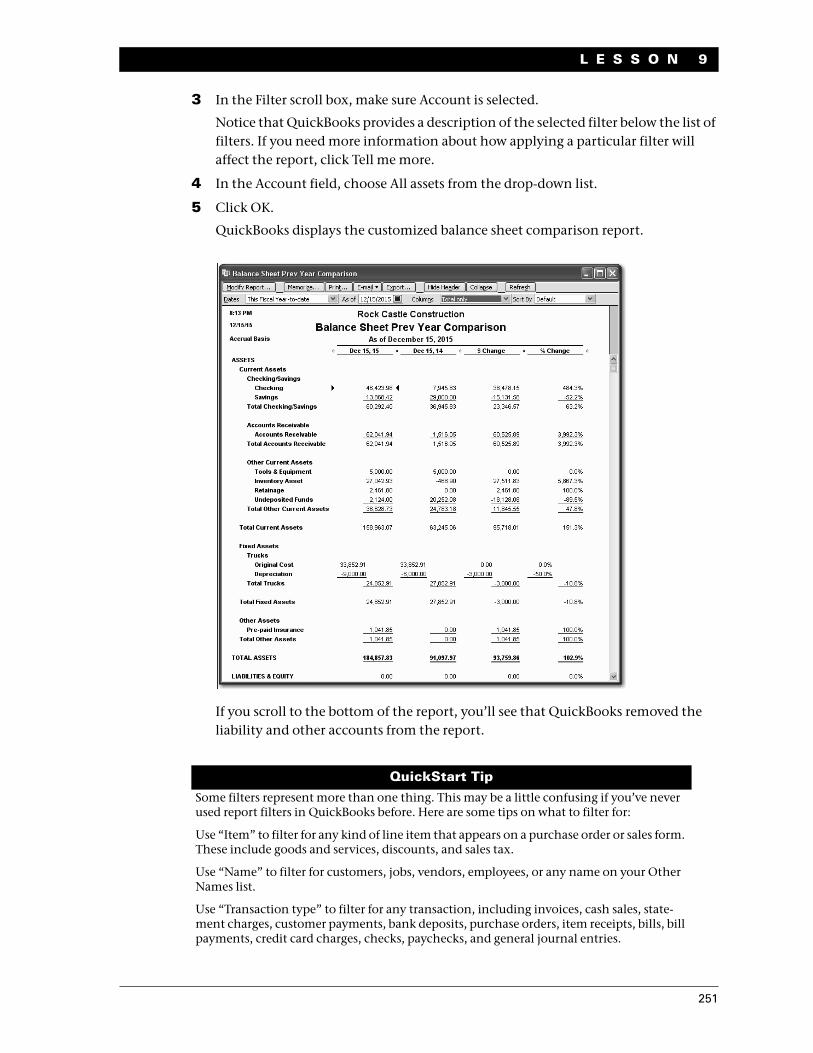
5 Click OK.
QuickBooks displays the customized balance sheet comparison report.
If you scroll to the bottom of the report, you’ll see that QuickBooks removed the liability and other accounts from the report.
QuickStart TipSome filters represent more than one thing. This may be a little confusing if you’ve never used report filters in QuickBooks before. Here are some tips on what to filter for:
Use “Item” to filter for any kind of line item that appears on a purchase order or sales form. These include goods and services, discounts, and sales tax.
Use “Name” to filter for customers, jobs, vendors, employees, or any name on your Other Names list.
Use “Transaction type” to filter for any transaction, including invoices, cash sales, state-ment charges, customer payments, bank deposits, purchase orders, item receipts, bills, bill payments, credit card charges, checks, paychecks, and general journal entries.
251
A n a l y z i n g f i n a n c i a l d a t a
Saving reports in PDF format
To keep a record of the information in the report as it exists today, you can save the report in Portable Document Format (PDF).
To save a report as a PDF file:1 With the report open, choose “Save as PDF” from the File menu.
2 Navigate to the folder in which you want to store the file, and enter a filename.
3 Click Save.
4 Close the report window.
5 Click No when asked if you want to add this report to the Memorized Report list.
6 Go to the Window menu and choose Close All.
7 Click Home in the icon bar.
Creating and customizing a sales report
In this exercise, you’ll create a QuickBooks sales report, which you will then customize by changing the date range it covers.
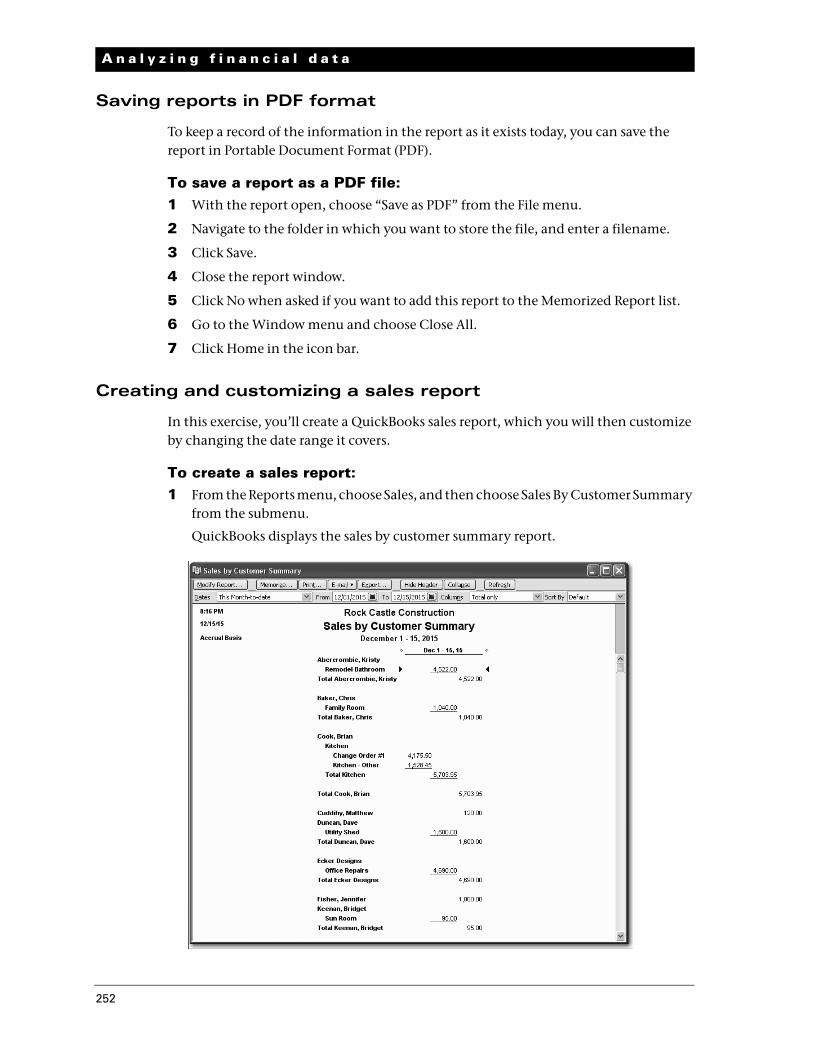
To create a sales report:1 From the Reports menu, choose Sales, and then choose Sales By Customer Summary
from the submenu.
QuickBooks displays the sales by customer summary report.
252
L E S S O N 9
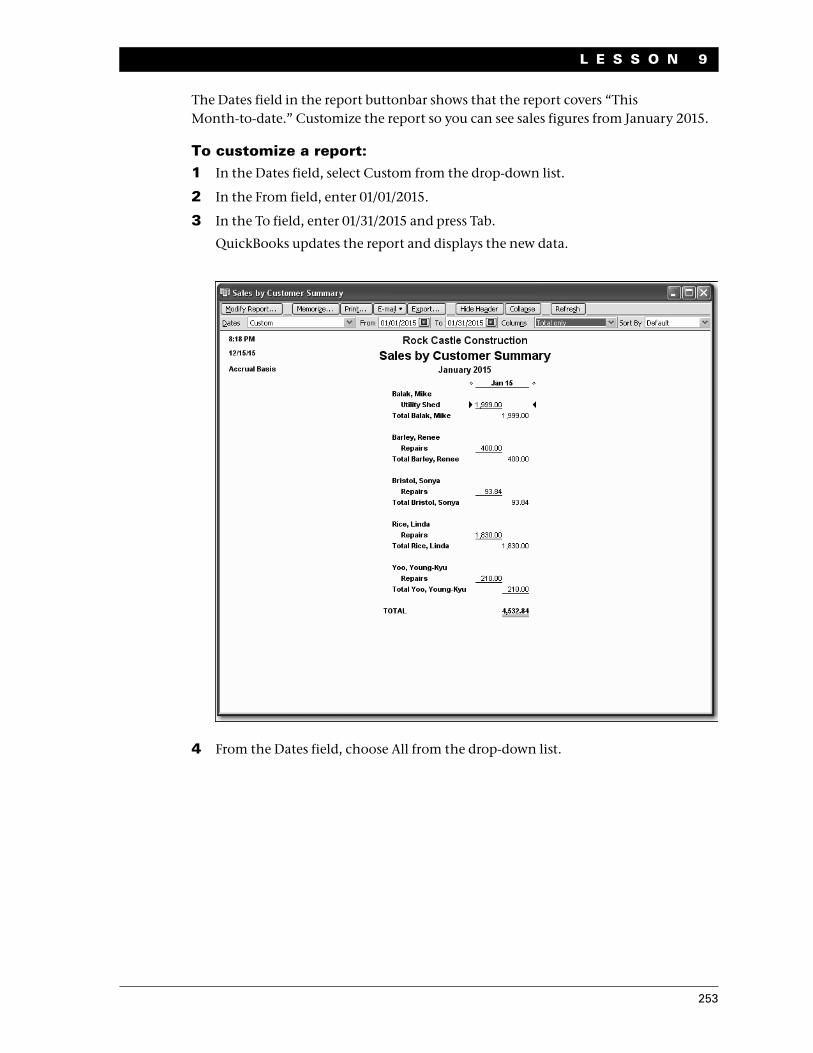
The Dates field in the report buttonbar shows that the report covers “This Month-to-date.” Customize the report so you can see sales figures from January 2015.
To customize a report:1 In the Dates field, select Custom from the drop-down list.
2 In the From field, enter 01/01/2015.
3 In the To field, enter 01/31/2015 and press Tab.
QuickBooks updates the report and displays the new data.
4 From the Dates field, choose All from the drop-down list.
253
A n a l y z i n g f i n a n c i a l d a t a
Using QuickZoom in a preset report
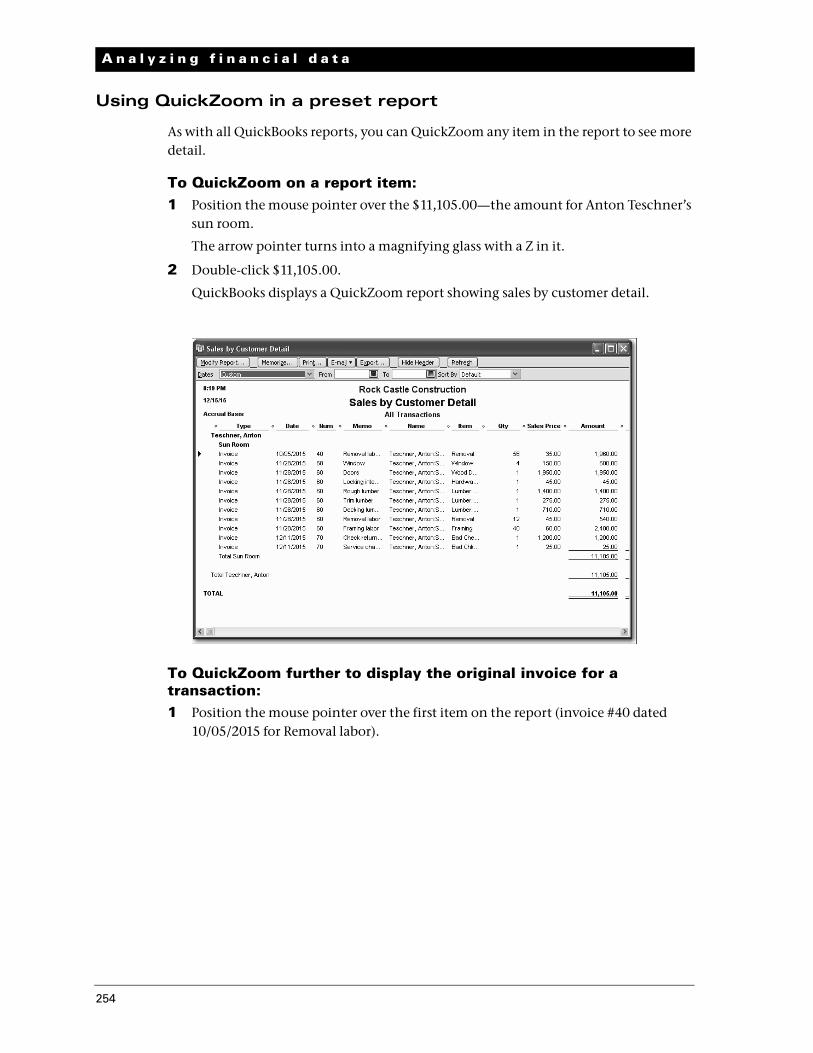
As with all QuickBooks reports, you can QuickZoom any item in the report to see more detail.
To QuickZoom on a report item:1 Position the mouse pointer over the $11,105.00—the amount for Anton Teschner’s
sun room.
The arrow pointer turns into a magnifying glass with a Z in it.
2 Double-click $11,105.00.
QuickBooks displays a QuickZoom report showing sales by customer detail.
To QuickZoom further to display the original invoice for a transaction:1 Position the mouse pointer over the first item on the report (invoice #40 dated
10/05/2015 for Removal labor).
254
L E S S O N 9
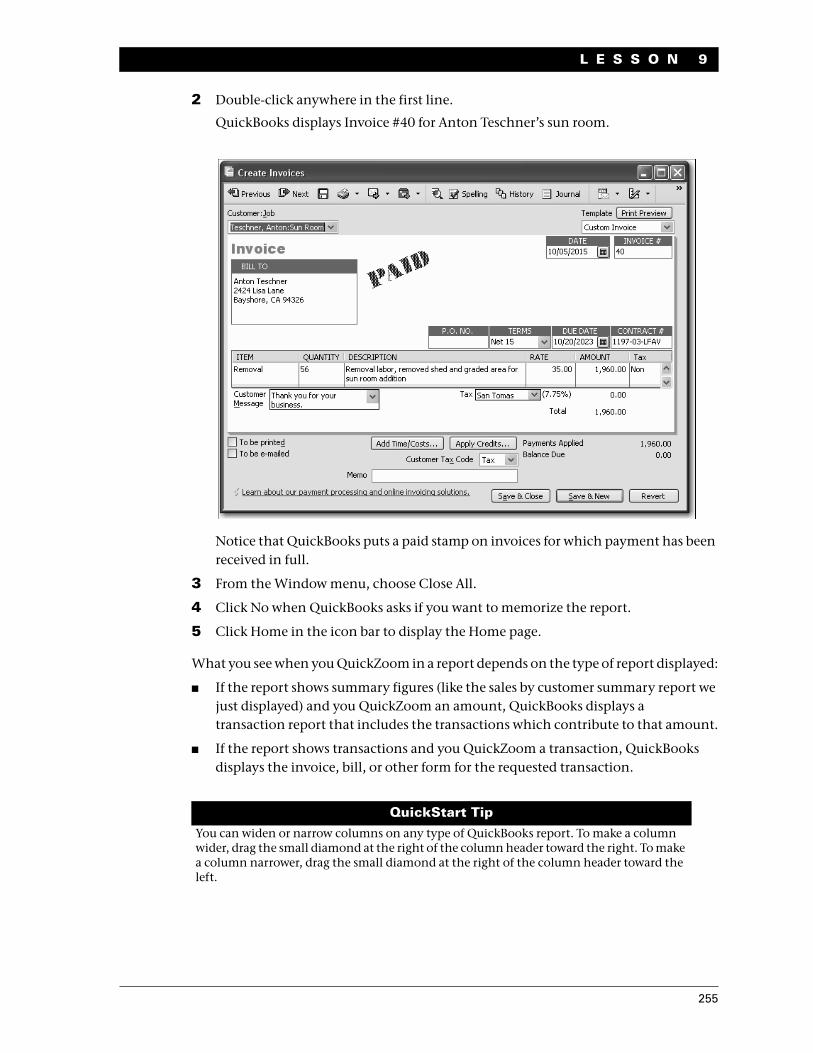
2 Double-click anywhere in the first line.
QuickBooks displays Invoice #40 for Anton Teschner’s sun room.
Notice that QuickBooks puts a paid stamp on invoices for which payment has been received in full.
3 From the Window menu, choose Close All.
4 Click No when QuickBooks asks if you want to memorize the report.
5 Click Home in the icon bar to display the Home page.
What you see when you QuickZoom in a report depends on the type of report displayed:
If the report shows summary figures (like the sales by customer summary report we just displayed) and you QuickZoom an amount, QuickBooks displays a transaction report that includes the transactions which contribute to that amount.
If the report shows transactions and you QuickZoom a transaction, QuickBooks displays the invoice, bill, or other form for the requested transaction.
QuickStart TipYou can widen or narrow columns on any type of QuickBooks report. To make a column wider, drag the small diamond at the right of the column header toward the right. To make a column narrower, drag the small diamond at the right of the column header toward the left.
255
A n a l y z i n g f i n a n c i a l d a t a
Saving report settings
After you have customized a report to provide the information you need, you can have QuickBooks memorize the settings so you can quickly produce the same report in the future. (QuickBooks memorizes a report’s settings, not the actual data.)
Note: If you use one of the QuickBooks Premier products, you can export the settings for memorized reports as report templates. A report template lets you specify all of a report’s settings in advance—for example, report date, format, and filters. Report templates can be imported into other QuickBooks data files and then accessed from the Memorized Report list.
Creating memorized report groups
In addition to saving report settings, you can create memorized report groups that you can use to organize your memorized reports in a way that makes sense for your business and to allow you to quickly process a group of reports at once.
QuickBooks comes preset with a number of memorized report groups each containing common reports for each area. You can add your own reports to these groups, modify the groups to meet your needs, and even create your own groups.
In this exercise, you’ll create a memorized group called “Year End” to which you will add some memorized reports. Later, you learn how you can batch process memorized reports.
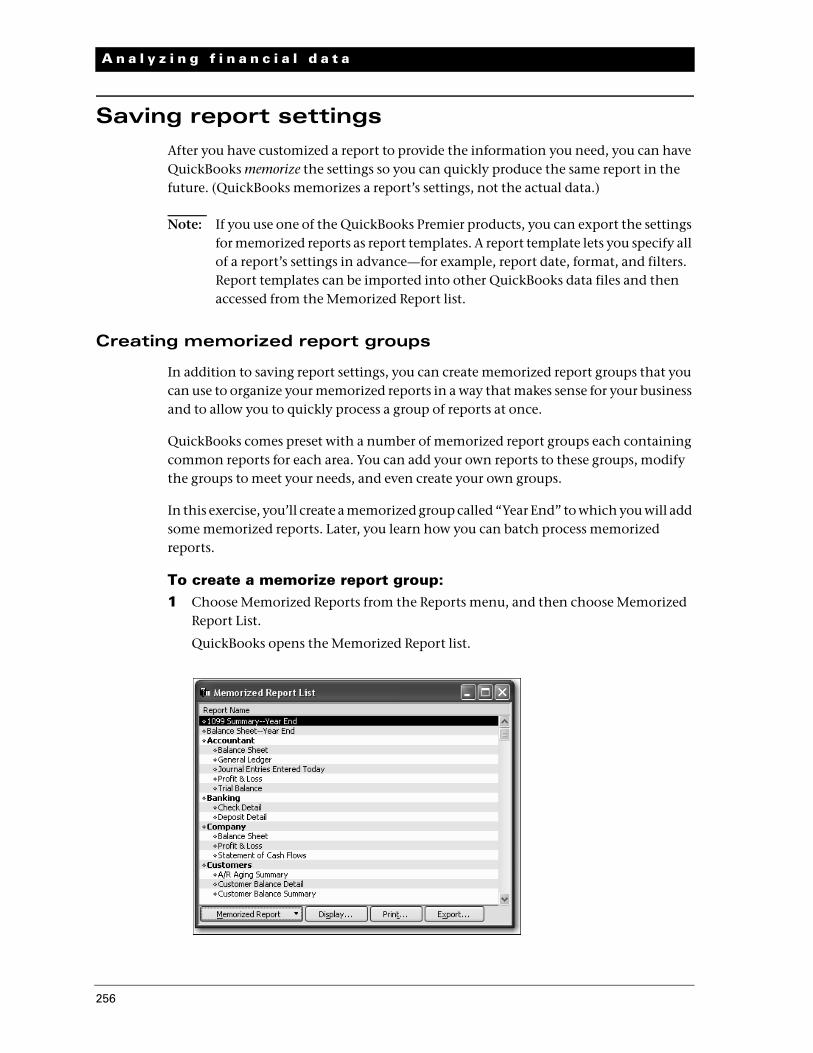
To create a memorize report group:1 Choose Memorized Reports from the Reports menu, and then choose Memorized
Report List.
QuickBooks opens the Memorized Report list.
256
L E S S O N 9
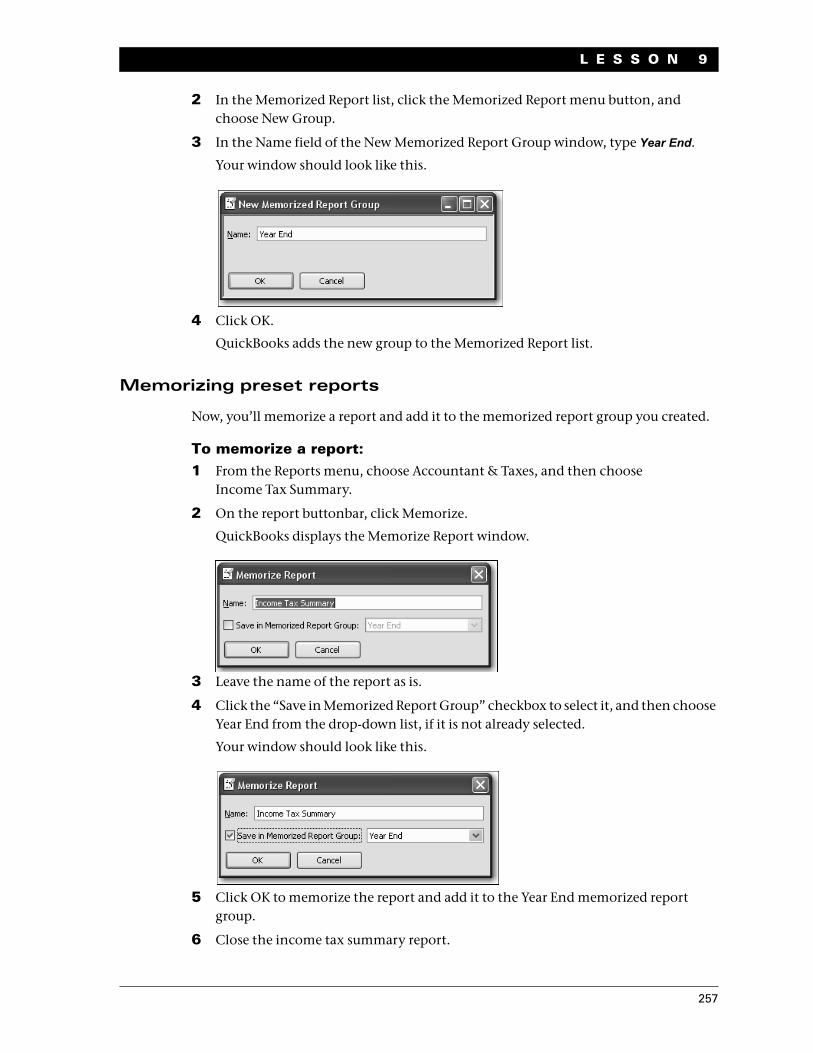
2 In the Memorized Report list, click the Memorized Report menu button, and choose New Group.
3 In the Name field of the New Memorized Report Group window, type Year End.
Your window should look like this.
4 Click OK.
QuickBooks adds the new group to the Memorized Report list.
Memorizing preset reports
Now, you’ll memorize a report and add it to the memorized report group you created.
To memorize a report:1 From the Reports menu, choose Accountant & Taxes, and then choose
Income Tax Summary.
2 On the report buttonbar, click Memorize.
QuickBooks displays the Memorize Report window.
3 Leave the name of the report as is.
4 Click the “Save in Memorized Report Group” checkbox to select it, and then choose Year End from the drop-down list, if it is not already selected.
Your window should look like this.
5 Click OK to memorize the report and add it to the Year End memorized report group.
6 Close the income tax summary report.
257
A n a l y z i n g f i n a n c i a l d a t a
Adding reports to memorized report groups
Now, you’ll add two previously memorized reports to the Year End group.
To add memorized reports to a memorized report group:1 In the Memorized Report List window, select the report called
“1099 Summary--Year End.”
2 Click the Memorized Report menu button, and then choose Edit Memorized Report.
QuickBooks opens the Edit Memorized Report window.
3 Leave the report name as is.
4 Click the “Save in Memorized Report Group” checkbox to select it, and then choose Year End from the drop-down list.
5 Click OK.
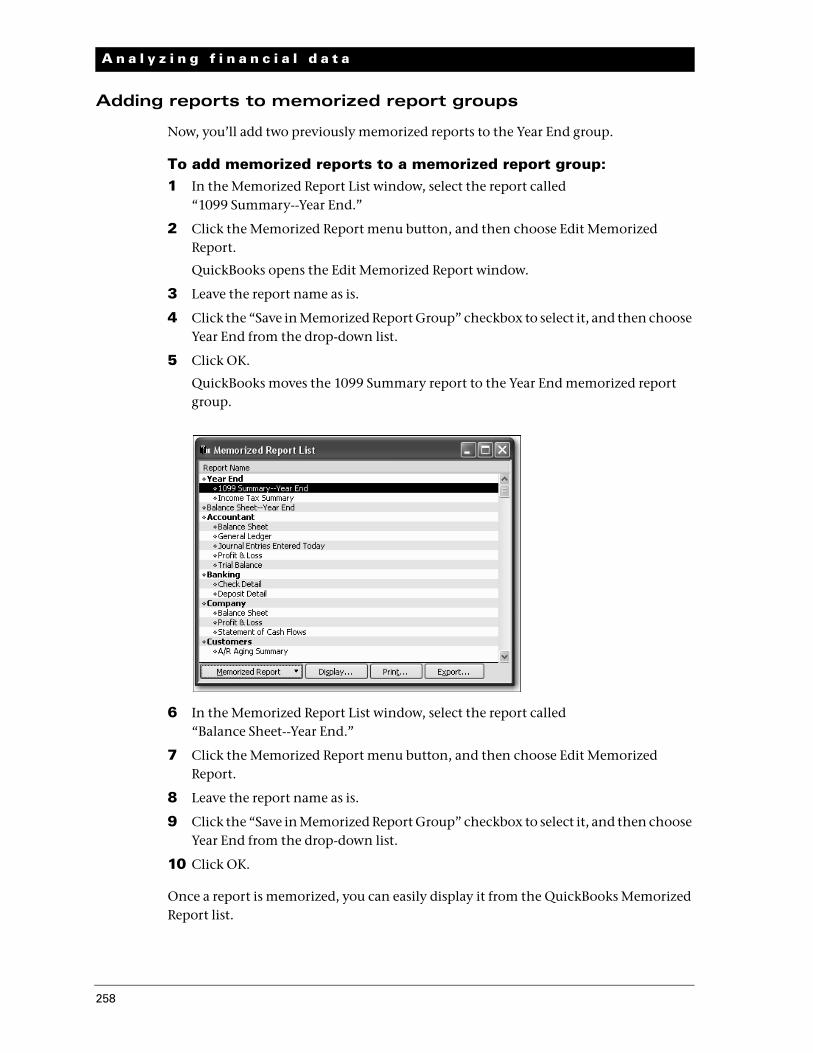
QuickBooks moves the 1099 Summary report to the Year End memorized report group.
6 In the Memorized Report List window, select the report called “Balance Sheet--Year End.”
7 Click the Memorized Report menu button, and then choose Edit Memorized Report.
8 Leave the report name as is.
9 Click the “Save in Memorized Report Group” checkbox to select it, and then choose Year End from the drop-down list.
10 Click OK.
Once a report is memorized, you can easily display it from the QuickBooks Memorized Report list.
258
L E S S O N 9
To display a memorized report:1 In the Memorized Report list, select “Balance Sheet--Year End.”
2 Click Display.
QuickBooks displays the report.
3 Leave the report open.
Printing reports
Any time you have a report displayed in the report window, you can print it by clicking the Print button in the report buttonbar.
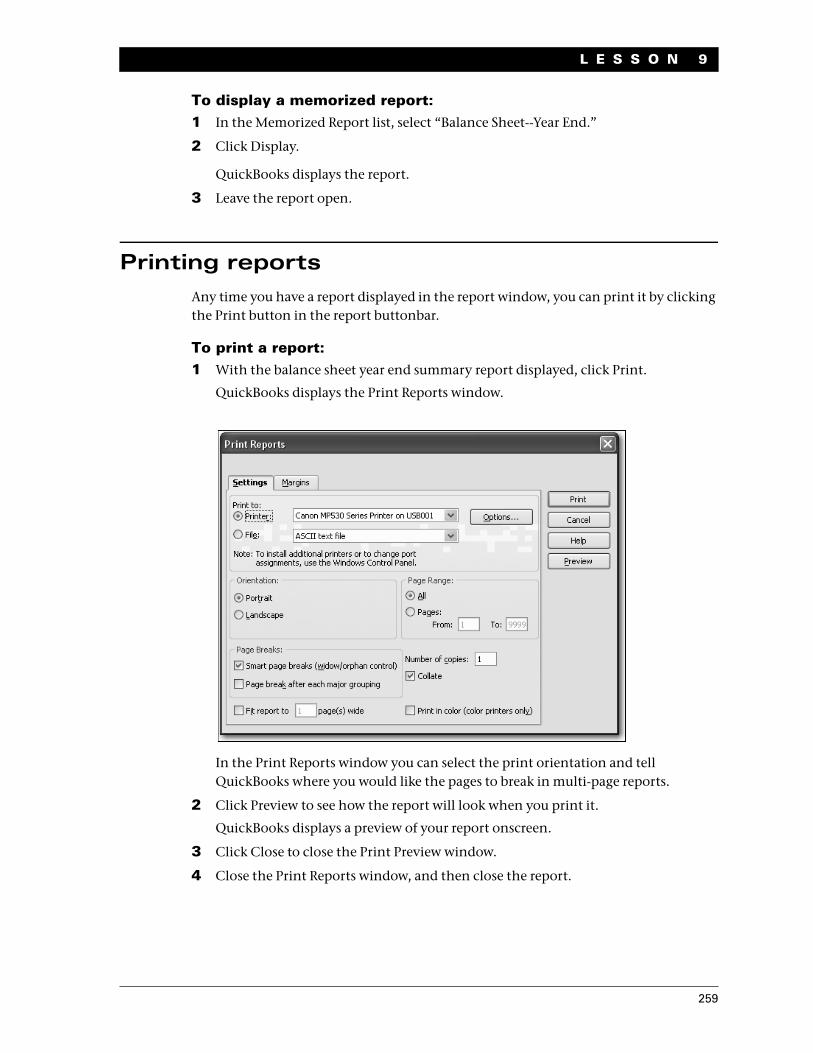
To print a report:1 With the balance sheet year end summary report displayed, click Print.
QuickBooks displays the Print Reports window.
In the Print Reports window you can select the print orientation and tell QuickBooks where you would like the pages to break in multi-page reports.
2 Click Preview to see how the report will look when you print it.
QuickBooks displays a preview of your report onscreen.
3 Click Close to close the Print Preview window.
4 Close the Print Reports window, and then close the report.
259
A n a l y z i n g f i n a n c i a l d a t a
Processing reports in groups
Organizing your memorized reports in groups makes it fast and easy to process several reports at once. Now, you’ll process the reports you added to the Year End report group you created in the previous exercise.
To batch process reports:1 In the Memorized Report list, select Year End.
2 Click Display.
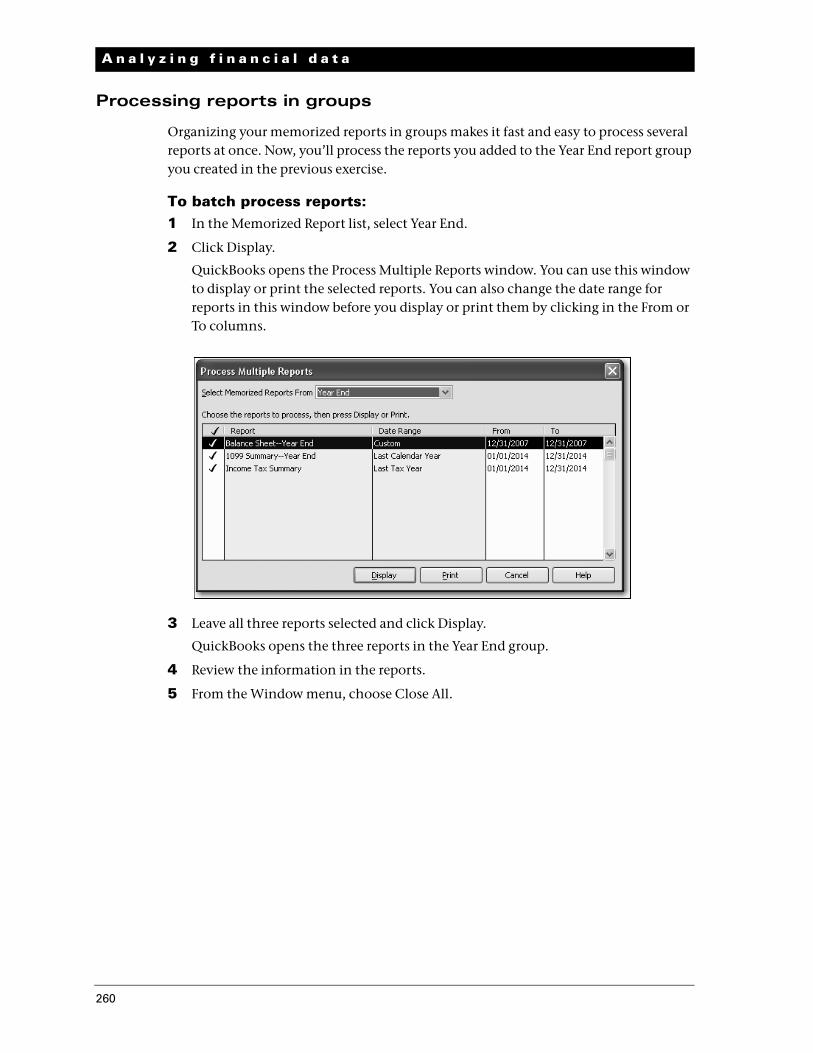
QuickBooks opens the Process Multiple Reports window. You can use this window to display or print the selected reports. You can also change the date range for reports in this window before you display or print them by clicking in the From or To columns.
3 Leave all three reports selected and click Display.
QuickBooks opens the three reports in the Year End group.
4 Review the information in the reports.
5 From the Window menu, choose Close All.
260
L E S S O N 9
Exporting reports to Microsoft Excel
Occasionally, you may want to change a report’s appearance or contents in ways that aren’t available in QuickBooks, filter report data in ways that you can’t in QuickBooks, or run “what-if” scenarios on your QuickBooks data.
You can send reports from QuickBooks to Microsoft Excel. Since the changes you make in Excel don’t affect your QuickBooks data, you’re free to customize reports as needed, and even change data to run what-if scenarios.
Note: To proceed with this exercise, you need Microsoft Excel 2000, 2002, 2003, or 2015. If you don’t have Excel, proceed to “Creating QuickInsight graphs” on page 268.
Sending a report to Microsoft Excel
When exporting a report to Microsoft Excel, you indicate whether or not you want to preserve the formatting from your QuickBooks report. You also have the option of turning on or off several Excel features from within QuickBooks.
By default, QuickBooks preserves the look of your report when exporting to Microsoft Excel, and turns on the following Excel features:
AutoFit sets column widths in Excel wide enough to display your data without cutting off words or numbers.
Freeze panes allows you to scroll through data while keeping the row and column headers in view.
Show Gridlines turns on gridlines in Excel.
In this exercise, you learn how to select which QuickBooks report formatting options you want to preserve in Excel, and how to turn on and off certain Excel features from within QuickBooks.
261
A n a l y z i n g f i n a n c i a l d a t a
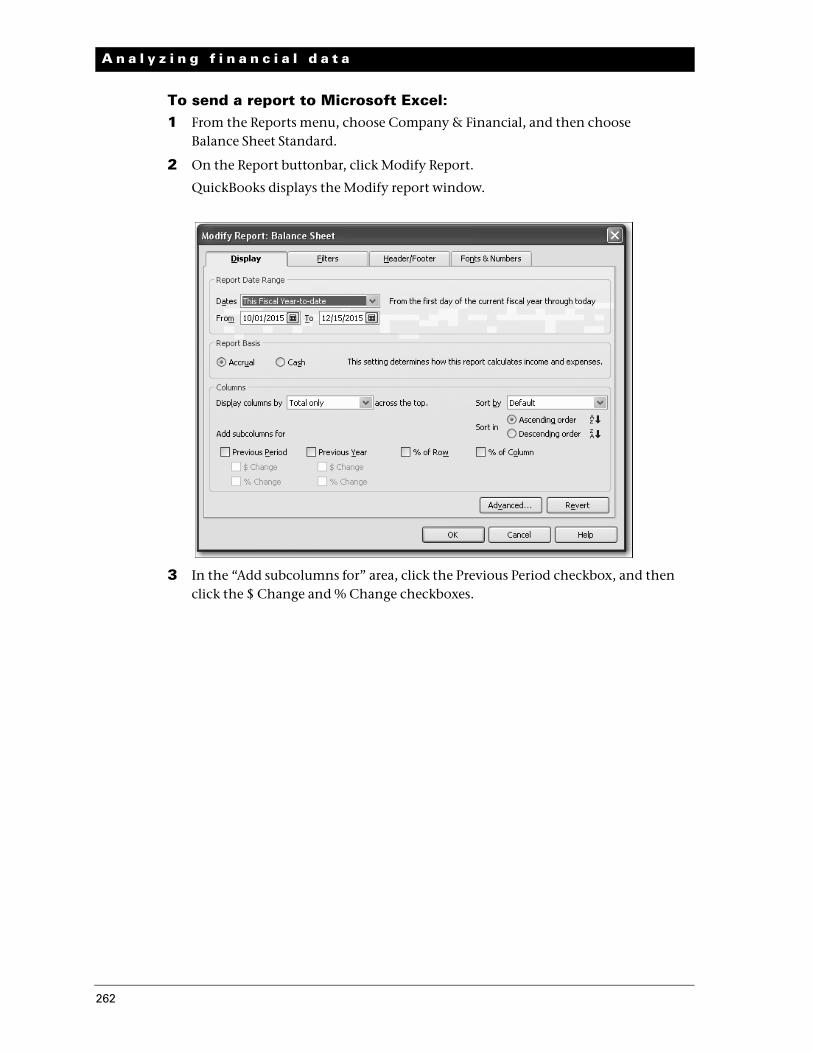
To send a report to Microsoft Excel:1 From the Reports menu, choose Company & Financial, and then choose
Balance Sheet Standard.
2 On the Report buttonbar, click Modify Report.
QuickBooks displays the Modify report window.
3 In the “Add subcolumns for” area, click the Previous Period checkbox, and then click the $ Change and % Change checkboxes.
262
L E S S O N 9
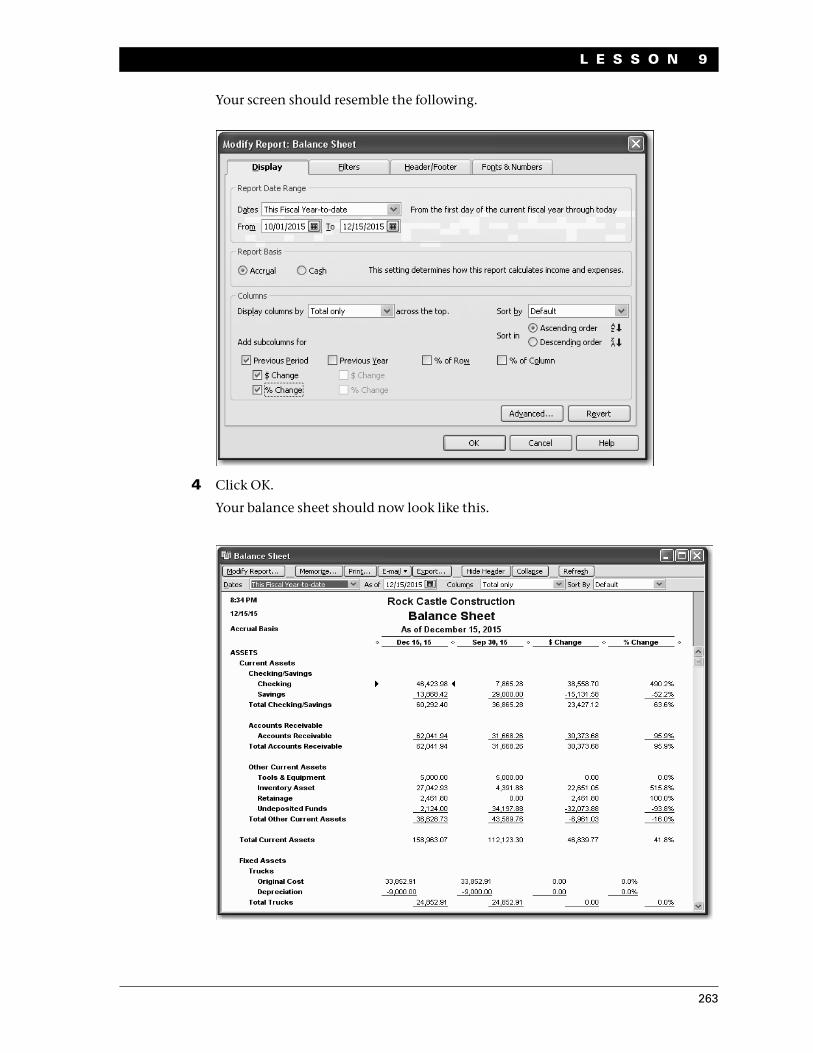
Your screen should resemble the following.
4 Click OK.
Your balance sheet should now look like this.
263
A n a l y z i n g f i n a n c i a l d a t a
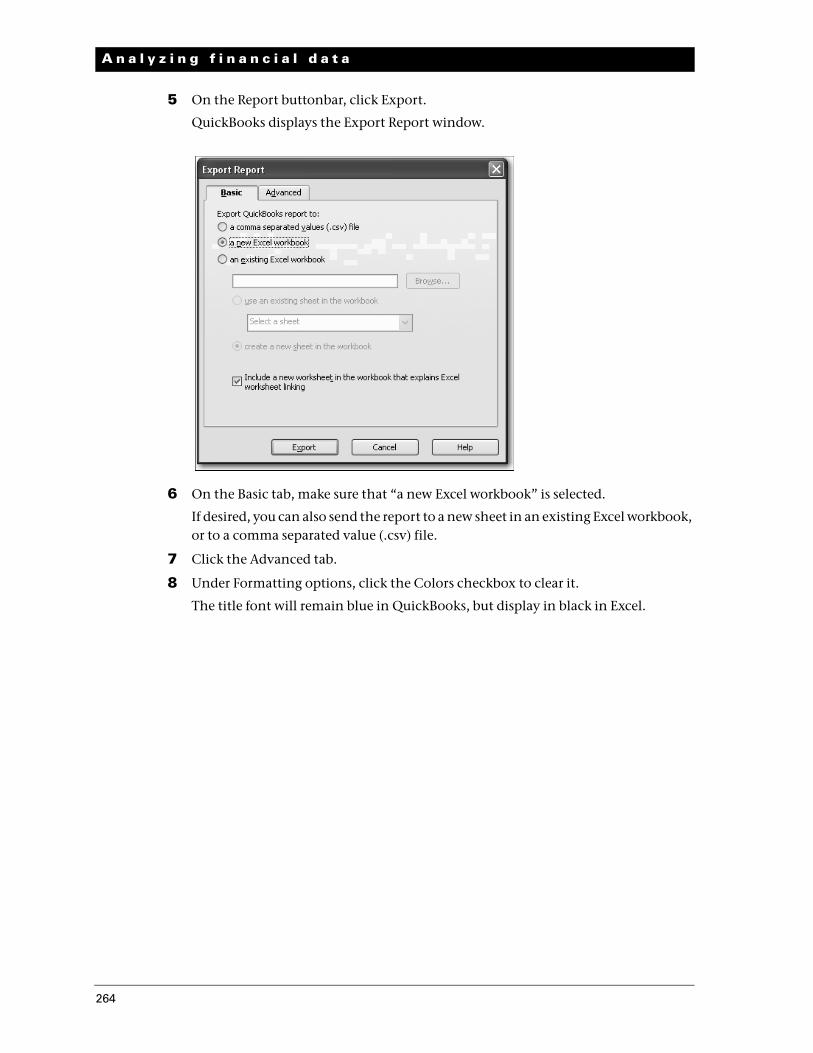
5 On the Report buttonbar, click Export.
QuickBooks displays the Export Report window.
6 On the Basic tab, make sure that “a new Excel workbook” is selected.
If desired, you can also send the report to a new sheet in an existing Excel workbook, or to a comma separated value (.csv) file.
7 Click the Advanced tab.
8 Under Formatting options, click the Colors checkbox to clear it.
The title font will remain blue in QuickBooks, but display in black in Excel.
264
L E S S O N 9
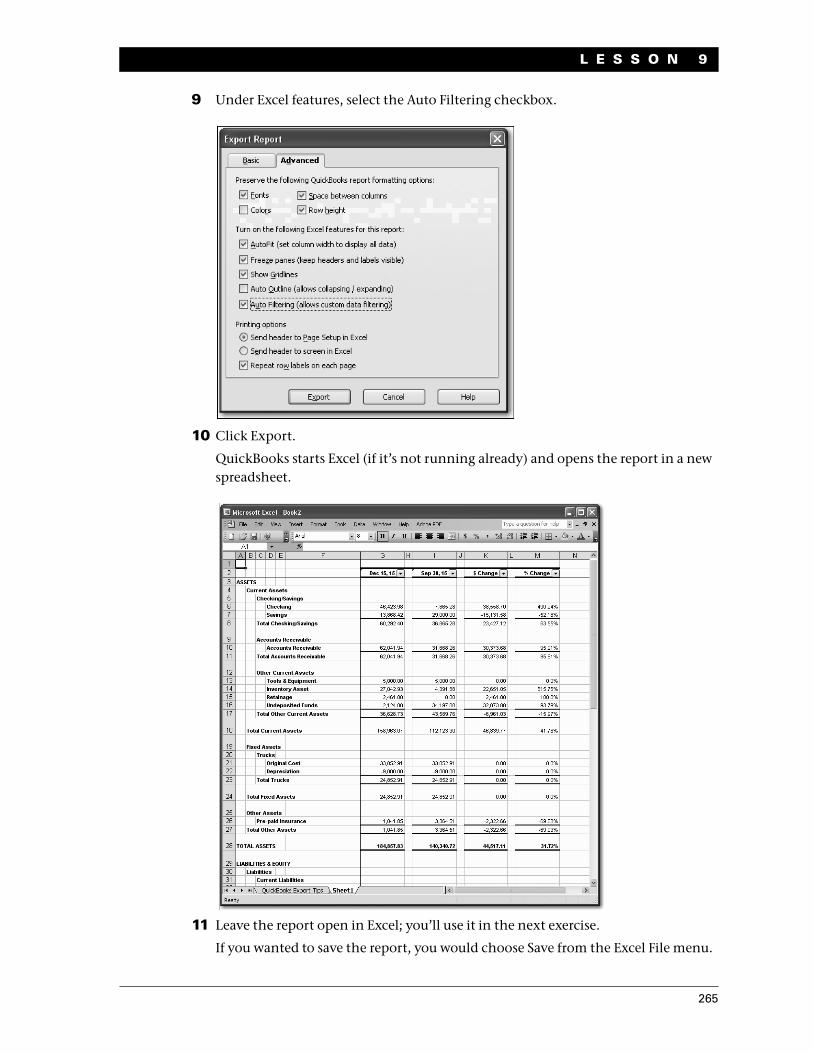
9 Under Excel features, select the Auto Filtering checkbox.
10 Click Export.
QuickBooks starts Excel (if it’s not running already) and opens the report in a new spreadsheet.
11 Leave the report open in Excel; you’ll use it in the next exercise.
If you wanted to save the report, you would choose Save from the Excel File menu.
265
A n a l y z i n g f i n a n c i a l d a t a
Filtering a report in Microsoft Excel
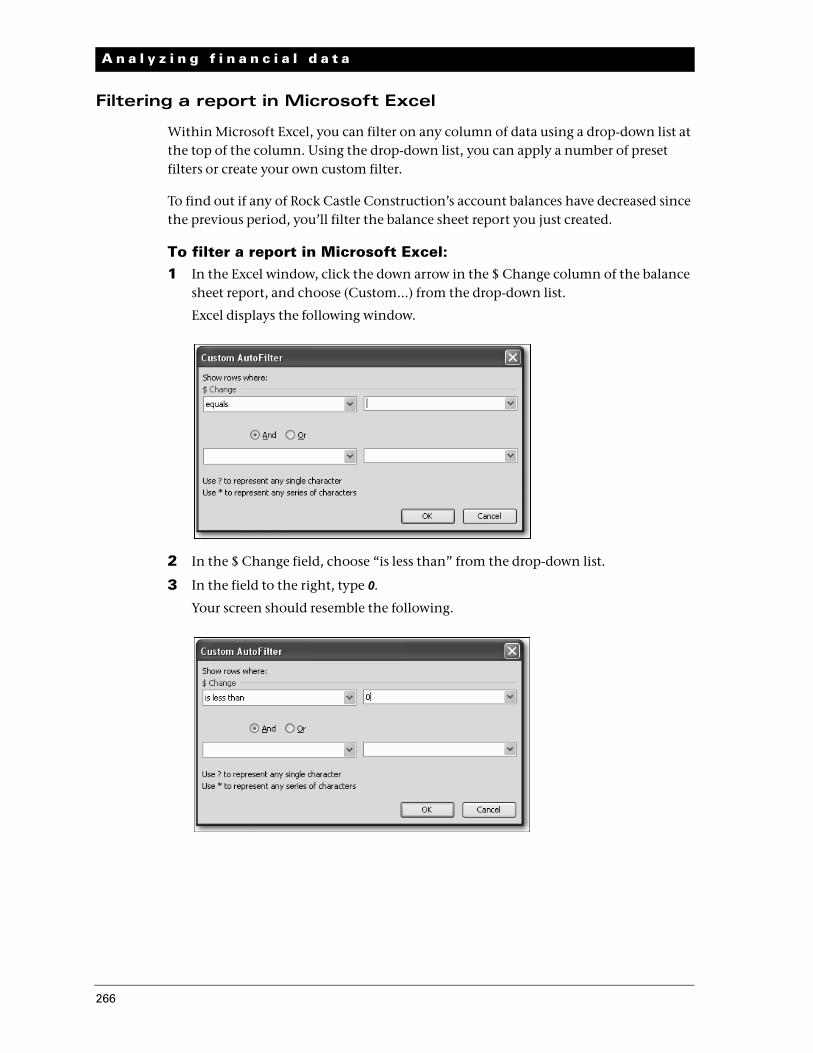
Within Microsoft Excel, you can filter on any column of data using a drop-down list at the top of the column. Using the drop-down list, you can apply a number of preset filters or create your own custom filter.
To find out if any of Rock Castle Construction’s account balances have decreased since the previous period, you’ll filter the balance sheet report you just created.
To filter a report in Microsoft Excel:1 In the Excel window, click the down arrow in the $ Change column of the balance
sheet report, and choose (Custom...) from the drop-down list.
Excel displays the following window.
2 In the $ Change field, choose “is less than” from the drop-down list.
3 In the field to the right, type 0.
Your screen should resemble the following.
266
L E S S O N 9
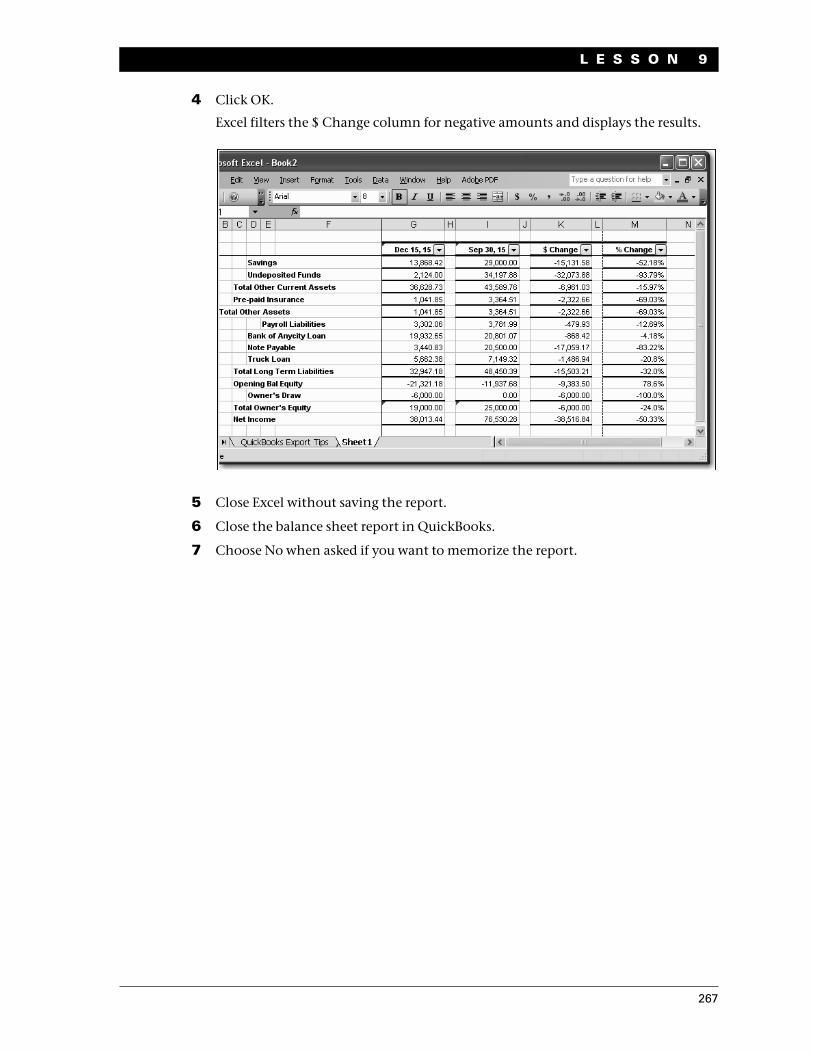
4 Click OK.
Excel filters the $ Change column for negative amounts and displays the results.
5 Close Excel without saving the report.
6 Close the balance sheet report in QuickBooks.
7 Choose No when asked if you want to memorize the report.
267
A n a l y z i n g f i n a n c i a l d a t a
Creating QuickInsight graphs
A report gives you numbers that are essential if you want to stay on top of your business finances. But when you want a visual picture to plan current or future business decisions, a graph is another invaluable tool.
A QuickInsight graph shows your data pictured as either a bar graph or a pie chart. The bar graphs and pie charts are simply different views of the same company financial information.
QuickBooks has six types of graphs, providing up to 15 different views of your data:
Income and Expenses graphs show your income and expenses for the period you specify.
Sales graphs show your company’s sales income for the period you specify.
Accounts Receivable graphs show how much your customers owe.
Accounts Payable graphs show how much you currently owe your vendors.
Net Worth graphs show changes in your company’s net worth.
Budget vs. Actual graphs let you see the variance between your budgeted amounts and the actual amount you earned or spent.
To create a QuickInsight graph, select the type of graph you want from a report submenu or from the Report Center.
Creating an Income and Expense graph
If you want your business to be profitable, you need to keep an eye on your expenses. The income and expense graph shows you exactly what you’re spending and where.
You should be especially concerned with the proportion you’re spending relative to the income you receive. As a simplistic example, if you’re earning only $20,000 in income, you don’t want to spend $30,000 in expenses.
268
L E S S O N 9
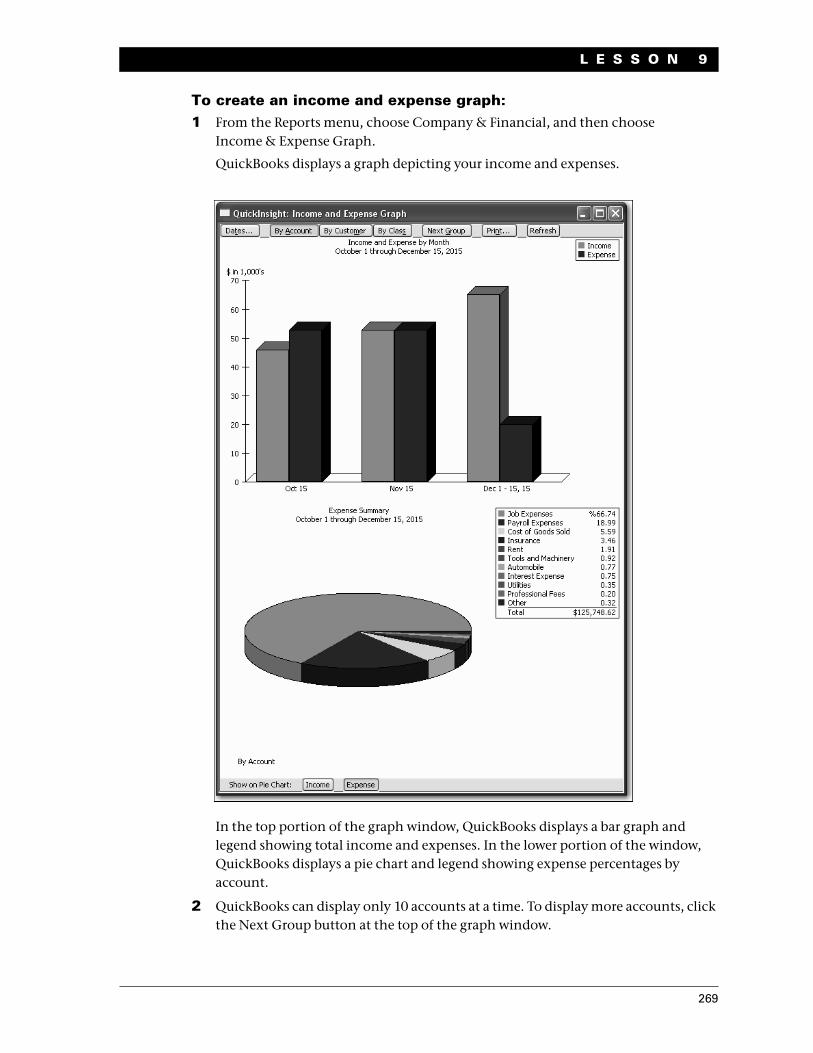
To create an income and expense graph:1 From the Reports menu, choose Company & Financial, and then choose
Income & Expense Graph.
QuickBooks displays a graph depicting your income and expenses.
In the top portion of the graph window, QuickBooks displays a bar graph and legend showing total income and expenses. In the lower portion of the window, QuickBooks displays a pie chart and legend showing expense percentages by account.
2 QuickBooks can display only 10 accounts at a time. To display more accounts, click the Next Group button at the top of the graph window.
269
A n a l y z i n g f i n a n c i a l d a t a
Features of QuickInsight graphs
These features are common to all QuickInsight graphs:
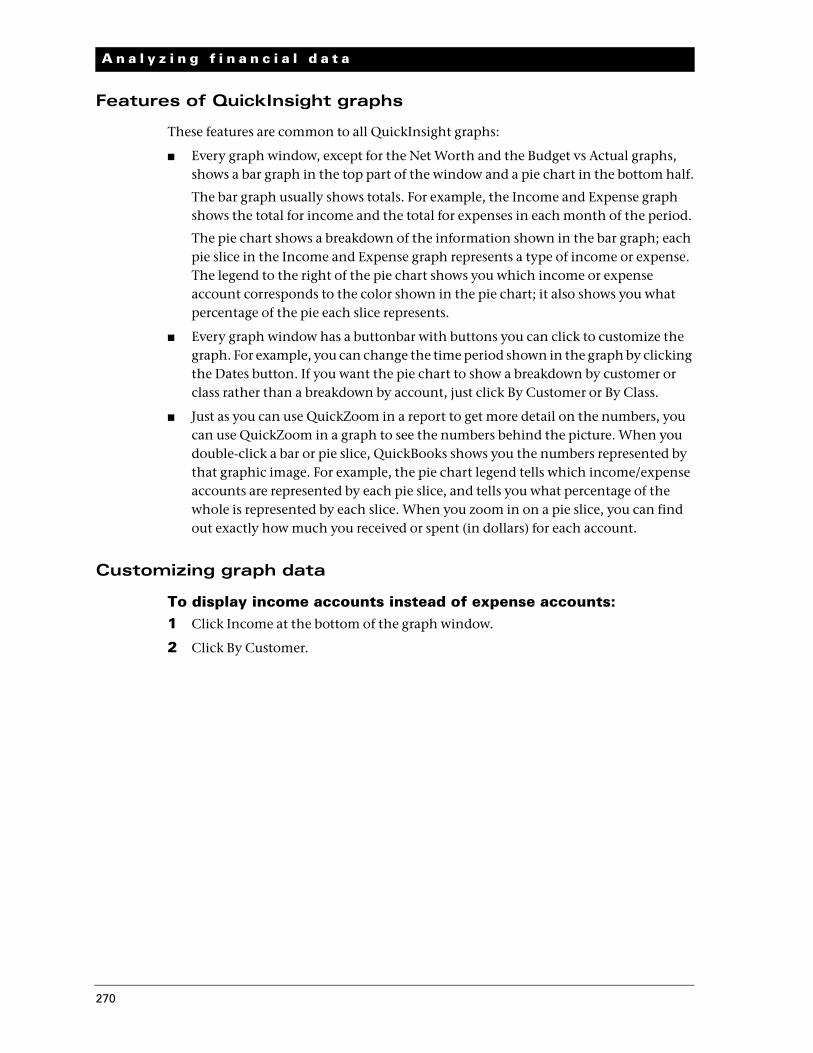
Every graph window, except for the Net Worth and the Budget vs Actual graphs, shows a bar graph in the top part of the window and a pie chart in the bottom half.
The bar graph usually shows totals. For example, the Income and Expense graph shows the total for income and the total for expenses in each month of the period.
The pie chart shows a breakdown of the information shown in the bar graph; each pie slice in the Income and Expense graph represents a type of income or expense. The legend to the right of the pie chart shows you which income or expense account corresponds to the color shown in the pie chart; it also shows you what percentage of the pie each slice represents.
Every graph window has a buttonbar with buttons you can click to customize the graph. For example, you can change the time period shown in the graph by clicking the Dates button. If you want the pie chart to show a breakdown by customer or class rather than a breakdown by account, just click By Customer or By Class.
Just as you can use QuickZoom in a report to get more detail on the numbers, you can use QuickZoom in a graph to see the numbers behind the picture. When you double-click a bar or pie slice, QuickBooks shows you the numbers represented by that graphic image. For example, the pie chart legend tells which income/expense accounts are represented by each pie slice, and tells you what percentage of the whole is represented by each slice. When you zoom in on a pie slice, you can find out exactly how much you received or spent (in dollars) for each account.
Customizing graph data
To display income accounts instead of expense accounts:1 Click Income at the bottom of the graph window.
2 Click By Customer.
270
L E S S O N 9
QuickBooks changes the pie chart to display income by customers.
271
A n a l y z i n g f i n a n c i a l d a t a
Using QuickZoom with graphs
To help you better understand the information shown in the graphs, QuickBooks lets you trace graphical data using QuickZoom graphs.
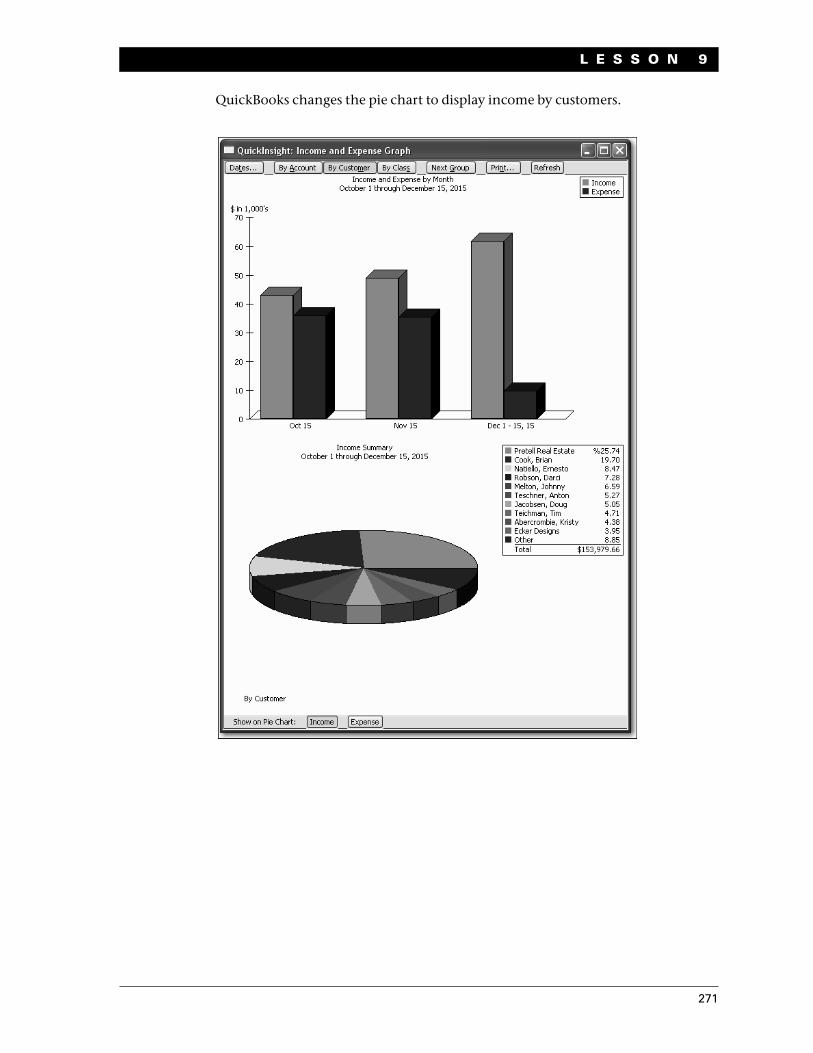
To display the sales for Anton Teschner:1 Position the mouse pointer over the Teschner, Anton slice of the pie chart.
(Use the Key on the right side of the window.)
The pointer changes to a magnifying glass with the letter Z inside.
2 Double-click the Teschner, Anton slice.
Note: If a slice is too small to click, click on its legend representation instead.
QuickBooks displays a QuickZoom graph depicting sales for Anton Teschner by month.
272
L E S S O N 9
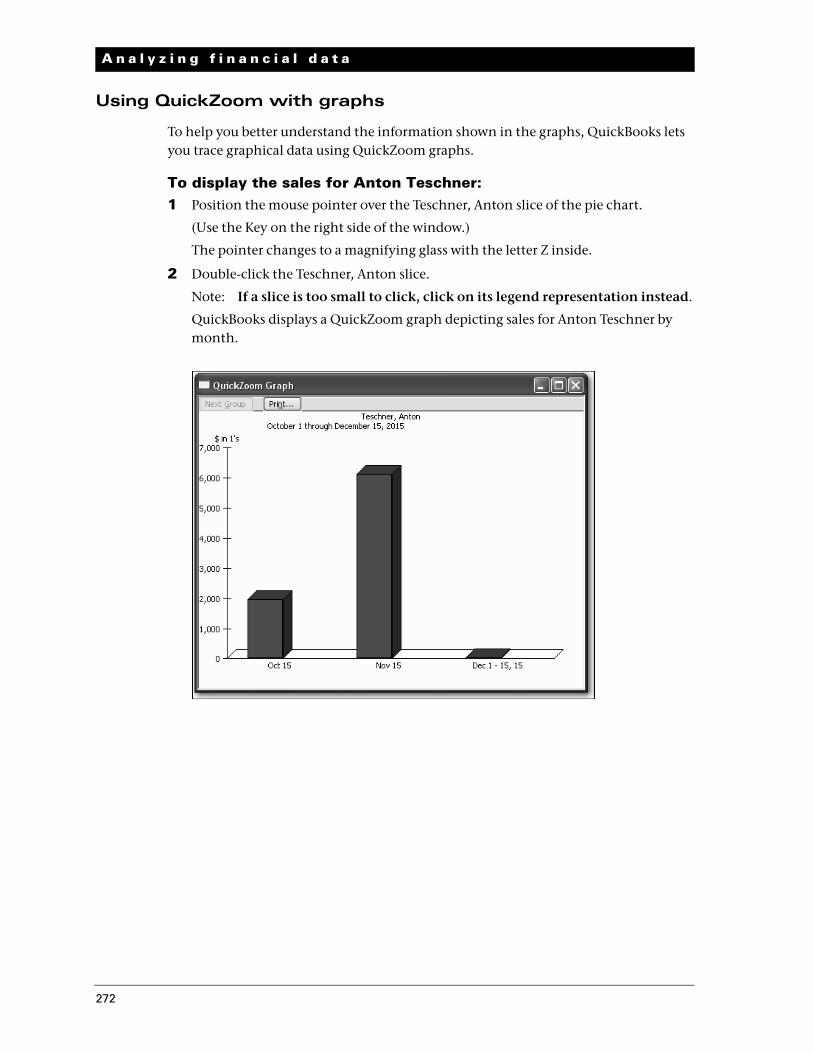
To display a report describing the transactions for a given month:1 Position the mouse pointer over the bar representing November 2015.
The pointer turns into the QuickZoom symbol.
2 Double-click the bar.
QuickBooks displays the custom transaction detail report for the month of November 2015.
You may need to scroll to the right to see the entire report.
273
A n a l y z i n g f i n a n c i a l d a t a
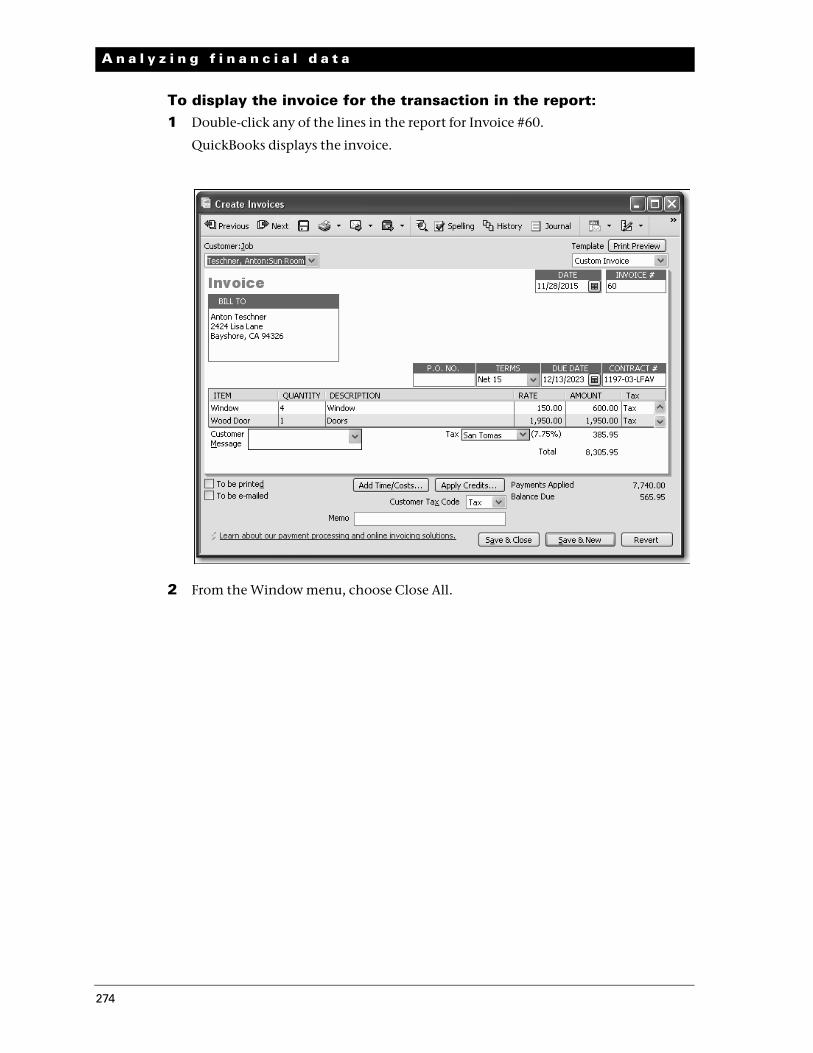
To display the invoice for the transaction in the report:1 Double-click any of the lines in the report for Invoice #60.
QuickBooks displays the invoice.
2 From the Window menu, choose Close All.
274
L E S S O N 9
Customizing how graphs display
You can customize graphs to control what data they include and how the data is displayed. In this exercise, you’ll change the display from three-dimensional (3D) to two-dimensional (2D) graphs.
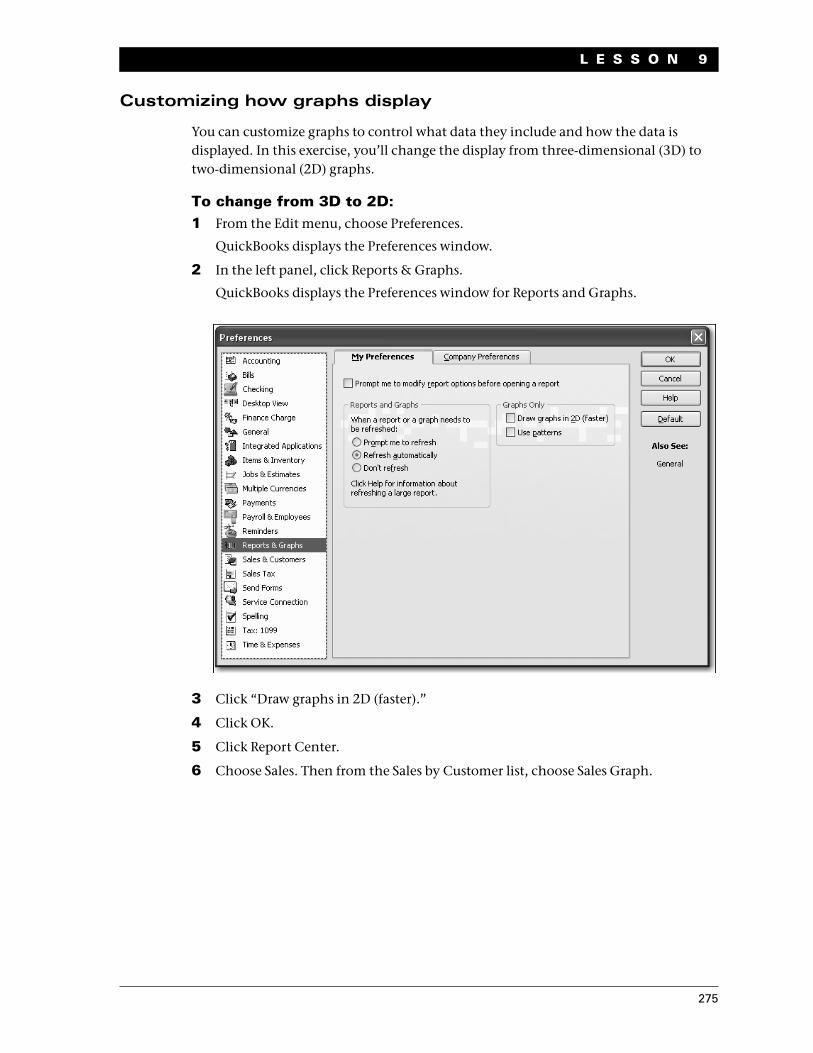
To change from 3D to 2D:1 From the Edit menu, choose Preferences.
QuickBooks displays the Preferences window.
2 In the left panel, click Reports & Graphs.
QuickBooks displays the Preferences window for Reports and Graphs.
3 Click “Draw graphs in 2D (faster).”
4 Click OK.
5 Click Report Center.
6 Choose Sales. Then from the Sales by Customer list, choose Sales Graph.
275
A n a l y z i n g f i n a n c i a l d a t a
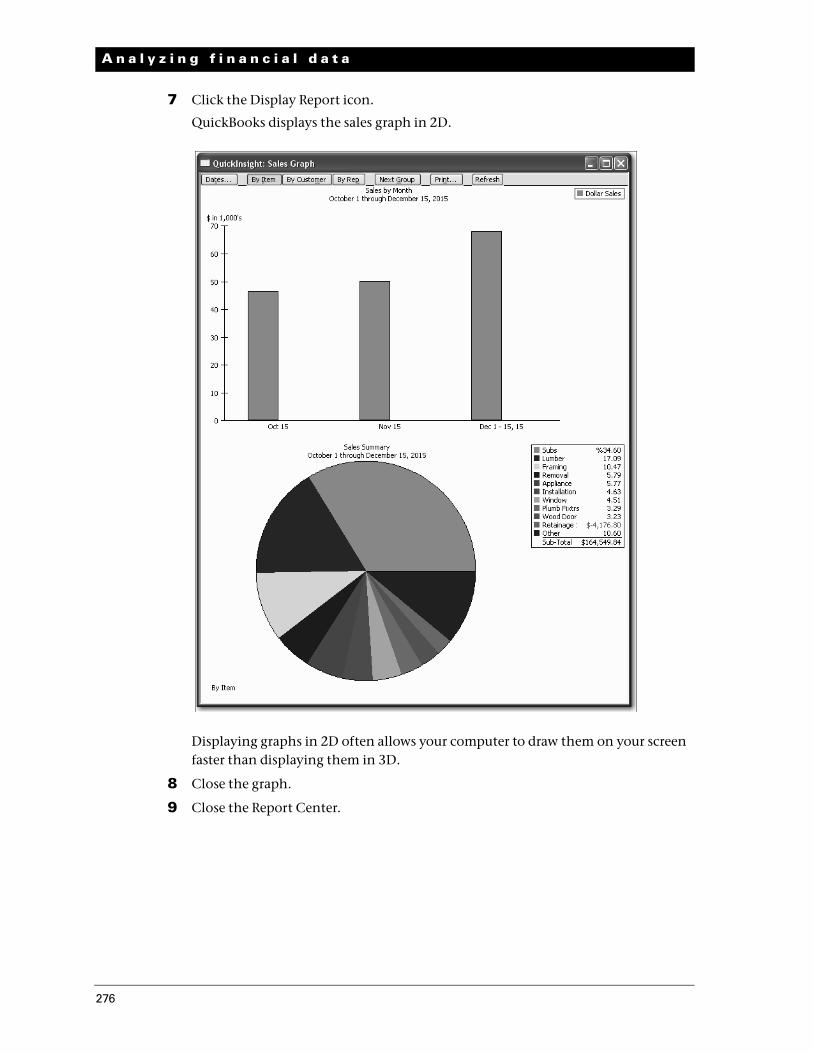
7 Click the Display Report icon.
QuickBooks displays the sales graph in 2D.
Displaying graphs in 2D often allows your computer to draw them on your screen faster than displaying them in 3D.
8 Close the graph.
9 Close the Report Center.
276