Embed Size (px)
Citation preview

Lesson One
Peter Rumble
Bangor Transfer Abroad Programme
BUS 111 – Micro Economics

BUS 111 - Micro Economics
It’s the economy - stupid
"It's the economy, stupid" is a slight variation of the phrase "The economy, stupid" which James Carville had coined as a campaign strategist of Bill Clinton's successful 1992 presidential campaign against sitting president George H. W. Bush.
Carville's original phrase was meant for the internal audience of Clinton's campaign workers as one of the three messages to focus on, the other two messages being "Change vs. more of the same" and "Don't forget health care.”

BUS 111 - Micro Economics
It’s the economy – stupid continues
Clinton's campaign had advantageously used the then-prevailing recession situation in the US as one of the campaign means to successfully unseat George H. W. Bush. In March 1991, days after the ground invasion of Iraq, 90% of polled Americans approved of President Bush's job performance.[1] Later the next year, Americans' opinions had turned sharply; 64% of polled Americans disapproved of Bush's job performance in August 1992.[1]

BUS 111 - Micro Economics
Economics Introductory Thoughts
What is Economics? Micro – Economics Macro – Economics Ten Principles

BUS 111 - Micro Economics
Economics Introductory Thoughts
Micro Economics
This is concerned with the individual parts – the demand and supply of goods and services
Focuses on households (consumer expenditure) and firms (organisations)
How markets work.

BUS 111 - Micro Economics
Economics Introductory Thoughts
Macro Economics
This is concerned with the economic aggregate demand and supply – the grand totals of households /individuals and firms activities.
The impact nationally of prices- inflation, employment and savings/ investments
International aspects.

BUS 111 - Micro Economics
Economics?
Handling scarce resourcesFactors of production..LabourLandCapitalEnterpreneurial skill
Maximising Wealth – Well being

BUS 111 - Micro Economics
Maximising Wealth
Economic Choices – Production Possibilities Frontiers
Rice or Wheat?
Computers or Cars? Page 26
Computers or Rice?

BUS 111 - Micro Economics
The Circular Flow
The simple circular flow model of the economy is designed to
understand the basic operations of the economy

BUS 111 - Micro Economics
58
7 6
43
2 1
Households
Businesses
Markets for factors
of production
Markets for good
and services

BUS 111 - Micro Economics
The simple circular flow
In the simple circular flow model two players of the economic game:
Households and Businesses.
Households are: sellers of all inputs, or factors of production, and buyers of
all output of good and services.
Businesses are: buyers of all inputs and sellers of all output.

BUS 111 - Micro Economics
Flow 1 – Households sell their land , labor and capital in the market as factors of production.
Flow 2 – Businesses buy these factors of production and use them to make goods and
services.
Flow 3 – Businesses sell the goods and services made.
Flow 4 - Households buy the goods and services.
So, when we start at the households and go counterclockwise from 1 to 4 we will follow the
flows of what are called “real” things – the resources and the goods and services made.
These are what are really important in the economy because these are the items used to
create our standard of living.

BUS 111 - Micro Economics
So, when we start at the households and go counterclockwise from 1 to 4 we will follow the flows of what are called “real” things – the resources and the goods and services made. These are
what are really important in the economy because these are the items used to create our standard of living
Consumption

BUS 111 - Micro Economics
Next we look at flows 5 through 8 and these are financial flows and we see a connection between
spending, revenues, and income.
Flow 5 – The households payment after selling resources in the factor markets is called income.
Flow 6 – When the households buy stuff they pay for it and the term used in the national economy sense to represent this buying is spending or consumption expenditure. The households buy from businesses in
the markets for output of good and services.
Flow 7 – When the businesses sell goods and services to household the businesses bring home revenue. (So, if we ignore government for now,
expenditure = revenue).

BUS 111 - Micro Economics
Flow 8 – When businesses take in revenue from sales then they use the money to pay for the resources they have purchased in
the markets for factors of production. Here we talk about costs of business
So the flows 5 through 8 are the financial flows that correspond to our “real” flows.
The simple circular flow model is a simple model of the day to day operations of the
economy.

BUS 111 - Micro Economics
Flows 1 through 4 are flows of inputs (resources) and output (goods and services).
Flows 5 through 8 are flows of money.
The flow of money is one way we account for the flow of resources and goods and services.

BUS 111 - Micro Economics
Analogy – A grocery store Denis
We look at the revenue of a grocery store to get a feel for the output amount – but we know
the output is made up of items like milk, noodles , drinks etc…
We look at expenses to get a feel for amount of inputs used – but we know the inputs are
hours of labor (wages), electricity used, rents paid and so on.
BUS 111 - Micro Economics
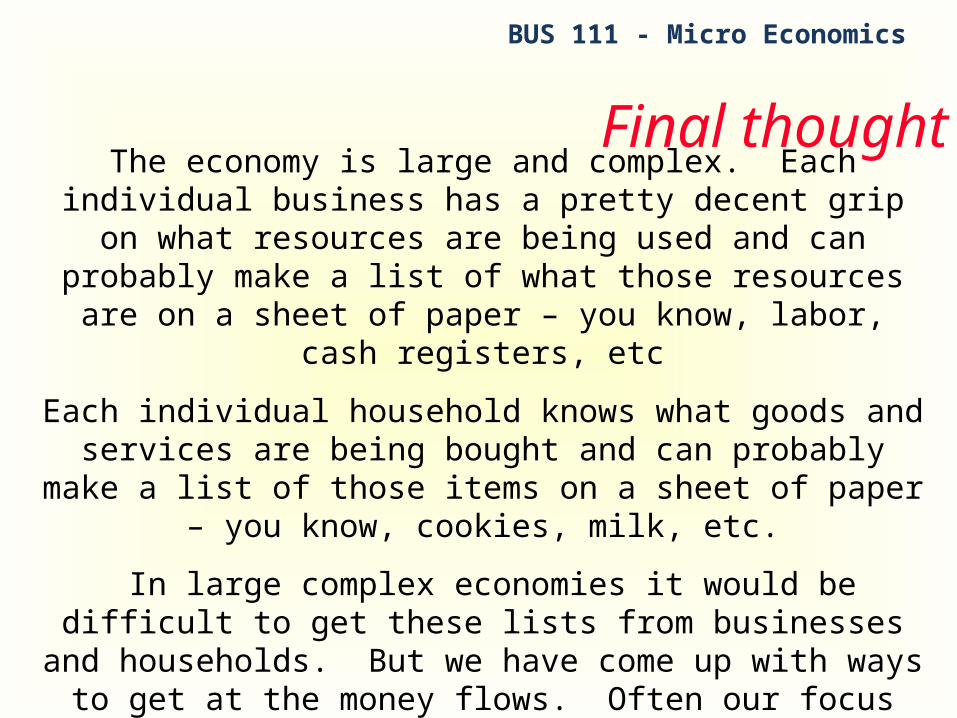
Final thoughtThe economy is large and complex. Each individual business has a pretty decent grip on what resources are being used and can probably make a list of what those resources are on a sheet of paper – you know,
labor, cash registers, etc
Each individual household knows what goods and services are being bought and can probably make a list of those items on a sheet of paper – you know,
cookies, milk, etc.
In large complex economies it would be difficult to get these lists from businesses and households. But we have come up with ways to get at the money flows.
Often our focus will be on money flows when we really want to talk about the lists.

BUS 111 - Micro Economics
The Circular Flow
Basic model but in reality it is more complex – Government Trade Advertising, The Invisible Hand,
Not complicated…. Just complex

BUS 111 - Micro Economics
The “10” principles
1 and 2 – People face trade offs The cost of something is what you give up
to get it - OPPORTUNITY COST.

BUS 111 - Micro Economics
The “10” principles
3 Rational people (firms) think at the
MARGIN.
The marginal benefit depends on how many units already “owned” and rarity of item - Peter’s mugs!!!
BUS 111 - Micro Economics
The “10” principles
4 People respond / need incentives.
Costs and benefits.
Tangible versus intangible.

BUS 111 - Micro Economics
The “10” principles
5 Trading can make everyone better off.
Specialisation

BUS 111 - Micro Economics
The “10” principles
6 & 7 Markets are usually a good way to
organize economic activity
Governments can sometimes improve market outcomes. PROPERTY RIGHTS.

BUS 111 - Micro Economics
The “10” principles
8 A countries standard of living depends
on its ability to produce goods and services
PRODUCTIVITY
BUS 111 - Micro Economics
The “10” principles
9 Prices will rise when Governments
PRINT too much money
INFLATION – QUANTITATIVE EASING

BUS 111 - Micro Economics
The “10” principles
10 Economies face a short/medium run
trade off between Inflation and Employment
The Business Cycle.
BUS 111 - Micro Economics
Markets
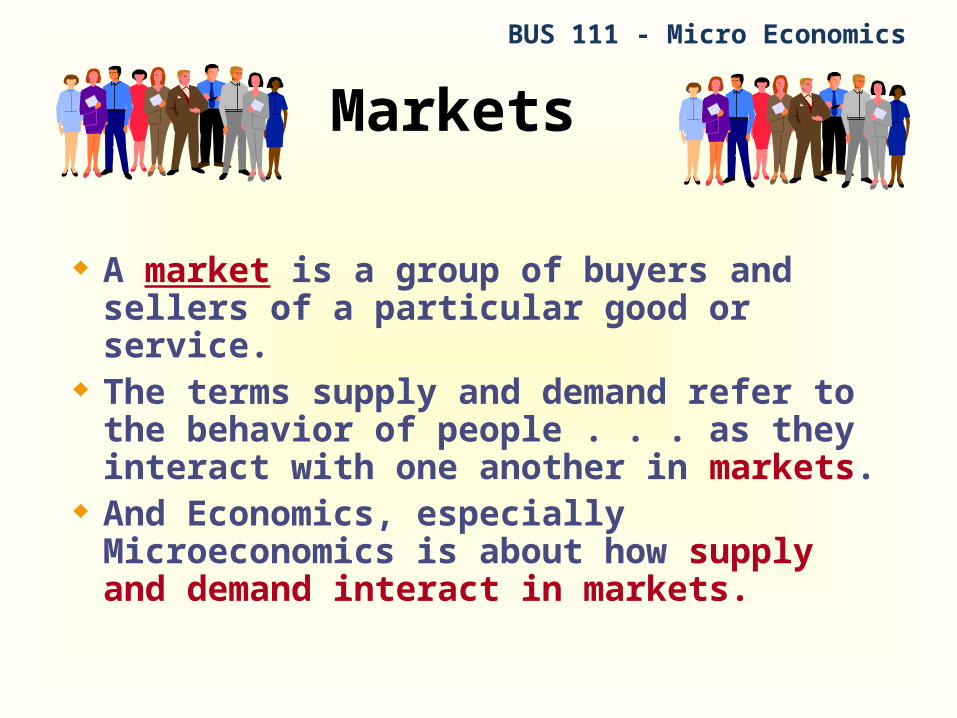
A market is a group of buyers and sellers of a particular good or service.
The terms supply and demand refer to the behavior of people . . . as they interact with one another in markets.
And Economics, especially Microeconomics is about how supply and demand interact in markets.
BUS 111 - Micro Economics
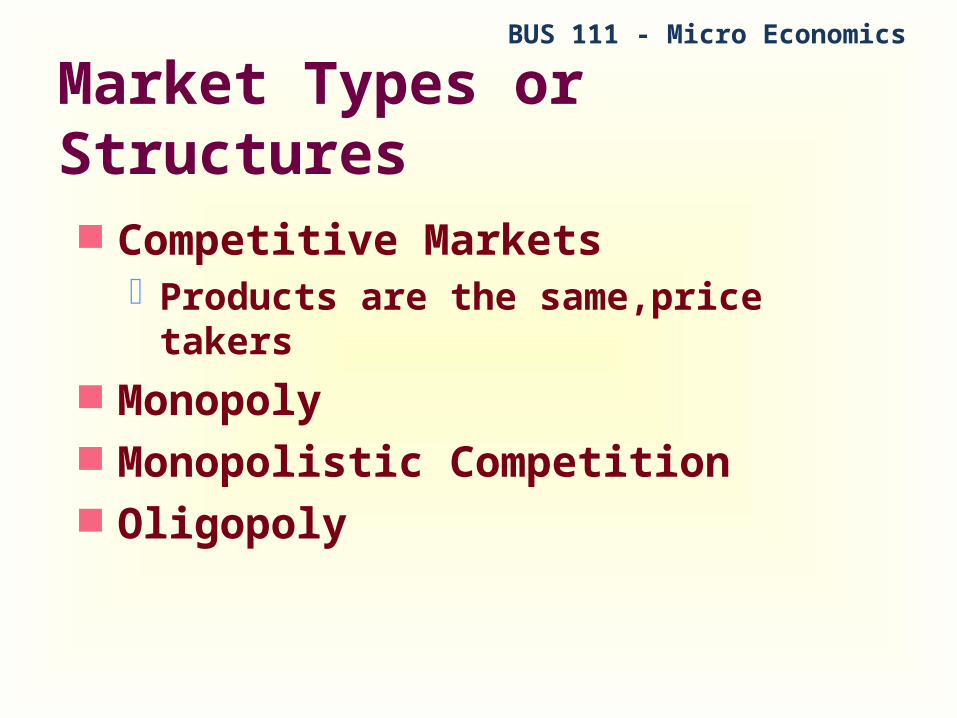
Market Types or Structures
Competitive MarketsProducts are the same,price takers
Monopoly Monopolistic Competition Oligopoly

BUS 111 - Micro Economics
Demand Curve
$3.002.50
2.001.501.00
0.50
21 3 4 5 6 7 8 9 10
12
11
Price of Ice-Cream Cone
Quantity of Ice-Cream Cones
0

BUS 111 - Micro Economics
Why does the Demand Curve Slope Downward?
Law of DemandInverse relationship between price and
quantity. Law of Diminishing Marginal Utility.
Utility is the extra satisfaction that one receives from consuming a product.
Marginal means extra.Diminishing means decreasing.

BUS 111 - Micro Economics
Market Demand
Market demand refers to the sum of all individual demands for a particular good or service.
Graphically, individual demand curves are summed horizontally to obtain the market demand curve.

BUS 111 - Micro Economics
Ceteris Paribus
Ceteris paribus is a Latin phrase that means all variables other than the
ones being studied are assumed to be constant. Literally, ceteris paribus means “other things being equal.”
The demand curve slopes downward because, ceteris paribus, lower prices
imply a greater quantity demanded!

BUS 111 - Micro Economics
Two Basic Rules for Movements vs. Shifts
Rule OneWhen an independent variable changes and that
variable does not appear on the graph, the curve on the graph will shift.
Rule TwoWhen an independent variable does appear on the
graph, the curve on the graph will not shift, instead a movement along the existing curve will occur.
Let’s apply these rules to the following cases of supply and demand!

BUS 111 - Micro Economics
Change in Quantity Demanded versus Change in Demand
Change in Quantity Demanded Movement along the demand curve. Caused by a change in the price of
the product.

BUS 111 - Micro Economics
Changes in Quantity Demanded
0
D1
Price of Cigarettes per Pack
Number of Cigarettes Smoked per Day
A tax that raises the price of cigarettes
results in a movement along the
demand curve.
A
C
20
2.00
$4.00
12

BUS 111 - Micro Economics
Change in Quantity Demanded versus Change in Demand
Change in Demand A shift in the demand curve, either to
the left or right. Caused by a change in a
determinant other than the price.

BUS 111 - Micro Economics
Determinants of Demand
Market price Consumer income Prices of related goods Tastes Expectations What are some examples?
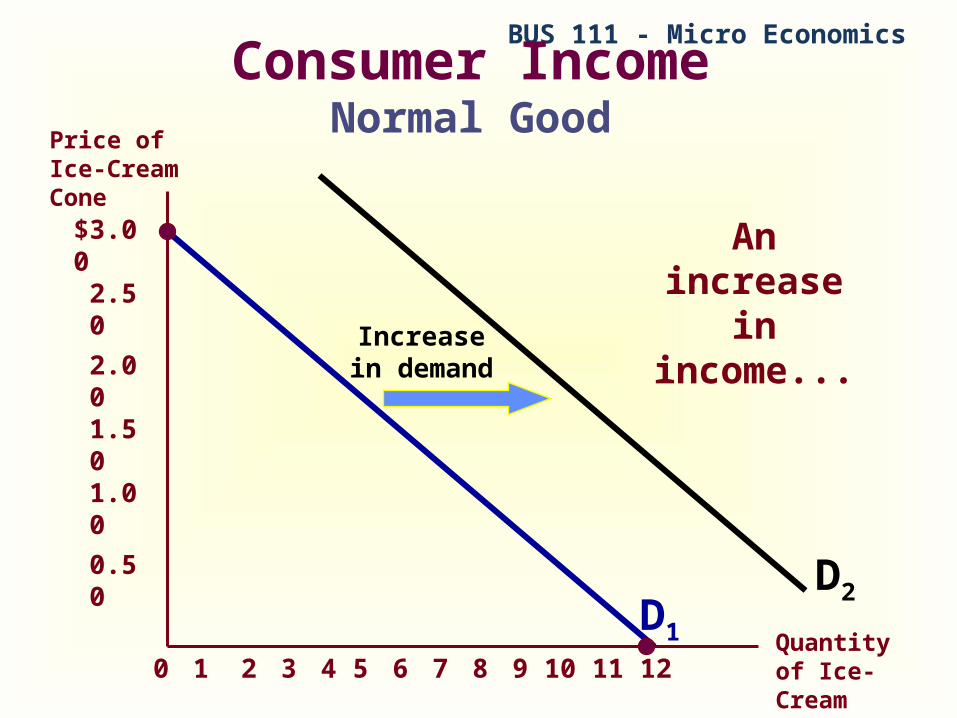
BUS 111 - Micro EconomicsConsumer Income
Normal Good
$3.002.50
2.001.501.00
0.50
21 3 4 5 6 7 8 9 10
12
11
Price of Ice-Cream Cone
Quantity of Ice-Cream Cones
0
Increasein demand
An increase
in income...
D1
D2

BUS 111 - Micro EconomicsConsumer Income
Inferior Good
$3.002.50
2.001.501.00
0.50
21 3 4 5 6 7 8 9 10
12
11
Price of Ice-Cream Cone
Quantity of Ice-Cream Cones
0
Decreasein demand
An increase
in income...
D1D2

BUS 111 - Micro Economics
Prices of Related GoodsSubstitutes & Complements
When a fall in the price of one good reduces the demand for another good, the two goods are called substitutes.
When a fall in the price of one good increases the demand for another good, the two goods are called complements.

BUS 111 - Micro EconomicsChange in Quantity Demanded
versus Change in Demand
Variables that Affect Quantity
Demanded
A Change in This Variable . . .
Price Represents a movementalong the demand curve
Income Shifts the demand curve
Prices of relatedgoods
Shifts the demand curve
Tastes Shifts the demand curve
Expectations Shifts the demand curve
Number ofbuyers
Shifts the demand curve

BUS 111 - Micro Economics
Supply Curve
$3.002.502.00
1.501.00
0.50
21 3 4 5 6 7 8 9 10
12
11
Price of Ice-Cream Cone
Quantity of Ice-Cream Cones
0

BUS 111 - Micro Economics
Law of Supply
The law of supply states that there is a direct (positive) relationship between
price and quantity supplied.

BUS 111 - Micro Economics
Supply
Quantity supplied is the amount of a good that sellers are willing and able
to sell.
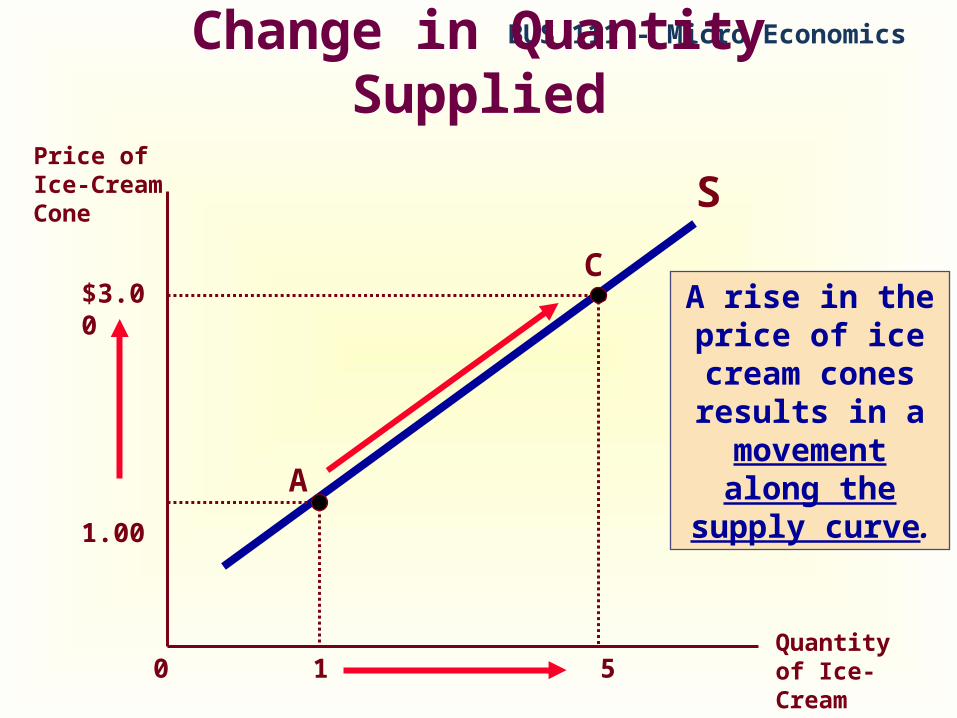
BUS 111 - Micro EconomicsChange in Quantity Supplied
1 5
Price of Ice-Cream Cone
Quantity of Ice-Cream Cones
0
S
1.00A
C$3.00
A rise in the price of ice cream cones
results in a movement along the supply curve.

BUS 111 - Micro Economics
Market Supply
Market supply refers to the sum of all individual supplies for all sellers of a particular good or service.
Graphically, individual supply curves are summed horizontally to obtain the market supply curve.

BUS 111 - Micro Economics
Determinants of Supply
Market price Input prices Technology Expectations Number of producers What are some examples?

BUS 111 - Micro EconomicsChange in Supply
Price of Ice-Cream Cone
Quantity of Ice-Cream Cones
0
S1 S2
S3
Increase in Supply
Decrease in Supply

BUS 111 - Micro Economics
Change in Quantity Supplied versus Change in Supply
Variables that Affect Quantity Supplied
A Change in This Variable . . .
Price Represents a movement along the supply curve
Input prices Shifts the supply curve
Technology Shifts the supply curve
Expectations Shifts the supply curve
Number of sellers Shifts the supply curve
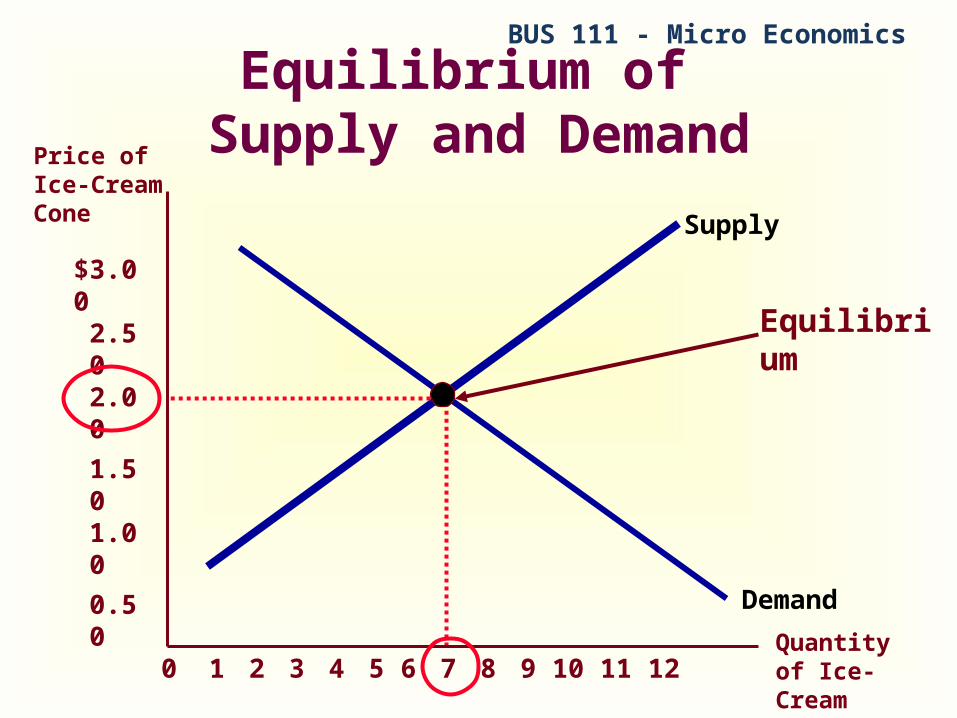
BUS 111 - Micro Economics
Supply
Demand
Price of Ice-Cream Cone
Quantity of Ice-Cream Cones
Equilibrium of Supply and Demand
21 3 4 5 6 7 8 9 10 12110
$3.002.502.00
1.501.00
0.50
Equilibrium

BUS 111 - Micro Economics
Price of Ice-Cream Cone
Quantity of Ice-Cream Cones
21 3 4 5 6 7 8 9 10
12110
$3.002.50
2.00
1.501.00
0.50
Supply
Demand
Surplus
Excess Supply

BUS 111 - Micro Economics
Excess Demand
Quantity ofIce-Cream Cones
Price ofIce-Cream
Cone
$2.00
0 1 2 3 4 5 6 7 8 9 10 11 12 13
Supply
Demand
$1.50
Shortage

BUS 111 - Micro Economics
Three Steps To Analyzing Changes in Equilibrium
Decide whether the event shifts the supply or demand curve (or both).
Decide whether the curve(s) shift(s) to the left or to the right.
Examine how the shift affects equilibrium price and quantity.

How an Increase in Demand Affects the Equilibrium
Price ofIce-Cream
Cone
2.00
0 7 Quantity ofIce-Cream Cones
Supply
Initialequilibrium
D1
1. Hot weather increasesthe demand for ice cream...
D2
2. ...resultingin a higherprice...
$2.50
103. ...and a higherquantity sold.
New equilibrium
Harcourt, Inc. items and derived items copyright © 2001 by Harcourt, Inc.

BUS 111 - Micro Economics
S2
How a Decrease in Supply Affects the Equilibrium
Price ofIce-Cream
Cone
2.00
0 1 2 3 4 7 8 9 11 12 Quantity ofIce-Cream Cones
13
Demand
Initial equilibrium
S1
10
1. An earthquake reducesthe supply of ice cream...
Newequilibrium
2. ...resultingin a higherprice...
$2.50
3. ...and a lowerquantity sold.