Embed Size (px)
Citation preview

Science TEKS: 5.1(A,B), 5.3(A), 5.5(A,B), 5.8(A) Suggested Time: 60 minutes Math TEKS: 5.11, 5.14, 5.15
Lesson One (Teacher) “Introduction to the Atmosphere”
Objective
The atmosphere, air pollution, and meteorology may be fairly new topics for the students, so the first day’s discussions and brief demonstrations provide an opportunity to gauge their incoming knowledge. This will help teachers identify any common misconceptions to address by the end of the curriculum.
A demonstration with ice water and associated discussion will help students review three states of matter—solid, liquid, and gas—and examples of how the transfer of heat energy can cause transitions between these states. Students should then begin to think of the atmosphere around them as a mixture of gases. How do we know that air actually exists—that what surrounds us is not just empty space? Inflating a balloon and discussing how they perceive the air with their senses will help students explore this question. Teachers will also introduce the various measuring tools to the class, explain how they work, and organize students into teams for the measurements.
Students should leave with a sense of wonder about the atmosphere around them and motivated to learn more about its importance. Interesting facts in the “Background Information” section can help the teacher achieve this goal.
Background Information
Matter is anything that takes up space, and is what makes up everything that we see. Solids, liquids and gases are three states of matter. A solid has both a fixed volume and fixed shape. A liquid takes the shape of whatever container that it is in, but has a fixed volume. Gases, however, do not have a fixed volume—they spread out to take up space, like in a balloon.
Students should recognize examples of transitions between states of matter and the role of heat energy in causing them. Adding heat energy can convert a solid to a liquid, or a liquid to a gas. Removing heat energy can turn a gas to a
1

liquid, or a liquid to a solid. The condensation in the ice water demonstration provides a visual example, as the cold glass condenses water vapor (gas) from the air to form liquid water on the outside of the glass.
Air is a fascinating gas. Every breath we take (~1 liter) has 1022 molecules of air! That is about as many stars as exist in the universe. Interestingly, if you could make a box with sides the width of a human hair, it could still have trillions of air molecules inside. However, these air molecules are so small that air appears “invisible” to the naked eye. Air molecules do scatter light, especially at blue wavelengths, which gives the sky its color. Particles suspended in the air can both scatter and absorb light, creating a hazy appearance when the air is polluted (Figure 1).
Figure 1. Houston on a hazy day (L) and on a clear day (R) Credit: http://www.jpl.nasa.gov/news/features.cfm?feature=423
The air around the Earth is called the atmosphere. Viewed from space (Figure 2), we see that the atmosphere is very thin compared to the Earth overall. However, the atmosphere is vitally important to life on Earth. It contains the air that animals breathe and that plants use for photosynthesis; absorbs UV radiation; regulates the planet’s temperature; blocks meteors from crashing onto our surface; and is where weather occurs.
The mass of the atmosphere (about 1.1×10¹⁹ pounds, or 5.1×10¹⁸ kilograms) can best be understood by considering atmospheric pressure, which is the pressure exerted by the weight of the atmosphere above a given point. Atmospheric pressure averages 14.7 psi (pounds per square inch) at sea level. This means that if you drew a square one inch wide and one inch long on the
2

Earth’s surface, the column of air rising above that square into space would weigh 14.7 pounds! The higher you travel in the atmosphere, the lower the density of air, but there is no definite boundary where the atmosphere ends and outer space begins.
Fig. 2. From space, the atmosphere appears as a thin blue line between Earth and outer
space. Credit: http://www.adventures.com.sg/
3

4
Materials (for a class of 25)
• Water glass (1 per class) • Water (Enough to fill the
glass) • Ice
• 1 Hot plate (if possible) • Access to Brainpop.com • Computer • Balloons (1 per student)
GLOBE instruments (described in GLOBE measurement protocols at www. globe.gov):
• Ozone strips (1 per class) • Ozone Scanner (1 per class) • Hygrometer (1 per class) • Infrared Thermometer (1
per class)
• Cloud Charts (1 per class) • Wind Vane (1 per class) • Thermal Glove (1 per class)
Vocabulary
• Matter • Solid • Liquid • Gas • Air • Temperature
• Heat Energy • Thermometer • Atmosphere • Molecules • Atmospheric Pressure
Demonstration: The Three States of Water (Step 2 of Lesson Plan)
This demonstration is geared toward introducing students to three states of matter, and how transfers of heat energy can change the state of matter.
1. In a clear glass, put in cold water and ice. 2. Condensation should form on the outside of the glass. 3. Explain or let your students try to explain what states of matter they
see. In this example, the water is a liquid and the ice is a solid. The “wetness” on the outside of the glass is a liquid that forms as the water vapor (gas) from the outside air cools and condenses onto the glass.
4. It is strongly recommended that you use a hot plate to demonstrate gas as the third state of matter, and how heat energy can change the state of matter. Heating a pot of water until it begins to steam, you can explain to students that heat energy from the hot plate is converting some of the liquid water into the gas (steam) that is being released.
5. Ask students to explain what transfers of heat energy are causing the changes in states of matter that they are observing.
Credit: http://www.acornadvisors.com
5

Step‐by‐Step Suggested Lesson Plan Note: Page numbers listed in the Student Activity column refer to Student worksheets.
Instructor Activity
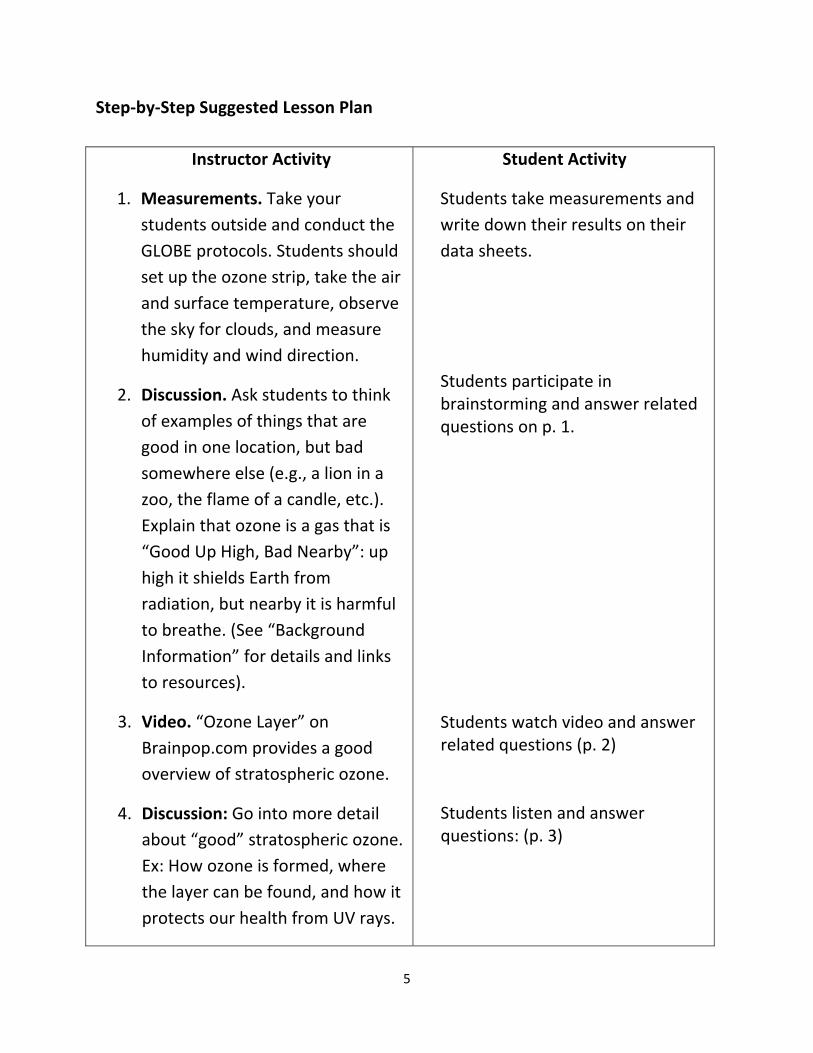
1. Explain the purpose of the curriculum. Let the students know that they will be learning about the Earth’s atmosphere, air pollution, and meteorology.
2. Demonstration: The Three States of Water (icewater demonstration on previous page)
3. Optional Video: “States of Matter” on Brainpop.com.
4. Demonstration: Ask the class to blow up balloons, and ask them what is filling up the space inside.
5. Brainstorming: Ask students why they cannot see the air around them. Then, ask them to describe experiences that they have had that demonstrate that air exists. For example, blowing warm air on a mirror (warm air condenses onto cool surface), seeing wind turn a pinwheel or windmill, blowing bubbles underwater, etc.
6. Discussion/Brainstorming: Share with students interesting facts from the “Background
Student Activity
Students observe the demonstration and answer questions (p. 1)
Students watch and take notes
Students participate in balloon activity and learn that air is a gas
Students brainstorm other examples that show air exists and write down examples (top of p. 2)
Students discuss, ask questions, and answer questions at bottom of
6

7
Expected Outcomes:
1. Students are reacquainted with the three states of matter. 2. Students seek out examples of how transfers of heat energy can cause
the state of matter to change. 3. Students identify examples that demonstrate the existence of air and
the importance of the atmosphere. 4. Though students may not understand exactly how the measuring
instruments work, they become familiar with each instrument to help prepare them for the measurements in the following class periods.
5. Students should complete Lesson One Journal Activities.
Information” section about the air and the atmosphere to pique their interest about the atmosphere. Brainstorm with students about why the atmosphere, though so thin, is actually quite important.
7. Demonstration: Introduce each measuring tool to the students, and invite questions from the students as they pass around the tools. Let students know how each tool works, and that they will get to use them to measure air pollution and meteorology.
a. Ozone strips b. Ozone scanner c. Infrared thermometer gun d. Hygrometer e. Cloud charts f. Wind vane g. Thermal glove
p. 2.
Students interact with each other and with the teacher as they handle each instrument and learn how each one works in preparation for Lesson Two. Students fill in instrument names and what they measure (p.3)
Science TEKS: 5.1(A,B), 5.2(A,B,C,D,E,F,G), 5.3(A,C), 5.4(A,B), 5.5(B) Suggested Time: 50 minutes Math TEKS: 5.11, 5.14, 5.15
Lesson Two (Teacher) “Physical Properties of the Atmosphere”
Objective
Students will begin to take the following measurements outside – the amount of ozone in the air, surface temperature and air temperature, types of clouds in the air, humidity, and wind direction. These measurements will continue for five class periods. At this point in time, students do not have enough knowledge to analyze the results they get. Creating hypotheses, drawing conclusions, and communicating their findings about the trends in data will occur later in the course. However, you can involve the students in experimental design by helping to select exactly where to take the measurements.
Students, who should now have learned the basic definition of the atmosphere, will be introduced to the layers of the atmosphere. Students will also learn about some of the tangible properties of the atmosphere that they will be measuring with their GLOBE instruments: temperature and winds.
1

Science TEKS: 5.1(A,B), 5.2(A,B,C,D,E,F,G), 5.3(A,C), 5.4(A,B), 5.5(B) Suggested Time: 50 minutes Math TEKS: 5.11, 5.14, 5.15 Regarding GLOBE Measurements
Teachers should have already been trained in the following GLOBE protocols: Surface Ozone, Cloud, Humidity, Surface and Air Temperature, Wind Direction. It may be helpful to review those protocols as you prepare for this lesson. Each day, beginning with today (Day Two) students will take all six measurements at the beginning and end of their class periods. It is important to remember that there must be one hour between the measurements at the beginning and at the end of each class.
Data sheets for students to record all of their results in an organized way are included in this handbook. It is recommended that the teacher split their classes into six groups or teams, and that each group takes turns using a different instrument. This way, all measurements can be taken at the same time. Small groups allow students to be more hands‐on with the measuring tool.
It is important to choose a good spot for the class to take the measurements. All of the measurements should be taken in the same area. If your class is interested in comparing measurements in different parts of the school, the curriculum is completely open to the class splitting up and testing different parts of the school, or different classes can compare data as well. Doing so can enable students to develop and test hypotheses regarding how air pollution and weather conditions will vary by location and time of day. All this requires is some more time and organization on the part of the teachers and the school.
This lesson is light on lecturing, in an effort to allow time for students to get used to taking the measurements at the beginning and end of the class.
2

Science TEKS: 5.1(A,B), 5.2(A,B,C,D,E,F,G), 5.3(A,C), 5.4(A,B), 5.5(B) Suggested Time: 50 minutes Math TEKS: 5.11, 5.14, 5.15 Background Information
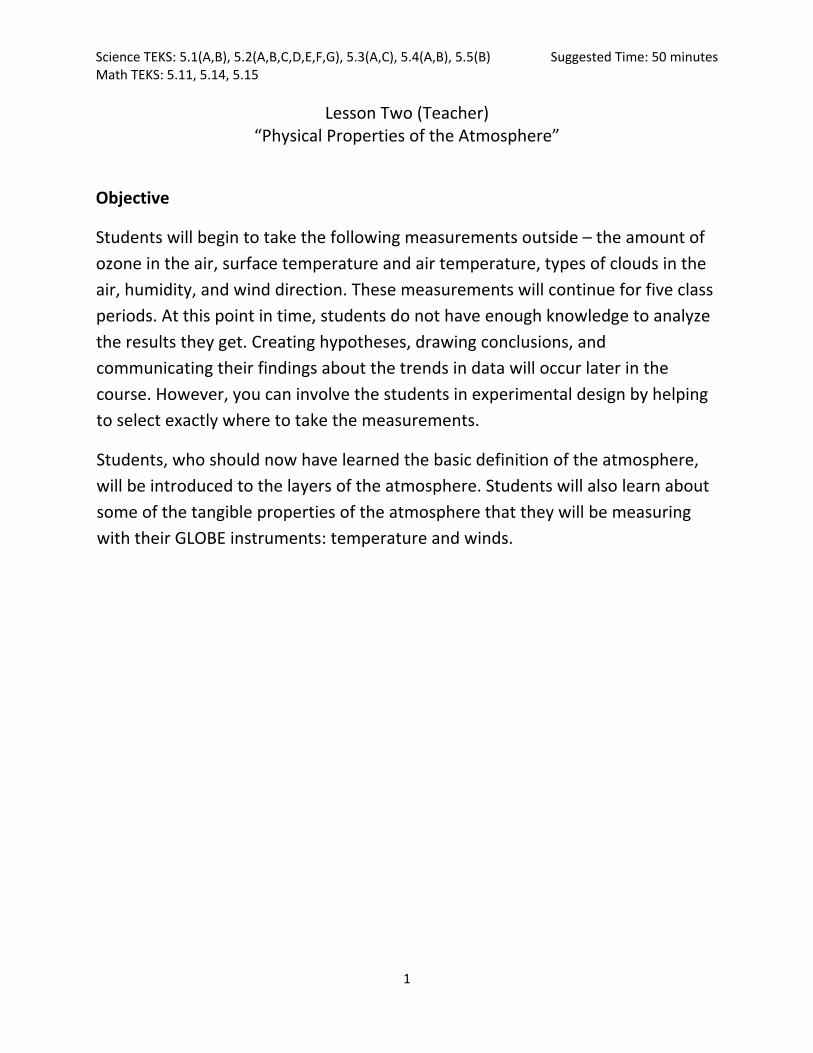
The Earth’s atmosphere is critical to life on Earth. It protects us from things like meteors in space. It also absorbs most of the sun’s intense ultraviolet light, while letting most of the visible sunlight pass through. It keeps us from getting too hot during a summer day and too cold on a winter night. Without the atmosphere’s greenhouse gases trapping in Earth’s warmth, virtually the entire planet’s surface The Earth’s atmosphere is divided into five layers. The first layer, closest to earth’s surface, is the troposphere. This is where all of our weather occurs—clouds, wind, lightning, hurricanes, rain, snow, and tornadoes. Because air density is greatest near the surface and diminishes with height, the troposphere contains about 80% of the atmosphere’s mass. Virtually all of the air we breathe is in the troposphere, so it is here that air pollution is of greatest concern. Temperature is typically warmest near the ground and cools with height in the troposphere, which helps drive the weather and the mixing of pollutants.
The next layer is the stratosphere. This is where ultraviolet radiation from the sun reacts with oxygen to form ozone gas and the ozone layer. The oxygen and the ozone layer protect us from the cancer‐causing ultraviolet radiation. This absorption of radiation causes temperatures to increase with height in the stratosphere, in contrast to cooling with height in the troposphere. This temperature pattern causes the stratosphere to be very stable; in other words, air rises and sinks very slowly in this layer.
The next layer is the mesosphere, which stops meteors and other fragments of things that come from space. The next layer is the thermosphere, where space shuttles orbit the earth. Finally, the last layer is the exosphere, which is the outermost portion of our atmosphere and is the layer in which satellites orbit the earth. Outside of this layer lies space.
3
Science TEKS: 5.1(A,B), 5.2(A,B,C,D,E,F,G), 5.3(A,C), 5.4(A,B), 5.5(B) Suggested Time: 50 minutes Math TEKS: 5.11, 5.14, 5.15
Credit: http://earthscience.files.wordpress.com/2007/04/atmosphere.gif
The two most obvious ways that we experience the atmosphere are through its temperature and its winds. Temperature is the measurement of how “hot” or “cold” something is. The GLOBE instruments will allow students to measure the temperature of both the surface and the air. Interestingly, these measurements are not always equal, though they may be taken in the same place. That’s because surfaces tend to change temperature more quickly than the air, warming more quickly during the day and cooling more quickly at night. Some surfaces warm more quickly than others due to their color and composition, and this can affect the temperature of the air above them. You may want to have students experiment with measuring the temperatures of different surfaces outside.
An urban heat island occurs when a metropolitan area is significantly warmer than surrounding rural areas. The heat island occurs because surfaces like asphalt and concrete warm up quickly and conduct their heat to the air; by contrast, much of the energy absorbed by vegetation dissipates by evapotranspiration. Waste heat from our use of energy adds to the heat island. More information about urban heat islands can be found online in The Encyclopedia of Earth (http://www.eoearth.org/article/Heat_island).
4

Science TEKS: 5.1(A,B), 5.2(A,B,C,D,E,F,G), 5.3(A,C), 5.4(A,B), 5.5(B) Suggested Time: 50 minutes Math TEKS: 5.11, 5.14, 5.15
Thermal image of temperatures in Houston, taken by a NASA airborne sensor in 1999.
Downtown is marked “CBD.” The blue (cooler) area toward the upper left is Memorial Park. Hermann Park and Rice University appear as relatively blue areas toward the lower left.
(Image from www.harc.edu/Projects/CoolHouston/HeatIsland/).
A typical urban heat island temperature profile. (http://commons.wikimedia.org/wiki/File:Urban_heat_island.svg)
5
Science TEKS: 5.1(A,B), 5.2(A,B,C,D,E,F,G), 5.3(A,C), 5.4(A,B), 5.5(B) Suggested Time: 50 minutes Math TEKS: 5.11, 5.14, 5.15
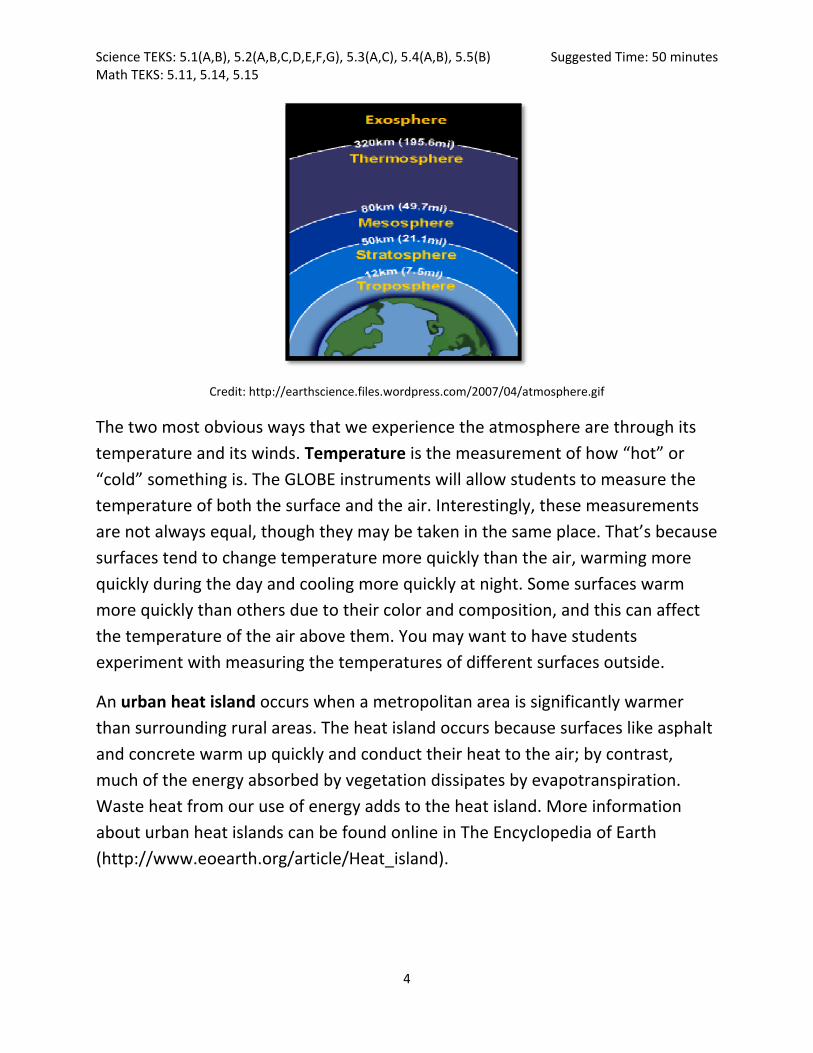
Differences in temperature are the driving force behind wind, or moving air. A classic example of how temperature differences cause the wind to blow is the sea breeze. On summer days near the coast, the land warms faster than the sea. This creates a wind circulation pattern in which near the ground the winds blow from sea to land. At night, a “land breeze” may blow in the opposite direction as the land cools more quickly than the sea.
A sea breeze circulation on a summer day. (http://www.prh.noaa.gov/hnl/kids/activities.php)
Students will use the wind vane to measure the direction in which the wind is blowing. Though students will not directly measure wind speed, they can get a sense of it by feeling the wind blow and checking the wind speed in weather reports.
6

Science TEKS: 5.1(A,B), 5.2(A,B,C,D,E,F,G), 5.3(A,C), 5.4(A,B), 5.5(B) Suggested Time: 50 minutes Math TEKS: 5.11, 5.14, 5.15
7
Materials (for a class of 25)
• Computers and/or projection screen
• Access to Brainpop.com • Hygrometer (1 per class) • Infrared Thermometer (1 per
class)
• Ozone Test Strips (1 per class) • Ozone Scanner (1 per class) • Wind Vane (1 per class) • Thermal Glove (1 per class) • GLOBE Measurement Data
Sheets (1 per student)
Vocabulary
• Atmosphere • Troposphere • Stratosphere • Mesosphere • Thermosphere • Exosphere • Ultraviolet Radiation
• Surface Temperature • Air Temperature • Fahrenheit • Celsius • Urban Heat Island • Wind • Sea Breeze
Science TEKS: 5.1(A,B), 5.2(A,B,C,D,E,F,G), 5.3(A,C), 5.4(A,B), 5.5(B) Suggested Time: 50 minutes Math TEKS: 5.11, 5.14, 5.15
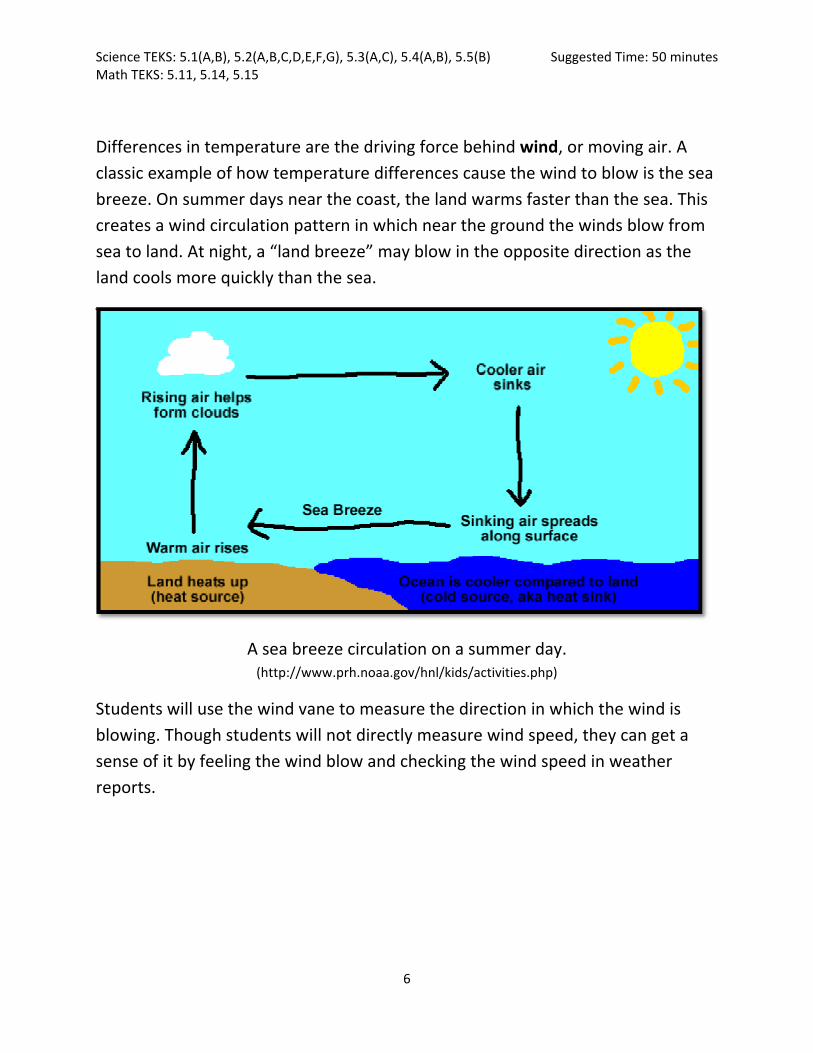
Instructor Activity
1. Take your students outside and conduct the GLOBE protocols listed above. Students should set up the ozone strip, take the air and surface temperature, observe the sky for clouds, and measure humidity and wind direction. This first time, take the measurements one at a time to make sure that the students are using the tools correctly and are getting accurate results.
2. Discuss the five layers of the atmosphere.
3. Discuss what is found in each layer – example: where the weather, the ozone layer, and space shuttles can be found. This does not have to be too detailed – just enough to give students a reasonable visualization of the atmospheric layers.
4. Next, tell teachers that they will be moving on other physical features of the atmosphere.
5. First, teach them about temperature. Ask students about the air around them – is it hold or is cold? What have been their experiences with temperature?
Student Activity
Students take measurements and write down their results on their data sheets. Students listen and take notes. (p.4) Students listen, ask questions, and fill out picture:(p.4) Students answer questions in journals: (p.5)
8

Science TEKS: 5.1(A,B), 5.2(A,B,C,D,E,F,G), 5.3(A,C), 5.4(A,B), 5.5(B) Suggested Time: 50 minutes Math TEKS: 5.11, 5.14, 5.15
Use this to lead into a lecture on temperature. Make sure that students understand the definition of both surface and air temperature.
6. Video on Brainpop.com : Temperature. Complete the online quiz as a class.
7. Next, teach them about wind. What have their experiences been with wind? Use this to lead into a brief lecture on wind. Make sure students understand the concept of a sea breeze.
8. Video on Brainpop.com: Wind. Complete the online quiz as a class.
9. Give students a few minutes to complete Conclusion & Reflection.
10. Take your class outside, and scan the ozone strip. Also, retake the surface and air temperature and the humidity so that students can take the average of these measurements in order to supplement their ozone measurements.
Students watch video. Students answer questions in journals: (p.6) Students watch video. Students complete journal questions: (p.8) Students take measurements and write down their results on their data sheets.
9

Science TEKS: 5.1(A,B), 5.2(A,B,C,D,E,F,G), 5.3(A,C), 5.4(A,B), 5.5(B) Suggested Time: 50 minutes Math TEKS: 5.11, 5.14, 5.15
10
Expected Outcomes
1. Students can label the five layers of the atmosphere and know what can be found in each layer of the atmosphere.
2. Students understand temperature, and in particular should understand the concept of urban heat island.
3. Students understand winds, and in particular should understand the concept of a sea breeze.
4. Students should complete Lesson Two Journal Activities.

Science TEKS: 5.1(A,B), 5.2(A,B,C,D,E,F,G), 5.3(A,C), 5.4(A,B), 5.5(A,B), 5.8(B), 5.9(D) Suggested Time: 90 minutes Math TEKS: 5.11, 5.14, 5.15
Lesson Three (Teacher) “Atmospheric Gases and Their Cycles”
Objective
Now that students have a basic knowledge of the physical structure of the atmosphere, this lesson goes into much further detail about the most common gases that make up the atmosphere. The significance of the water cycle, the oxygen cycle, and the carbon cycle will be covered1. The gases discussed today compose the vast majority of air molecules in the atmosphere; in later lessons, students will learn about air pollutants that greatly affect our health and environment even in very small quantities.
Background Information
The atmosphere is made up of five main gases – nitrogen (N2), oxygen (O2), argon (Ar), water vapor (H2O), and carbon dioxide (CO2). There are many other gases in very trace amounts, some of which are called air pollutants if they harm the health of humans, plants, or animals, and some of which are greenhouse gases that trap in the Earth’s warmth.
To visualize the composition of the atmosphere, suppose you gathered 100 random molecules of dry air. Most likely, 78 of them would be nitrogen molecules (N2), 21 of them would be oxygen molecules (O2), and 1 of them would be an argon molecule (Ar). Depending on how warm and humid the air is, zero to four of the 100 molecules would be replaced by molecules of water vapor (H2O).
Now suppose that you could randomly choose 1 million molecules of air. Almost all of them (about 999,610 molecules) would be the gases we listed above: nitrogen (N2), oxygen (O2), argon (Ar), and water vapor (H2O). About 385 of them would be carbon dioxide (CO2). This is less than one‐tenth of 1 percent of the
1 Note: In the interest of time, the nitrogen cycle is not covered here since it is not crucial to the other lessons or measurements. However, the nitrogen cycle is covered on the TAKS test, and teachers may wish to add material about the nitrogen cycle if it has not already been covered elsewhere in the school year.
1

Earth’s atmosphere, but in Lesson 6 we’ll see it has a huge effect on Earth’s climate. Most of the other air pollutants that we’ll study in later lessons have concentrations of less than 1 part per million, so we might not even see one in our collection of 1 million air molecules. However, we’ll learn later that these air pollutants can have important effects on our health and environment.
The main gases of the atmosphere undergo important cycles that are vital to life on Earth. The most apparent of these cycles is the water cycle, which includes all the movements of water between Earth’s atmosphere, bodies of water, and underground. The total amount of water on Earth is constant, but water is continually moving to different locations and changing its form (solid, liquid, or gas).
The Water Cycle
Credit: http://www.dnr.state.wi.us/org/caer/ce/eek/earth/groundwater/images/groundwater.gif
The following steps make up the water cycle. Energy from the Sun evaporates liquid water from lakes and oceans to become water vapor gas in the air. Plants also release water vapor to the atmosphere by transpiration. The water vapor condenses back to liquid water higher in the troposphere, because the cooler air
2
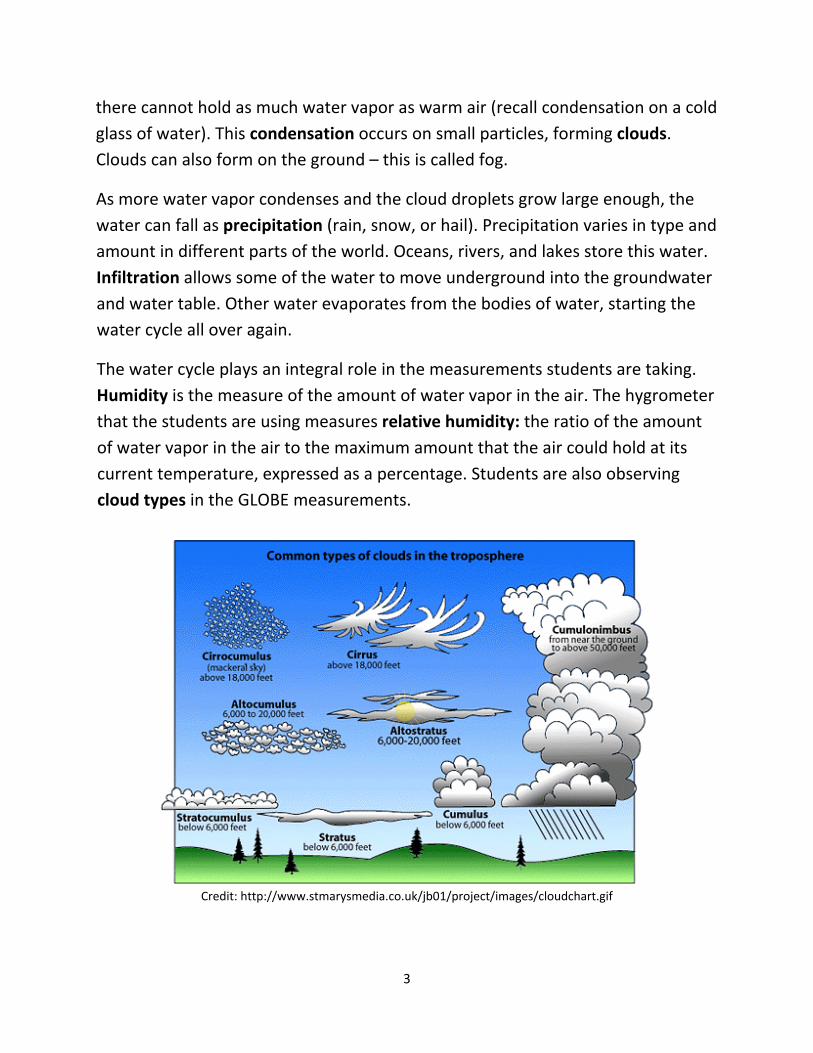
there cannot hold as much water vapor as warm air (recall condensation on a cold glass of water). This condensation occurs on small particles, forming clouds. Clouds can also form on the ground – this is called fog.
As more water vapor condenses and the cloud droplets grow large enough, the water can fall as precipitation (rain, snow, or hail). Precipitation varies in type and amount in different parts of the world. Oceans, rivers, and lakes store this water. Infiltration allows some of the water to move underground into the groundwater and water table. Other water evaporates from the bodies of water, starting the water cycle all over again.
The water cycle plays an integral role in the measurements students are taking. Humidity is the measure of the amount of water vapor in the air. The hygrometer that the students are using measures relative humidity: the ratio of the amount of water vapor in the air to the maximum amount that the air could hold at its current temperature, expressed as a percentage. Students are also observing cloud types in the GLOBE measurements.
Credit: http://www.stmarysmedia.co.uk/jb01/project/images/cloudchart.gif
3
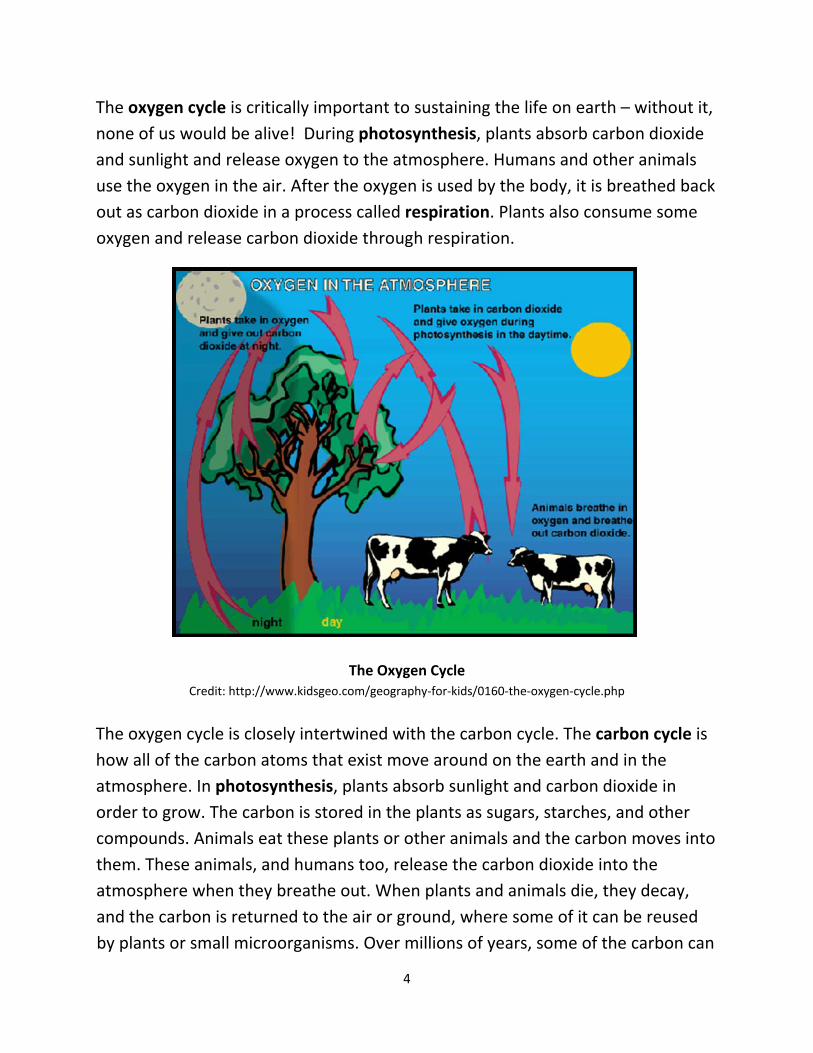
The oxygen cycle is critically important to sustaining the life on earth – without it, none of us would be alive! During photosynthesis, plants absorb carbon dioxide and sunlight and release oxygen to the atmosphere. Humans and other animals use the oxygen in the air. After the oxygen is used by the body, it is breathed back out as carbon dioxide in a process called respiration. Plants also consume some oxygen and release carbon dioxide through respiration.
The Oxygen Cycle Credit: http://www.kidsgeo.com/geography‐for‐kids/0160‐the‐oxygen‐cycle.php
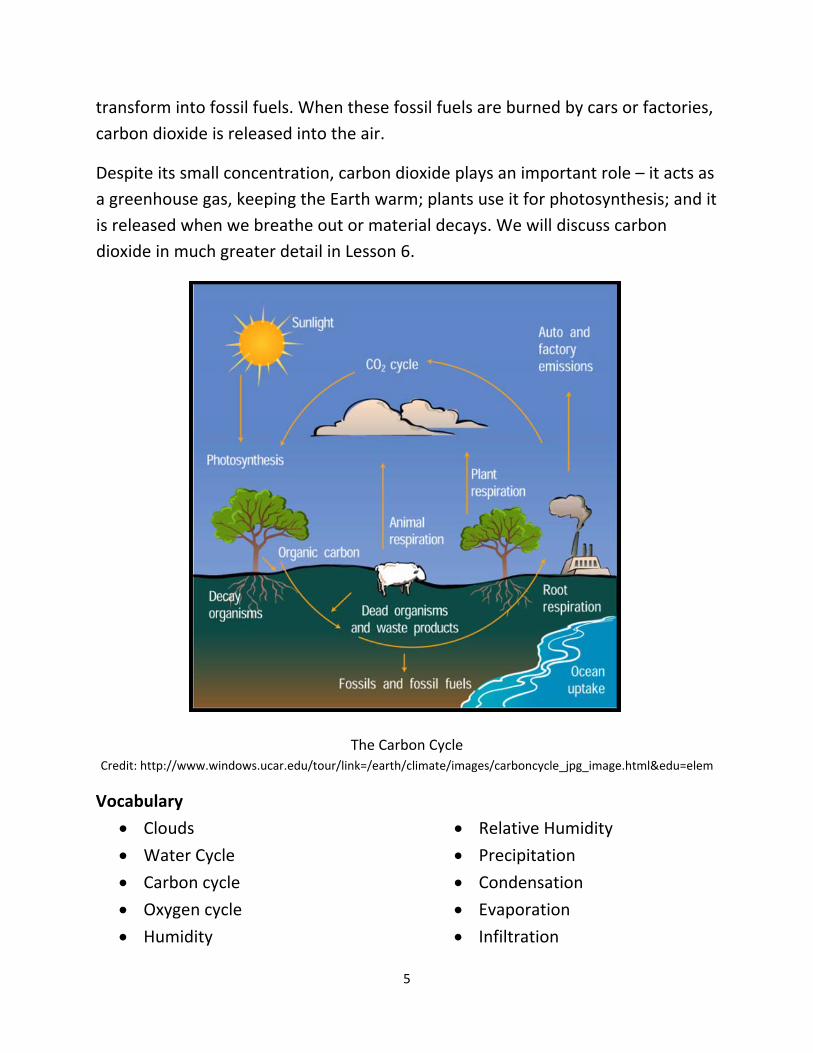
The oxygen cycle is closely intertwined with the carbon cycle. The carbon cycle is how all of the carbon atoms that exist move around on the earth and in the atmosphere. In photosynthesis, plants absorb sunlight and carbon dioxide in order to grow. The carbon is stored in the plants as sugars, starches, and other compounds. Animals eat these plants or other animals and the carbon moves into them. These animals, and humans too, release the carbon dioxide into the atmosphere when they breathe out. When plants and animals die, they decay, and the carbon is returned to the air or ground, where some of it can be reused by plants or small microorganisms. Over millions of years, some of the carbon can
4
5
transform into fossil fuels. When these fossil fuels are burned by cars or factories, carbon dioxide is released into the air.
Despite its small concentration, carbon dioxide plays an important role – it acts as a greenhouse gas, keeping the Earth warm; plants use it for photosynthesis; and it is released when we breathe out or material decays. We will discuss carbon dioxide in much greater detail in Lesson 6.
The Carbon Cycle Credit: http://www.windows.ucar.edu/tour/link=/earth/climate/images/carboncycle_jpg_image.html&edu=elem
Vocabulary • Relative Humidity • Clouds • Precipitation • Water Cycle • Condensation • Carbon cycle • Evaporation • Oxygen cycle • Infiltration • Humidity
• Transpiration • Cirrus • Cumulonimbus • Cumulus
• Stratus • Surface Water • Respiration • Photosynthesis
Materials (for a class of 25)
• Hygrometer (1) • Infrared Thermometer (1) • Ozone Test Strip (1) • Ozone Scanner (1) • Wind Vane (1) • Thermal Glove (1) • Cloud Charts
• GLOBE Data Sheets • Computer • Projection Screen • Access to Brainpop.com • 101 Cloud Activities • Cotton Balls • Various Art Supplies
Step‐by‐Step Suggested Lesson Plan
Instructor Activity
1. Measurements. Take your students outside and conduct the GLOBE protocols. Students should set up the ozone strip, take the air and surface temperature, observe the sky for clouds, and measure humidity and wind direction.
2. Review. Take a few minutes to review what students have already learned about the atmosphere (e.g. its importance, layers, temperature, and wind).
Student Activity
Students take measurements.
6

3. Discussion. Next, introduce students to the 5 main gases that make up the atmosphere (nitrogen, oxygen, argon, water vapor, and carbon dioxide), using information from the “Background Information” section. You can have students pretend to be different types of air molecules to visualize ratios of molecules (for example, about one‐fifth of air molecules are oxygen). Explain the concept of a “cycle”, and point out that we’ll be discussing cycles that affect three of the main gases: water, oxygen, and carbon.
4. Water Cycle Video and Discussion. Introduce the water cycle with the Brainpop.com video: Water Cycle (Optional: accompanying Brainpop quiz and activity). Explain the processes of evaporation, transpiration, condensation, precipitation, and infiltration. Ask students for examples of types of precipitation.
5. Humidity Discussion. Ask students to recall the Water in Three States Demonstration from Lesson One (or, repeat the demonstration). Remind them that the water that condensed on the glass came from water vapor in the air. Explain that humidity is a
Students answer journal question: (p.1)
Students watch video (and participate in optional quiz and activity), participate in discussion, and fill out journal questions (p. 2)
Students answer journal questions (top of p. 3)
7

measure of how much water vapor the air contains. Hold up the GLOBE hygrometer to remind them of how they are measuring humidity.
6. Clouds discussion. Give a short lecture about clouds. Teach the students about the different types of clouds, how they are formed, and where they are found. Students should be somewhat familiar with recognizing clouds, as they have already done a bit with the GLOBE protocol.
7. Pick 1 cloud activity to do with the class, from the 101 Cloud Activities in the GLOBE kit. Students may split into smaller groups to do the activities and play the games.
8. Art Activity (optional): Ask the class to draw a model of the water cycle. Make sure that they can name all parts of the cycle. Cotton balls can be used to create the clouds, and they should be able to differentiate between different shapes of clouds. You can hang these models up in the classroom for future reference. Students may use construction paper, markers, crayons, glue and scissors to create the model. The following parts of the water cycle should be clearly shown and labeled
Students answer journal questions: (bottom of p. 3)
Students complete cloud activity.
Students complete art activity.
8
9
Expected Outcomes
1. Students will be able to list the gases of the atmosphere and the relative abundance of each.
2. Students should be able to draw and label a diagram of the water, oxygen, and carbon cycles and explain in a few sentences the importance of each.
3. Students should complete Lesson Three Journal Activities.
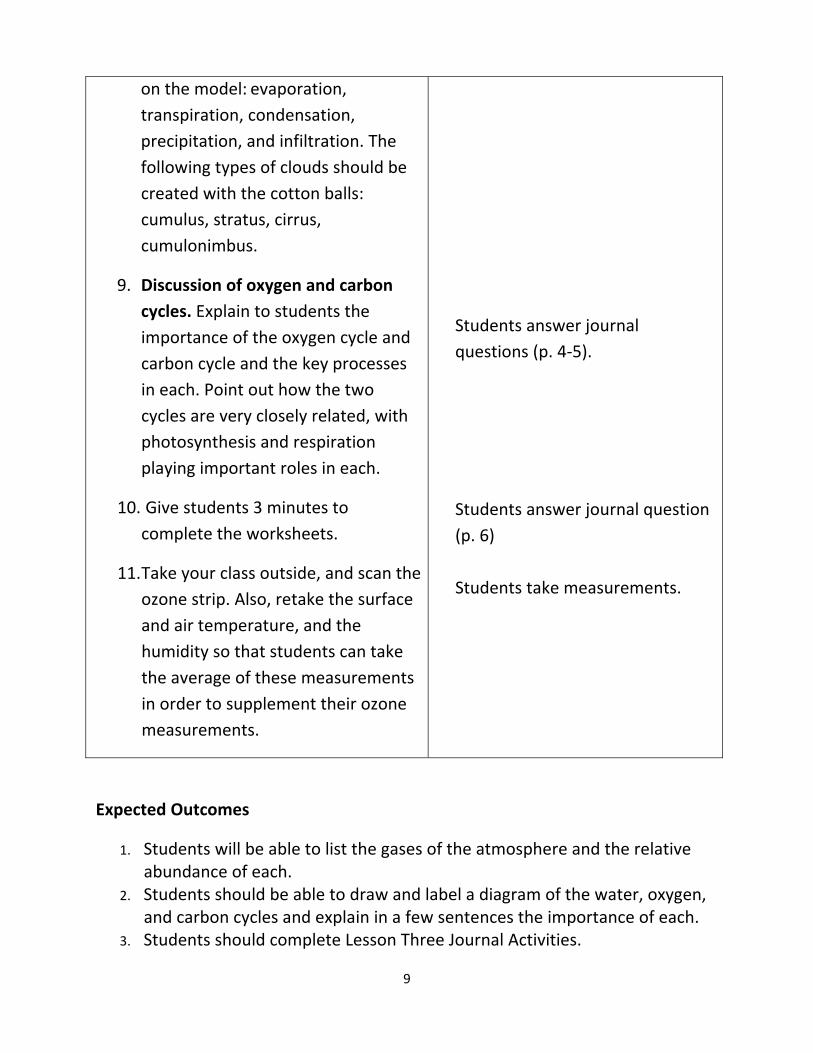
on the model: evaporation, transpiration, condensation, precipitation, and infiltration. The following types of clouds should be created with the cotton balls: cumulus, stratus, cirrus, cumulonimbus.
9. Discussion of oxygen and carbon cycles. Explain to students the importance of the oxygen cycle and carbon cycle and the key processes in each. Point out how the two cycles are very closely related, with photosynthesis and respiration playing important roles in each.
10. Give students 3 minutes to complete the worksheets.
11. Take your class outside, and scan the ozone strip. Also, retake the surface and air temperature, and the humidity so that students can take the average of these measurements in order to supplement their ozone measurements.
Students answer journal questions (p. 4‐5).
Students answer journal question (p. 6) Students take measurements.

Science TEKS: 5.1(A,B), 5.2(A,B,C,D,E,F,G), 5.3(A,C), 5.4(A,B) Suggested Time: 65 minutes Math TEKS: 5.11, 5.14, 5.15
Lesson Four (Teacher) “The Dual Nature of Ozone – Stratospheric Ozone”
Objective
Students have already learned about the most common gases in the atmosphere. Now they will begin to learn about how other substances in the atmosphere can strongly affect their health and the environment, even in minute concentrations. In this lesson, students will learn about stratospheric ozone and the difference between this high‐level ozone (which protects the Earth from ultraviolet radiation) and low‐level ozone (which is an air pollutant).
Stratospheric ozone forms naturally and protects us from ultraviolet radiation. Tropospheric ozone forms from air pollutant emissions and harms human health.
Credit: U.S. EPA: “Ozone Good Up High, Bad Nearby”
1

Science TEKS: 5.1(A,B), 5.2(A,B,C,D,E,F,G), 5.3(A,C), 5.4(A,B) Suggested Time: 65 minutes Math TEKS: 5.11, 5.14, 5.15
Background Information
Most of the oxygen in the atmosphere, and the type that we need to sustain life, has two atoms per molecule (O2). Ozone, by contrast, has three oxygen atoms (O3). Ozone forms naturally in the stratosphere when intense ultraviolet radiation from the Sun splits an oxygen molecule (O2) into two O atoms. Each O can then combine with another O2 to form O3. [Note: The concept of molecules composed of atoms is above the 5th grade level; for your explanation to students, you can state that the Sun’s intense UV radiation splits oxygen to form ozone].
About 90 percent of the ozone in the Earth’s atmosphere is found in what is known as the ozone layer in the stratosphere (about 10‐30 miles above Earth’s surface). The ozone layer absorbs most of the Sun’s ultraviolet radiation to shield us from these damaging rays. Ultraviolet rays can cause a range of negative effects: they can cause cancer, burn skin, damage eyes, weaken the human immune system, and harm both plants and animals. In fact, estimates show that a one percent reduction in the ozone layer results in a two to five percent increase in the number of cases of cancer!
Certain air pollutants can damage the ozone layer. The most dramatic depletion of the ozone layer is the Antarctic ozone hole. In the early 1980s, scientists discovered major thinning of the ozone layer above Antarctica during springtime1. In fact, they observed nearly 70% less ozone than had been found there previously! Scientists realized that the depletion of the ozone layer is caused by the release of certain chemicals such as chlorofluorocarbons (CFCs) into the atmosphere. Just a few decades ago, CFCs were used in air conditioners, aerosol sprays, and cleaning products. When CFCs reach the stratosphere, they react with the sunlight to release chlorine atoms, which can destroy ozone molecules. In
1 The dramatic thinning of ozone over the South Pole does not last for the entire year. Instead, it usually occurs in September or October (Antarctic springtime) and “fills in” or disappears by December. Special conditions in the Antarctic winter make its stratospheric ozone especially sensitive to depletion by chlorine when the sun returns in the early spring. Outside of Antarctica, slight reductions in stratospheric ozone have also been observed over most of the planet.
2

Science TEKS: 5.1(A,B), 5.2(A,B,C,D,E,F,G), 5.3(A,C), 5.4(A,B) Suggested Time: 65 minutes Math TEKS: 5.11, 5.14, 5.15 1989, an international agreement known as the Montreal Protocol was signed to ban the most destructive ozone‐depleting gases and preserve the ozone layer. If the agreement is adhered to, it is hoped that the ozone layer will completely recover by 2050.
From September 21‐30, 2006 the average area of the ozone hole was the largest ever observed. In this image, from Sept. 24, 2006, the Antarctic ozone hole was equal to the record
single‐day size of 11.4 million square miles. Credit: http://www.nasa.gov/centers/goddard/news/topstory/2006/ozone_record.html
As we have seen, the ozone layer in the stratosphere is a vital layer of protection for the Earth. This layer that contains most of the atmosphere’s ozone is far above the air that we breathe every day, and even above the altitude where most airplanes fly. However, when ozone forms near the surface in the troposphere, where humans breathe, it is an air pollutant that can harm our lungs and the natural environment. This tropospheric ozone is the same molecule as in the stratosphere. However, in the troposphere, ozone forms in very different ways than in the stratosphere. We’ll learn more about tropospheric ozone and other air pollutants in Lesson Five.
3

Science TEKS: 5.1(A,B), 5.2(A,B,C,D,E,F,G), 5.3(A,C), 5.4(A,B) Suggested Time: 65 minutes Math TEKS: 5.11, 5.14, 5.15
4
Additional Resources
More information about good and bad ozone can be found at http://www.epa.gov/airnow/gooduphigh ‐ a booklet by the EPA called Good Up High, Bad Nearby. Other great resources regarding ozone can be found at:
1. http://www.epa.gov/ozone/strathome.html. 2. http://www.windows.ucar.edu/tour/link=/Earth/Atmosphere/ozone_ov
erview.html&edu=mid 3. http://www.clean‐air‐kids.org.uk/ozonehole.html 4. Comic strip from US EPA illustrating the two types of ozone:
http://www.epa.gov/ozone/sciencem /missoz/index.html.
Vocabulary
• ozone • ozone layer • ultraviolet rays • Antarctic ozone hole • Chlorofluorocarbons (CFCs) • Montreal Protocol
• Environmental Protection Agency
• Asthma • Cancer • Tropospheric ozone • Stratospheric ozone
Materials (for a class of 25)
• Hygrometer (1 per class) • Infrared Thermometer (1 per
class) • Ozone Test Strips (1 per class) • Ozone Scanner (1 per class) • Wind Vane (1 per class) • Thermal Glove (1 per class)
• Cloud Charts (1 per class) • GLOBE Measurement Data
Sheets (1 per student) • Computer • Access to Brainpop.com • Projection screen
Step‐by‐Step Suggested Lesson Plan
Instructor Activity
1. Measurements. Take your students outside and conduct the GLOBE protocols. Students should set up the ozone strip, take the air and surface temperature, observe the sky for clouds, and measure humidity and wind direction.
2. Discussion. Ask students to think of examples of things that are good in one location, but bad somewhere else (e.g., a lion in a zoo, the flame of a candle, etc.). Explain that ozone is a gas that is “Good Up High, Bad Nearby”: up high it shields Earth from radiation, but nearby it is harmful to breathe. (See “Background Information” for details and links to resources).
3. Video. “Ozone Layer” on Brainpop.com provides a good overview of stratospheric ozone.
4. Discussion: Go into more detail about “good” stratospheric ozone. Ex: How ozone is formed, where the layer can be found, and how it protects our health from UV rays.
Student Activity
Students take measurements and write down their results on their data sheets.
Students participate in brainstorming and answer related questions on p. 1. Students watch video and answer related questions (p. 2) Students listen and answer questions: (p. 3)
5
6
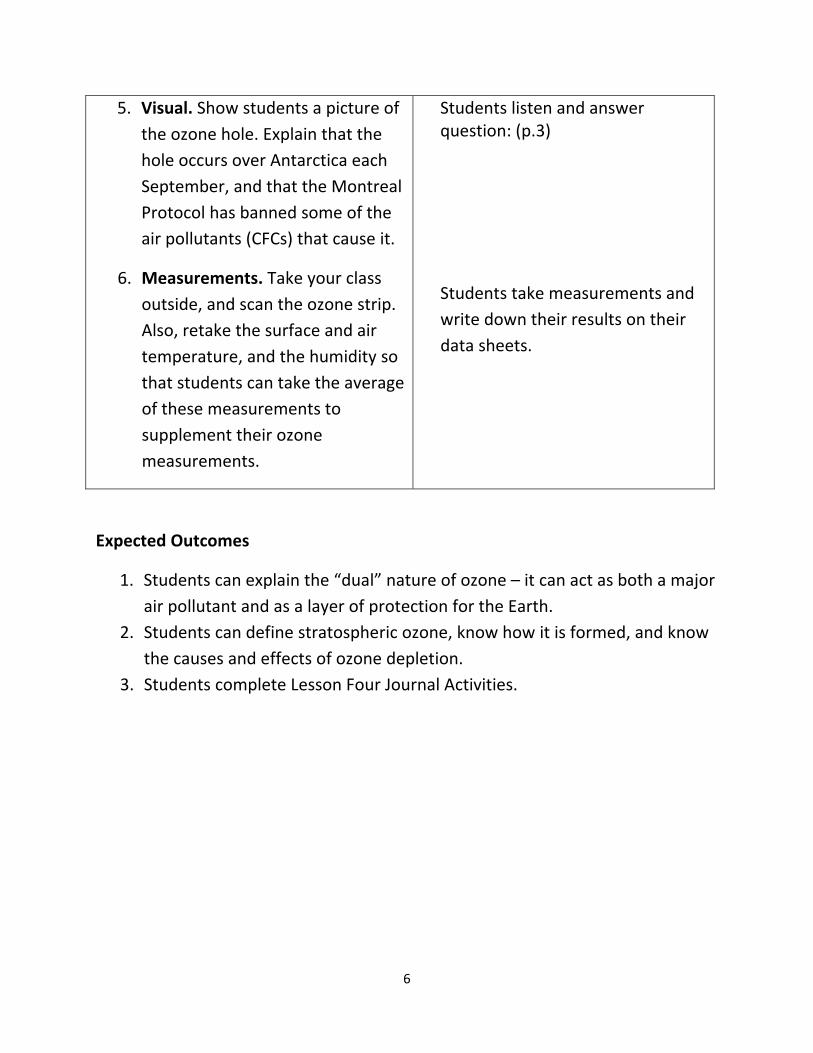
Expected Outcomes
1. Students can explain the “dual” nature of ozone – it can act as both a major air pollutant and as a layer of protection for the Earth.
2. Students can define stratospheric ozone, know how it is formed, and know the causes and effects of ozone depletion.
3. Students complete Lesson Four Journal Activities.
5. Visual. Show students a picture of the ozone hole. Explain that the hole occurs over Antarctica each September, and that the Montreal Protocol has banned some of the air pollutants (CFCs) that cause it.
6. Measurements. Take your class outside, and scan the ozone strip. Also, retake the surface and air temperature, and the humidity so that students can take the average of these measurements to supplement their ozone measurements.
Students listen and answer question: (p.3) Students take measurements and write down their results on their data sheets.

Science TEKS: 5.1(A,B), 5.2(A,B,C,D,E,F,G), 5.3(A,C), 5.4(A,B) Suggested Time: 120 minutes Math TEKS: 5.11, 5.14, 5.15
Lesson Five (Teacher) “Tropospheric Ozone and Other Air Pollutants”
Objective
During Lesson Four, students learned about the “dual” nature of ozone, and in particular stratospheric ozone. Today, students will learn about tropospheric or low‐level ozone, which is a very harmful air pollutant. Students will learn about how it is created, and how it affects our planet. Students will explore statistics about Houston ozone levels, as well as national ozone levels. Students will learn how to read the EPA’s Air Quality Index, and will also become more informed about current issues regarding ozone pollution. Hopefully, as they explore these topics, they will gain a much more complete understanding of how different factors contribute to the creation of low‐level ozone, which is what they are measuring everyday through the GLOBE protocols. Students will also learn about ways that they can help prevent the creation of ground‐level ozone.
With this background knowledge, students will spend the second half of class discussing with other students and with the teacher what they have learned about air pollution, ozone, surface temperature, air temperature, humidity, clouds, and wind direction. This begins the inquiry‐based learning of the curriculum. Students will be asked to create hypotheses regarding what they think the relationships are between the six GLOBE measurements they take every day (listed above). For example, do they think that on days that that the air temperature is higher there will be more ozone measured in the air or vice‐versa? Today, students will write down the trends they think they will see in their GLOBE measurement data. By the end of the curriculum, on Day Seven, they can use their data to either refute or support their initial conjectures.
1

Science TEKS: 5.1(A,B), 5.2(A,B,C,D,E,F,G), 5.3(A,C), 5.4(A,B) Suggested Time: 120 minutes Math TEKS: 5.11, 5.14, 5.15 Background Information
There are many types of air pollution. Air pollution consists of chemicals and/or particulate matter in the air that causes harm or discomfort to living things or the environment. All of the air pollutants that are harmful for us to breathe, or that cause the atmosphere to look “hazy” or “dirty,” actually constitute very little of the entire atmosphere. Most pollutants are less than one molecule per million air molecules, and yet they still have quite an impact on humans and on the environment.
Power plants, factories, and vehicles can release these particles as well as gases like sulfur dioxide and nitrogen oxides. These gases are also types of air pollutants. They are harmful to people’s health – causing a range of illnesses from a simple cough to cancer. Ozone (O3), near the ground, is also a deadly form of air pollution. This is tropospheric ozone.
Stratospheric ozone acts as a layer of protection for the Earth (refer to Lesson Four for more information). However, ozone also forms in the troposphere, where humans and animals can breathe it in. This tropospheric ozone is an air pollutant that is harmful to humans and the natural environment. It is quite interesting to point out that ozone is major air pollutant in the troposphere even though tropospheric ozone only constitutes ten percent of all atmospheric ozone. Low‐level ozone, found near the earth’s surface, is formed when chemicals are released from cars, factories, the burning of fossil fuels etc. When these chemicals react with the heat and the sunlight, ozone is formed. Though many of the many of the chemicals are released in urban areas, winds tend to carry the chemicals with it, creating ozone pollution in more rural areas as well. Low‐level ozone can also interfere with photosynthesis, and can stunt the growth of some types of plants.
Low‐level ozone can have the following health effects (even at concentrations of less than 100 parts per billion i.e. 1 ozone molecule for every 10 million air molecules):
1. Make people more sensitive to allergens
2

Science TEKS: 5.1(A,B), 5.2(A,B,C,D,E,F,G), 5.3(A,C), 5.4(A,B) Suggested Time: 120 minutes Math TEKS: 5.11, 5.14, 5.15
2. Aggravate asthma 3. Damage and inflame the lungs, making it harder to breathe 4. Irritate the respiratory system ‐ coughing and irritation in the chest
All of the above can prevent people from taking part in vigorous activities outdoors. Children and the elderly are especially sensitive to these health effects.
Normal lung tissue (left) and lung tissue exposed to high levels of ozone Credit: US EPA
More information about tropospheric ozone can be found at http://www.epa.gov/airnow/gooduphigh ‐ a booklet by the Environmental Protection Agency called Good Up High, Bad Nearby.
The Houston region has long struggled to meet federal air quality standards for ground‐level (tropospheric) ozone. Large amounts of emissions from vehicles and industries (including numerous petrochemical facilities) and hot weather conditions contribute to Houston’s ozone pollution. Though cleaner cars and factories have greatly improved ozone levels in Houston, they continue to exceed federal limits. The U.S. EPA recently lowered the ozone limit from 85 parts per billion to 75 parts per billion, because scientists found that health impacts can occur even at these low levels. This lower limit will make it even more challenging for Houston to reduce emissions sufficiently to attain the ozone standard.
3

Science TEKS: 5.1(A,B), 5.2(A,B,C,D,E,F,G), 5.3(A,C), 5.4(A,B) Suggested Time: 120 minutes Math TEKS: 5.11, 5.14, 5.15
Houston’s ground‐level ozone pollution has improved dramatically over the past decade, but continues to violate federal air quality standards.
Credit: Texas Commission on Environmental Quality
In addition to tropospheric ozone, there are many other types of air pollutants that can cause significant impacts. An air pollutant is any gas or particle in the air that causes harm to living things or the environment. Particles, like dust and soot, are microscopic liquids or solids suspended in the air. When the air looks “hazy” like in the picture below, it is mostly due to particles scattering and absorbing light. Scientists and doctors have learned that high levels of particles in the air can cause cardiovascular and respiratory diseases. The “Coffee Can” Particle Experiment that began in Lesson 4 helps students visualize the particles in the air.
4

Science TEKS: 5.1(A,B), 5.2(A,B,C,D,E,F,G), 5.3(A,C), 5.4(A,B) Suggested Time: 120 minutes Math TEKS: 5.11, 5.14, 5.15
Houston on a hazy day (L); Houston on a clear Day (R) Credit: http://www.jpl.nasa.gov/news/features.cfm?feature=423
Other air pollutants are gases such as sulfur dioxide, carbon monoxide, lead, and benzene. Most of these gases are virtually invisible and occur in very small concentrations (typically less than 1 molecule per million air molecules), but they can still have major impacts on our health and the environment. Some air pollutants cause health effects ranging from respiratory disease to cancer. Others are greenhouse gases that can warm the planet as we will discuss in Lesson 6.
The sources of air pollutants are widely varied and include manmade and natural processes. For example, particles are emitted by manmade sources like diesel engines and smokestacks, and by natural sources such as volcanoes and windblown dust. Cows actually produce 80 million metric tons per year of methane (CH4), which is a greenhouse gas and one of the hydrocarbons that forms tropospheric ozone.
The Environmental Protection Agency posts Air Quality Index numbers for different parts of the country every day to tell us how clean the air is that day. Many times, this is printed by the local newspaper so people know whether it is safe to be outside. More information about this can be found at http://airnow.gov/index.cfm?action=aqibroch.index. In the Houston Chronicle, the weather page shows the ozone levels from the day before and a forecast of today’s ozone levels. Online, the Houston Chronicle has a “current air quality” map that you can click on. That takes you to an interactive map, where they can
5
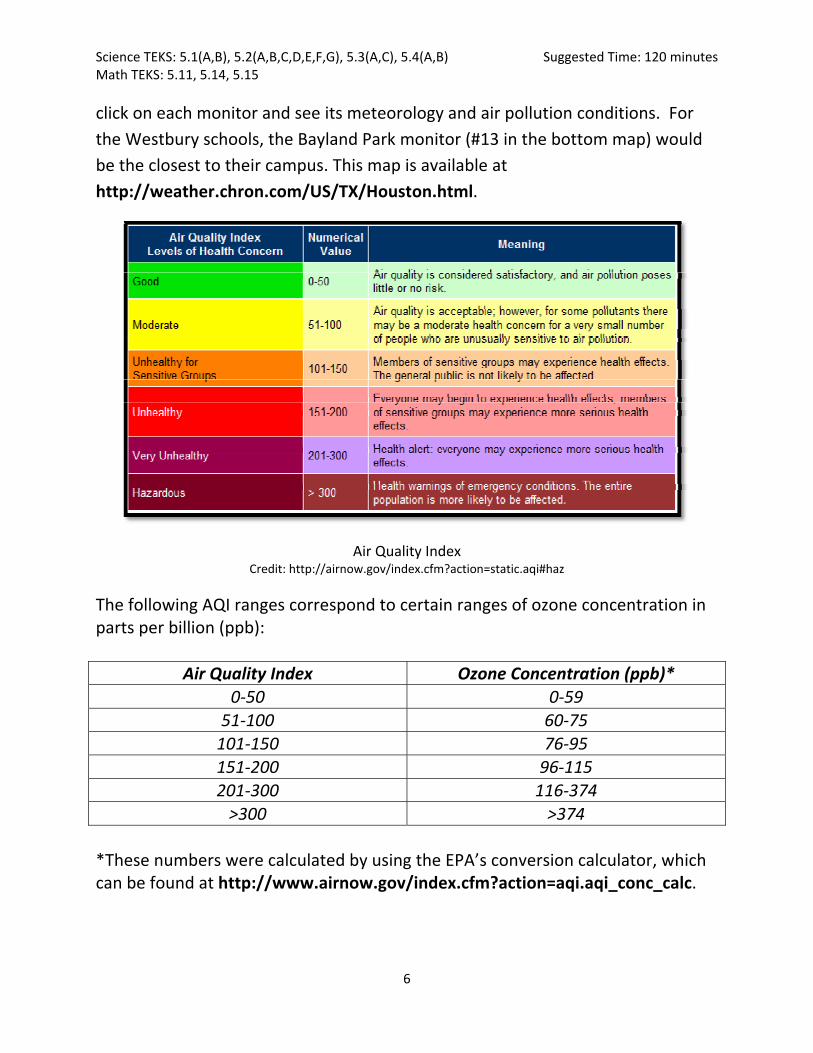
Science TEKS: 5.1(A,B), 5.2(A,B,C,D,E,F,G), 5.3(A,C), 5.4(A,B) Suggested Time: 120 minutes Math TEKS: 5.11, 5.14, 5.15 click on each monitor and see its meteorology and air pollution conditions. For the Westbury schools, the Bayland Park monitor (#13 in the bottom map) would be the closest to their campus. This map is available at http://weather.chron.com/US/TX/Houston.html.
Air Quality Index Credit: http://airnow.gov/index.cfm?action=static.aqi#haz
The following AQI ranges correspond to certain ranges of ozone concentration in parts per billion (ppb):
Air Quality Index Ozone Concentration (ppb)*0‐50 0‐59
51‐100 60‐75 101‐150 76‐95 151‐200 96‐115 201‐300 116‐374 >300 >374
*These numbers were calculated by using the EPA’s conversion calculator, which can be found at http://www.airnow.gov/index.cfm?action=aqi.aqi_conc_calc.
6
Science TEKS: 5.1(A,B), 5.2(A,B,C,D,E,F,G), 5.3(A,C), 5.4(A,B) Suggested Time: 120 minutes Math TEKS: 5.11, 5.14, 5.15 Other great resources, if you need additional reading material, can be found at:
1. http://www.epa.gov/ozone/strathome.html. 2. http://www.windows.ucar.edu/tour/link=/earth/Atmosphere/ozone_ov
erview.html&edu=mid 3. http://www.clean‐air‐kids.org.uk/ozonehole.html
The EPA also provides reading material through Project A.I.R.E:
1. Air pollution http://www.epa.gov/region01/students/pdfs/rd_airpol.pdf 2. Health effects
http://www.epa.gov/region01/students/pdfs/rd_health.pdf 3. Weather and air quality
http://www.epa.gov/region01/students/pdfs/weather.pdf 4. Ozone http://www.epa.gov/region01/students/pdfs/ozone.pdf 5. Automobiles and air pollution
http://www.epa.gov/region01/students/pdfs/rd_auto.pdf
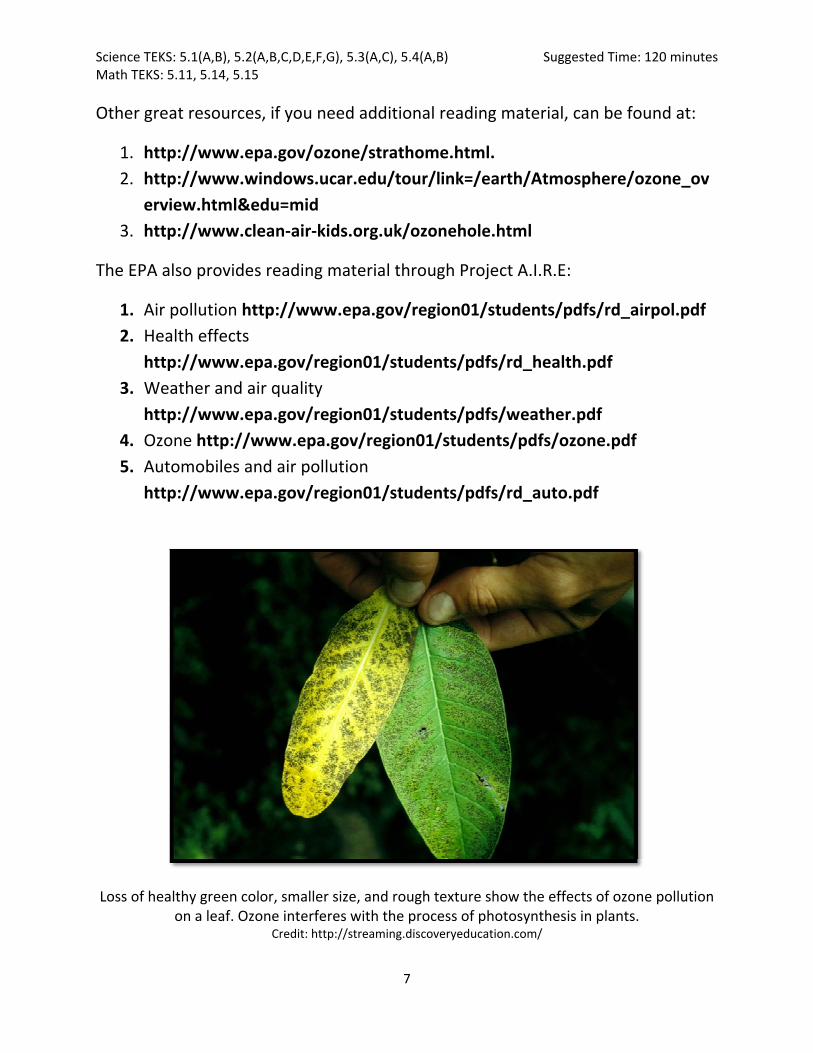
Loss of healthy green color, smaller size, and rough texture show the effects of ozone pollution on a leaf. Ozone interferes with the process of photosynthesis in plants.
Credit: http://streaming.discoveryeducation.com/
7
Science TEKS: 5.1(A,B), 5.2(A,B,C,D,E,F,G), 5.3(A,C), 5.4(A,B) Suggested Time: 120 minutes Math TEKS: 5.11, 5.14, 5.15
8
Materials (for a class of 25)
• Hygrometer (1 per class) • Infrared Thermometer (1 per
class) • Ozone Test Strips (1 per class) • Ozone Scanner (1 per class) • Wind Vane (1 per class) • Thermal Glove (1 per class) • Cloud Charts (1 per class)
• GLOBE Measurement Data Sheets (1 per student)
• Access to computer (enough for two or three students to share a computer)
• Access to UnitedLearning.com • Access to Brainpop.com • Projection Screen
Vocabulary
• Ozone • Ultraviolet radiation • Air pollution • Oxygen atoms • Tropospheric ozone • Stratospheric ozone • Environment • Surface temperature • Air temperature • Humidity • Clouds • Wind direction
• Environmental Protection Agency
• Air Quality Index • Air pollutants • Particles • Manmade sources • Natural Sources • Methane • Sulfur Dioxide • Carbon Monoxide • Lead • Benzene

Science TEKS: 5.1(A,B), 5.2(A,B,C,D,E,F,G), 5.3(A,C), 5.4(A,B) Suggested Time: 120 minutes Math TEKS: 5.11, 5.14, 5.15 Step 12 in Lesson Plan
http://airnow.gov/index.cfm?action=aqikids.index.
http://www.airnow.gov/index.cfm?action=aqi.aqi_conc_calc.
9

Science TEKS: 5.1(A,B), 5.2(A,B,C,D,E,F,G), 5.3(A,C), 5.4(A,B) Suggested Time: 120 minutes Math TEKS: 5.11, 5.14, 5.15 Step 13 in Lesson Plan
http://www.airnow.gov/
Step 14 in Lesson Plan
http://www.airnow.gov/index.cfm?action =airnow.showmap&pollutant=OZONE& domain=hou&map=archives&date=9/30/2004 &standard=US&language=EN
10
Science TEKS: 5.1(A,B), 5.2(A,B,C,D,E,F,G), 5.3(A,C), 5.4(A,B) Suggested Time: 120 minutes Math TEKS: 5.11, 5.14, 5.15
Instructor Activity
1. Take your students outside and conduct the GLOBE protocols. Students should set up the ozone strip, take the air and surface temperature, observe the sky for clouds, and measure humidity and wind direction.
2. Take one minute to review the definition of stratospheric, “good” ozone.
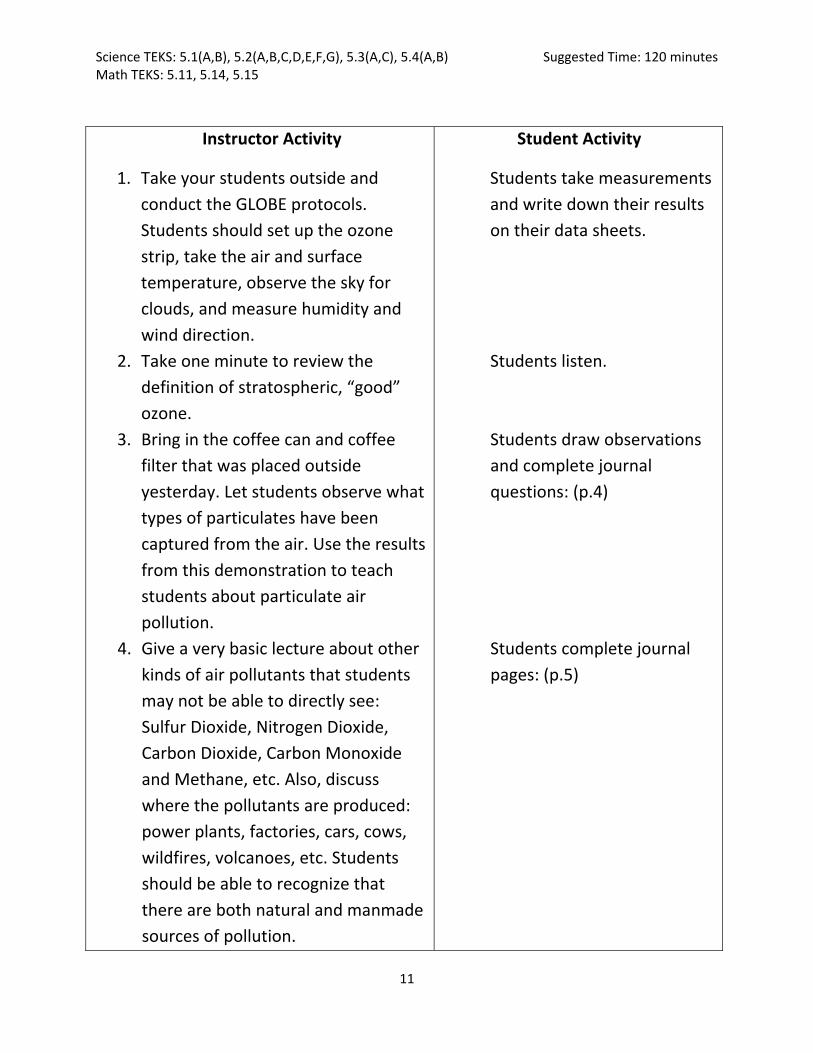
3. Bring in the coffee can and coffee filter that was placed outside yesterday. Let students observe what types of particulates have been captured from the air. Use the results from this demonstration to teach students about particulate air pollution.
4. Give a very basic lecture about other kinds of air pollutants that students may not be able to directly see: Sulfur Dioxide, Nitrogen Dioxide, Carbon Dioxide, Carbon Monoxide and Methane, etc. Also, discuss where the pollutants are produced: power plants, factories, cars, cows, wildfires, volcanoes, etc. Students should be able to recognize that there are both natural and manmade sources of pollution.
Student Activity
Students take measurements and write down their results on their data sheets. Students listen. Students draw observations and complete journal questions: (p.4) Students complete journal pages: (p.5)
11

Science TEKS: 5.1(A,B), 5.2(A,B,C,D,E,F,G), 5.3(A,C), 5.4(A,B) Suggested Time: 120 minutes Math TEKS: 5.11, 5.14, 5.15
5. You can use the online National Geographic article entitled Air Pollution, to supplement Step 3 of the lesson plan. This can be found at http://environment.nationalgeographic. com/environment/global‐warming/pollution‐overview.html. As a class, students may read the article and, if time permits, take the accompanying online quiz.
6. Next, teach the students about tropospheric or “bad” ozone. Discuss how it is formed, the sources of the ozone, and the ozone’s negative health effects. What are the “ingredients” necessary for the formation of low‐level ozone? Heat? Sunlight? Wind? Factory and vehicular emissions? Do more of these “ingredients” create more ozone? Discuss how interesting it is that ozone, with three oxygen atoms is so harmful, while, oxygen, with just two atoms is vital. What are the health effects of low‐level, tropospheric ozone? **Note** The EPA provides a great illustrated comic that introduces both types of ozone. Feel free to use this as a supplement or guide. The comic is available online at http://www.epa.gov/ozone/science
Students read article as a class, and if time permits, take the online quiz. Students complete journal pages: (p.6)
12
Science TEKS: 5.1(A,B), 5.2(A,B,C,D,E,F,G), 5.3(A,C), 5.4(A,B) Suggested Time: 120 minutes Math TEKS: 5.11, 5.14, 5.15
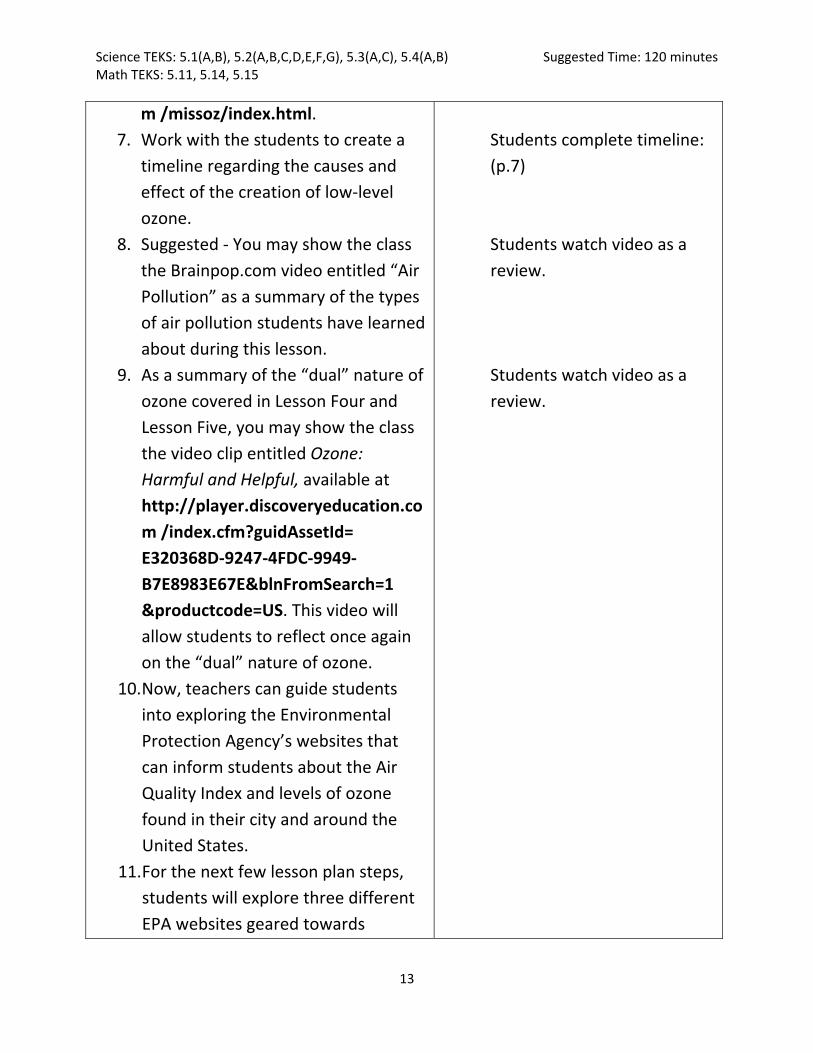
m /missoz/index.html. 7. Work with the students to create a
timeline regarding the causes and effect of the creation of low‐level ozone.
8. Suggested ‐ You may show the class the Brainpop.com video entitled “Air Pollution” as a summary of the types of air pollution students have learned about during this lesson.
9. As a summary of the “dual” nature of ozone covered in Lesson Four and Lesson Five, you may show the class the video clip entitled Ozone: Harmful and Helpful, available at http://player.discoveryeducation.com /index.cfm?guidAssetId= E320368D‐9247‐4FDC‐9949‐B7E8983E67E&blnFromSearch=1 &productcode=US. This video will allow students to reflect once again on the “dual” nature of ozone.
10. Now, teachers can guide students into exploring the Environmental Protection Agency’s websites that can inform students about the Air Quality Index and levels of ozone found in their city and around the United States.
11. For the next few lesson plan steps, students will explore three different EPA websites geared towards
Students complete timeline: (p.7) Students watch video as a review. Students watch video as a review.
13

Science TEKS: 5.1(A,B), 5.2(A,B,C,D,E,F,G), 5.3(A,C), 5.4(A,B) Suggested Time: 120 minutes Math TEKS: 5.11, 5.14, 5.15
younger students. Students will learn about the Air Quality Index, and about ozone levels at the local and national level. This part of the lesson is organized into a type of scavenger hunt – students will follow the instructions and questions listed in their Day Five Journal to complete this part. Teachers will act as a guide during this par t of the course, answering questions but also letting students explore and learn on the computer on their own.
12. First, visit http://airnow.gov/index.cfm?action=aqikids.index. This website teaches about the Air Quality Index in fun and simple way. Guide students into answering the related questions in their journals by using this website. Question 3d, on p. 9 of the student journal relates AQI values to ozone concentrations in parts per billion. This will allow students to see how their own GLOBE ozone measurements relate to AQI index values.
13. Students will then visit http://www.airnow.gov/. Here, students will able to see a map of the current ozone levels in the United States, and will also be able to see
Students complete journal pages: (p.8‐9) Students complete journal pages: (p.10‐11, questions 1‐5)
14

Science TEKS: 5.1(A,B), 5.2(A,B,C,D,E,F,G), 5.3(A,C), 5.4(A,B) Suggested Time: 120 minutes Math TEKS: 5.11, 5.14, 5.15
the specific Air Quality Index numbers for several cities around the nation. Students will also be able to explore ozone levels for previous days in their city.
14. Next, students will be able to look at an animation of the ozone levels in Houston on one specific day. This animation is a map with the AQI colors presented every hour of the day (September 30, 2004) Students will be able to use this to record the ozone levels for every hour. In this animation, the ozone levels are greatest during the mid‐afternoon, when temperatures are the highest, so students will be able to see that higher ozone levels correspond to higher temperature. This animation is found at http://www.airnow.gov/index.cfm?action =airnow.showmap&pollutant=OZONE& domain=hou&map=archives&date=9/30/2004 &standard=US&language=EN .
15. Now that students have a solid understanding of tropospheric, ozone, they will move into the scientific inquiry portion of the lesson. Students will be asked to
Students complete journal pages: (p. 11‐12, question 8) Students read journal page: (p.14). Students complete journal page: (p.15)
15

Science TEKS: 5.1(A,B), 5.2(A,B,C,D,E,F,G), 5.3(A,C), 5.4(A,B) Suggested Time: 120 minutes Math TEKS: 5.11, 5.14, 5.15
create hypotheses regarding what they think the relationships are between the six GLOBE measurements they take every day. For example, do they think that on days that that the air temperature is higher there will be more ozone measured in the air? How does cloud cover and humidity relate to the amount of ozone in the air? Let students make these hypotheses on their own in their journals – they have learned enough to make some educated guesses. Students will write down the trends they think they will see in their GLOBE measurement data. On Day Seven, they can use their final data to either refute or support their initial conjectures.
16. Take your class outside, and scan the ozone strip. Also, retake the surface and air temperature, and the humidity so that students can take the average of these measurements in order to supplement their ozone measurements.
Students take measurements and write down their results on their data sheets.
16
Science TEKS: 5.1(A,B), 5.2(A,B,C,D,E,F,G), 5.3(A,C), 5.4(A,B) Suggested Time: 120 minutes Math TEKS: 5.11, 5.14, 5.15
17
Expected Outcomes
1. Students will be able to define tropospheric ozone, and will understand how this is ozone is created and how it effects our planet.
2. Students will know how to read the EPA’s Air Quality Index. Using this knowledge, they will be able to read local and national ozone maps, and will also know the relation between AQI index values and ozone concentration in units of parts per billion (ppb).
3. Students will have created hypotheses regarding what they think the relationships are between the six GLOBE measurements they take every day.

Science TEKS: 5.1(A,B), 5.2(A,B,C,D,E,F,G), 5.3(A), 5.4(A,B), 5.7(C), 5.8(A), 5.9(C) Suggested Time: 60 minutes Math TEKS: 5.11, 5.14, 5.15
Lesson Six (Teacher) “The Greenhouse Effect and Global Warming”
Objective
By now, students have covered air pollution, and in particular, ozone, in quite great detail. So today, as students take their last set of GLOBE measurements, students will be cover some other interesting, related topics. The greenhouse effect has already been mentioned, and today, it will be covered in greater detail. Students will also be able to learn about global warming, their carbon footprint, and alternative and clean fuels and sources of energy. These topics have been added near the end of the curriculum so students may tie in their knowledge about air pollution into the global picture. Air pollution is a worldwide issue, and students should come away with a sense of their own impact on the environment and what they can do to prevent the creation of more air pollution.
1

Science TEKS: 5.1(A,B), 5.2(A,B,C,D,E,F,G), 5.3(A), 5.4(A,B), 5.7(C), 5.8(A), 5.9(C) Suggested Time: 60 minutes Math TEKS: 5.11, 5.14, 5.15 Background Information
The greenhouse effect is the warming of the Earth caused by certain gases in the atmosphere. First, sunlight shines onto the Earth’s surface. The Earth absorbs some of this energy and radiates its own energy back toward space. We don’t see the Earth’s radiation because it is mostly infrared, unlike the Sun’s ultraviolet and visible light. Greenhouse gases are chemicals in the atmosphere that prevent some of the Earth’s infrared radiation (i.e., heat) from escaping into space, while letting sunlight pass through. Greenhouse gases include water vapor, carbon dioxide, methane, chlorofluorocarbons, and ozone.
The greenhouse effect is very beneficial to life on Earth because it maintains the temperature of the atmosphere, just as a greenhouse keeps up its warm temperature inside its walls. The greenhouse effect also stabilizes temperatures between daytime and nighttime. Without the presence of greenhouse gases the surface of the Earth would be too cold for liquid water! (For an interactive animation of the greenhouse effect, visit http://environment.nationalgeographic.com/environment/global‐warming/gw‐overview‐interactive.html )
Greenhouse effect Credit: http://www.epa.gov/climatechange/kids/greenhouse.html
2

Science TEKS: 5.1(A,B), 5.2(A,B,C,D,E,F,G), 5.3(A), 5.4(A,B), 5.7(C), 5.8(A), 5.9(C) Suggested Time: 60 minutes Math TEKS: 5.11, 5.14, 5.15
The Global Energy Budget
Credit: Bulletin of the American Meteorological Society 90.3 (2009): 314.
While the greenhouse effect is necessary for most life on Earth, increasing levels of greenhouse gases can cause Earth’s temperature to rise. This is what scientists believe is currently happening to our planet. The burning of fossil fuels and the loss of forests have caused levels of greenhouse gases like carbon dioxide to increase dramatically over the past century. Many greenhouse gases remain in the atmosphere for decades. As a result, more and more heat is being trapped in the Earth’s atmosphere, which is causing the Earth’s climate to warm.
Global warming is the increase in the average air temperature of Earth. Most climate scientists believe that the Earth’s average temperature has been rising over the past century, and that most of this warming has been caused by manmade emissions of greenhouse gases, such as the burning of fossil fuels.
3

Science TEKS: 5.1(A,B), 5.2(A,B,C,D,E,F,G), 5.3(A), 5.4(A,B), 5.7(C), 5.8(A), 5.9(C) Suggested Time: 60 minutes Math TEKS: 5.11, 5.14, 5.15
Atmospheric carbon dioxide has been increasing in recent decades. Credit: http://www.globalwarmingart.com/wiki/Image:Mauna_Loa_Carbon_Dioxide_png
4
Science TEKS: 5.1(A,B), 5.2(A,B,C,D,E,F,G), 5.3(A), 5.4(A,B), 5.7(C), 5.8(A), 5.9(C) Suggested Time: 60 minutes Math TEKS: 5.11, 5.14, 5.15
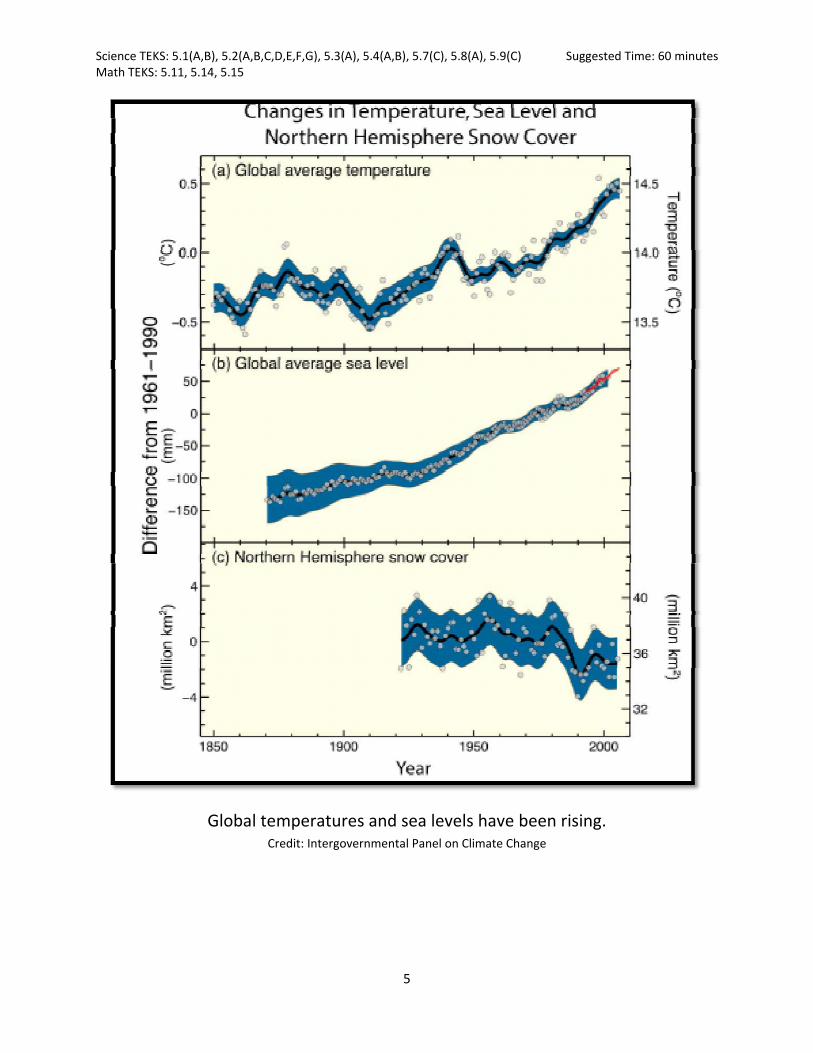
Global temperatures and sea levels have been rising. Credit: Intergovernmental Panel on Climate Change
5
Science TEKS: 5.1(A,B), 5.2(A,B,C,D,E,F,G), 5.3(A), 5.4(A,B), 5.7(C), 5.8(A), 5.9(C) Suggested Time: 60 minutes Math TEKS: 5.11, 5.14, 5.15
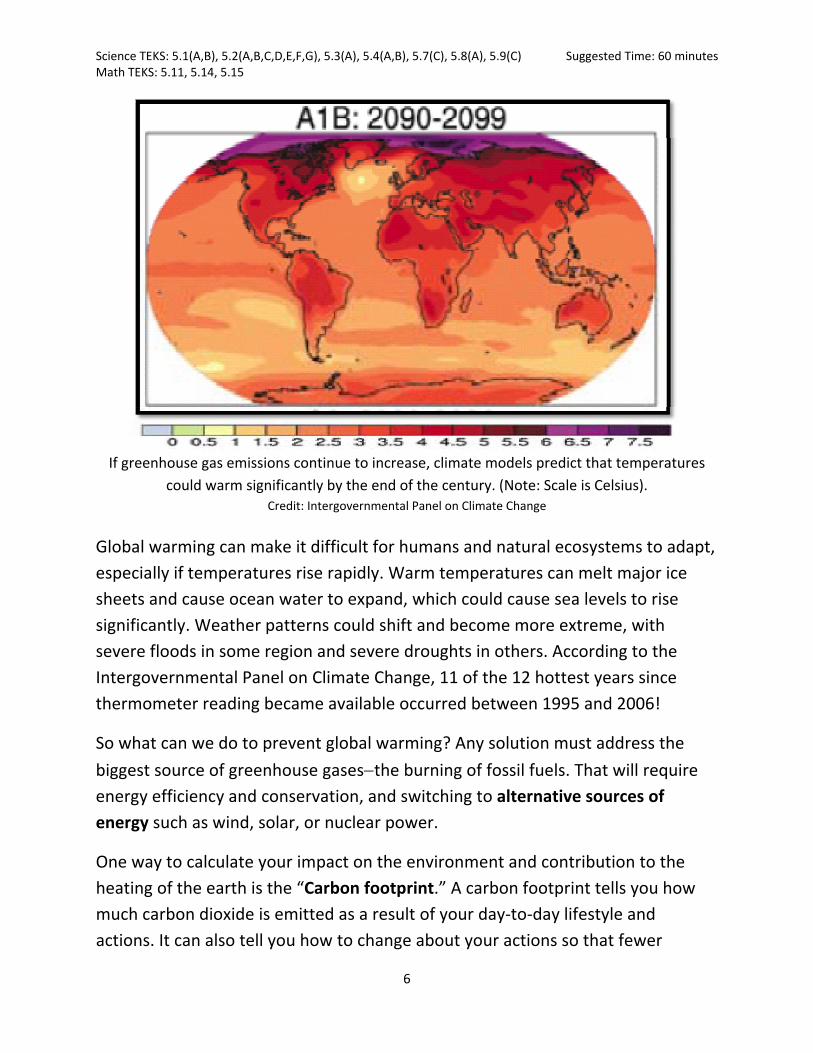
If greenhouse gas emissions continue to increase, climate models predict that temperatures
could warm significantly by the end of the century. (Note: Scale is Celsius). Credit: Intergovernmental Panel on Climate Change
Global warming can make it difficult for humans and natural ecosystems to adapt, especially if temperatures rise rapidly. Warm temperatures can melt major ice sheets and cause ocean water to expand, which could cause sea levels to rise significantly. Weather patterns could shift and become more extreme, with severe floods in some region and severe droughts in others. According to the Intergovernmental Panel on Climate Change, 11 of the 12 hottest years since thermometer reading became available occurred between 1995 and 2006!
So what can we do to prevent global warming? Any solution must address the biggest source of greenhouse gases−the burning of fossil fuels. That will require energy efficiency and conservation, and switching to alternative sources of energy such as wind, solar, or nuclear power.
One way to calculate your impact on the environment and contribution to the heating of the earth is the “Carbon footprint.” A carbon footprint tells you how much carbon dioxide is emitted as a result of your day‐to‐day lifestyle and actions. It can also tell you how to change about your actions so that fewer
6
Science TEKS: 5.1(A,B), 5.2(A,B,C,D,E,F,G), 5.3(A), 5.4(A,B), 5.7(C), 5.8(A), 5.9(C) Suggested Time: 60 minutes Math TEKS: 5.11, 5.14, 5.15 pollutants are released into the air. Toward the end of this lesson, students will compute their own carbon footprints using an EPA computer program online.
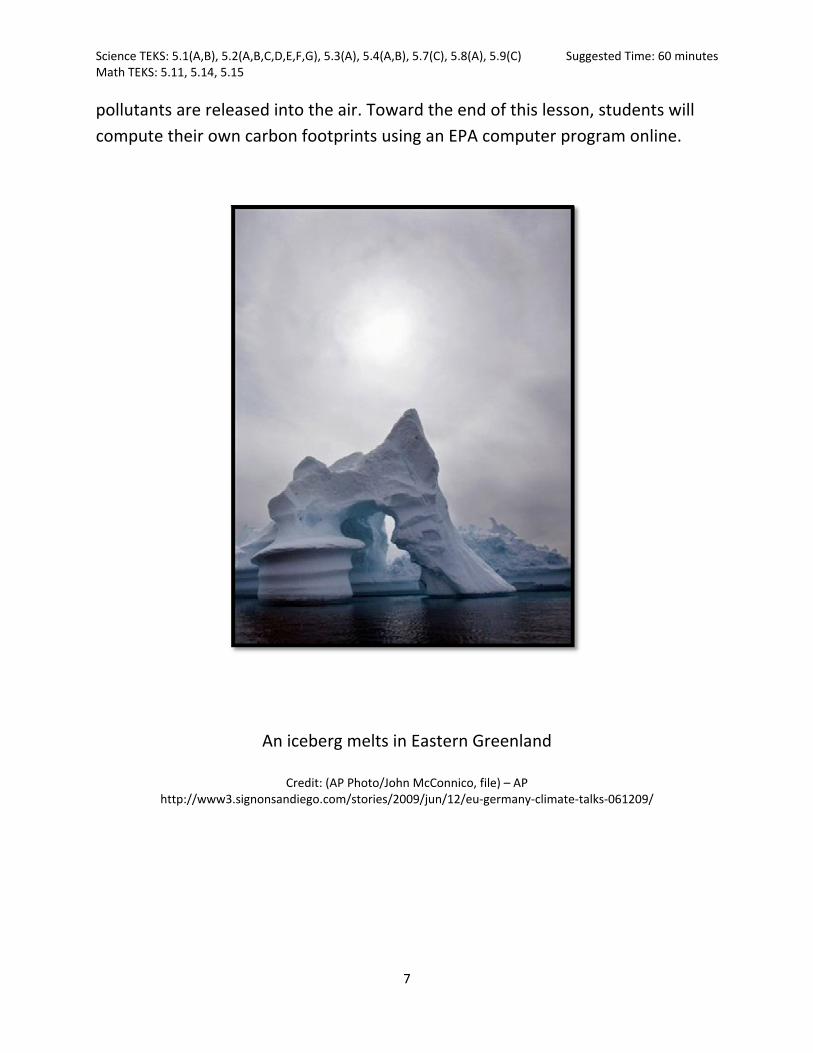
An iceberg melts in Eastern Greenland
Credit: (AP Photo/John McConnico, file) – AP http://www3.signonsandiego.com/stories/2009/jun/12/eu‐germany‐climate‐talks‐061209/
7
Science TEKS: 5.1(A,B), 5.2(A,B,C,D,E,F,G), 5.3(A), 5.4(A,B), 5.7(C), 5.8(A), 5.9(C) Suggested Time: 60 minutes Math TEKS: 5.11, 5.14, 5.15
8
How can we keep our air clean and reduce our carbon footprint?
• Walk, bike or take the bus • Turn down the heat in your house • Look out for energy‐efficient appliances • Use fluorescent light bulbs • Ask your parents to make sure that your air conditioners are in good
condition • Shut off the lights when you are not in the room • Save water! Turn off the water when you are brushing your teeth and do
the laundry or run the dishwasher only when you have a full load of clothes or dishes.
• Use environmentally safe paints and cleaning product • Turn off your electronic appliances when they are not in use. • Use less heat and air conditioning. Close the blinds on a hot day to keep the
heat from the sun out. Dress lightly when it's hot, and add a layer when it's cold. Grab a blanket when it is cold and a fan when it is hot.
Additional reading materials:
1. Greenhouse effect http://www.epa.gov/region01/students/pdfs/greenhouse.pdf
2. Ozone http://www.epa.gov/region01/students/pdfs/ozone.pdf 3. Clean fuels http://www.epa.gov/region01/students/pdfs/rd_clean.pdf 4. Clean air Act http://www.epa.gov/region01/students/pdfs/rd_cleanair.pdf 5. The Greenhouse Effect http://www.windows.ucar.edu/tour/link=/earth/interior/greenhouse_effect.html
Materials (for a class of 25)

Science TEKS: 5.1(A,B), 5.2(A,B,C,D,E,F,G), 5.3(A), 5.4(A,B), 5.7(C), 5.8(A), 5.9(C) Suggested Time: 60 minutes Math TEKS: 5.11, 5.14, 5.15
• Hygrometer (1 per class) • Infrared Thermometer (1 per
class) • Ozone Test Strips (1 per class) • Ozone Scanner (1 per class) • Wind Vane (1 per class) • Thermal Glove (1 per class)
• Cloud Charts (1 per class) • GLOBE Measurement Data
Sheets (1 per student) • Computers • Projection Screen • Access to Brainpop.com
Vocabulary
• Low‐level ozone • Greenhouse effect • Global warming • Atmosphere • Carbon footprint
• Alternative fuels • Alternative energy • Greenhouse effect • Greenhouse gases
Step 5 in Lesson Plan
http://environment.nationalgeographic.com/environment/global‐warming/gw‐impacts‐interactive.html
9
Science TEKS: 5.1(A,B), 5.2(A,B,C,D,E,F,G), 5.3(A), 5.4(A,B), 5.7(C), 5.8(A), 5.9(C) Suggested Time: 60 minutes Math TEKS: 5.11, 5.14, 5.15
Instructor Activity
1. Take your students outside and conduct the GLOBE protocols. Students should set up the ozone strip, take the air and surface temperature, observe the sky for clouds, and measure humidity and wind direction.
2. Introduce the last topics that the class will be learning about in the curriculum. Tell students that they will be learning about the greenhouse effect, global warming, alternative energy, and the carbon footprint.
3. First, discuss the greenhouse effect. Students should understand the gases and basic processes behind the effect. The greenhouse effect has a dual nature. Make sure to make it clear that the greenhouse effect is good for the Earth to some extent. Talk about when excess air pollution causes the greenhouse effect to harm the earth. If you feel it is necessary, you can show the video entitled “Greenhouse effect” on Brainpop.com
4. Let discussion about the greenhouse effect lead to the warming of the earth, and to global warming. Make sure to clearly state the causes and effects of global warming. You may
Student Activity
Students take measurements and write down results on data sheets.
Students complete journal pages: (p. 3‐4) Students visit website and answer related questions in their journal. (p. 5)
10

Science TEKS: 5.1(A,B), 5.2(A,B,C,D,E,F,G), 5.3(A), 5.4(A,B), 5.7(C), 5.8(A), 5.9(C) Suggested Time: 60 minutes Math TEKS: 5.11, 5.14, 5.15
use the following article to introduce the causes: http://environment.nationalgeographic.com/environment/global‐warming/gw‐causes.html . Definitely use this National Geographic article to discuss the very real effects of global warming: http://environment.nationalgeographic.com/environment/global‐warming/gw‐effects.html .
5. Next, guide students to an interactive map of global warming effects available at: http://environment.nationalgeographic.com/environment/global‐warming/gw‐impacts‐interactive.html . Guide students into answering the related questions in their journal.
6. Briefly discuss some suggested solutions to the creation of too many greenhouse gases and global warming. If you would like, there is an article regarding that at: http://environment.nationalgeographic.com/environment/global‐warming/gw‐solutions.html .
7. Briefly discuss the search for alternative and clean energy sources.
8. Finally, tell students that you will be transitioning to talking about our day‐
Students complete journal page: (p. 7). Students listen. Students complete journal page: (p.8)
11

Science TEKS: 5.1(A,B), 5.2(A,B,C,D,E,F,G), 5.3(A), 5.4(A,B), 5.7(C), 5.8(A), 5.9(C) Suggested Time: 60 minutes Math TEKS: 5.11, 5.14, 5.15
12
Expected Outcomes
1. Students understand the causes and effects of the greenhouse effect. 2. Students understand the causes and effects of global warming. 3. Students understand the steps that can be taken to prevent increases in air
pollution, the greenhouse effect, and global warming.
to‐day lifestyles, and how it affects the amount of air pollution, the greenhouse effect, and global warming.
9. Students will be measuring their carbon footprint. A carbon footprint calculator will tell students how much carbon emission they are creating with their actions, and how much carbon emissions they can prevent by changing a few simple things. Guide students into completing the footprint, which is available at the EPA’s website: http://www.epa.gov/climatechange/kids/calc/index.html .
10. Ask students how they can reduce their carbon footprint.
11. Take your class outside, and scan the ozone strip. Also, retake the surface and air temperature, and the humidity so that students can take the average of these measurements in order to supplement their ozone measurements.
Students complete carbon footprint and answer related questions in journal (p. 9) Students complete journal page: (p.11) Students take measurements and write down their results on their data sheets.
Science TEKS: 5.1(A,B), 5.2(A,B,C,D,E,F,G), 5.3(A,C), 5.4(A,B) Suggested Time: 60 minutes Math TEKS: 5.5, 5.11, 5.13, 5.14, 5.15, 5.16
Day Seven (Teacher) “Analyzing GLOBE Data”
Objective
Students have now finished taking the last of their GLOBE measurements. In today’s lesson, students will compile and analyze their data. The goal of today’s lesson is for students to explore relationships between ozone and the other factors that they measured. Students will analyze the data from the six GLOBE measurements – ozone, cloud cover, humidity, air temperature, surface temperature, and wind direction. They will do this by using simple calculations and by creating charts, graphs, and pictures to represent their data. These calculations and graphs will allow students to see trends in their data. For example, students may find that temperature is positively correlated to the amount of low‐level ozone present (as they discovered is true in Smog City 2 in Lesson 5). However, if the data shows no clear trends or atypical correlations (e.g., ozone highest on cool, cloudy days), students must not be discouraged. Instead, explain possible reasons for anomalous results: 1) five days may be too little data for students to find typical relationships between factors, and 2) factors that cannot be measured at one school (e.g., daily fluctuations in emissions; complex wind flow patterns) also affect the creation of low‐level ozone. Students should understand that this is also part of experimental design, and that they would probably be able to come up with more accurate conclusions if they took the GLOBE measurements for a much a longer period of time.
After students have reached their conclusions, they will be able to compare them to their original hypotheses. Students will also be given a chance to compare and communicate their findings with other students.
1

Students will most likely find the following correlations in their data. However, actual results may vary due to the small number of data points collected and factors beyond the scope of these measurements that affect ozone.
Positive Correlation
Negative Correlation
No Correlation
Reasoning
Ozone and Air Temperature
√ The higher the temperature, the more
ozone is produced. This is one reason why summertime is the time to watch out for unhealthy levels of ozone.
Ozone and Humidity
?May be positively or negatively correlated depending on complex factors beyond scope of this curriculum. Possible reason for positive correlation: 1. Water vapor is a precursor of OH radical, which is needed to form tropospheric ozone. Possible reasons for negative correlation: 1. Higher humidity may be associated with rainy conditions, which disperse pollution and rain‐out some ozone precursors. 2. Relative humidity is often inversely correlated with temperature, because air with a given water vapor content has lower RH as temperature increases. Since ozone is positively correlated with temperature, it may be negatively correlated with RH.
Ozone and Cloud Cover
√ More cloud cover tends to reduce ozone
levels. Clouds reduce sunlight needed for the chemical reactions that form O3.
Background Information
There is no new background information for this lesson.
2

3
Vocabulary
There is no new vocabulary for this lesson.
Materials Needed (for a class of 25)
• Butcher Paper • GLOBE Measurement Data Sheets (1 per student) • Ruler
• Calculator (If needed) • Construction Paper • Crayons • Any other art supplies (If
needed to make graphs, charts, tables, pictures)
• Markers • Pencils
Step‐by‐Step Suggested Lesson Plan
Instructor Activity
1. Tell students that today is the last lesson of the curriculum. Today students will be guided into analyzing their GLOBE data for trends. Tell students they will be able to use the knowledge they have learned in order to see the how the GLOBE measurements they have taken are related.
2. Students will analyze their data. Guide students into calculations and graphing related to the data, following the instructions on the worksheets. You may choose to
Student Activity
Students listen
Students analyze their measurement data to create graphs and answer journal questions: (p.3‐6)

have some of the work, like the calculations of daily average temperature, to be done as a class.
3. Have students share their graphs and conclusions with the class. Suggestion: Create a poster recapping the students’ final conclusions and what they have learned over the course of the lessons.
4. As a final discussion for students, ask students to tell each other about something that they learned about that they found interesting.
Students share graphs and findings
Students complete final reflection journal page: (p. 7)
Expected Outcomes
1. Students will explore how cloud cover, air temperature, and humidity relate to ozone levels on a given day.
2. Students will build experience graphing data in charts.
4