Embed Size (px)
Citation preview
Lesson: Economic Indicators
9B Social
Introduction Questions
• How could anyone determine if a country is “wealthy”?
• How could anyone determine if a country is “poor”?
• To what extent does money buy happiness?
Gross Domestic Product (GDP)
• What can GDP tell us about a country?– GDP is used as an indicator of a country’s
economic health.
• What is it?– Basic measure of a nation’s economic output
and income– Total market value ($) of all final goods and
services produced annually in a country
How Is GDP Measured?
• The GDP of the United States in 2005 was more than $12 trillion.
• Economists determined this number by adding up the amount spent by four sectors: household, business, government, and foreign.
• All goods produced in the economy must be bought by someone in one of the four sectors of the economy. Summing the spending of the four sectors and subtracting import spending will give a good estimate of GDP. – Gross domestic product can be determined by multiplying the
price of each good by the quantity produced of that good.
How Is GDP Measured?
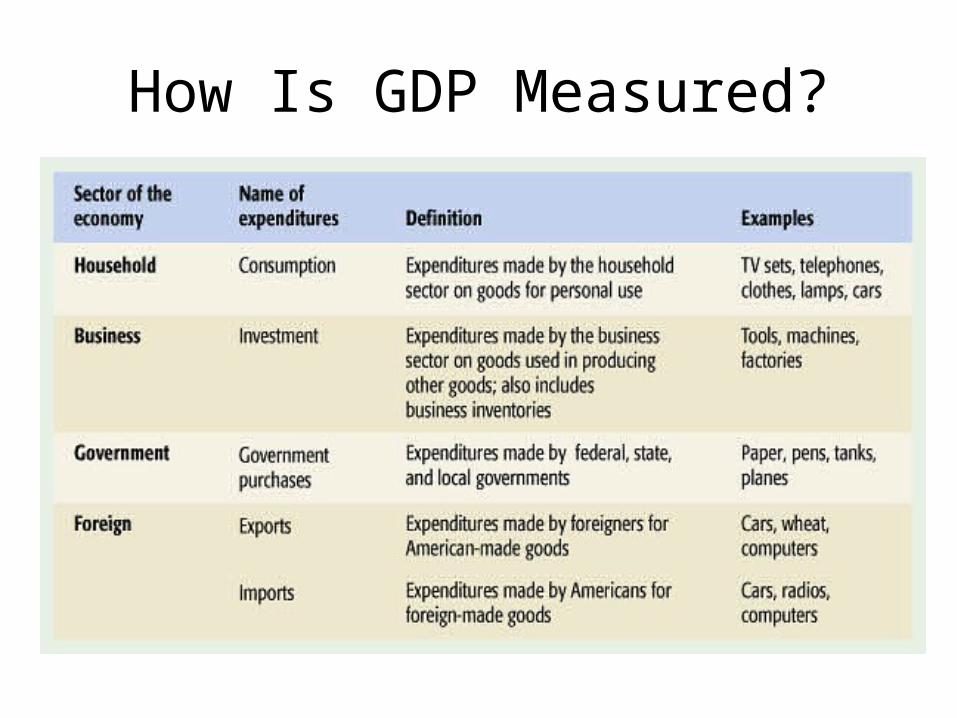
• The expenditures made by the four sectors of the economy– Household consumption
• New cars, groceries, doctor visits
– Business investment • New factories, equipment, tools
– Government spending • Military, schools, highways
– Net exports• Spending by people abroad on things made on U.S. good
and services (exports) minus spending by people in the U.S. on foreign goods and services (imports)
How Is GDP Measured?
How Is GDP Measured?
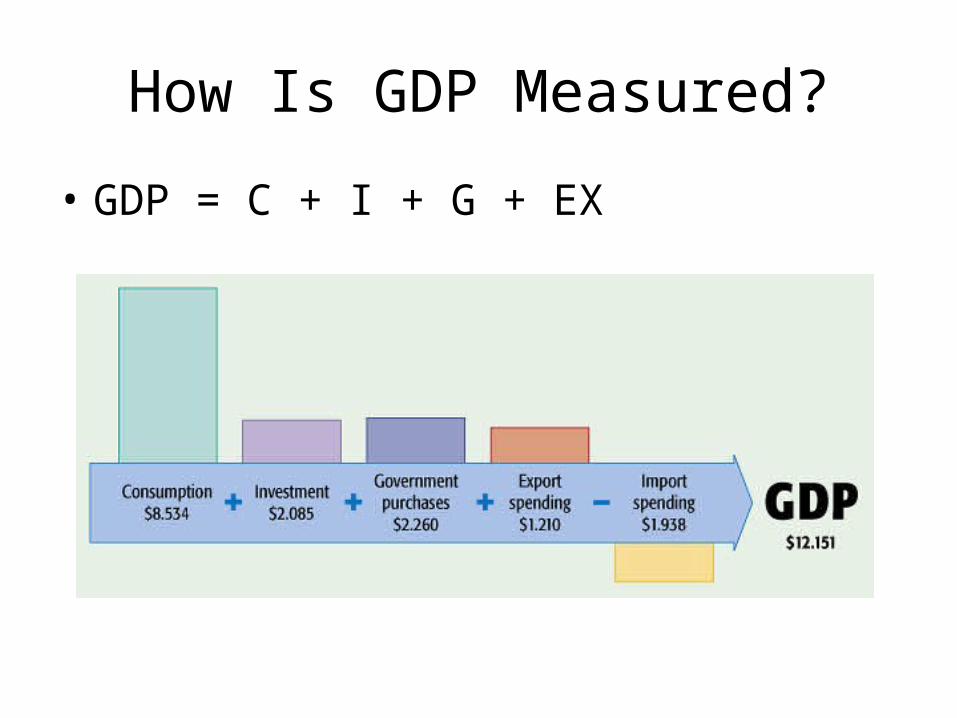
• GDP = C + I + G + EXIM
Gross Domestic Product (GDP)
• Why Count Only Final Goods?– An intermediate good is a good that is not
ready for use or purchase. It could be a good that is partially assembled. It could even be the components that are used in producing a final product.
– Suppose economists counted both final and intermediate goods and services when they computed GDP. Then they would be double counting, or counting goods more than once.
Final v. Intermediate Goods
• Final Goods and Services– Dresses– New house– Bread– Army tanks– Highway repairs– Solar panel roof for a local restaurant
Final v. Intermediate Goods
• Intermediate Goods (all products are used to produce something else that will be sold to a final buyer)– Cloth for making dresses– Siding used in new house– Flour for making bread– Screws used in army tanks– Silicon used in solar panels
Does GDP Omit Anything?• We do not count illegal goods and services in GDP because we do
not have any records of their sale or purchase.• Any legal transaction that is not recorded also cannot be counted. If
someone is paid in cash, with no sales receipt, the transaction is not likely to be recorded.
• We do not count goods and services that are traded outside official market settings.
• The sale of used goods is not counted in GDP.• Stock transactions and other financial transactions are also not
included in GDP.• Government payments, such as social security checks, are not
exchanged for goods or services, and are also not counted in GDP.
Comparing GDP
• Guess the total GDP of the United States
• Gapminder.org– Compare and research the different countries
The Difference Between GDP and GNP
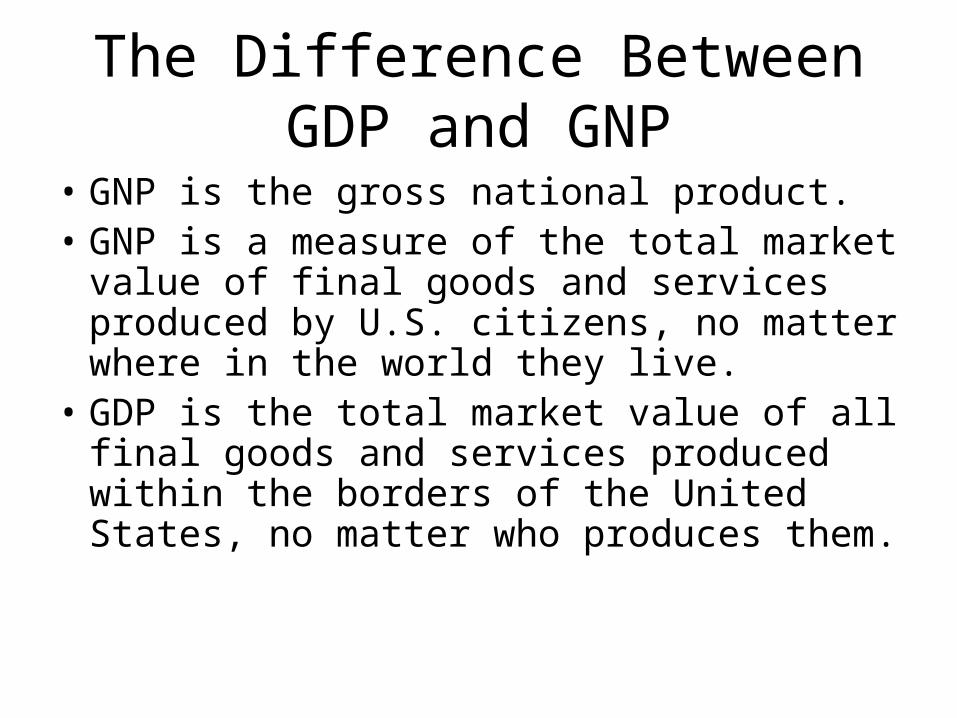
• GNP is the gross national product.• GNP is a measure of the total market
value of final goods and services produced by U.S. citizens, no matter where in the world they live.
• GDP is the total market value of all final goods and services produced within the borders of the United States, no matter who produces them.
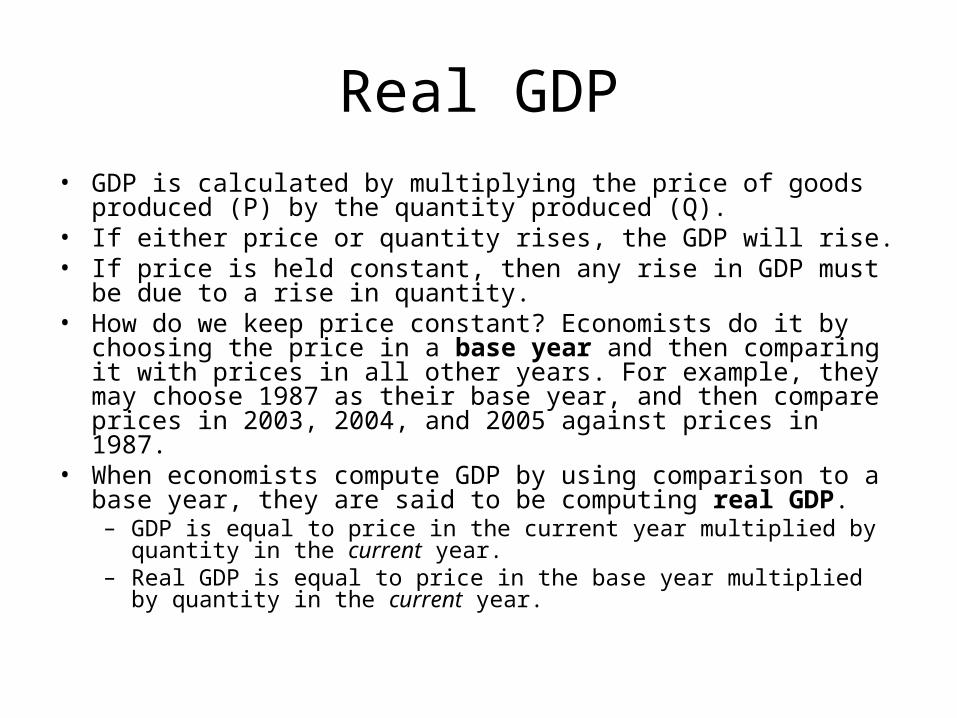
Real GDP• GDP is calculated by multiplying the price of goods produced (P) by
the quantity produced (Q).• If either price or quantity rises, the GDP will rise.• If price is held constant, then any rise in GDP must be due to a rise
in quantity.• How do we keep price constant? Economists do it by choosing the
price in a base year and then comparing it with prices in all other years. For example, they may choose 1987 as their base year, and then compare prices in 2003, 2004, and 2005 against prices in 1987.
• When economists compute GDP by using comparison to a base year, they are said to be computing real GDP.– GDP is equal to price in the current year multiplied by quantity in the
current year.– Real GDP is equal to price in the base year multiplied by quantity in the
current year.
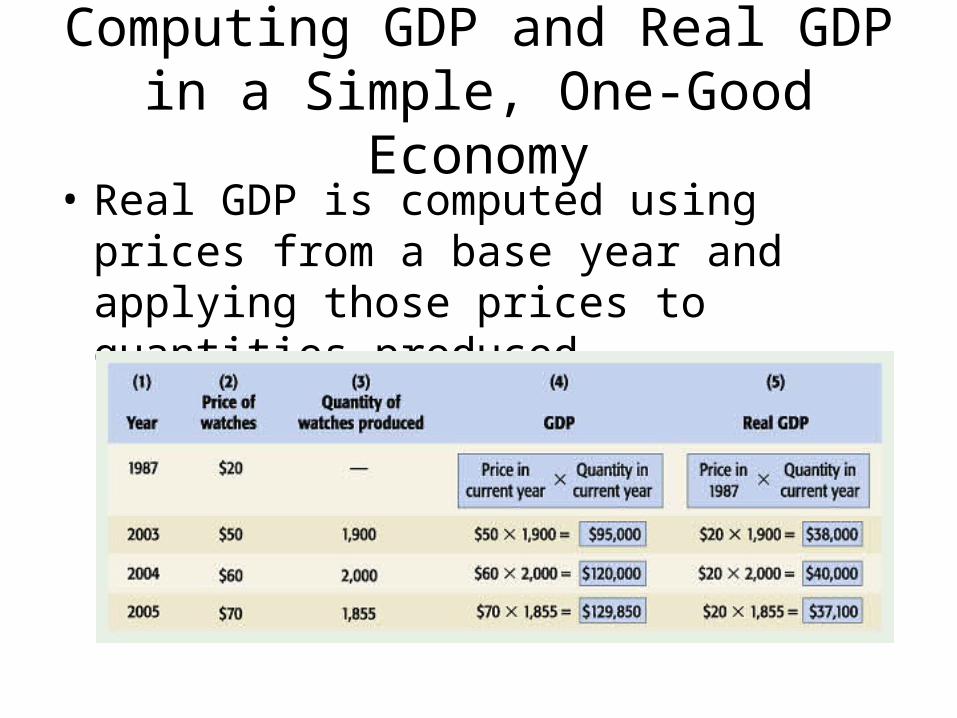
Computing GDP and Real GDPin a Simple, One-Good Economy
• Real GDP is computed using prices from a base year and applying those prices to quantities produced.
The Consumer Price Index• Economists are much more interested in what happens to prices in general
than in what happens to a single price.• A price index is a measure of the price level, or the average level of prices.• The most widely used price index is the consumer price index (CPI).• The consumer price index is calculated using a sampling of thousands of
households. The survey asks what consumers paid for a group of goods that represent all the types of goods they might purchase in a year. This group of goods is called the market basket.
• The percentage change in the CPI is equal to the CPI in the later year minus the CPI in the earlier year, divided by the CPI in the earlier year, multiplied by 100. (See Transparency 11-5.)
• Taken individually, CPI numbers mean very little. But if we compare the numbers, we can learn what is happening to prices over time. What happened to prices in the United States between 1995 and 2004? (Answer: They rose fairly steadily.)
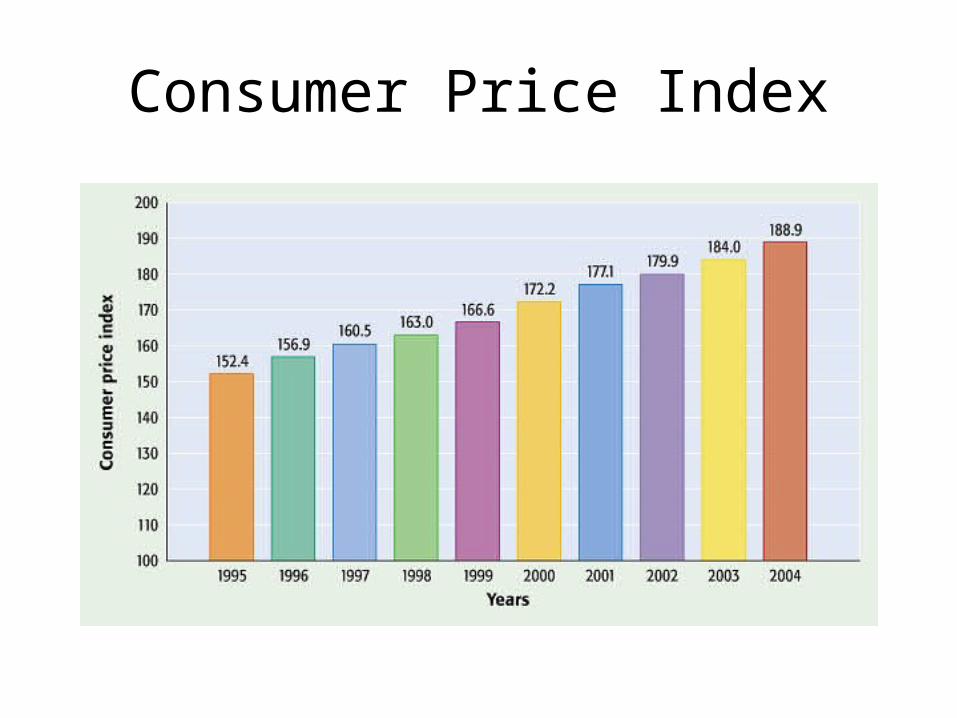
Consumer Price Index
Inflation
• What Is Inflation?– Inflation is an increase in the price level, or
the average level of prices.
• How Do We Measure Inflation?– If the price level increases from one year to
the next, the economy is experiencing inflation.
– One way of determining inflation is to look for changes in the consumer price index (CPI).
Measuring Inflation
Measuring Inflation
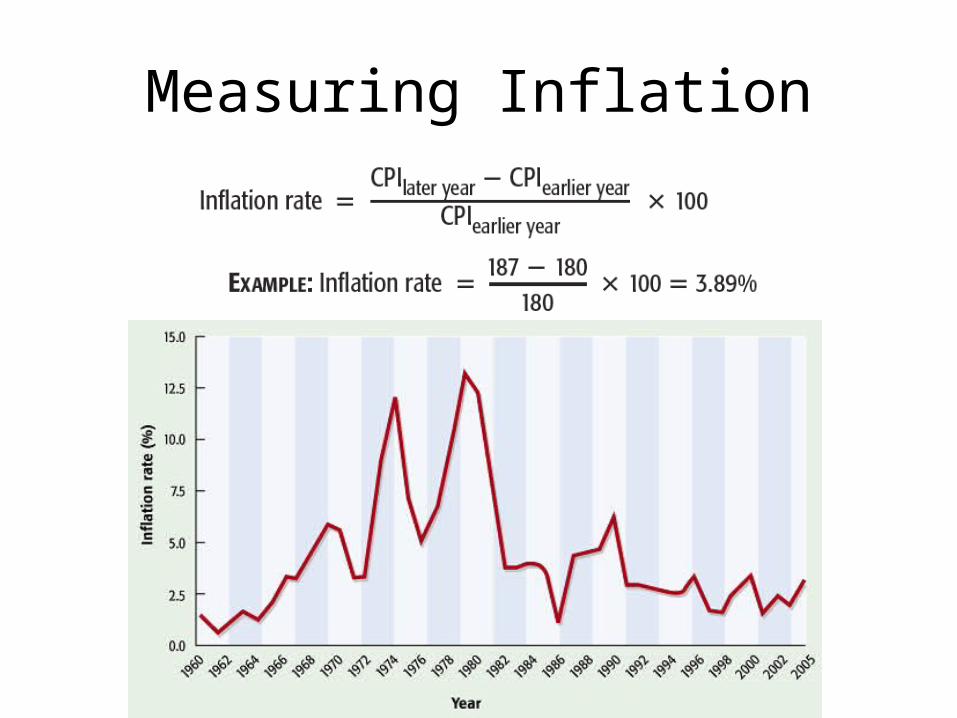
• For example, if the CPI increases from 180 in one year to 187 in the next year, the inflation rate is 3.89 percent.– Between 1960 and 2006, the United States
experienced wide fluctuations in inflation rates. – Approximately what was the highest rate during those
years? • Answer: 13.25 percent
– Approximately what was the lowest rate? • Answer: 0.5 percent
Demand-Side Versus Supply-Side Inflation
• Inflation can originate on either the demand side of the economy or the supply side of the economy. If aggregate demand increases and aggregate supply stays the same, inflation will occur.
• Demand-side inflation occurs when an increase in the price level originates on the demand side of the economy. Demand-side inflation can be caused by an increase in the money supply.
• Supply-side inflation occurs when an increase in the price level originates on the supply side of the economy.
The Effects of Inflation• Inflation increases the amount that people must spend on particular
goods or services. It can affect people on fixed incomes, savers, and partners in contracts.– Inflation reduces the buying power of people on fixed incomes, such as
social security or investment proceeds.– If the inflation rate is greater than the interest rate earned on savings
accounts, the money in those accounts loses value. As time goes on, savers will be able to buy fewer goods with the same amount of money.
– Over time, inflation can eat up the profits factored into a long-term contract. As the costs of supplies and labor increase during the length of the project, the profit that was factored into the contract begins to disappear.
• To hedge against inflation is to try to avoid or lessen a loss by taking some counterbalancing action. People try to figure out the best protection against inflation by investing in items such as gold, real estate, and art.
What Is Deflation?
• Deflation is the opposite of inflation. Deflation is a decrease in the price level, or the average level of prices.
• A downward change in the CPI indicates deflation.
• A Major Effect of Deflation– When prices fall, they do not all fall at the same time.
When prices do not fall at the same time, deflation can lead to firms going out of business and workers being laid off. These are common results during times of deflation.
What Is a Business Cycle?
• A business cycle includes recurrent swings (up and down) in real GDP of an economy.
What Is a Business Cycle?
• Economists usually talk about five phases of a business cycle.
– Peak. At the peak of a business cycle, real GDP is at a temporary high.
– Contraction. If real GDP decreases, the economy is said to be in contraction. A recession occurs when real GDP falls for two consecutive quarters.
– Trough. The low point in real GDP, just before GDP turns up, is called the trough.
– Recovery. The recovery is the period when real GDP is rising.
– Expansion. The expansion refers to increases in real GDP beyond the recovery.
Phases of the Business Cycle
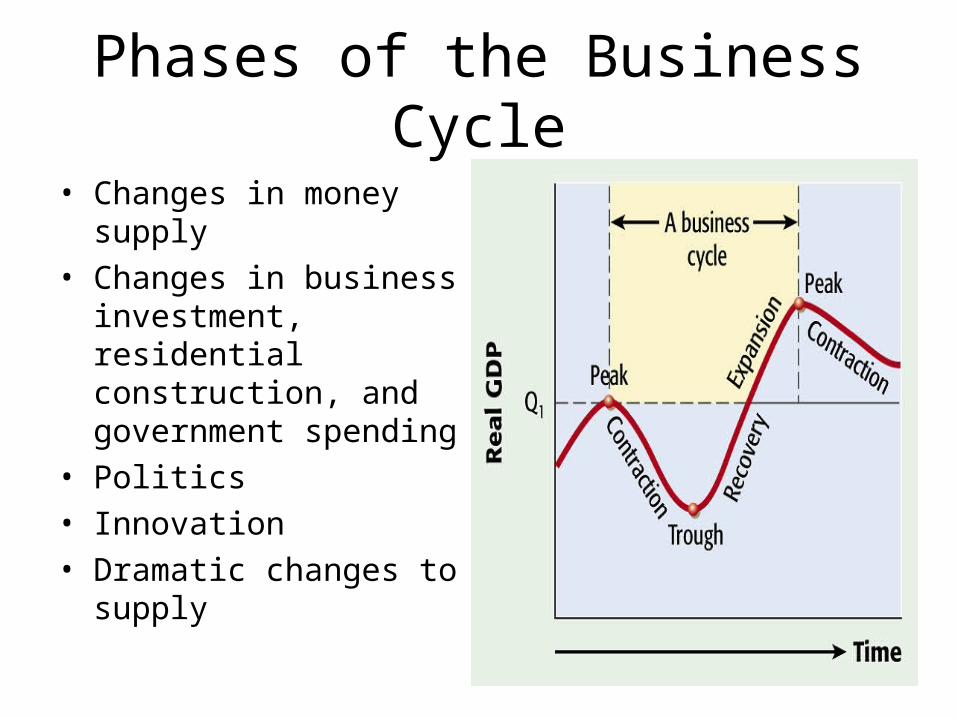
• Changes in money supply• Changes in business
investment, residential construction, and government spending
• Politics• Innovation• Dramatic changes to
supply
What Causes the Business Cycle?
• Between 1945 and 2005, the United States went through 10 business cycles. What causes a business cycle?
• One possible reason for business cycles is changes in the money supply. Some economists say that the ups and downs of business cycles are caused by the erratic behavior of the monetary authorities or the Fed.
• Other possible reasons for business cycles are changes in business investment, residential construction, or government spending. A reduction in these fields may result in less income, causing further reduced spending on consumer goods. The cycle will continue, as goods-producing firms must then reduce expenses.
What Causes the Business Cycle?
• Some business cycles may be caused by politicians pushing legislation through Congress in the hopes of gaining reelection.
• Major innovations can result in business cycles, as business firms invest resources in hopes of profiting from a new product or technology.
• Business cycles can also result from dramatic changes to supply. A supply disruption caused by hurricane or war can temporarily disrupt business practices.
What Is Economic Growth?
• Absolute real economic growth is an increase in real GDP from one period to the next.
• Per capita real economic growth is an increase in per capita real GDP from one period to the next. Per capita real GDP is real GDP divided by population.
What Causes Economic Growth?
• Factors that cause a rightward shift in the PPF include natural resources, labor, capital, human capital, technological advances, and incentives.
• With more natural resources, a country can produce more goods and services.
• With more labor, a country can produce more output. An increase in productivity of existing labor will also cause economic growth.
• Capital investment can lead to increases in labor productivity and therefore lead to increases in output or real GDP.
What Causes Economic Growth?
• Human capital can also affect economic growth. Human capital is the knowledge and skill that people use in the production of goods and services. Human capital includes honesty, creativity, and perseverance—traits that lend themselves to finding work.
• Technological advances can make it possible to obtain more output from the same amount of resources. Technological advances may result from new capital goods or new ways of producing goods.
• Some economists argue that economic growth develops where people are given the incentive to produce and innovate.
Two Worries About Future Economic Growth
• Growth can come at a great cost. Economic growth may mean more pollution, more factories, and more crowded cities, along with increased social and psychological issues.
• Continued economic and population growth may bring us to a time when there is no clean air or water, and no land for people to live on comfortably.