Embed Size (px)
Citation preview
170170
Lesson 8: Mortality
Trends
Diffetentials
Determinants
171
Introduction
Mortality differential refers to the unequal survival chances among individuals and population
groups. Death is often preceded by illness (morbidity). As a result, the state of health of
individuals and societies is the prime determinant of mortality differences. However, variations
in the types and severity of illnesses around the world indicate that the state of health is itself
dependent on the level of socio-economic development.
Education figures prominently in our discussions of fertility differentials in Ethiopia. It also tops
the list of factors determining the health of individuals and mothers’ ability to prevent illness and
care for their young. The level of mortality is at the same time the reflection and determinant of
socio economic progress. Moreover, infant and child mortality rates are among the vital
indicators widely used to assess the socio–economic wellbeing of a country’s population. “A
reduction in child mortality significantly increases life expectancy and thus human capital, which
is needed for development”. [1] With a life expectancy of only 49 years Ethiopia, unfortunately,
has one of the highest child and adult mortality rates in the world.
MORTALITY TRENDS
Infant Mortality
Definition of terms [2]:
Neonatal mortality (NN): the probability of dying within the first month of life
Post-neonatal mortality (PNN): the probability of dying between the 5th
and 52nd
week
after birth (the difference between infant and neonatal mortality)
Infant mortality (1q0): the probability of dying between birth and the first birthday
Child Mortality (4q1): the probability of dying between exact ages one and five
Under-five mortality (5q0): the probability of dying between birth and the fifth birthday
The 2005 Demographic and Health Survey [2] presents childhood mortality trends in a very
positive light in which infant mortality dropped from 93 per thousand births in 2000 to 77 per
thousand in 2005 (see Fig 8.1 also). Under-five mortality rate (U5MR) reportedly declined from
166 in 2000 to 123 per thousand live births (DHS 2005). These figures represent an impressive
mortality decline of 21 and 26 percent respectively in a span of five years.
172
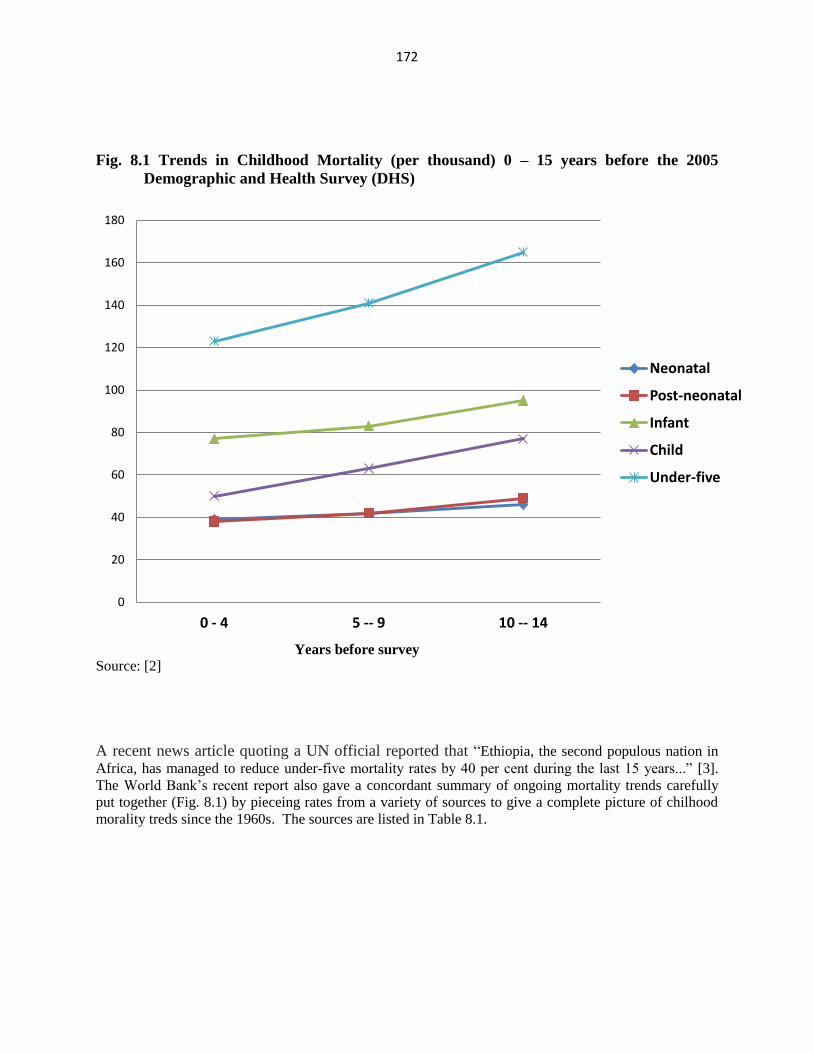
Fig. 8.1 Trends in Childhood Mortality (per thousand) 0 – 15 years before the 2005
Demographic and Health Survey (DHS)
Years before survey
Source: [2]
A recent news article quoting a UN official reported that “Ethiopia, the second populous nation in
Africa, has managed to reduce under-five mortality rates by 40 per cent during the last 15 years...” [3].
The World Bank’s recent report also gave a concordant summary of ongoing mortality trends carefully
put together (Fig. 8.1) by pieceing rates from a variety of sources to give a complete picture of chilhood
morality treds since the 1960s. The sources are listed in Table 8.1.
0
20
40
60
80
100
120
140
160
180
0 - 4 5 -- 9 10 -- 14
Neonatal
Post-neonatal
Infant
Child
Under-five
173
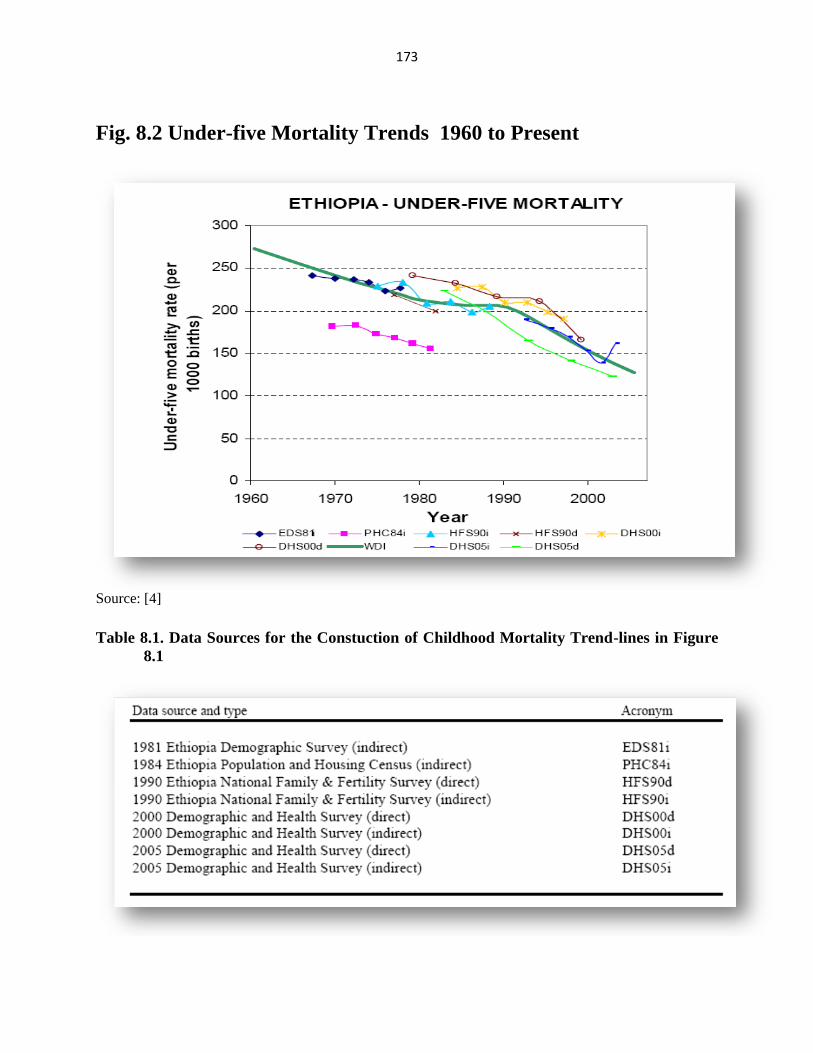
Fig. 8.2 Under-five Mortality Trends 1960 to Present
Source: [4]
Table 8.1. Data Sources for the Constuction of Childhood Mortality Trend-lines in Figure
8.1
174
Source: [3]
Mortality Trends: Child and Adolescent Mortality
Among the factors putting infants at risk of illness and death in Ethiopia are, short birth intervals,
high birth order, low birth weight, the age and educational attainment of the mother, tetanus and
other infections, congenital factors, and being part of certain religious group. [4]. The reported
low life expectancy at birth for Ethiopia which is in the high-forties, and the ongoing HIV/AIDS
epidemic, is an indication that adult mortality is also high and, perhaps, rising. On the plus side,
as indicated above, recent studies suggest a steady decline in child and young adult mortality
(Figs. 8.2 and 8.3).
Source: [6]
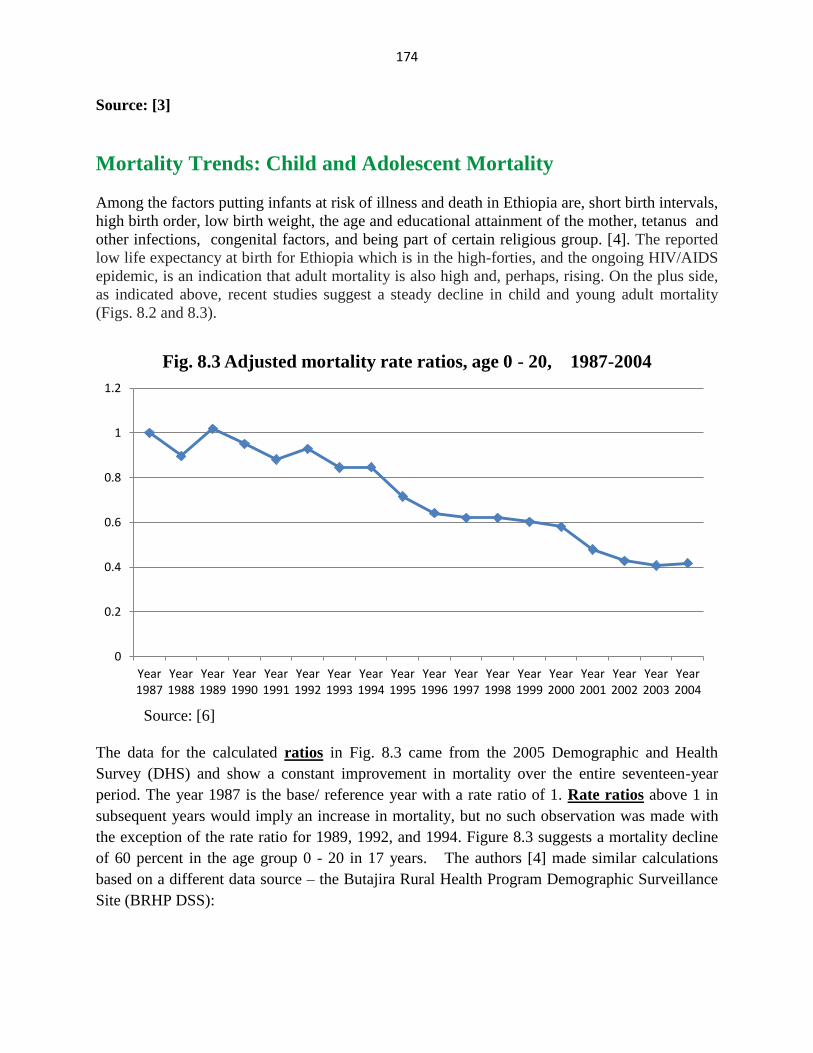
The data for the calculated ratios in Fig. 8.3 came from the 2005 Demographic and Health
Survey (DHS) and show a constant improvement in mortality over the entire seventeen-year
period. The year 1987 is the base/ reference year with a rate ratio of 1. Rate ratios above 1 in
subsequent years would imply an increase in mortality, but no such observation was made with
the exception of the rate ratio for 1989, 1992, and 1994. Figure 8.3 suggests a mortality decline
of 60 percent in the age group 0 - 20 in 17 years. The authors [4] made similar calculations
based on a different data source – the Butajira Rural Health Program Demographic Surveillance
Site (BRHP DSS):
0
0.2
0.4
0.6
0.8
1
1.2
Year 1987
Year 1988
Year 1989
Year 1990
Year 1991
Year 1992
Year 1993
Year 1994
Year 1995
Year 1996
Year 1997
Year 1998
Year 1999
Year 2000
Year 2001
Year 2002
Year 2003
Year 2004
Fig. 8.3 Adjusted mortality rate ratios, age 0 - 20, 1987-2004
175
The Butajira Rural Health Program (BRHP) is a DSS [Demographic Surveillance System] that has been in place
since 1987 and has accumulated over 700,000 person-years of surveillance data. It is located in the Southern
Nations, Nationalities and Peoples Region (SNNPR), some 130 km to the south of Addis Ababa. This district was
purposefully chosen as being potentially representative for a DSS in 1986, on the basis of being at least 100 km
from any major city, but not in a peripheral border region; combining a mixture of the highland and lowland
environments typical of Ethiopia; and containing a mixture of ethnic and religious groups. [6]
The results from Butajia show an erratic trend and don’t appear to be as plausible as those from
the DHS data. It is true, however, that Demographics Survey Sites (DSS) such as that in
Butagira do provide a longitudinal/cohort data, and serve as cheaper alternatives to a complete
vital registration.
Infant and under-five mortality (a subset of the population covered in Fig. 8.3) has also been declining. A
World Bank estimate puts the reduction at 21 percent in the five to nine years preceding its 2004 report
“…with a more pronounced reduction in the last decade.” [5].
Mortality Trends: Adult Mortality
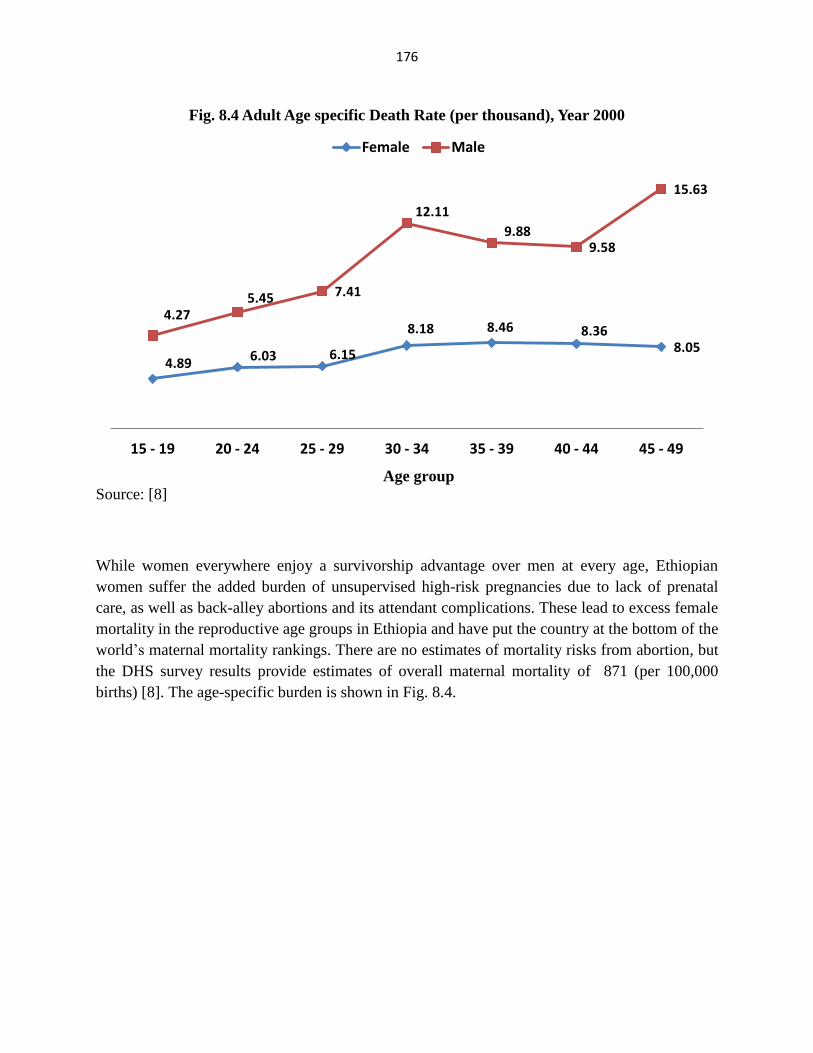
The year 2000 Demographic and Health Survey gave direct estimates of adult (age 15 and
above) mortality by asking siblings about the survival status of their brothers/ sisters. A total of
92,000 sibling reports were gathered, mostly from sisters. Using the response from surviving
siblings, “age-specific death rates [were] computed by dividing the number of deaths in each age
group by the total person-months of exposure in that age group during a specified reference
period.” [5]. A crude death rate of 8 per thousand and 6.7 per thousand were calculated for males
and females respectively. The age specific rates are shown in Figure 8.4. The female rates
appear less erratic than that of males but fail to show the expected rise with increasing age. More
investigation is called-for to account for the sudden rise in the male death rate in the 30 – 34 and
45 – 49 age groups. One might suspect excess HIV/AIDS deaths as a culprit, especially in the 30
-34 age group, but the lack of a similar surge in the female rate leads to the suspicion of data
errors, or other causes.
A recent HIV/AIDS study in the capital Addis Ababa used Life Table techniques and burial
records to arrive at HIV/AIDS estimates. [7]
Between 54.7 and 62.4% of adult deaths in Addis Ababa (age 20-64) are attributed to AIDS. The absolute
numbers of AIDS deaths for the year 2001 is estimated between 7,000 and 9,000. Estimates of the absolute
number of deaths are sensitive to under-reporting of burials and therefore on the conservative side. In terms of the
share of AIDS attributable mortality, women are worse affected than men. The absolute number of AIDS deaths
is higher for men than for women. [7]
176
Age group
Source: [8]
While women everywhere enjoy a survivorship advantage over men at every age, Ethiopian
women suffer the added burden of unsupervised high-risk pregnancies due to lack of prenatal
care, as well as back-alley abortions and its attendant complications. These lead to excess female
mortality in the reproductive age groups in Ethiopia and have put the country at the bottom of the
world’s maternal mortality rankings. There are no estimates of mortality risks from abortion, but
the DHS survey results provide estimates of overall maternal mortality of 871 (per 100,000
births) [8]. The age-specific burden is shown in Fig. 8.4.
4.89 6.03 6.15
8.18 8.46 8.36 8.05
4.27 5.45 7.41
12.11
9.88 9.58
15.63
15 - 19 20 - 24 25 - 29 30 - 34 35 - 39 40 - 44 45 - 49
Fig. 8.4 Adult Age specific Death Rate (per thousand), Year 2000
Female Male
177
Age group
Source: [8]
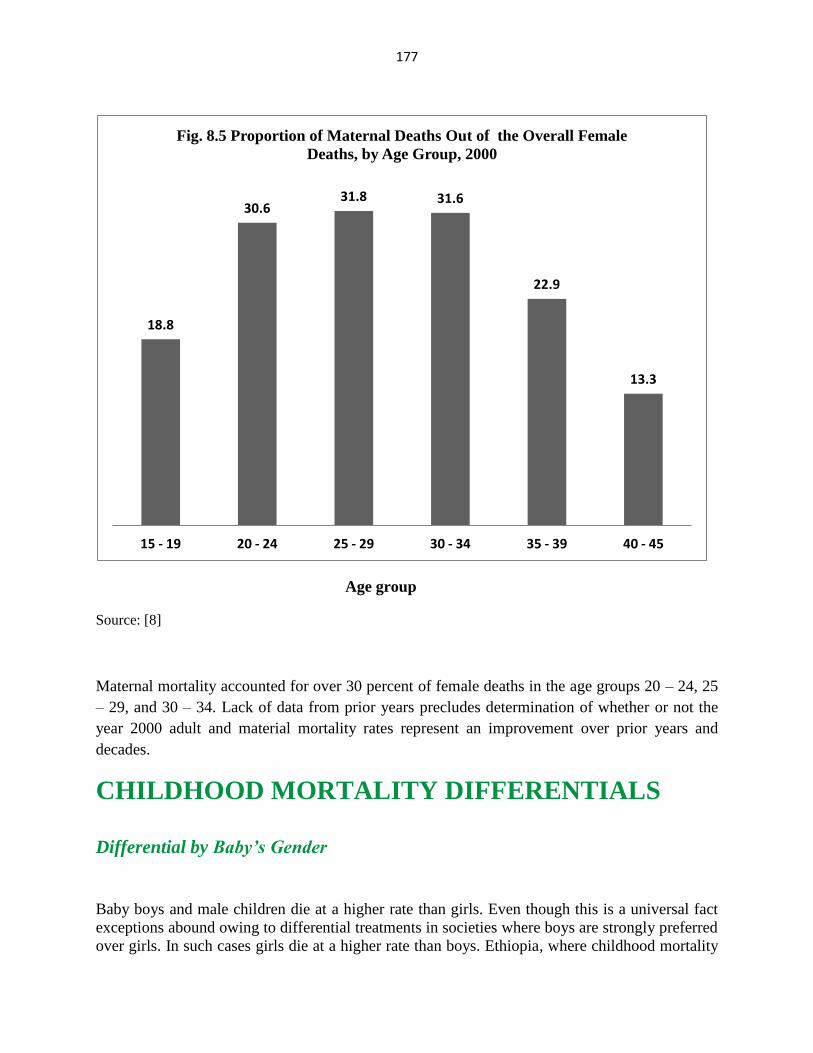
Maternal mortality accounted for over 30 percent of female deaths in the age groups 20 – 24, 25
– 29, and 30 – 34. Lack of data from prior years precludes determination of whether or not the
year 2000 adult and material mortality rates represent an improvement over prior years and
decades.
CHILDHOOD MORTALITY DIFFERENTIALS
Differential by Baby’s Gender
Baby boys and male children die at a higher rate than girls. Even though this is a universal fact
exceptions abound owing to differential treatments in societies where boys are strongly preferred
over girls. In such cases girls die at a higher rate than boys. Ethiopia, where childhood mortality
18.8
30.6 31.8 31.6
22.9
13.3
15 - 19 20 - 24 25 - 29 30 - 34 35 - 39 40 - 45
Fig. 8.5 Proportion of Maternal Deaths Out of the Overall Female
Deaths, by Age Group, 2000
178
is 4 percent higher among girls than boys is one such exception; an exception blamed on “…
differences in child rearing practices in Ethiopia, presumably in feeding practices and utilization of health
care services, that favor boys over girls”. [8]
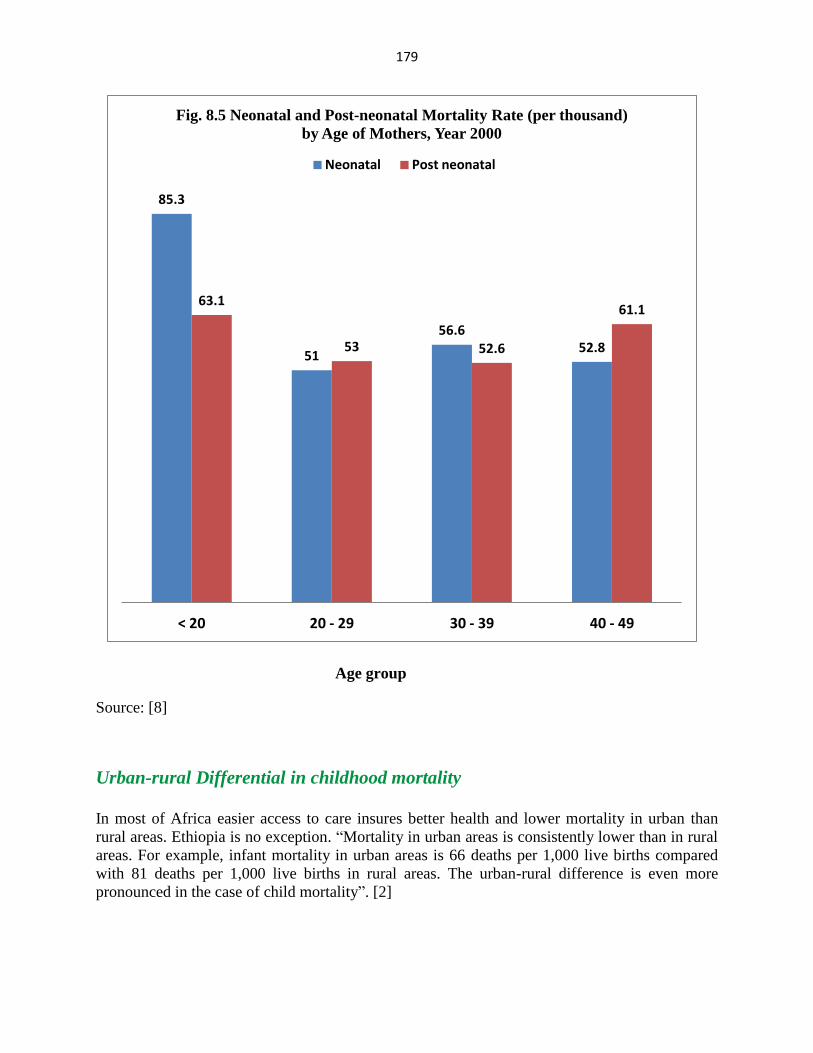
Differential by Maternal Age
Infant mortality has a classic U-shaped relationship with maternal age in which infant and under-
five mortality is “…relatively higher among children born to mothers under age 20 and over age
40 than among mothers in the middle age groups”. Infant mortality includes neonatal mortality
(mortality in the first month of life), and post-neonatal mortality (from week 5 to week 52). In
the developed world, more infants die in the first month of life than in the remaining 11 months
mainly due to congenital malformations. However, for all maternal age groups, this is not true,
in Ethiopia (Fig. 8.5).
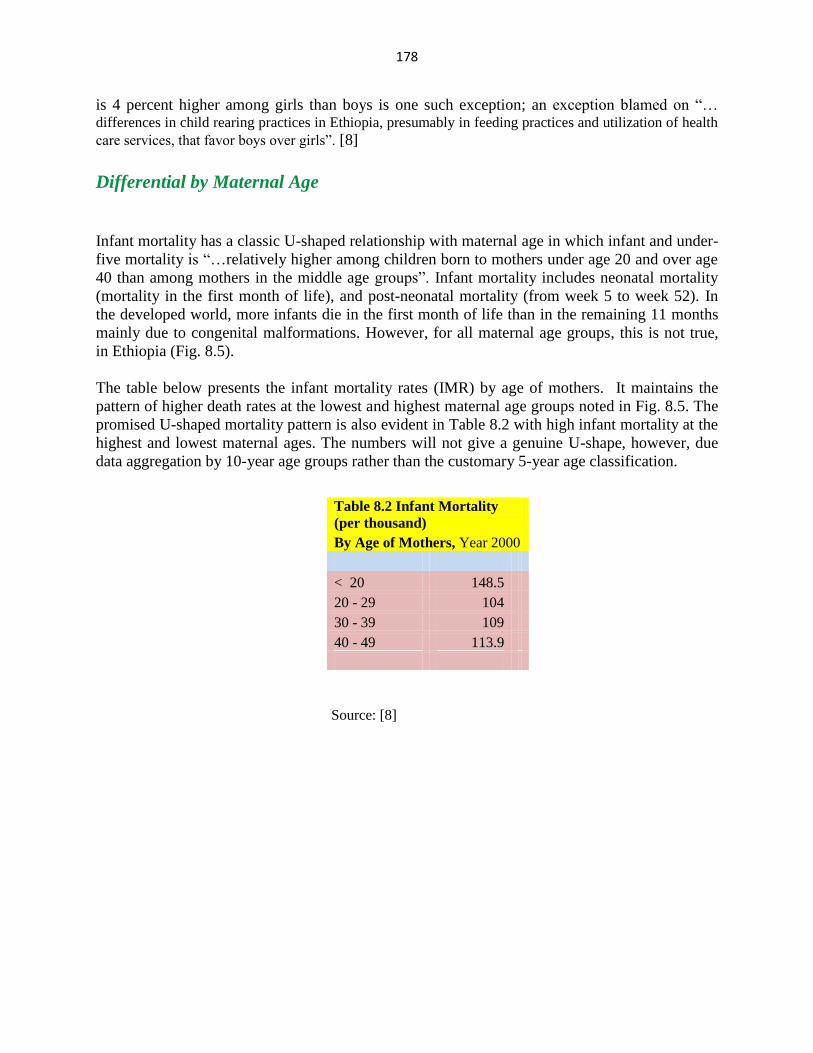
The table below presents the infant mortality rates (IMR) by age of mothers. It maintains the
pattern of higher death rates at the lowest and highest maternal age groups noted in Fig. 8.5. The
promised U-shaped mortality pattern is also evident in Table 8.2 with high infant mortality at the
highest and lowest maternal ages. The numbers will not give a genuine U-shape, however, due
data aggregation by 10-year age groups rather than the customary 5-year age classification.
Source: [8]
Table 8.2 Infant Mortality
(per thousand)
By Age of Mothers, Year 2000
< 20 148.5
20 - 29 104
30 - 39 109
40 - 49 113.9
179
Age group
Source: [8]
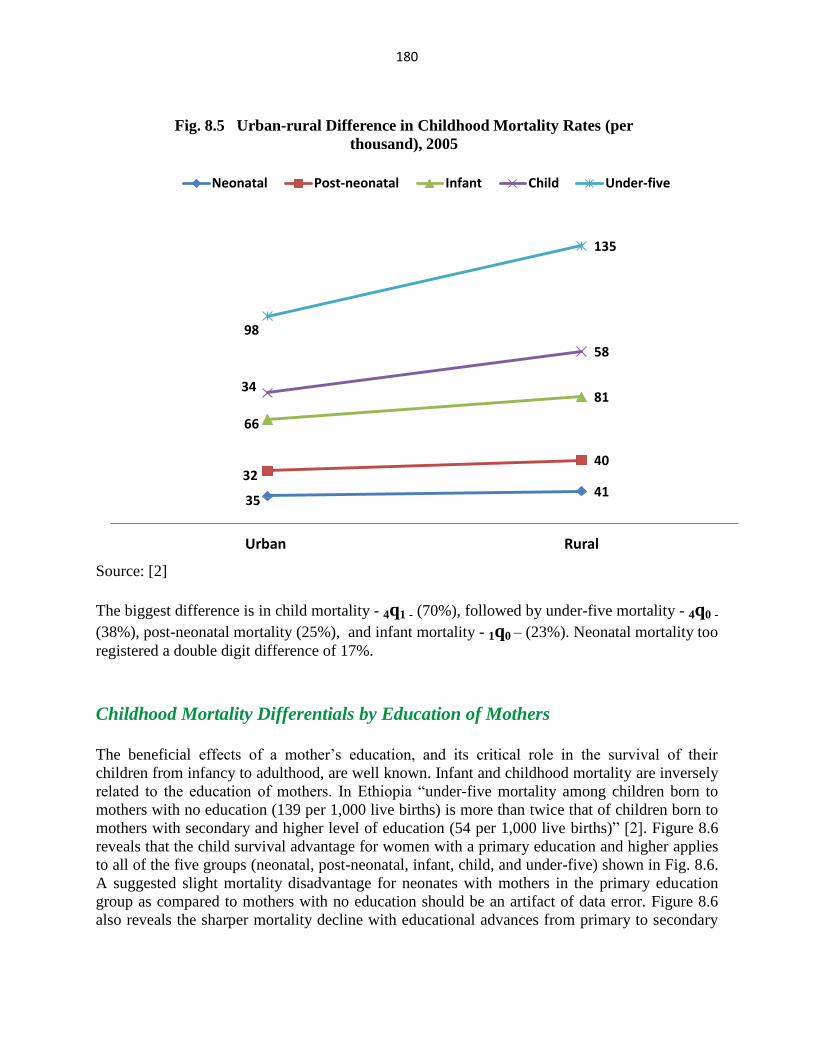
Urban-rural Differential in childhood mortality
In most of Africa easier access to care insures better health and lower mortality in urban than
rural areas. Ethiopia is no exception. “Mortality in urban areas is consistently lower than in rural
areas. For example, infant mortality in urban areas is 66 deaths per 1,000 live births compared
with 81 deaths per 1,000 live births in rural areas. The urban-rural difference is even more
pronounced in the case of child mortality”. [2]
85.3
51
56.6 52.8
63.1
53 52.6
61.1
< 20 20 - 29 30 - 39 40 - 49
Fig. 8.5 Neonatal and Post-neonatal Mortality Rate (per thousand)
by Age of Mothers, Year 2000
Neonatal Post neonatal
180
Source: [2]
The biggest difference is in child mortality - 4q1 - (70%), followed by under-five mortality - 4q0 -
(38%), post-neonatal mortality (25%), and infant mortality - 1q0 – (23%). Neonatal mortality too
registered a double digit difference of 17%.
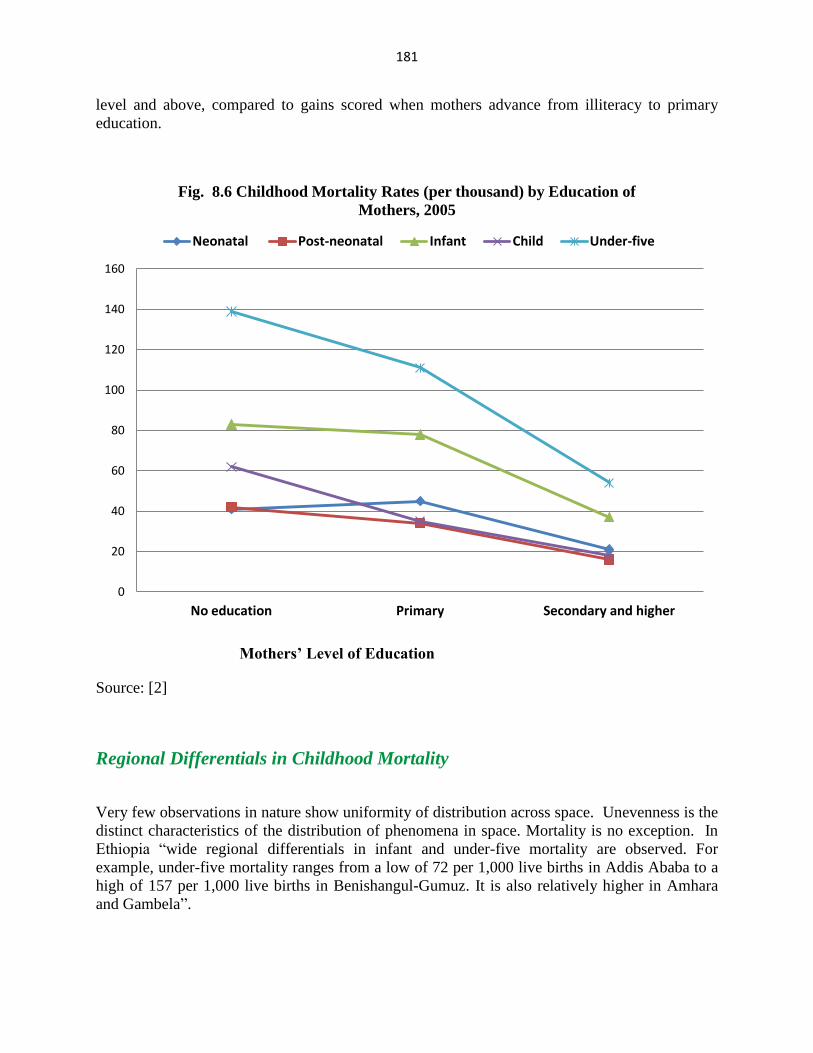
Childhood Mortality Differentials by Education of Mothers
The beneficial effects of a mother’s education, and its critical role in the survival of their
children from infancy to adulthood, are well known. Infant and childhood mortality are inversely
related to the education of mothers. In Ethiopia “under-five mortality among children born to
mothers with no education (139 per 1,000 live births) is more than twice that of children born to
mothers with secondary and higher level of education (54 per 1,000 live births)” [2]. Figure 8.6
reveals that the child survival advantage for women with a primary education and higher applies
to all of the five groups (neonatal, post-neonatal, infant, child, and under-five) shown in Fig. 8.6.
A suggested slight mortality disadvantage for neonates with mothers in the primary education
group as compared to mothers with no education should be an artifact of data error. Figure 8.6
also reveals the sharper mortality decline with educational advances from primary to secondary
35 41
32 40
66
81 34
58
98
135
Urban Rural
Fig. 8.5 Urban-rural Difference in Childhood Mortality Rates (per
thousand), 2005
Neonatal Post-neonatal Infant Child Under-five
181
level and above, compared to gains scored when mothers advance from illiteracy to primary
education.
Mothers’ Level of Education
Source: [2]
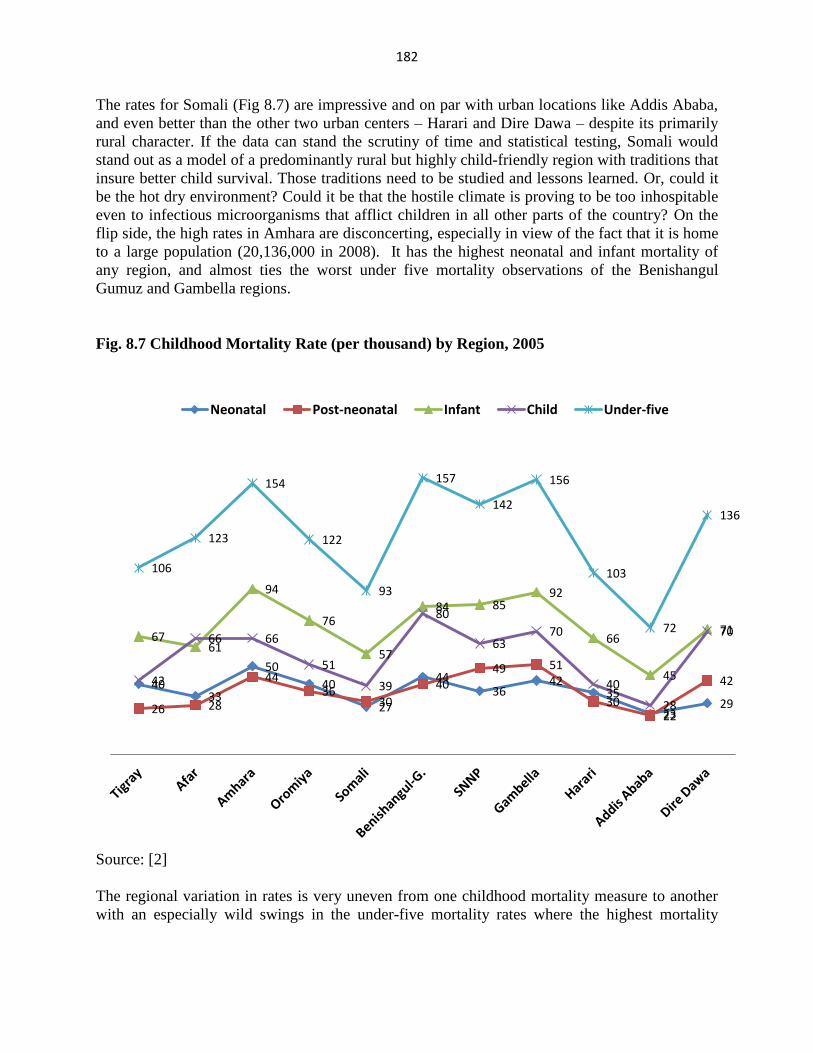
Regional Differentials in Childhood Mortality
Very few observations in nature show uniformity of distribution across space. Unevenness is the
distinct characteristics of the distribution of phenomena in space. Mortality is no exception. In
Ethiopia “wide regional differentials in infant and under-five mortality are observed. For
example, under-five mortality ranges from a low of 72 per 1,000 live births in Addis Ababa to a
high of 157 per 1,000 live births in Benishangul-Gumuz. It is also relatively higher in Amhara
and Gambela”.
0
20
40
60
80
100
120
140
160
No education Primary Secondary and higher
Fig. 8.6 Childhood Mortality Rates (per thousand) by Education of
Mothers, 2005
Neonatal Post-neonatal Infant Child Under-five
182
The rates for Somali (Fig 8.7) are impressive and on par with urban locations like Addis Ababa,
and even better than the other two urban centers – Harari and Dire Dawa – despite its primarily
rural character. If the data can stand the scrutiny of time and statistical testing, Somali would
stand out as a model of a predominantly rural but highly child-friendly region with traditions that
insure better child survival. Those traditions need to be studied and lessons learned. Or, could it
be the hot dry environment? Could it be that the hostile climate is proving to be too inhospitable
even to infectious microorganisms that afflict children in all other parts of the country? On the
flip side, the high rates in Amhara are disconcerting, especially in view of the fact that it is home
to a large population (20,136,000 in 2008). It has the highest neonatal and infant mortality of
any region, and almost ties the worst under five mortality observations of the Benishangul
Gumuz and Gambella regions.
Fig. 8.7 Childhood Mortality Rate (per thousand) by Region, 2005
Source: [2]
The regional variation in rates is very uneven from one childhood mortality measure to another
with an especially wild swings in the under-five mortality rates where the highest mortality
40 33
50
40
27
44 36
42 35
23 29 26 28
44 36
30
40 49 51
30 22
42
67 61
94
76
57
84 85 92
66
45
71
42
66 66
51
39
80
63 70
40
28
70
106
123
154
122
93
157
142
156
103
72
136
Neonatal Post-neonatal Infant Child Under-five
183
region – Gambella – has a rate more than twice as high as that of the lowest mortality region –
Addis Ababa.
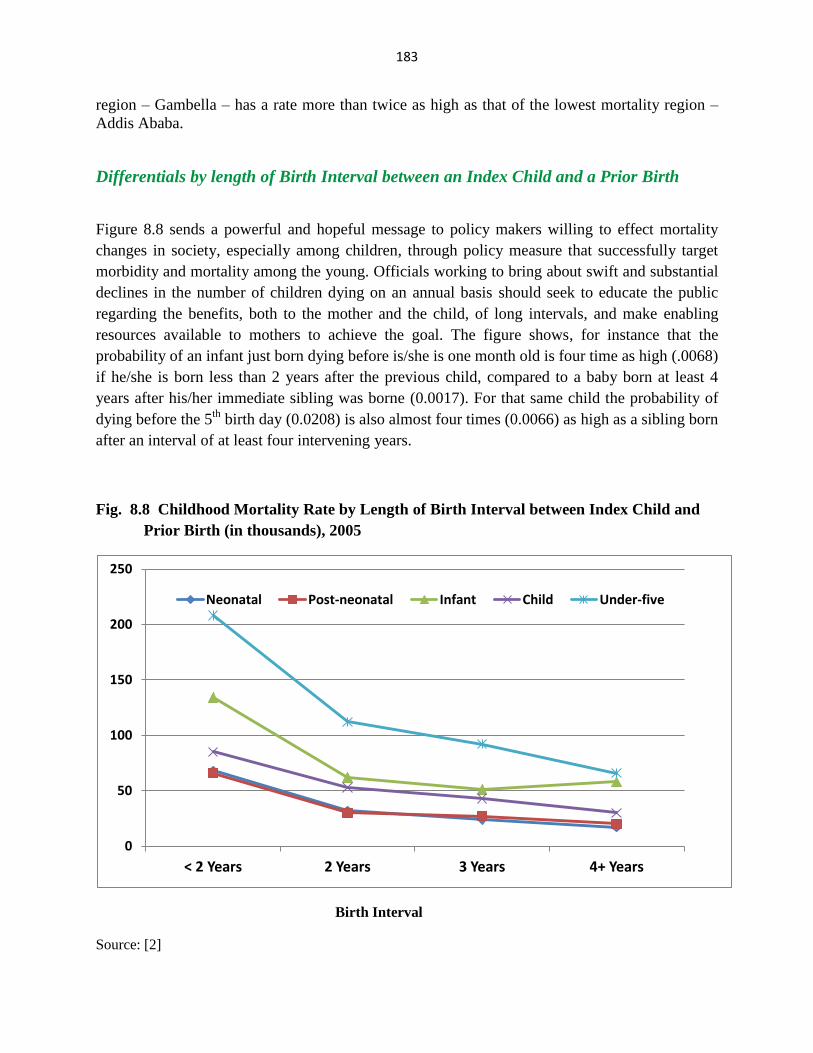
Differentials by length of Birth Interval between an Index Child and a Prior Birth
Figure 8.8 sends a powerful and hopeful message to policy makers willing to effect mortality
changes in society, especially among children, through policy measure that successfully target
morbidity and mortality among the young. Officials working to bring about swift and substantial
declines in the number of children dying on an annual basis should seek to educate the public
regarding the benefits, both to the mother and the child, of long intervals, and make enabling
resources available to mothers to achieve the goal. The figure shows, for instance that the
probability of an infant just born dying before is/she is one month old is four time as high (.0068)
if he/she is born less than 2 years after the previous child, compared to a baby born at least 4
years after his/her immediate sibling was borne (0.0017). For that same child the probability of
dying before the 5th
birth day (0.0208) is also almost four times (0.0066) as high as a sibling born
after an interval of at least four intervening years.
Fig. 8.8 Childhood Mortality Rate by Length of Birth Interval between Index Child and
Prior Birth (in thousands), 2005
Birth Interval
Source: [2]
0
50
100
150
200
250
< 2 Years 2 Years 3 Years 4+ Years
Neonatal Post-neonatal Infant Child Under-five
184
References:
1. Millennium Development Goals Report: Challenges and Prospects for Ethiopia. Ministry of
Finance and Economic Development (MOFED) of the Federal Democratic Republic of Ethiopia
and the United Nations Country Team, March 2004. Addis Ababa.
2. Ethiopia Demographic and Health Survey 2005 Central Statistical Agency, Addis Ababa,
Ethiopia , RC Macro, Calverton, Maryland, USA, September 2006
3. http://allafrica.com/stories/200801221379.html
4. Ethiopia. A Country Status Report on Health and Poverty. June 2004. The World Bank,
Africa Region Human Development & Ministry of Health Ethiopia
5. http://siteresources.worldbank.org/INTHNPMDGS/Resources/563114-1112109151438/892594-
1113404879158/Ethiopia.pdf
6. Peter Byass et. al. DSS and DHS: longitudinal and cross-sectional viewpoints on child and
adolescent mortality in Ethiopia, Population Health Metrics 2007, 5:12 7. Georges Reniers et. al. Life table estimates of adult HIV/AIDS mortality in Addis
Ababa. Ethiopian Journal of Health Development. Vol. 20 No 1. 2006
8. Ethiopia Demographic and Health Survey 2000 Central Statistical Agency, Addis Ababa,
Ethiopia , RC Macro, Calverton, Maryland, USA, September 2001