Embed Size (px)
Citation preview
Lesson 5 : Medical Nutrition Therapy

Types of DM
Type 1(5-10%) Type 2 (90-95%) Gestational “Other Specific Types” from
specific genetic syndromes surgery drugs Malnutrition (old term) infections other illnesses
Impaired glucose tolerance (pre-diabetes)
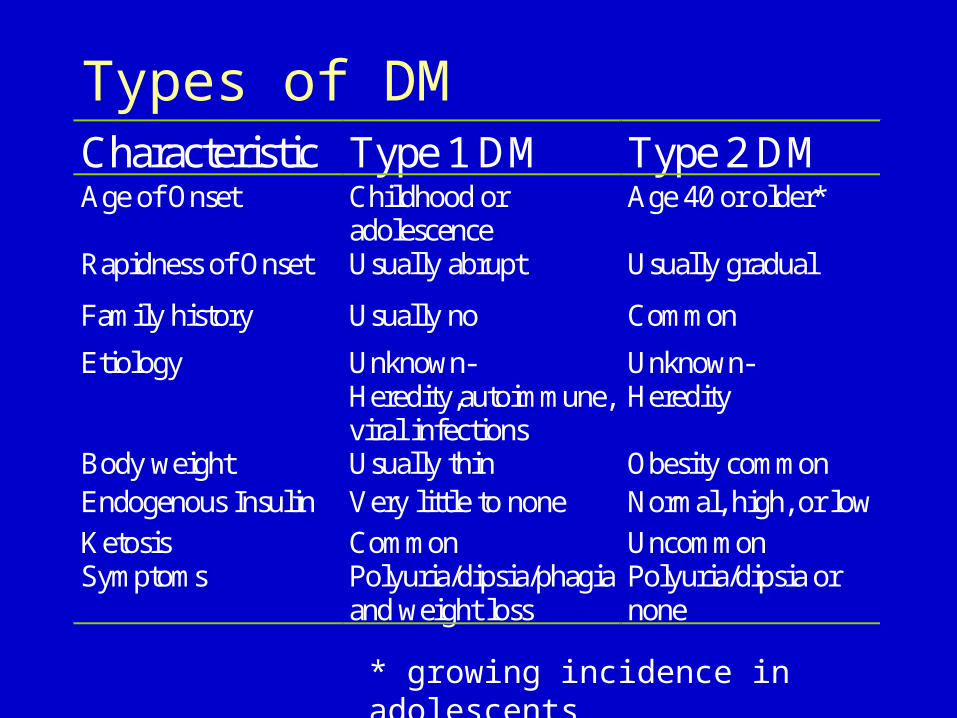
Types of DMCharacteristic Type 1 DM Type 2 DM Age of Onset Childhood or
adolescence Age 40 or older*
Rapidness of Onset Usually abrupt Usually gradual
Family history Usually no Common
Etiology Unknown- Heredity,autoimmune, viral infections
Unknown- Heredity
Body weight Usually thin Obesity common Endogenous Insulin Very little to none Normal, high, or low
Ketosis Common Uncommon Symptoms Polyuria/dipsia/phagia
and weight loss Polyuria/dipsia or none
* growing incidence in adolescents
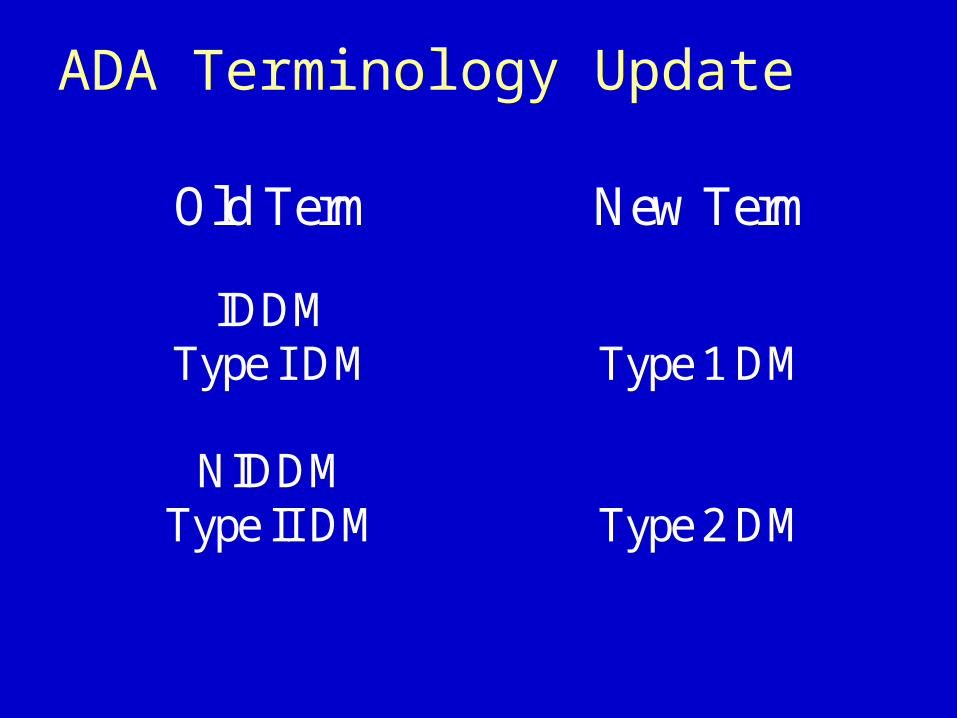
ADA Terminology Update
Old Term New Term
IDDMType I DM Type 1 DM
NIDDMType II DM Type 2 DM
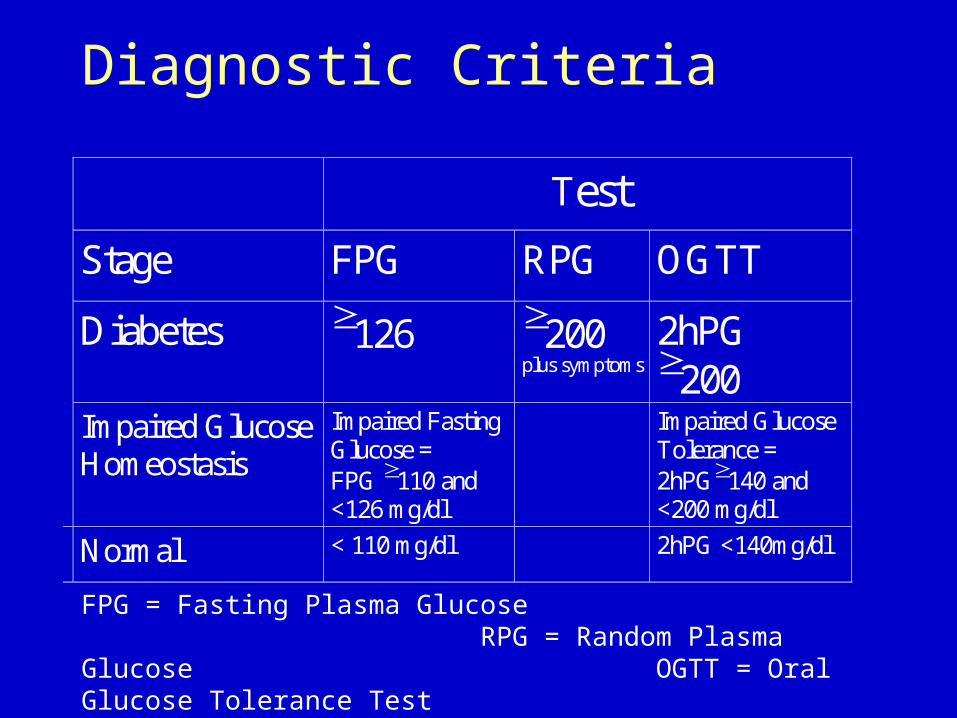
Diagnostic Criteria
Test
Stage FPG RPG OGTT
Diabetes 126 200 plus symptoms
2hPG 200
Impaired Glucose Homeostasis
Impaired Fasting Glucose = FPG 110 and <126 mg/dl
Impaired Glucose Tolerance = 2hPG140 and <200 mg/dl
Normal < 110 mg/dl 2hPG <140mg/dl
FPG = Fasting Plasma Glucose RPG = Random Plasma Glucose OGTT = Oral Glucose Tolerance Test
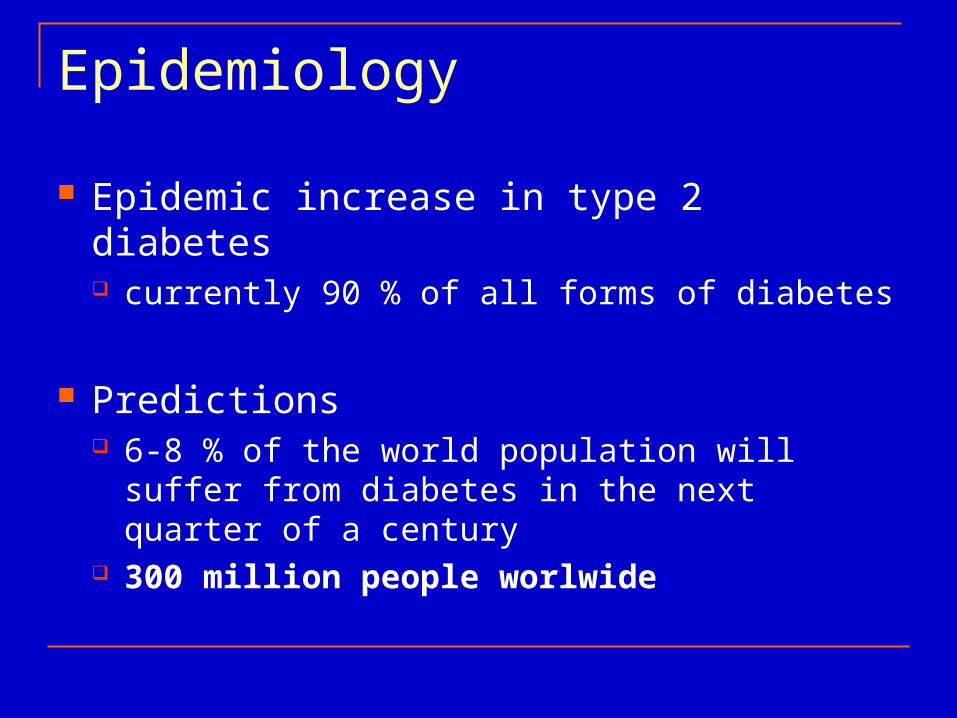
Epidemiology
Epidemic increase in type 2 diabetes currently 90 % of all forms of diabetes
Predictions 6-8 % of the world population will suffer from
diabetes in the next quarter of a century 300 million people worlwide
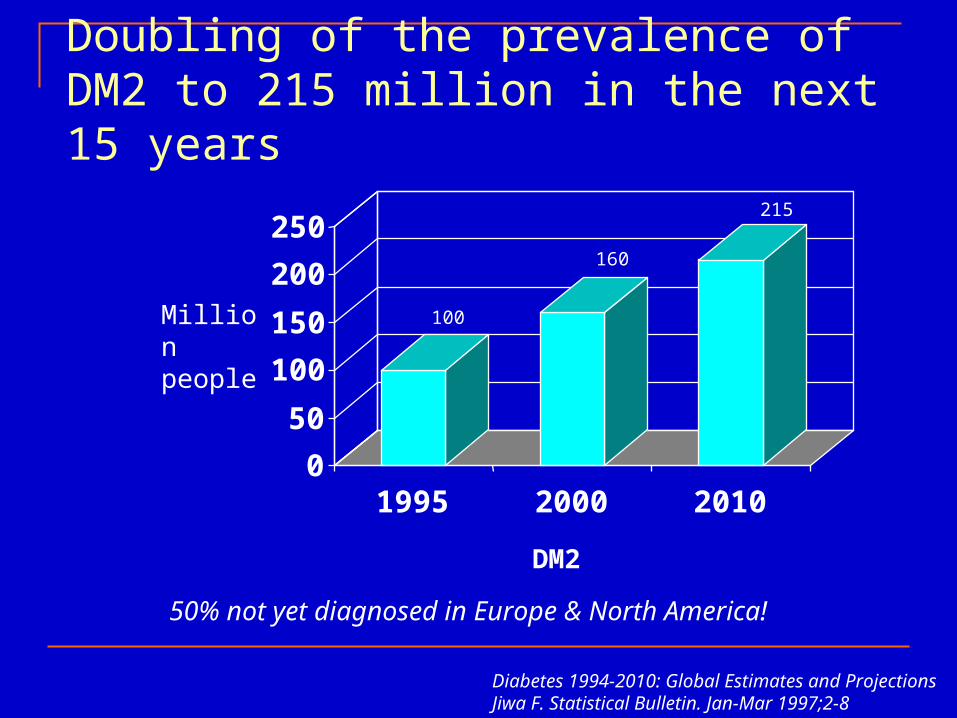
Doubling of the prevalence of DM2 to 215 million in the next 15 years
50% not yet diagnosed in Europe & North America!
Diabetes 1994-2010: Global Estimates and ProjectionsJiwa F. Statistical Bulletin. Jan-Mar 1997;2-8
0
50
100
150
200
250
1995 2000 2010
DM2
Million people
100
160
215
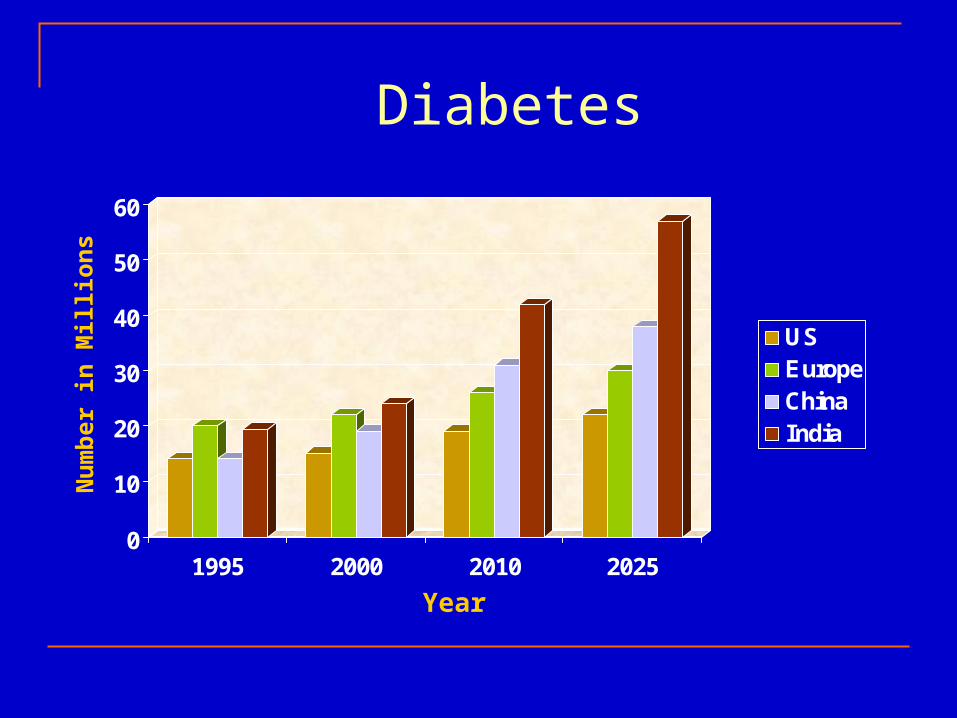
Diabetes
0
10
20
30
40
50
60
1995 2000 2010 2025
USEuropeChinaIndia
Year
Nu
mb
er i
n M
illi
on
s
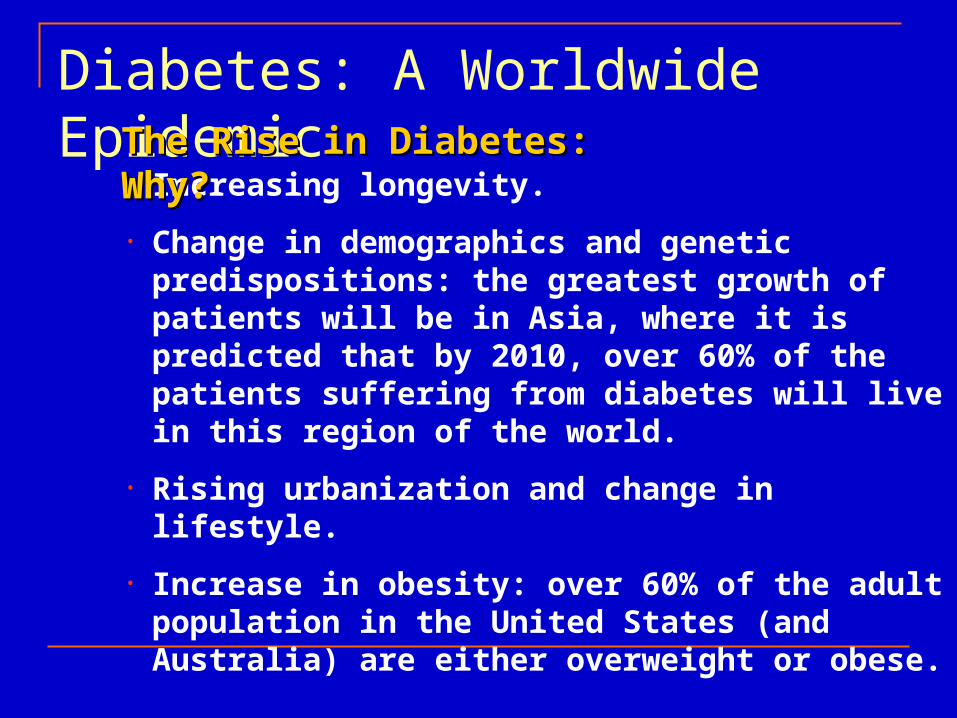
Diabetes: A Worldwide Epidemic
• Increasing longevity.
• Change in demographics and genetic predispositions: the greatest growth of patients will be in Asia, where it is predicted that by 2010, over 60% of the patients suffering from diabetes will live in this region of the world.
• Rising urbanization and change in lifestyle.
• Increase in obesity: over 60% of the adult population in the United States (and Australia) are either overweight or obese.
The Rise in Diabetes: Why?The Rise in Diabetes: Why?
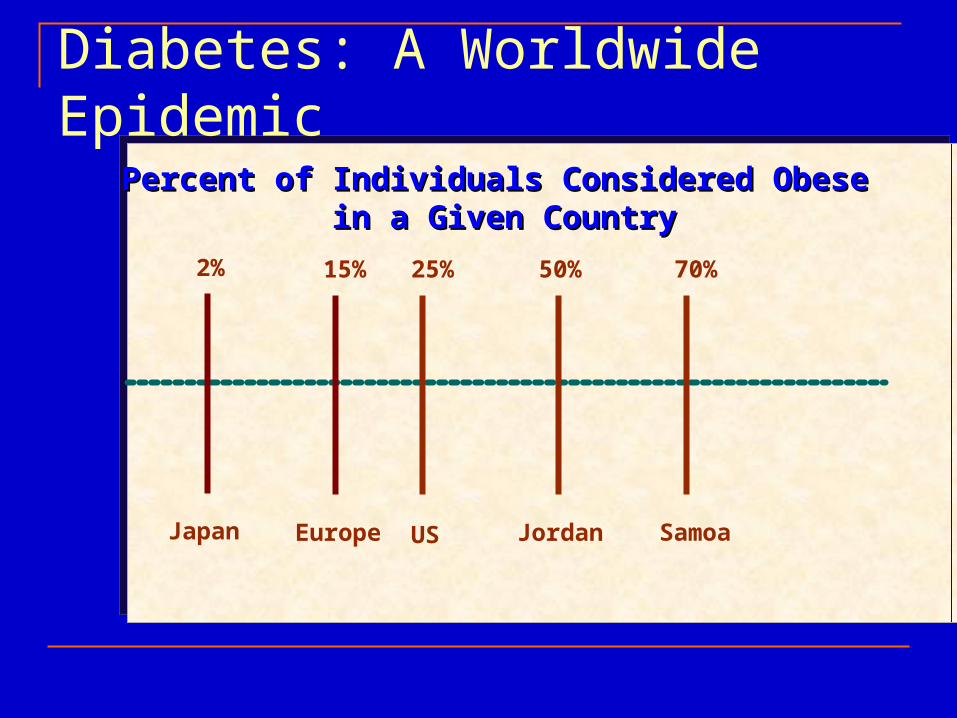
Diabetes: A Worldwide Epidemic
US
25% 70%
Samoa
Percent of Individuals Considered ObesePercent of Individuals Considered Obese in a Given Countryin a Given Country
15%
Europe Jordan
50%2%
Japan
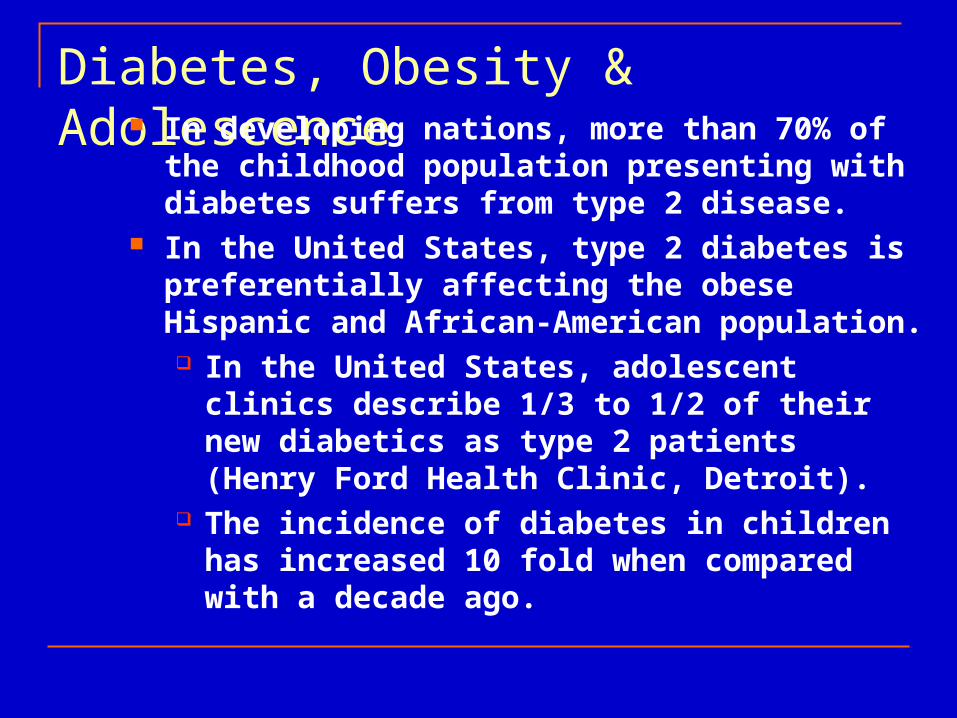
Diabetes, Obesity & Adolescence In developing nations, more than 70% of the
childhood population presenting with diabetes suffers from type 2 disease.
In the United States, type 2 diabetes is preferentially affecting the obese Hispanic and African-American population. In the United States, adolescent clinics
describe 1/3 to 1/2 of their new diabetics as type 2 patients (Henry Ford Health Clinic, Detroit).
The incidence of diabetes in children has increased 10 fold when compared with a decade ago.
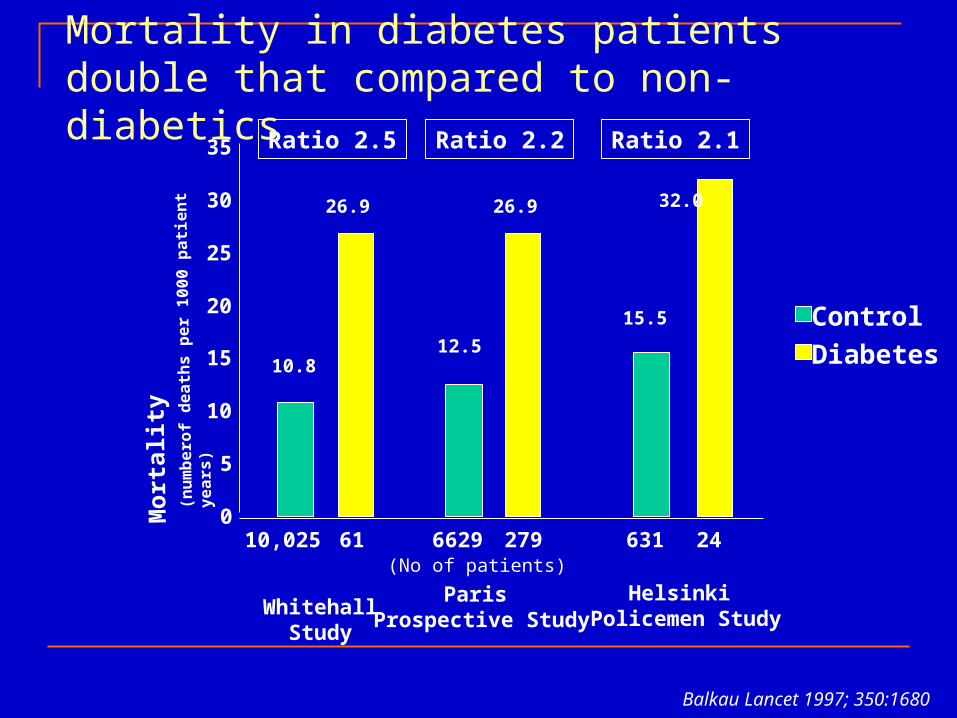
Mortality in diabetes patients double that compared to non-diabetics
Balkau Lancet 1997; 350:1680
WhitehallStudy
0
5
10
15
20
25
30
35
Control
Diabetes
10,025 61 6629 279 631 24(No of patients)
Ratio 2.5 Ratio 2.2 Ratio 2.1
10.8
26.9
12.5
26.9
15.5
32.0
Mo
rtal
ity
Paris Prospective Study
Helsinki Policemen Study
(nu
mb
ero
f d
eat
hs
pe
r 1
00
0 p
ati
en
t y
ea
rs)
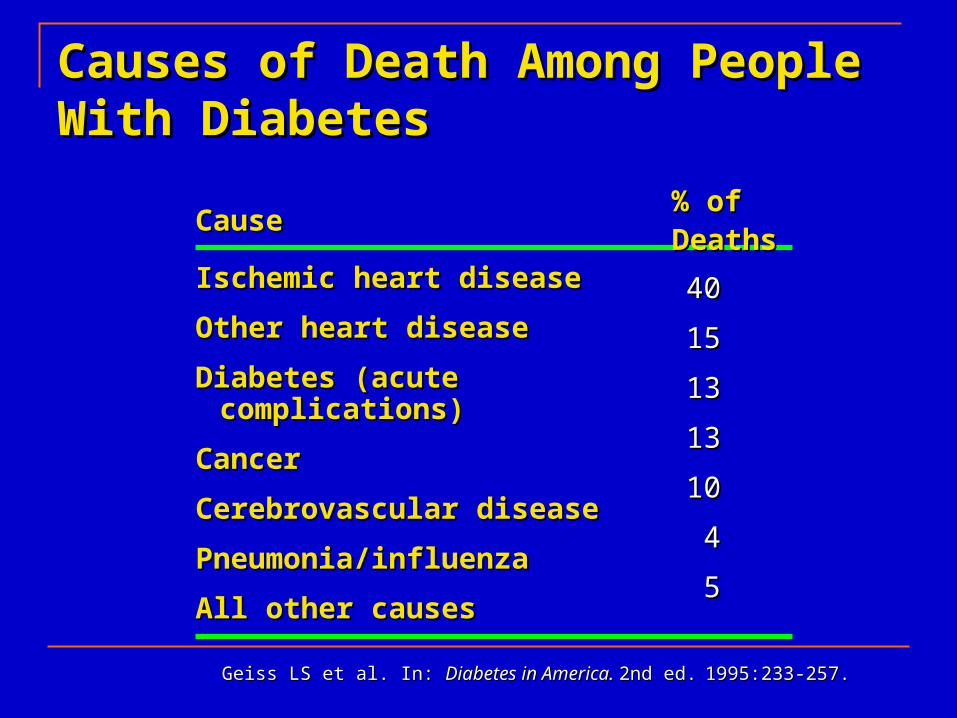
Causes of Death Among People With Causes of Death Among People With DiabetesDiabetes
Ischemic heart diseaseIschemic heart disease
Other heart diseaseOther heart disease
Diabetes (acute complications)Diabetes (acute complications)
CancerCancer
Cerebrovascular diseaseCerebrovascular disease
Pneumonia/influenzaPneumonia/influenza
All other causesAll other causes
CauseCause % of Deaths% of Deaths
Geiss LS et al. In: Geiss LS et al. In: Diabetes in America. Diabetes in America. 2nd ed.2nd ed. 1995:233-257.1995:233-257.
4040
1515
1313
1313
1010
44
55
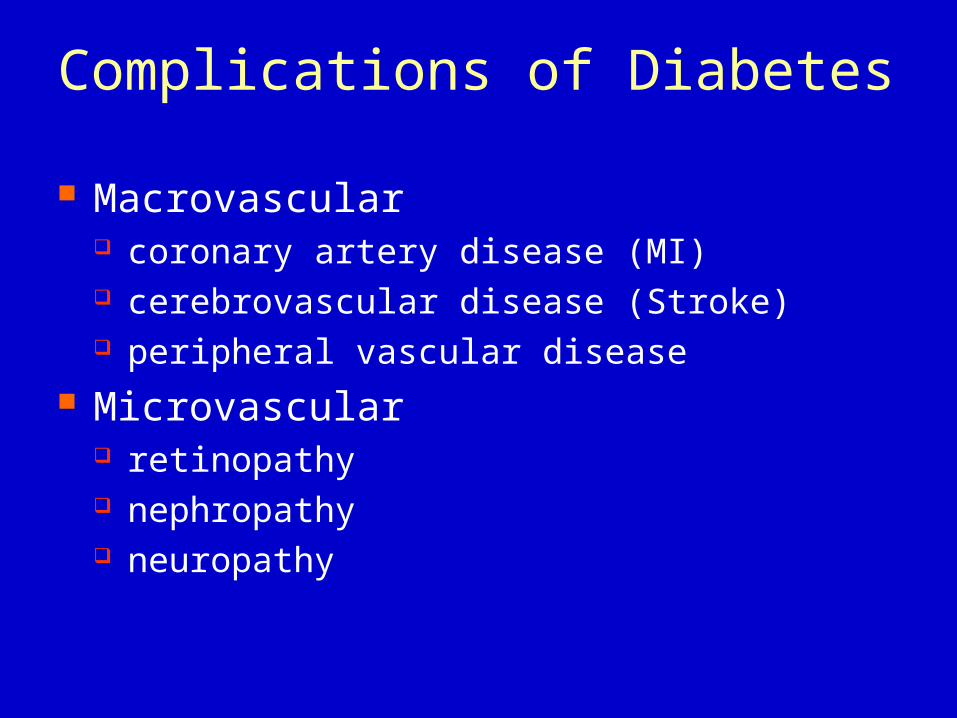
Complications of Diabetes
Macrovascular coronary artery disease (MI) cerebrovascular disease (Stroke) peripheral vascular disease
Microvascular retinopathy nephropathy neuropathy
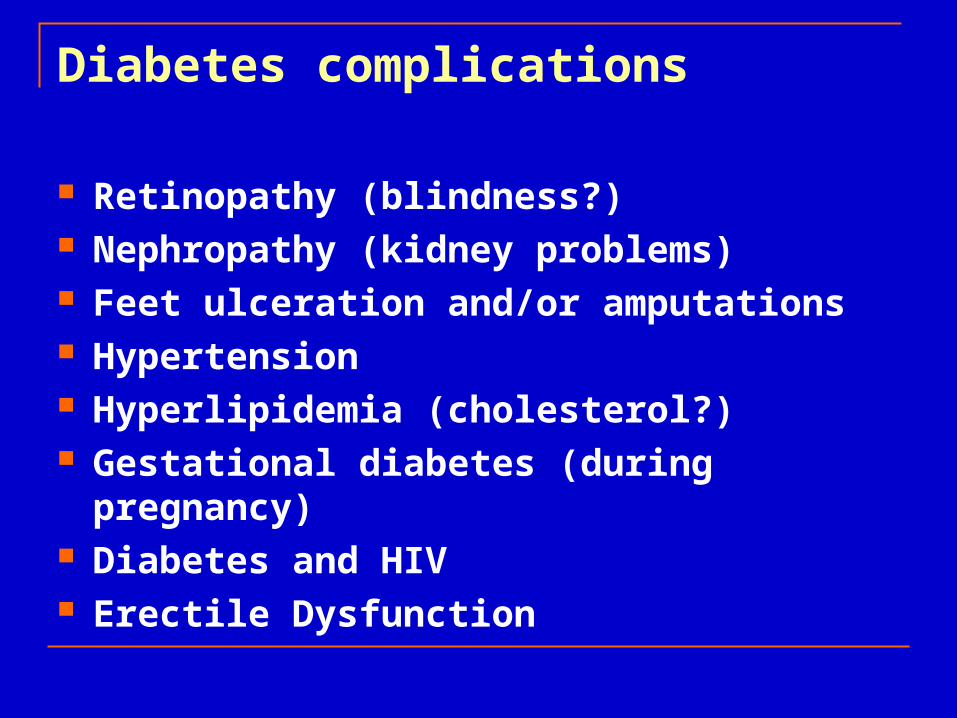
Diabetes complications
Retinopathy (blindness?) Nephropathy (kidney problems) Feet ulceration and/or amputations Hypertension Hyperlipidemia (cholesterol?) Gestational diabetes (during pregnancy) Diabetes and HIV Erectile Dysfunction
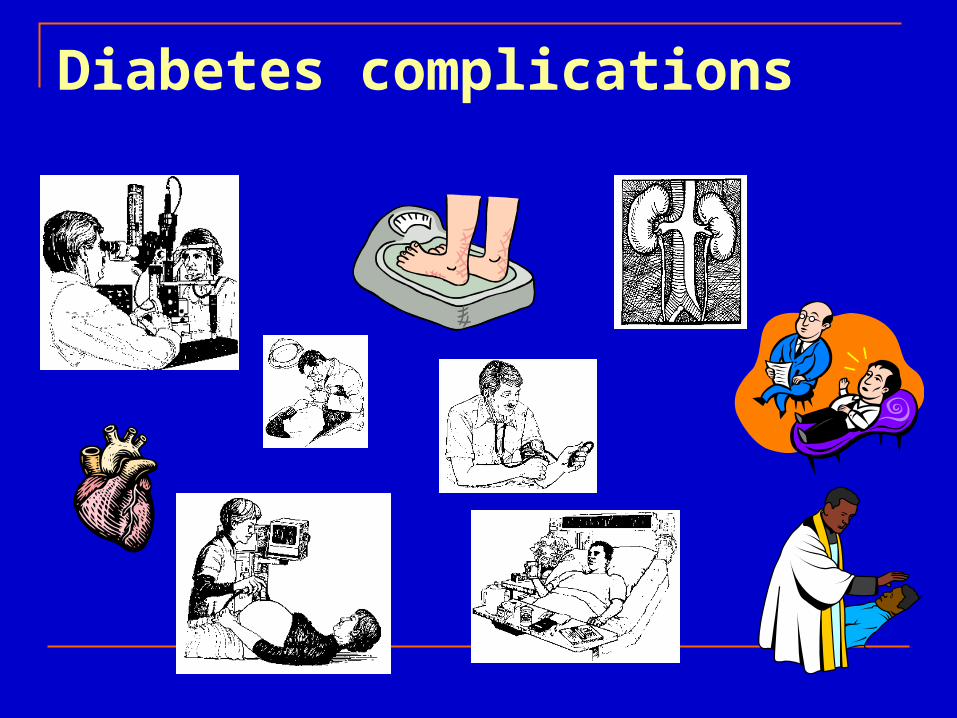
Diabetes complications
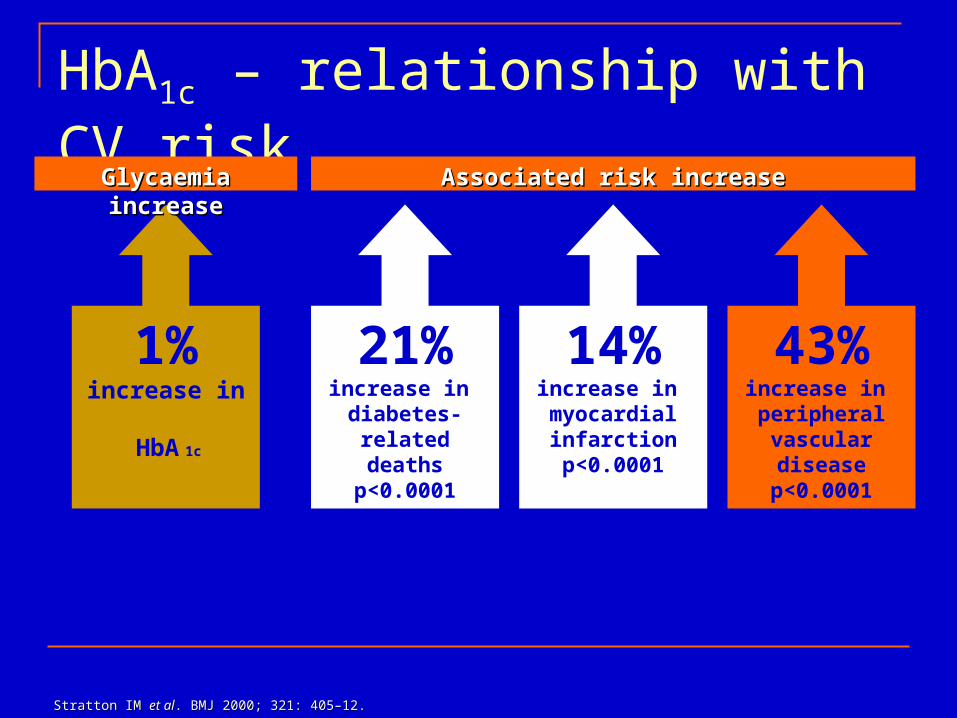
1%increase in
HbA 1c
21%increase in
diabetes-related deaths
p<0.0001
14%increase in myocardial infarctionp<0.0001
43%increase in peripheral vascular disease
p<0.0001
HbA1c – relationship with CV riskGlycaemia increaseGlycaemia increase Associated risk increaseAssociated risk increase
Stratton IM Stratton IM et alet al. BMJ 2000; 321: 405. BMJ 2000; 321: 405––12.12.
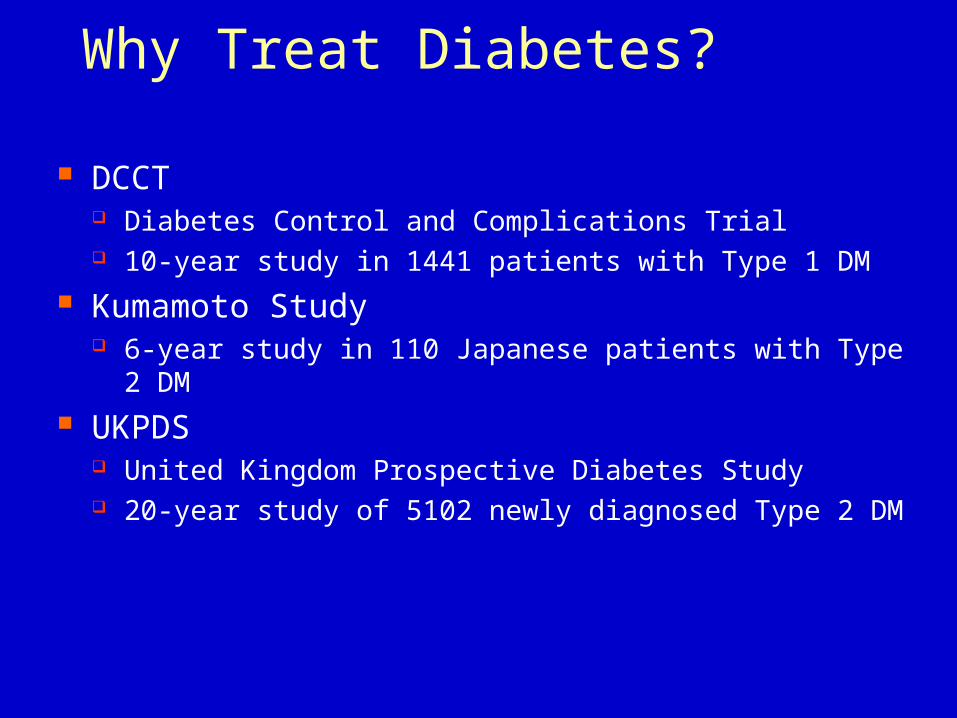
Why Treat Diabetes?
DCCT Diabetes Control and Complications Trial 10-year study in 1441 patients with Type 1 DM
Kumamoto Study 6-year study in 110 Japanese patients with Type 2 DM
UKPDS United Kingdom Prospective Diabetes Study 20-year study of 5102 newly diagnosed Type 2 DM
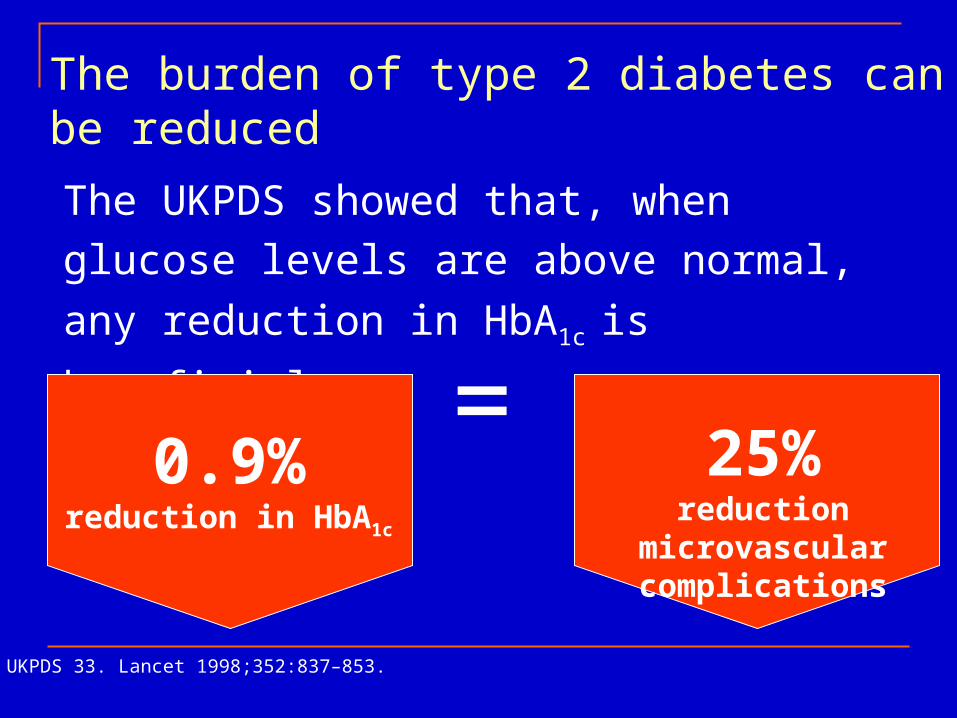
The burden of type 2 diabetes can be reduced
UKPDS 33. Lancet 1998;352:837–853.
The UKPDS showed that, when glucose levels
are above normal, any reduction in HbA1c is
beneficial
=0.9%
reduction in HbA1c
25%reduction microvascular
complications
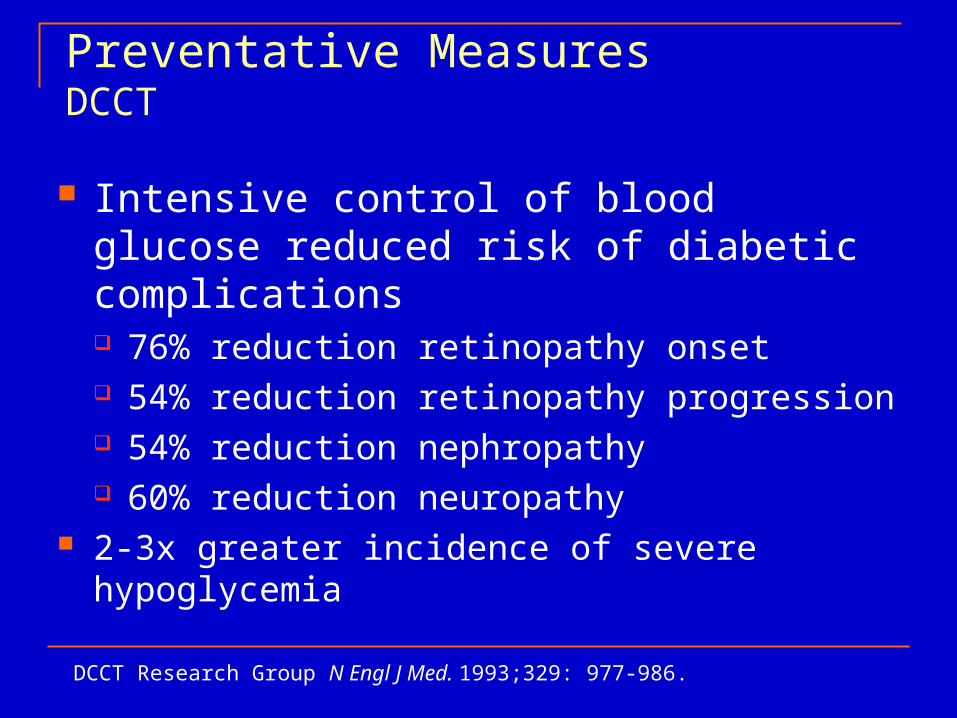
Preventative MeasuresDCCT
Intensive control of blood glucose reduced risk of diabetic complications 76% reduction retinopathy onset 54% reduction retinopathy progression 54% reduction nephropathy 60% reduction neuropathy
2-3x greater incidence of severe hypoglycemia
DCCT Research Group N Engl J Med. 1993;329: 977-986.
American Diabetes Association. Diabetes Care. 1999;22(suppl 1):S27-S31. UKPDS Group. Lancet. 1998;352:854-865.
UKPDS Group. BMJ. 1998;317:703-713.Nathan D. Lancet. 1998;352:832-833.
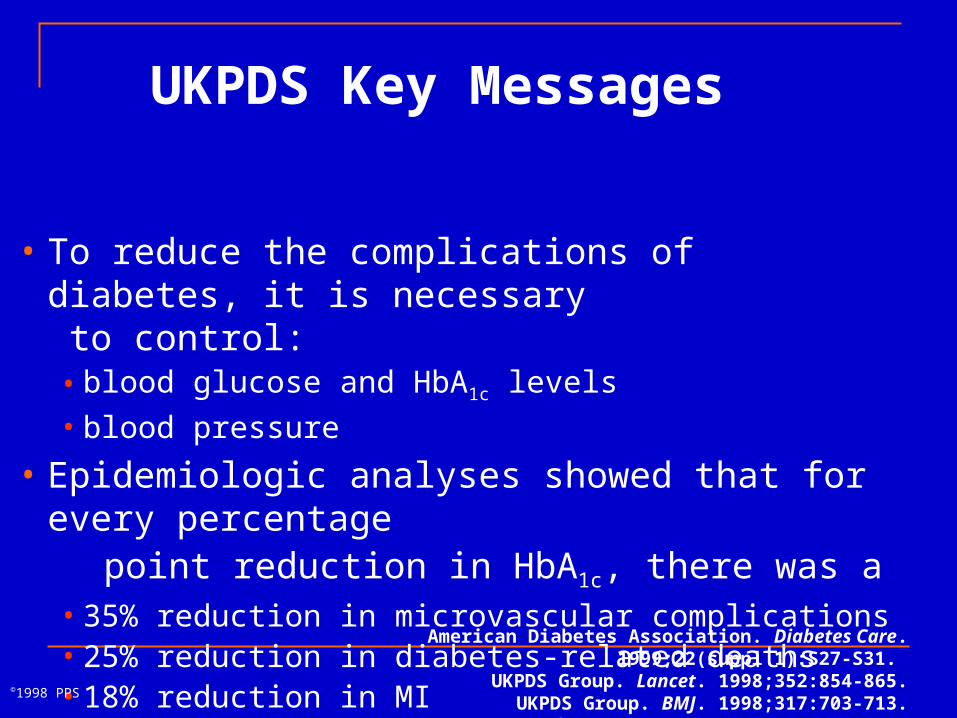
UKPDS Key Messages
• To reduce the complications of diabetes, it is necessary to control:• blood glucose and HbA1c levels
• blood pressure
• Epidemiologic analyses showed that for every percentage point reduction in HbA1c, there was a
• 35% reduction in microvascular complications• 25% reduction in diabetes-related deaths• 18% reduction in MI
©1998 PPS
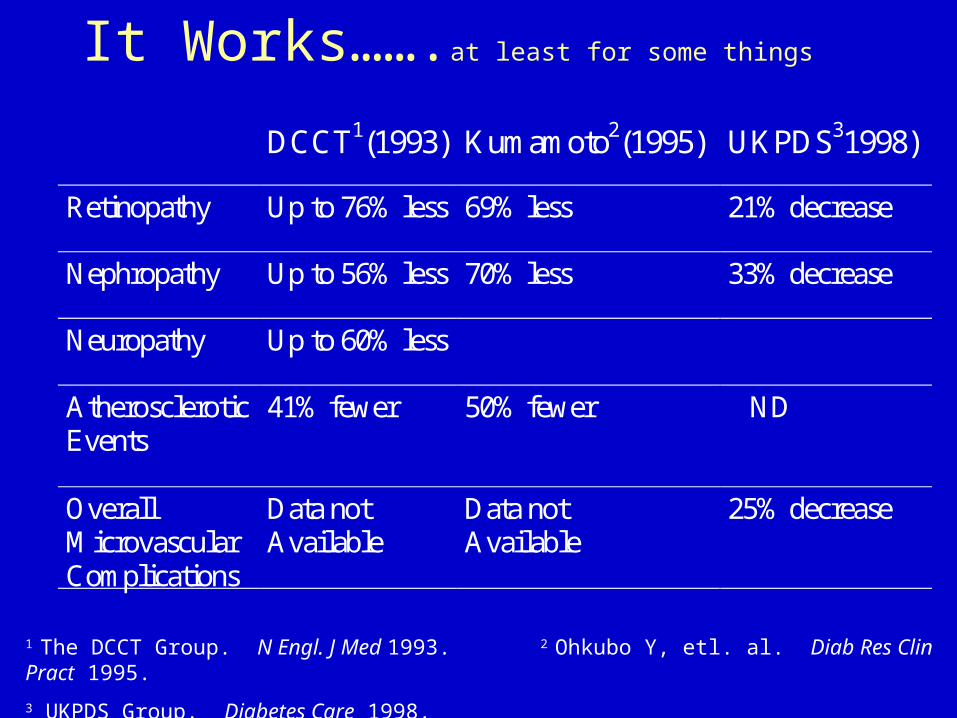
It Works…….at least for some things
DCCT1(1993) Kumamoto2(1995) UKPDS31998)
Retinopathy Up to 76% less 69% less 21% decrease
Nephropathy Up to 56% less 70% less 33% decrease
Neuropathy Up to 60% less
Atherosclerotic Events
41% fewer 50% fewer ND
Overall Microvascular Complications
Data not Available
Data not Available
25% decrease
1 The DCCT Group. N Engl. J Med 1993. 2 Ohkubo Y, etl. al. Diab Res Clin Pract 1995.
3 UKPDS Group. Diabetes Care 1998.
Goals of Treatment
Alleviate symptoms Prevent complications Prevent progression of current
complications Improve quality of life
Alleviate symptoms Prevent complications Prevent progression of current
complications Improve quality of life
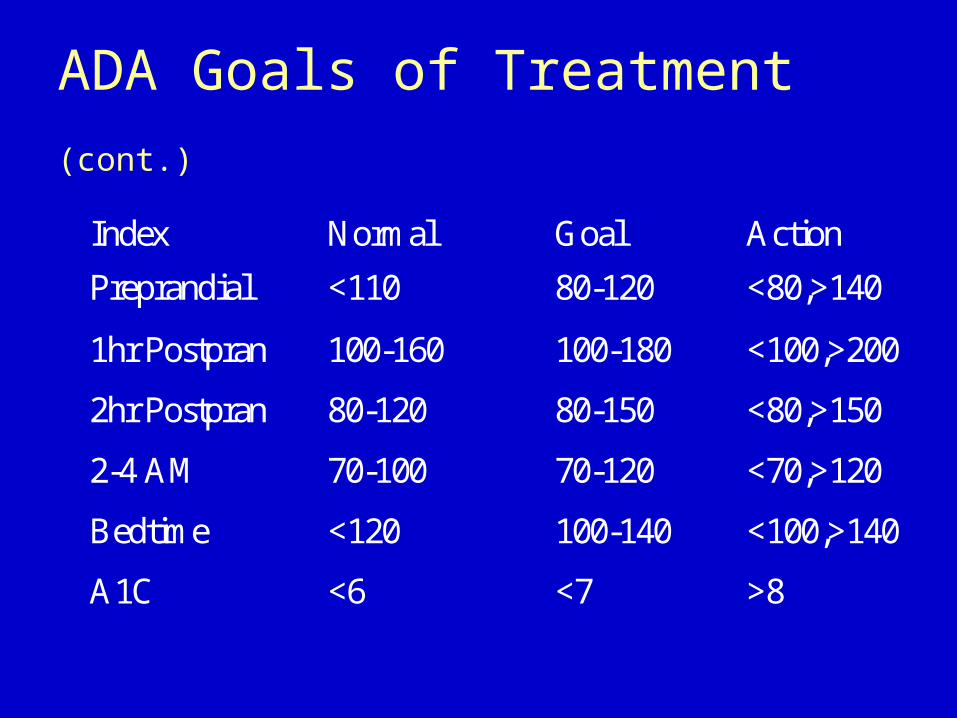
ADA Goals of Treatment (cont.)
Index Normal Goal Action
Preprandial <110 80-120 <80,>140
1hr Postpran 100-160 100-180 <100,>200
2hr Postpran 80-120 80-150 <80,>150
2-4 AM 70-100 70-120 <70,>120
Bedtime <120 100-140 <100,>140
A1C <6 <7 >8
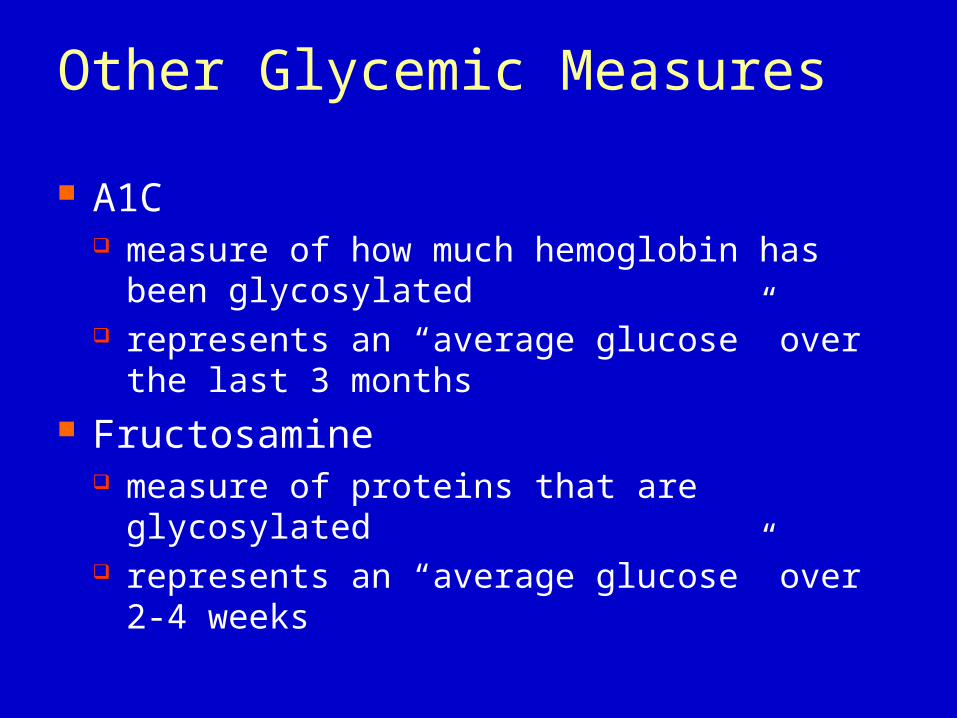
Other Glycemic Measures
A1C measure of how much hemoglobin has been
glycosylated represents an “average glucose” over the last 3
months Fructosamine
measure of proteins that are glycosylated represents an “average glucose” over 2-4 weeks
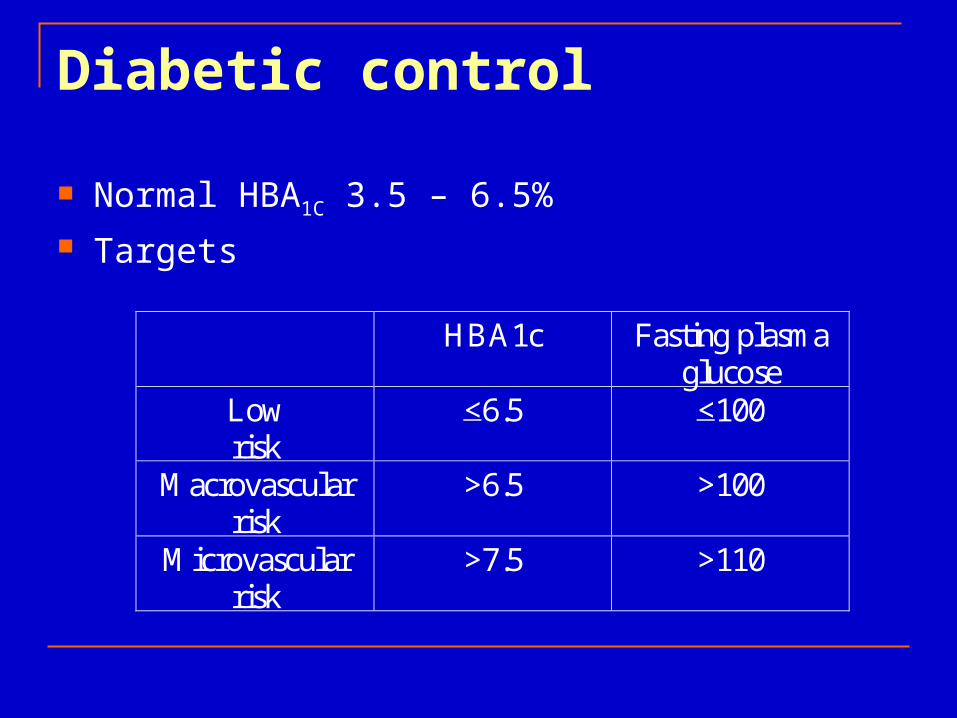
Diabetic control
Normal HBA1C 3.5 – 6.5% Targets
HBA1c Fasting plasma glucose
Low risk
<6.5 <100
Macrovascular risk
>6.5 >100
Microvascular risk
>7.5 >110
Collaborative Management
Nutritional Therapy Activity Monitoring of Blood Glucose Medication - Insulin or Oral Agents Education
Nutritional Therapy
Cornerstone of care for Diabetic No one “diabetic” or “ADA” diet Use individualized approach Consider financial status and cultural and
ethnic influences Priority placed on amount of CHO, not source
of the CHO
Nutrition
Nutrition Therapy – The Most Fundamental Component of the Diabetes Treatment Plan
Goals: Near Normal Glucose Levels Normal Blood Pressure Normal Serum Lipid Levels Reasonable Body Weight Promotion of Overall Health
Nutrition TherapyDiet Teaching Goal - independence; effective self-
management. Include Family. Follow prescribed plan; accurate portions Never skip meals Concern - Alcohol Concern - Dietetic Foods
Nutrient Components
Protein* Fat* CHO* Sucrose and Fructose Nutritive Sweeteners Fat Replacements* Vitamins and Minerals Alcohol Intake*
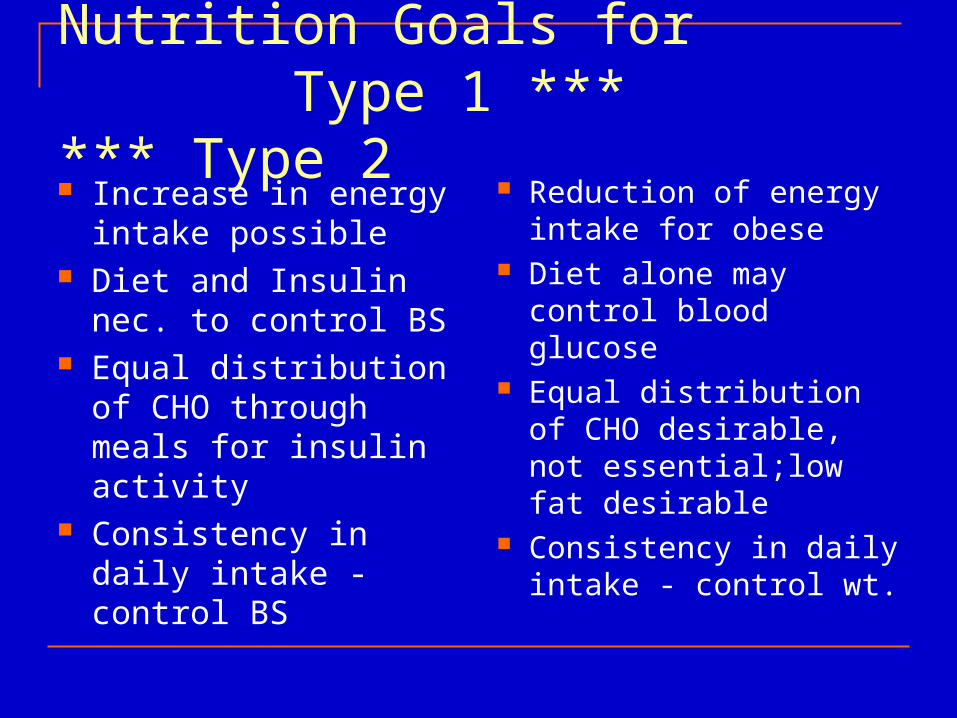
Nutrition Goals for Type 1 *** *** Type 2 Increase in energy
intake possible Diet and Insulin nec. to
control BS Equal distribution of
CHO through meals for insulin activity
Consistency in daily intake - control BS
Reduction of energy intake for obese
Diet alone may control blood glucose
Equal distribution of CHO desirable, not essential;low fat desirable
Consistency in daily intake - control wt.
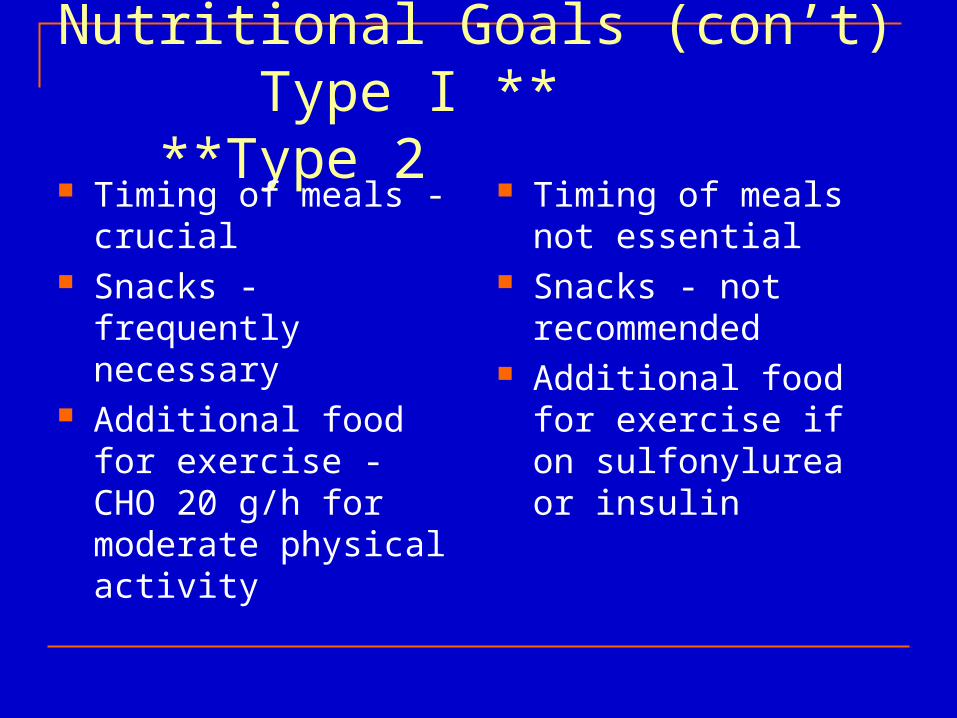
Nutritional Goals (con’t) Type I ** **Type 2 Timing of meals -
crucial Snacks - frequently
necessary Additional food for
exercise - CHO 20 g/h for moderate physical activity
Timing of meals not essential
Snacks - not recommended
Additional food for exercise if on sulfonylurea or insulin
Dietary Management of Diabetes Maintain as near-normal blood glucose levels as
possible by balancing food, insulin and exercise Achieve recommended serum blood lipid levels Provide energy intake to maintain or attain healthy
weight Prevent and treat acute and long-term diabetes-related
complications Enhance over all health
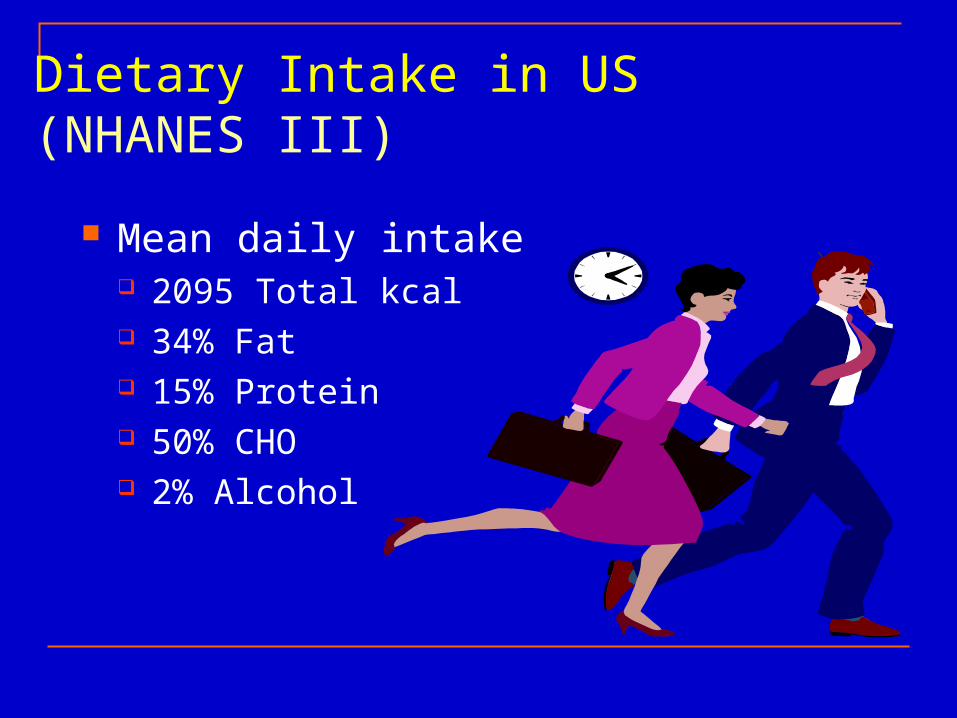
Dietary Intake in US (NHANES III)
Mean daily intake 2095 Total kcal 34% Fat 15% Protein 50% CHO 2% Alcohol
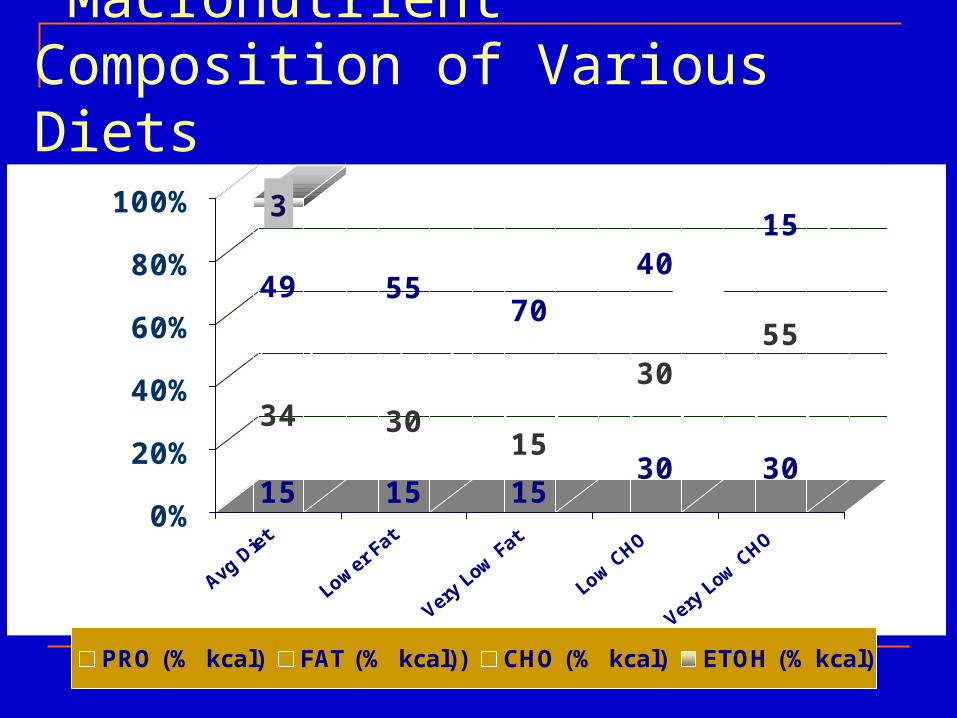
Macronutrient Composition of Various Diets
15
34
49
3
15
30
55
15
15
70
30
30
40
30
55
15
0%
20%
40%
60%
80%
100%
Avg
Diet
Lower
Fat
Very
Low Fa
t
Low C
HO
Very
Low C
HO
PRO (% kcal) FAT (% kcal)) CHO (% kcal) ETOH (% kcal)
Major Dietary Guidance Tools Recommended Dietary Allowances
1989 10th Edition currently being revised Dietary Reference Intakes (DRIs)
RDAs ,Tolerable Upper Intake Level (UL), Estimated Average Requirement (EAR) and Adequate Intake (AI)
Yates et al, Jour Am Diet Assoc. 1998:98:699-706
The Food Guide Pyramid Human Nutrition Information Service, Home and Garden
Bulletin Number 252, Hyattsville, MD:USDA, 1992
1995 US Dietary Guidelines USDA and USDHHS, Nutrition and your health: Dietary
guidelines for Americans, 4th edition, 1995; Home and Garden Bulletin No. 232,Washington, DC:USDA, 1995
Type 1 Diabetes Mellitus
Type 1 Diabetes Mellitus
Nutrition Goals for Type 1
Consider intensive insulin therapy to allow flexibility in meal patterns
Integrate insulin therapy with usual food intake Develop an eating pattern based on person’s usual
food intake Monitor blood glucose levels
Ref: Manual of Clinical Nutrition, 2000
Meal PlanningMeal Planning
Term “ADA Diet” is obsolete Avoid the terms
no concentrated sweets low sugar diet liberal diabetic diet
Medical Nutrition TherapyMedical Nutrition Therapy
Meal plans should be individualized based on
nutrition assessment medical history psycho-social assessment treatment goals
Carbohydrate ConsistencyCarbohydrate Consistency
CHO intake and distribution should be comparable from one day to the next.
CHO content of meals within the same day can vary.
Type of Carbohydrate Type of Carbohydrate
The total amount of CHO eaten is more important than the source or type.
Clinical studies do not justify the longtime belief that sucrose must be restricted.
Glycemic IndexGlycemic Index
Compares various CHO foods and ranks them according to effect on BG.
Limitations: compared 50 g CHO from each source, actual
portion sizes weren’t necessarily comparable. looked at BG response when each item was
eaten alone, on an empty stomach. Mixed meals would produce a different effect.
People may unnecessarily restrict healthful foods.

Sugars and SweetenersSugars and Sweeteners
Sugar, honey, syrup...1 Tbs. =15g CHO Fructose slightly lower post-prandial
response. Sugar alcohol is a form of carbohydrate, but
labels can technically state “sugar free”. FDA approves 4 sugar substitutes which
have no CHO: aspartame, saccharin, acesulfame-K, sucralose
Macronutrient CompositionMacronutrient Composition
No absolute percentages CHO and MUFA should be 60-70% kcals SFA < 10% kcals Protein intakes of 15-20% kcals
Sample energy distributionSample energy distribution
50-60 % CHO 15-20 % Protein 20-30 % Fat
Protein Intake
Small to medium portion of protein once daily 12-20% of daily calories From both animal and vegetable sources Vegetable source less nephrotoxic than
animal protein 3-5oz (100-150g) of meat, fish or poultry daily Patient with nephropathy should limit to less
than 12% daily
Fat Intake
<35% of total calories Saturated fat <10% of total calories Polyunsaturated fats 10% of total calories Cholesterol consumption < 300 mg Moderate increase in monounsaturated fats
such as canola oil and olive oil (up to 20% of total calories)
CHO Intake
CHO intake determined after protein and fat intake have been calculated.
Emphasize on whole grains, starches, fruits, and vegetables
Fiber same as for nondiabetics (20g to 35g) Rate of digestion related to the presence of
fat, degree of ripeness, cooking method, and preparation
Carbohydrate Management ToolsCarbohydrate Management Tools Food Pyramid Food Labels ADA Exchange Lists Reference Books
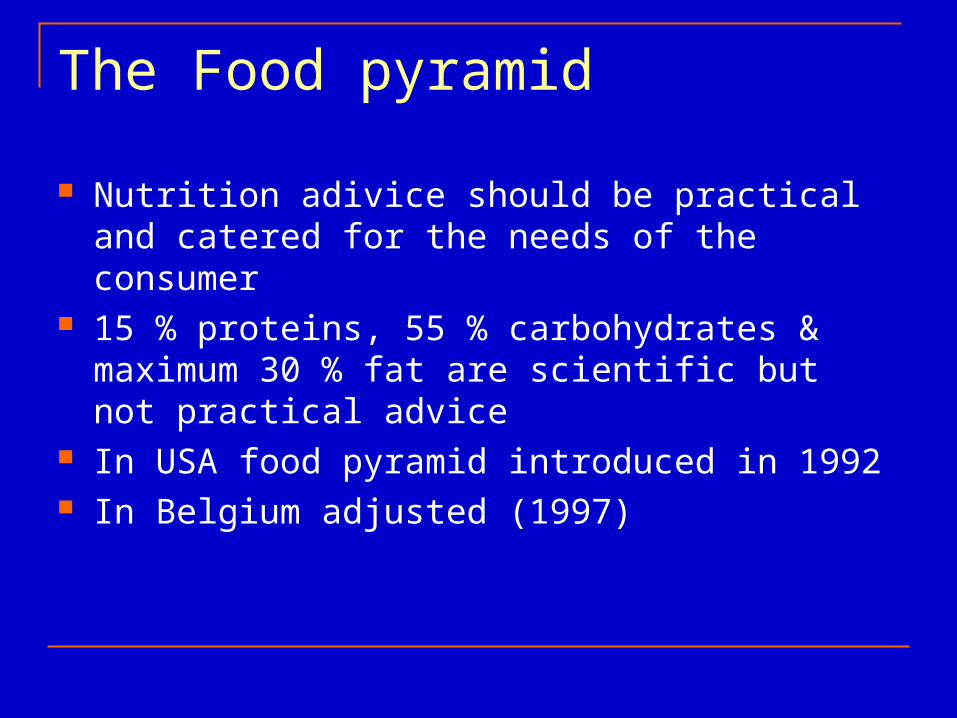
The Food pyramid
Nutrition adivice should be practical and catered for the needs of the consumer
15 % proteins, 55 % carbohydrates & maximum 30 % fat are scientific but not practical advice
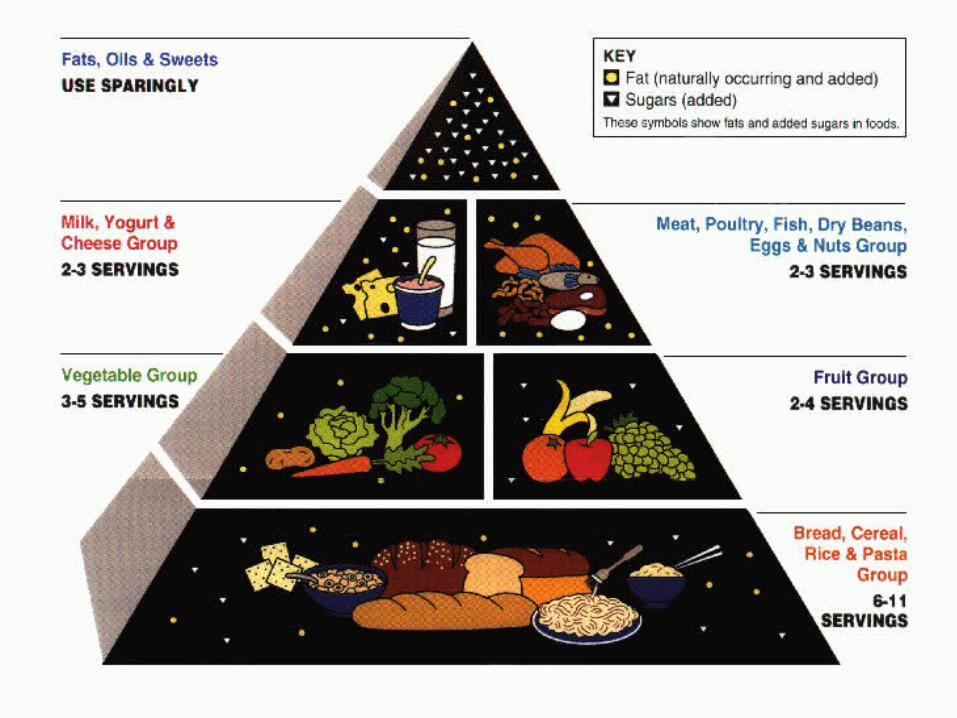
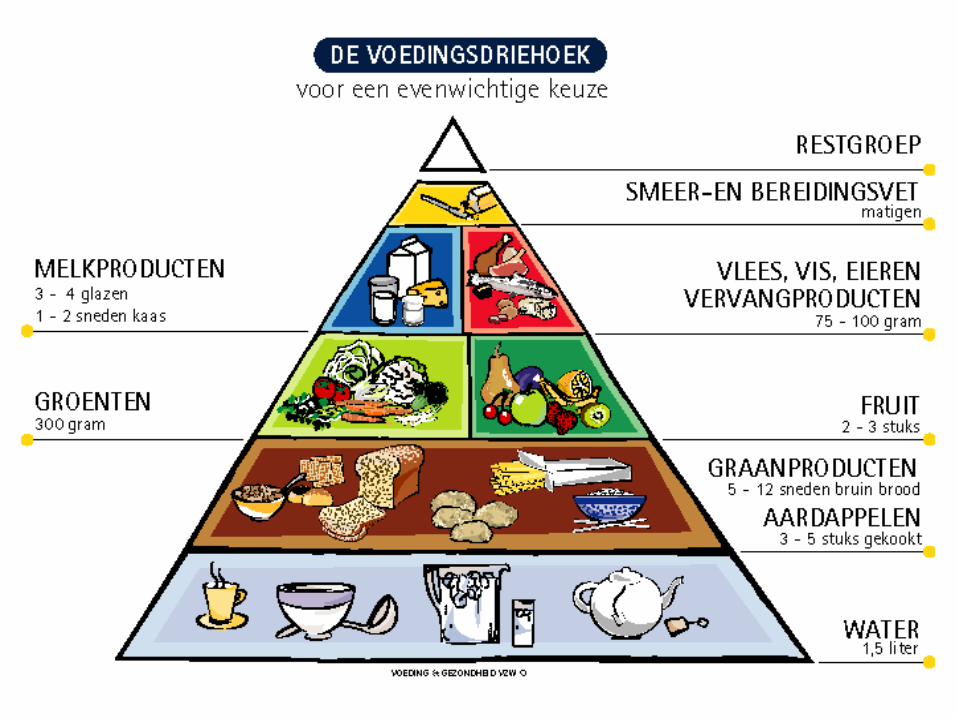
In USA food pyramid introduced in 1992 In Belgium adjusted (1997)
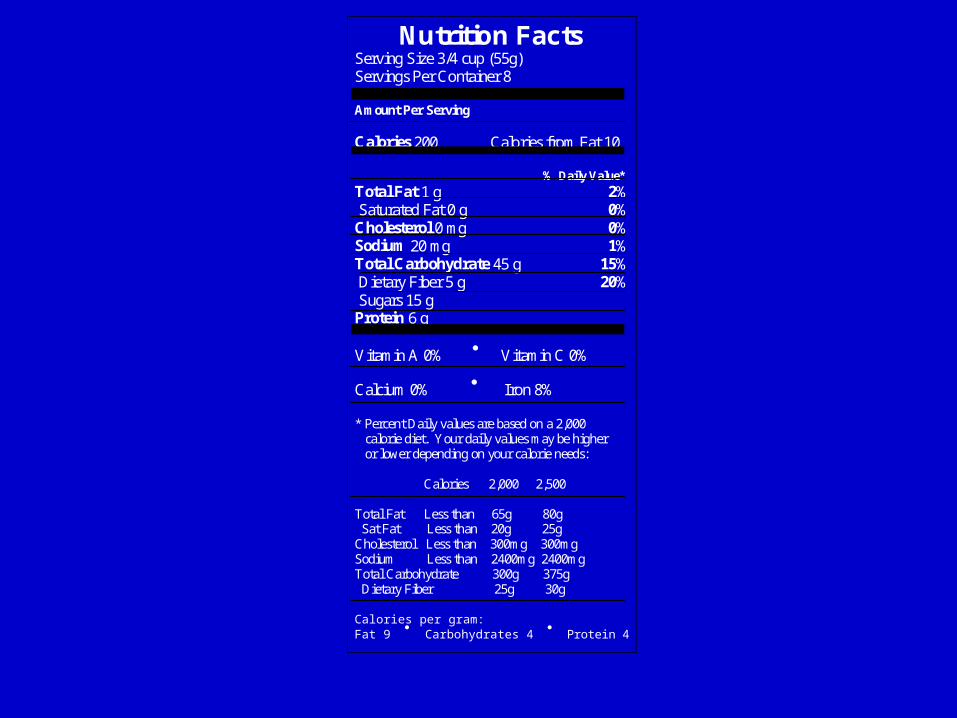
Nutrition Facts Serving Size 3/4 cup (55g) Servings Per Container 8 Amount Per Serving Calories 200 Calories from Fat 10 % Daily Value* Total Fat 1 g 2% Saturated Fat 0 g 0% Cholesterol 0 mg 0% Sodium 20 mg 1% Total Carbohydrate 45 g 15% Dietary Fiber 5 g 20% Sugars 15 g Protein 6 g Vitamin A 0% Vitamin C 0%
Calcium 0% Iron 8% * Percent Daily values are based on a 2,000 calorie diet. Your daily values may be higher or lower depending on your calorie needs: Calories 2,000 2,500 Total Fat Less than 65g 80g Sat Fat Less than 20g 25g Cholesterol Less than 300mg 300mg Sodium Less than 2400mg 2400mg Total Carbohydrate 300g 375g Dietary Fiber 25g 30g Calories per gram: Fat 9 Carbohydrates 4 Protein 4
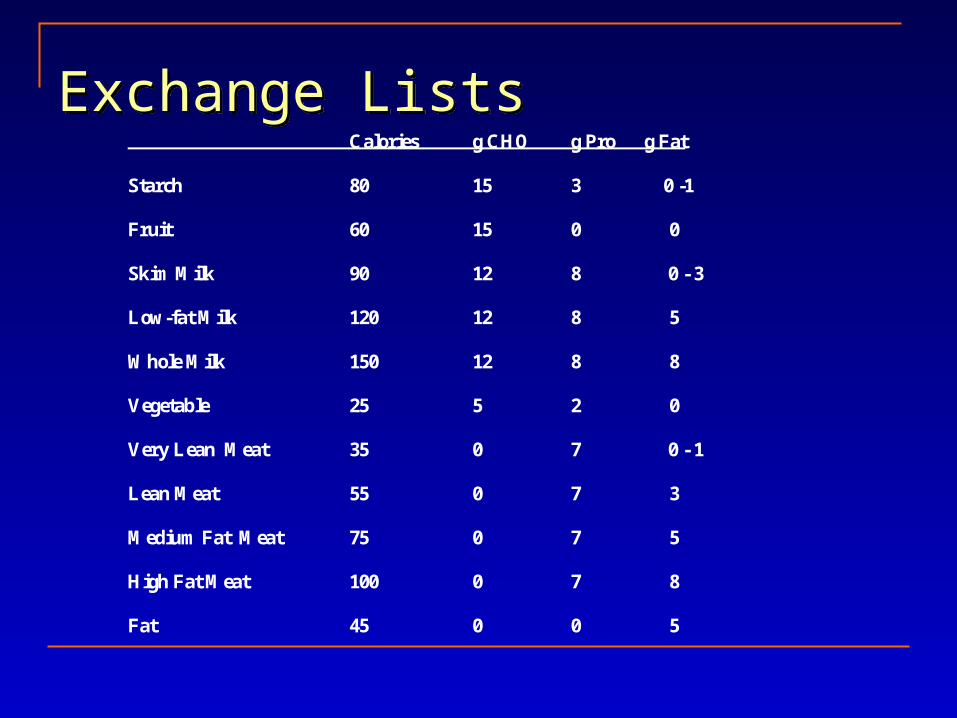
Exchange ListsExchange Lists Calories g CHO g Pro g Fat
Starch 80 15 3 0 -1
Fruit 60 15 0 0
Skim Milk 90 12 8 0 - 3
Low-fat Milk 120 12 8 5
Whole Milk 150 12 8 8
Vegetable 25 5 2 0
Very Lean Meat 35 0 7 0 - 1
Lean Meat 55 0 7 3
Medium Fat Meat 75 0 7 5
High Fat Meat 100 0 7 8
Fat 45 0 0 5
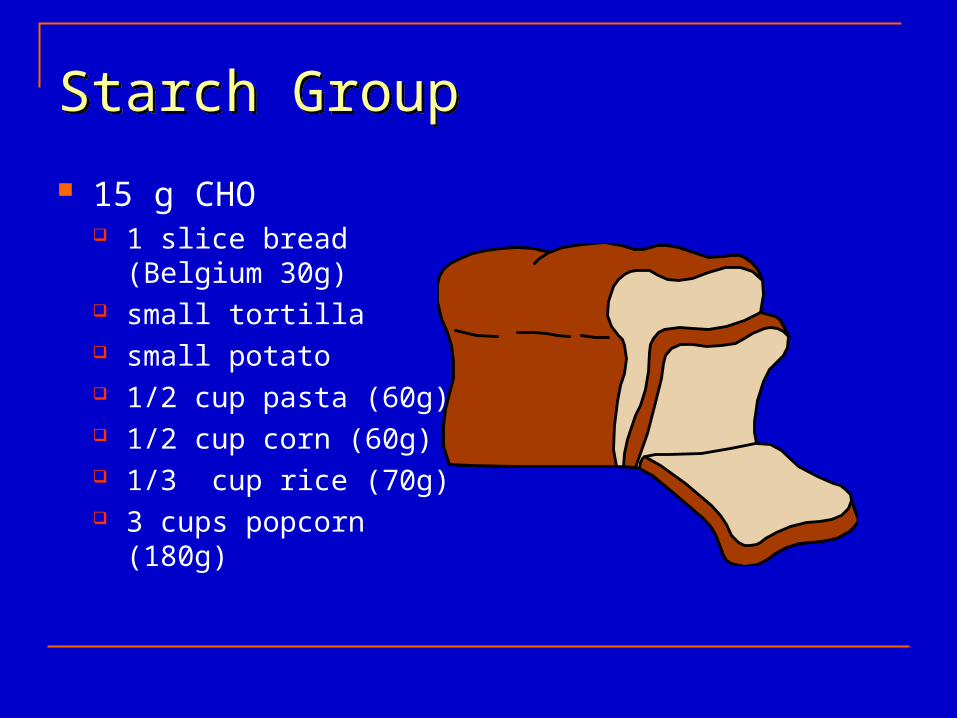
Starch GroupStarch Group
15 g CHO 1 slice bread (Belgium
30g) small tortilla small potato 1/2 cup pasta (60g) 1/2 cup corn (60g) 1/3 cup rice (70g) 3 cups popcorn (180g)
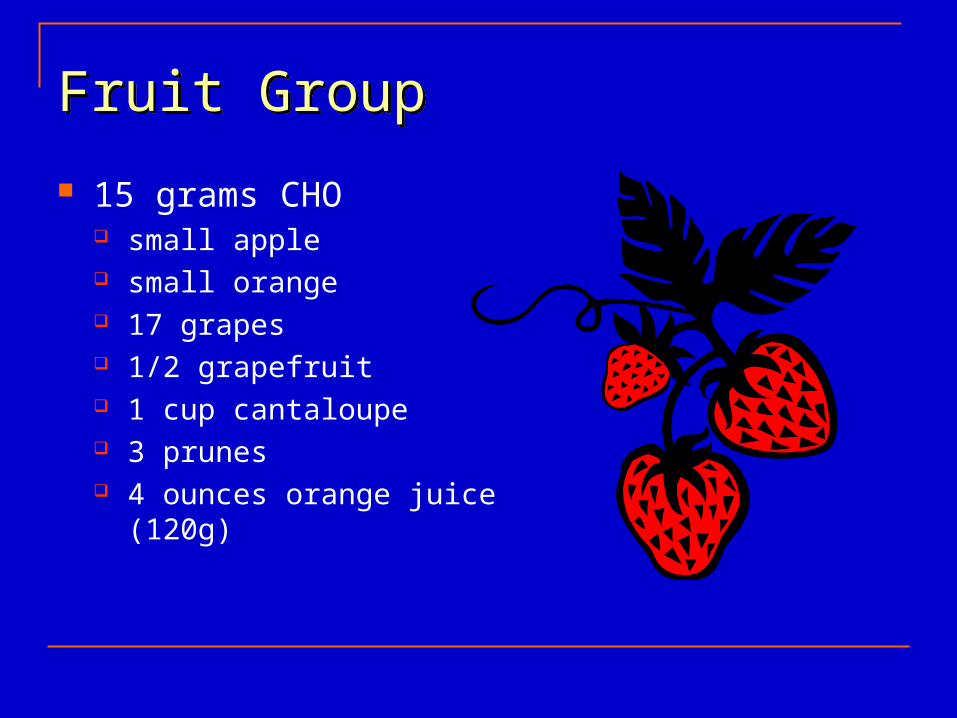
Fruit GroupFruit Group
15 grams CHO small apple small orange 17 grapes 1/2 grapefruit 1 cup cantaloupe 3 prunes 4 ounces orange juice (120g)
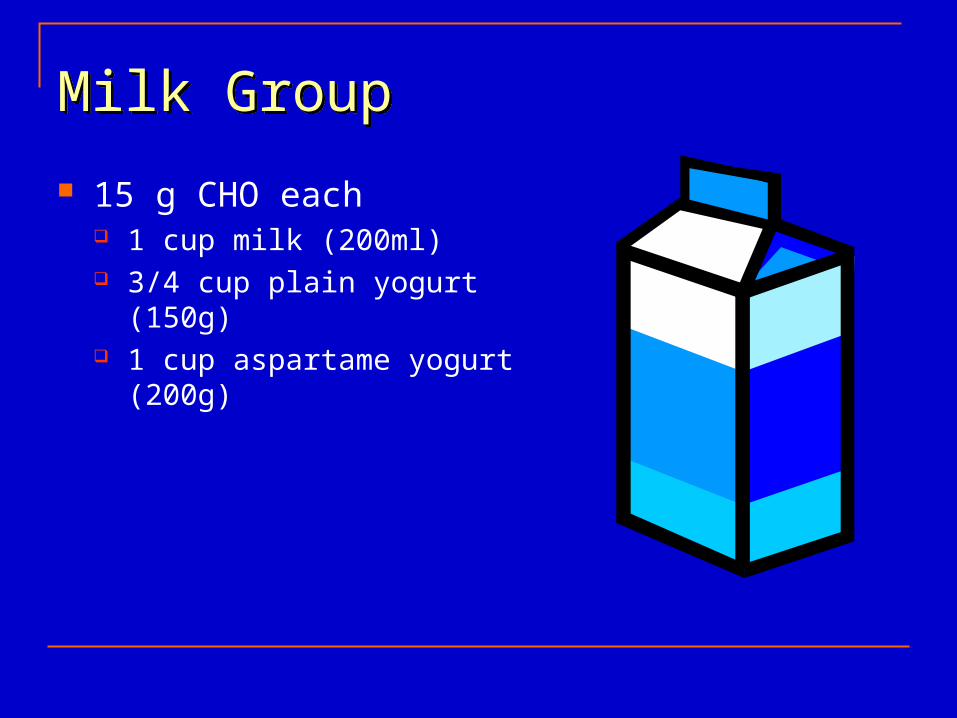
Milk GroupMilk Group
15 g CHO each 1 cup milk (200ml) 3/4 cup plain yogurt (150g) 1 cup aspartame yogurt (200g)
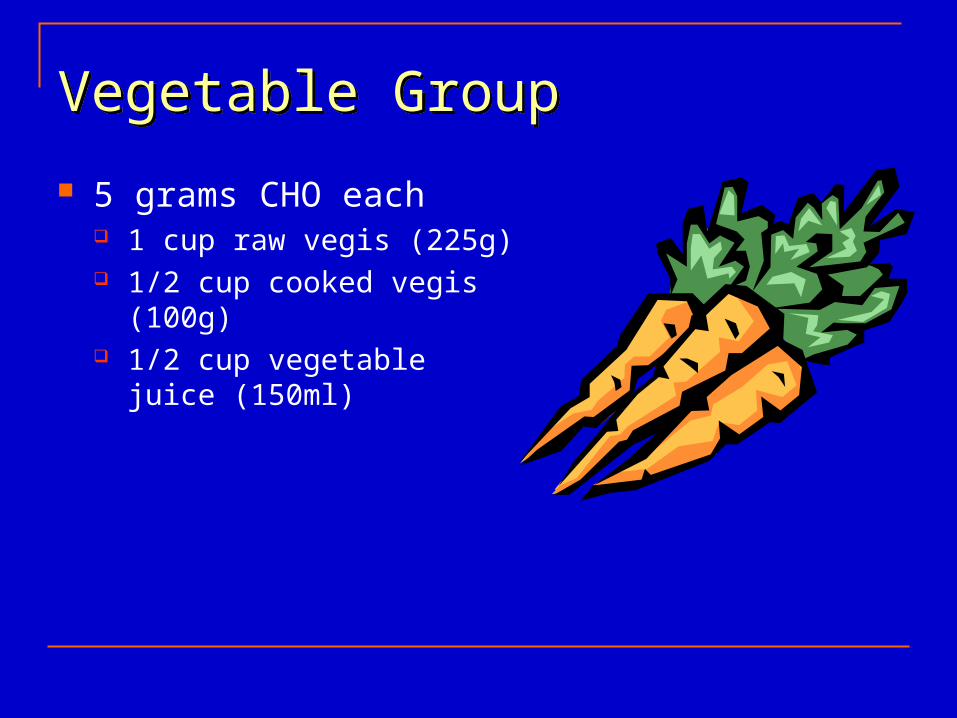
Vegetable Group Vegetable Group
5 grams CHO each 1 cup raw vegis (225g) 1/2 cup cooked vegis (100g) 1/2 cup vegetable juice
(150ml)
Digestion TimingDigestion Timing
Peak Post Prandial BG is typically 1-2 hours after a standard mixed meal.
Liquids (juice/soda) digest quicker. High fat meals digest slower.
Meal PlanningMeal Planning
Set Carbohydrate Intake specific amount of CHO set to match prescribed
insulin regimen (less flexible) Adjust Insulin to Desired Carbo Intake
insulin to carbohydrate ratio 1 unit per 10-15 g carbohydrate 1 unit for every 50 mg/dl elevated above target (above
doses may vary)
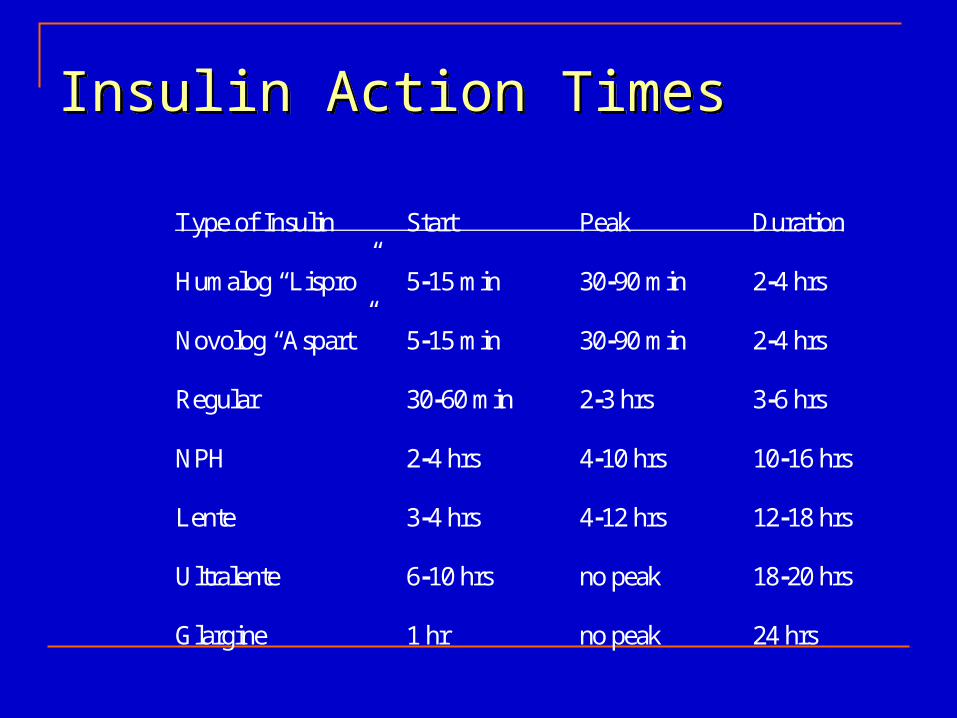
Insulin Action TimesInsulin Action Times
Type of Insulin Start Peak Duration
Humalog “Lispro” 5-15 min 30-90 min 2-4 hrs
Novolog “Aspart” 5-15 min 30-90 min 2-4 hrs
Regular 30-60 min 2-3 hrs 3-6 hrs
NPH 2-4 hrs 4-10 hrs 10-16 hrs
Lente 3-4 hrs 4-12 hrs 12-18 hrs
Ultralente 6-10 hrs no peak 18-20 hrs
Glargine 1 hr no peak 24 hrs
Insulin Delivery Insulin Delivery
Syringes Insulin Pens Insulin Pump
delivers short acting insulin (sub-Q catheter) adjustable basal rate (usually 0.5-1.0 u/hr) programmable bolus for food or BG correction
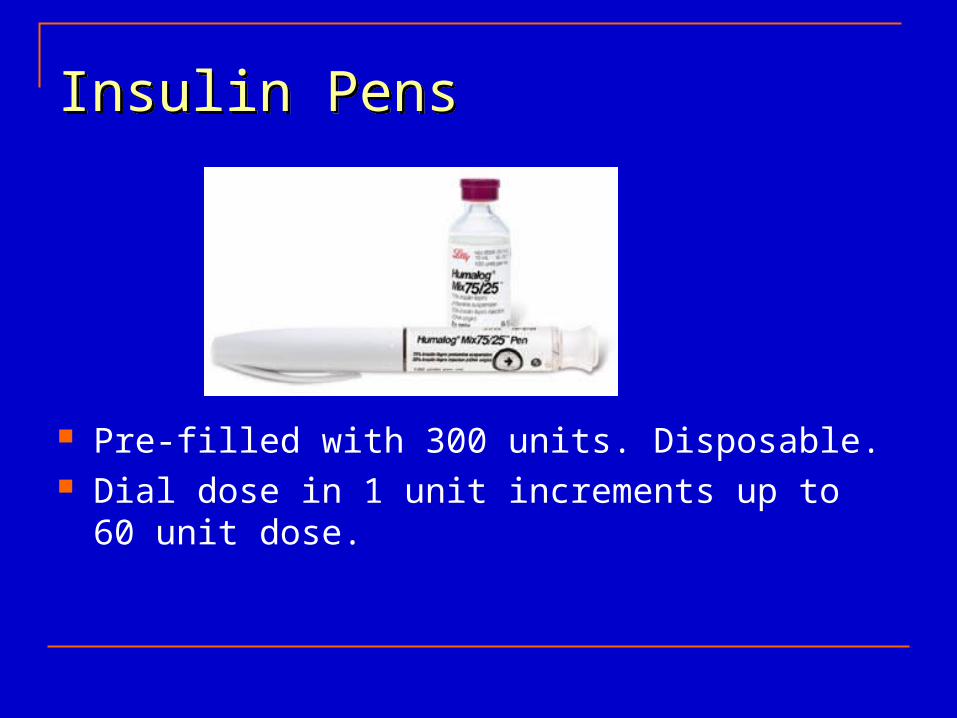
Insulin PensInsulin Pens
Pre-filled with 300 units. Disposable. Dial dose in 1 unit increments up to 60 unit dose.
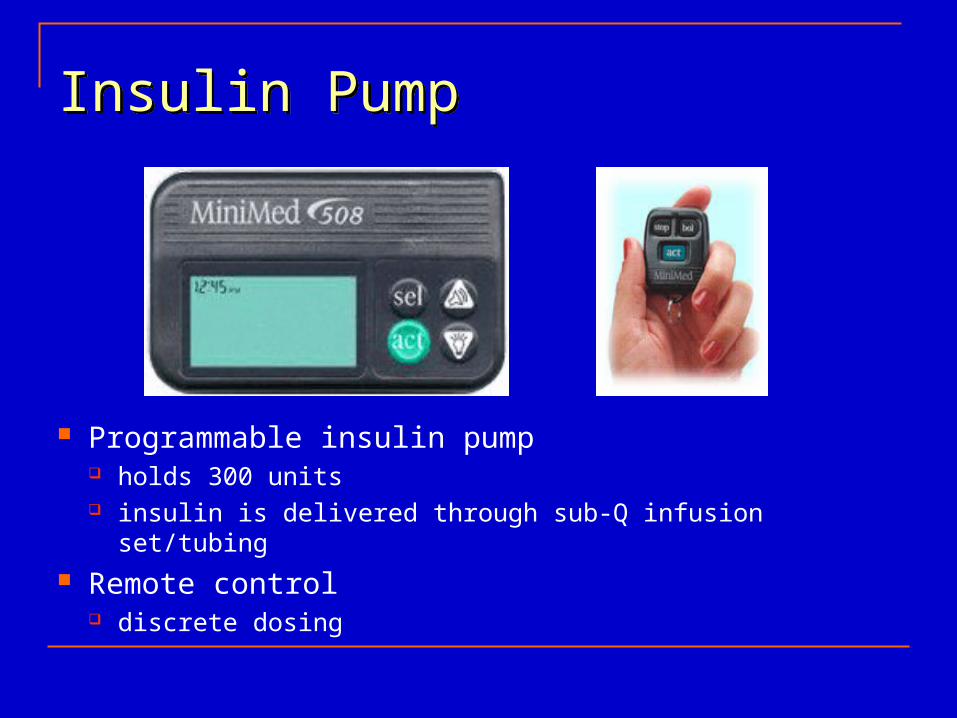
Insulin PumpInsulin Pump
Programmable insulin pump holds 300 units insulin is delivered through sub-Q infusion set/tubing
Remote control discrete dosing
ExerciseExercise
Improves insulin sensitivity
Lowers Blood Glucose Uses Glycogen Stores
muscle liver
Increases release of FFA from adipose
Exercise Guidelines: Type 1 DMMetabolic Control
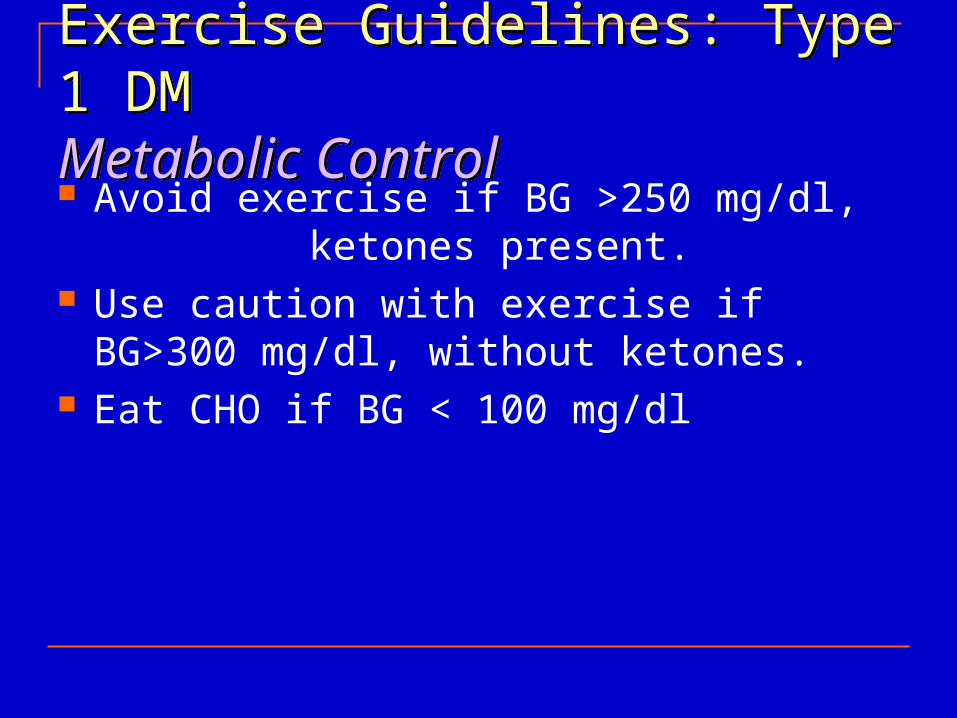
Exercise Guidelines: Type 1 DMMetabolic Control Avoid exercise if BG >250 mg/dl,
ketones present. Use caution with exercise if BG>300 mg/dl,
without ketones. Eat CHO if BG < 100 mg/dl
Exercise Guidelines: Type 1 DMBlood Glucose Monitoring
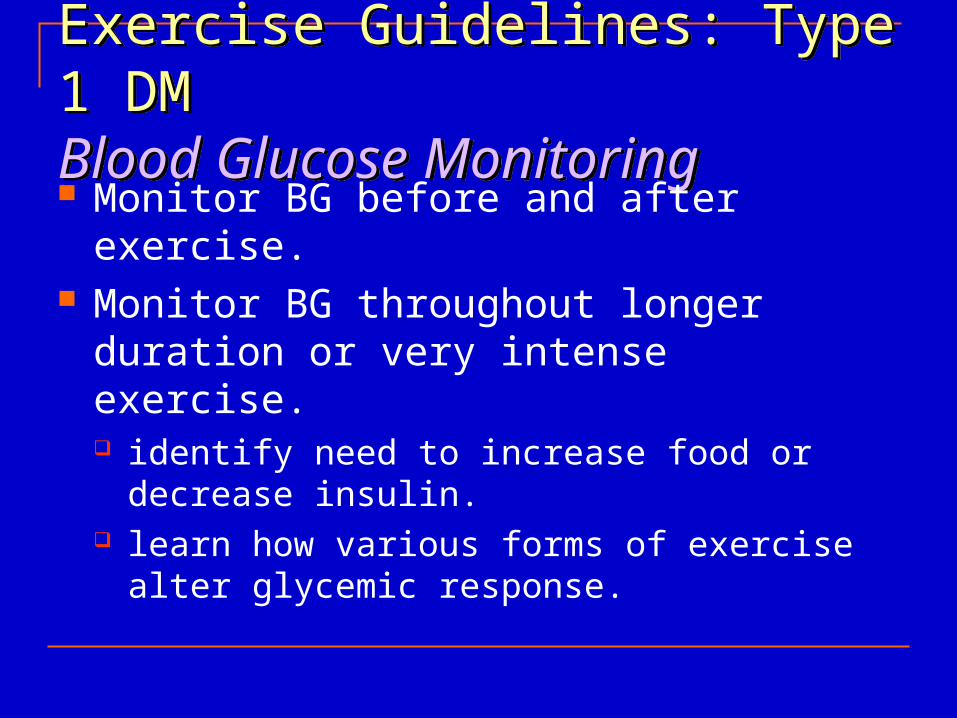
Exercise Guidelines: Type 1 DMBlood Glucose Monitoring Monitor BG before and after exercise. Monitor BG throughout longer duration or
very intense exercise. identify need to increase food or decrease insulin. learn how various forms of exercise alter glycemic
response.
Exercise Guidelines: Type 1 DMInsulin Adjustments
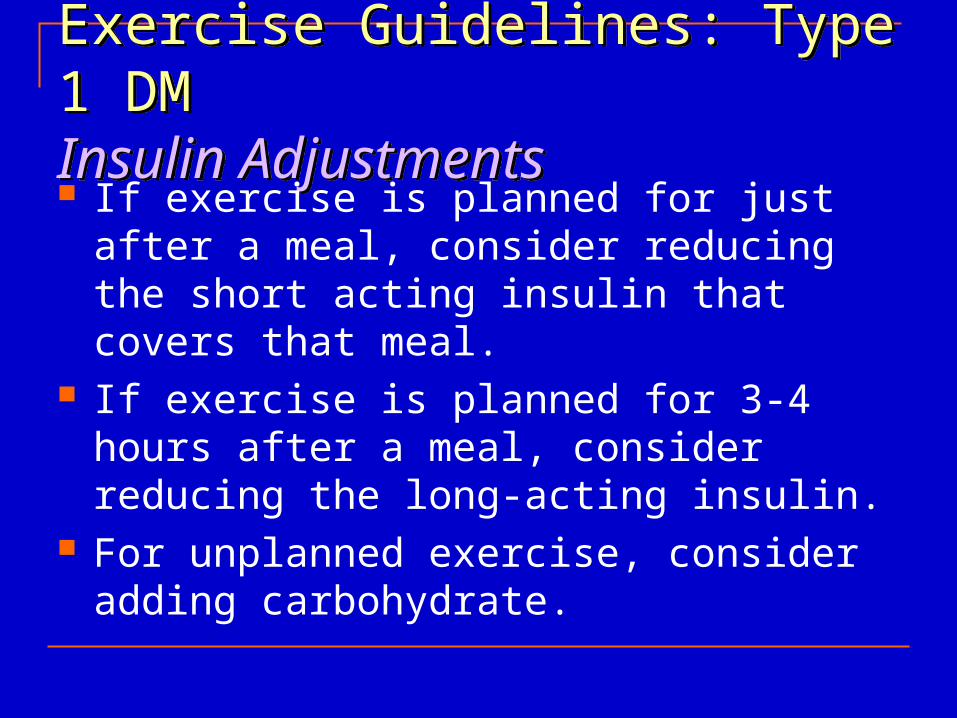
Exercise Guidelines: Type 1 DMInsulin Adjustments If exercise is planned for just after a meal,
consider reducing the short acting insulin that covers that meal.
If exercise is planned for 3-4 hours after a meal, consider reducing the long-acting insulin.
For unplanned exercise, consider adding carbohydrate.
Exercise Guidelines: Type 1 DMFood Intake
Exercise Guidelines: Type 1 DMFood Intake Consume CHO before, during, or after
exercise to prevent hypoglycemia. Always keep CHO foods readily available
during exercise.
Late-onset HypoglycemiaLate-onset Hypoglycemia
Related to repletion of glycogen stores. Can occur up to 24 hrs after exercise.
indicates that insufficient carbohydrate was available in relation to insulin and exercise.
Depleted glycogen stores are best replaced when CHO is consumed within 30 min of exercise completion.
Treating HypoglycemiaTreating Hypoglycemia
Check BG when s/sx of hypoglycemia For BG < 70 mg/dl
take 15 grams of CHO 4 oz (120ml) juice 1 Tbs. (15g) sugar, jam, honey 3-4 glucose tabs
recheck BG in 15 minutes, repeat PRN If unconscious, NPO: administer glucagon or
IV dextrose.
Alcohol PrecautionsAlcohol Precautions
Alcohol inhibits gluconeogenesis which impairs the ability to recover from low BG.
Glycogenolysis is not affected by EtOH. Counter-regulatory response depends on glycogen stores.
ADA rec’s: limit to 1-2 drinks, consumed with CHO foods, if
no other contraindications.
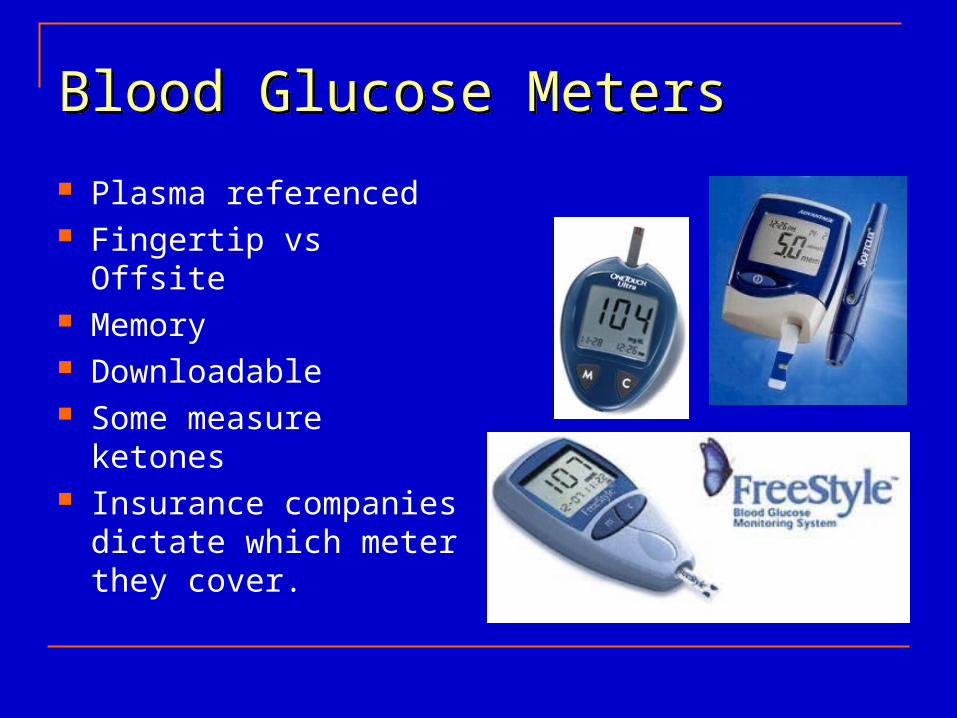
Blood Glucose MetersBlood Glucose Meters
Plasma referenced Fingertip vs Offsite Memory Downloadable Some measure ketones Insurance companies
dictate which meter they cover.
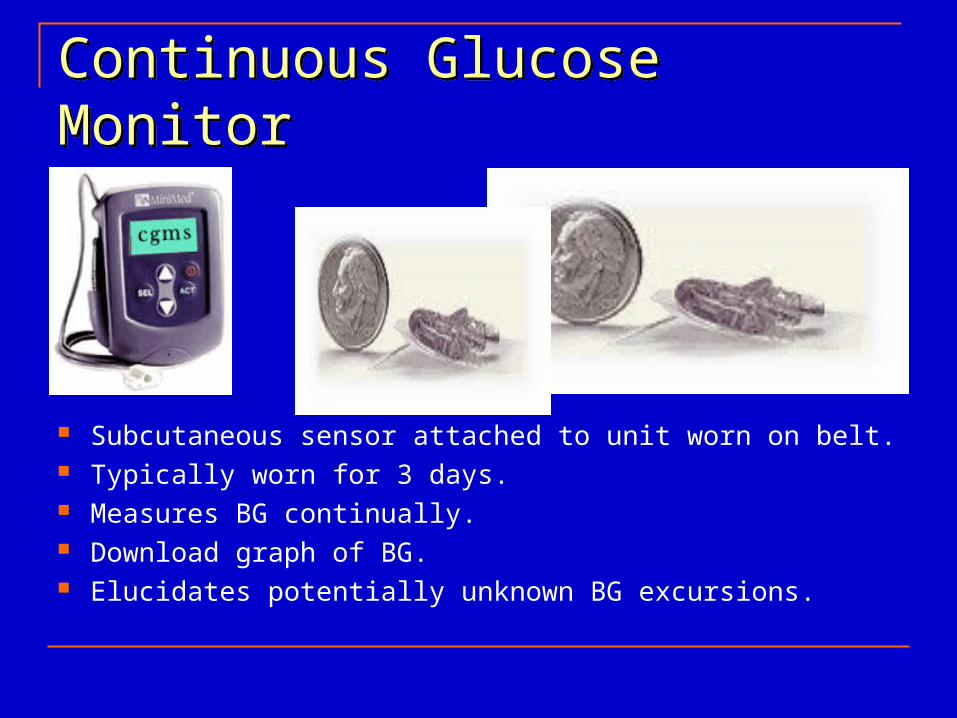
Continuous Glucose MonitorContinuous Glucose Monitor
Subcutaneous sensor attached to unit worn on belt. Typically worn for 3 days. Measures BG continually. Download graph of BG. Elucidates potentially unknown BG excursions.
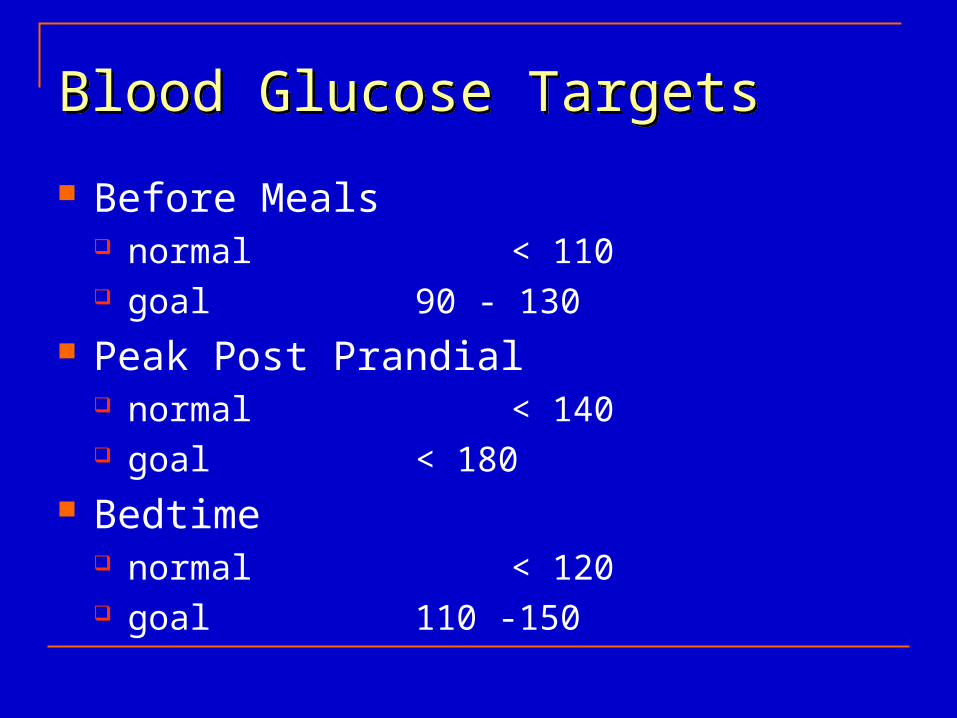
Blood Glucose TargetsBlood Glucose Targets
Before Meals normal < 110 goal 90 - 130
Peak Post Prandial normal < 140 goal < 180
Bedtime normal < 120 goal 110 -150
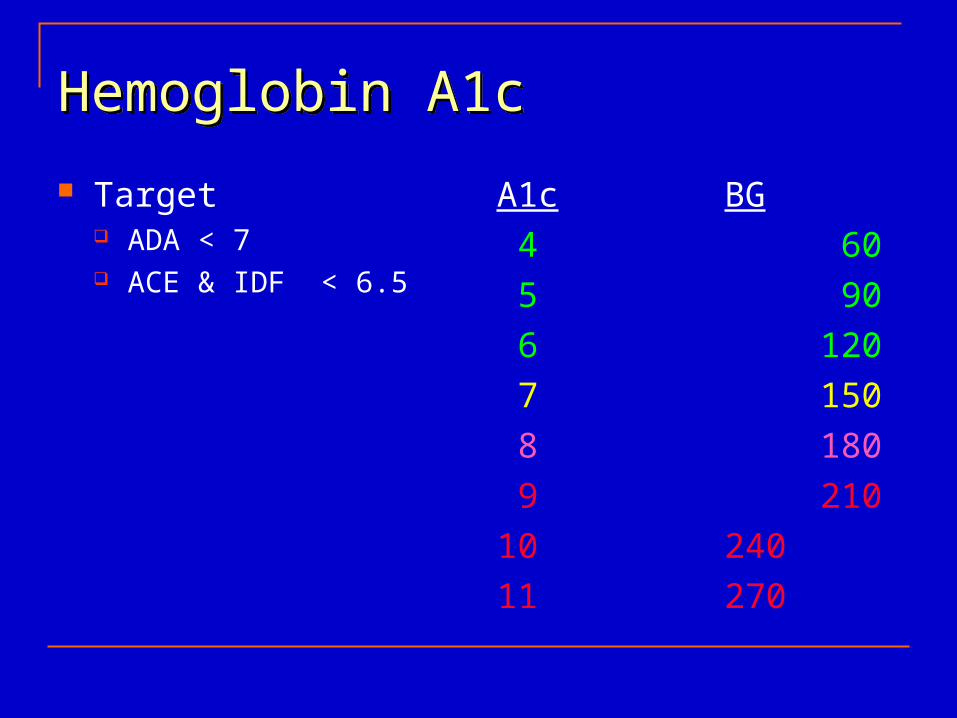
Hemoglobin A1cHemoglobin A1c
Target ADA < 7 ACE & IDF < 6.5
A1c BG
4 60
5 90
6 120
7 150
8 180
9 210
10 240
11 270
Type 2 Diabetes Mellitus
Type 2 Diabetes Mellitus
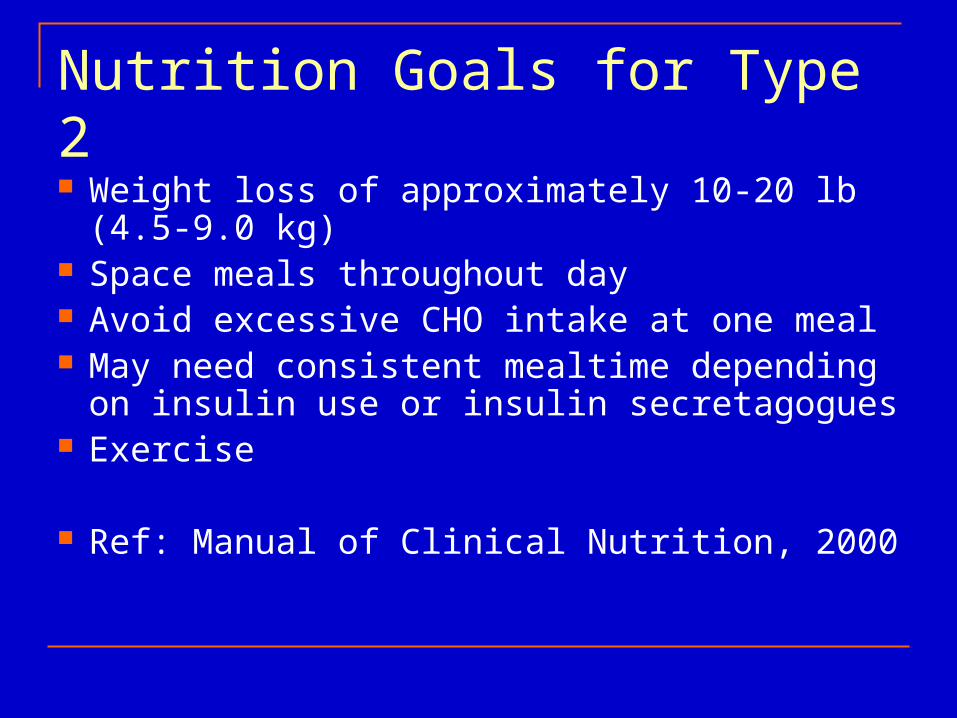
Nutrition Goals for Type 2
Weight loss of approximately 10-20 lb (4.5-9.0 kg)
Space meals throughout day Avoid excessive CHO intake at one meal May need consistent mealtime depending on
insulin use or insulin secretagogues Exercise
Ref: Manual of Clinical Nutrition, 2000
Key TopicsKey Topics
Statistics/Overview Weight Control Lipid Control Blood Pressure Control Exercise Other Complications
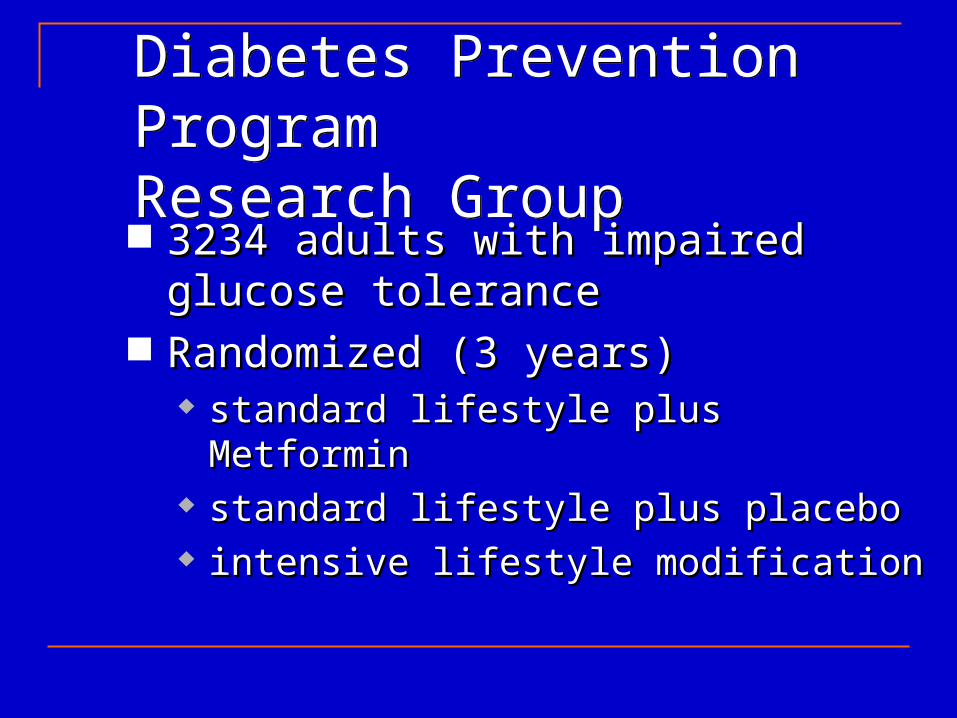
Diabetes Prevention ProgramResearch Group Diabetes Prevention ProgramResearch Group 3234 adults with impaired glucose tolerance3234 adults with impaired glucose tolerance Randomized (3 years)Randomized (3 years)
standard lifestyle plus Metforminstandard lifestyle plus Metformin standard lifestyle plus placebostandard lifestyle plus placebo intensive lifestyle modificationintensive lifestyle modification
Lifestyle ModificationLifestyle Modification
Weight loss (decrease weight by 7 %) individualized counseling healthy, low calorie, low-fat diet A 16 lesson curriculum on diet, exercise, behavior
modification Exercise 150 minutes per week
ResultsResults
Intensive lifestyle modification group reduced incidence of diabetes by 58 %
Metformin reduced incidence of diabetes by 31 %
Exercise
Potential Benefits Improved Glucose tolerance Weight loss or maintenance or desirable weight Improved cardiovascular risk factors Improved response to pharmacologic therapy Improved energy level, muscular strength,
flexibility, quality of life, and sense of well being
Exercise Prescription
Interest Capacity Motivation Physical status Individualized approach
Types of exercise
Walking Biking and stationary cycling Lap swimming and water aerobics Weight lifting At least 3-4 times a week, 30-40 minutes per
session, 50 to 70% of maximum oxygen uptake
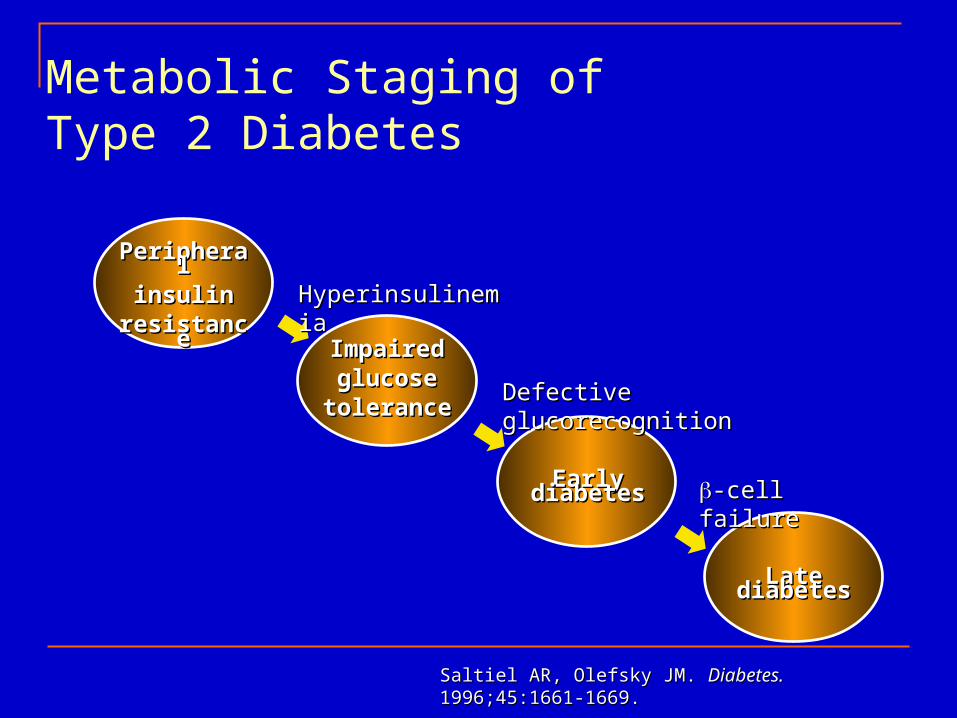
PeripheralPeripheralinsulininsulin
resistanceresistance
ImpairedImpairedglucoseglucose
tolerancetolerance
Early diabetesEarly diabetes
Late diabetesLate diabetes
HyperinsulinemiaHyperinsulinemia
Defective glucorecognitionDefective glucorecognition
-cell failure-cell failure
Saltiel AR, Olefsky JM. Saltiel AR, Olefsky JM. Diabetes. Diabetes. 1996;45:1661-1669.1996;45:1661-1669.
Metabolic Staging ofType 2 Diabetes
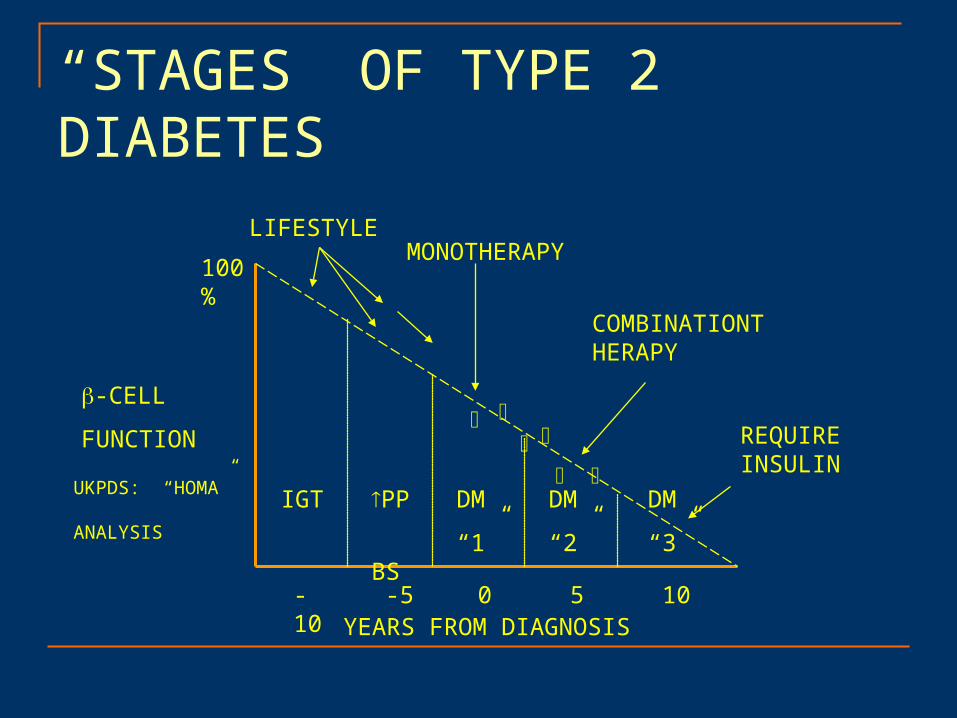
“STAGES” OF TYPE 2 DIABETES
100%
-CELL
FUNCTION
YEARS FROM DIAGNOSIS-10 -5 0 5 10
IGT PP
BS
DM
“1”
DM
“2”
DM
“3”
MONOTHERAPY
COMBINATIONTHERAPY
REQUIRE INSULIN
LIFESTYLE
UKPDS: “HOMA” ANALYSIS
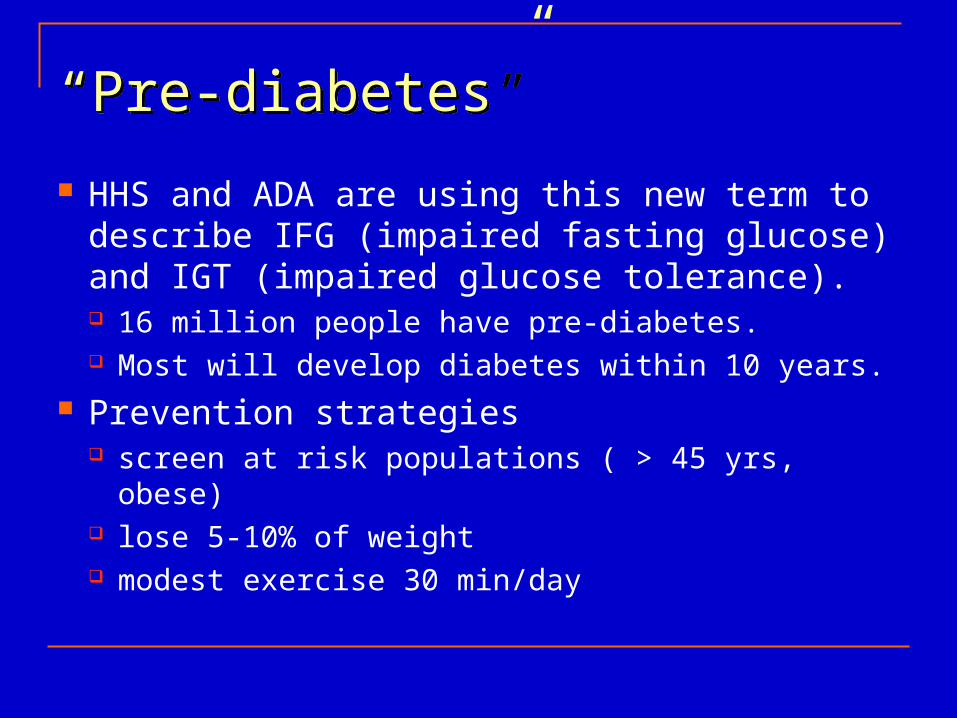
“Pre-diabetes”“Pre-diabetes”
HHS and ADA are using this new term to describe IFG (impaired fasting glucose) and IGT (impaired glucose tolerance). 16 million people have pre-diabetes. Most will develop diabetes within 10 years.
Prevention strategies screen at risk populations ( > 45 yrs, obese) lose 5-10% of weight modest exercise 30 min/day
Weight ControlWeight Control
Energy In = Energy Out
CHO: 4 kcals/g Metabolism
Protein: 4 kcals/g Daily Activities
Fat: 9 kcals/g Exercise
EtOH: 7 kcals/g
Nutrition Therapy
Provide Follow-up assessment of the meal plan to Determine effectiveness in terms of glucose and
lipid control and weight loss Make necessary changes based on weight loss,
activity level, or changes in medication Provide ongoing patient education and support
Weight Loss
Improves Glucose Control Increases Sensitivity to insulin Lower lipid levels and blood pressure Corresponding lowering of the dosage of
pharmacologic agents

For a Successful Outcome
Modest Energy Restrictions Spreading energy intake throughout the day Increased Physical Activity Behavior Modification Psychosocial Support

Energy Intake
Women: 100 # for the first 5 ft of height plus 5 # for each additional inch over 5 ft.
Men: 106# for the first 5 ft. of height plus 6# for each additional inch over 5 ft.
Add 10% for larger body build, Subtract 10% for smaller body builds
Multiply resulting weight by: Men and Physically Active Women: 15 Most Women, Sedentary Men, and Adults over 55: 13 Sedentary Women, Obese Adults over age 55: 10
Weight LossWeight Loss
1 pound body fat = 3500 kcals stored energy Energy deficit of 500 kcals/day to lose 1 lb/wk Energy deficit of 250 kcals/day to lose 1/2 lb/wk
Create energy deficit by: Eating less calories Exercise more
Guidelines for Weight LossGuidelines for Weight Loss
Limit eating for emotional or situational reasons. Limit non-nutritious energy sources. Limit added fats. Use lean meats. Use lowfat dairy products. Use lowfat cooking methods. Choose low calorie beverages. Eat a balanced diet and don’t skip meals. Exercise regularly.
Getting to the Heart of the MatterGetting to the Heart of the Matter The number 1 cause of death for people with
diabetes is heart disease. Minimize risk factors:
* control BG * don’t smoke
* control BP * control lipids
* control weight * exercise regularly
Treatment Goals Treatment Goals
Blood Pressure < 130/80
Total Chol < 200 mg/dl LDL Chol < 100 mg/dl HDL Chol > 40 mg/dl Triglycerides < 150 mg/dl
Heart Healthy Diet Heart Healthy Diet
Decrease saturated, hydrogenated, and trans-fatty acids. (< 7% kcals)
Limit dietary cholesterol. (<200 mg/d)
Increase intake of omega-3 fatty acids. Increase intake of soluble fiber. (10-25 g/d)
Include plant stanols/sterols. (2 g/d)
Dietary Fats DefinedDietary Fats Defined
Saturated Fats solid at room temperature animal fats
Hydrogenated Fats vegetable oils in origin, modified to solidify
Trans Fatty Acids occur mostly in hydrogenated fats
All of the above fats can raise LDL cholesterol.
Dietary Fats DefinedDietary Fats Defined
Polyunsaturated Fats safflower, corn, sunflower, sesame, cottonseed
Monounsaturated Fats olive, canola, peanut, avocados
Omega-3 Fatty Acids fish: salmon, tuna, mackerel, herring, sardines vegetarian sources: flaxseed, walnut, soybean,
canola, evening primrose.
Dietary CholesterolDietary Cholesterol
Only found in animal products. Most concentrated sources:
eggs (212 mg/yolk) shrimp (194 mg/3.5 oz, 100g) squid (231 mg/3.5 oz, 100g) liver (389 mg beef, 631 mg chicken, 3.5 oz, 100g) meat (75-95 mg/3.5 oz, 100g beef, chicken, pork)
Soluble FiberSoluble Fiber
Binds bile acids in the intestine, so that the bile acids are not absorbed in the terminal ileum.
New bile acids are made from circulating cholesterol, thus lowering serum chol.
Best Sources: oats, beans/legumes, rice bran, barley carrots, broccoli, sweet potatoes, citrus, papaya, apples, strawberries
Homocysteine AlertHomocysteine Alert
Elevated homocysteine levels may increase the risk of heart disease.
Adequate intake of these vitamins can lower homocysteine levels: Folate: fruits, vegetables, legumes, avocado,
yeast, wheat germ, fortified cereals and grains. Vit B6: whole grains, legumes, fish, chicken... Vit B12: milk, cheese, meat, fish, chicken, eggs
Blood Pressure ControlBlood Pressure Control
Lifestyle Modifications control weight exercise regularly limit sodium limit alcohol eat diet rich in potassium eat adequate amounts of calcium (?)
Reduce Sodium IntakeReduce Sodium Intake
Limit to 2,400 mg/d Low Sodium Strategies:
avoid the salt shaker limit use of processed foods limit fast food restaurant meals season with herbs, spices, garlic, ginger, lemon,
onions, flavored vinegar
PotassiumPotassium
Unless patient is limiting potassium for renal disease, or hyperkalemia, encourage a diet rich in potassium. Sources include: apricots, avocados, bananas, cantaloupe, kiwi,
mangos, oranges, strawberries artichokes, tomatoes, potatoes, yams, legumes,
parsnips, winter squash milk, yogurt lean meat, fish, skinless poultry
ExerciseExercise
Improves insulin sensitivity/lowers BG Helps with weight control Lowers blood pressure Lowers LDL and triglycerides Raises HDL Improves circulation and strengthens heart Improves bone density Relieves stress, improves sleep

Complications = Restricted DietsComplications = Restricted Diets Nephropathy
protein restriction 0.8 g/kg/day potassium, phosphorus, sodium, fluid restrictions.
Gastroparesis small frequent meals lowfat, low fiber, puree/liquid consistency difficulty matching insulin kinetics and digestion
timing.
Dietary Management of Diabetes: Guidelines
Same as for the general population
Total fat: 30% or less of total energy (20% or less in obese) If elevated triglycerides, reduce CHO and increase fat to 35-
40% of energy Saturated fat -- 10% of total energy
Protein: 10 - 20% of total energy intake
CHO: 55% of total energy intake
Dietary Management of Diabetes: GuidelinesCarbohydrates and Sweeteners Emphasis on total CHO rather than simple or complex
Can have sucrose as part of CHO allotment up to a maximum of 10% of calories
Different foods have different effects on blood sugar level -- glycemic index
Nutrition Consult – Individualized Meal Planning Conduct Initial Assessment of Nutritional Status Diet History, Lifestyle, Eating Habit Provide Patient Education Regarding
Basic principles of diet therapy Meal planning Problem solving Developing individualized meal plan Emphasize one or two priorities Minimize changes from the patient’s usual diet
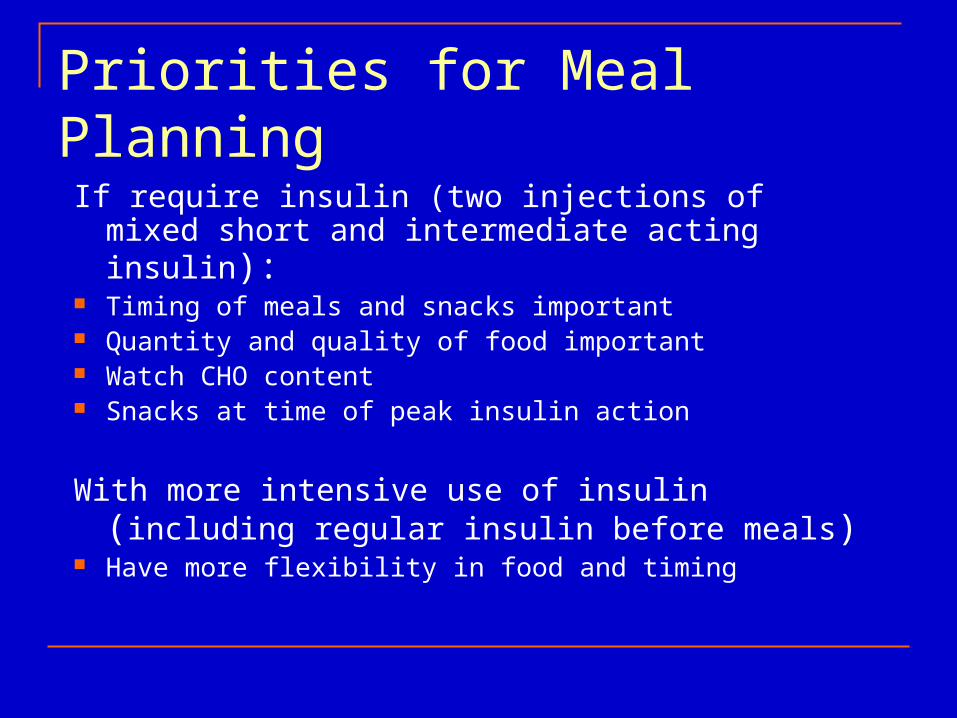
Priorities for Meal Planning
If require insulin (two injections of mixed short and intermediate acting insulin):
Timing of meals and snacks important Quantity and quality of food important Watch CHO content Snacks at time of peak insulin action
With more intensive use of insulin (including regular insulin before meals)
Have more flexibility in food and timing
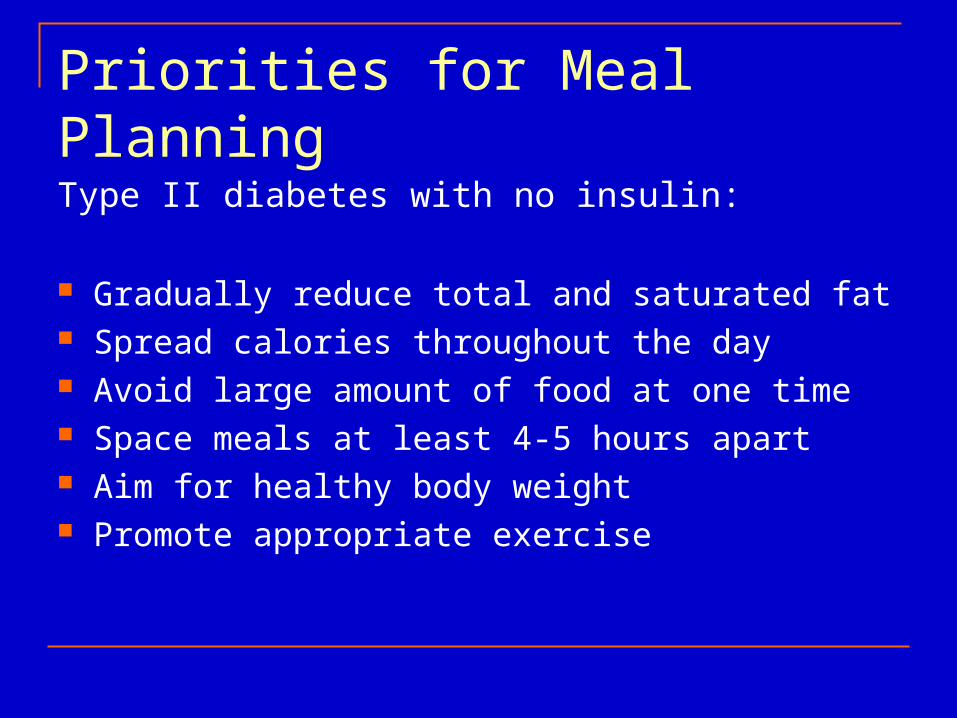
Priorities for Meal Planning
Type II diabetes with no insulin:
Gradually reduce total and saturated fat Spread calories throughout the day Avoid large amount of food at one time Space meals at least 4-5 hours apart Aim for healthy body weight Promote appropriate exercise

Diabetic Exchange System
Are tools for enabling food choices based on categories of foods and serving sizes
Patients need to be fairly literate Canadian and American and European systems differ
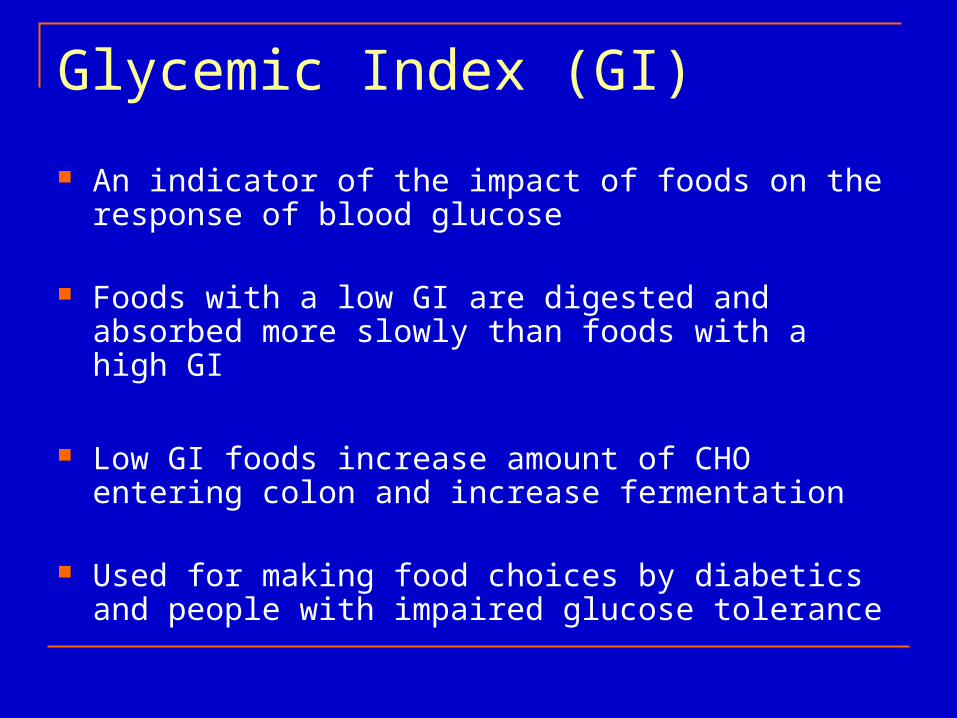
Glycemic Index (GI)
An indicator of the impact of foods on the response of blood glucose
Foods with a low GI are digested and absorbed more slowly than foods with a high GI
Low GI foods increase amount of CHO entering colon and increase fermentation
Used for making food choices by diabetics and people with impaired glucose tolerance
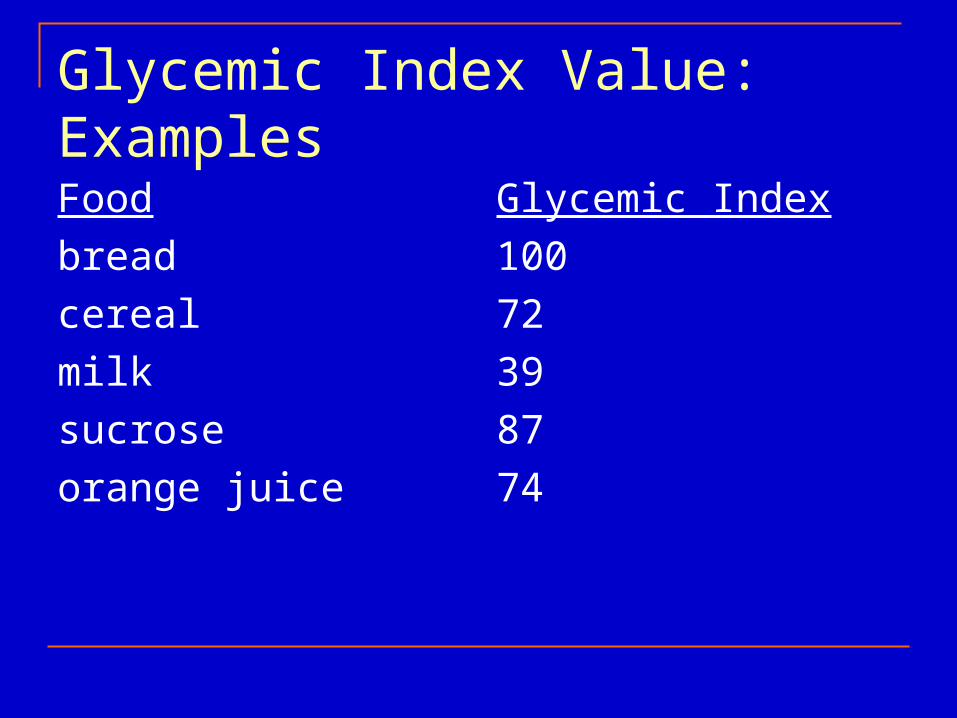
Glycemic Index Value: ExamplesFood
bread
cereal
milk
sucrose
orange juice
Glycemic Index
100
72
39
87
74
Artificial Sweeteners
Sugar alcohols (sorbitol, mannitol, xylitol cause less rise in blood glucose
Non-nutritive Sweeteners Aspartame (Equal, Nutrasweet, candarel) Saccharin (Sweet’n Low, Sugar Twin)
Alcohol Inake
Alcohol Moderate amounts can be consumed when diabetes
is well controlled
No more than two drinks per day
Should always take alcohol with food
Some Special Situations
Delayed meals Eat a snack if expect meal will be delayed
Carry available source of CHO i.e. Glucose tablets or
hard candy to avoid hypoglycemic reaction
Some Special Situations
Strenuous exercise Eat extra food before activity and take 15-30 grams of
CHO for every 30 min of strenuous activity (15 g CHO for each hour of less strenuous exercise)
Eat hearty snack after activity
If activity is pre-planned may reduce insulin dosage prior to activity
Some Special Situations
Illness Lack of appetite often with illness Substitute foods that are well tolerated Drink sugar containing liquids For each missed meal give 50 g CHO in small
frequent feedings over 3-4 hours Type I should not miss insulin as illness often causes
rise in blood glucose
Hypoglycemia: Treatment
Give quickly absorbed CHO immediately (1/3 can coke 33cl, 2 sugar cubes, 15 g glucose tablets)
Repeat treatment every 15-20 minutes if symptoms continue
If unconscious give intravenous glucose or glucagon injection
Diabetes in Children
75% of Type 1 diabetes occurs before 18 years Peak onset is 6 -11 years
Balance between allowing for normal growth and development, and need for glycemic control
Need meal plan that fits child’s lifestyle and promotes optimal compliance
Management Goals in Children Support normal growth and development Control blood glucose Prevent acute and chronic complications Achieve optimal nutritional status
Gestational Diabetes
Nutrition management similar to Type 1 and Type 2.
Diet tends to be slightly lower in CHO and higher in protein and fat (30-35%)
Requires individualized approach
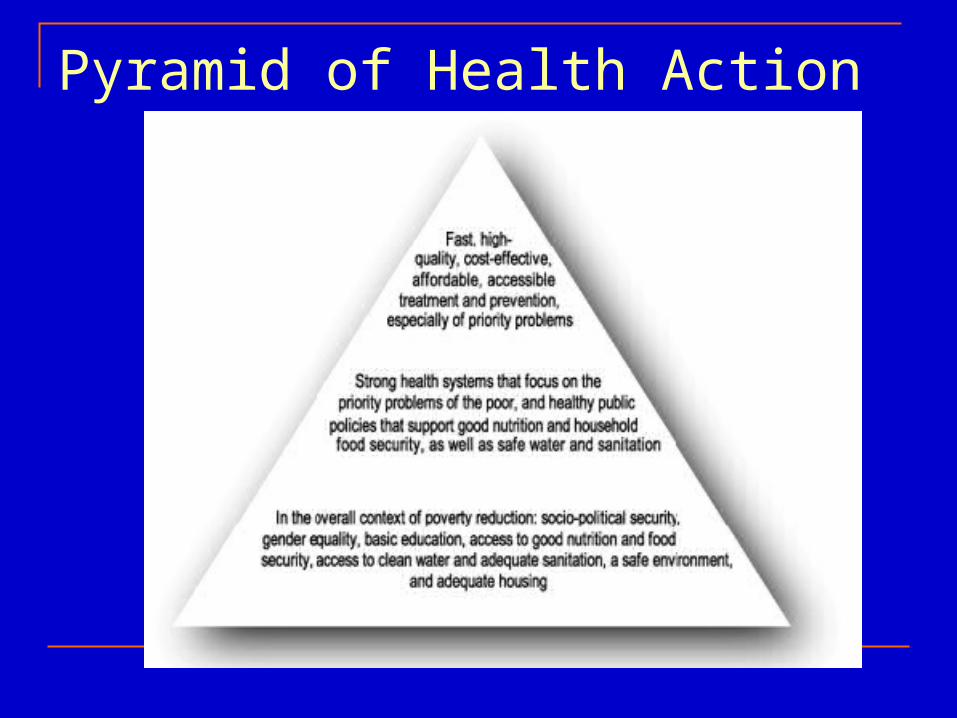
Pyramid of Health Action
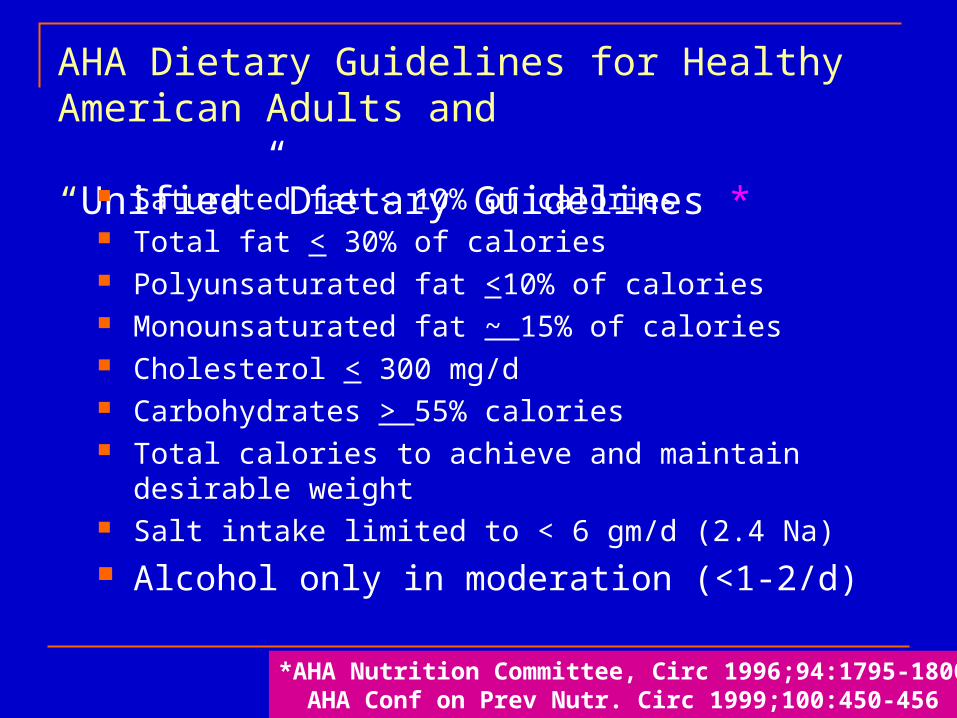
AHA Dietary Guidelines for Healthy American Adults and “Unified” Dietary Guidelines * Saturated fat < 10% of calories
Total fat < 30% of calories Polyunsaturated fat <10% of calories Monounsaturated fat ~ 15% of calories Cholesterol < 300 mg/d Carbohydrates > 55% calories Total calories to achieve and maintain desirable weight Salt intake limited to < 6 gm/d (2.4 Na) Alcohol only in moderation (<1-2/d)
*AHA Nutrition Committee, Circ 1996;94:1795-1800 AHA Conf on Prev Nutr. Circ 1999;100:450-456
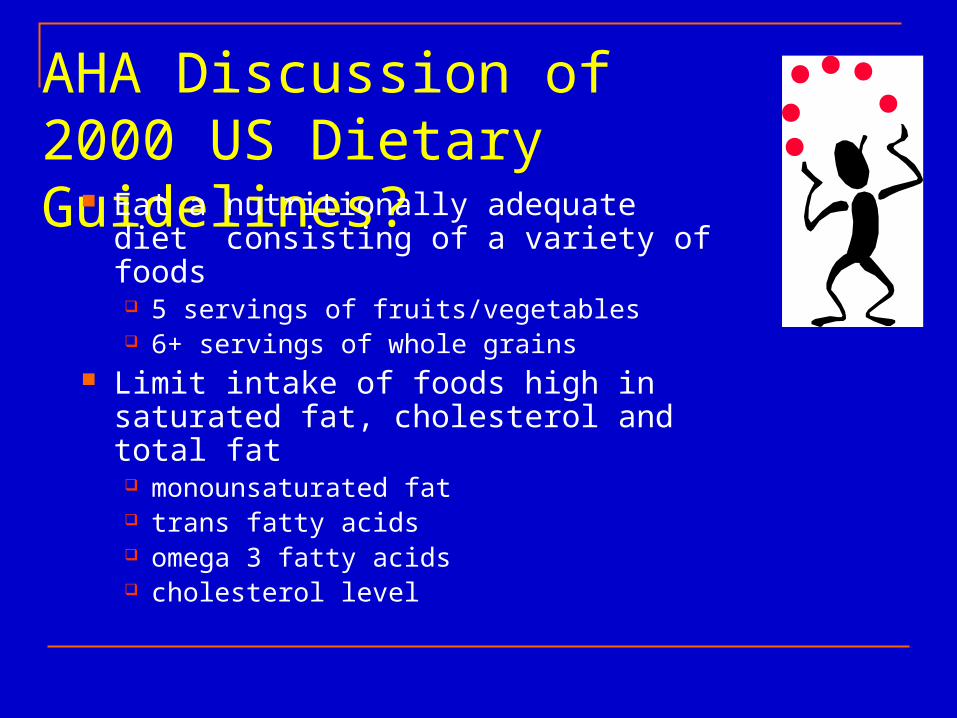
AHA Discussion of2000 US Dietary Guidelines? Eat a nutritionally adequate diet
consisting of a variety of foods 5 servings of fruits/vegetables 6+ servings of whole grains
Limit intake of foods high in saturated fat, cholesterol and total fat monounsaturated fat trans fatty acids omega 3 fatty acids cholesterol level
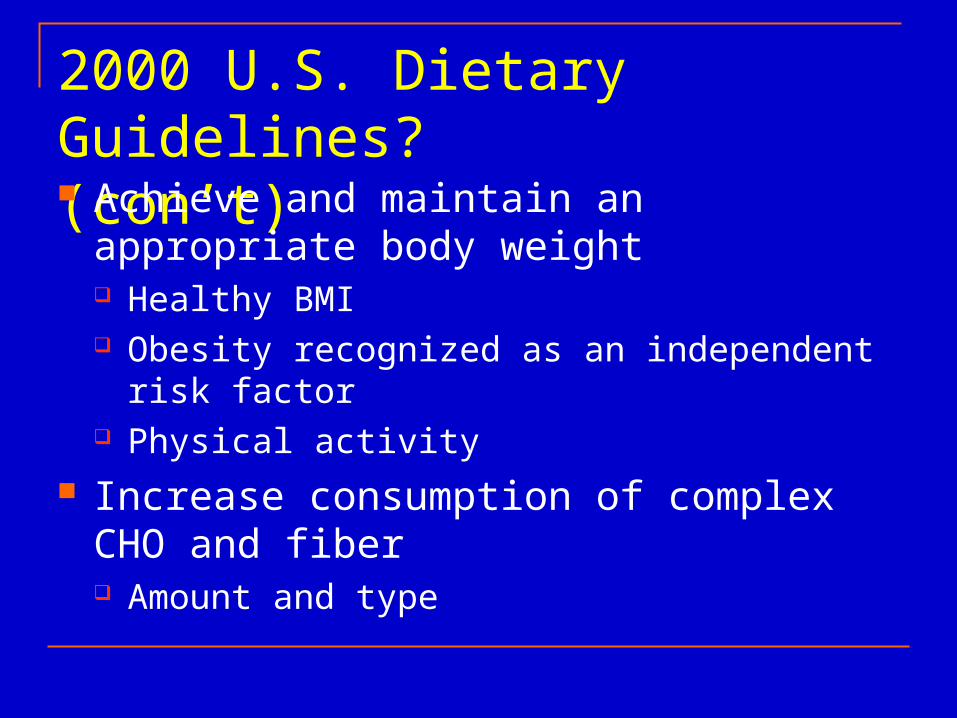
2000 U.S. Dietary Guidelines?(con’t) Achieve and maintain an appropriate body
weight Healthy BMI Obesity recognized as an independent risk factor Physical activity
Increase consumption of complex CHO and fiber Amount and type
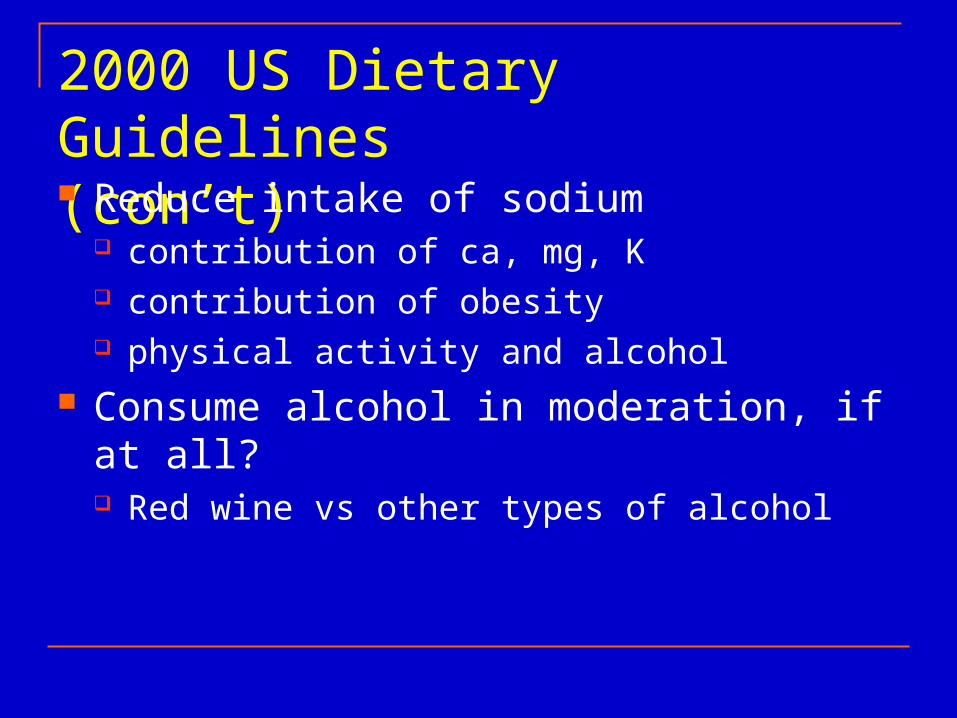
2000 US Dietary Guidelines(con’t) Reduce intake of sodium
contribution of ca, mg, K contribution of obesity physical activity and alcohol
Consume alcohol in moderation, if at all? Red wine vs other types of alcohol
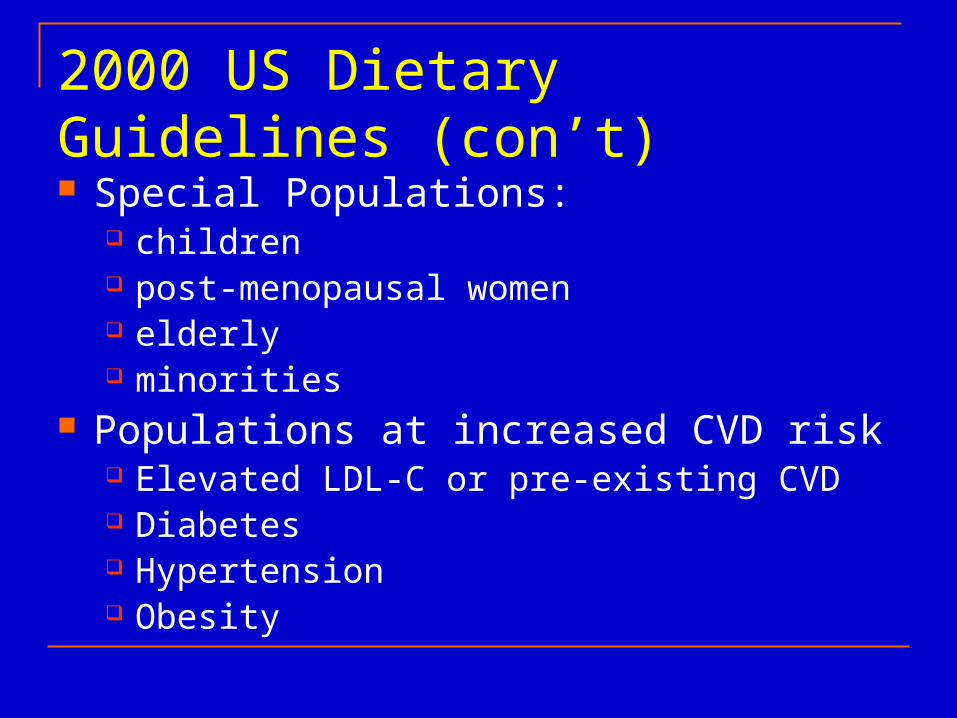
2000 US Dietary Guidelines (con’t) Special Populations:
children post-menopausal women elderly minorities
Populations at increased CVD risk Elevated LDL-C or pre-existing CVD Diabetes Hypertension Obesity
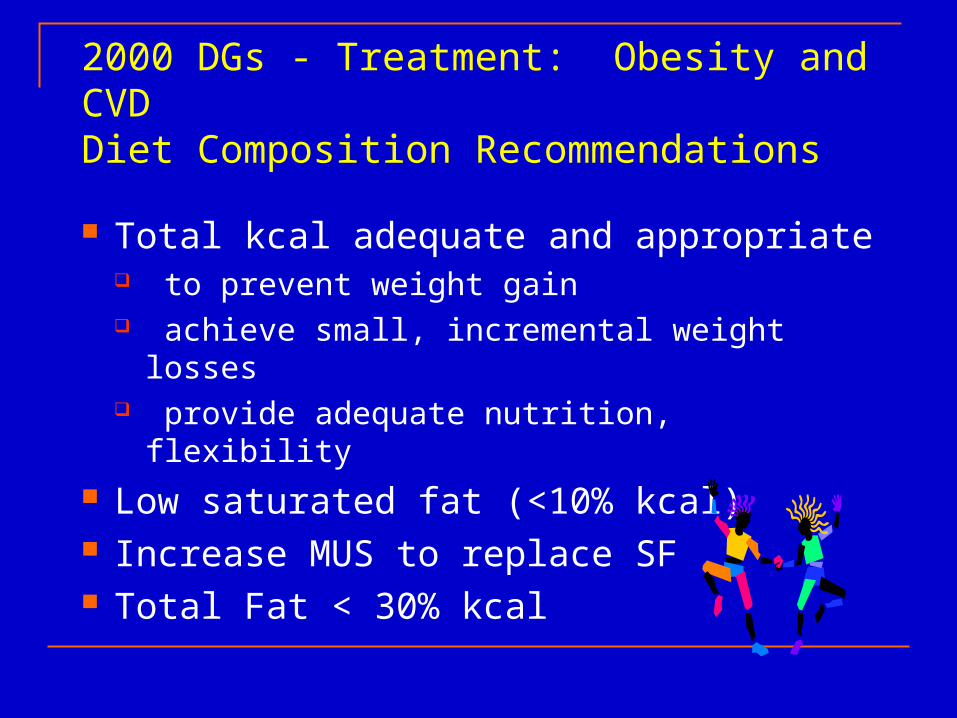
2000 DGs - Treatment: Obesity and CVD Diet Composition Recommendations
Total kcal adequate and appropriate to prevent weight gain achieve small, incremental weight losses provide adequate nutrition, flexibility
Low saturated fat (<10% kcal) Increase MUS to replace SF Total Fat < 30% kcal