Embed Size (px)
Citation preview
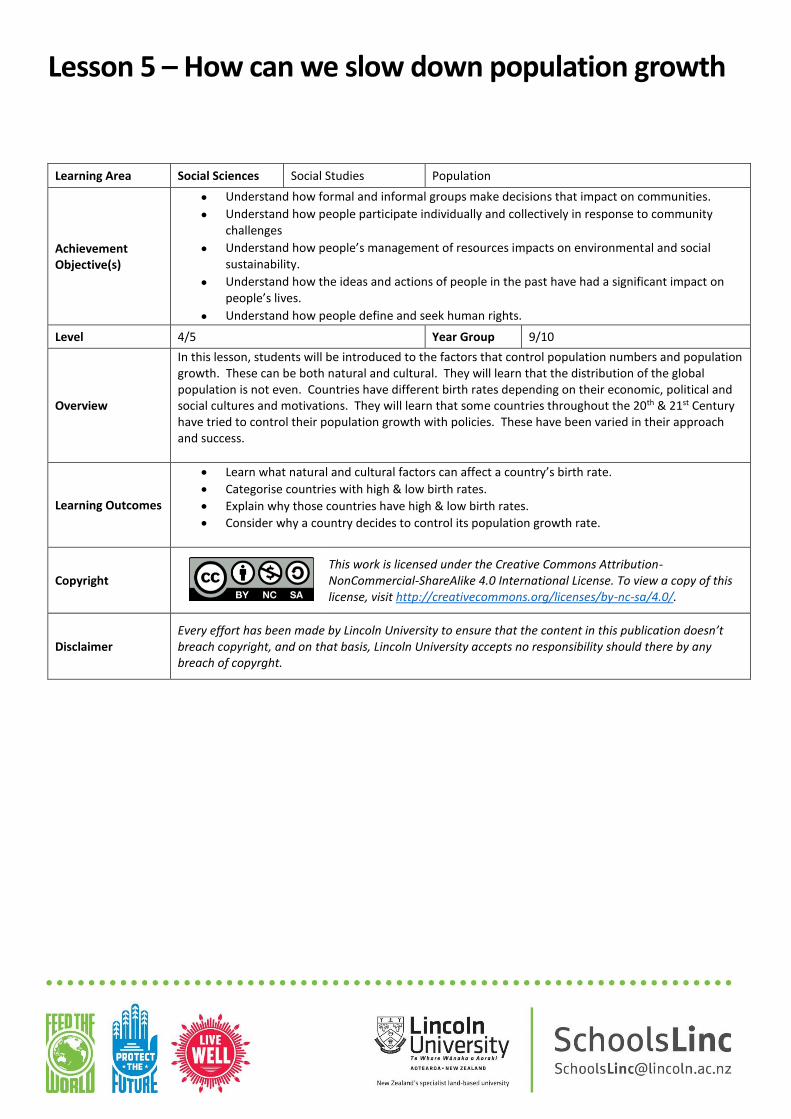
Lesson 5 – How can we slow down population growth
Learning Area Social Sciences Social Studies Population
Achievement Objective(s)
Understand how formal and informal groups make decisions that impact on communities.
Understand how people participate individually and collectively in response to community challenges
Understand how people’s management of resources impacts on environmental and social sustainability.
Understand how the ideas and actions of people in the past have had a significant impact on people’s lives.
Understand how people define and seek human rights.
Level 4/5 Year Group 9/10
Overview
In this lesson, students will be introduced to the factors that control population numbers and population growth. These can be both natural and cultural. They will learn that the distribution of the global population is not even. Countries have different birth rates depending on their economic, political and social cultures and motivations. They will learn that some countries throughout the 20th & 21st Century have tried to control their population growth with policies. These have been varied in their approach and success.
Learning Outcomes
Learn what natural and cultural factors can affect a country’s birth rate.
Categorise countries with high & low birth rates.
Explain why those countries have high & low birth rates.
Consider why a country decides to control its population growth rate.
Copyright This work is licensed under the Creative Commons Attribution-
NonCommercial-ShareAlike 4.0 International License. To view a copy of this license, visit http://creativecommons.org/licenses/by-nc-sa/4.0/.
Disclaimer Every effort has been made by Lincoln University to ensure that the content in this publication doesn’t breach copyright, and on that basis, Lincoln University accepts no responsibility should there by any breach of copyrght.
Lesson 5 Introduction
1. As an excellent introduction to methods of population change, I recommend the Population Jelly Babies
game from Geographyalltheway.com. I’ve had many successful lessons with this (and, of course, the
students can eat the ‘population’ at the end). Details can be found here.
2. Give the class 5-10 minutes to play the game (after introducing the rules etc…), this gives them enough time
to see how different population scenarios play out!
3. Give the class another 5 minutes to reflect and answer the questions in the worksheet.
Population Distribution
4. Patterns are a key part of geography and it is important to be able to recognise, describe and explain
patterns in population studies they need to know what sort of patterns to look for. Handout the worksheet
on patterns. Get students to try to describe the 5 main types of patterns on the worksheet, and then
identify which pattern is being shown in the four images on the right.
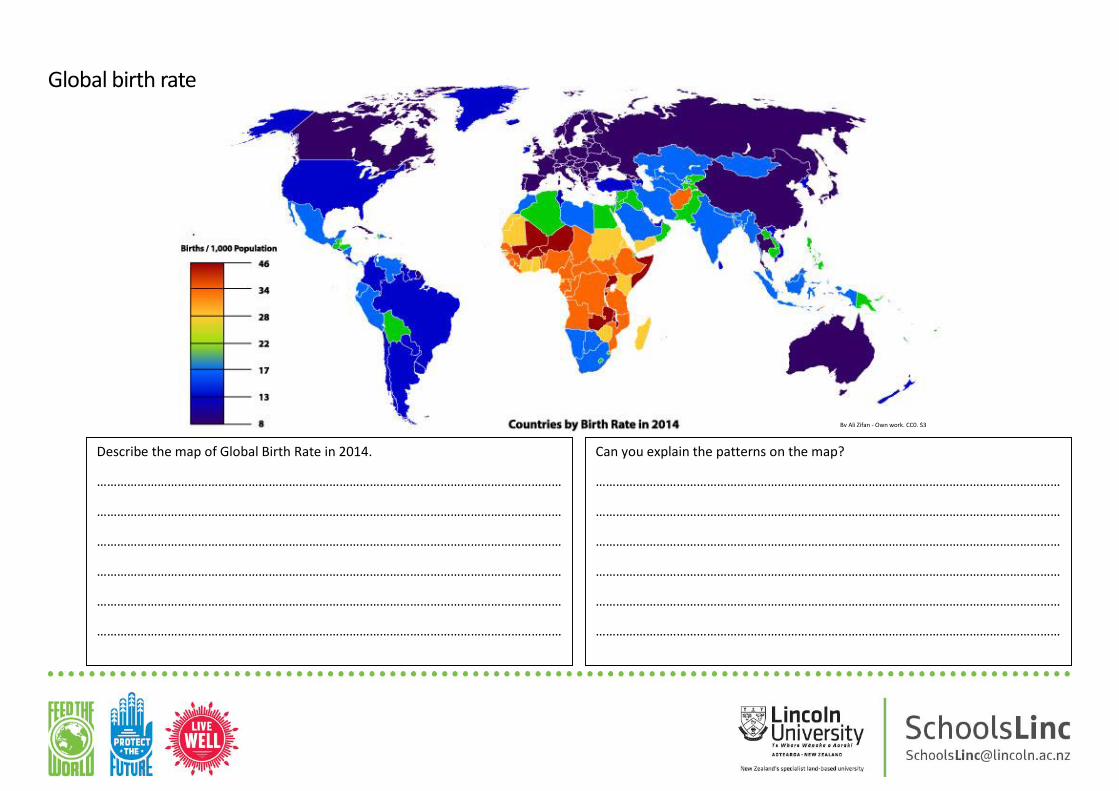
5. Students should then be given the map of global birth rates for 2014. Give them time to identify the
patterns and to describe what they see.
6. When they’ve described the patterns, they should try to explain the patterns that they see (this will be much
harder, so you could use a group brainstorm for this!).
Characteristics of Countries
7. This part of the lesson is designed to get the students to understand the reasons that countries have high
and low birth rates.
8. On the worksheet, students should look at the global map, and try to identify what characteristics link those
countries that have high and low birth rates. Collate this information for the class, after a class discussion.
How does population of a country change?
9. Think back to the jelly babies game, ask students to re-read their answers to the birth rate and death rate
questions – discuss these with the class.
So, how can we slow down the global population growth?
10. Explain that, over time, there have been numerous ways that countries have ‘influenced’ the growth of their
population. The most famous example is China’s One Child Policy. Political intervention in population
growth falls into 2 categories: Pro-Natalist or Anti-Natalist. Explain to the class the two main policies (but
don’t give them the examples!).
Pro-Natalist Anti-Natalist
The encouragement of families to have children. Examples: Singapore, Denmark, France
The prevention of families from having children. Examples: China, India
11. During a whole-class brainstorm, ask ‘how can countries affect their population growth?’ Collate student
answers on the whiteboard. Allow them to ‘think creatively’, so all answers are valid (if workable or
morally/ethically dubious!).
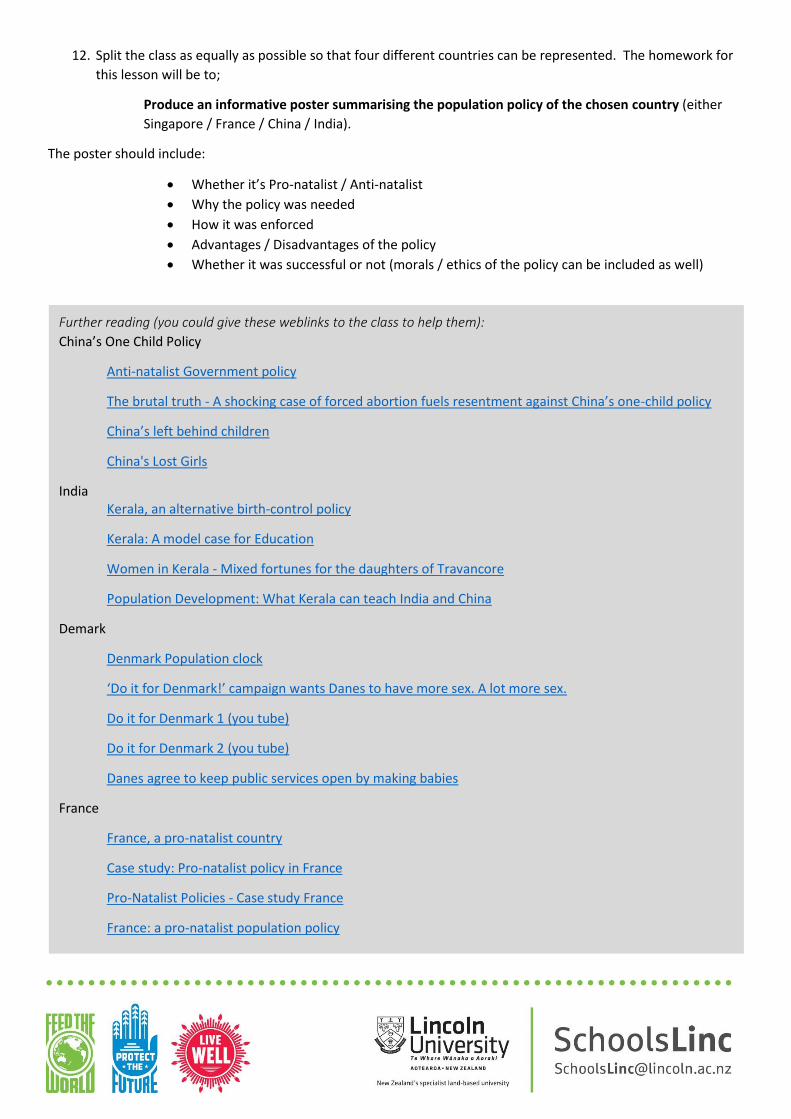
12. Split the class as equally as possible so that four different countries can be represented. The homework for
this lesson will be to;
Produce an informative poster summarising the population policy of the chosen country (either
Singapore / France / China / India).
The poster should include:
Whether it’s Pro-natalist / Anti-natalist
Why the policy was needed
How it was enforced
Advantages / Disadvantages of the policy
Whether it was successful or not (morals / ethics of the policy can be included as well)
Further reading (you could give these weblinks to the class to help them):
China’s One Child Policy
Anti-natalist Government policy
The brutal truth - A shocking case of forced abortion fuels resentment against China’s one-child policy
China’s left behind children
China's Lost Girls
India Kerala, an alternative birth-control policy
Kerala: A model case for Education
Women in Kerala - Mixed fortunes for the daughters of Travancore
Population Development: What Kerala can teach India and China
Demark
Denmark Population clock
‘Do it for Denmark!’ campaign wants Danes to have more sex. A lot more sex.
Do it for Denmark 1 (you tube)
Do it for Denmark 2 (you tube)
Danes agree to keep public services open by making babies
France
France, a pro-natalist country
Case study: Pro-natalist policy in France
Pro-Natalist Policies - Case study France
France: a pro-natalist population policy
Note to teacher - before the start of the next lesson
In preparation for the debate, you should split the class into equal groups to debate the following statement.
The whole world should adopt a ‘one-child policy’.
Split the class into 8 equal groups to represent the following perspectives on this issue.
Religious Political Economic Social Environmental
Healthcare (GPs) Developed Country Developing Country
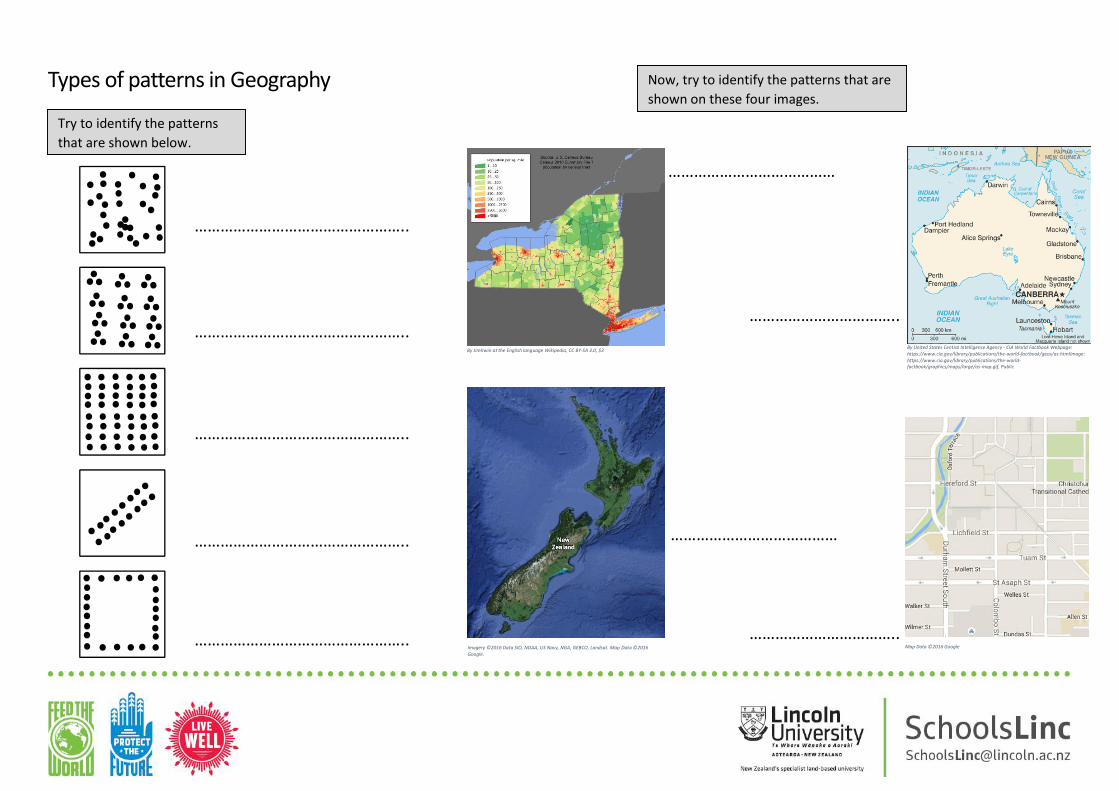
Types of patterns in Geography
…………………………………………..
…………………………………………..
…………………………………………..
…………………………………………..
…………………………………………..
By JimIrwin at the English language Wikipedia, CC BY-SA 3.0, $3
…………………………………
By United States Central Intelligence Agency - CIA World Factbook Webpage: https://www.cia.gov/library/publications/the-world-factbook/geos/as.htmlImage: https://www.cia.gov/library/publications/the-world-factbook/graphics/maps/large/as-map.gif, Public
……………………………..
Imagery ©2016 Data SIO, NOAA, US Navy, NGA, GEBCO, Landsat. Map Data ©2016 Google.
…………………………………
Now, try to identify the patterns that are
shown on these four images.
Try to identify the patterns
that are shown below.
Map Data ©2016 Google
……………………………..
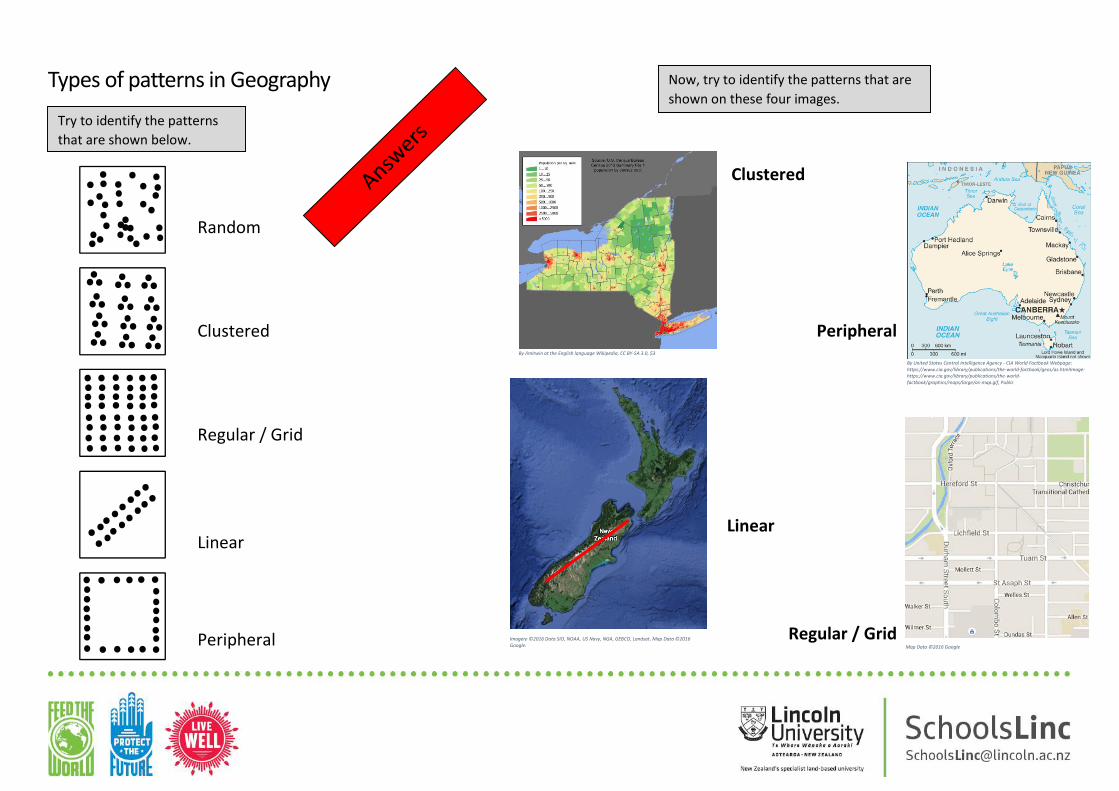
Types of patterns in Geography
Random
Clustered
Regular / Grid
Linear
Peripheral
By JimIrwin at the English language Wikipedia, CC BY-SA 3.0, $3
Clustered
By United States Central Intelligence Agency - CIA World Factbook Webpage: https://www.cia.gov/library/publications/the-world-factbook/geos/as.htmlImage: https://www.cia.gov/library/publications/the-world-factbook/graphics/maps/large/as-map.gif, Public
Peripheral
Imagery ©2016 Data SIO, NOAA, US Navy, NGA, GEBCO, Landsat. Map Data ©2016 Google.
Linear
Now, try to identify the patterns that are
shown on these four images.
Try to identify the patterns
that are shown below.
Map Data ©2016 Google
Regular / Grid
By Ali Zifan - Own work, CC0, $3
Global birth rate
Describe the map of Global Birth Rate in 2014.
…………………………………………………………………………………………………………………………
…………………………………………………………………………………………………………………………
…………………………………………………………………………………………………………………………
…………………………………………………………………………………………………………………………
…………………………………………………………………………………………………………………………
…………………………………………………………………………………………………………………………
Can you explain the patterns on the map?
…………………………………………………………………………………………………………………………
…………………………………………………………………………………………………………………………
…………………………………………………………………………………………………………………………
…………………………………………………………………………………………………………………………
…………………………………………………………………………………………………………………………
…………………………………………………………………………………………………………………………
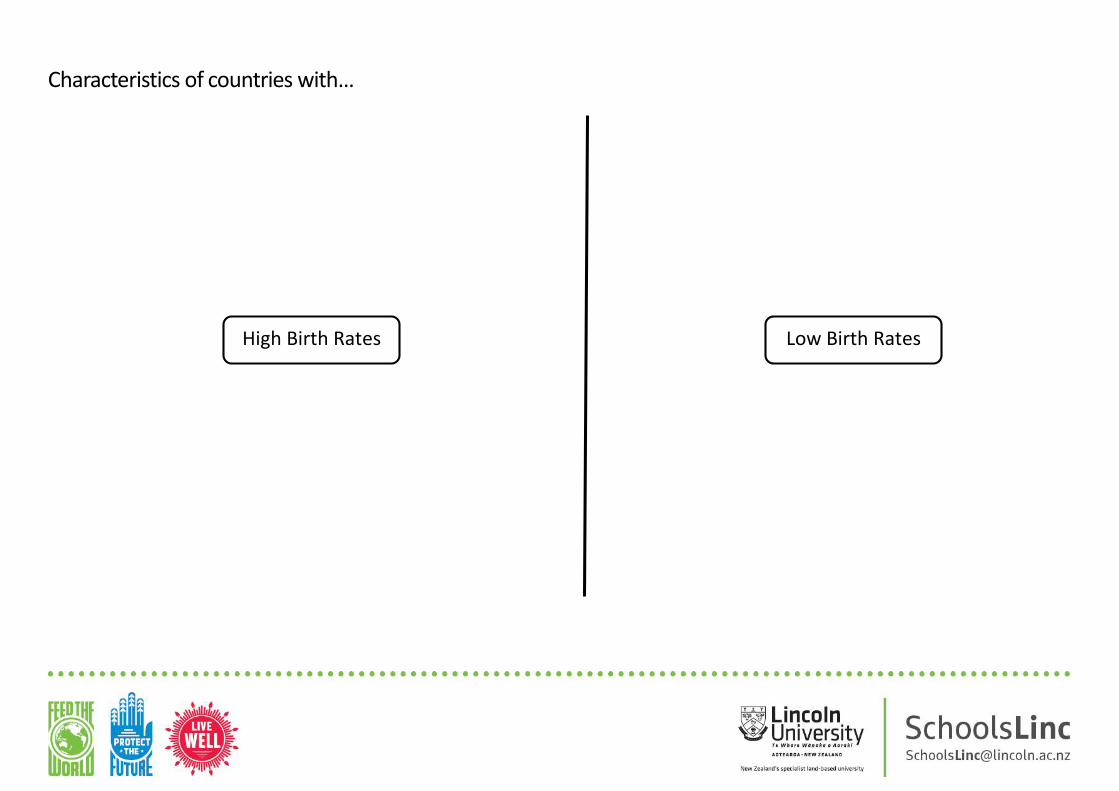
Characteristics of countries with…
High Birth Rates Low Birth Rates
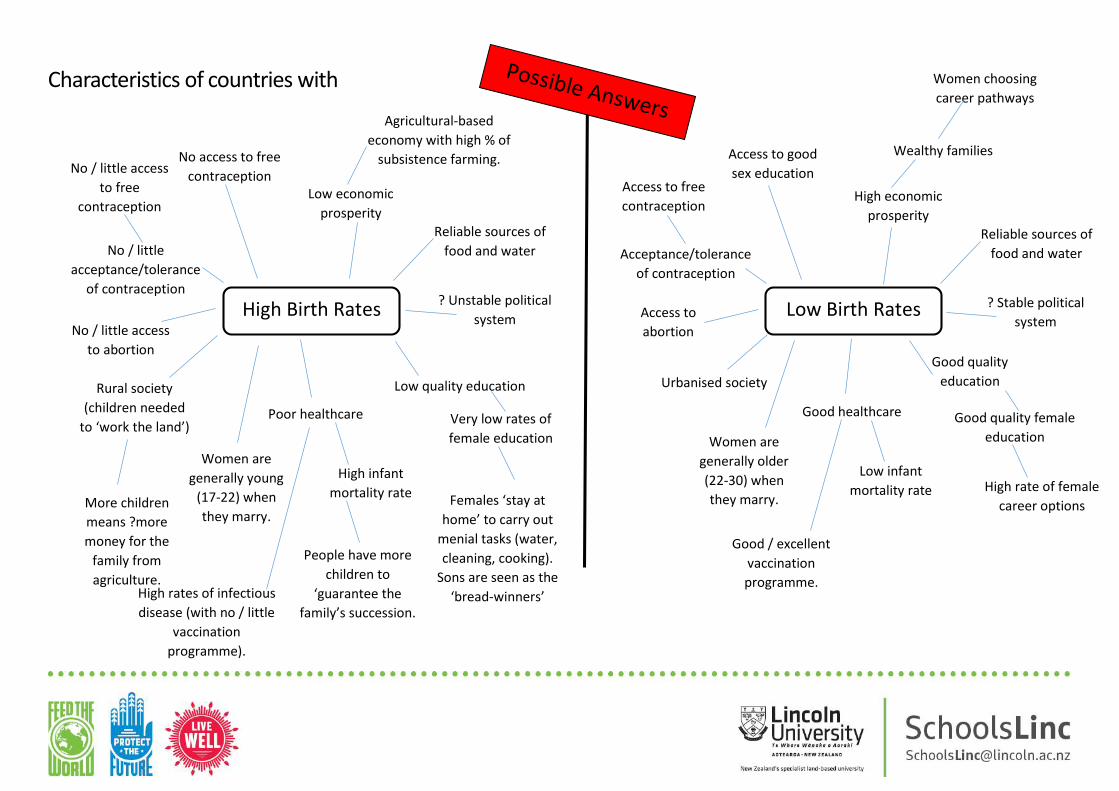
Characteristics of countries with
High Birth Rates Low Birth Rates
Access to free
contraception
Access to good
sex education
Low infant
mortality rate
Good healthcare
Acceptance/tolerance
of contraception
High economic
prosperity
Reliable sources of
food and water
Access to
abortion
Good quality
education
Good quality female
education
More children
means ?more
money for the
family from
agriculture.
Wealthy families
High rate of female
career options
? Stable political
system
Women choosing
career pathways
Rural society
(children needed
to ‘work the land’)
Urbanised society
High infant
mortality rate
Poor healthcare
People have more
children to
‘guarantee the
family’s succession.
Low quality education
Very low rates of
female education
Females ‘stay at
home’ to carry out
menial tasks (water,
cleaning, cooking).
Sons are seen as the
‘bread-winners’
Women are
generally older
(22-30) when
they marry.
Women are
generally young
(17-22) when
they marry.
No / little access
to free
contraception
No / little
acceptance/tolerance
of contraception
No / little access
to abortion
No access to free
contraception
Agricultural-based
economy with high % of
subsistence farming.
Reliable sources of
food and water
? Unstable political
system
High rates of infectious
disease (with no / little
vaccination
programme).
Good / excellent
vaccination
programme.
Low economic
prosperity