Embed Size (px)
Citation preview

8/11/2019 Lesson 15_Graph of a Quadratic Function...
http://slidepdf.com/reader/full/lesson-15graph-of-a-quadratic-function 1/10
The Graph of aQuadratic
FunctionQuadratic Functions
Mr. Rolando B. Magat,Jr.
MAT - Math

8/11/2019 Lesson 15_Graph of a Quadratic Function...
http://slidepdf.com/reader/full/lesson-15graph-of-a-quadratic-function 2/10
The graph of quadratic function f(x) = ax 2 + bx + c isthe same as the graph of the quadratic equationy = ax 2 + bx + c .
Properties of the Graph of f(x) = ax 2 + bx + c
1. If a is positive, then the parabola opens upward .
2. If a is negative, then the parabola opensdownward .
Graph of a Quadratic Function

8/11/2019 Lesson 15_Graph of a Quadratic Function...
http://slidepdf.com/reader/full/lesson-15graph-of-a-quadratic-function 3/10
b
2a2
4ac b4a
3. The vertex has an x – coordinate of and
y – coordinate of .
Properties of the Graphof f(x) = ax
2
+ bx + c
4. The axis of symmetry is the vertical line . b
x2a
Graph of a Quadratic Function

8/11/2019 Lesson 15_Graph of a Quadratic Function...
http://slidepdf.com/reader/full/lesson-15graph-of-a-quadratic-function 4/10
6. If x = h, then it is called the axis of symmetryand if y = k, then it is called the highest orlowest value of the function.
bh
2a
24ac bk
4a
5. The highest or lowest point of a parabola is thevertex of the parabola denoted by an
ordered pair (h, k) where
Properties of the Graphof f(x) = ax
2
+ bx + c
Graph of a Quadratic Function
8/11/2019 Lesson 15_Graph of a Quadratic Function...
http://slidepdf.com/reader/full/lesson-15graph-of-a-quadratic-function 5/10
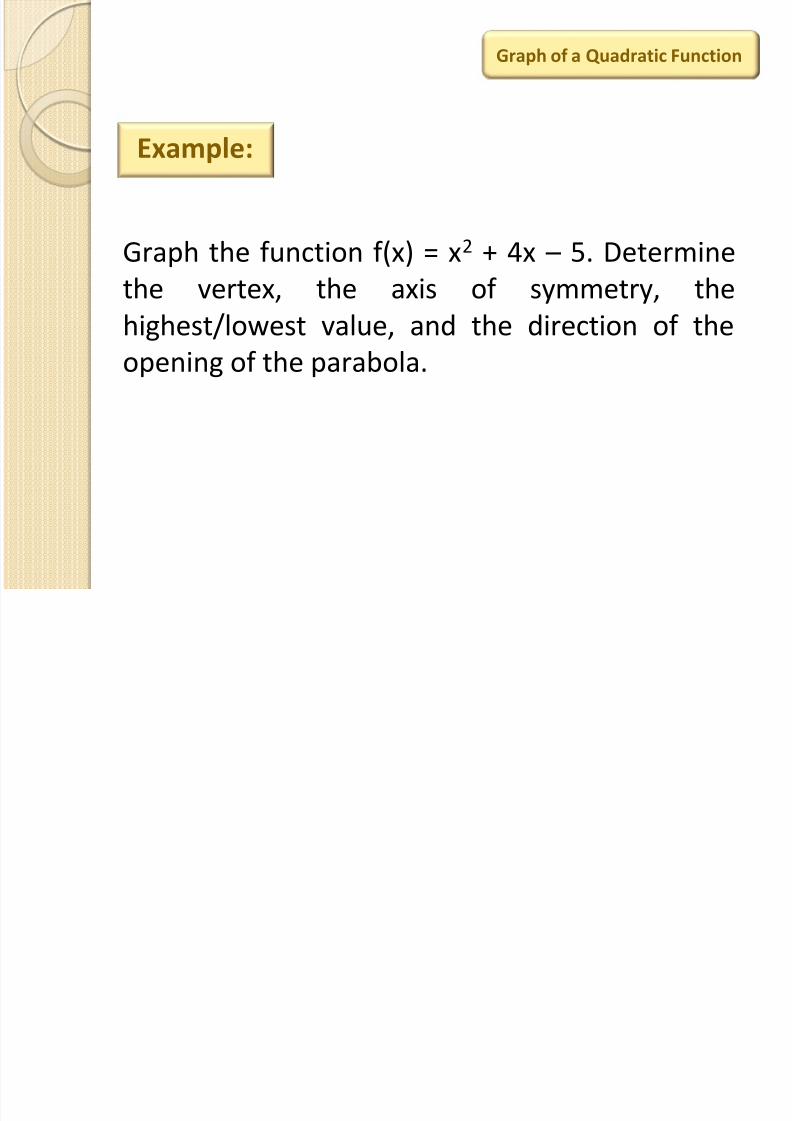
Graph the function f(x) = x 2 + 4x – 5. Determinethe vertex, the axis of symmetry, thehighest/lowest value, and the direction of theopening of the parabola.
Example:
Graph of a Quadratic Function

8/11/2019 Lesson 15_Graph of a Quadratic Function...
http://slidepdf.com/reader/full/lesson-15graph-of-a-quadratic-function 6/10
Solution:
Step 1: Determine the coordinates of the vertex.
f(x) = x2 + 4x – 5
a = 1; b = 4; c = -5
2b 4ac bVertex ,
2a 4a
24 4(1)( 5) (4),
2(1) 4(1)
= (-2, -9)
Graph of a Quadratic Function

8/11/2019 Lesson 15_Graph of a Quadratic Function...
http://slidepdf.com/reader/full/lesson-15graph-of-a-quadratic-function 7/10
Step 2: Construct the table of values.
-3
-4
-1
0
-5
-8
This is the vertex of theparabola. (-2, -9)-2 -9
-8
-5
(-4, -5)
(-3, -8)
(-1, -8)
(0, -5)
= (-4)2 + 4(-4) – 5
= (-3)2 + 4(-3) – 5
= (-1)2 + 4(-1) – 5
= (0)2 + 4(0) – 5
Graph of a Quadratic Function

8/11/2019 Lesson 15_Graph of a Quadratic Function...
http://slidepdf.com/reader/full/lesson-15graph-of-a-quadratic-function 8/10
Step 3: Plot and connect the given pointsin the Cartesian plane.
Direction: Upward
Vertex: (-2, -9)
Axis of Symmetry: x = -2
Highest/Lowest Value: -9
Graph of a Quadratic Function

8/11/2019 Lesson 15_Graph of a Quadratic Function...
http://slidepdf.com/reader/full/lesson-15graph-of-a-quadratic-function 9/10
Problem Set:
A. Determine the direction of the opening of thegraph, the vertex, axis of symmetry and thehighest/lowest value for each of the following
quadratic functions.

8/11/2019 Lesson 15_Graph of a Quadratic Function...
http://slidepdf.com/reader/full/lesson-15graph-of-a-quadratic-function 10/10
B. Sketch the graph of the quadratic function f(x) =x2 – 8x + 16 and determine the direction of theopening of the graph, the vertex, axis of symmetryand the maximum/minimum value.
Graph of a Quadratic Function