Embed Size (px)
Citation preview
Lesson 1 - R
Summary to
Exploring Data

Objectives• Use a variety of graphical techniques to display a
distribution. These should include bar graphs, pie charts, stemplots, histograms, ogives, time plots, and Boxplots
• Interpret graphical displays in terms of the shape, center, and spread of the distribution, as well as gaps and outliers
• Use a variety of numerical techniques to describe a distribution. These should include mean, median, quartiles, five-number summary, interquartile range, standard deviation, range, and variance

Objectives• Interpret numerical measures in the context of the
situation in which they occur
• Learn to identify outliers in a data set
• Explore the effects of a linear transformation of a data set

Vocabulary• none new

Statistical Plots
• Stemplot– stem and leaf from Algebra– remember back-to-back for comparisons
• Boxplot– know how to use (will use it a lot in course)
• Histogram• Dotplot• Normality Plot (will learn later)• Pie Chart• Bar Graph

Describing Distributions
• Shape– symmetric, skewed (left or right), multi-modal
• Outliers– do they exist, how many, and on which ends
• Center– appropriate measure (mean, median, or mode)
• Spread– appropriate measure (standard deviation or IQR)
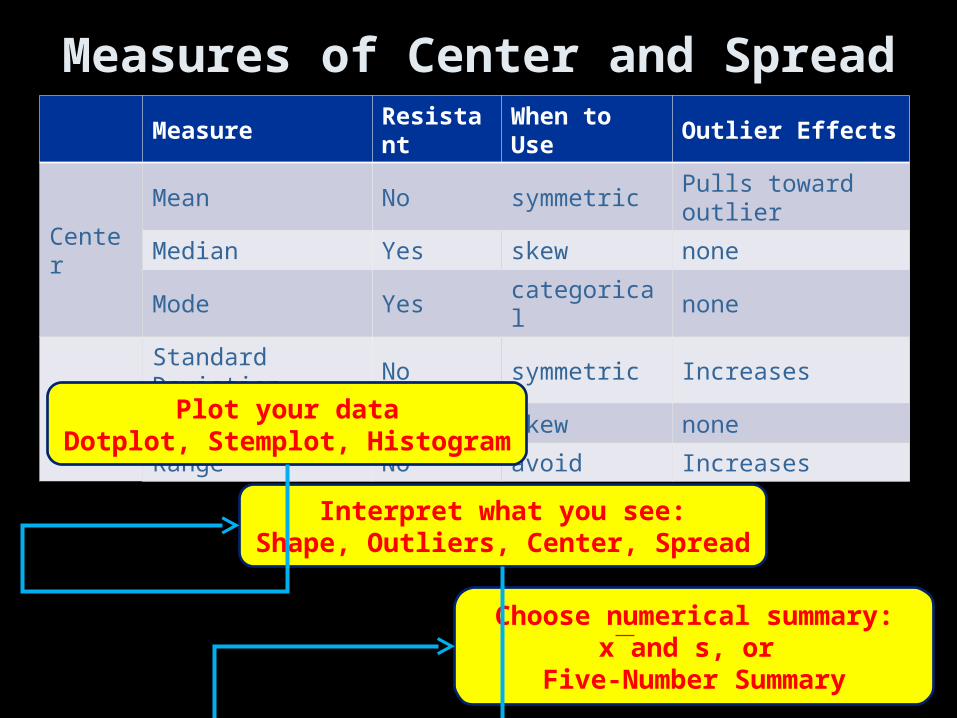
Measures of Center and SpreadMeasure Resistant When to Use Outlier Effects
Center
Mean No symmetric Pulls toward outlier
Median Yes skew none
Mode Yes categorical none
Spread
Standard Deviation No symmetric Increases
IQR Yes Skew none
Range No avoid Increases
Plot your dataDotplot, Stemplot, Histogram
Interpret what you see:Shape, Outliers, Center, Spread
Choose numerical summary:x and s, or
Five-Number Summary

Numerical Statistical Summaries
• 5 Number Summary from 1-VarStats– Min– Q1 (25th percentile of the dataset)– Q2 (Median, 50th percentile of the dataset)– Q3 (75th percentile of the dataset)– Max
• IQR = Q3 – Q1• Outliers values
– less than Q1 - 1.5IQR– more than Q3 + 1.5IQR
• Mean and Standard Deviation from 1-VarStats

TI-83 Help
• Use Lists to keep track of data for other work
• 1 Var Stats (mean, standard deviation, 5 number summary)
• Stat Plot (Box plots, histogram, dot plot)– ZoomStat
• Comparative Plots (turn plot1 and plot2 on)

Data Analysis Toolbox
To answer a statistical question of interest:Data: Organize and Examine (W5HW)
Who are the individuals described?What are the variables?Why were the data gathered?When, Where, How, and By Whom were data gathered?
Graph: Construct an appropriate graphical displayComparative Graphs (boxplots, stemplots, histograms)Describe SOCS
•Numerical Summary: Appropriate center & spread Calculate Mean and Standard DeviationCalculate 5 number summary
Interpretation: Answer question in context!
Summary and Homework
• Summary– Data Analysis is the art of describing data in
context using graphs and numerical summaries. – The purpose is to describe the most important
features of a dataset (SOCS)
• Homework– pg

Problem 1
The upper or third quartile for grades on the first calculus test was 85%. Your friend, who has not taken statistics, scored 90% on the test. Explain to your friend how her grade compares to others in her class.
Since the 3rd quartile (75% ranking) was 85%, her grade of 90% is better than at least 75% of the class.

Problem 2
Suppose you have test scores of 72%, 91%, 86%, and 95% in your chemistry class. What score do you need to make on the next test in order to have an 85% average?
5 85 = 425
72 + 91 + 86 + 95 = 344
425 – 344 = 81

Problem 3
In the computational formula for standard deviation, you sometimes use n and sometimes use (n – 1). Under what circumstances should you use n?
We use n-1 for sample standard deviation because we lose one degree of freedom for the estimate of the population mean with the sample mean.
If we have the entire population (a census), then our sample mean is the population mean and we can divide by n in calculating the standard deviation.

Problem 4
(a) We studied two measures of central tendency, mean and median. Which of these is the more resistant measure? _________________ Explain why this measure is more resistant.
(b) We studied three measures of spread: standard deviation, interquartile range, and range. Which of these is the most resistant measure? ________________IQR
median
because they are least affected by outliers
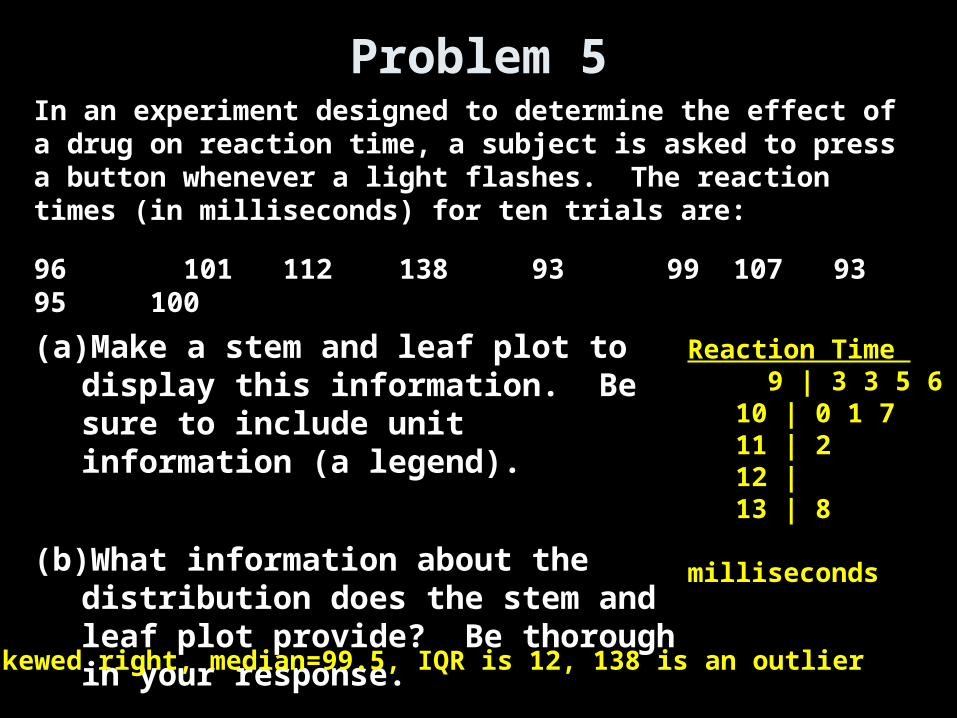
Problem 5In an experiment designed to determine the effect of a drug on reaction time, a subject is asked to press a button whenever a light flashes. The reaction times (in milliseconds) for ten trials are:
96 101 112 138 93 99 107 93 95 100
(a) Make a stem and leaf plot to display this information. Be sure to include unit information (a legend).
(b) What information about the distribution does the stem and leaf plot provide? Be thorough in your response.
Reaction Time 9 | 3 3 5 6 9 10 | 0 1 7 11 | 2 12 | 13 | 8
milliseconds
skewed right, median=99.5, IQR is 12, 138 is an outlier

Problem 6
Data were collected on a sample of Deerfield Academy students. Several of the variables are listed below. Next to each variable, put all of the following words that correctly describe the variable:
Categorical quantitative discrete continuous
(a) Advisor ______________________________
(b) Height _______________________________
(c) Number of courses student is taking this term ______________________________________
categorical
quantitative continuous
quantitative discrete

Problem 7
A teacher returned the first test to the five students in a small class. She reported that the median score was 85 and the mean score was 84. The student with the lowest score (62) realized that the teacher had incorrectly calculated her grade and that the correct grade was 72. Assuming that this is still be the lowest score for the seminar students, when the teacher recomputed the summary statistics, the median will equal _____________ and the mean will equal ________________ .
85
median doesn’t change because order is unaffected by rescoring
84 + 2 = 86
mean is recalculated by dividing 10 additional points by 5 = 2 and adding 2 points to the mean

Problem 8
The histogram below displays weight increases (in pounds) for a sample of pigs fed a certain diet. Assume that bars include right endpoints.
(a) How many pigs were in this sample? ___________
(b) Estimate the median weight increase for the pigs in this sample. __________
(c) What proportion of these pigs had a weight increase exceeding 20 pounds? _________________
(d) Briefly (but completely) describe the shape of this distribution
5 + 8 + 5 + 3 + 2 = 23
12th ranked – 10-15 lb
5/23 = 21.74%
unimodal skewed right

Problem 9
As I drove through Connecticut several weeks ago, I obtained a sample of prices for a gallon of unleaded gasoline at service stations I passed. Four of these are provided here: $3.09, $3.15, $3.19, $3.29. Use the definition and show work below to find the mean and standard deviation of these prices. Round answers to the nearest cent.
(a)Mean
(b)Standard deviation
1/n ∑xi
¼ (3.09 + 3.15 + 3.19 + 3.29) = 3.18
Var = 1/(n-1)∑(xi - mean)² ⅓ [(3.09-3.18)² + (3.15-3.18)² + (3.19-3.18)² + (3.29-3.18)² ]⅓ [(-.09)² + (-.03)² + (.01)² + (.11)² ] = ⅓ .0212 = 0.007067Std dev = √Var = √0.007067 = 0.8406

Problem 10The Los Angeles Times reported interest rates for savings accounts at a sample of California banks. Summary statistics are provided below:
Minimum = 3.15% Q1 = 3.25% Median = 3.31%Q3 = 3.33% Maximum = 4.35%
Determine whether the data set has any outliers (check for extremely low and high values). Show work and provide an explanation to support your answer.
LF = Q1 – 1.5IQR = 3.25 – 1.5 0.08 = 3.13%
Since the max is greater than UF, the data has at least one outlier.
IQR = Q3 – Q1 = 0.08% UF = Q3 + 1.5IQR = 3.33 – 1.5 0.08 = 3.45%