Embed Size (px)
Citation preview

Global Ozone Project
Curriculum
Rev 13 Jessa Ellenburg and John Birks
Lesson 1: Air Pollution Basics
Learning Objectives
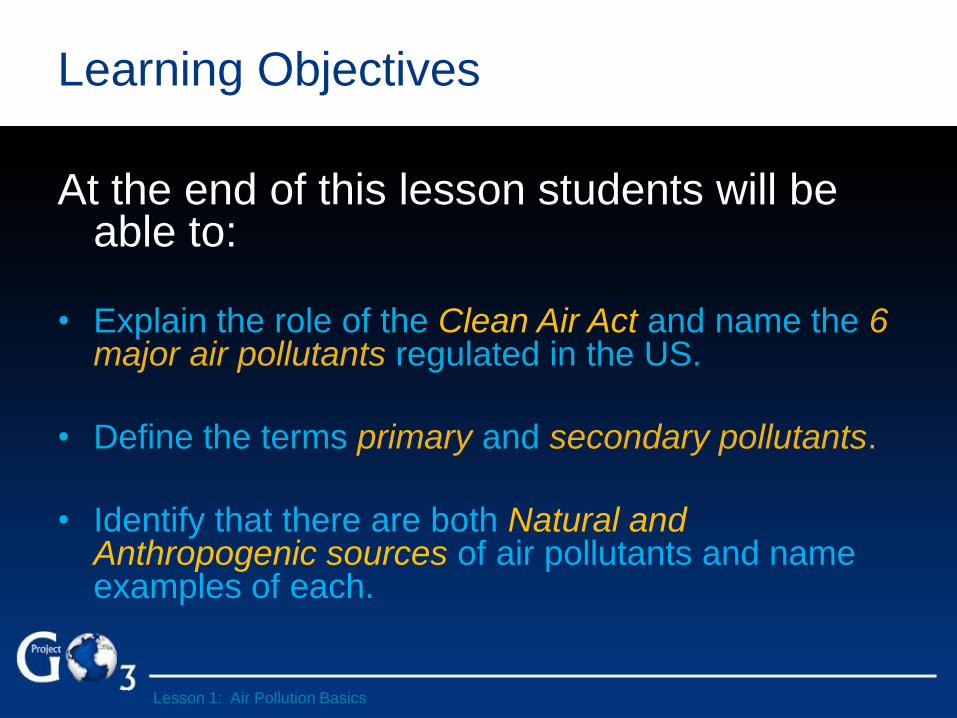
At the end of this lesson students will be able to:
• Explain the role of the Clean Air Act and name the 6 major air pollutants regulated in the US.
• Define the terms primary and secondary pollutants.
• Identify that there are both Natural and Anthropogenic sources of air pollutants and name examples of each.
Lesson 1: Air Pollution Basics
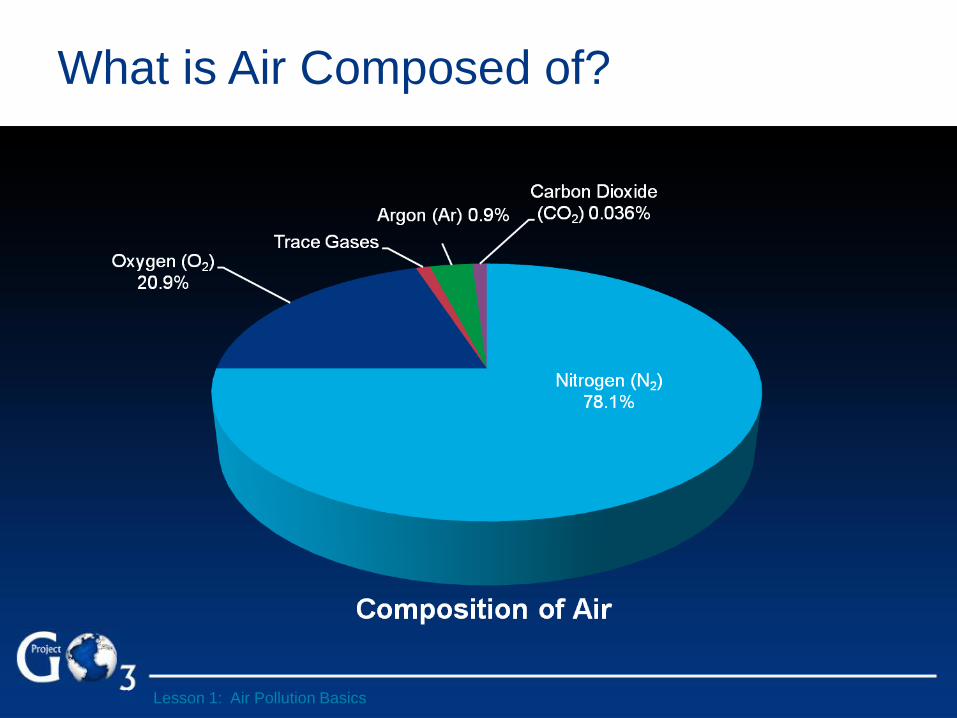
What is Air Composed of?
Lesson 1: Air Pollution Basics
What is Air Pollution?
Air Pollutant: Any substance emitted to or
produced in the atmosphere as a result of
human activity in sufficient quantity to cause
harm to plants, animals or materials.
Harm can be direct: human health effects, reduced crop yields,
damage to rubber products such as tires, erosion of marble
sculpture, etc.
Or indirect: e.g., climate change
Lesson 1: Air Pollution Basics

Air Pollution + Stagnant Weather Can
Spell Disaster
Lesson 1: Air Pollution Basics
An air pollution episode killed 20 people, and half the town's 14,000 residents became ill due to emissions from industrial facilities and stagnant weather conditions.
1948 in Donora, PA
1948: Donora, PA at NOON
Air Pollution + Stagnant Weather Can
Spell Disaster
Lesson 1: Air Pollution Basics
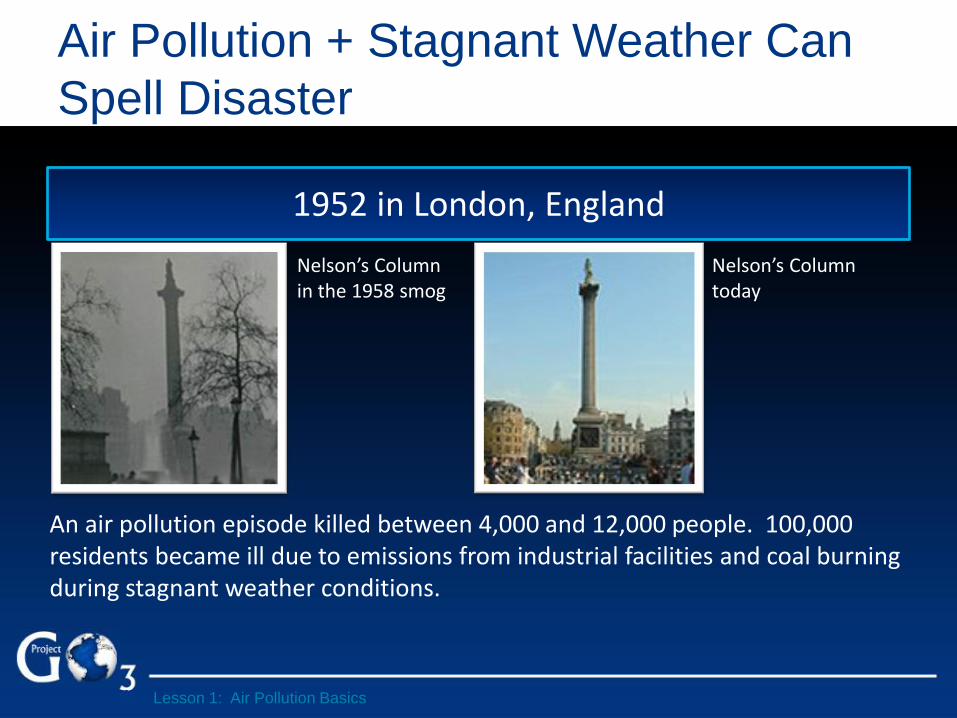
An air pollution episode killed between 4,000 and 12,000 people. 100,000 residents became ill due to emissions from industrial facilities and coal burning during stagnant weather conditions.
1952 in London, England
Nelson’s Column in the 1958 smog
Nelson’s Column today
Clean Air Act
• After the deadly US air pollution event of 1948, it was
clear that air quality needed to be regulated to ensure
that such severe pollution events didn’t happen again.
• The US passed the first Clean Air Act in 1963.
• The Clean Air Act of 1970 gave the US Environmental
Protection Agency (EPA) the authority to regulate air
pollution and identified six Criteria Pollutants to monitor.
Lesson 1: Air Pollution Basics

Clean Air Act
Six Criteria Air Pollutants to monitor:
Lesson 1: Air Pollution Basics
Carbon Monoxide (CO)
Lead (Pb)
Nitrogen Dioxide (NO2)
Particulate Matter (PM2.5 and PM10)
Ozone (O3)
Sulfur Dioxide (SO2)
Examples of Sources for the Six Criteria
Pollutants
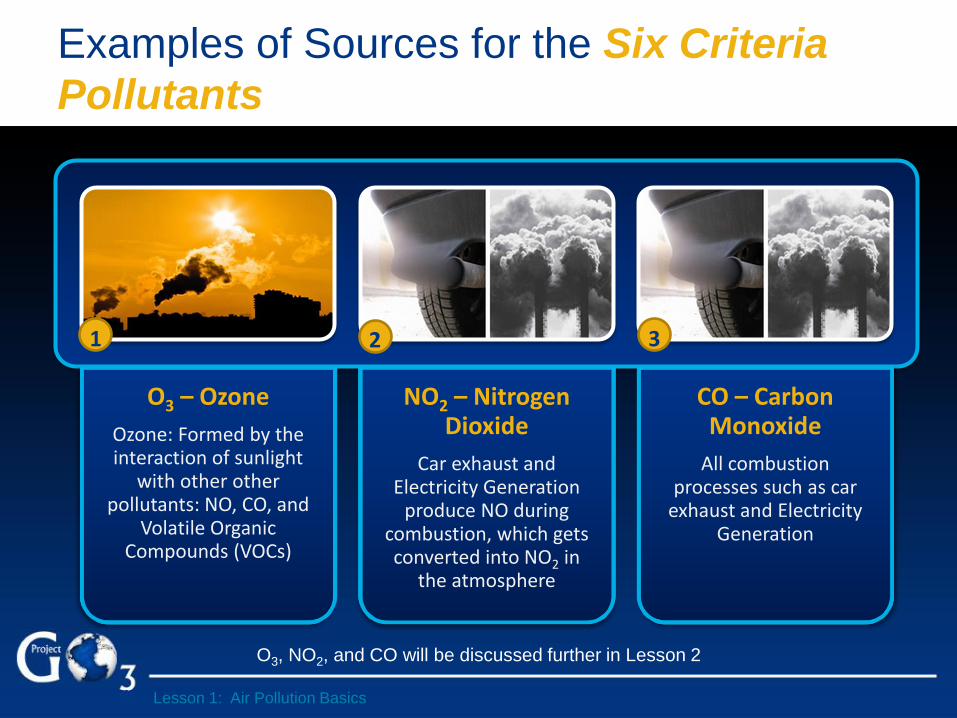
O3 – Ozone
Ozone: Formed by the interaction of sunlight
with other other pollutants: NO, CO, and
Volatile Organic Compounds (VOCs)
NO2 – Nitrogen Dioxide
Car exhaust and Electricity Generation
produce NO during combustion, which gets converted into NO2 in
the atmosphere
CO – Carbon Monoxide
All combustion processes such as car
exhaust and Electricity Generation
Lesson 1: Air Pollution Basics
O3, NO2, and CO will be discussed further in Lesson 2
1 2 3

Examples of Sources for the Six Criteria
Pollutants
PM2.5,10 – Particulate Matter
Car Exhaust, Electricity Generation, Fires, and
Road dust
Pb – Lead
Iron smelters and other industrial processes.
Before it was banned, leaded gasoline was a major contributor to
lead in the atmosphere.
SO2 – Sulfur Dioxide
Electricity Generation from burning of coal.
Lesson 1: Air Pollution Basics
O3, NO2, and CO will be discussed further in Lesson 2
4 5 6
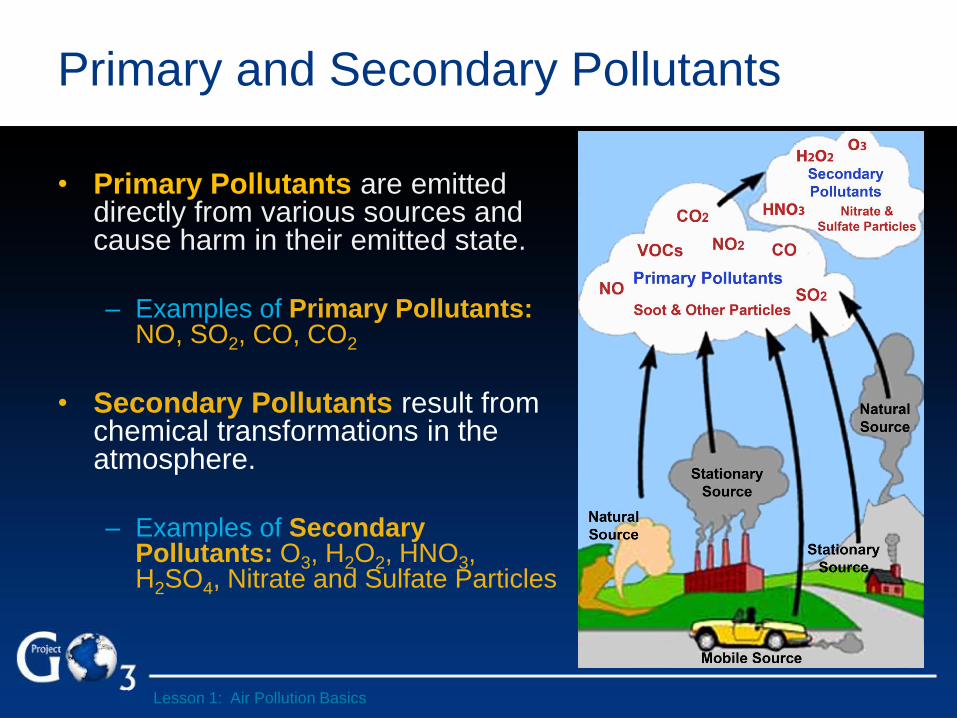
Primary and Secondary Pollutants
• Primary Pollutants are emitted directly from various sources and cause harm in their emitted state.
– Examples of Primary Pollutants:
NO, SO2, CO, CO2
• Secondary Pollutants result from chemical transformations in the atmosphere.
– Examples of Secondary
Pollutants: O3, H2O2, HNO3, H2SO4, Nitrate and Sulfate Particles
Lesson 1: Air Pollution Basics
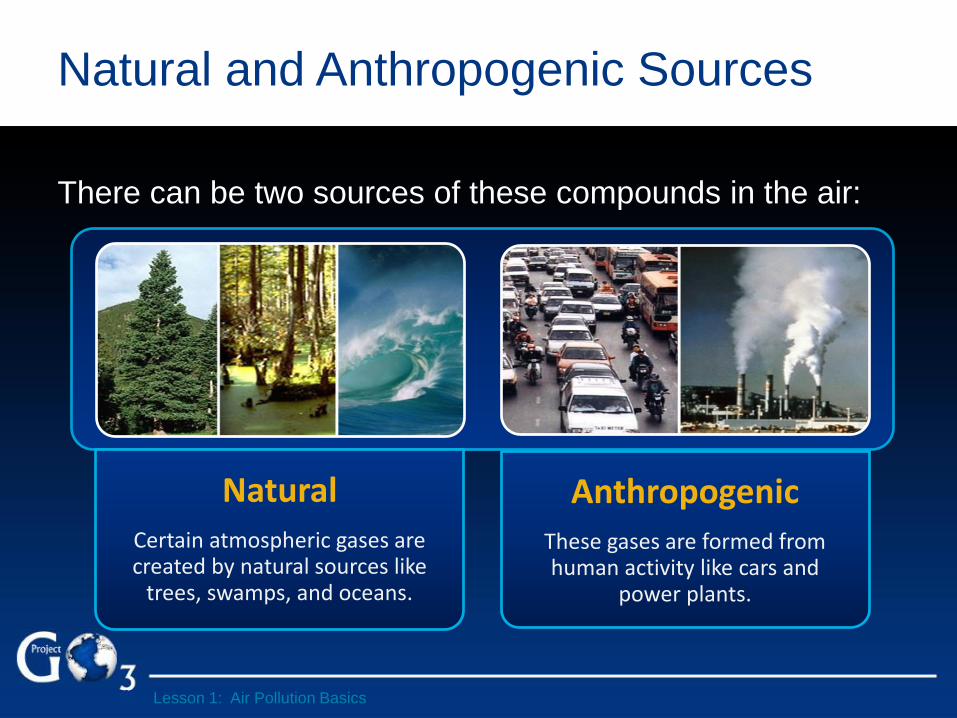
Natural and Anthropogenic Sources
There can be two sources of these compounds in the air:
Natural Certain atmospheric gases are created by natural sources like
trees, swamps, and oceans.
Anthropogenic These gases are formed from human activity like cars and
power plants.
Lesson 1: Air Pollution Basics
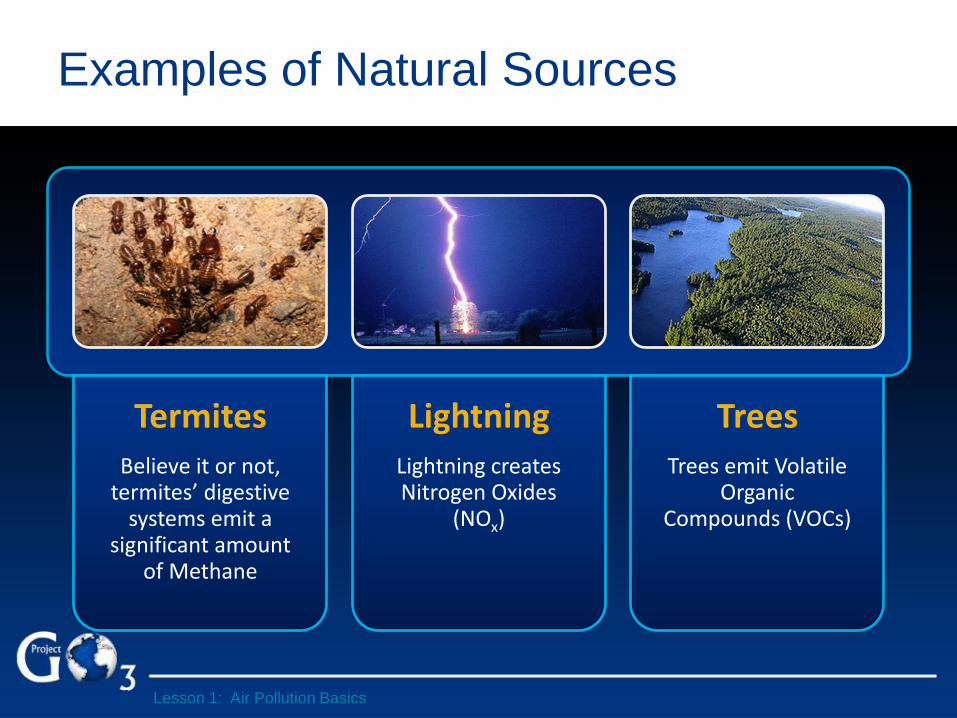
Examples of Natural Sources
Termites Believe it or not,
termites’ digestive systems emit a
significant amount of Methane
Lightning Lightning creates Nitrogen Oxides
(NOx)
Trees Trees emit Volatile
Organic Compounds (VOCs)
Lesson 1: Air Pollution Basics
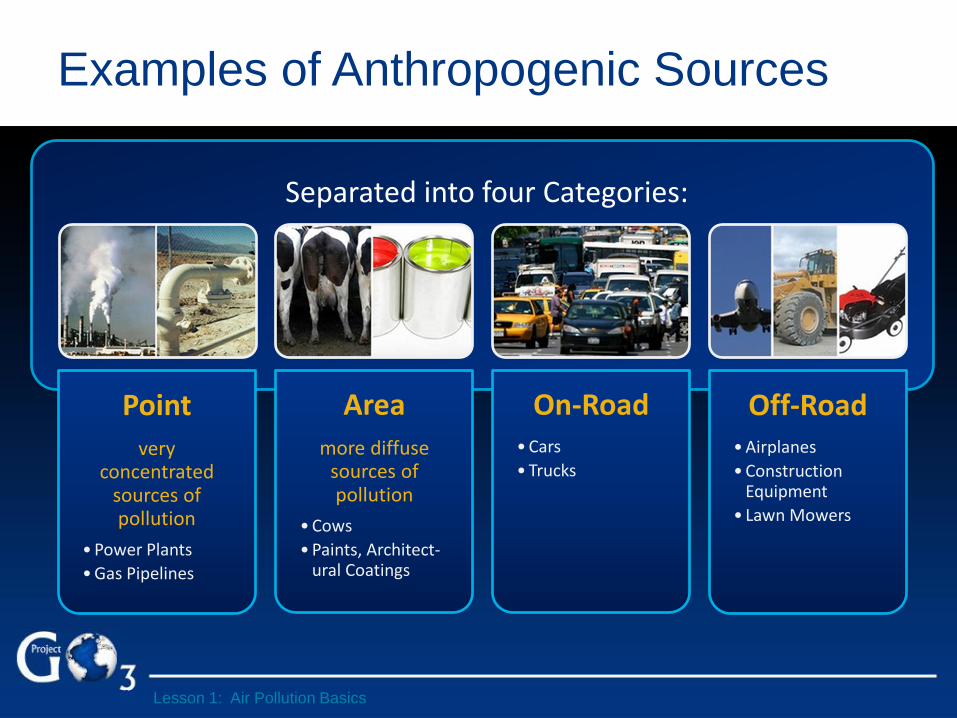
Examples of Anthropogenic Sources
Point
very concentrated
sources of pollution
• Power Plants
• Gas Pipelines
Area more diffuse
sources of pollution
• Cows
• Paints, Architect-ural Coatings
On-Road • Cars
• Trucks
Off-Road • Airplanes
• Construction Equipment
• Lawn Mowers
Lesson 1: Air Pollution Basics
Separated into four Categories:
Air Quality Index
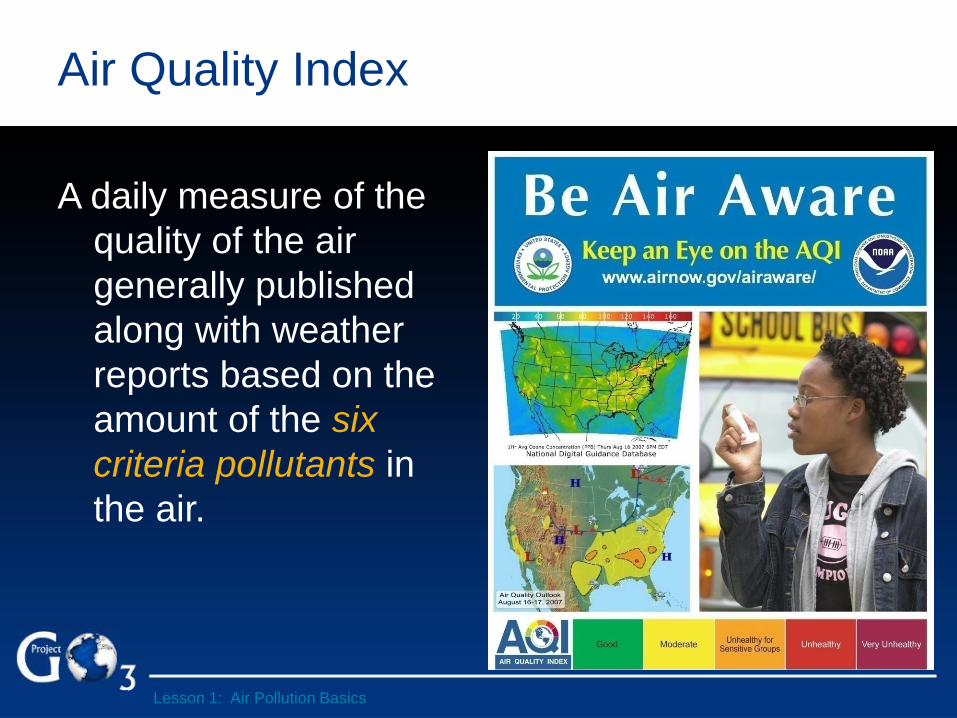
A daily measure of the
quality of the air
generally published
along with weather
reports based on the
amount of the six
criteria pollutants in
the air.
Lesson 1: Air Pollution Basics

Air Quality Index
Levels of Health Concern
Lesson 1: Air Pollution Basics
0-50
51-100
101-150
151 – 200
201- 300
> 300
• Good – Air Quality is considered satisfactory, and air pollution poses little or no risk.
• Moderate – Air Quality is acceptable; however, for some pollutants there may be a moderate
health concern for a very small number of people who are unusually sensitive to air pollution.
• Unhealthy for Sensitive Groups – Members of sensitive groups may experience health effects. The general public is not likely to be affected.
• Unhealthy – Everyone may begin to experience health effects; members of sensitive groups may experience more serious health effects.
• Very Unhealthy – Health alert: everyone may experience more serious health effects.
• Hazardous – Health warnings of emergency conditions. The entire population is more likely to be affected.
Numerical Value • Meaning
A daily measure of the quality of the air generally published along with weather reports based on the amount of the six criteria pollutants in the air.
Global Ozone Project
Curriculum
Rev 13
Lesson 2: Ozone Formation in the Troposphere

Learning Objectives
At the end of this lesson students will be able to:
• Identify the difference between ozone in the
stratosphere and the troposphere.
• List the ingredients that result in formation of ground
level ozone.
• Describe the role sunlight plays in the formation of
ground level ozone.
Lesson 2: Ozone Formation in the Troposphere
Our Atmosphere
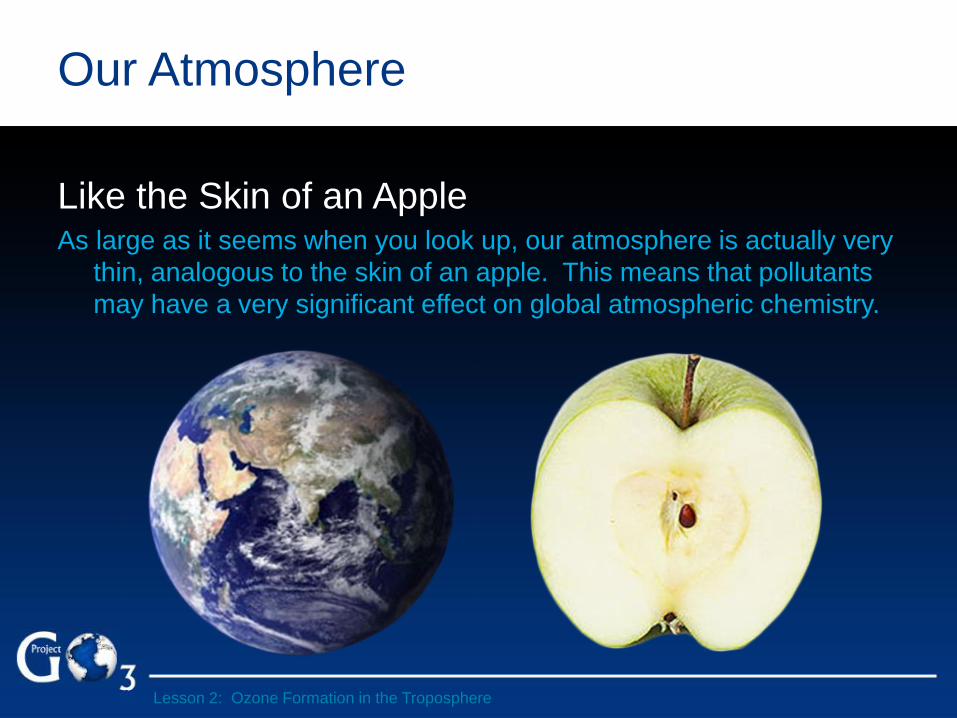
Like the Skin of an Apple As large as it seems when you look up, our atmosphere is actually very
thin, analogous to the skin of an apple. This means that pollutants
may have a very significant effect on global atmospheric chemistry.
Lesson 2: Ozone Formation in the Troposphere
Layers of the Atmosphere
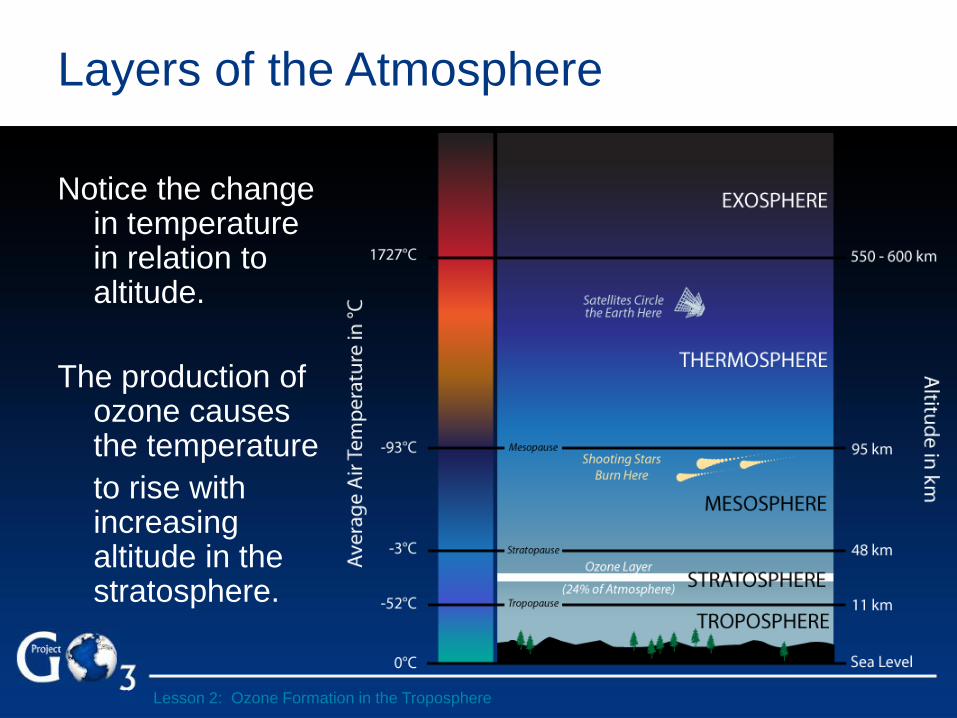
Notice the change in temperature in relation to altitude.
The production of ozone causes the temperature
to rise with increasing altitude in the stratosphere.
Lesson 2: Ozone Formation in the Troposphere
The Difference Between Stratospheric
and Tropospheric Ozone
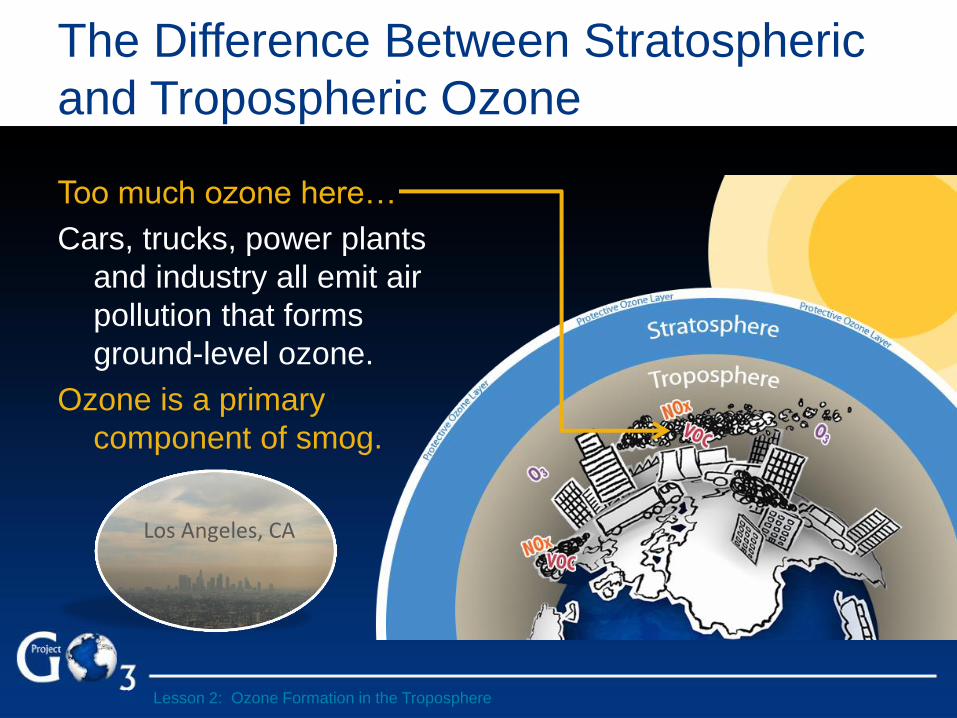
Too much ozone here…
Cars, trucks, power plants
and industry all emit air
pollution that forms
ground-level ozone.
Ozone is a primary
component of smog.
Los Angeles, CA
Lesson 2: Ozone Formation in the Troposphere
The Difference Between Stratospheric
and Tropospheric Ozone
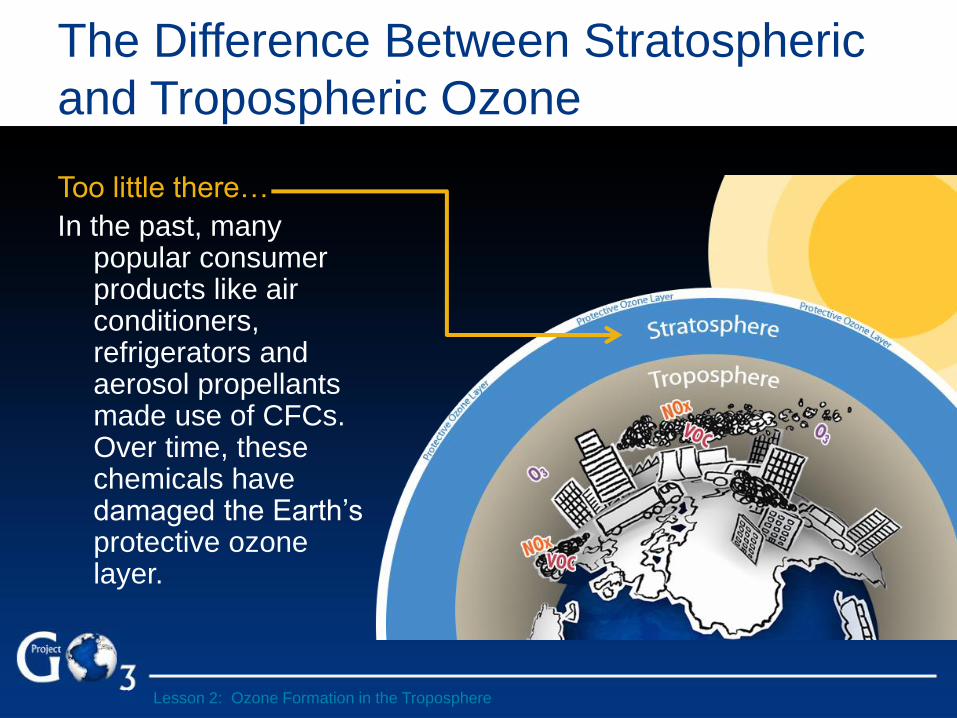
Too little there…
In the past, many popular consumer products like air conditioners, refrigerators and aerosol propellants made use of CFCs. Over time, these chemicals have damaged the Earth’s protective ozone layer.
Lesson 2: Ozone Formation in the Troposphere
The Difference Between Stratospheric
and Tropospheric Ozone
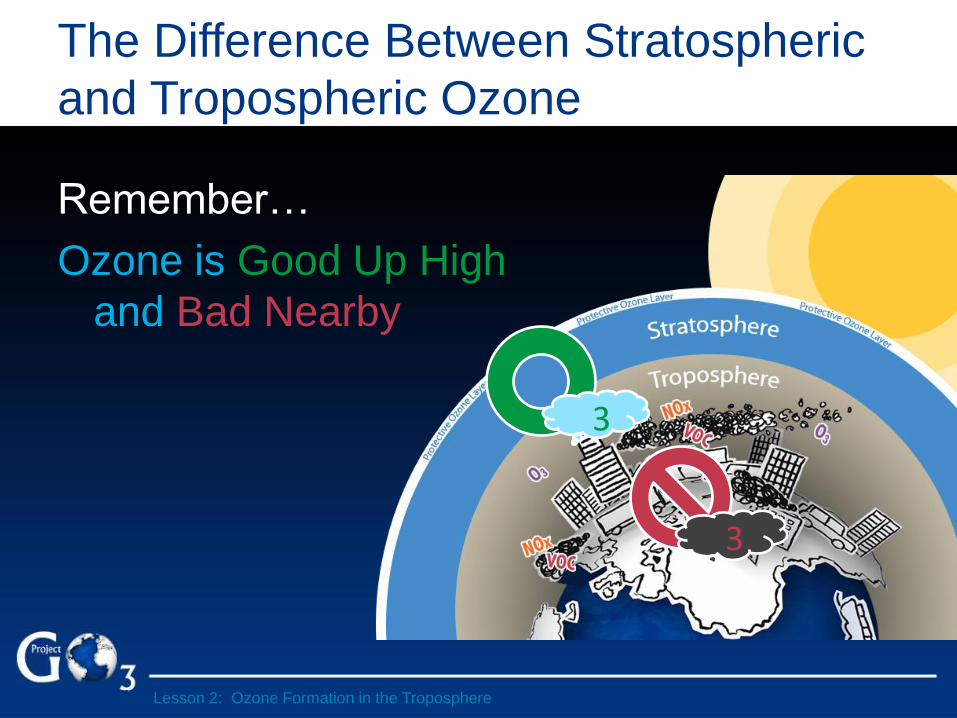
Remember…
Ozone is Good Up High
and Bad Nearby
3
3
Lesson 2: Ozone Formation in the Troposphere
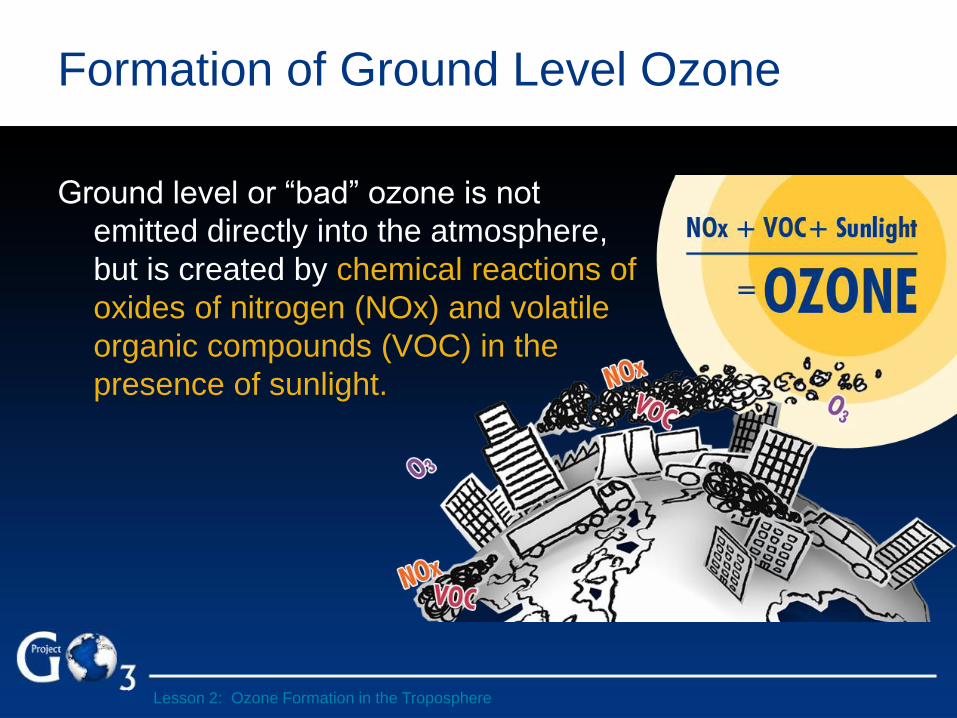
Formation of Ground Level Ozone
Ground level or “bad” ozone is not
emitted directly into the atmosphere,
but is created by chemical reactions of
oxides of nitrogen (NOx) and volatile
organic compounds (VOC) in the
presence of sunlight.
Lesson 2: Ozone Formation in the Troposphere
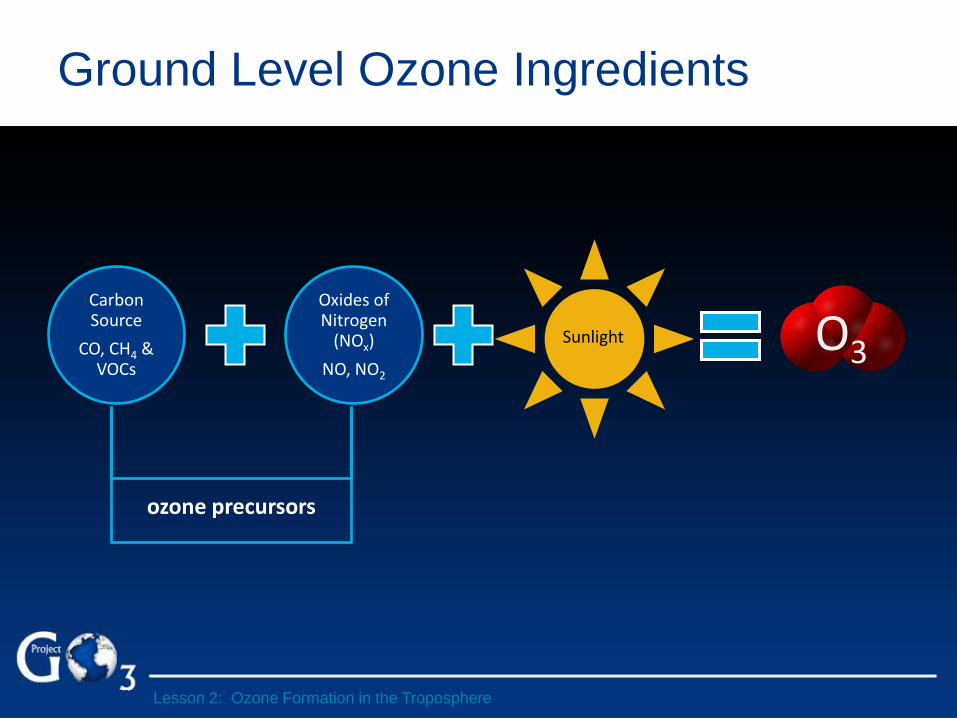
Carbon Source
CO, CH4 & VOCs
Oxides of Nitrogen
(NOx)
NO, NO2
Sunlight O3
Ground Level Ozone Ingredients
ozone precursors
Lesson 2: Ozone Formation in the Troposphere

The series of reactions with CO that leads to the formation of ground level ozone:
(we will explore this in more depth in later sections)
CO + OH → CO2 + H
H + O2 → HO2
HO2 + NO → OH + NO2
NO2 + hv → NO + O
O + O2 → O3
Net: CO + 2 O2 → CO2 + O3
Sunlight
A Closer Look at CO
Lesson 2: Ozone Formation in the Troposphere
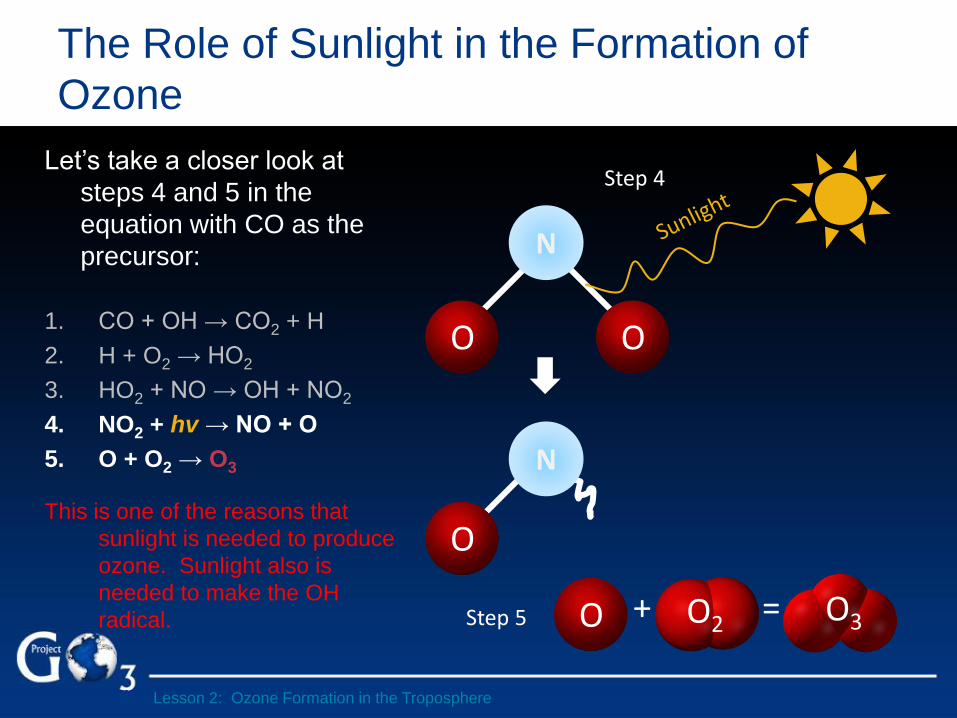
The Role of Sunlight in the Formation of
Ozone
Let’s take a closer look at
steps 4 and 5 in the
equation with CO as the
precursor:
1. CO + OH → CO2 + H
2. H + O2 → HO2
3. HO2 + NO → OH + NO2
4. NO2 + hv → NO + O
5. O + O2 → O3
This is one of the reasons that
sunlight is needed to produce
ozone. Sunlight also is
needed to make the OH
radical. + = O2 O O3
O O
N
O
N
Step 4
Step 5
Lesson 2: Ozone Formation in the Troposphere

Formation of Ozone (O3)
The Single Oxygen Atom is Lonely
A single Oxygen atom (O) in the atmosphere will quickly
find an O2 and bind with it to form Ozone (O3). O2 is
obviously quite abundant in the troposphere, but a
single O is extremely rare.
+ = O2 O O3
Lesson 2: Ozone Formation in the Troposphere
Global Ozone Project
Curriculum
Rev 13
Lesson 3:
Carbon Sources -
Carbon Monoxide
Learning Objectives
At the end of this lesson students will be able to:
• Identify three main examples of carbon sources that lead
to the formation of ground level ozone.
• Understand the sources of carbon globally that contribute
to the formation of ground level ozone.
• Identify examples of natural and anthropogenic sources of
carbon in the atmosphere.
Lesson 3 : Carbon Sources - Carbon Monoxide

Exploration of Precursors in Depth
Carbon Sources: CO, CH4, VOCs
• Examples of carbon sources
• Breakdown of anthropogenic sources (cars, power plants, etc.)
• Breakdown of natural sources (swamps, trees, etc.)
Carbon Source
CO, CH4 & VOCs
Oxides of Nitrogen
(NOx)
NO, NO2
ozone precursors
Lesson 3 : Carbon Sources - Carbon Monoxide
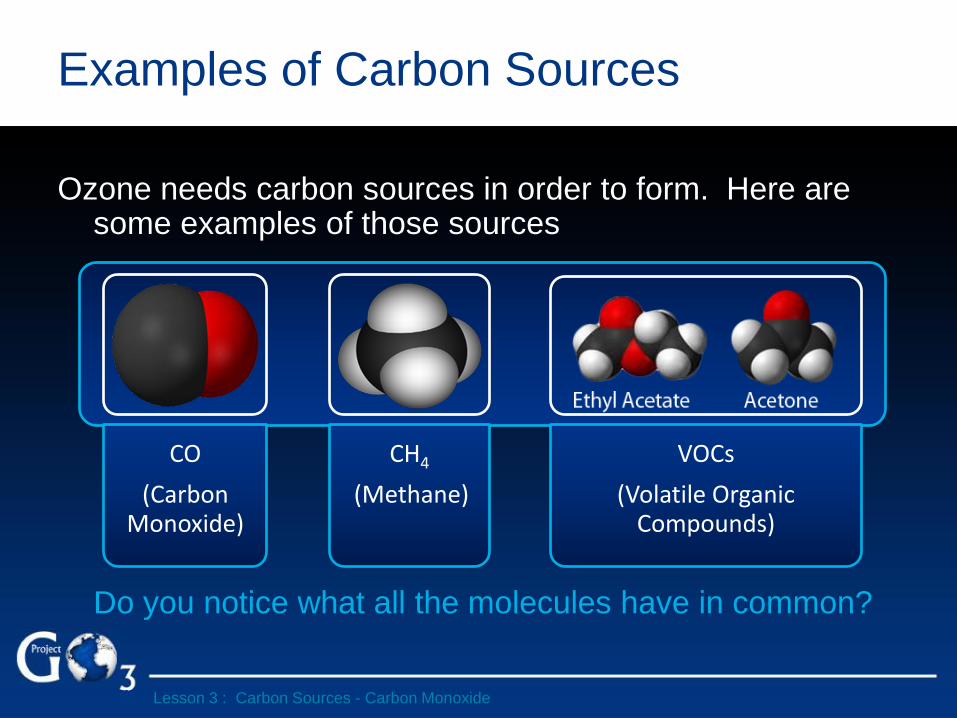
Ozone needs carbon sources in order to form. Here are some examples of those sources
Do you notice what all the molecules have in common?
CO
(Carbon Monoxide)
CH4
(Methane)
VOCs
(Volatile Organic Compounds)
Examples of Carbon Sources
Lesson 3 : Carbon Sources - Carbon Monoxide

Carbon Monoxide (CO)
Lesson 3 : Carbon Sources - Carbon Monoxide
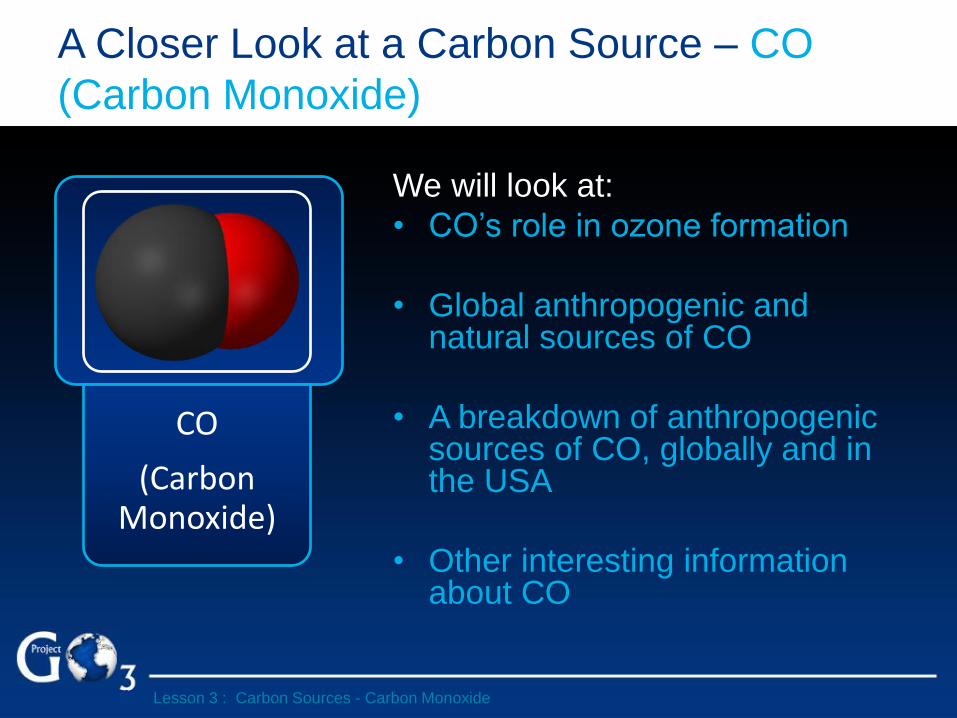
A Closer Look at a Carbon Source – CO
(Carbon Monoxide)
We will look at:
• CO’s role in ozone formation
• Global anthropogenic and natural sources of CO
• A breakdown of anthropogenic sources of CO, globally and in the USA
• Other interesting information about CO
CO
(Carbon Monoxide)
Lesson 3 : Carbon Sources - Carbon Monoxide
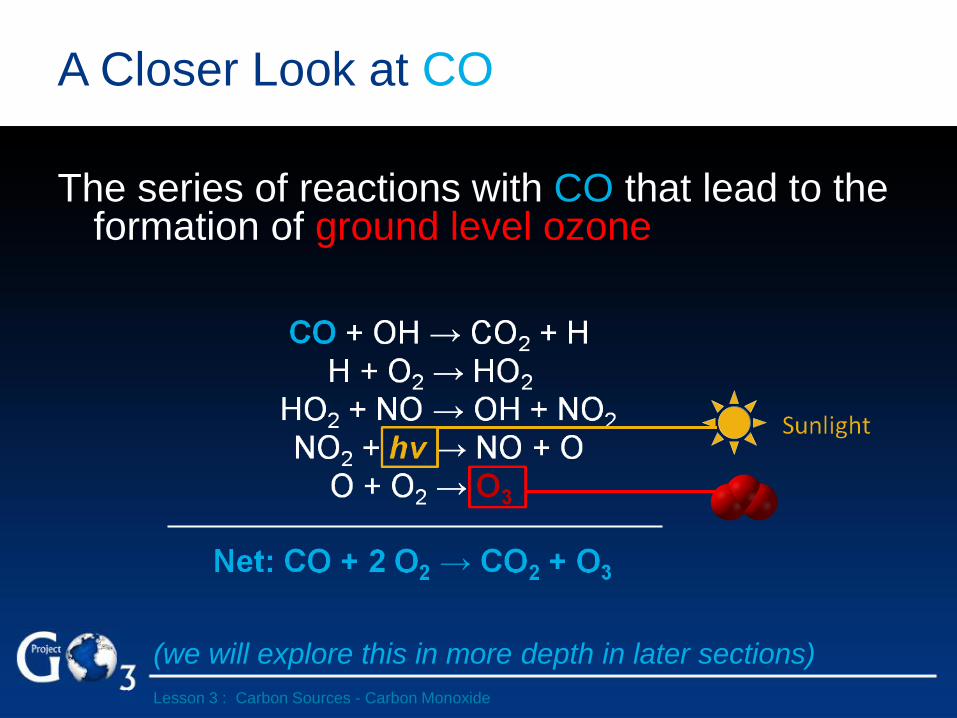
The series of reactions with CO that lead to the formation of ground level ozone
(we will explore this in more depth in later sections)
A Closer Look at CO
Lesson 3 : Carbon Sources - Carbon Monoxide

Global Anthropogenic Sources of CO
Lesson 3 : Carbon Sources - Carbon Monoxide

Breakdown of Global Anthropogenic
Sources of CO
Fossil Fuel Burning*
32%
Biomass Burning
13%
Forest Clearing 26%
Oxidation of Anthropogenic
CH4 20%
Oxidation of non-CH4
Hydrocarbons 6%
Wood Burning Fuel 3%
*Includes automobile emissions
Lesson 3 : Carbon Sources - Carbon Monoxide
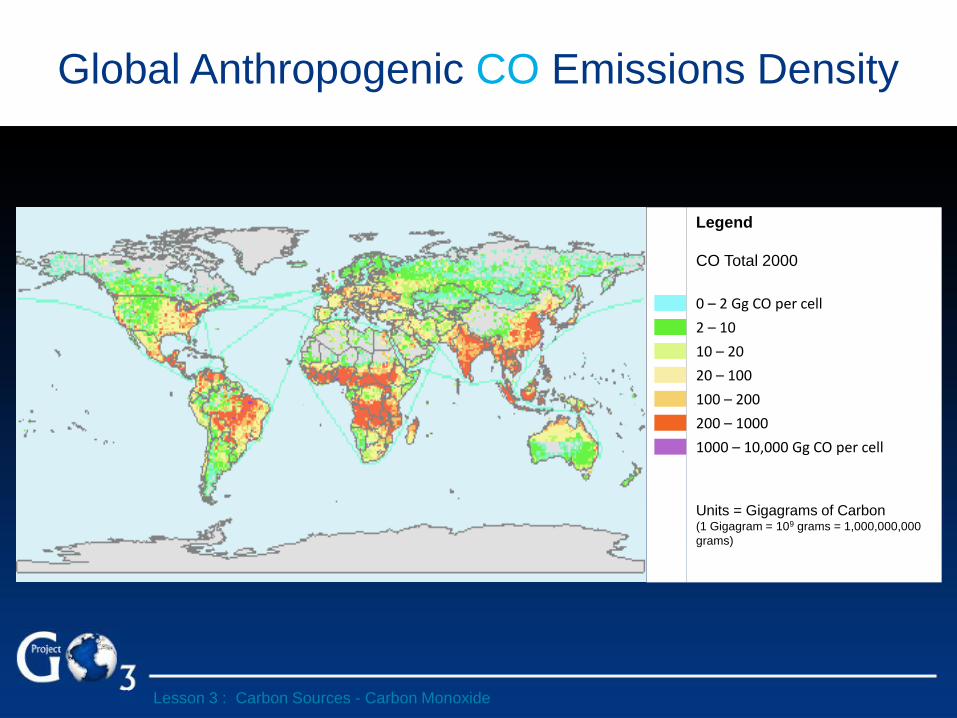
Global Anthropogenic CO Emissions Density
Legend
CO Total 2000
Units = Gigagrams of Carbon (1 Gigagram = 109 grams = 1,000,000,000
grams)
0 – 2 Gg CO per cell
2 – 10
10 – 20
20 – 100
100 – 200
200 – 1000
1000 – 10,000 Gg CO per cell
Lesson 3 : Carbon Sources - Carbon Monoxide
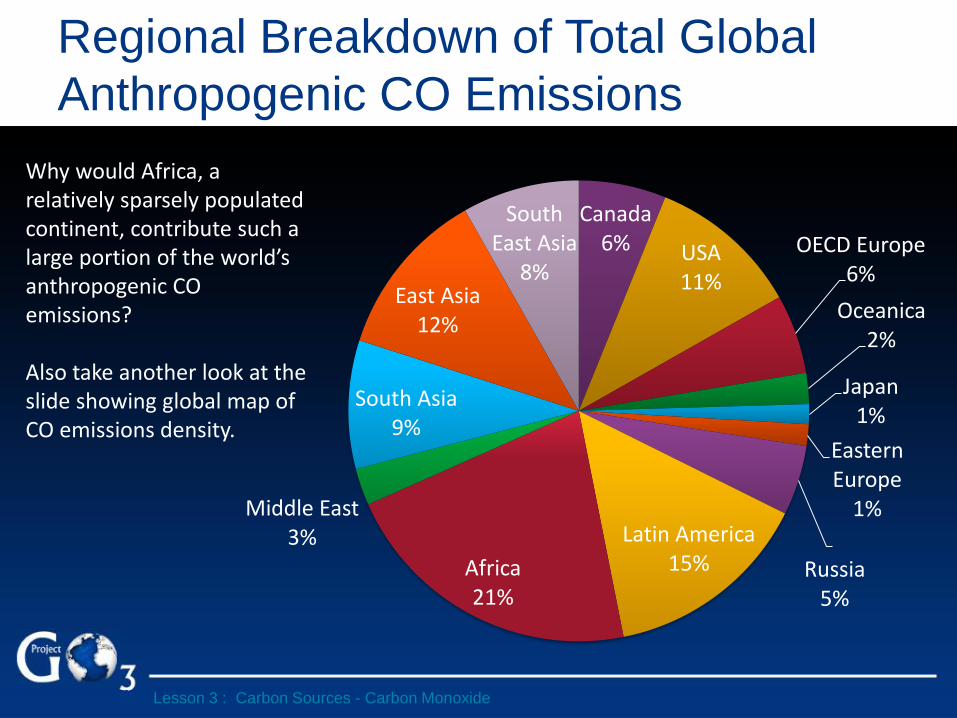
Canada 6% USA
11%
OECD Europe 6%
Oceanica 2%
Japan 1%
Eastern Europe
1%
Russia
5%
Latin America 15% Africa
21%
Middle East 3%
South Asia 9%
East Asia 12%
South East Asia
8%
Regional Breakdown of Total Global
Anthropogenic CO Emissions
Why would Africa, a relatively sparsely populated continent, contribute such a large portion of the world’s anthropogenic CO emissions? Also take another look at the slide showing global map of CO emissions density.
Lesson 3 : Carbon Sources - Carbon Monoxide
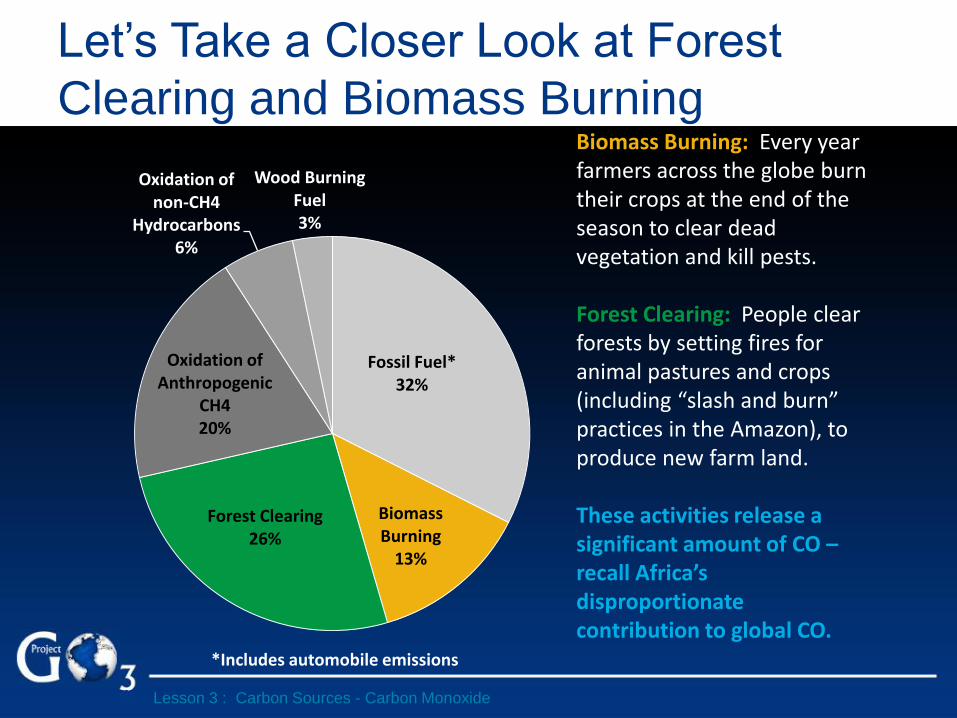
Let’s Take a Closer Look at Forest
Clearing and Biomass Burning
Fossil Fuel* 32%
Biomass Burning
13%
Forest Clearing 26%
Oxidation of Anthropogenic
CH4 20%
Oxidation of non-CH4
Hydrocarbons 6%
Wood Burning Fuel 3%
*Includes automobile emissions
Biomass Burning: Every year farmers across the globe burn their crops at the end of the season to clear dead vegetation and kill pests. Forest Clearing: People clear forests by setting fires for animal pastures and crops (including “slash and burn” practices in the Amazon), to produce new farm land. These activities release a significant amount of CO – recall Africa’s disproportionate contribution to global CO.
Lesson 3 : Carbon Sources - Carbon Monoxide

Forest Clearing and Biomass Burning
as Sources of CO
NASA Satellite Image of Fires Burning in Africa (in the
Democratic Republic of the Congo)
The red dots indicate the locations of active fires burning
Lesson 3 : Carbon Sources - Carbon Monoxide
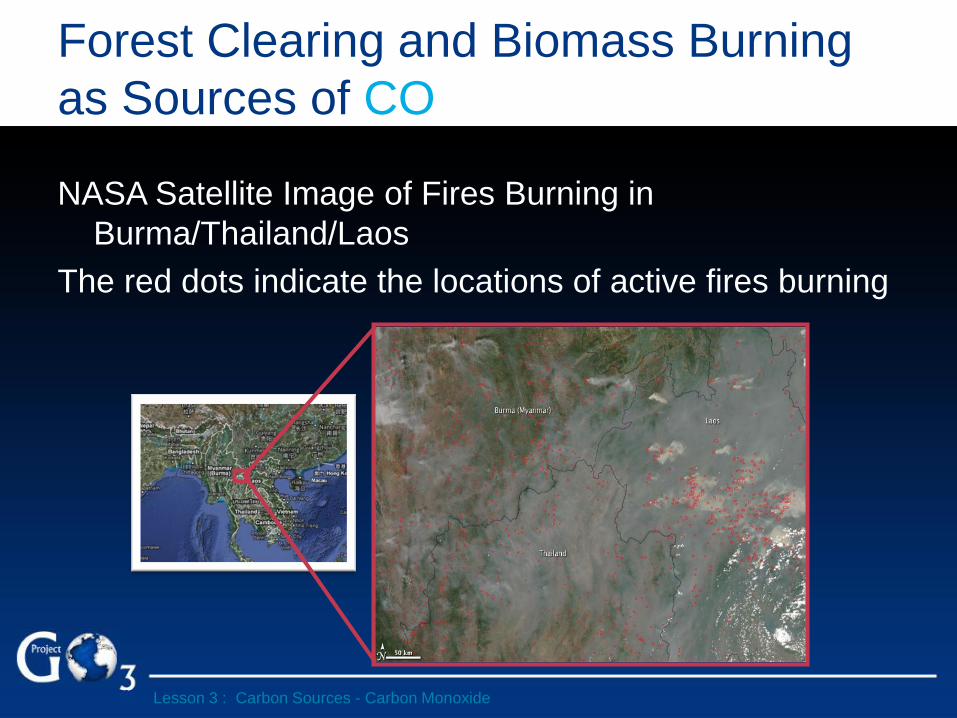
Forest Clearing and Biomass Burning
as Sources of CO
NASA Satellite Image of Fires Burning in
Burma/Thailand/Laos
The red dots indicate the locations of active fires burning
Lesson 3 : Carbon Sources - Carbon Monoxide
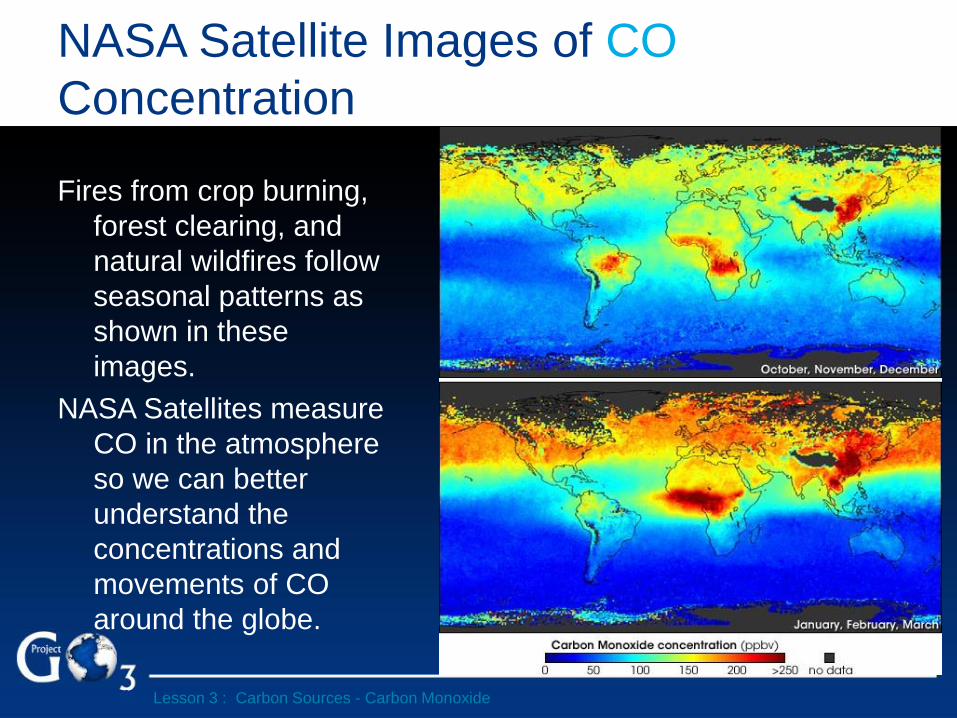
NASA Satellite Images of CO
Concentration
Fires from crop burning,
forest clearing, and
natural wildfires follow
seasonal patterns as
shown in these
images.
NASA Satellites measure
CO in the atmosphere
so we can better
understand the
concentrations and
movements of CO
around the globe.
Lesson 3 : Carbon Sources - Carbon Monoxide

Anthropogenic Sources of CO in the
United States
Lesson 3 : Carbon Sources - Carbon Monoxide
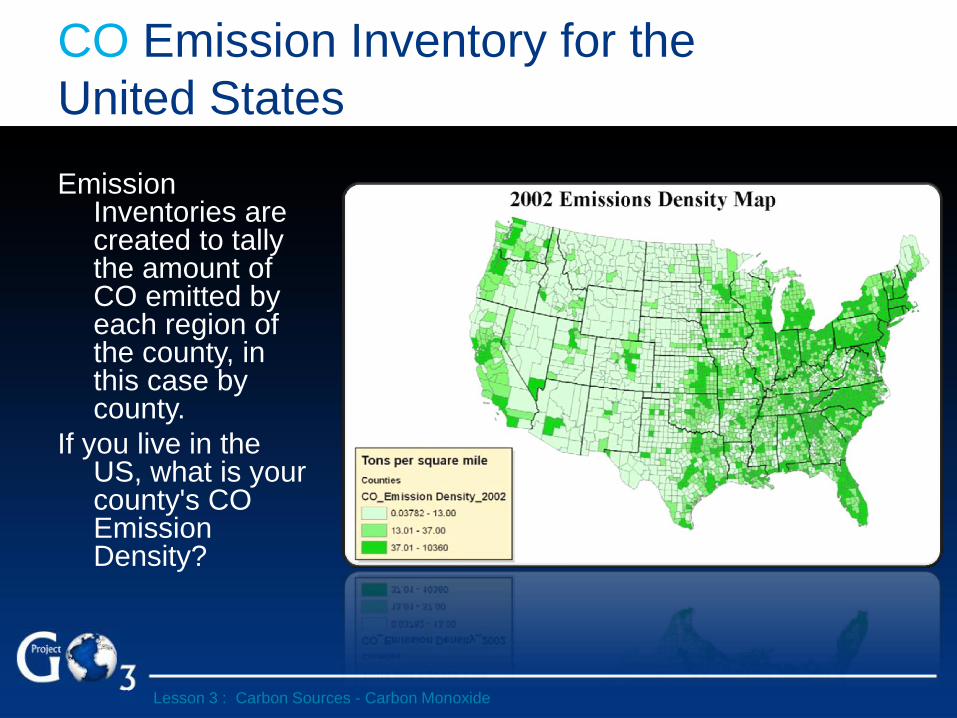
CO Emission Inventory for the
United States
Emission Inventories are created to tally the amount of CO emitted by each region of the county, in this case by county.
If you live in the US, what is your county's CO Emission Density?
Lesson 3 : Carbon Sources - Carbon Monoxide
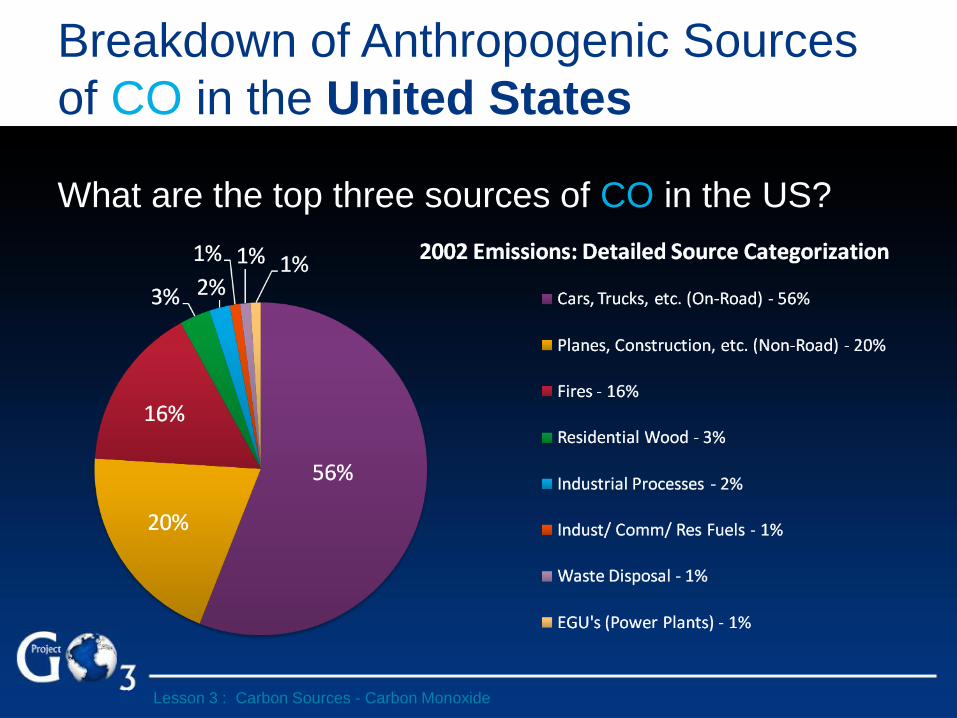
Breakdown of Anthropogenic Sources
of CO in the United States
What are the top three sources of CO in the US?
Lesson 3 : Carbon Sources - Carbon Monoxide

Natural Sources of CO
Lesson 3 : Carbon Sources - Carbon Monoxide
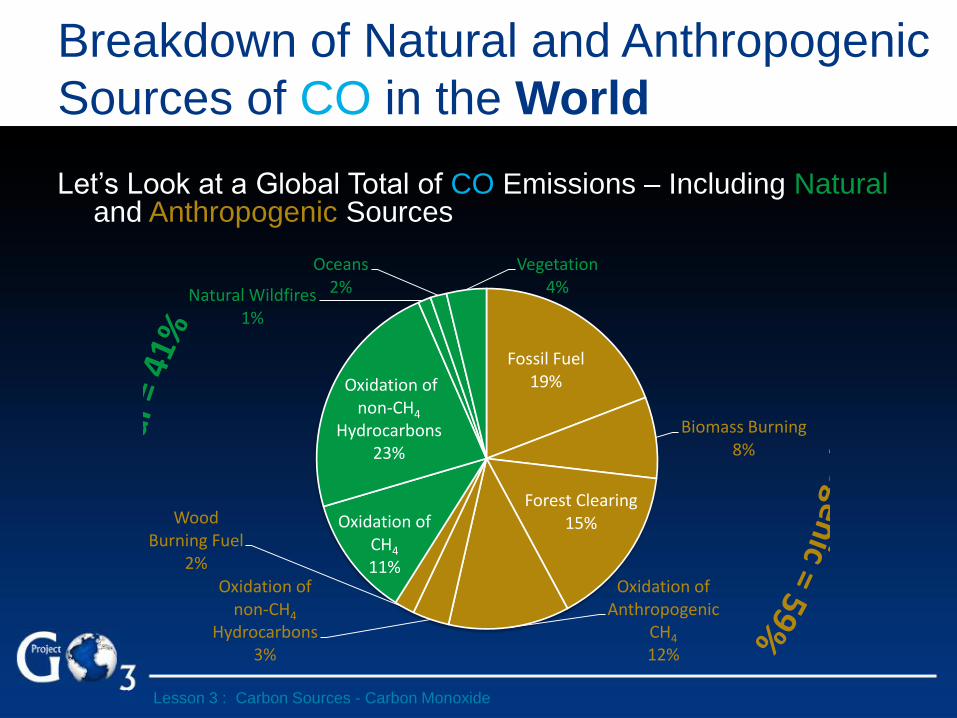
Breakdown of Natural and Anthropogenic
Sources of CO in the World
Let’s Look at a Global Total of CO Emissions – Including Natural and Anthropogenic Sources
Fossil Fuel 19%
Biomass Burning 8%
Forest Clearing 15%
Oxidation of Anthropogenic
CH4 12%
Oxidation of non-CH4
Hydrocarbons 3%
Wood Burning Fuel
2%
Oxidation of CH4 11%
Oxidation of non-CH4
Hydrocarbons 23%
Natural Wildfires 1%
Oceans 2%
Vegetation 4%
Lesson 3 : Carbon Sources - Carbon Monoxide

Lesson 4:
Methane (CH4)
Learning Objectives
At the end of this lesson students will be able to:
• Identify three main examples of methane sources that lead
to the formation of ground level ozone.
• Understand the sources of methane globally that
contribute to the formation of ground level ozone.
• Identify examples of natural and anthropogenic sources of
methane in the atmosphere.
Lesson 4 : Carbon Sources - Methane
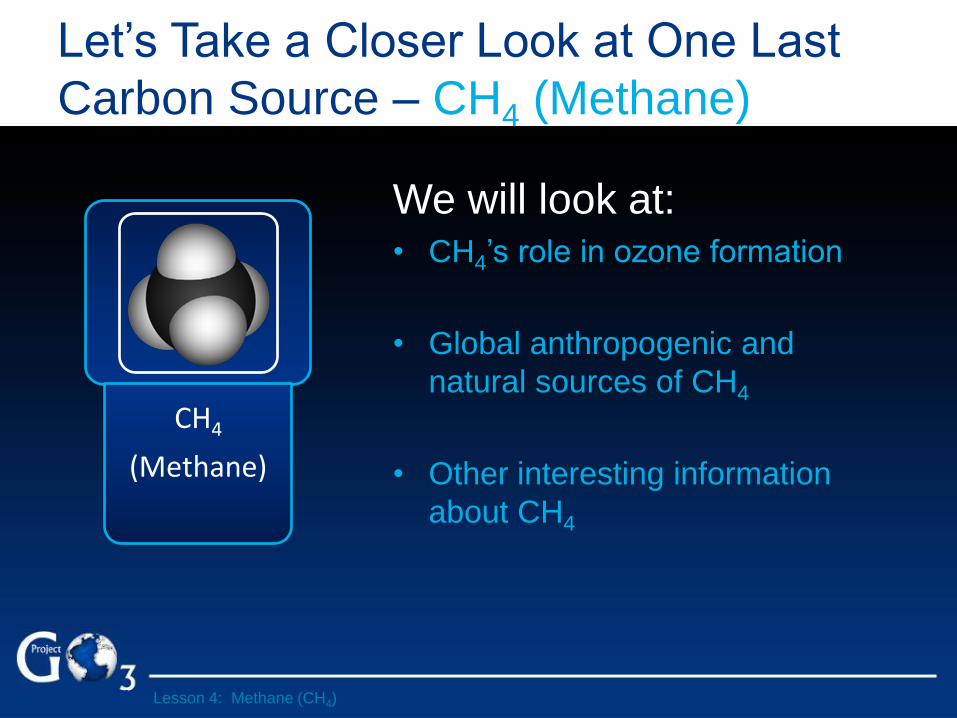
Let’s Take a Closer Look at One Last
Carbon Source – CH4 (Methane)
We will look at: • CH4’s role in ozone formation
• Global anthropogenic and
natural sources of CH4
• Other interesting information
about CH4
CH4
(Methane)
Lesson 4: Methane (CH4)

The Series of Reactions with CH4 that Lead to the Formation of Ground Level Ozone
A Closer Look at CH4
Lesson 4: Methane (CH4)

Global Anthropogenic Sources of CH4
Lesson 4: Methane (CH4)
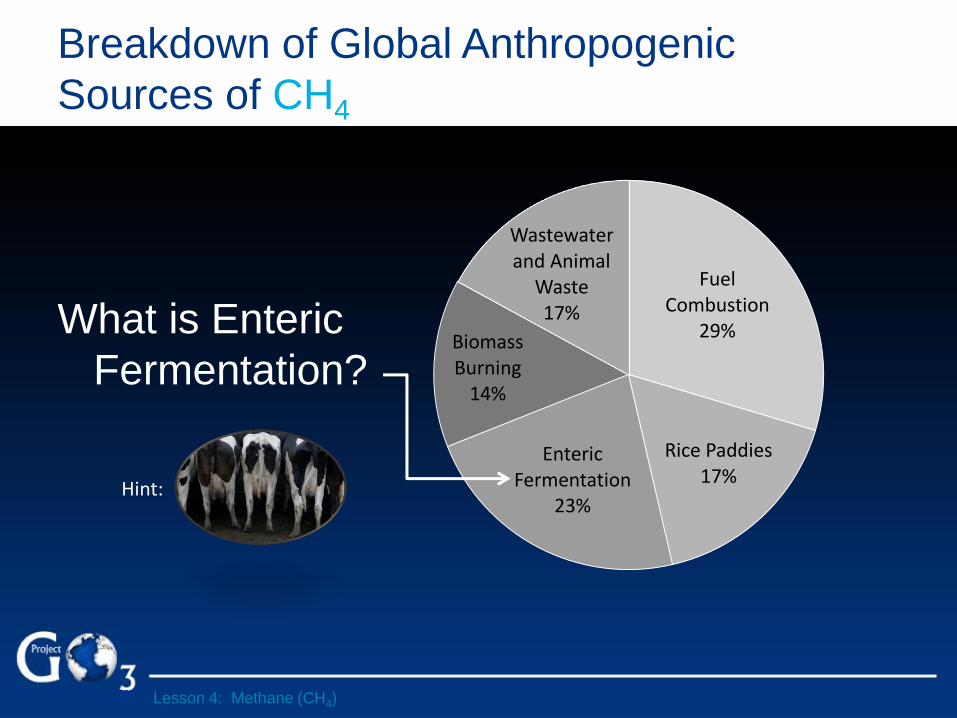
Breakdown of Global Anthropogenic
Sources of CH4
Fuel Combustion
29%
Rice Paddies 17%
Enteric Fermentation
23%
Biomass Burning
14%
Wastewater and Animal
Waste 17%
Hint:
What is Enteric
Fermentation?
Lesson 4: Methane (CH4)
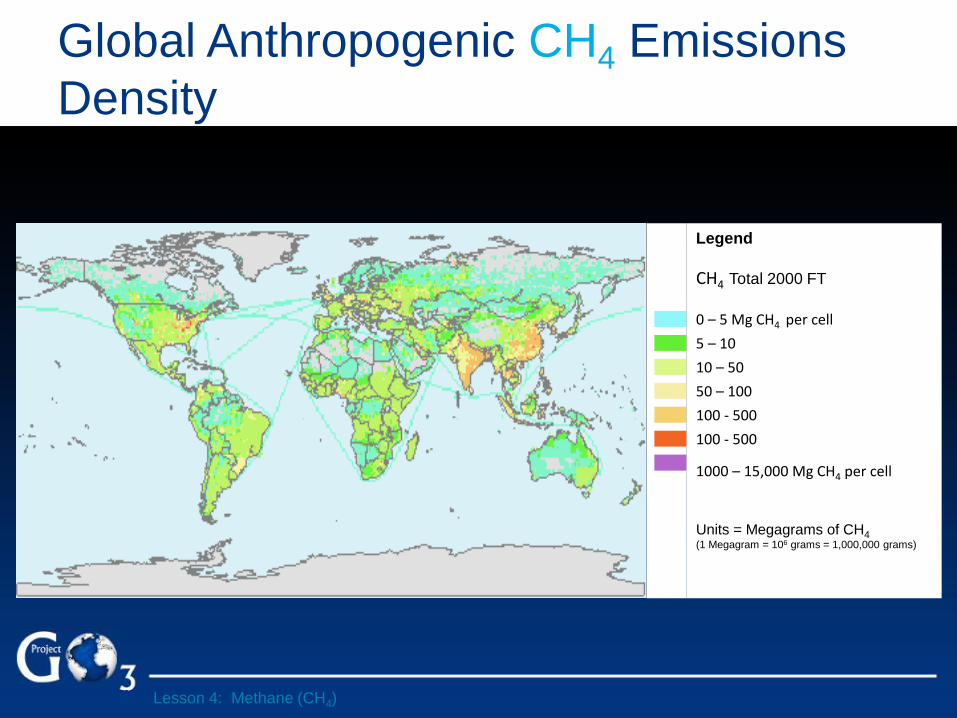
Global Anthropogenic CH4 Emissions
Density
Legend
CH4 Total 2000 FT
Units = Megagrams of CH4 (1 Megagram = 106 grams = 1,000,000 grams)
0 – 5 Mg CH4 per cell
5 – 10
10 – 50
50 – 100
100 - 500
100 - 500
1000 – 15,000 Mg CH4 per cell
Lesson 4: Methane (CH4)
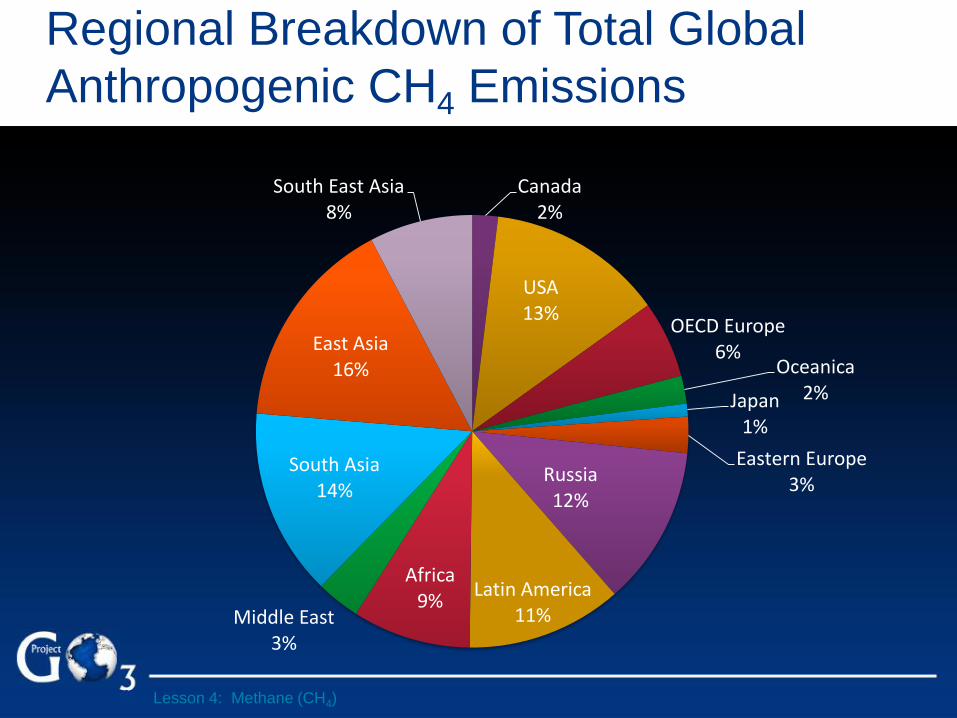
Canada 2%
USA 13%
OECD Europe 6%
Oceanica 2% Japan
1%
Eastern Europe 3% Russia
12%
Latin America 11%
Africa 9%
Middle East 3%
South Asia 14%
East Asia 16%
South East Asia 8%
Regional Breakdown of Total Global
Anthropogenic CH4 Emissions
Lesson 4: Methane (CH4)

Natural Sources of CH4
Lesson 4: Methane (CH4)

There are Significant Natural Sources
of CH4
Lesson 4: Methane (CH4)
Fuel Combustion
21%
Rice Paddies 12%
Enteric Fermentation
16%
Biomass Burning
10%
Wastewater and Animal
Waste 12%
Natural Wetlands
20%
Termites 4%
Oceans 1%
Other 4%

Lesson 5:
Volatile Organic Compounds (VOCs)
Learning Objectives
At the end of this lesson students will be able to:
• Identify three main examples of VOCs sources that lead to
the formation of ground level ozone.
• Understand the sources of VOCs globally that contribute
to the formation of ground level ozone.
• Identify examples of natural and anthropogenic sources of
VOCs in the atmosphere.
Lesson 5 : Carbon Sources - VOCs
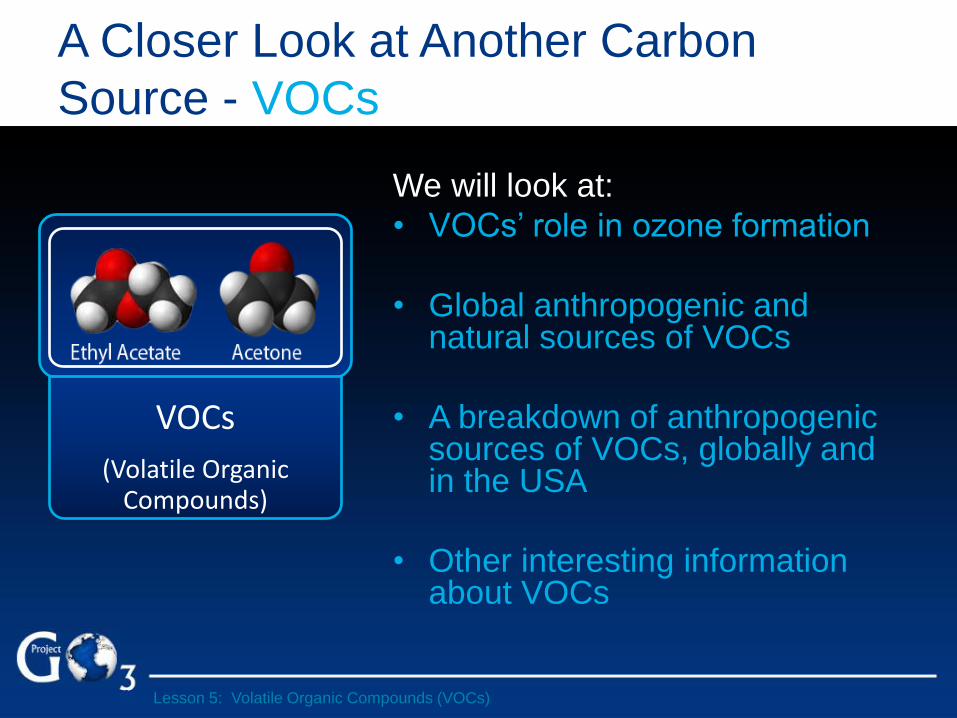
A Closer Look at Another Carbon
Source - VOCs
We will look at:
• VOCs’ role in ozone formation
• Global anthropogenic and natural sources of VOCs
• A breakdown of anthropogenic sources of VOCs, globally and in the USA
• Other interesting information about VOCs
VOCs
(Volatile Organic Compounds)
Lesson 5: Volatile Organic Compounds (VOCs)
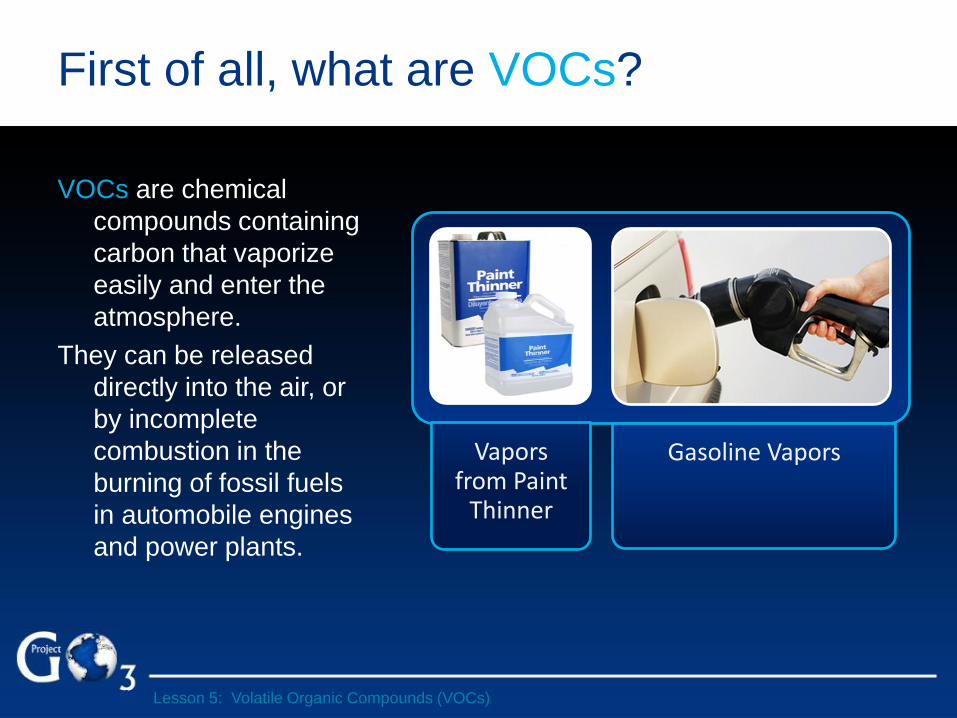
Vapors from Paint
Thinner
Gasoline Vapors
First of all, what are VOCs?
VOCs are chemical
compounds containing
carbon that vaporize
easily and enter the
atmosphere.
They can be released
directly into the air, or
by incomplete
combustion in the
burning of fossil fuels
in automobile engines
and power plants.
Lesson 5: Volatile Organic Compounds (VOCs)
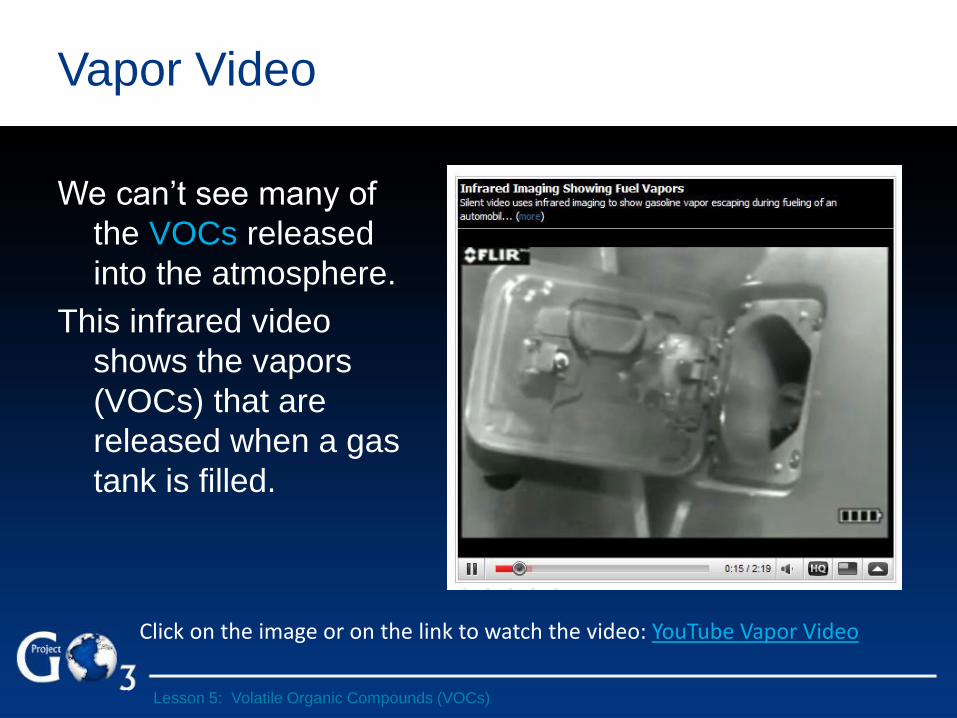
Vapor Video
We can’t see many of
the VOCs released
into the atmosphere.
This infrared video
shows the vapors
(VOCs) that are
released when a gas
tank is filled.
Lesson 5: Volatile Organic Compounds (VOCs)
Click on the image or on the link to watch the video: YouTube Vapor Video
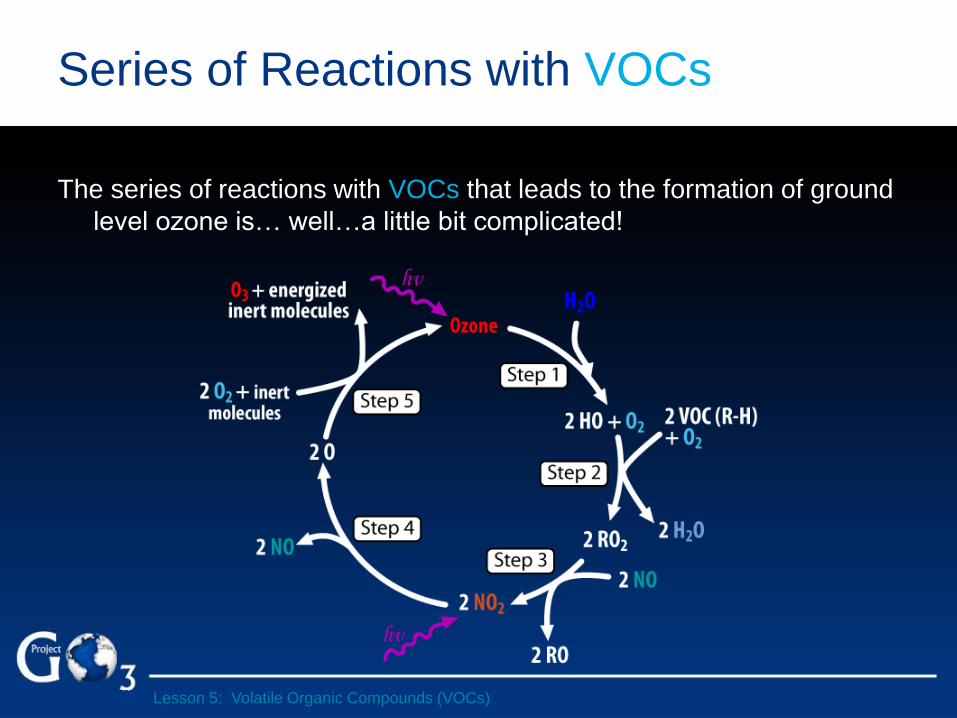
Series of Reactions with VOCs
The series of reactions with VOCs that leads to the formation of ground
level ozone is… well…a little bit complicated!
Lesson 5: Volatile Organic Compounds (VOCs)

Global Anthropogenic Sources of VOCs
Lesson 5: Volatile Organic Compounds (VOCs)

Breakdown of Global Anthropogenic
Sources of VOCs
How does this breakdown differ from the CO sources?
What is the main source of anthropogenic VOCs?
Biomass Burning
14%
Fossil Fuels* 49%
Biofuel 18%
Industrial Processes
16%
Agriculture 1%
Waste Handling
2%
*Includes automobile emissions
Lesson 5: Volatile Organic Compounds (VOCs)
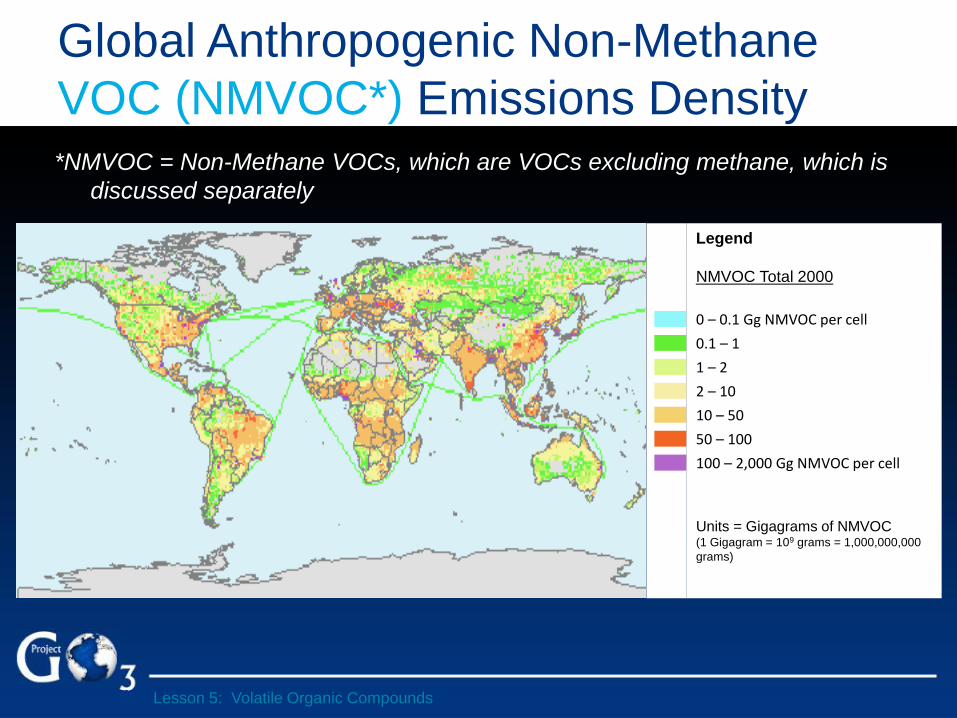
Global Anthropogenic Non-Methane
VOC (NMVOC*) Emissions Density *NMVOC = Non-Methane VOCs, which are VOCs excluding methane, which is
discussed separately
Legend
NMVOC Total 2000
Units = Gigagrams of NMVOC (1 Gigagram = 109 grams = 1,000,000,000
grams)
0 – 0.1 Gg NMVOC per cell
0.1 – 1
1 – 2
2 – 10
10 – 50
50 – 100
100 – 2,000 Gg NMVOC per cell
Lesson 5: Volatile Organic Compounds
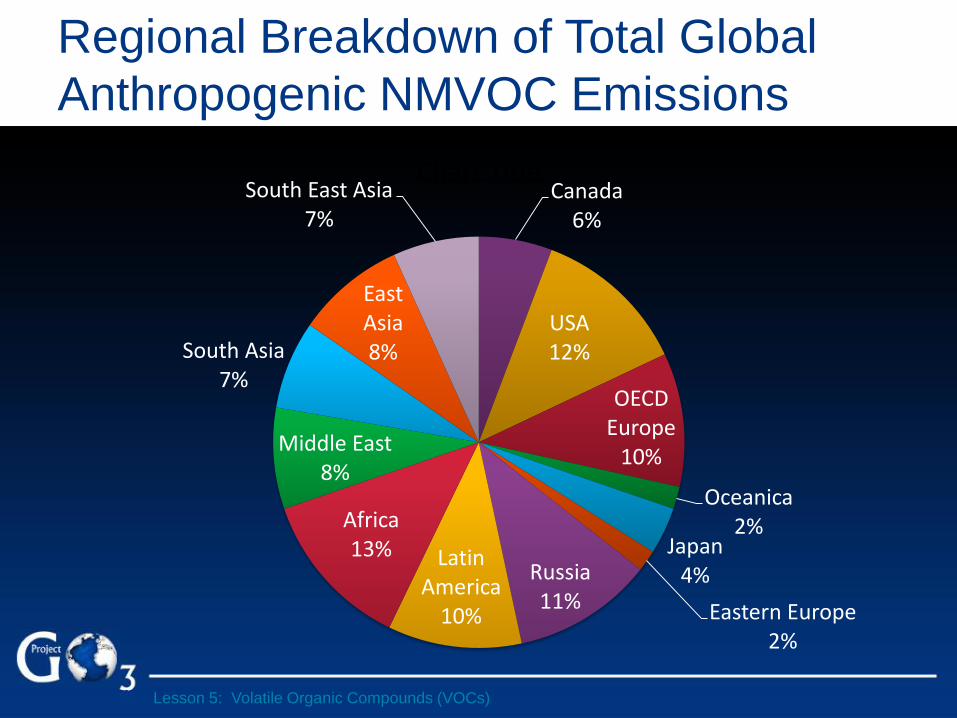
Regional Breakdown of Total Global
Anthropogenic NMVOC Emissions
Canada 6%
USA 12%
OECD Europe
10%
Oceanica 2%
Japan 4%
Eastern Europe 2%
Russia 11%
Latin America
10%
Africa 13%
Middle East 8%
South Asia 7%
East Asia 8%
South East Asia 7%
Chart Title
Lesson 5: Volatile Organic Compounds (VOCs)

Anthropogenic Sources of VOCs in the
United States
Lesson 5: Volatile Organic Compounds (VOCs)
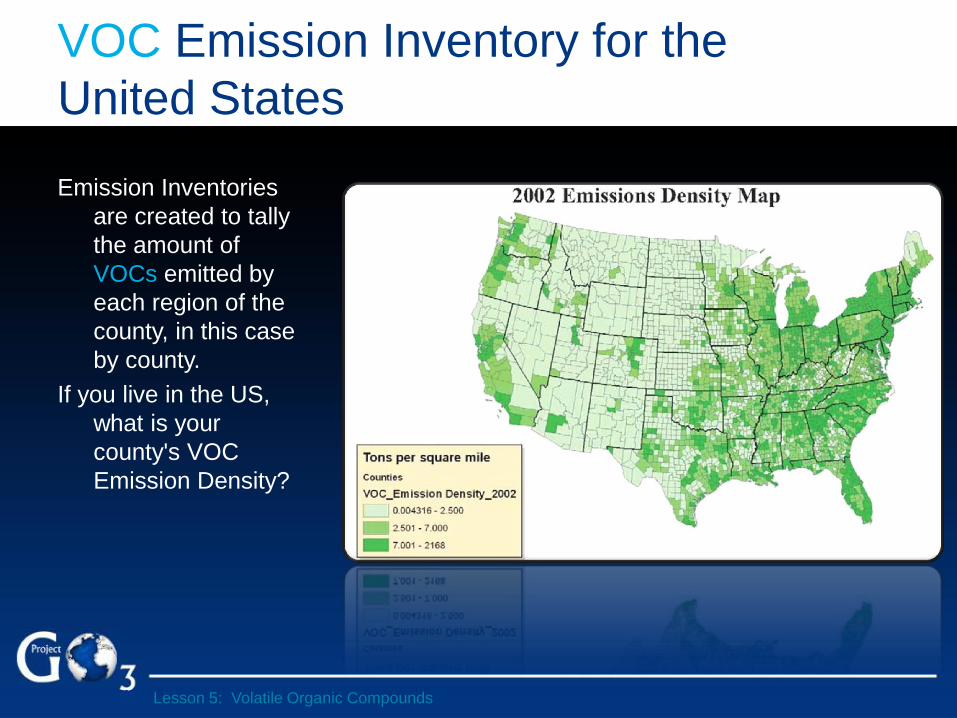
VOC Emission Inventory for the
United States
Emission Inventories
are created to tally
the amount of
VOCs emitted by
each region of the
county, in this case
by county.
If you live in the US,
what is your
county's VOC
Emission Density?
Lesson 5: Volatile Organic Compounds
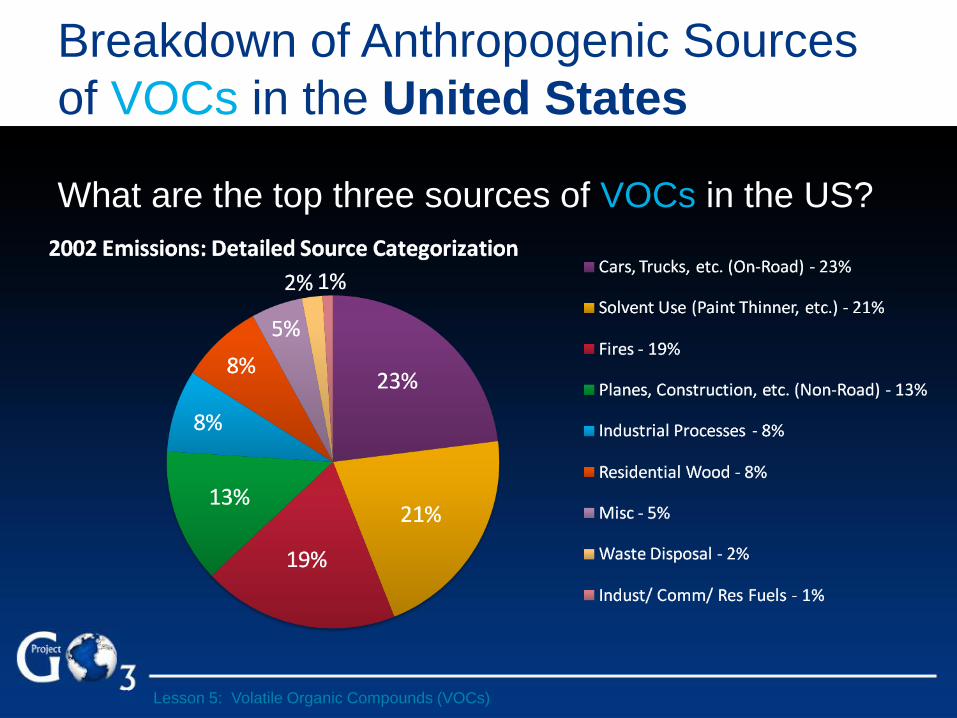
Breakdown of Anthropogenic Sources
of VOCs in the United States
What are the top three sources of VOCs in the US?
Lesson 5: Volatile Organic Compounds (VOCs)
Natural Sources of VOCs
Lesson 5: Volatile Organic Compounds (VOCs)

There are Significant Natural Sources
of VOCs
Biomass Burning
1.7%
Fossil Fuel 6.0%
Biofuel 2.1%
Industrial Processes
1.9% Agriculture 0.2%
Waste Handling
0.2% Oceans
0.4%
Trees 62.7%
Crops 9.2%
Shrubs 14.8%
Other 0.7%
Lesson 5: Volatile Organic Compounds (VOCs)

What are the Natural Sources of
VOCs?
Trees emit VOCs in the form
of isoprene and
monoterpenes, which give
them their characteristic
smell.
Trees emit VOCs for a variety
of reasons:
• To repel harmful insects
and animals.
• To attract pollinators.
• As a stress response.
Isoprene, one of the VOCs emitted by trees
Lesson 5: Volatile Organic Compounds (VOCs)

Kudzu – Another Natural Source of VOCs
The invasive vine Kudzu produces isoprene, a “growing” problem for ozone formation in the Southeastern US
Lesson 5: Volatile Organic Compounds (VOCs)
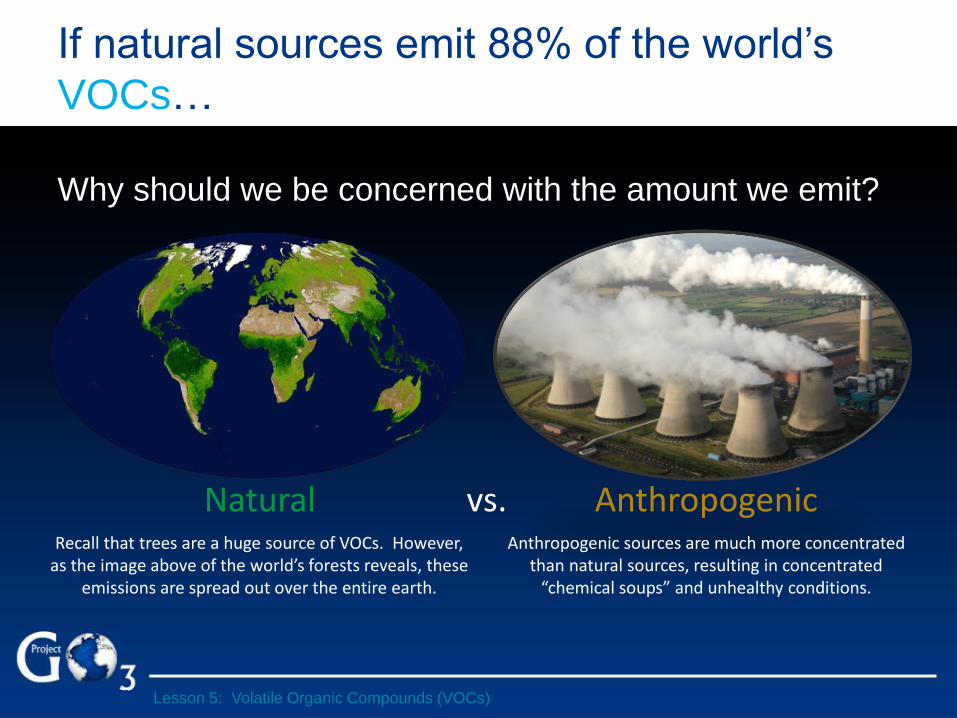
If natural sources emit 88% of the world’s
VOCs…
Why should we be concerned with the amount we emit?
Recall that trees are a huge source of VOCs. However, as the image above of the world’s forests reveals, these
emissions are spread out over the entire earth.
Anthropogenic sources are much more concentrated than natural sources, resulting in concentrated
“chemical soups” and unhealthy conditions.
vs. Anthropogenic Natural
Lesson 5: Volatile Organic Compounds (VOCs)
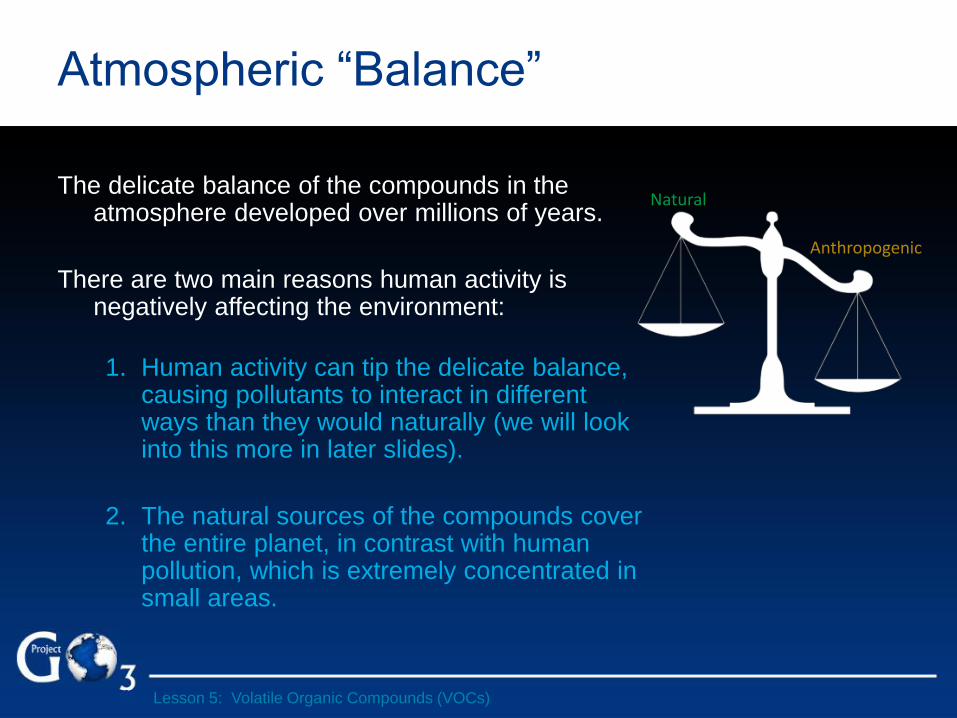
Atmospheric “Balance”
The delicate balance of the compounds in the atmosphere developed over millions of years.
There are two main reasons human activity is negatively affecting the environment:
1. Human activity can tip the delicate balance, causing pollutants to interact in different ways than they would naturally (we will look into this more in later slides).
2. The natural sources of the compounds cover the entire planet, in contrast with human pollution, which is extremely concentrated in small areas.
Natural
Anthropogenic
Lesson 5: Volatile Organic Compounds (VOCs)

Global Ozone Project
Curriculum
Rev 13
Lesson 6:
Oxides of Nitrogen (NOx)
Learning Objectives
At the end of this lesson students will be able to:
• Identify the two forms of nitrogen that make up NOx and lead to the
formation of ground level ozone.
• Understand the sources of NOx globally that contribute to the
formation of ground level ozone.
• Identify examples of natural and anthropogenic sources of NOx in the
atmosphere.
• Describe the role of NOx as a “Chemical Switch”.
Lesson 6: Oxides of Nitrogen (NOx)

Exploration of Precursors in Depth
Oxides of Nitrogen (NOx): NO, NO2
• Examples of nitrogen sources
• Breakdown of anthropogenic sources (cars, power plants, etc.)
• Breakdown of natural sources (swamps, trees, etc.)
Carbon Source
CO, CH4 & VOCs
Oxides of Nitrogen
(NOx)
NO, NO2
ozone precursors
Lesson 6: Oxides of Nitrogen (NOx)

Ozone needs oxides of nitrogen in order to form. Here are the two NOx compounds:
NO
(Nitric Oxide)
NO2
(Nitrogen Dioxide)
Examples of NOx
Lesson 6: Oxides of Nitrogen (NOx)
Global Anthropogenic Sources of NOx
Lesson 6: Oxides of Nitrogen (NOx)
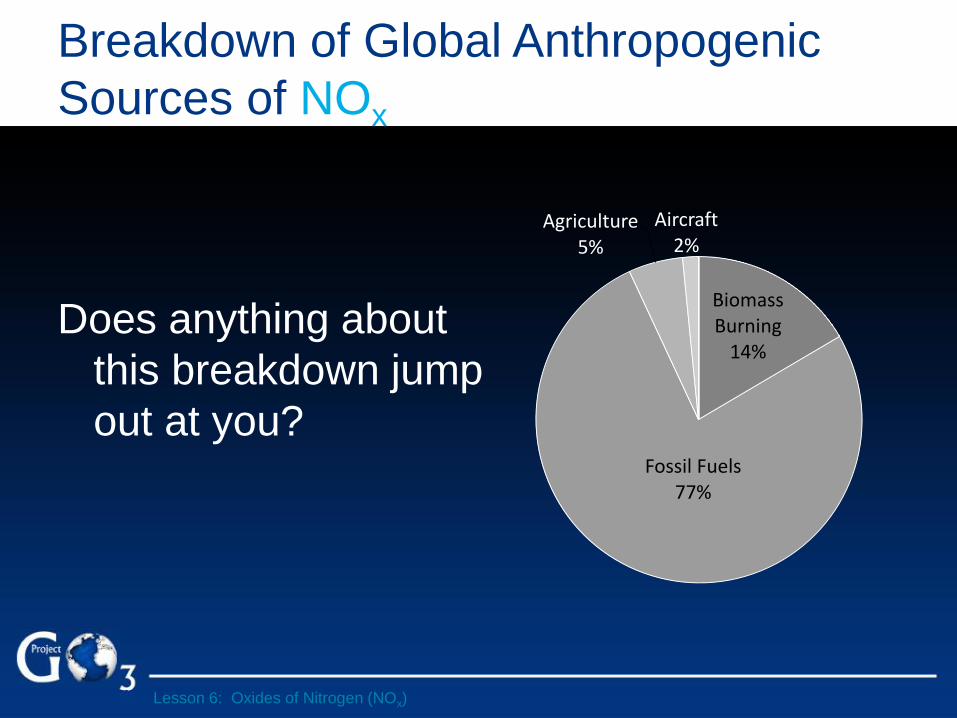
Biomass Burning
14%
Fossil Fuels 77%
Agriculture 5%
Aircraft 2%
Breakdown of Global Anthropogenic
Sources of NOx
Does anything about
this breakdown jump
out at you?
Lesson 6: Oxides of Nitrogen (NOx)
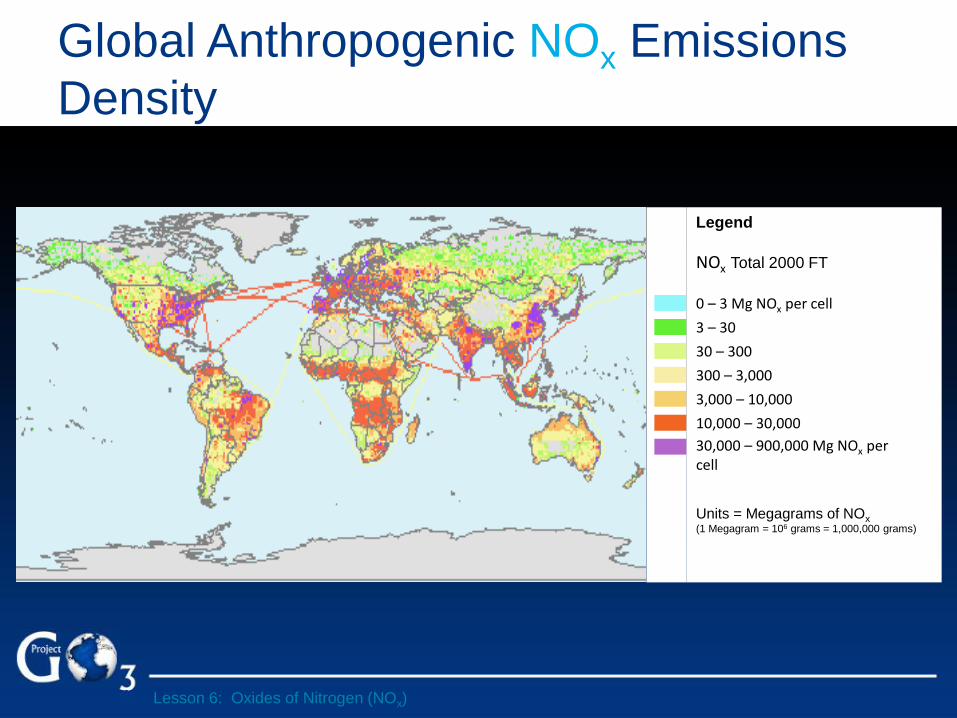
Global Anthropogenic NOx Emissions
Density
Legend
NOx Total 2000 FT
Units = Megagrams of NOx (1 Megagram = 106 grams = 1,000,000 grams)
0 – 3 Mg NOx per cell
3 – 30
30 – 300
300 – 3,000
3,000 – 10,000
10,000 – 30,000
30,000 – 900,000 Mg NOx per cell
Lesson 6: Oxides of Nitrogen (NOx)
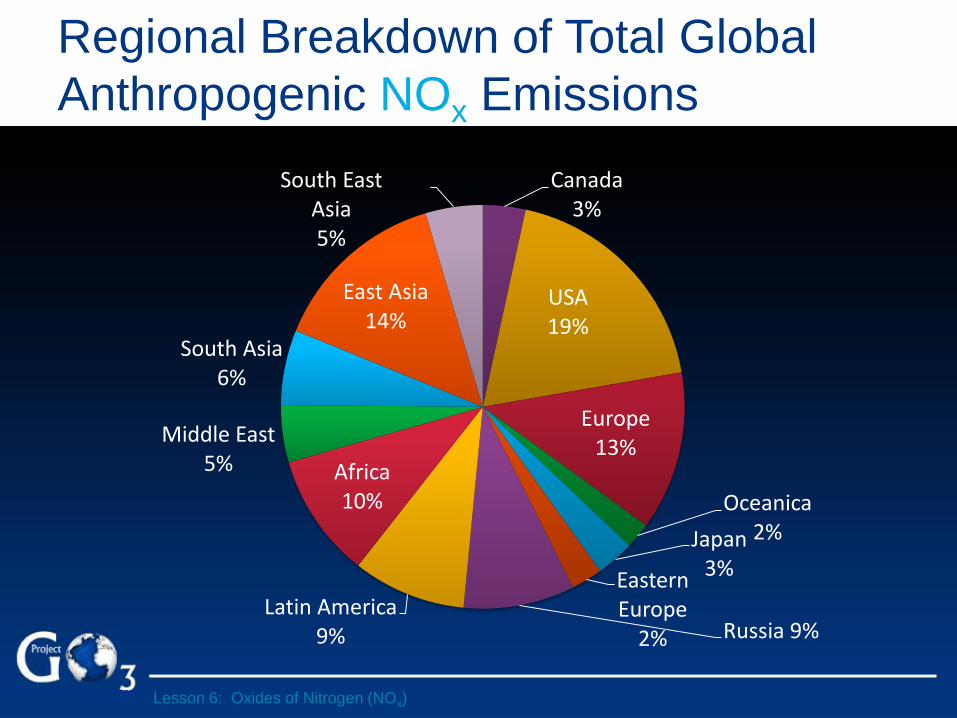
Regional Breakdown of Total Global
Anthropogenic NOx Emissions
Canada 3%
USA 19%
Europe 13%
Oceanica 2% Japan
3% Eastern Europe
2% Russia 9% Latin America
9%
Africa 10%
Middle East 5%
South Asia 6%
East Asia 14%
South East Asia 5%
Lesson 6: Oxides of Nitrogen (NOx)

Anthropogenic Sources of NOx in the
United States
Lesson 6: Oxides of Nitrogen (NOx)
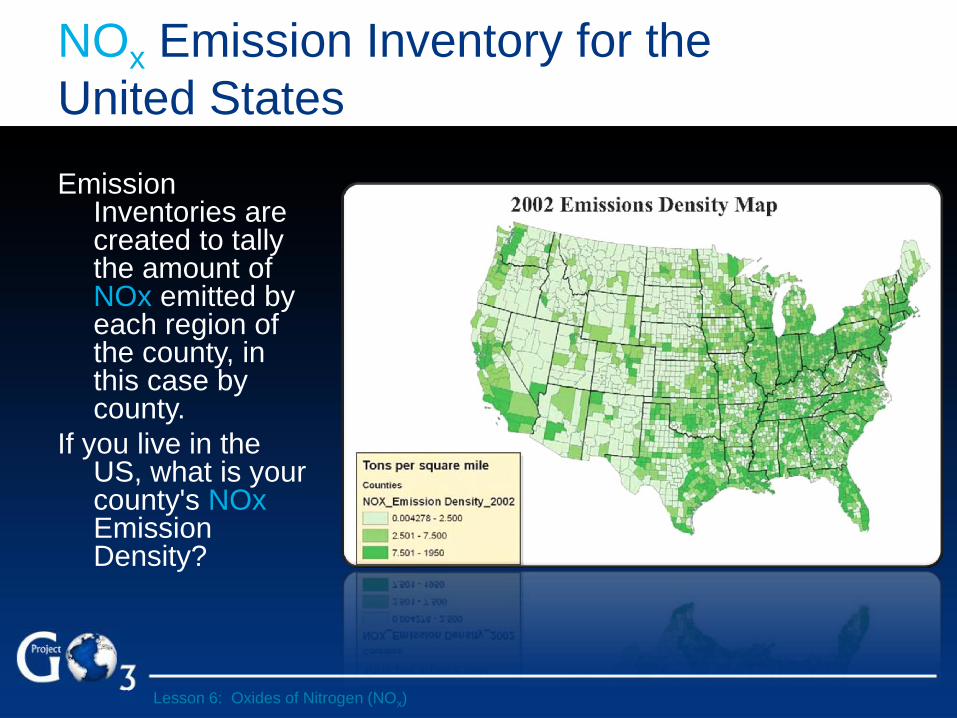
NOx Emission Inventory for the
United States
Emission Inventories are created to tally the amount of NOx emitted by each region of the county, in this case by county.
If you live in the US, what is your county's NOx Emission Density?
Lesson 6: Oxides of Nitrogen (NOx)

Breakdown of Anthropogenic Sources
of NOx in the United States
What are the top three sources of NOx in the US?
Lesson 6: Oxides of Nitrogen (NOx)

Natural Sources of NOx
Lesson 6: Oxides of Nitrogen (NOx)

Biomass Burning 14%
Fossil Fuel 64%
Agriculture 4%
Aircraft 1%
Lightning 10%
Atmospheric Chemistry
1%
Soil Emissions 6%
Anthropogenic Emissions Contribute
the Vast Majority of NOx Globally
Lesson 6: Oxides of Nitrogen (NOx)
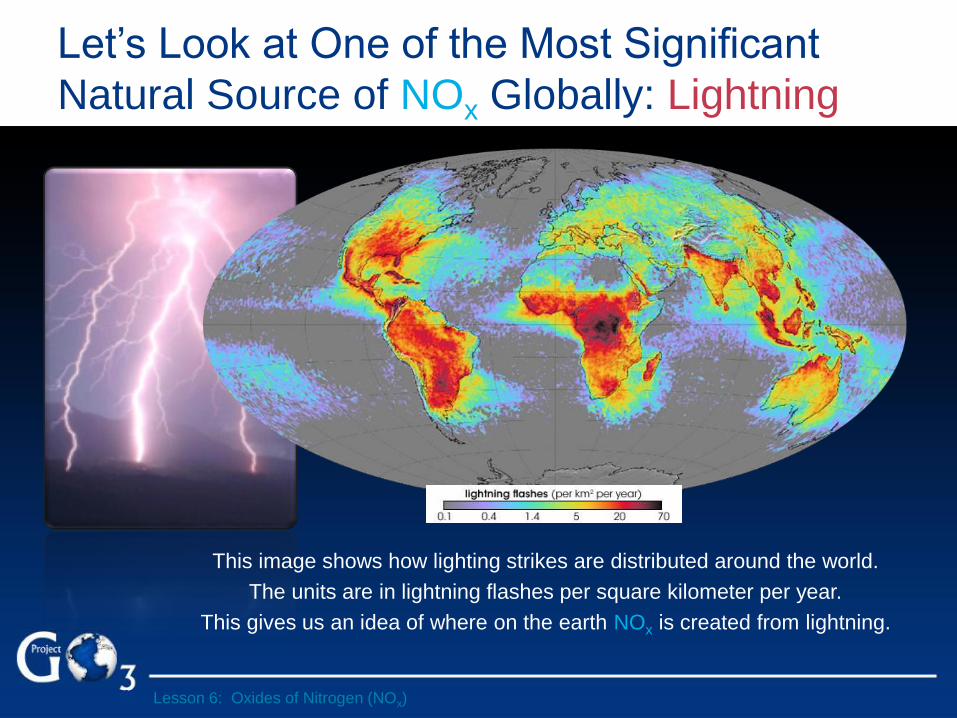
Let’s Look at One of the Most Significant
Natural Source of NOx Globally: Lightning
This image shows how lighting strikes are distributed around the world.
The units are in lightning flashes per square kilometer per year.
This gives us an idea of where on the earth NOx is created from lightning.
Lesson 6: Oxides of Nitrogen (NOx)

NOx as a “Chemical Switch”
Lesson 6: Oxides of Nitrogen (NOx)
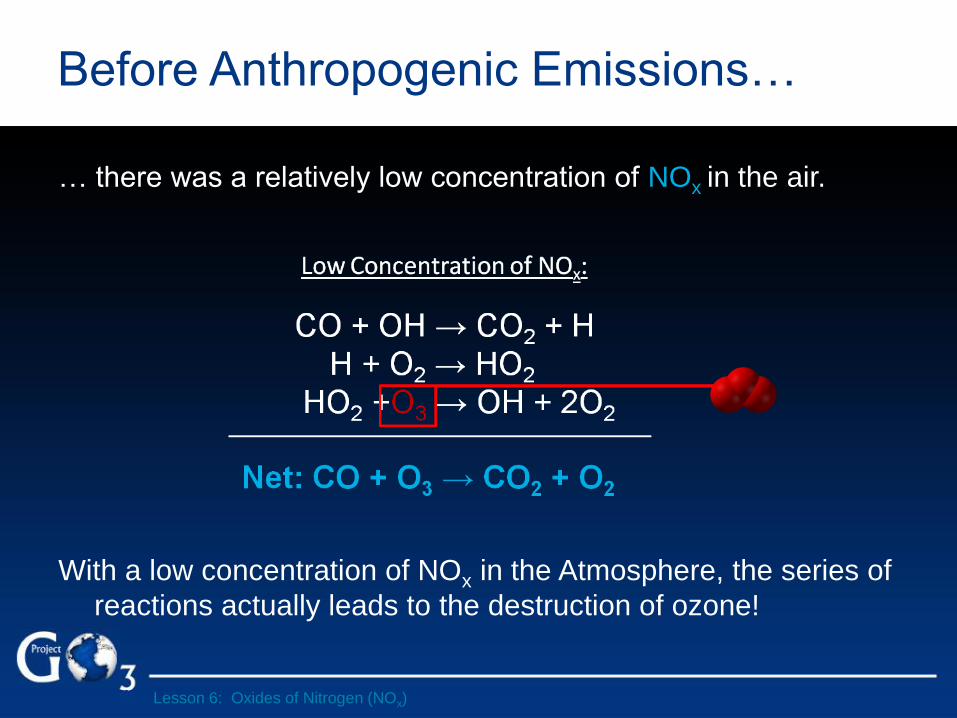
Before Anthropogenic Emissions…
… there was a relatively low concentration of NOx in the air.
With a low concentration of NOx in the Atmosphere, the series of
reactions actually leads to the destruction of ozone!
Lesson 6: Oxides of Nitrogen (NOx)
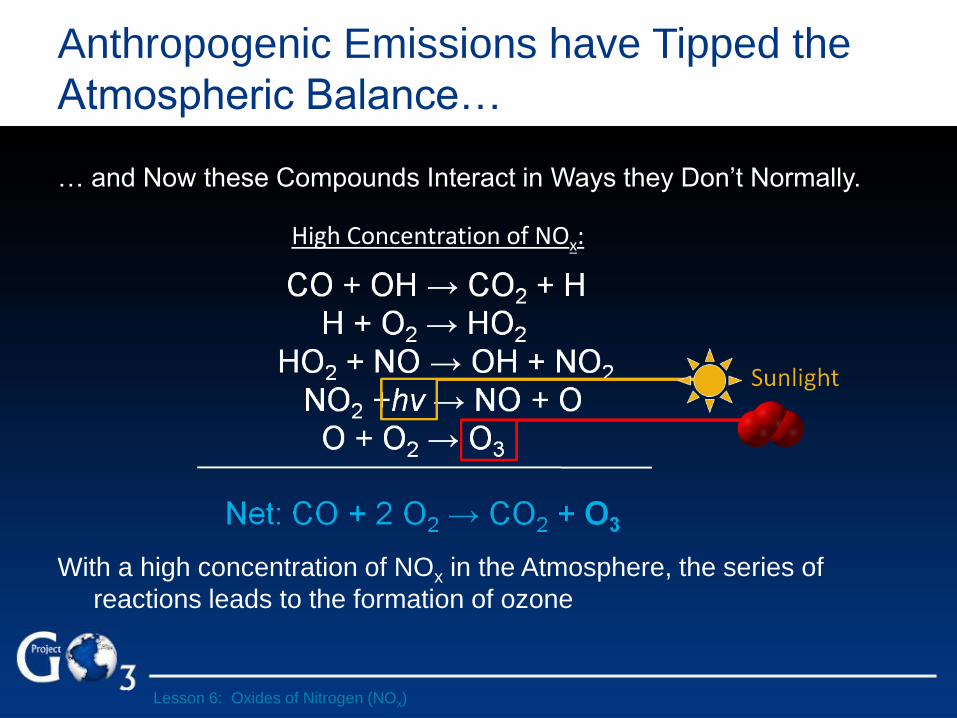
Anthropogenic Emissions have Tipped the
Atmospheric Balance…
… and Now these Compounds Interact in Ways they Don’t Normally.
With a high concentration of NOx in the Atmosphere, the series of
reactions leads to the formation of ozone
High Concentration of NOx:
Lesson 6: Oxides of Nitrogen (NOx)
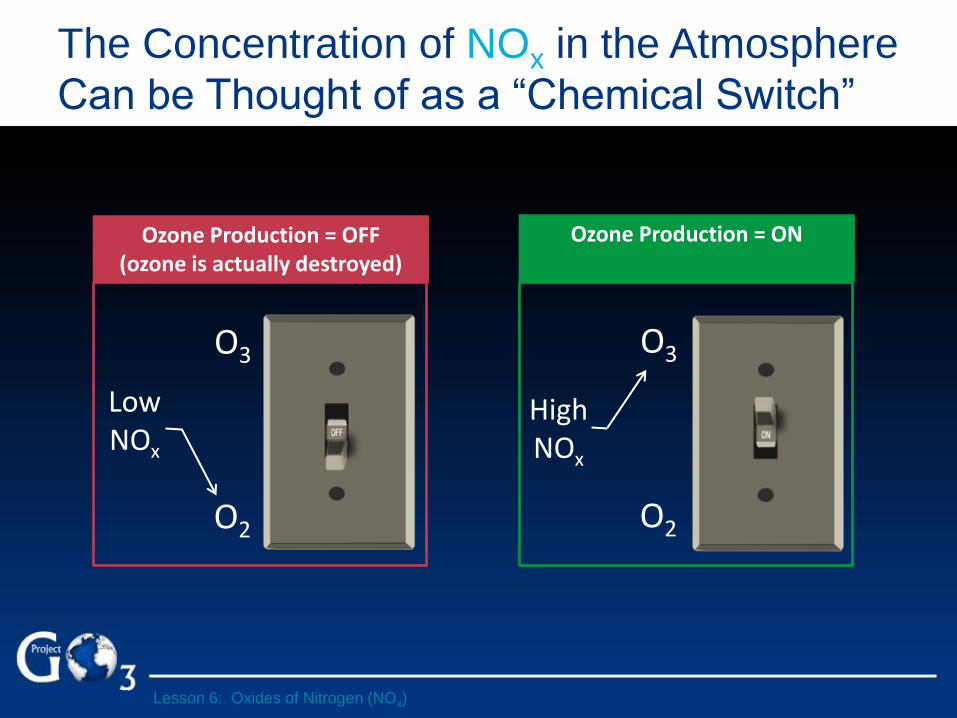
The Concentration of NOx in the Atmosphere
Can be Thought of as a “Chemical Switch”
Low NOx
O3
O2
Ozone Production = OFF (ozone is actually destroyed)
O3
O2
Ozone Production = ON
High NOx
Lesson 6: Oxides of Nitrogen (NOx)

Global Ozone Project
Curriculum
Rev 13
Lesson 7: Sunlight and Weather
Learning Objectives
At the end of this lesson students will be able to:
• Describe the role of sunlight in the formation of ground level
ozone.
• Explain ozone transport locally and globally.
• Identify the role of temperature, humidity, rain, and temperature
inversions play in ground level ozone concentrations.
• Describe the seasonality of ground level ozone.
Lesson 7: Sunlight and Weather
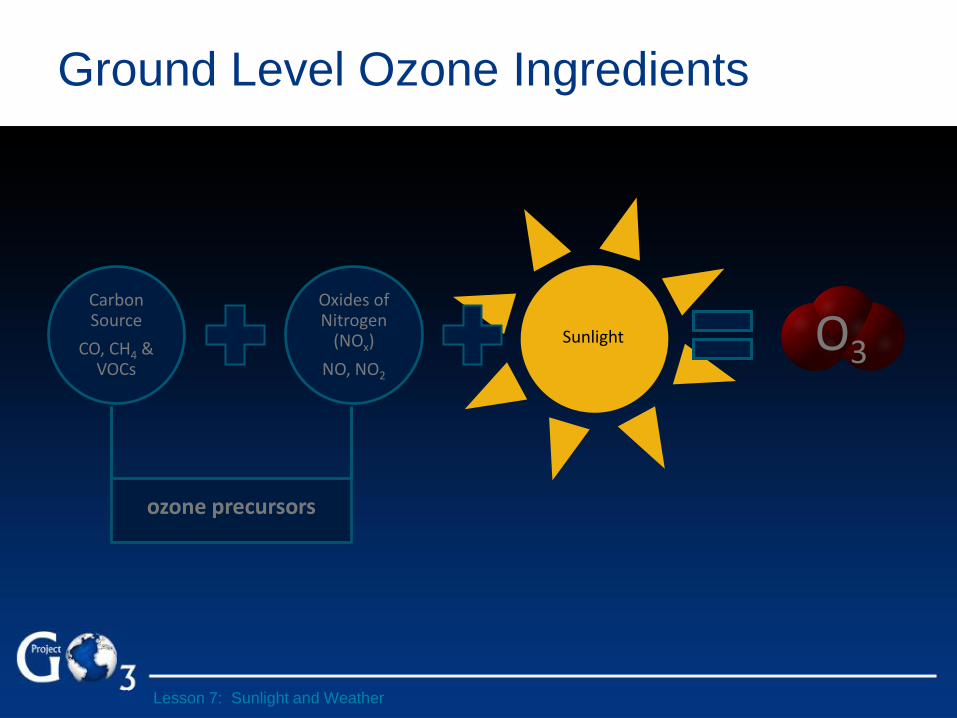
Carbon Source
CO, CH4 & VOCs
Oxides of Nitrogen
(NOx)
NO, NO2
Sunlight O3
Ground Level Ozone Ingredients
ozone precursors
Lesson 7: Sunlight and Weather

The Role of Sunlight in the Formation of
Ozone
Let’s take a closer look at
steps 4 and 5 in the
equation with CO as the
precursor:
1. CO + OH → CO2 + H
2. H + O2 → HO2
3. HO2 + NO → OH + NO2
4. NO2 + hv → NO + O
5. O + O2 → O3
This is why sunlight is needed
to produce ozone + = O2 O O3
O O
N
O
N
Step 4
Step 5
Lesson 7: Sunlight and Weather
How Weather Affects Ozone
Production and Transport
Lesson 7: Sunlight and Weather
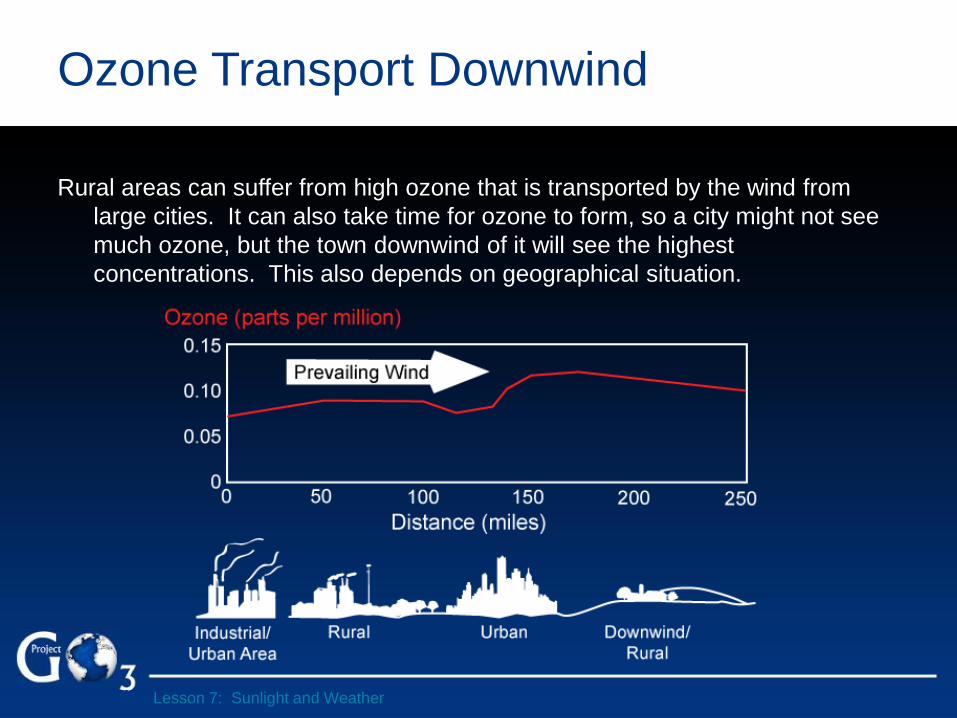
Ozone Transport Downwind
Rural areas can suffer from high ozone that is transported by the wind from
large cities. It can also take time for ozone to form, so a city might not see
much ozone, but the town downwind of it will see the highest
concentrations. This also depends on geographical situation.
Lesson 7: Sunlight and Weather
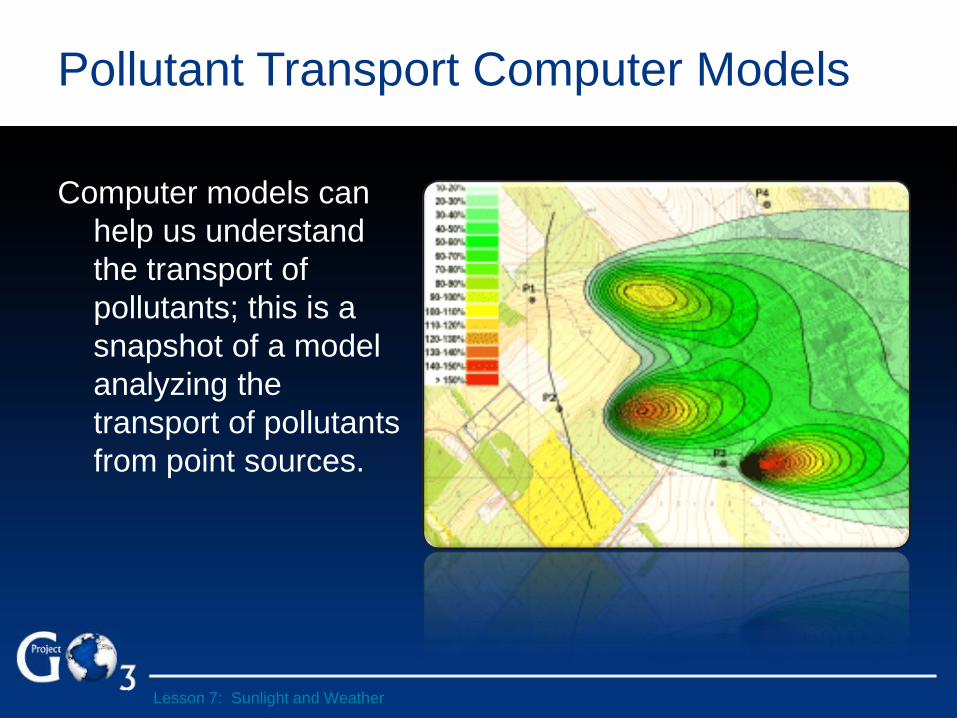
Pollutant Transport Computer Models
Computer models can
help us understand
the transport of
pollutants; this is a
snapshot of a model
analyzing the
transport of pollutants
from point sources.
Lesson 7: Sunlight and Weather

Local Conditions and Weather Phenomena
Affects Ozone Formation
Data collected with a satellite
shows Northern
Colorado’s (USA) average
concentration of NOx for
July of 2006. A local
upslope phenomenon
brings Denver’s NOx up
into the mountains, shown
here moving up a canyon
to the west of Denver.
This transport of NOx affects
ozone concentration along
the mountain range, as
shown in the next slide.
Mo
un
tain
s
Clear Creek Canyon
Lesson 7: Sunlight and Weather
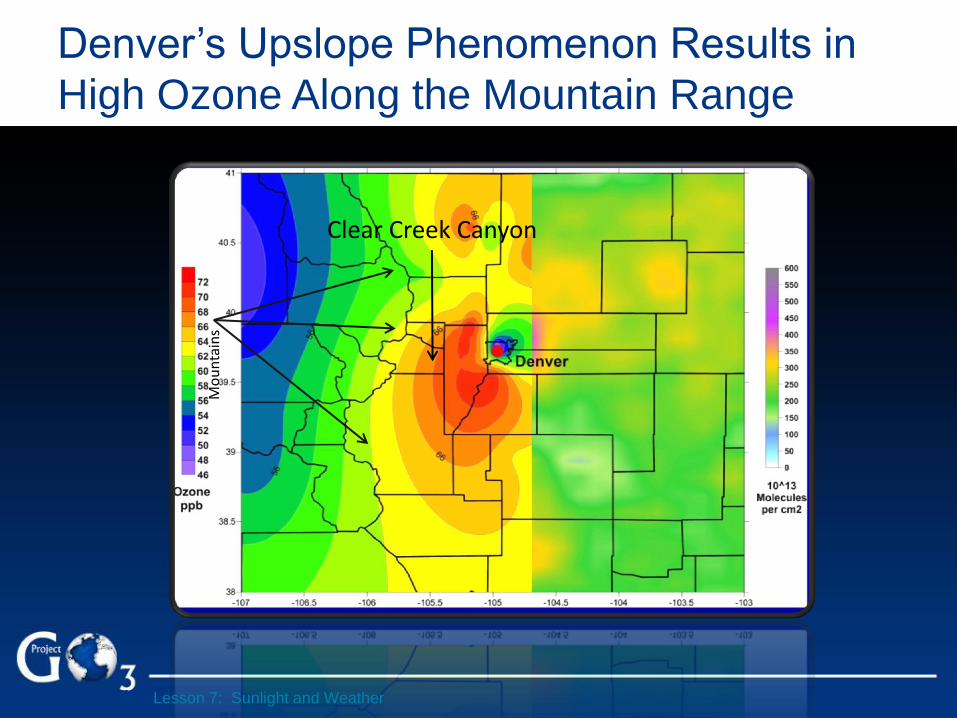
Denver’s Upslope Phenomenon Results in
High Ozone Along the Mountain Range
Mo
un
tain
s Clear Creek Canyon
Lesson 7: Sunlight and Weather
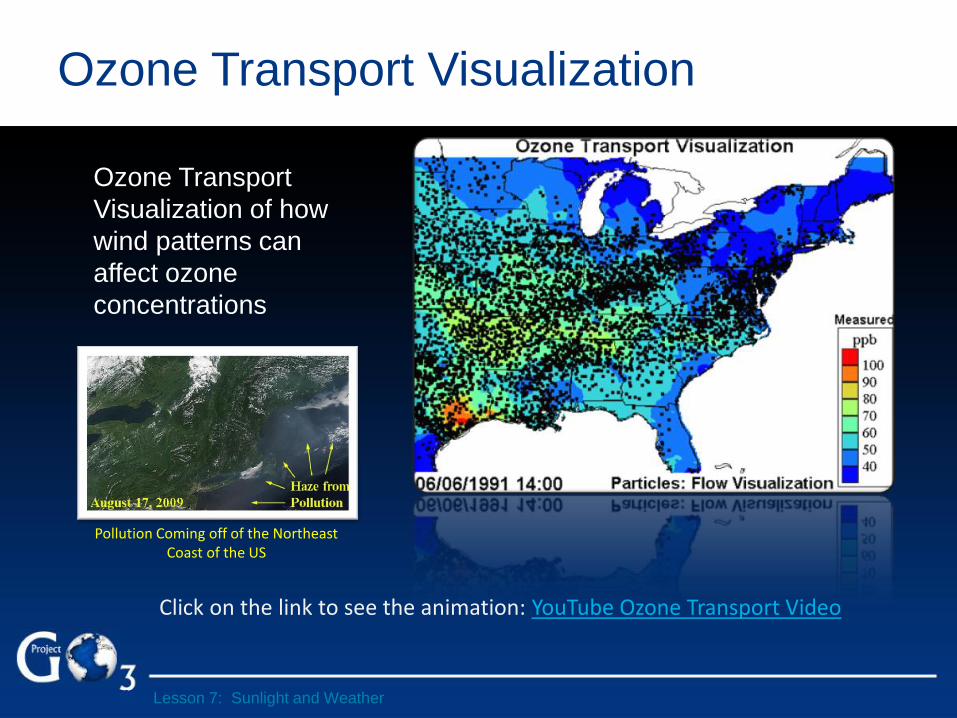
Ozone Transport Visualization
Ozone Transport
Visualization of how
wind patterns can
affect ozone
concentrations
Pollution Coming off of the Northeast Coast of the US
Lesson 7: Sunlight and Weather
Click on the link to see the animation: YouTube Ozone Transport Video
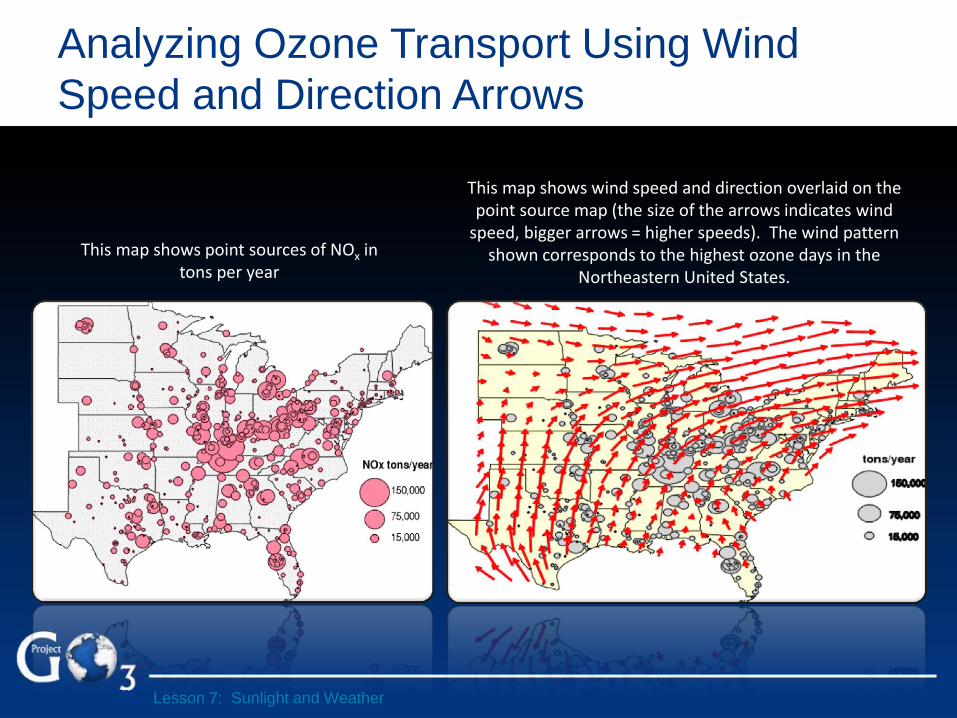
Analyzing Ozone Transport Using Wind
Speed and Direction Arrows
This map shows point sources of NOx in tons per year
This map shows wind speed and direction overlaid on the point source map (the size of the arrows indicates wind
speed, bigger arrows = higher speeds). The wind pattern shown corresponds to the highest ozone days in the
Northeastern United States.
Lesson 7: Sunlight and Weather
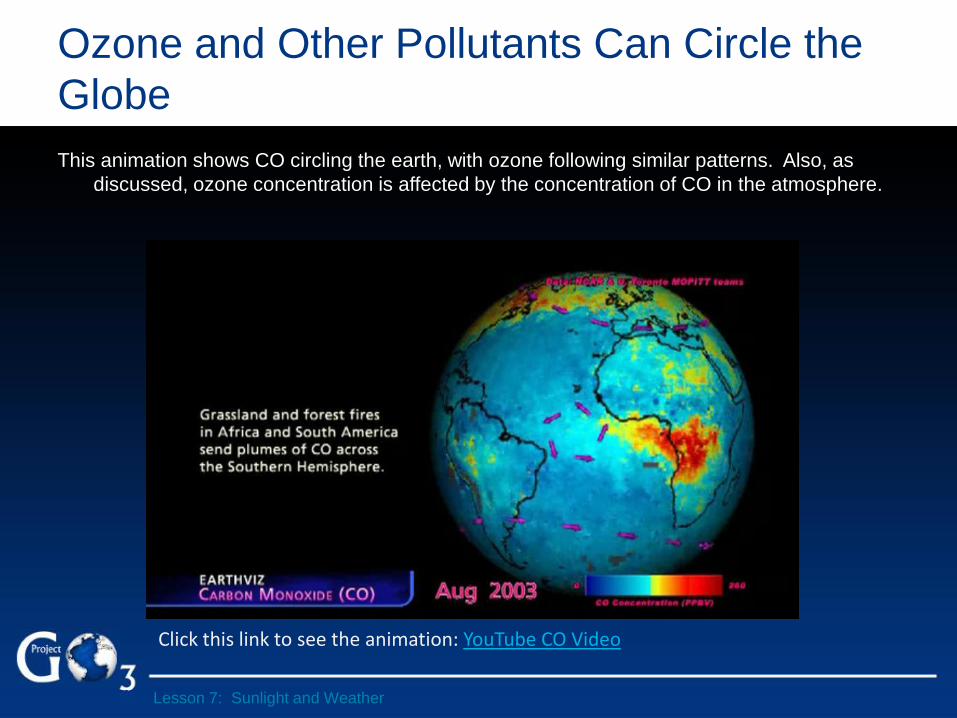
Ozone and Other Pollutants Can Circle the
Globe
This animation shows CO circling the earth, with ozone following similar patterns. Also, as
discussed, ozone concentration is affected by the concentration of CO in the atmosphere.
Click this link to see the animation: YouTube CO Video
Lesson 7: Sunlight and Weather
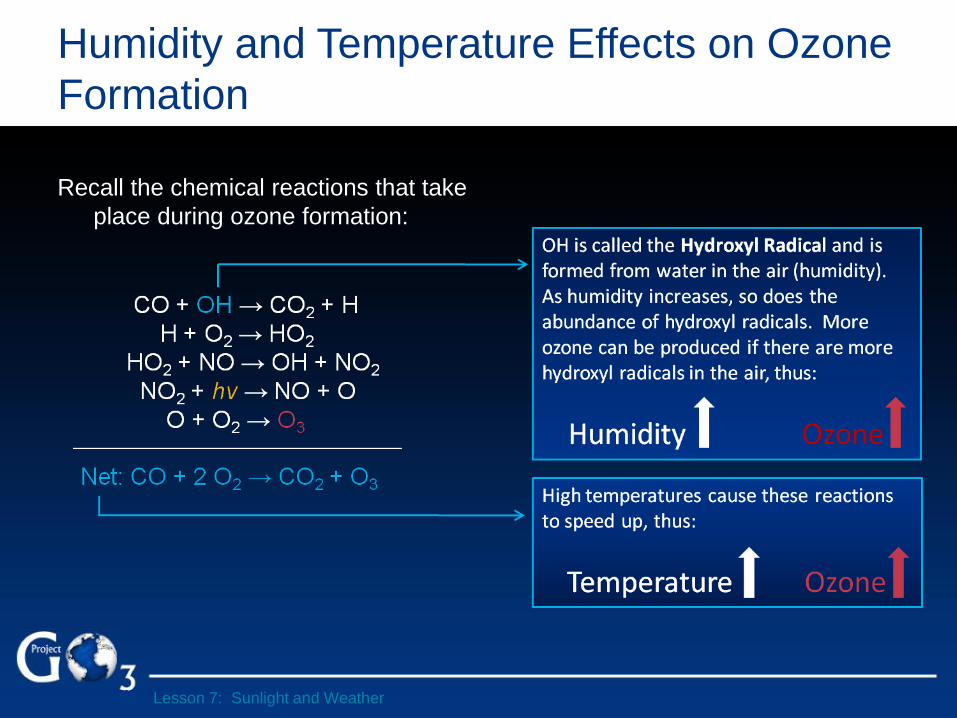
Humidity and Temperature Effects on Ozone
Formation
Recall the chemical reactions that take
place during ozone formation:
Lesson 7: Sunlight and Weather
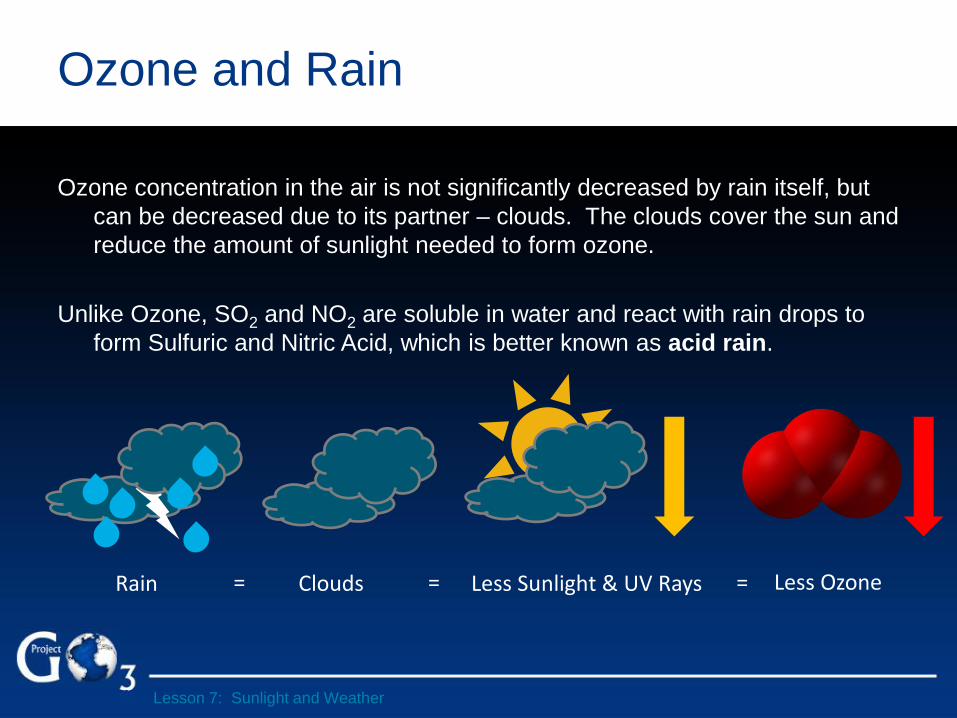
Ozone and Rain
Ozone concentration in the air is not significantly decreased by rain itself, but
can be decreased due to its partner – clouds. The clouds cover the sun and
reduce the amount of sunlight needed to form ozone.
Unlike Ozone, SO2 and NO2 are soluble in water and react with rain drops to
form Sulfuric and Nitric Acid, which is better known as acid rain.
Rain = Clouds = Less Sunlight & UV Rays = Less Ozone
Lesson 7: Sunlight and Weather
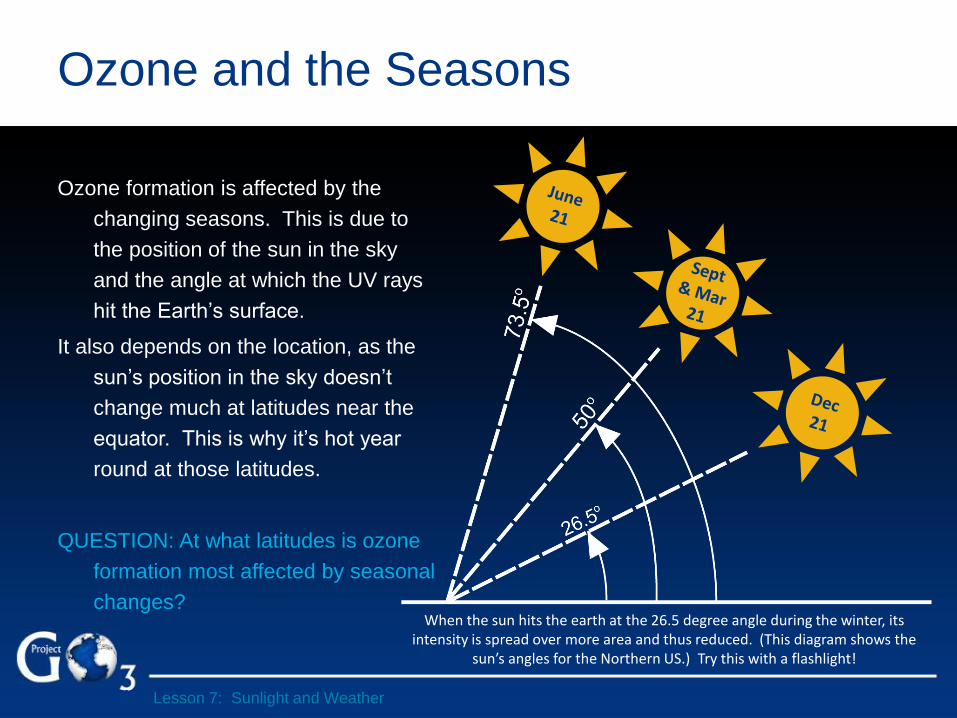
Ozone and the Seasons
Ozone formation is affected by the
changing seasons. This is due to
the position of the sun in the sky
and the angle at which the UV rays
hit the Earth’s surface.
It also depends on the location, as the
sun’s position in the sky doesn’t
change much at latitudes near the
equator. This is why it’s hot year
round at those latitudes.
QUESTION: At what latitudes is ozone
formation most affected by seasonal
changes? When the sun hits the earth at the 26.5 degree angle during the winter, its
intensity is spread over more area and thus reduced. (This diagram shows the sun’s angles for the Northern US.) Try this with a flashlight!
Lesson 7: Sunlight and Weather
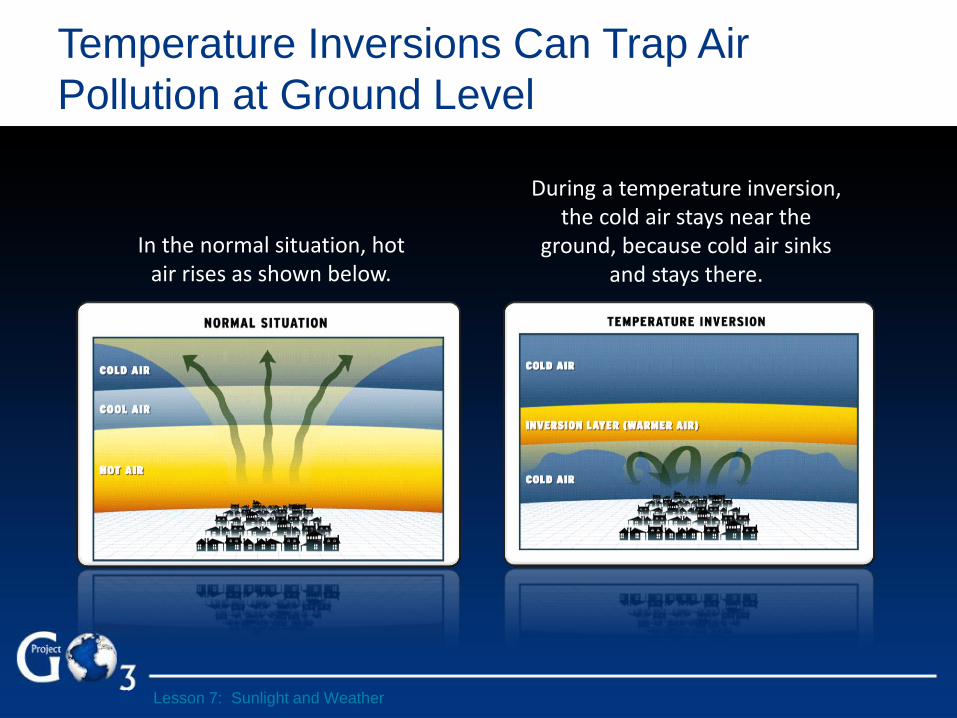
Temperature Inversions Can Trap Air
Pollution at Ground Level
In the normal situation, hot air rises as shown below.
During a temperature inversion, the cold air stays near the
ground, because cold air sinks and stays there.
Lesson 7: Sunlight and Weather
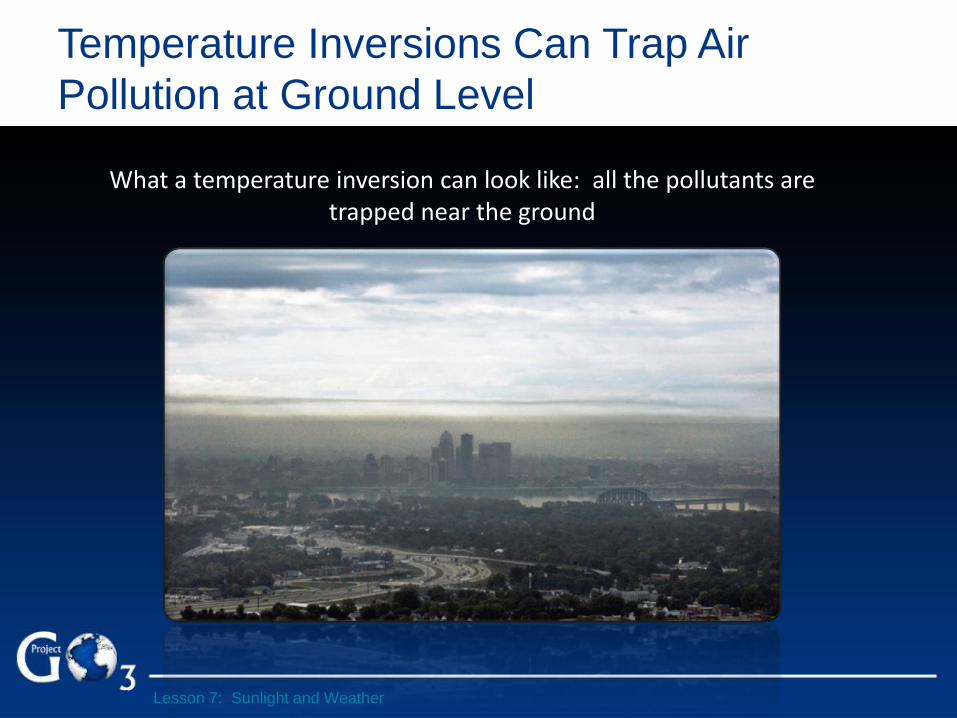
Temperature Inversions Can Trap Air
Pollution at Ground Level
What a temperature inversion can look like: all the pollutants are trapped near the ground
Lesson 7: Sunlight and Weather

Global Ozone Project
Curriculum
Rev 13
Lesson 8: Harmful Effects of Ground Level Ozone
Learning Objectives
At the end of this lesson students will be able
to:
• Describe ground level ozone’s effect on
humans and plants.
• Identify ozone as a greenhouse gas.
Lesson 8: Harmful Effects of Ground Level Ozone

The Pathways and Effects of Air Pollution
Lesson 8: Harmful Effects of Ground Level Ozone
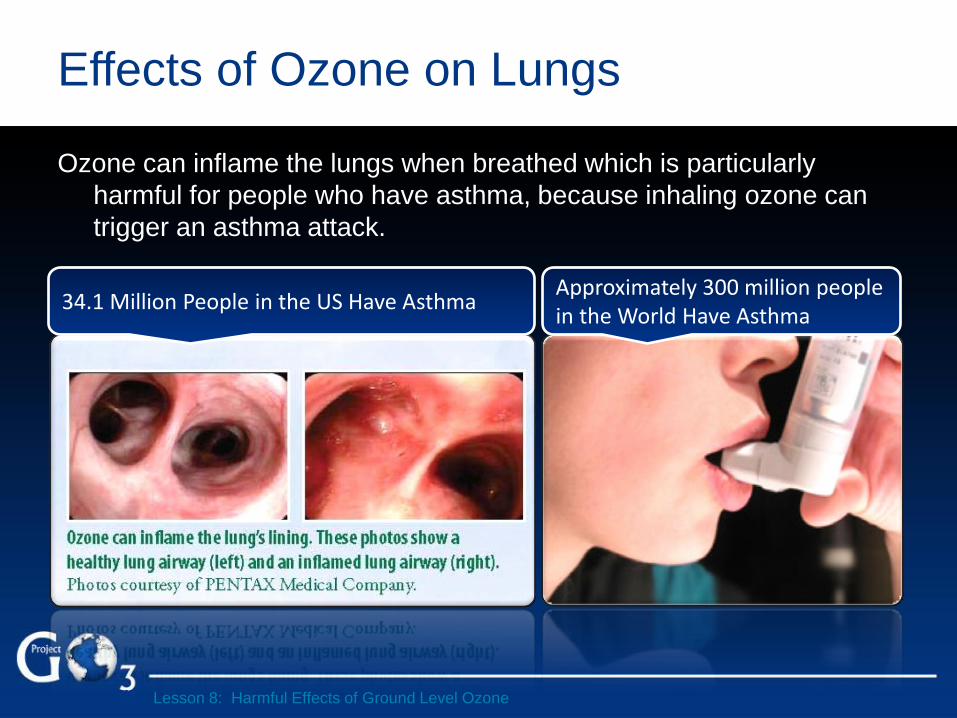
Effects of Ozone on Lungs
Ozone can inflame the lungs when breathed which is particularly
harmful for people who have asthma, because inhaling ozone can
trigger an asthma attack.
Approximately 300 million people in the World Have Asthma
34.1 Million People in the US Have Asthma
Lesson 8: Harmful Effects of Ground Level Ozone
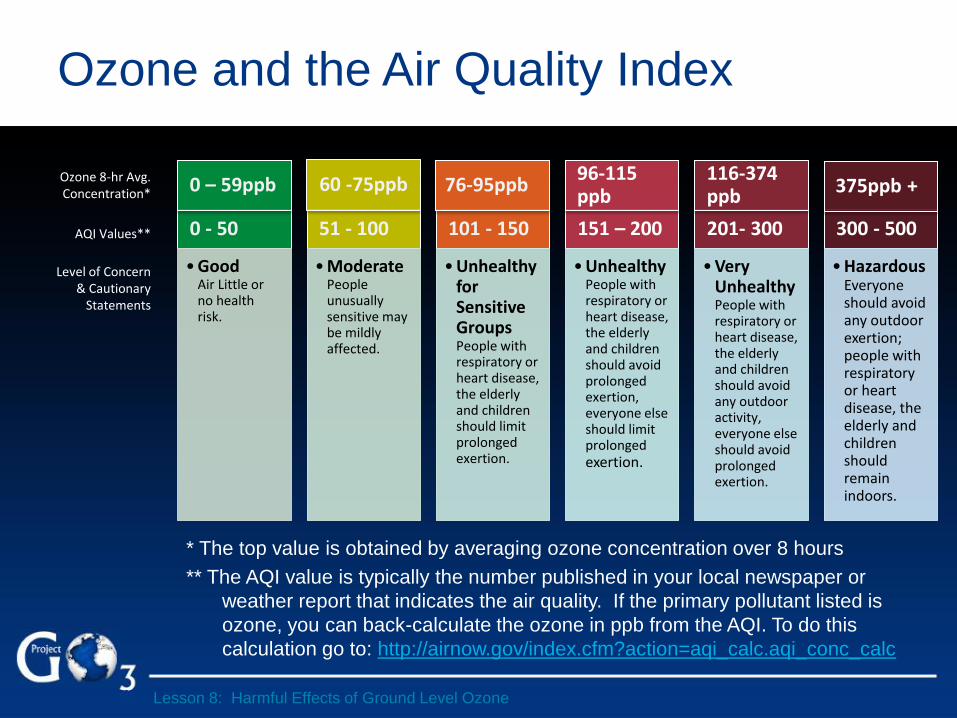
Ozone and the Air Quality Index
* The top value is obtained by averaging ozone concentration over 8 hours
** The AQI value is typically the number published in your local newspaper or
weather report that indicates the air quality. If the primary pollutant listed is
ozone, you can back-calculate the ozone in ppb from the AQI. To do this
calculation go to: http://airnow.gov/index.cfm?action=aqi_calc.aqi_conc_calc
0 - 50
• Good Air Little or no health risk.
51 - 100
• Moderate People unusually sensitive may be mildly affected.
101 - 150
• Unhealthy for Sensitive Groups People with respiratory or heart disease, the elderly and children should limit prolonged exertion.
151 – 200
• Unhealthy People with respiratory or heart disease, the elderly and children should avoid prolonged exertion, everyone else should limit prolonged exertion.
201- 300
• Very Unhealthy People with respiratory or heart disease, the elderly and children should avoid any outdoor activity, everyone else should avoid prolonged exertion.
300 - 500
• Hazardous Everyone should avoid any outdoor exertion; people with respiratory or heart disease, the elderly and children should remain indoors.
0 – 59ppb 60 -75ppb 76-95ppb 96-115 ppb
116-374 ppb 375ppb +
Ozone 8-hr Avg. Concentration*
AQI Values**
Level of Concern & Cautionary
Statements
Lesson 8: Harmful Effects of Ground Level Ozone
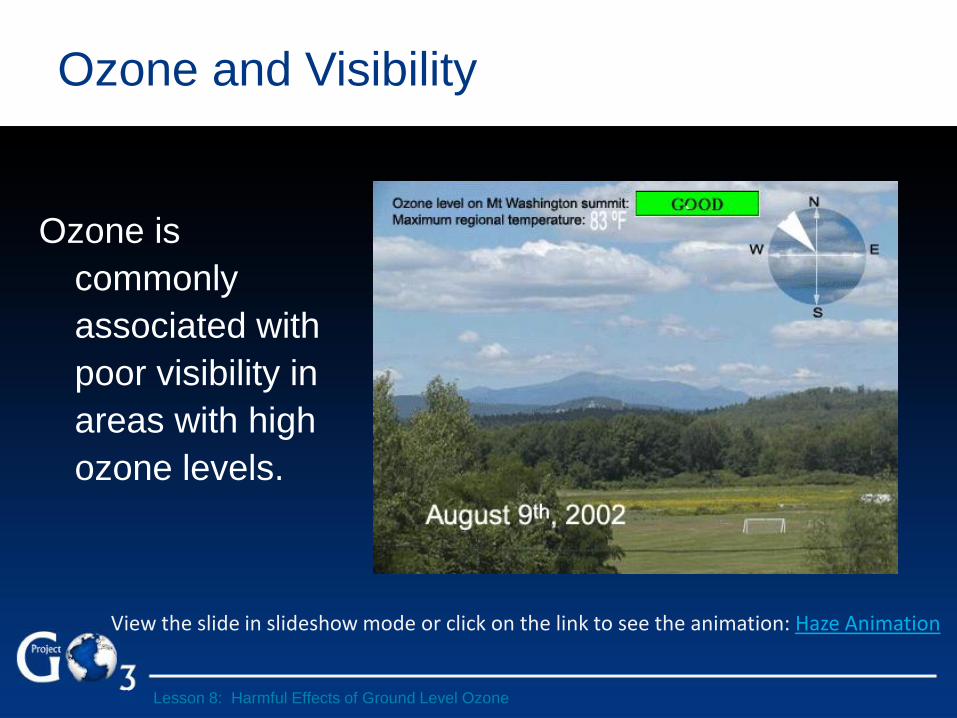
Ozone and Visibility
Ozone is
commonly
associated with
poor visibility in
areas with high
ozone levels.
Lesson 8: Harmful Effects of Ground Level Ozone
View the slide in slideshow mode or click on the link to see the animation: Haze Animation

Effects of Ozone on Crop Production
15 ppb 80 ppb 100 ppb
Effects of Ozone on Crop Production
This chart shows crop reductions for various crops as a function of
increased ozone levels.
QUESTION: Which crop is the most sensitive?
Lesson 8: Harmful Effects of Ground Level Ozone
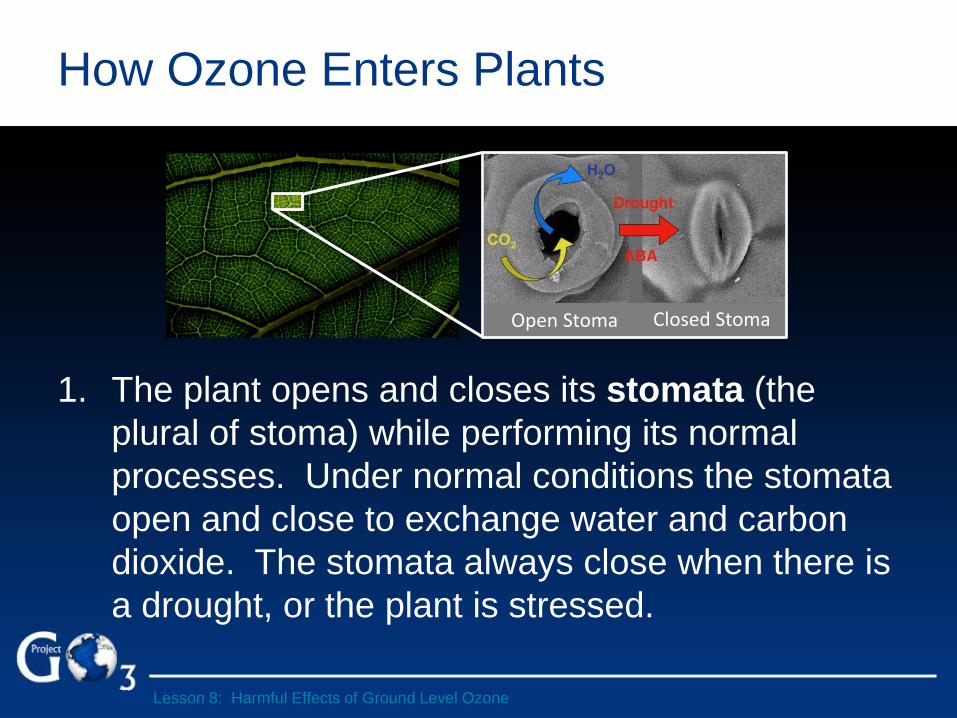
How Ozone Enters Plants
1. The plant opens and closes its stomata (the
plural of stoma) while performing its normal
processes. Under normal conditions the stomata
open and close to exchange water and carbon
dioxide. The stomata always close when there is
a drought, or the plant is stressed.
Open Stoma Closed Stoma
Lesson 8: Harmful Effects of Ground Level Ozone
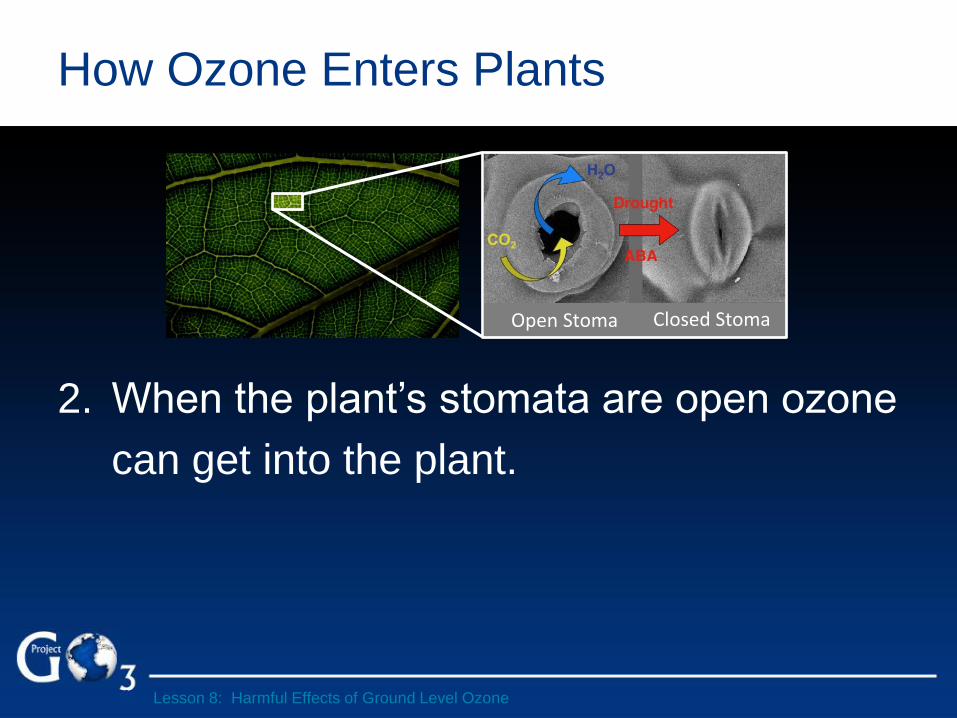
How Ozone Enters Plants
2. When the plant’s stomata are open ozone
can get into the plant.
Open Stoma Closed Stoma
Lesson 8: Harmful Effects of Ground Level Ozone

How Ozone Enters Plants
3. When the plant detects that ozone is
entering the stomata, it closes its stomata
so that no more ozone can get in.
Open Stoma Closed Stoma
Lesson 8: Harmful Effects of Ground Level Ozone
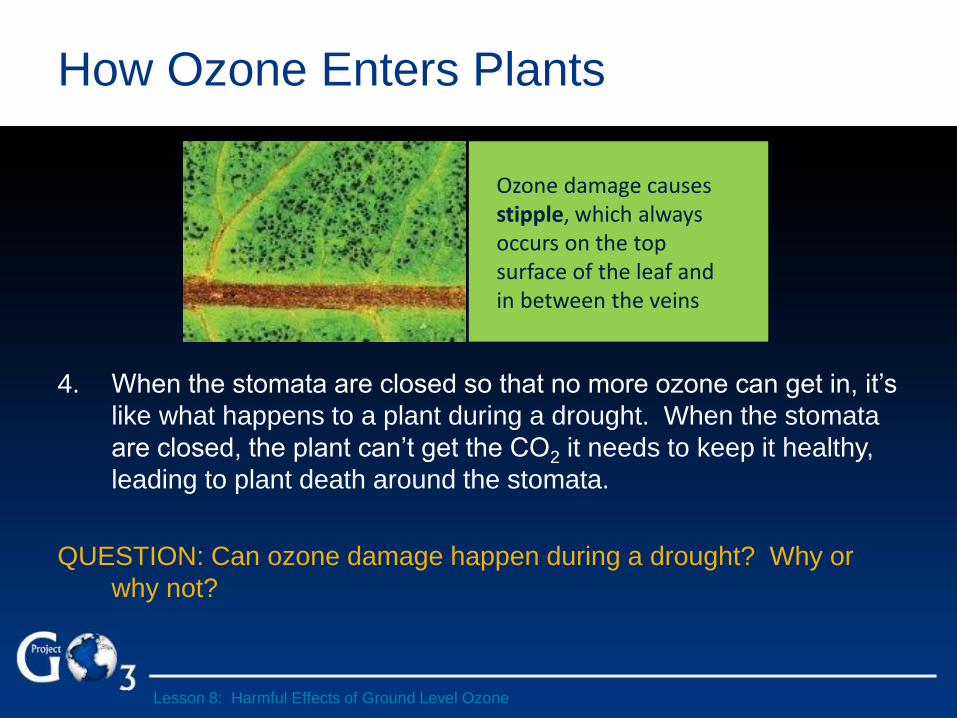
How Ozone Enters Plants
4. When the stomata are closed so that no more ozone can get in, it’s
like what happens to a plant during a drought. When the stomata
are closed, the plant can’t get the CO2 it needs to keep it healthy,
leading to plant death around the stomata.
QUESTION: Can ozone damage happen during a drought? Why or
why not?
Ozone damage causes stipple, which always occurs on the top surface of the leaf and in between the veins
Lesson 8: Harmful Effects of Ground Level Ozone
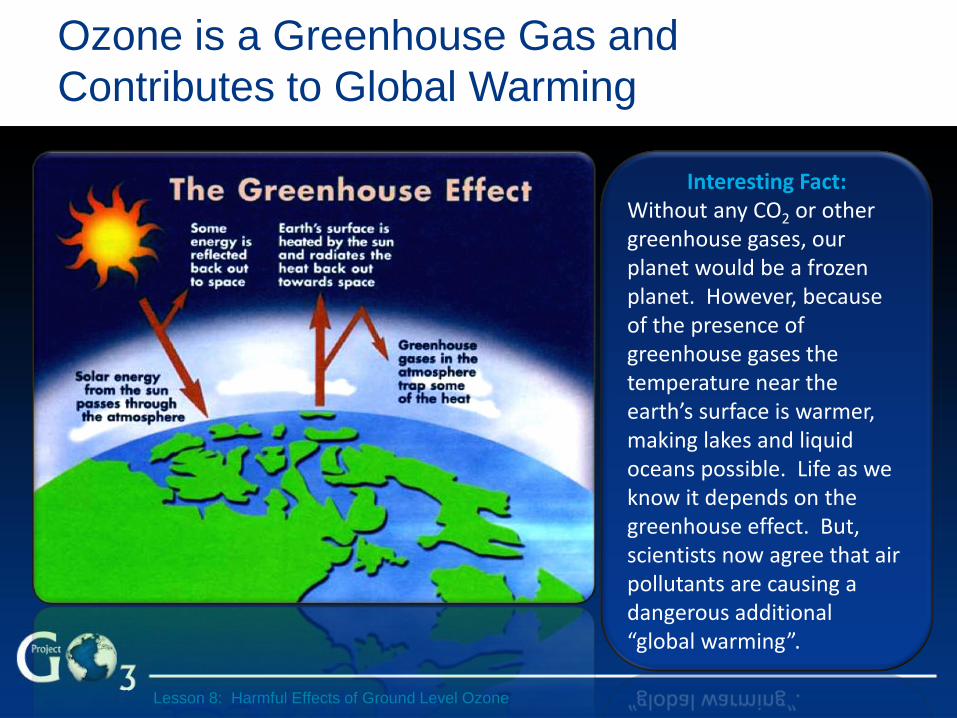
Ozone is a Greenhouse Gas and
Contributes to Global Warming
Interesting Fact: Without any CO2 or other greenhouse gases, our planet would be a frozen planet. However, because of the presence of greenhouse gases the temperature near the earth’s surface is warmer, making lakes and liquid oceans possible. Life as we know it depends on the greenhouse effect. But, scientists now agree that air pollutants are causing a dangerous additional “global warming”.
Lesson 8: Harmful Effects of Ground Level Ozone
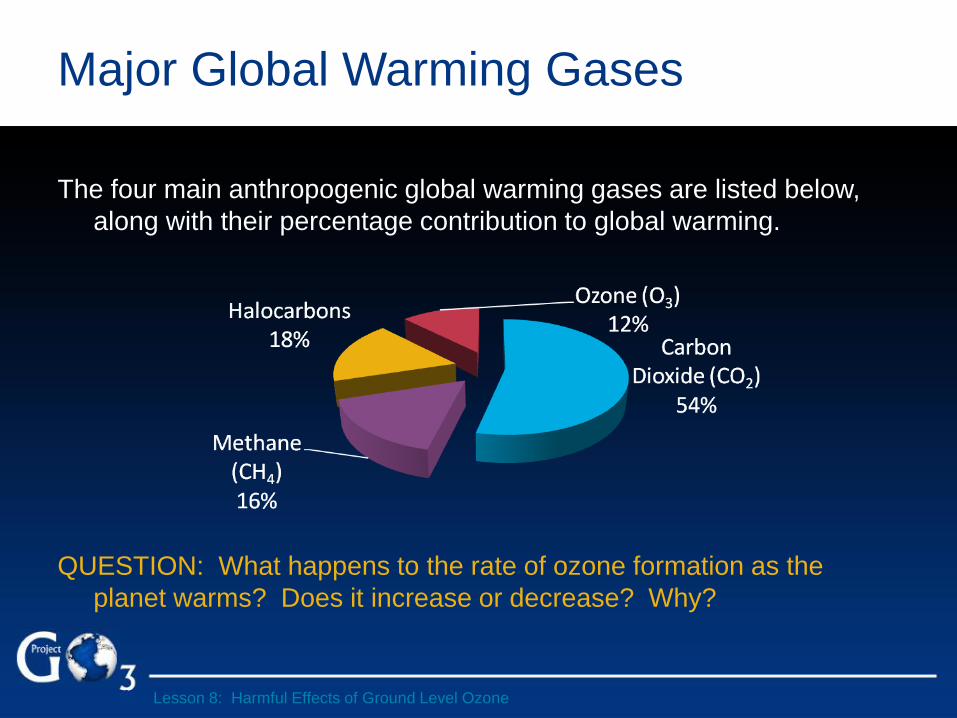
Major Global Warming Gases
The four main anthropogenic global warming gases are listed below,
along with their percentage contribution to global warming.
QUESTION: What happens to the rate of ozone formation as the
planet warms? Does it increase or decrease? Why?
Lesson 8: Harmful Effects of Ground Level Ozone

Global Ozone Project
Curriculum
Rev 13
Lesson 9: Stratospheric Ozone and the Ozone Hole
Learning Objectives
At the end of this lesson the students will be able to:
• Identify the main causes of stratospheric ozone depletion.
• Explain Dobson Units and how they are used to describe the thickness of the ozone layer.
• Describe why the ozone hole occurs over Antarctica.
• Discuss the requirements of the Montreal Protocol.
Lesson 9: Stratospheric Ozone and the Ozone Hole
The Stratospheric Ozone Layer: a Giant
Umbrella for Earth
Lesson 9: Stratospheric Ozone and the Ozone Hole
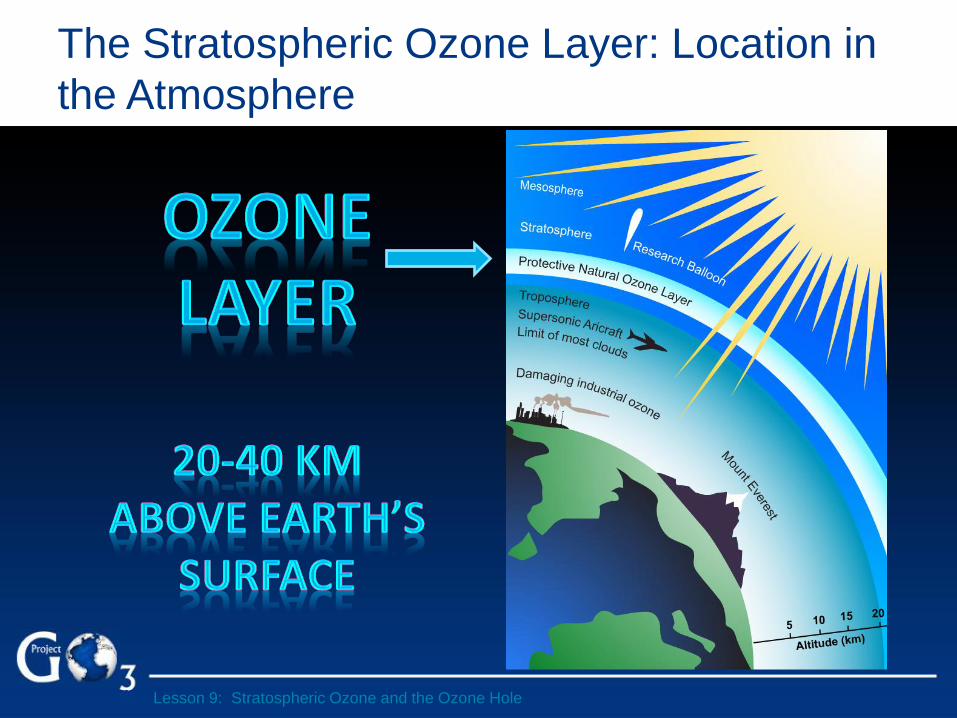
The Stratospheric Ozone Layer: Location in
the Atmosphere
Lesson 9: Stratospheric Ozone and the Ozone Hole

The Stratospheric Ozone Layer: Filters Out
Many of the Sun’s Harmful Rays
Lesson 9: Stratospheric Ozone and the Ozone Hole

Thinning of the Ozone Layer Over Antarctica
These satellite images illustrate the development of the ozone
hole during the 1980s and 1990s. Dark blue colors
correspond to the thinnest ozone, while light blue, green, and
yellow indicate thicker ozone. (Image courtesy of the NASA
GSFC Scientific Visualization Studio.)
Lesson 9: Stratospheric Ozone and the Ozone Hole
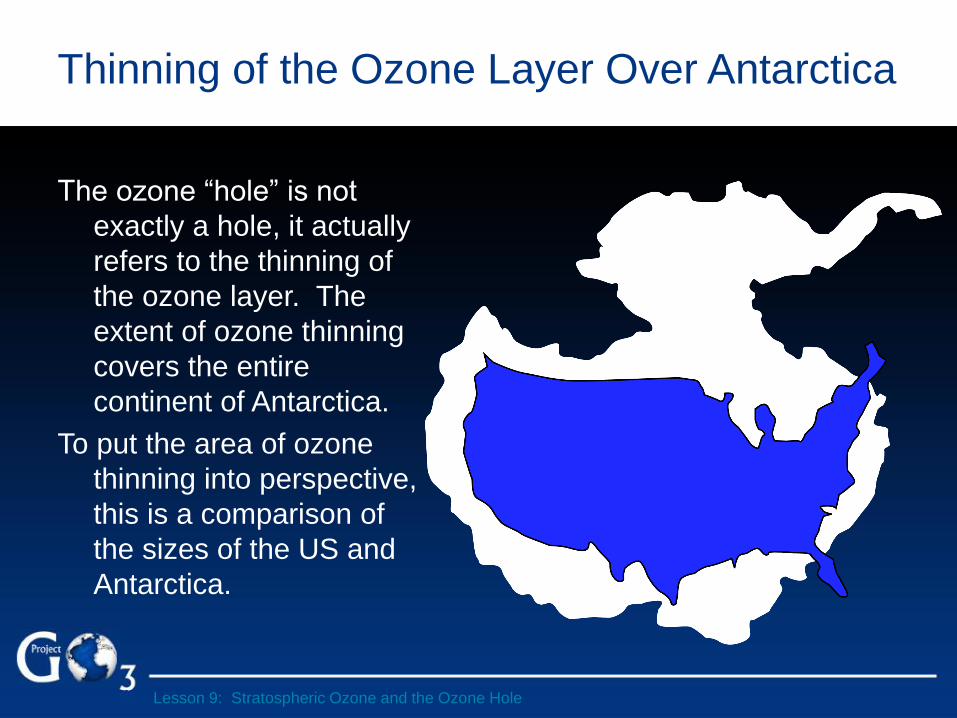
Thinning of the Ozone Layer Over Antarctica
The ozone “hole” is not
exactly a hole, it actually
refers to the thinning of
the ozone layer. The
extent of ozone thinning
covers the entire
continent of Antarctica.
To put the area of ozone
thinning into perspective,
this is a comparison of
the sizes of the US and
Antarctica.
Lesson 9: Stratospheric Ozone and the Ozone Hole
The Thickness of the Ozone
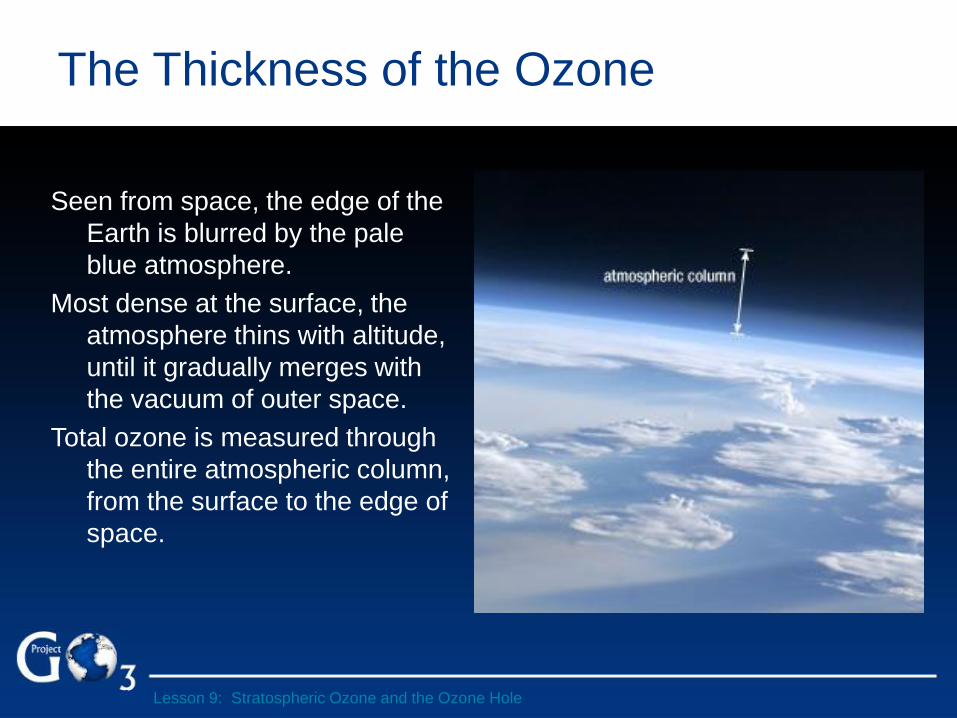
Seen from space, the edge of the
Earth is blurred by the pale
blue atmosphere.
Most dense at the surface, the
atmosphere thins with altitude,
until it gradually merges with
the vacuum of outer space.
Total ozone is measured through
the entire atmospheric column,
from the surface to the edge of
space.
Lesson 9: Stratospheric Ozone and the Ozone Hole
The Thickness of the Ozone Layer is
Measured in Dobson Units
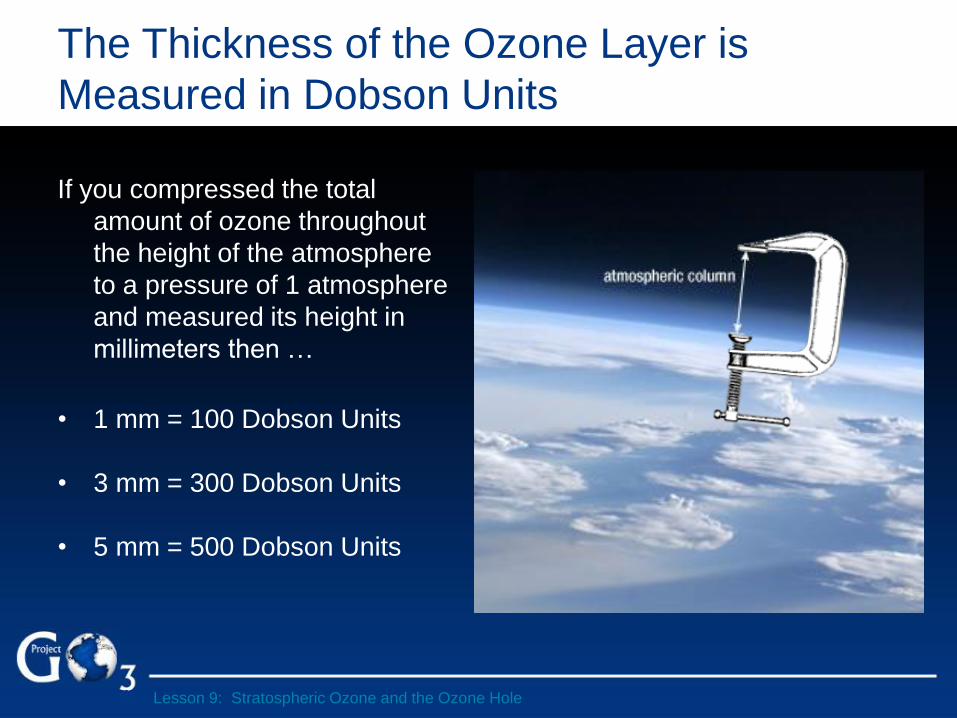
If you compressed the total
amount of ozone throughout
the height of the atmosphere
to a pressure of 1 atmosphere
and measured its height in
millimeters then …
• 1 mm = 100 Dobson Units
• 3 mm = 300 Dobson Units
• 5 mm = 500 Dobson Units
Lesson 9: Stratospheric Ozone and the Ozone Hole
The Global Average Ozone is 300 DU
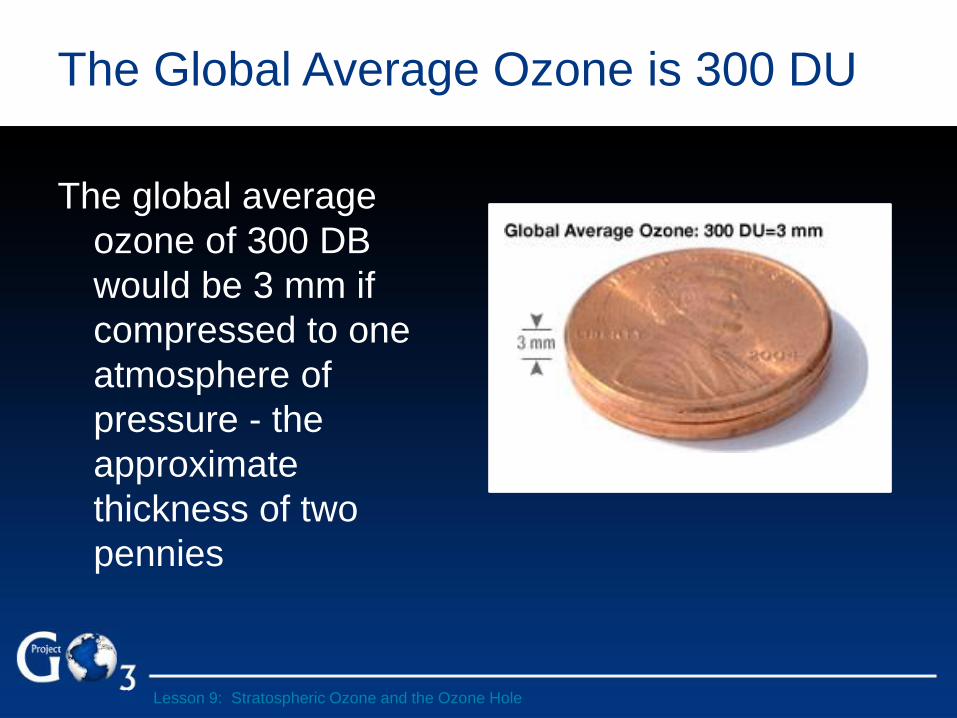
The global average
ozone of 300 DB
would be 3 mm if
compressed to one
atmosphere of
pressure - the
approximate
thickness of two
pennies
Lesson 9: Stratospheric Ozone and the Ozone Hole
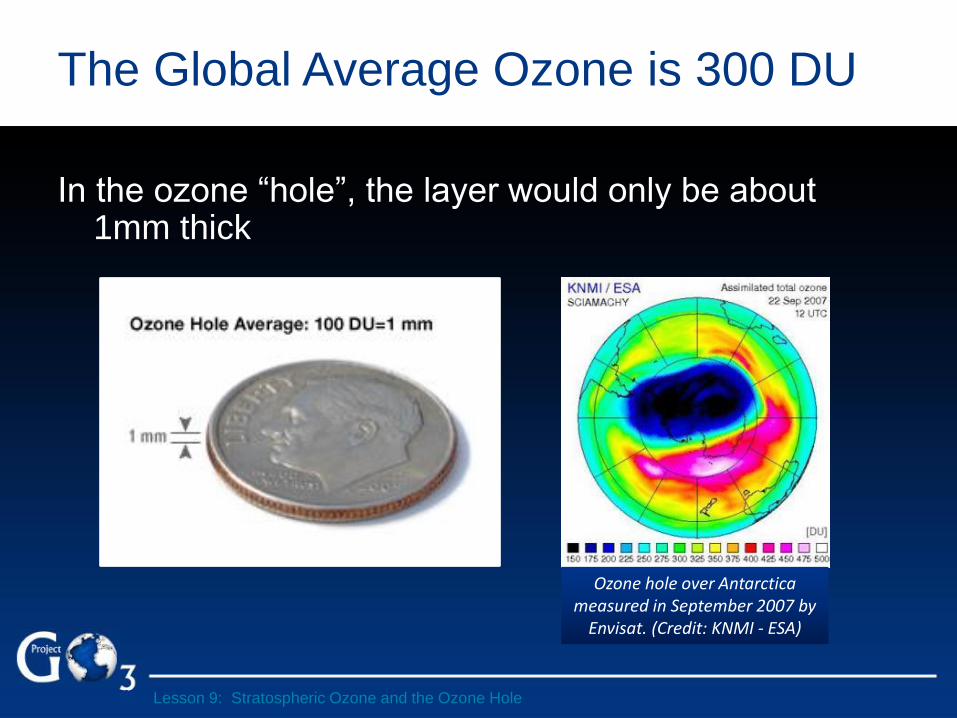
The Global Average Ozone is 300 DU
In the ozone “hole”, the layer would only be about 1mm thick
Ozone hole over Antarctica measured in September 2007 by
Envisat. (Credit: KNMI - ESA)
Lesson 9: Stratospheric Ozone and the Ozone Hole

Methods of Measuring Ozone in the
Stratosphere
Scientists have many different
methods of measuring the amount
of ozone in the stratosphere
Scientists launch a balloon sonde in Antarctica
Lesson 9: Stratospheric Ozone and the Ozone Hole
2.
3. 4.
1.
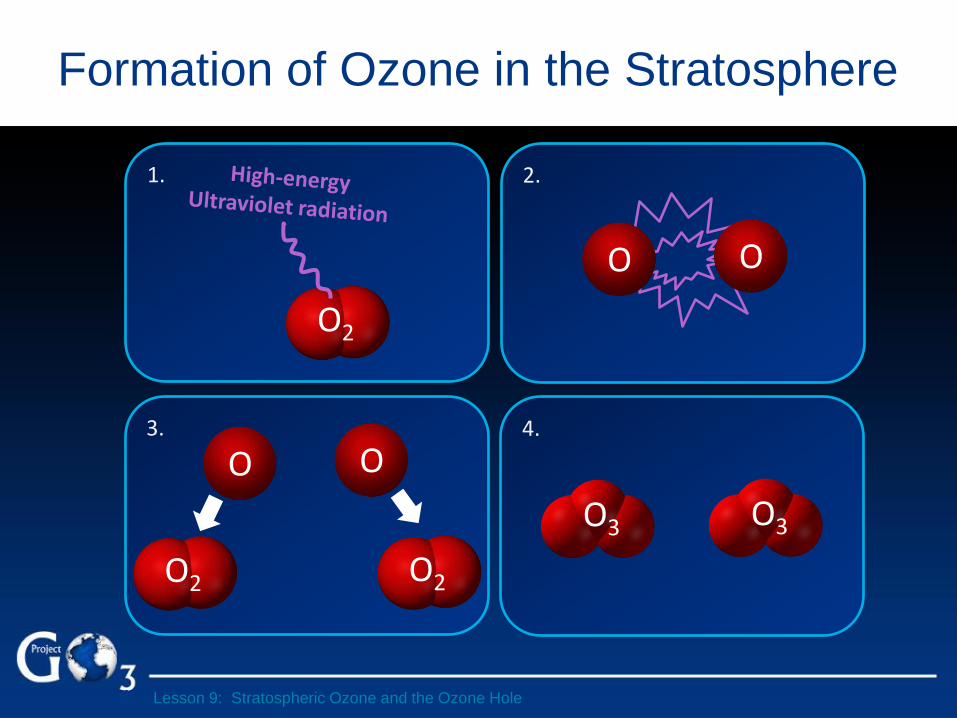
Formation of Ozone in the Stratosphere
O O
O2
O2 O2
O3 O3
O O
Lesson 9: Stratospheric Ozone and the Ozone Hole
Video
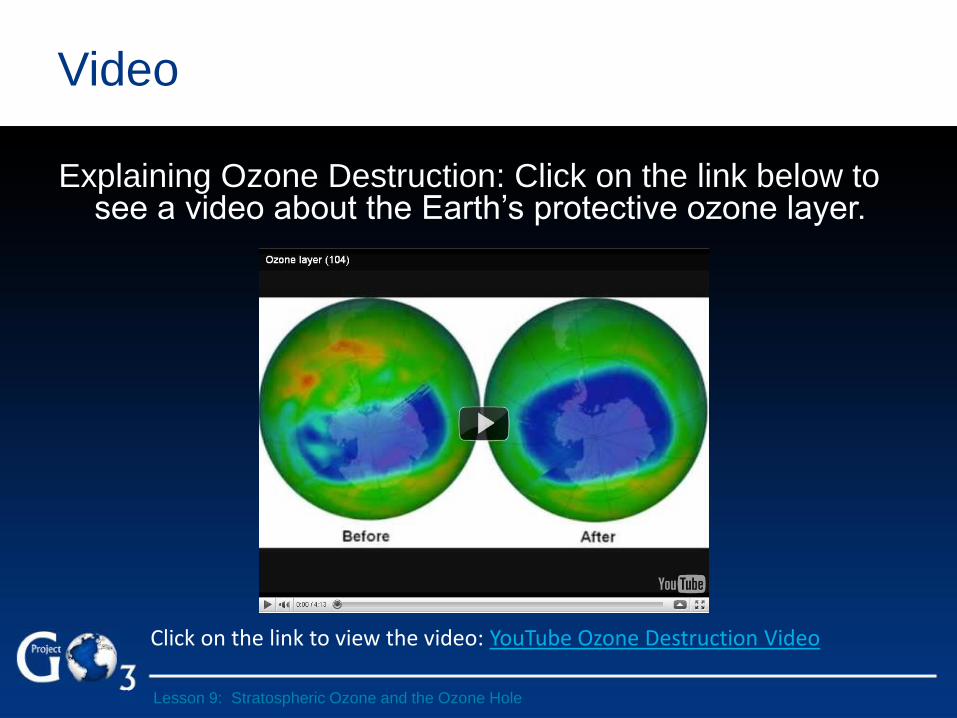
Explaining Ozone Destruction: Click on the link below to see a video about the Earth’s protective ozone layer.
Lesson 9: Stratospheric Ozone and the Ozone Hole
Click on the link to view the video: YouTube Ozone Destruction Video
NASA Video
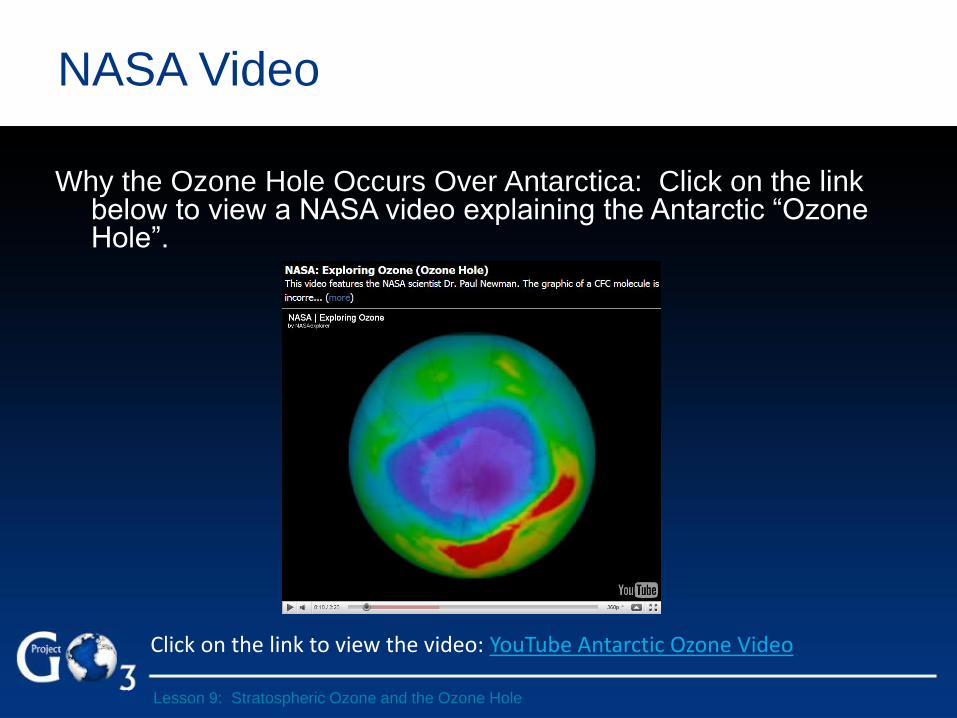
Why the Ozone Hole Occurs Over Antarctica: Click on the link below to view a NASA video explaining the Antarctic “Ozone Hole”.
Lesson 9: Stratospheric Ozone and the Ozone Hole
Click on the link to view the video: YouTube Antarctic Ozone Video

Ozone Depleting Substances
Lesson 9: Stratospheric Ozone and the Ozone Hole

Brief Timeline of Major Events in the
Discovery of the Ozone Hole
Interesting Fact: Even though NASA had been
measuring worldwide ozone since 1974, they
initially “missed” detecting the ozone hole,
because their computer was programmed to
discard all ozone data that was below 180
Dobson Units. It was previously thought to be
impossible for the ozone layer to be thinner
than 180 Dobson Units, so NASA initially
thought the data was incorrect.
1928 1956 1974 1978 1985
1986
The first CFCs are made by DuPont
The British Antarctic Survey begins making
ground-based measurements of
ozone over Antarctica
Scientists Molina and Rowland publish a
study that shows CFCs have the potential to
destroy ozone
British Antarctic Survey scientists Farman, Gardiner, and Shanklin publish a paper
describing the ozone hole based on their ground-based measurements
NASA begins to make worldwide ozone measurements by
satellite
NASA confirms
the ozone
hole with satellite
data
Lesson 9: Stratospheric Ozone and the Ozone Hole
Montreal Protocol
The Montreal Protocol on Substances That Deplete the Ozone
Layer is an international treaty designed to protect the ozone layer
by phasing out the production of a number of substances (CFCs and
related compounds) responsible for ozone depletion. It outlines two
timelines, one for developed countries and one for developing
countries.
Due to its widespread adoption and implementation it has been hailed
as an example of exceptional international co-operation with Kofi
Annan, the Former Secretary General of the United Nations, quoted
as saying that the Montreal Protocol is "perhaps the single most
successful international agreement to date“.
Lesson 9: Stratospheric Ozone and the Ozone Hole
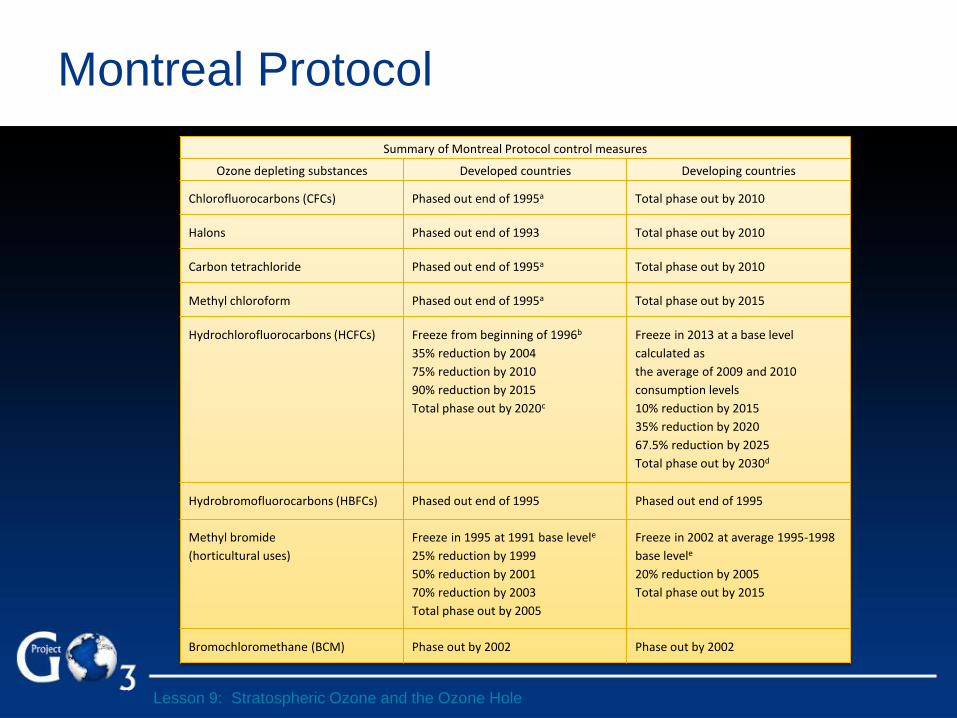
Montreal Protocol
Summary of Montreal Protocol control measures
Ozone depleting substances Developed countries Developing countries
Chlorofluorocarbons (CFCs) Phased out end of 1995a Total phase out by 2010
Halons Phased out end of 1993 Total phase out by 2010
Carbon tetrachloride Phased out end of 1995a Total phase out by 2010
Methyl chloroform Phased out end of 1995a Total phase out by 2015
Hydrochlorofluorocarbons (HCFCs) Freeze from beginning of 1996b
35% reduction by 2004
75% reduction by 2010
90% reduction by 2015
Total phase out by 2020c
Freeze in 2013 at a base level
calculated as
the average of 2009 and 2010
consumption levels
10% reduction by 2015
35% reduction by 2020
67.5% reduction by 2025
Total phase out by 2030d
Hydrobromofluorocarbons (HBFCs) Phased out end of 1995 Phased out end of 1995
Methyl bromide
(horticultural uses)
Freeze in 1995 at 1991 base levele
25% reduction by 1999
50% reduction by 2001
70% reduction by 2003
Total phase out by 2005
Freeze in 2002 at average 1995-1998
base levele
20% reduction by 2005
Total phase out by 2015
Bromochloromethane (BCM) Phase out by 2002 Phase out by 2002
Lesson 9: Stratospheric Ozone and the Ozone Hole
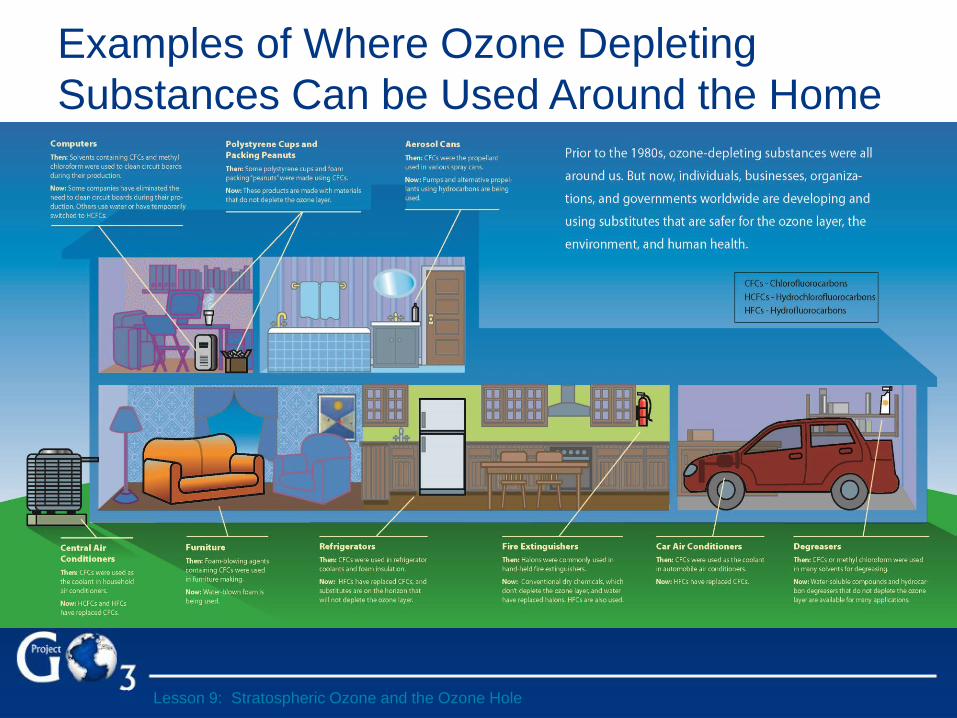
Examples of Where Ozone Depleting
Substances Can be Used Around the Home
Lesson 9: Stratospheric Ozone and the Ozone Hole
Global Ozone Project
Curriculum
Rev 13
Lesson 10:
How an Ozone Monitor
Works
Learning Objectives
At the end of this lesson students will be able to:
• Define UV absorbance and explain how it is
used to detect ozone.
• Describe the important terms in the
mathematical equation for ozone concentration.
Lesson 10: How an Ozone Monitor Works
Ozone Monitor Video
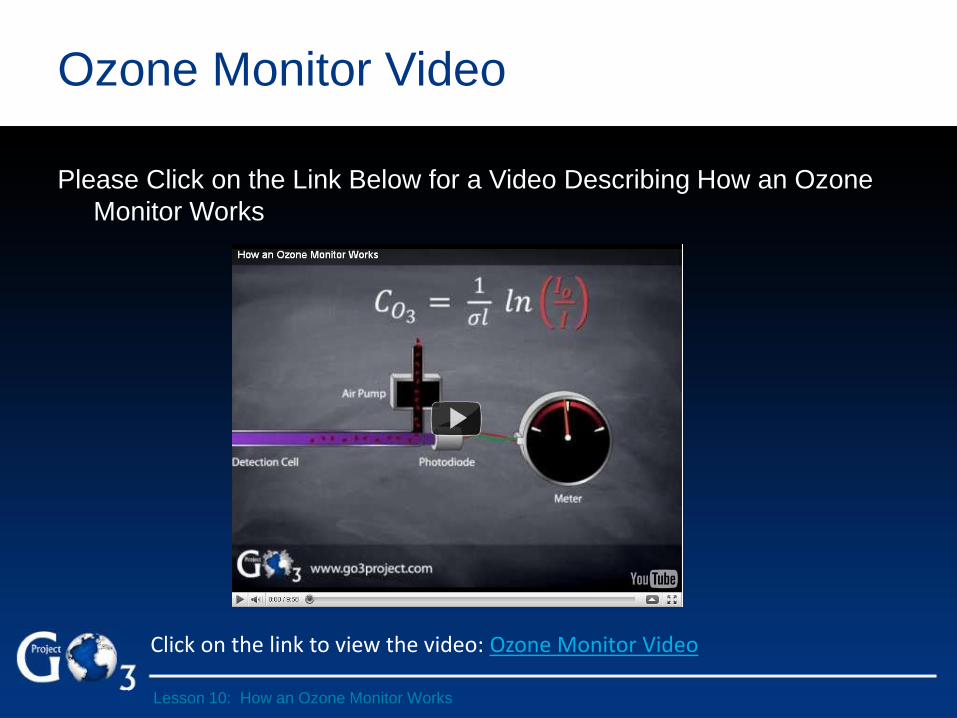
Please Click on the Link Below for a Video Describing How an Ozone
Monitor Works
Lesson 10: How an Ozone Monitor Works
Click on the link to view the video: Ozone Monitor Video

Global Ozone Project
Curriculum
Rev 13
Lesson 11: Data Collection and Integration

Learning Objectives
At the end of this lesson students will be
able to:
• Plot and analyze ozone data to identify
interesting trends and events.
Lesson 11: Data Collection and Interpretation
Lesson 11: Data Collection and Interpretation
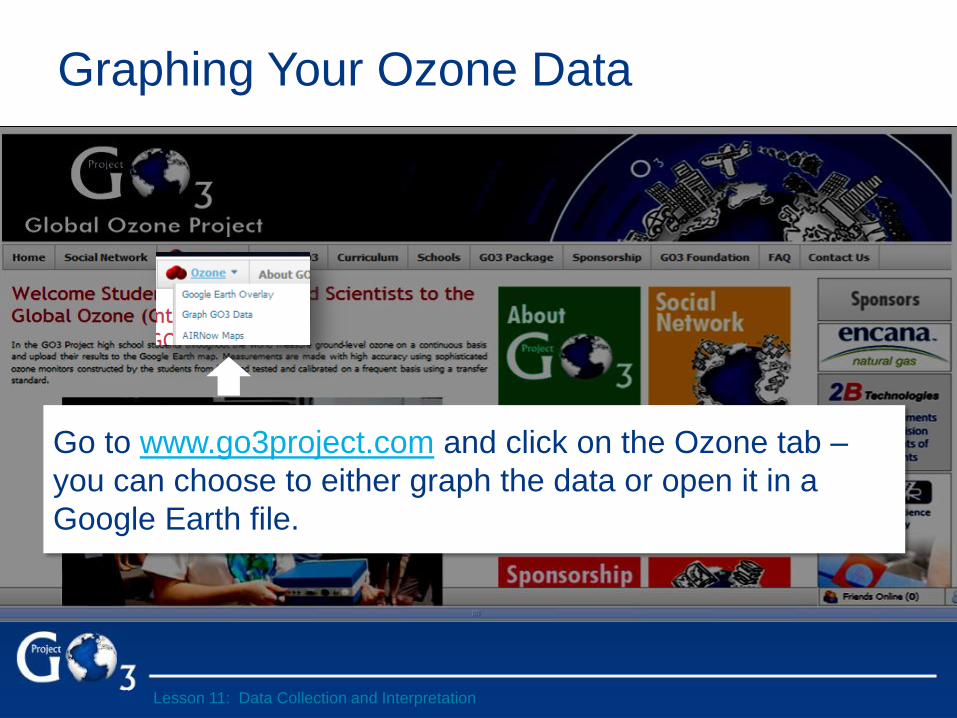
Graphing Your Ozone Data
Go to www.go3project.com and click on the Ozone tab –
you can choose to either graph the data or open it in a
Google Earth file.

Lesson 11: Data Collection and Interpretation
Google Earth Display of GO3 Data
Note that the time displayed for each measurement represents the local time at each location

Graph of GO3 Ozone Data
Lesson 11: Data Collection and Interpretation
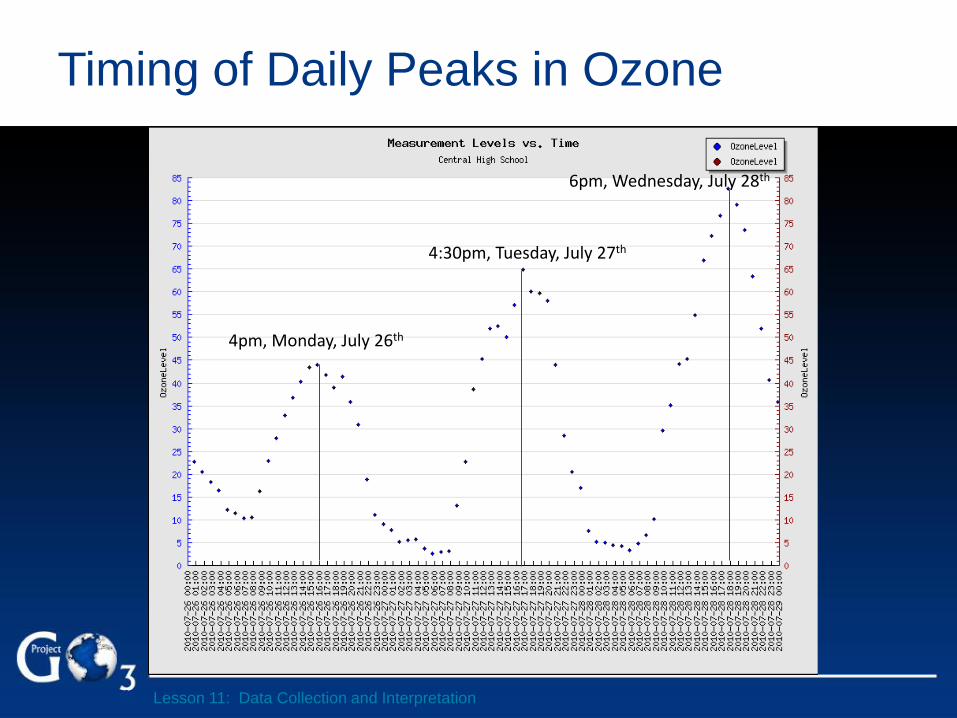
4pm, Monday, July 26th
4:30pm, Tuesday, July 27th
6pm, Wednesday, July 28th
Timing of Daily Peaks in Ozone
Lesson 11: Data Collection and Interpretation

Ozone “Spikes” at Night
Lesson 11: Data Collection and Interpretation
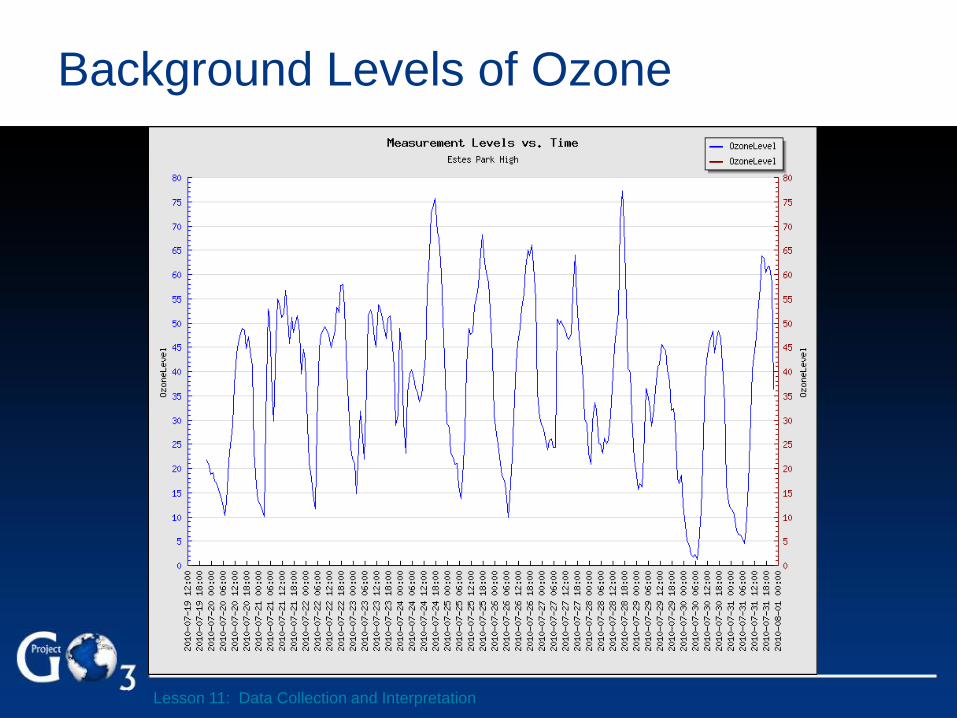
Background Levels of Ozone
Lesson 11: Data Collection and Interpretation
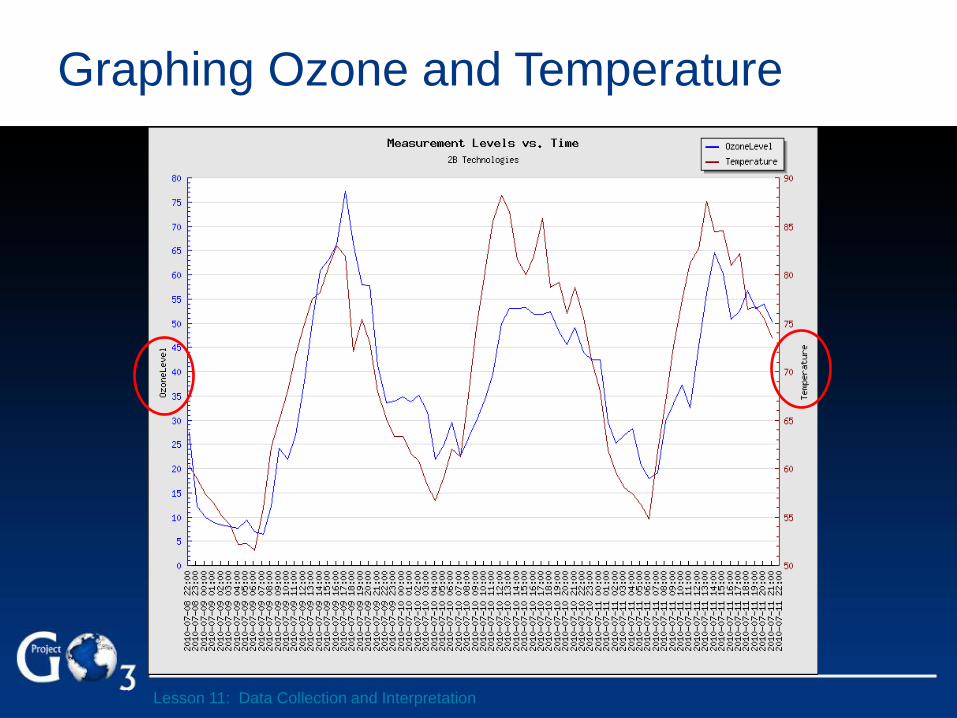
Graphing Ozone and Temperature
Lesson 11: Data Collection and Interpretation

Graphing Ozone and Humidity
Lesson 11: Data Collection and Interpretation
Global Ozone Project
Curriculum
Rev 13
Lesson 12: Sustainable Technologies and Renewable Energies UNDER CONSTRUCTION

Global Ozone Project
Curriculum
Rev 13
Lesson 13: What Can You Do? UNDER CONSTRUCTION