Embed Size (px)
Citation preview
MANAGEMENT SCIENCEVol, 52, No, 1, January 2006, pp, 85-94ISSN 0025-19091 EISSN 1526-55011061520110083
DOI 10,1287/mnsc,1050,0446©2006 INFORMS
Less Likely to Fail: Low Performance,Firm Size, and Factory Expansion in
the Shipbuilding Industry
Pino G. AudiaHaas School of Business, University of California, Berkeley, California 94720-1900,
audia@haas,berkeley,edu
Henrich R. GreveNorwegian School of Management BI, Elias Smiths vei 15, Box 580, 1302 Sandvika, Norway,
henrich,greve@bi,no
The behavioral theory of the firm and prospect theory predict that performance below an aspiration levelincreases risk taking, but researchers also propose that performance below an aspiration level decreases risk
taking. These conflicting predictions primarily hinge on whether decision makers perceive negative performanceas a repairable gap or as a threat to firm survival. This study examines a boundary condition of these conflictingpredictions. We argue that a firm's resource endowment affects decision makers' risk tolerance: Managers infirms with large stocks of resources are buffered from the threat of failure and conform to the prediction ofgreater risk taking in response to performance decreases; managers in firms with limited resources view lowperformance as a step closer to failure and decrease risk taking in response to performance decreases. Usingdata on the risky decision of factory expansion in shipbuilding firms and firm size as an indicator of the stockof tangible resources, we find that performance below the aspiration level reduces risk taking in small firms,but either does not affect risk taking or increases risk taking in large firms. These findings are largely consistentwith our predictions and also suggest that large firms are more inert than small firms.
Key words: organizations; organizational decision making; risk takingHistory: Accepted by Daniel Levinthal, business strategy; received April 10, 2003. This paper was with the
authors 5 months for 2 revisions.
IntroductionThe behavioral perspective has guided much recentresearch on risky orgaruzational changes. Its centralargument is that decision makers use an aspirationlevel to evaluate performance and that the perfor-mance relative to the aspiration level influences theirinclination to take risks and make changes (Cyert andMarch 1963; March and Shapira 1987, 1992; Shapira1986). The theory is based on psychological processesof risk perception and preference (Kahneman andTversky 1979) and organizational processes of search(Cyert and March 1963).
Most studies adopting this theoretical perspectivesuggest that, when performance is above the aspi-ration level, increases in performance decrease risktaking (Bromiley et al. 2001, Nickel and Rodriguez2002). In contrast, the effect of changes in performancewhen performance falls below the aspiration levelremains subject to active debate (March and Shapira1987, 1992; Mone et al. 1998; Ocasio 1995; Sitkin andPablo 1992). Researchers have focused on two oppos-ing arguments. One proposes that performance belowthe aspiration level heightens awareness of needs for
improvement and stimulates risk taking (Cyert andMarch 1963, Kahneman and Tversky 1979), whereasthe other suggests that performance below the aspi-ration level heightens awareness of danger and leadsto risk aversion (Lopes 1987, Sitkin and Pablo 1992,Staw et al. 1981).
Although the debate regarding the conflicting pre-dictions of risk seeking and risk aversion has receivedconsiderable attention (March and Shapira 1987,1992;Mone et al. 1998; Ocasio 1995), it rests on lim-ited empirical evidence. Evidence of risk aversionwhen performance is below the aspiration levelcomes primarily from studies of risk behavior inresponse to orgaruzational decline (e.g., Greenhalgh1983, Cameron et al. 1987), manifested as a reduc-tion in financial resources. Because those studies focuson orgaruzations close to failure, it remains unclearwhether decision makers experiencing low but notnear-fatal performance would also show risk aver-sion. Except for two studies that provide some sug-gestive evidence (Miller and Bromiley 1990, Wisemanand Bromiley 1996), prior research does not show riskaversion when performance is below the aspirationlevel.
83
84Audia and Greve: Low Performance, Tirm Size, and Tactory Expansion in the Shipbuilding Industry
Management Science 52(1), pp. 83-94, ©2006 INFORMS
Evidence of risk seeking when performance isbelow the aspiration level is also relatively rare. Moststudies of organizational risk taking examine theeffect of performance on risk behavior, but assumethat this relationship is the same when performance isboth above and below the aspiration level (Bromiley1991, Singh 1986, Wiseman and Catanach 1997).Therefore, the researchers estimate the effect of per-formance on risk behavior as an average across theperformance range. Some studies have separated theperformance above and below aspiration levels andhave shown risk taking when performance is belowthe aspiration level (Gooding et al. 1996, Greve 1998,Ketchen and Palmer 1999, Miller and Chen 2004).
This study attempts to clarify the effect of per-formance on risk behavior by identifying organiza-tional conditions under which performance below theaspiration level leads to risk taking or risk aversion.Building on the shifting-focus model of risk taking(March and Shapira 1987, 1992), we propose that afirm's stock of resources affects risk behavior. Lowperformance can threaten the normal functioning of afirm and even its survival, but these consequences arelikely to be contingent on a firm's resource endow-ment (Levinthal 1991). Levels of low performance thatdo not normally threaten firms with large stocks ofresources can induce the failure of firms with lim-ited resources. We expect that managers of firms witha limited stock of resources perceive the low perfor-mance as a step closer to firm failure. Threatenedby the prospect of additional losses that can jeopar-dize the survival of the firm, these decision makersbecome risk averse. Their risk behavior presumablystems from a combination of their inability to gen-erate risky courses of action (Staw et al. 1981) andtheir choice of low-risk options that do not requireinvesting the firm's few remaining resources (Marchand Shapira 1992). In contrast, managers of firms withlarge stocks of resources are less concerned about therisk of incurring additional losses, because additionallosses would not threaten the firm's survival. Theylook more at the upside of decisions that require sub-stantial allocations of resources, and are more proneto make risky decisions.
We explore these ideas by examining the risk be-havior of small and large firms when performanceis below the aspiration level. Firm size is a primaryindicator of tangible resources and has been shown toreduce firm failure rates (Bruderl and Schussler 1990,Dobrev 2001, Levinthal 1991, Mitchell 1994). The spe-cific risk behavior we analyze is factory expansion byJapanese shipbuilders. Factory expansion is a riskydecision because the consequences are uncertain aridmay include losses (March and Shapira 1987, Palmerand Wiseman 1999, Ruefli et al. 1999). By upgradingproduction assets or adding employees, a firm can
overcome productivity gaps or capacity constraints,but additional investments can worsen the situationif the implementation of the expansion is not success-ful or if envirorvmental changes depress the marketserved by the factory. In shipbuilding, factories areimportant strategic assets that are risky because ofhigh fluctuations in demand. Having had 30% of theglobal market in recent years, the Japanese shipbuild-ing industry is an important subpopulation of firmswithin a single national context.
Theory and HypothesesThe Effect of Performance Below the AspirationLevel on Risk TakingResearch on organizational risk taking has beenguided primarily by two theories: the behavioral the-ory of the firm (Cyert and March 1963), in partic-ular the component regarding the search process,and prospect theory (Kahneman and Tversky 1979).Researchers have emphasized the similarities betweenthese two theories, noting that both theories pre-dict risk aversion when performance is above anaspiration level and risk seeking when performanceis below an aspiration level, and that both theo-ries base their predictions on the following threecomponents (e.g., Singh 1986, Lant and Montgomery1987, Bromiley 1991). First, the decision maker focusesattention on an aspiration level for performance. Inprospect theory, this aspiration level is the status quo,or a value of zero, whereas in the behavioral theory ofthe firm, the aspiration level is determined by socialor historical comparison. Second, the decision makeruses this aspiration level to code outcomes as failureswhen performance is below it and as successes whenperformance exceeds it. Third, the desire to overcomea performance failure is stronger than the desire toextend success, so decision makers below the aspi-ration level accept more risks than decision makersabove the aspiration level.
Although risk aversion when performance is abovethe aspiration level is widely accepted, the claim ofrisk seeking when performance is below the aspira-tion level has been controversial (Lopes 1987; Marchand Shapira 1987,1992; Ocasio 1995; Sitkin and Pablo1992). Researchers have proposed two related argu-ments for why performance below the aspiration levelmight lead to risk aversion rather than to risk seeking.Drawing primarily from research that developed thethreat-rigidity hypothesis (Staw et al. 1981), the firstargument holds that decision makers interpret perfor-mance below the aspiration level not as a repairablegap, as prospect theory and the behavioral theoryof the firm assume, but rather as a threat to theirvital interests (Milliken and Lant 1991, Sitkin and
Audia and Greve: Low Performance, Tirm Size, and Tactory Expansion in the Shipbuilding IndustryManagement Science 52(1), pp, 83-94, ©2006 INFORMS 85
Pablo 1992, Ocasio 1995, Mone et al. 1998). Percep-tions of threat lead to psychological stress and anxiety,which restricts information processing and reducesbehavioral flexibility. Finally, an inability to generateand consider risky alternatives makes decision mak-ers rigid and risk averse.
The second argument proposes that risk aversionresults from decision makers' motivational predispo-sitions (Lopes 1987). In this view, most decision mak-ers have a strong need for security and are moti-vated to avoid bad outcomes. When performance isbelow the aspiration level, they experience a conflictbetween the desire to improve the performance bymaking risky decisions and the desire to preserve aposition of safety by avoiding additional losses. Thisconflict gives rise to unstable risk preferences and toa greater frequency of low-risk choices than hypoth-esized by prospect theory and the behavioral theoryof the firm. These two arguments emphasize differ-ent processes underlying risk aversion—an inabilityto generate risky alternatives and a desire to preservea position of safety. However, both arguments implythat interpretation of low performance as a threatinduces risk aversion.
In spite of the continued attention given to theseconflicting predictions, we found just six studies thatshowed that performance below the aspiration levelaffected firms' risk behavior, and these studies offercontradictory evidence. Gooding et al. (1996) foundthat firms with performance in the lowest quintiletook more risks in response to performance declines.Greve (1998) found that decreases in performanceincreased the risk taking of firms both above andbelow the aspiration level, but had a weaker effecton those below the aspiration level. Ketchen andPalmer (1999) found that low performance increasedorganizational risk taking. Miller and Chen (2004)found that decreases in performance increased orga-nizational risk taking in all (low, medium, and high)ranges of performance. Miller and Bromiley (1990)found that deterioration in performance increasedrisk taking for high performers but decreased it forlow performers. Wiseman and Bromiley (1996) foundthat lower performance caused less risk taking in asample of declining firms. Thus, the first four stud-ies suggest risk seeking below the aspiration level,whereas the latter two studies provide evidence ofrisk aversion below the aspiration level.̂ In both theselatter studies, the evidence in favor of risk aversionwas counter to the authors' predictions and led tocalls for more research.
To help resolve this longstanding debate and to cor-rect the imbalance between theoretical and empiricalwork, we begin by testing the two competing pre-dictions regarding the effect of performance belowthe aspiration level on firms' risk behavior. The firstis proposed by the behavioral theory of the firmand prospect theory; the second is the risk-aversionhypothesis.
HYPOTHESIS 1. When performance is below the aspira-tion level, performance decreases lead to more risk taking.
HYPOTHESIS 2. When performance is below the aspira-tion level, performance decreases lead to less risk taking.
The Shifting-Focus Model of Risk Taking andthe Moderating Effect of Firm SizeResearchers have suggested that the conflicting find-ings regarding risk seeking under conditions of adver-sity may be due to unobserved heterogeneity andhave proposed numerous contingencies that may ex-plain when risk aversion or risk seeking prevails(Mone et al. 1998, Ocasio 1995, Sitkin and Pablo1992). However, few studies have addressed thisissue empirically (but see Chattopadhyay et al. 2001).March and Shapira (1987, 1992) have made an impor-tant contribution to this literature by proposing theshifting-focus model of risk taking. Drawing on exten-sive studies of how managers perceive risk (Shapira1986), they noted that decision makers do not directtheir attention to a single reference point, as prospecttheory and the behavioral theory of the firm assume.Rather, decision makers switch their focus betweenthe aspiration level for performance and the survivalpoint—the point at which performance is so low thatthe organization fails. March and Shapira (1992) sug-gested that the reference point on which decisionmakers focus is important because it affects how theyinterpret performance outcomes, and these interpre-tations in turn influence whether decision makersrespond to changes in performance by increasing ordecreasing risk taking.
The shifting-focus model of risk taking reconcilesthe conflicting predictions of risk aversion and riskseeking by suggesting two scenarios for firms withperformance above the survival point but below theaspiration level.^ In the first scenario, decision mak-ers focus on the survival point, which makes theminterpret decreases in performance as a step closer tofailure and as a serious threat. This interpretation oflow performance induces risk aversion either becauseperceptions of threat make decision makers rigid and
' Additional evidence comes from two individual-level experimen-tal (Laughhunn et al, 1980) and survey (Shapira 1986) studies find-ing that very low performance reduced risk taking. There has alsobeen work finding no effect on firm risk taking below the aspirationlevel (e,g,, Greve 2003a),
^Because decision makers aspire to do better than firm failure,the aspiration level is always higher than the survival point. Also,performance below the survival point leads to failure, so we canrestrict our attention to performance below the aspiration level andabove the survival point.
86Audia and Greve: Low Performance, Tirm Size, and Tactory Expansion in the Shipbuilding Industry
Management Science 52(1), pp, 83-94, ©2006 INFORMS
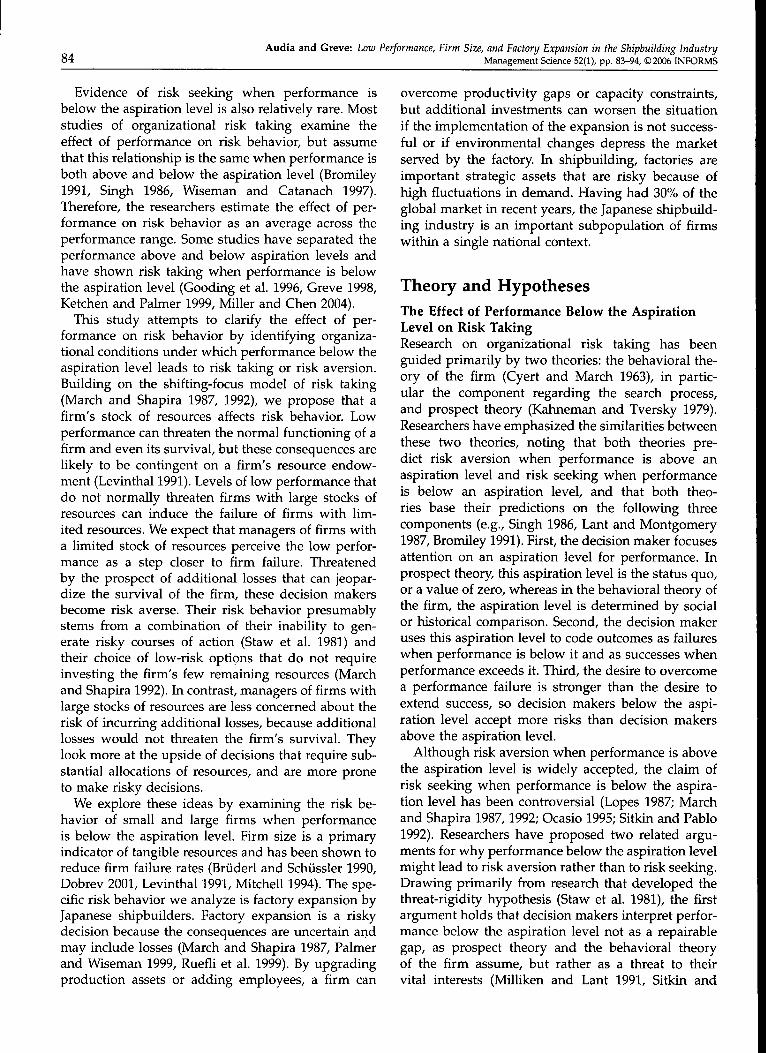
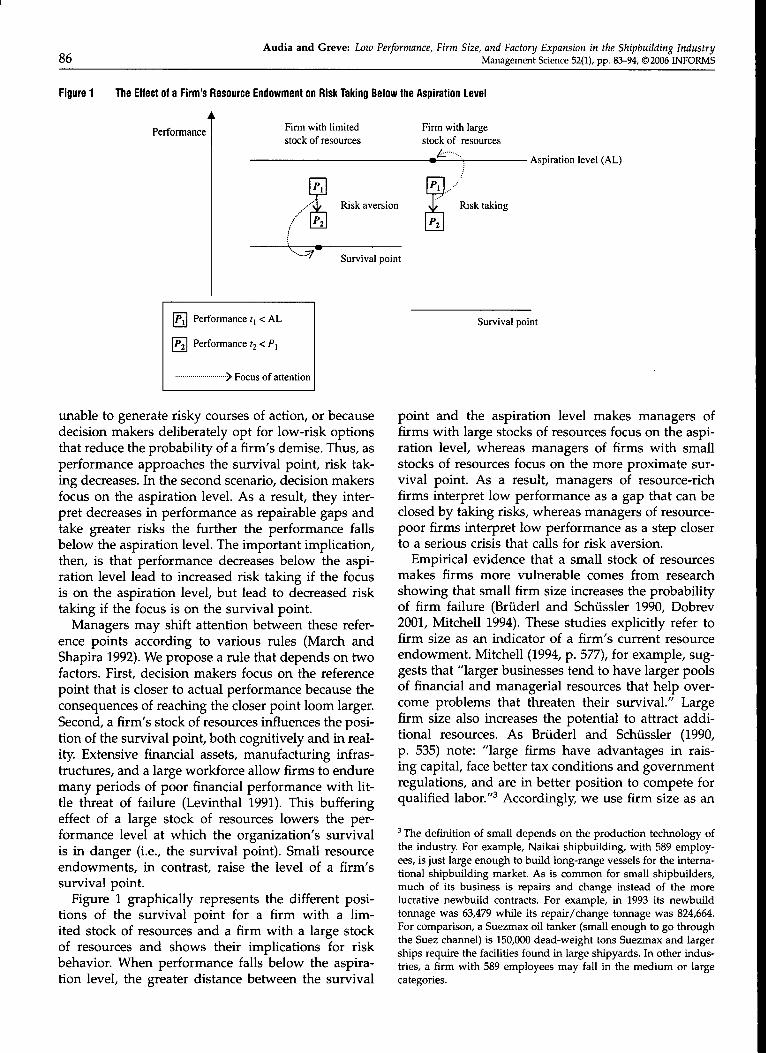
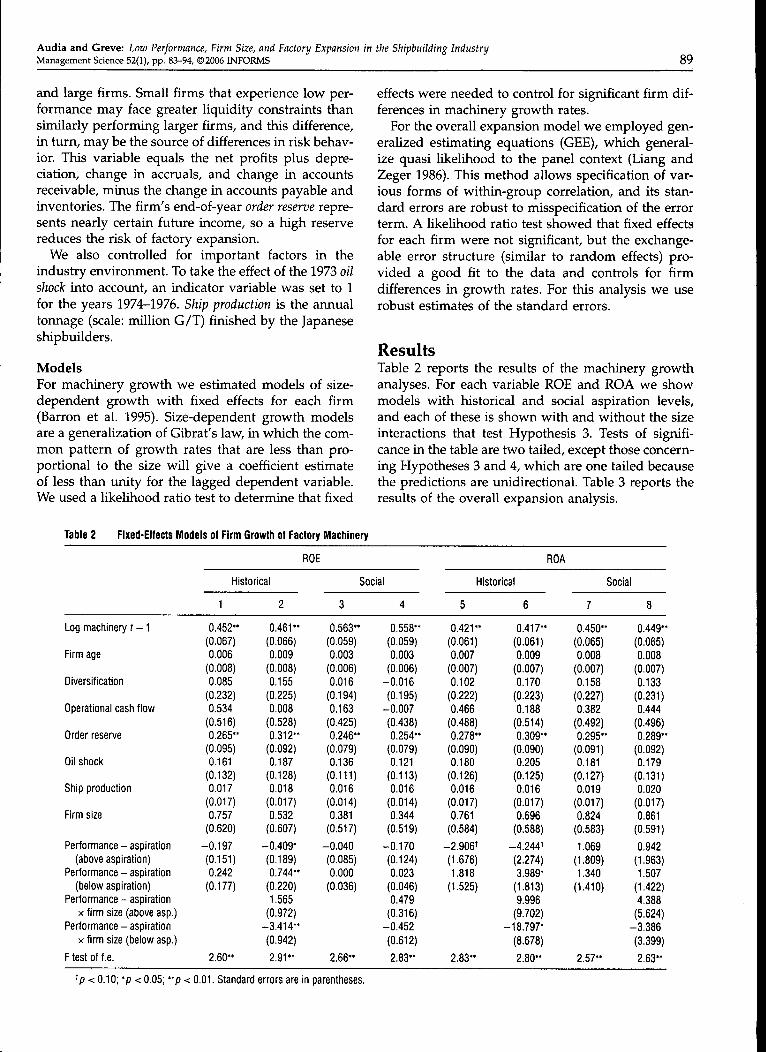
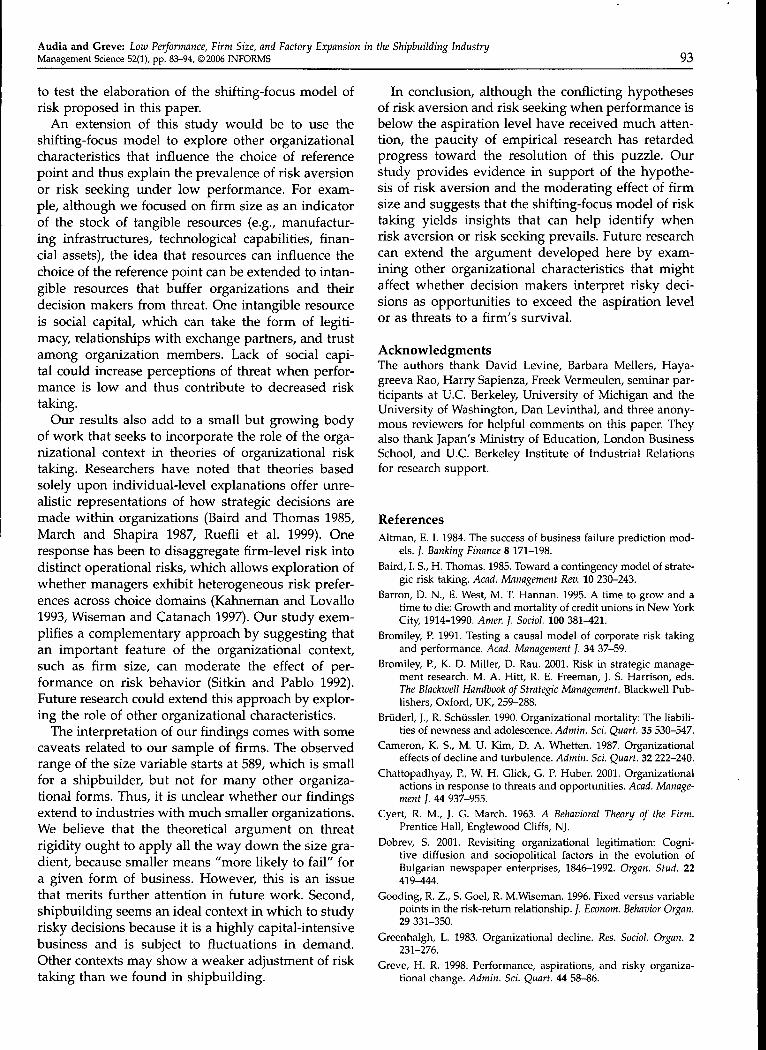
Figure 1 The Effect of a Firm's Resource Endowment on Risk Tai(ing Beiow tiie Aspiration Levei
Performance Firm with limitedstock of resources
Firm with largestock of resources
• Aspiration level (AL)
Risk aversion Risk taking
Survival point
Performance «[ < AL
Performance t2<P\
> Focus of attention
unable to generate risky courses of action, or becausedecision makers deliberately opt for low-risk optionsthat reduce the probability of a firm's demise. Thus, asperformance approaches the survival point, risk tak-ing decreases. In the second scenario, decision makersfocus on the aspiration level. As a result, they inter-pret decreases in performance as repairable gaps andtake greater risks the further the performance fallsbelow the aspiration level. The important implication,then, is that performance decreases below the aspi-ration level lead to increased risk taking if the focusis on the aspiration level, but lead to decreased risktaking if the focus is on the survival point.
Managers may shift attention between these refer-ence points according to various rules (March andShapira 1992). We propose a rule that depends on twofactors. First, decision makers focus on the referencepoint that is closer to actual performance because theconsequences of reaching the closer point loom larger.Second, a firm's stock of resources influences the posi-tion of the survival point, both cognitively and in real-ity. Extensive financial assets, manufacturing infras-tructures, and a large workforce allow firms to enduremany periods of poor financial performance with lit-tle threat of failure (Levinthal 1991). This bufferingeffect of a large stock of resources lowers the per-formance level at which the organization's survivalis in danger (i.e., the survival point). Small resourceendowments, in contrast, raise the level of a firm'ssurvival point.
Figure 1 graphically represents the different posi-tions of the survival point for a firm with a lim-ited stock of resources and a firm with a large stockof resources and shows their implications for riskbehavior. When performance falls below the aspira-tion level, the greater distance between the survival
Survival point
point and the aspiration level makes managers offirms with large stocks of resources focus on the aspi-ration level, whereas managers of firms with smallstocks of resources focus on the more proximate sur-vival point. As a result, managers of resource-richfirms interpret low performance as a gap that can beclosed by taking risks, whereas managers of resource-poor firms interpret low performance as a step closerto a serious crisis that calls for risk aversion.
Empirical evidence that a small stock of resourcesmakes firms more vulnerable comes from researchshowing that small firm size increases the probabilityof firm failure (Bruderl and Schussler 1990, Dobrev2001, Mitchell 1994). These studies explicitly refer tofirm size as an indicator of a firm's current resourceendowment. Mitchell (1994, p. 577), for example, sug-gests that "larger businesses tend to have larger poolsof financial and managerial resources that help over-come problems that threaten their survival." Largefirm size also increases the potential to attract addi-tional resources. As Bruderl and Schussler (1990,p. 535) note: "large firms have advantages in rais-ing capital, face better tax conditions and governmentregulations, and are in better position to compete forqualified labor."' Accordingly, we use firm size as an
^ The definition of small depends on the production technology ofthe industry, Por example, Naikai shipbuilding, with 589 employ-ees, is just large enough to build long-range vessels for the interna-tional shipbuilding market. As is common for small shipbuilders,much of its business is repairs and change instead of the morelucrative newbuild contracts, Por example, in 1993 its newbuildtonnage was 63,479 while its repair/change tonnage was 824,664,Por comparison, a Suezmax oil tanker (small enough to go throughthe Suez charmel) is 150,000 dead-weight tons Suezmax and largerships require the facilities found in large shipyards. In other indus-tries, a firm with 589 employees may fall in the medium or largecategories.
Audia and Greve: Low Performance, Tirm Size, and Tactory Expansion in the Shipbuilding IndustryManagement Science 52(1), pp, 83-94, ©2006 INFORMS 87
indicator of a firm's resource endowment and pro-pose that it modifies the effect of low performance onrisk behavior as follows:
HYPOTHESIS 3. When performance is below the aspira-tion level, performance decreases lead to less risk takingamong small firms and more risk taking among large firms.
Firm Size and InertiaWe have proposed that firm size affects the perfor-mance-risk relationship when performance is belowthe aspiration level, but firm size can also influ-ence risk taking irrespective of the level of perfor-mance. The theory of structural inertia holds thatlarge firms are encumbered by structural constraintssuch as slow communication channels, the need formultiple approvals, and norms and procedures thatlimit decision makers' ability to make organizationalchanges (Hannan and Freeman 1984). An implicationof this theory is that the structural constraints associ-ated with large firm size can discourage the pursuit ofrisky courses of action. Thus, inertia theory predictsthe following:
HYPOTHESIS 4. Firm size decreases risk taking.
Data and MethodsMost research on orgaruzational risk taking exam-ines either aggregate measures of firm risk (e.g.,Gooding et al. 1996, Palmer and Wiseman 1999) orspecific risky decisions (e.g., McNamara and Bromiley1997). The advantage of focusing on specific decisionsis that they more directly correspond to the actualrisk behavior of managers (March and Shapira 1987).Taking this latter approach, we examine the strate-gic decisions regarding factory expansion made byJapanese shipbuilders.
We use data for shipbuilders on the primary listof the Tokyo and Osaka Stock exchanges from 1974to 1995. The firm data come from the Nikkei annualdirectory of corporations, and industry data weretaken from the Ministry of Transportation's annualreport on shipbuilding. Nine Japanese shipbuilderswere listed in the stock market throughout the sam-ple period, and two exited the data through failure(Hashimama) and stock delisting (Hakodate), respec-tively. We use aU years in which complete dataare available for these 11 firms, for a total of 178firm-years.^
•* We also identified 12 other builders of large- and medium-sizedships in Japan that were not listed in the stock market, of whichtwo failed during the study period, but we were unable to obtainaccounting data for these firms. Many of these firms appear tobe family controlled. In addition to these builders of mediumand large ships, there are numerous builders of small ships. Theirplants and production processes are sufficiently different fromthese builders that they should be considered a distinct organiza-tional form.
Measures
Dependent Variables. We examined five variablesindicating factory expansion. The first three arethe logged ratio of the year-end and year-start of thefirm's (1) value of the machinery, (2) value of thenonmachinery real assets, and (3) number of work-ers. All these are long-term investments that can-not easily be disposed of if they turn out not to beneeded. The machinery and other real assets of ship-builders are highly specialized and immobile, andthe firms honored lifetime employment guaranteesduring the study period. The final two variables arecounts of the number of additions or deletions of fac-tory functions according to the categories: (1) newships, (2) ship repairs, (3) engines, (4) accessories,(5) steel, and (6) unrelated business.
We first analyzed growth in the value of the ma-chinery. Machinery can be purchased and installedquickly and is not autocorrelated across years, makingit the most sensitive indicator of investment decisions.Next, we extracted a measure of overall expansionfrom the five variables by performing a principal fac-tor analysis with varimax rotation. This yielded twosignificant factors: One factor captured factory expan-sion, and the other captured function change. Theexpansion factor (eigenvalue 0.746) had similar load-ings for value of machinery (0.514) and nonmachinery(0.535) real assets and number of workers (0.403), andsmall loadings of the function add (0.115) and drop(0.136) variables. The other factor (eigenvalue 1.084)had high loadings for function add (0.722) and drop(0.711), and small loadings for the other three vari-ables (-0.076, -0.126, and -0.183, respectively). Thescore of the expansion factor was used as the depen-dent variable in the analysis. Maximum-likelihood oriterated principal factor methods of constructing theexpansion factor had correlations of 0.99 with ourapproach.
Firm Performance. We measured performance us-ing the traditional accounting measures of returns:return on equity (ROE), return on assets (ROA),and return on sales (ROS). We display the first twoof these for brevity and note that the ROS find-ings resembled the ROA findings, but had some-what weaker effects. Performance measures are eval-uated against aspiration levels, which may be deter-mined by the recent history of performance of theorganization (historical aspiration levels) or by theperformance of similar others (social aspiration lev-els) (Cyert and March 1963). We generated historicalaspiration levels by taking an exponentially weightedaverage of past values on the performance variable(Greve 1998, Lant 1992, Levinthal and March 1981).The formula we used to compute historical aspirationlevels is:
88Audia and Greve: Low Performance, Tirm Size, and Tactory Expansion in the Shipbuilding Industry
Management Science 52(1), pp, 83-94, ©2006 INFORMS
Here, A is aspiration level, P is the performance, f is atime subscript, and a is the weight given to the mostrecent aspiration level. The a can be found by estimat-ing the models with different values of a and findingwhich value best fits the data. We used such prelim-inary analysis to establish that ROE had an a of 0.1,ROA had 0.3, and ROS had 0.2. These low as sug-gest fairly rapid updating of the aspiration level, asone would expect if decision makers believe that theirindustry is highly dynamic, so that only recent perfor-mance data are valid indicators of future prospects.We took the average performance of other firms inthe same year as the social aspiration level (Lant andHurley 1999, Mezias et al. 2002).
To examine whether the effect of performance onfactory expansion differs according to whether theperformance is above or below the aspiration level,we split the performance variables into two cate-gories. Performance above the aspiration level equals 0when performance is below the aspiration level andequals performance minus the aspiration level whenperformance is above the aspiration level. Similarly,performance below the aspiration level equals 0 when per-formance is above the aspiration level and equalsperformance minus the aspiration level when perfor-mance is below the aspiration level.
Firm Size. For firm size, we used the logged num-ber of employees, which is a good measure of overallfirm size in a given industry. In these data, the loggednumber of employees correlates highly with anotherstandard size measure, the accounting value of assets.We logged the number of employees because wethink that this specification better captures the effectof size on risk taking. It means that a given percentageincrease has the same effect regardless of firm size,whereas a linear measure would mean that a given
number of workers added has the same effect regard-less of firm size. Going from 600 to 1,200 workersought to affect risk taking more than going from50,000 to 50,600 workers. "Hie logging gives the sizevariable an approximately normal distribution.
To examine the interaction between firm perfor-mance and firm size, we normalized firm size be-tween 0 and 1 using the lowest and highest valuesin the data. Thus, the largest firm (Mitsubishi, with78,104 employees) had a score of 1, and the small-est (Naikai, with 538 employees) had a value of 0.This simplifies the interpretation of the coefficients inTables 2 and 3 for the minimum and maximum val-ues in the data. The effect for the smallest firm in thedata is the main effect of Hrm performance, and theeffect for the largest firm in the data is the sum of themain effect of firm performance and the interactioneffect between firm performance and firm size. Theeffects for all other firms fall in between. Firm size istime varying, as all variables are, but the scaling func-tion is time constant. Our approach is mathematicallyequivalent to the alternative approach of taking theinteractions as deviations from the mean, but is easierto interpret when testing hypotheses that contrast theextremes in the size distribution.
Control Variables. Control variables were enteredto describe firm and factory characteristics and theeconomic conditions in the previous year. Includingfirm age controlled for processes of bureaucratizationand obsolescence associated with the passage of time.The firm's product diversification was entered by com-puting the entropy index of product line shares givenin the Nikkei directory. Operating cash flow measuredthe ability to fund investments without borrowing,and allowed us to control for an alternative expla-nation of differences in the risk behavior of small
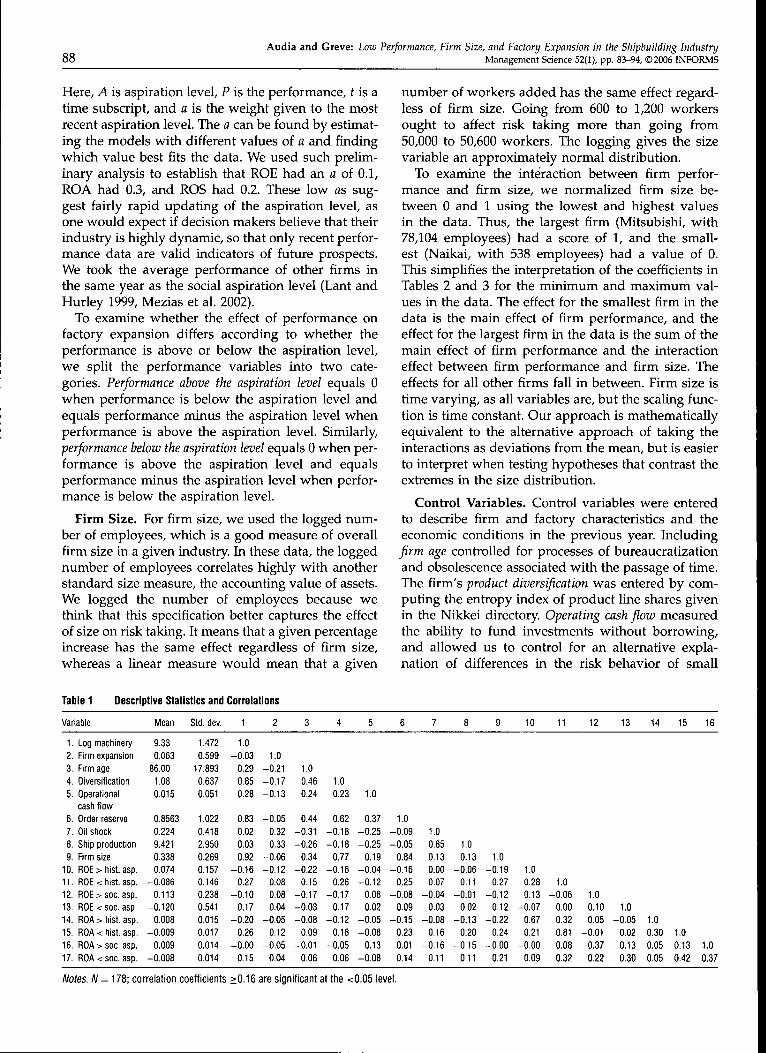
Table 1 Descriptive Statistics and Correiations
Variabie
1, Log machinery
2, Firm expansion
3, Firm age
4, Diversification
5, Operationai
cash flow
6, Order reserve
7, Oii shock
8, Ship production
9, Firm size
10, ROE > hist, asp.
11, ROE < hist, asp.
12, ROE > soc, asp.
13, ROE < soc, asp.
14, ROA > hist, asp.
15, ROA < hist, asp.
16, ROA > soc, asp.
17, ROA < soc, asp.
iVIean
9,33
0,063
86,00
1,08
0,015
0,8563
0,224
9,421
0,338
0,074
-0,086
0,113
-0,120
0,008
-0,009
0,009
-0,008
Std, dev.
1,472
0,599
17,893
0,637
0,051
1,022
0,418
2,950
0,269
0,157
0,146
0,238
0,541
0,015
0,017
0,014
0,014
1
1,0-0 ,03
0,29
0,85
0,28
0,83
0,02
0,03
0,92
-0,16
0,27
-0,10
0,17
-0,20
0,26
-0,00
0,15
2
1,0-0 ,21
-0,17
-0,13
-0,05
0,32
0,33
-0,06
-0,12
0,08
0,08
0,04
-0,05
0,12
-0,05
0,04
3
1,00,46
0,24
0,44
-0,31
-0,26
0,34
-0,22
0,15
-0,17
-0,03
-0,08
0,09
-0,01
0,06
4
1,00,23
0,62
-0,18
-0,18
0,77
-0,16
0,26
-0,17
0,17
-0,12
0,18
-0,05
0,06
5
1,0
0,37
-0,25
-0,25
0,19
-0,04
-0,12
0,08
0,02
-0,05
-0,08
0,13
-0,08
6
1,0-0 ,09
-0,05
0,84
-0,16
0,25
-0,08
0,09
-0,15
0,23
0,01
0,14
7
1,00,85
0,13
0,00
0,07
-0,04
0,03
-0,08
0,16
-0,16
0,11
8
1,00,13
-0,06
0,11
-0,01
0,02
-0,13
0,20
-0,15
0,11
9
1,0-0 ,19
0,27
-0,12
0,12
-0,22
0,24
-0,00
0,21
10
1,00,28
0,13
-0,07
0,67
0,21
-0,00
0,09
11
1,0-0 ,06
0,00
0,32
0,81
0,08
0,32
12
1,00,10
0,05
-0 ,01
0,37
0,22
13
1,0-0 ,05
0,02
0,13
0,30
14 15 16
1,00,30 1,0
0,05 0,13 1,0
0,05 0,42 0,37
Notes. /V = 178; correlation coefficients >0,16 are significant af fhe <0,05 level.
Audia and Greve: Low Performance, Firm Size, and Factory Expansion in the Shipbuilding IndustryManagement Science 52(1), pp. 83-94, ©2006 INFORMS 89
and large firms. Small firms that experience low per-formance may face greater liquidity constraints thansimilarly performing larger firms, and this difference,in turn, may be the source of differences in risk behav-ior. This variable equals the net profits plus depre-ciation, change in accruals, and change in accountsreceivable, minus the change in accounts payable andinventories. The firm's end-of-year order reserve repre-sents nearly certain future income, so a high reservereduces the risk of factory expansion.
We also controlled for important factors in theindustry environment. To take the effect of the 1973 oilshock into account, an indicator variable was set to 1for the years 1974-1976. Ship production is the annualtormage (scale: million G/T) finished by the Japaneseshipbuilders.
ModelsFor machinery growth we estimated models of size-dependent growth with fixed effects for each firm(Barron et al. 1995). Size-dependent growth modelsare a generalization of Gibrat's law, in which the com-mon pattern of growth rates that are less than pro-portional to the size will give a coefficient estimateof less than unity for the lagged dependent variable.We used a likelihood ratio test to determine that fixed
effects were needed to control for significant firm dif-ferences in machinery growth rates.
For the overall expansion model we employed gen-eralized estimating equations (GEE), which general-ize quasi likelihood to the panel context (Liang andZeger 1986). This method allows specification of var-ious forms of within-group correlation, and its stan-dard errors are robust to misspecification of the errorterm. A likelihood ratio test showed that fixed effectsfor each firm were not significant, but the exchange-able error structure (similar to random effects) pro-vided a good fit to the data and controls for firmdifferences in growth rates. For this analysis we userobust estimates of the standard errors.
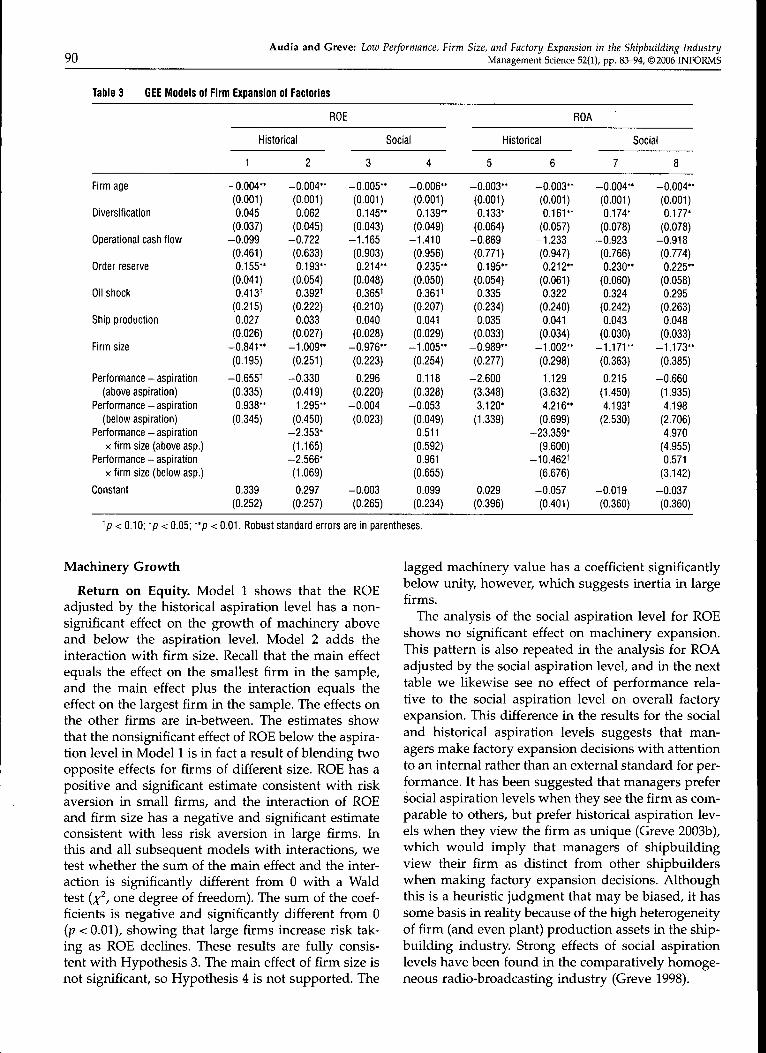
ResultsTable 2 reports the results of the machinery growthanalyses. For each variable ROE and ROA we showmodels with historical and social aspiration levels,and each of these is shown with and without the sizeinteractions that test Hypothesis 3. Tests of signifi-cance in the table are two tailed, except those concern-ing Hypotheses 3 and 4, which are one tailed becausethe predictions are unidirectional. Table 3 reports theresults of the overall expansion analysis.
Table 2 Fixed-Effects Models of Firm Growth of Factory Macfiinery
Log machinery t - 1
Firm age
Diversification
Operationai cash fiow
Order reserve
Oii shock
Ship production
Firm size
Performance - aspiration(above aspiration)
Performance - aspiration(beiow aspiration)
Performance - aspirationX firm size (above asp.)
Performance - aspirationX firm size (beiow asp,)
F test of f.e.
Historical
1
0,452"(0,067)0,006
(0.008)0.085
(0.232)0.534
(0.516)0.265"
(0.095)0,161
(0.132)0.017
(0.017)0.757
(0.620)
-0.197
(0.151)0.242
(0.177)
2,60"
2
0,461"(0,066)0.009
(0,008)0,155
(0,225)0,008
(0.528)0,312"
(0.092)0.187
(0,128)0,018
(0,017)0,532
(0,607)
-0,409*(0,189)0,744"
(0,220)1,565
(0,972)-3 ,414 "
(0,942)
2 ,91 "
ROE
3
0,563*(0,059)0.003
(0,006)
0.016(0.194)
0.163(0.425)0.246*
(0.079)0.136
(0.111)0.016
(0.014)0.381
(0.517)
-0.040(0.085)0.000
(0.036)
2.66"
Social
4
0,558"(0.059)
0,003(0,006)
-0,016(0,195)
-0,007
(0,438)0,254"
(0,079)0,121
(0,113)0,016
(0,014)0,344
(0,519)
-0,170(0,124)0,023
(0,046)0,479
(0,316)-0,452
(0,612)
2,83"
ROA
Historical
5
0.421"(0.061)0.007
(0.007)0.102
(0.222)
0.466(0.488)0.278**
(0.090)0.180
(0.126)0.016
(0.017)
0.761(0.584)
-2,906*(1,676)1.818
(1,525)
2,83"
6
0.417"(0,061)0.009
(0,007)
0,170(0.223)
0.188(0.514)0.309"
(0.090)0.205
(0.125)0.016
(0.017)0.696
(0.588)
-4,244 '(2.274)3.989*
(1.813)
9.996(9.702)
-18.797*
(8.678)
2.80"
7
0.450*(0.065)0.008
(0.007)
0.158(0.227)0.382
(0.492)
0,295*(0,091)0.181
(0.127)
0,019(0.017)0.824
(0.583)
1,069(1,809)1.340
(1,410)
2,57"
Social
8
0.449*'(0.065)0.008
(0,007)
0.133(0.231)0,444
(0,496)0,289*'
(0.092)0.179
(0,131)0,020
(0,017)
0.861(0,591)
0,942(1,963)1.507
(1,422)4,388
(5.624)-3,386
(3,399)
2,63"
< 0.10; *p < 0.05; "p < 0,01. Standard errors are in parentheses.
90Audia and Greve: Low Performance, Firm Size, and Factory Expansion in the Shipbuilding Industry
Management Science 52(1), pp, 83-94, ©2006 INFORMS
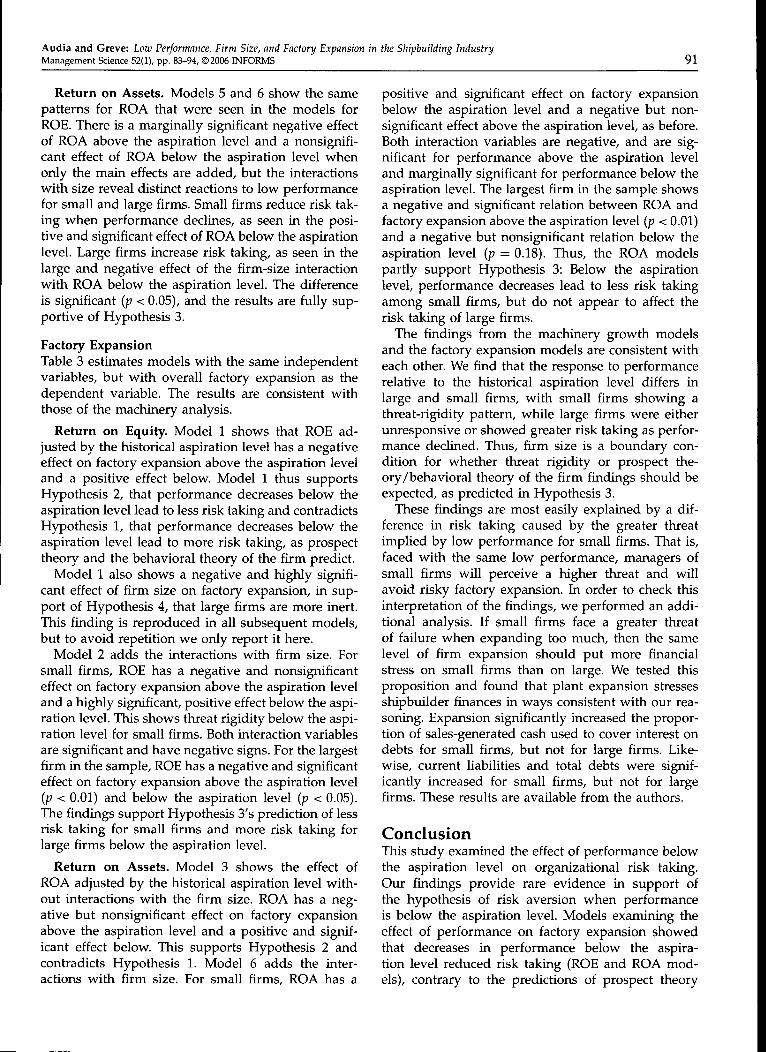
Table 3 GEE Models of Firm Expansion of Factories
Firm age
Diversification
Operational cash fiow
Order reserve
Oii shock
Ship production
Firm size
Performance - aspiration(above aspiration)
Performance - aspiration(beiow aspiration)
Performance - aspirationX firm size (above asp.)
Performance - aspirationX firm size (beiow asp.)
Constant
ROE
Historical
1
- 0 . 0 0 4 "(0,001)
0,045(0,037)
-0.099(0.461)0.155"
(0.041)0.413*
(0.215)0.027
(0.026)- 0 , 8 4 1 "
(0,195)
-0,655+
(0,335)0,938"
(0,345)
0.339(0.252)
2
- 0 . 0 0 4 "(0,001)0.062
(0.045)-0.722(0.633)0.193"
(0.054)0.392t
(0.222)
0.033(0.027)
-1 ,009 "
(0,251)
-0,330
(0,419)
1,295"(0,450)
-2,353*(1.165)
-2.566*(1.069)
0.297(0.257)
3
-0,005*(0,001)0,145*
(0,043)-1.165(0.903)0.214*
(0.048)0.365*
(0.210)
0.040(0,028)
-0,976*
(0,223)
0,296(0,220)
-0,004
(0,023)
-0.003
(0.265)
Social
4
- 0 , 0 0 6 "(0,001)0,139"
(0,049)-1,410(0,956)
0,235**(0.050)0,3611
(0.207)
0.041(0.029)
-1 ,005 "(0,254)
0,118(0,328)
-0,053
(0,049)0,511
(0.592)
0,961(0,655)
0.099(0.234)
Historicai
5
-0.003**(0.001)0.133*
(0.064)-0.869(0.771)
0,195"(0,054)
0.335(0,234)
0,035(0.033)
-0.989**(0.277)
-2.600
(3.348)3.120*
(1.339)
0,029(0,396)
6
- 0 . 0 0 3 "(0.001)
0,161"(0.057)
-1,233(0,947)
0,212"(0,061)0.322
(0,240)0,041
(0,034)
- 1 , 0 0 2 "
(0.298)
1.129
(3.632)
4.216"(0.699)
-23.359*(9,600)
-10,462t(6,676)
-0,057(0,401)
ROA
7
-0,004*
(0,001)0,174*
(0.078)-0.923(0.766)
0.230*(0.060)0.324
(0.242)
0,043(0,030)
-1 .171*
(0,363)
0,215(1,450)
4,193t
(2,530)
-0.019(0.360)
Social
8
- 0 , 0 0 4 "(0,001)0,177*
(0,078)-0,918(0,774)
0.225"(0.058)0.295
(0.263)0.048
(0.033)
- 1 . 1 7 3 "
(0.385)
-0.660(1.935)
4,198
(2,706)4,970
(4,955)0,571
(3,142)
-0.037
(0,360)
< 0,10; *p < 0.05; "p < 0.01. Robust standard errors are in parentheses.
Machinery Growth
Return on Equity. Model 1 shows that the ROEadjusted by the historical aspiration level has a non-significant effect on the growth of machinery aboveand below the aspiration level. Model 2 adds theinteraction with firm size. Recall that the main effectequals the effect on the smallest firm in the sample,and the main effect plus the interaction equals theeffect on the largest firm in the sample. The effects onthe other firms are in-between. The estimates showthat the nonsignificant effect of ROE below the aspira-tion level in Model 1 is in fact a result of blending twoopposite effects for firms of different size. ROE has apositive and significant estimate consistent with riskaversion in small firms, and the interaction of ROEand firm size has a negative and significant estimateconsistent with less risk aversion in large firms. Inthis and all subsequent models with interactions, wetest whether the sum of the main effect and the inter-action is significantly different from 0 with a Waldtest {x^, one degree of freedom). The sum of the coef-ficients is negative and significantly different from 0(p < 0.01), showing that large firms increase risk tak-ing as ROE declines. These results are fully consis-tent with Hypothesis 3. The main effect of firm size isnot significant, so Hypothesis 4 is not supported. The
lagged machinery value has a coefficient significantlybelow unity, however, which suggests inertia in largefirms.
The analysis of the social aspiration level for ROEshows no significant effect on machinery expansion.This pattern is also repeated in the analysis for ROAadjusted by the social aspiration level, and in the nexttable we likewise see no effect of performance rela-tive to the social aspiration level on overall factoryexpansion. This difference in the results for the socialand historical aspiration levels suggests that man-agers make factory expansion decisions with attentionto an internal rather than an external standard for per-formance. It has been suggested that managers prefersocial aspiration levels when they see the firm as com-parable to others, but prefer historical aspiration lev-els when they view the firm as unique (Greve 2003b),which would imply that managers of shipbuildingview their firm as distinct from other shipbuilderswhen making factory expansion decisions. Althoughthis is a heuristic judgment that may be biased, it hassome basis in reality because of the high heterogeneityof firm (and even plant) production assets in the ship-building industry. Strong effects of social aspirationlevels have been found in the comparatively homoge-neous radio-broadcasting industry (Greve 1998).
Audia and Greve: Low Performance, Firm Size, and Factory Expansion in the Shipbuilding IndustryManagement Science 52(1), pp, 83-94, ©2006 INFORMS 91
Return on Assets. Models 5 and 6 show the samepatterns for ROA that were seen in the models forROE. There is a marginally significant negative effectof ROA above the aspiration level and a nonsignifi-cant effect of ROA below the aspiration level whenonly the main effects are added, but the interactionswith size reveal distinct reactions to low performancefor small and large firms. Small firms reduce risk tak-ing when performance declines, as seen in the posi-tive and significant effect of ROA below the aspirationlevel. Large firms increase risk taking, as seen in thelarge and negative effect of the firm-size interactionwith ROA below the aspiration level. The differenceis sigruHcant {p < 0.05), and the results are fully sup-portive of Hypothesis 3.
Factory ExpansionTable 3 estimates models with the same independentvariables, but with overall factory expansion as thedependent variable. The results are consistent withthose of the machinery analysis.
Return on Equity. Model 1 shows that ROE ad-justed by the historical aspiration level has a negativeeffect on factory expansion above the aspiration leveland a positive effect below. Model 1 thus supportsHypothesis 2, that performance decreases below theaspiration level lead to less risk taking and contradictsHypothesis 1, that performance decreases below theaspiration level lead to more risk taking, as prospecttheory and the behavioral theory of the firm predict.
Model 1 also shows a negative and highly signifi-cant effect of firm size on factory expansion, in sup-port of Hypothesis 4, that large firms are more inert.This finding is reproduced in all subsequent models,but to avoid repetition we only report it here.
Model 2 adds the interactions with firm size. Forsmall firms, ROE has a negative and nonsignificanteffect on factory expansion above the aspiration leveland a highly significant, positive effect below the aspi-ration level. This shows threat rigidity below the aspi-ration level for small firms. Both interaction variablesare significant and have negative signs. For the largestfirm in the sample, ROE has a negative and significanteffect on factory expansion above the aspiration level(p < 0.01) and below the aspiration level (p < 0.05).The findings support Hypothesis 3's prediction of lessrisk taking for small firms and more risk taking forlarge firms below the aspiration level.
Return on Assets. Model 3 shows the effect ofROA adjusted by the historical aspiration level with-out interactions with the firm size. ROA has a neg-ative but nonsigruficant effect on factory expansionabove the aspiration level and a positive and signif-icant effect below. This supports Hypothesis 2 andcontradicts Hypothesis 1. Model 6 adds the inter-actions with firm size. For small firms, ROA has a
positive and significant effect on factory expansionbelow the aspiration level and a negative but non-significant effect above the aspiration level, as before.Both interaction variables are negative, and are sig-nificant for performance above the aspiration leveland marginally significant for performance below theaspiration level. The largest firm in the sample showsa negative and significant relation between ROA andfactory expansion above the aspiration level {p < 0.01)and a negative but nonsignificant relation below theaspiration level {p = 0.18). Thus, the ROA modelspartly support Hypothesis 3: Below the aspirationlevel, performance decreases lead to less risk takingamong small firms, but do not appear to affect therisk taking of large firms.
The findings from the machinery growth modelsand the factory expansion models are consistent witheach other. We find that the response to performancerelative to the historical aspiration level differs inlarge and small firms, with small firms showing athreat-rigidity pattern, while large firms were eitherunresponsive or showed greater risk taking as perfor-mance declined. Thus, firm size is a boundary con-dition for whether threat rigidity or prospect the-ory/behavioral theory of the firm findings should beexpected, as predicted in Hypothesis 3.
These findings are most easily explained by a dif-ference in risk taking caused by the greater threatimplied by low performance for small firms. That is,faced with the same low performance, managers ofsmall firms will perceive a higher threat and willavoid risky factory expansion. In order to check thisinterpretation of the findings, we performed an addi-tional analysis. If small firms face a greater threatof failure when expanding too much, then the samelevel of firm expansion should put more financialstress on small firms than on large. We tested thisproposition and found that plant expansion stressesshipbuilder finances in ways consistent with our rea-soning. Expansion significantly increased the propor-tion of sales-generated cash used to cover interest ondebts for small firms, but not for large firms. Like-wise, current liabilities and total debts were signif-icantly increased for small firms, but not for largefirms. These results are available from the authors.
ConclusionThis study examined the effect of performance belowthe aspiration level on organizational risk taking.Our findings provide rare evidence in support ofthe hypothesis of risk aversion when performanceis below the aspiration level. Models examining theeffect of performance on factory expansion showedthat decreases in performance below the aspira-tion level reduced risk taking (ROE and ROA mod-els), contrary to the predictions of prospect theory
92Audia and Greve: Low Performance, Firm Size, and Factory Expansion in the Shipbuilding Industry
Management Science 52(1), pp. 83-94, ©2006 INFORMS
(Kahneman and Tversky 1979) and the behavioral the-ory of the firm (Cyert and March 1963), but consistentwith the hypothesis of risk aversion (Lopes 1987, Stawet al. 1981).
We also showed that the finding that decreases inperformance below the aspiration level will decreaserisk taking masked differences between small andlarge firms. Small firms decreased risk taking inresponse to reduced firm performance. In contrast,large firms were either insensitive (ROA models) orincreased risk taking (ROE models) in response todecreases in performance. These effects were foundafter controlling for operational cash flow, which sug-gests that differences in the risk behavior of smalland large firms were not simply due to liquidity con-straints.
The results support our argument that a firm's sizeaffects decision makers' choice of the reference pointand that this choice modifies risk behavior. Managersof small firms are more likely than managers of largefirms to focus their attention on the survival pointbecause small firms have limited resources and arevulnerable to levels of low performance that do notnormally threaten large firms. A focus on the survivalpoint induces managers of small firms to interpret areduction in performance as a step closer to organi-zational failure, which invokes a risk-averse response,as the shifting-focus model of risk taking suggests,rather than as a repairable gap that can be closedby taking risks, as prospect theory and the behav-ioral theory of the firm predict. We also found thatlarge firms took less risk at any given level of perfor-mance and showed some insensitivity to performanceabove the aspiration level. We interpret these findingsas support for inertia theory's prediction that struc-tural constraints encumber pursuit of risky courses ofaction in large firms.
Our approach of examining the interactive effect ofsize and performance on risk-taking behavior is noveland sheds light on previous studies of the effect ofperformance on risk taking. The shifting-focus modelof risk elaborated in this paper suggests that differ-ences in the risk behavior of small and large firmsmay lead to either a positive effect or a nonsignifi-cant effect of low performance on risk, as the over-all pattern of our results show. Recall that a posi-tive effect means that decreases in performance belowthe aspiration level reduce risk taking. Earlier wereviewed four studies using direct measures of aggre-gate risk such as income stream uncertainty. Oneof these studies. Miller and Bromiley (1990), exam-ined, as we do, the risk behavior of firms alongthe entire range of performance below the aspirationlevel, whereas the other three studies used subsam-ples of low-performing firms. Gooding et al. (1996)
examined the bottom quintile of the performance dis-tribution. Miller and Chen (2004) studied firms withvalues of Altman's (1984) bankruptcy score in the bot-tom 10%, and Wiseman and Bromiley (1996) selectedfirms with at least four years of declining sales outof a seven-year period. While Miller and Bromileyreport, as we do, that low performance reduced risktaking, the other three studies report mixed results.Gooding et al. (1996) and Miller and Chen (2004)report increased risk taking after low performance,whereas Wiseman and Bromiley (1996) report theopposite effect. Thus, the study of risk that examinesthe entire range of low performance, as we do here,shows the same finding we do. The mixed results ofstudies that focus on subsamples of low-performingfirms may be due to the manner in which low-performing firms are defined. For example, if firmswith certain characteristics are overrepresented at thelow end of the performance distribution, subsamplesmay introduce a selection bias that alters the results.
This observation is not contradicted when we con-sider the three studies that used indirect measuresof risk. While Greve (1998) examined the probabilityof change of radio formats across the entire range oflow-performance values, Ketchen and Palmer (1999)grouped low-performing hospitals in one categorydetermined by whether performance was below theindustry mean two years out of two. Again, the studythat uses a research design closest to the researchdesign of this study reports results that are consis-tent with the shifting-focus model of risk. Both stud-ies report increased change in response to low perfor-mance. Greve (1998), however, differentiates in sup-plemental analyses between types of changes thatentail different levels of risk, finding that, for theriskiest types of change, the effect of performanceon change disappears, a result compatible with theshifting-focus model of risk taking. In another studythat examines the entire range of low-performancevalues, Greve (2003a) similarly reported no effect ofperformance below the aspiration level on the high-risk behavior of launching innovations, but found apositive effect of low performance on the less-riskybehavior of increasing R&D funding.
Overall, this comparative analysis suggests thatour finding that low performance can have eithera positive effect or a nonsignificant effect on riskas a result of differences in the risk behavior ofsmall and large firms can be reconciled with stud-ies that examine aggregate measures of risk or highlyrisky behaviors along the entire range of low perfor-mance. Our results imply that future studies shouldexpect small and large firms to respond differently tolow-performance and should incorporate these differ-ences into the model. Studies that focus on a subsam-ple of low-performing firms may be less appropriate
Audia and Greve: Low Performance, Firm Size, and Factory Expansion in the Shipbuilding IndustryManagement Science 52(1), pp. 83-94, ©2006 INFORMS 93
to test the elaboration of the shifting-focus model ofrisk proposed in this paper.
An extension of this study would be to use theshifting-focus model to explore other organizationalcharacteristics that influence the choice of referencepoint and thus explain the prevalence of risk aversionor risk seeking under low performance. For exam-ple, although we focused on firm size as an indicatorof the stock of tangible resources (e.g., manufactur-ing infrastructures, technological capabilities, finan-cial assets), the idea that resources can influence thechoice of the reference point can be extended to intan-gible resources that buffer organizations and theirdecision makers from threat. One intangible resourceis social capital, which can take the form of legiti-macy, relationships with exchange partners, and trustamong organization members. Lack of social capi-tal could increase perceptions of threat when perfor-mance is low and thus contribute to decreased risktaking.
Our results also add to a small but growing bodyof work that seeks to incorporate the role of the orga-nizational context in theories of organizational risktaking. Researchers have noted that theories basedsolely upon individual-level explanations offer unre-alistic representations of how strategic decisions aremade within orgaruzations (Baird and Thomas 1985,March and Shapira 1987, Ruefli et al. 1999). Oneresponse has been to disaggregate firm-level risk intodistinct operational risks, which allows exploration ofwhether managers exhibit heterogeneous risk prefer-ences across choice domains (Kahneman and Lovallo1993, Wiseman and Catanach 1997). Our study exem-plifies a complementary approach by suggesting thatan important feature of the organizational context,such as firm size, can moderate the effect of per-formance on risk behavior (Sitkin and Pablo 1992).Future research could extend this approach by explor-ing the role of other organizational characteristics.
The interpretation of our findings comes with somecaveats related to our sample of firms. The observedrange of the size variable starts at 589, which is smallfor a shipbuilder, but not for many other organiza-tional forms. Thus, it is unclear whether our findingsextend to industries with much smaller orgaruzations.We believe that the theoretical argument on threatrigidity ought to apply all the way down the size gra-dient, because smaller means "more likely to fail" fora given form of business. However, this is an issuethat merits further attention in future work. Second,shipbuilding seems an ideal context in which to studyrisky decisions because it is a highly capital-intensivebusiness and is subject to fluctuations in demand.Other contexts may show a weaker adjustment of risktaking than we found in shipbuilding.
In conclusion, although the conflicting hypothesesof risk aversion and risk seeking when performance isbelow the aspiration level have received much atten-tion, the paucity of empirical research has retardedprogress toward the resolution of this puzzle. Ourstudy provides evidence in support of the hypothe-sis of risk aversion and the moderating effect of firmsize and suggests that the shifting-focus model of risktaking yields insights that can help identify whenrisk aversion or risk seeking prevails. Future researchcan extend the argument developed here by exam-ining other organizational characteristics that mightaffect whether decision makers interpret risky deci-sions as opportunities to exceed the aspiration levelor as threats to a firm's survival.
AcknowledgmentsThe authors thank David Levine, Barbara Mellers, Haya-greeva Rao, Harry Sapienza, Freek Vermeulen, seminar par-ticipants at U.C. Berkeley, University of Michigan and theUniversity of Washington, Dan Levinthal, and three anony-mous reviewers for helpful comments on this paper. Theyalso thank Japan's Ministry of Education, London BusinessSchool, and U.C. Berkeley Institute of Industrial Relationsfor research support.
ReferencesAltman, E. I. 1984. The success of business failure prediction mod-
els. /. Banking Finance 8 171-198.Baird, I. S., H. Thomas. 1985. Toward a contingency model of strate-
gic risk taking. Acad. Management Rev. 10 230-243.Barron, D. N., E. West, M. T. Hannan. 1995. A time to grow and a
time to die: Growth and mortality of credit unions in New YorkCity, 1914-1990. Amer. ]. Sociol. 100 381-121.
Bromiley, P. 1991. Testing a causal model of corporate risk takingand performance. Acad. Management J. 34 37-59.
Bromiley, P., K. D. Miller, D. Rau. 2001. Risk in strategic manage-ment research. M. A. Hitt, R. E. Freeman, J. S. Harrison, eds.The Biackwell Handbook of Strategic Management. Biackwell Pub-lishers, Oxford, UK, 259-288.
Bruderi, J., R. Schussler. 1990. Organizational mortality: The liabili-ties of newness and adolescence. Admin. Sci. Quart. 35 530-547.
Cameron, K. S., M. U. Kim, D. A. Whetten. 1987. Organizationaleffects of decline and turbulence. Admin. Sci. Quart. 32 222-240.
Chattopadhyay, P, W. H. Glick, G. P. Huber. 2001. Organizationalactions in response to threats and opportunities. Acad. Manage-ment J. 44 937-955.
Cyert, R. M., J. G. March. 1963. A Behavioral Theory of the Firm.Prentice Hall, Englewood Cliffs, NJ.
Dobrev, S. 2001. Revisiting organizational legitimation: Cogni-tive diffusion and sociopolitical factors in the evolution ofBulgarian newspaper enterprises, 1846-1992. Organ. Stud. 22419-444.
Gooding, R. Z., S. Goel, R. M.Wiseman. 1996. Fixed versus variablepoints in the risk-return relationship. /. Econom. Behavior Organ.29 331-350.
Greenhalgh, L. 1983. Organizational decline. Res. Sociol. Organ. 2231-276.
Greve, H. R. 1998. Performance, aspirations, and risky organiza-tional change. Admin. Sci. Quart. 44 58-86.
94Audia and Greve: Low Performance, Firm Size, and Factory Expansion in the Shipbuilding Industry
Management Science 52(1), pp. 83-94, ©2006 INFORMS
Greve, H. R. 2003a. A behavioral theory of R&D expenditures andinnovations: Evidence from shipbuilding. Acad. Management }.47 685-702.
Greve, H. R. 2003b. Organizational Learning From PerformanceFeedback: A Behavioral Perspective on Innovation and Change.Cambridge University Press, Cambridge, UK.
Hannan, M. X, J. Freeman. 1984. Structural inertia and organiza-tional change. Amer. Sociol. Rev. 49 149-164.
Kahneman, D., D. Lovallo. 1993. Timid choices and bold forecasts:A cognitive perspective on risk taking. Organ. Sci. 39 17-31.
Kahneman, D., A. Tversky. 1979. Prospect theory: An analysis ofdecision under risk. Econometrica 47 263-291.
Ketchen, D. J., T. B. Palmer. 1999. Strategic responses to poor organi-zational performance: A test of competing perspectives. /. Man-agement 25 683-706.
Lant, T. K. 1992. Aspiration level adaptation: An empirical explo-ration. Management Sci. 38 623-644.
Lant, T. K., A. E. Hurley. 1999. A contingency model of responseto performance feedback: Escalation of commitment and incre-mental adaptation in resource investment decisions. GroupOrgan. Management 24 421-437.
Lant, T. K., D. B. Montgomery. 1987. Learning from strategic successand failure. /. Bus. Res. 15 503-518.
Laughhunn, D. J., J. W. Payne, R. Crum. 1980. Managerial risk pref-erences for below target returns. Management Sci. 26 1238-1249.
Levinthal, D. A. 1991. Random walks and organizational mortality.Admin. Sci. Quart. 36 397-420.
Levinthal, D. A., J. G. March. 1981. A model of adaptive organiza-tional search. /. Econom. Behavior Organ. 2 307-333.
Liang, K.-L., S. L. Zeger. 1986. Longitudinal data analysis usinggeneralized linear models. Biometrika 73 13-22.
Lopes, L. L. 1987. Between hope and fear: The psychology of risk.Adv. Experiment. Social Psych. 20 255-295.
March, J. G., Z. Shapira. 1987. Managerial perspectives on risk andrisk taking. Management Sci. 33 1404-1418.
March, J. G., Z. Shapira. 1992. Variable risk preferences and thefocus of attention. Psych. Rev. 99 172-183.
McNamara, G., P. Bromiley. 1997. Decision making in an organi-zational setting: Cognitive and organizational influences onrisk assessment in conunercial lending. Acad. Management J. 401063-1088.
Mezias, S. J., Y. R. Chen, P. R. Murphy 2002. Aspiration-level adap-tation in an American financial services organization: A fieldstudy Management Sci. 48 1285-1300.
Miller, K. D., P. Bromiley. 1990. Strategic risk and corporate perfor-mance: An analysis of alternative risk measures. Acad. Manage-ment J. 4 756-779.
Miller, K. D., W.-R. Chen. 2004. Variable organizational risk prefer-ences: Tests of the March-Shapira model. Acad. Management f.47 105-115.
Milliken, F. J., T. K. Lant. 1991. The effect of an organization's recentperformance history on strategic persistence and change. Adv.Strategic Management 7 129-156.
Mitchell, W. 1994. The dynamics of evolving markets: The effect ofbusiness sales and age on dissolutions and divestitures. Admin.Sci. Quart. 39 575-602.
Mone, M. A., W. McKinley, V. L. Barker. 1998. Organizationaldecline and innovation: A contingency framework. Acad. Man-agement Rev. 23 115-132.
Nickel, M. N., M. C. Rodriguez. 2002. A review of research onthe negative accounting relationship between risk and return:Bowman's paradox. Omega—Internat. J. Management Sci. 301-18.
Ocasio, W. C. 1995. The enactment of econontuc adversity: A rec-onciliation of theories of failure-induced change and threat-rigidity. Research in Organizational Behavior. JAI Press, Green-wich, CT, 287-331.
Palmer, T. B., R. M. Wiseman. 1999. Decoupling risk takingfrom income stream uncertainty. Strategic Management ]. 201037-1062.
Ruefli, T. W., J. M. CoUins, J. R. Lacugna. 1999. Risk measures instrategic management research: Auld lang syne? Strategic Man-agement ]. 20 167-194.
Shapira, Z. 1986. Risk Taking. Russel Sage Foundation, New York.Singh, J. 1986. Performance, slack, and risk taking in organizational
decision making. Acad. Management J. 29 562-585.Sitkin, S. B., A. L. Pablo. 1992. Reconceptualizing the determinants
of risk behavior. Acad. Management Rev. 17 9-38.Staw, B. M., L. E. Sandelands, J. E. Dutton. 1981. Threat-rigidity
effects in organizational behavior: A multilevel analysis.Admin. Sci. Quart. 26 501-524.
Wiseman, R. M., P. Bromiley. 1996. Toward a model of risk in declin-ing organizations: An empirical examination of risk, perfor-mance and decline. Organ. Sci. 7 524-543.
Wiseman, R. M., A. H. Catanach. 1997. A longitudinal disaggrega-tion of operational risk under changing regulations: Evidencefrom the savings and loan industry. Acad. Management J. 40799-830.