Embed Size (px)
Citation preview
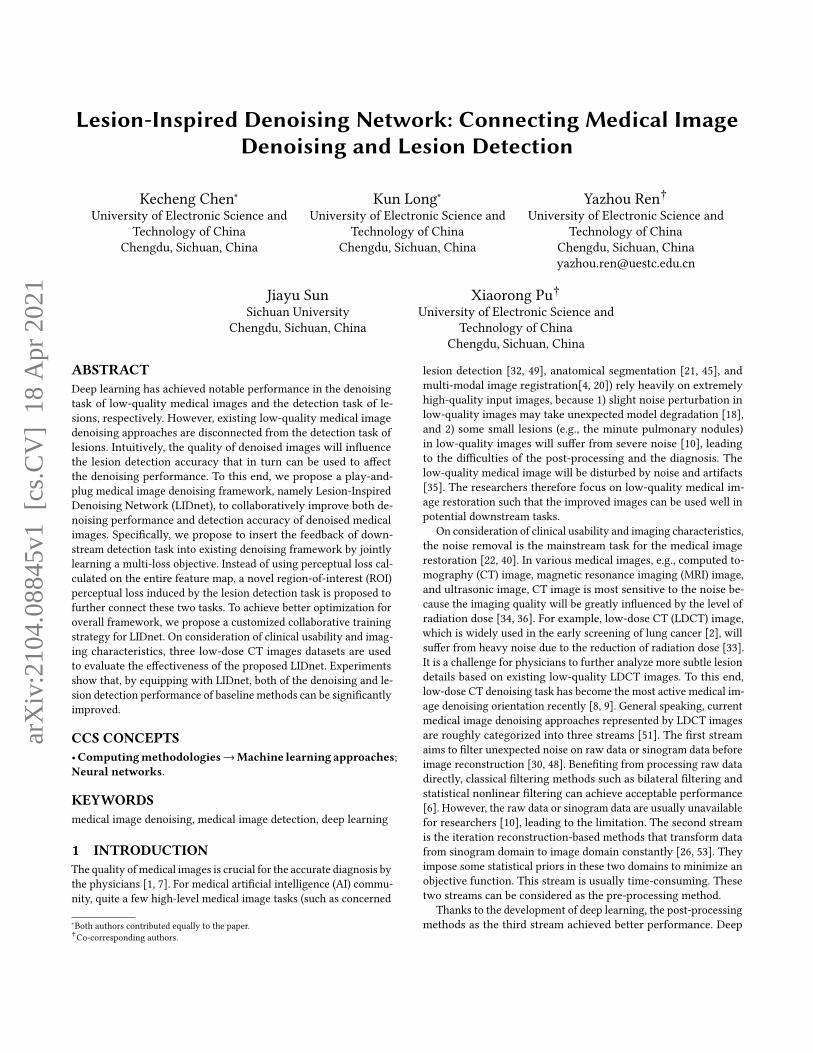
Lesion-Inspired Denoising Network: Connecting Medical ImageDenoising and Lesion Detection
Kecheng Chen∗University of Electronic Science and
Technology of ChinaChengdu, Sichuan, China
Kun Long∗University of Electronic Science and
Technology of ChinaChengdu, Sichuan, China
Yazhou Ren†University of Electronic Science and
Technology of ChinaChengdu, Sichuan, [email protected]
Jiayu SunSichuan University
Chengdu, Sichuan, China
Xiaorong Pu†University of Electronic Science and
Technology of ChinaChengdu, Sichuan, China
ABSTRACTDeep learning has achieved notable performance in the denoisingtask of low-quality medical images and the detection task of le-sions, respectively. However, existing low-quality medical imagedenoising approaches are disconnected from the detection task oflesions. Intuitively, the quality of denoised images will influencethe lesion detection accuracy that in turn can be used to affectthe denoising performance. To this end, we propose a play-and-plug medical image denoising framework, namely Lesion-InspiredDenoising Network (LIDnet), to collaboratively improve both de-noising performance and detection accuracy of denoised medicalimages. Specifically, we propose to insert the feedback of down-stream detection task into existing denoising framework by jointlylearning a multi-loss objective. Instead of using perceptual loss cal-culated on the entire feature map, a novel region-of-interest (ROI)perceptual loss induced by the lesion detection task is proposed tofurther connect these two tasks. To achieve better optimization foroverall framework, we propose a customized collaborative trainingstrategy for LIDnet. On consideration of clinical usability and imag-ing characteristics, three low-dose CT images datasets are usedto evaluate the effectiveness of the proposed LIDnet. Experimentsshow that, by equipping with LIDnet, both of the denoising and le-sion detection performance of baseline methods can be significantlyimproved.
CCS CONCEPTS•Computingmethodologies→Machine learning approaches;Neural networks.
KEYWORDSmedical image denoising, medical image detection, deep learning
1 INTRODUCTIONThe quality of medical images is crucial for the accurate diagnosis bythe physicians [1, 7]. For medical artificial intelligence (AI) commu-nity, quite a few high-level medical image tasks (such as concerned
∗Both authors contributed equally to the paper.†Co-corresponding authors.
lesion detection [32, 49], anatomical segmentation [21, 45], andmulti-modal image registration[4, 20]) rely heavily on extremelyhigh-quality input images, because 1) slight noise perturbation inlow-quality images may take unexpected model degradation [18],and 2) some small lesions (e.g., the minute pulmonary nodules)in low-quality images will suffer from severe noise [10], leadingto the difficulties of the post-processing and the diagnosis. Thelow-quality medical image will be disturbed by noise and artifacts[35]. The researchers therefore focus on low-quality medical im-age restoration such that the improved images can be used well inpotential downstream tasks.
On consideration of clinical usability and imaging characteristics,the noise removal is the mainstream task for the medical imagerestoration [22, 40]. In various medical images, e.g., computed to-mography (CT) image, magnetic resonance imaging (MRI) image,and ultrasonic image, CT image is most sensitive to the noise be-cause the imaging quality will be greatly influenced by the level ofradiation dose [34, 36]. For example, low-dose CT (LDCT) image,which is widely used in the early screening of lung cancer [2], willsuffer from heavy noise due to the reduction of radiation dose [33].It is a challenge for physicians to further analyze more subtle lesiondetails based on existing low-quality LDCT images. To this end,low-dose CT denoising task has become the most active medical im-age denoising orientation recently [8, 9]. General speaking, currentmedical image denoising approaches represented by LDCT imagesare roughly categorized into three streams [51]. The first streamaims to filter unexpected noise on raw data or sinogram data beforeimage reconstruction [30, 48]. Benefiting from processing raw datadirectly, classical filtering methods such as bilateral filtering andstatistical nonlinear filtering can achieve acceptable performance[6]. However, the raw data or sinogram data are usually unavailablefor researchers [10], leading to the limitation. The second streamis the iteration reconstruction-based methods that transform datafrom sinogram domain to image domain constantly [26, 53]. Theyimpose some statistical priors in these two domains to minimize anobjective function. This stream is usually time-consuming. Thesetwo streams can be considered as the pre-processing method.
Thanks to the development of deep learning, the post-processingmethods as the third stream achieved better performance. Deep
arX
iv:2
104.
0884
5v1
[cs
.CV
] 1
8 A
pr 2
021
Conference’17, July 2017, Washington, DC, USA Kecheng Chen, Kun Long, Yazhou Ren, Jiayu Sun, and Xiaorong Pu
learning-based post-processing methods perform LDCT image de-noising in the reconstructed image domain, which has the advan-tages of the efficiency and the convenience [24, 29, 42–44]. However,existing deep learning-based medical image denoising approachesstill have some limitations that need to be considered.
The biggest issue is that existing medical image denoising task isdisconnected from downstream tasks. Existing deep learning-basedmethods typically demonstrate their better denoising performancethrough multiple evaluation metrics, such as quantitative results(e.g., peak signal-to-noise ratio (PSNR) [44], structure similarityindex measure (SSIM) [9], texture matching loss (TML) [51]) anddouble-blind scoring experiments [42] (e.g., the scores of noisesuppression, contrast, and diagnostic acceptability). However, theactual usability of denoised images for deep neural network-baseddownstream medical image tasks (such as concerned lesion detec-tion, anatomical segmentation, and multi-modal image registration)dose not be explored. These downstream tasks are extremely crucialfor medicine-related AI communities.
The aforementioned issue may cause that the optimal denoisingresult is not the optimal one for downstream tasks. For example,existing deep learning-based LDCT images denoising approachesusually calculate the perceptual loss (which can be used to measurethe difference of feature space between the denoised result andcorresponding ground-truth) on the entire feature map [10, 29, 42–44, 51]. However, the lesions detection task, for example, prefersfocusing on the local region-of-interest [28], which causes the mis-match of the objective between these two tasks. In this case, thecalculation of perceptual loss on local feature maps is a better choicefor upstream denoising task.
To tackle these issues, an intuitive idea is to connect the medicalimage denoising task with downstream tasks. By doing so, the ac-tual usability of denoised images can be reflected explicitly via theoutput of downstream tasks. The feedback of downstream tasksalso can be leveraged by denoising task such that the medical im-age denoising task can learn a comprehensively optimal patternregardless of denoising and downstream tasks. In this paper, weconcentrate on deep learning-based LDCT image denoising taskand downstream deep learning-based lesions detection task, onconsideration of clinical use frequency, the availability of datasetsand noise characteristics. Following aforementioned idea, we pro-pose a play-and-plug medical image denoising framework, namelyLesion-Inspired Denoising Network (LIDnet), to collaborativelyimprove both denoising performance and the accuracy of detectionresults for medical images. To be more specific, we propose to con-nect the medical image denoising task with downstream detectiontask by inserting the feedback of downstream detection task intoexisting denoising framework through jointly learning a multi-lossobjective. We further connect these two tasks by a novel region-of-interest (ROI) perceptual loss induced by the lesion detection task,rather than simply using the perceptual loss calculated on the entirefeature map. To achieve better optimization for overall framework,a customized collaborative training strategy is proposed for LIDnet.
The contributions of this paper have three-folds:
• To the best of our knowledge, the LIDnet framework is thefirst attempt to connect the medical image denoising taskwith downstream detection task through jointly learning a
multi-loss objective, leading to the collaborative improve-ments of both denoising effect and detection accuracy• We propose a novel ROI perceptual loss induced by lesionsdetection task such that the detection results can be furtherinserted into the denoising task, which better matches theobjectives of these two tasks.• A customized collaborative training strategy is proposed forLIDnet framework, which can contribute to better optimiza-tion orientation for denoising and downstream networks.
2 RELATEDWORKSIn this study, the related works includes three aspects, i,e., deeplearning-based LDCT image denoising, deep learning-based lesiondetection, connection between denoising and downstream tasks.
2.1 Deep learning-based LDCT image denoisingLDCT image denoising is the most active orientation in medicalimage denoising fields, which contributes to its easily accessibledatasets [13, 31] and valuable clinical usability. Deep learning-basedLDCT image denoising methods have achieved better performancecompared with conventional methods. To the best of our knowl-edge, Chen et. al [9] firstly adopted a simple convolutional neuralnetwork (CNN) to suppress the noise of LDCT images. Sequentially,various CNN-based LDCT image denoising methods were proposed,including the single CNN-based framework [27] and generativeadversarial network (GAN)-based framework [29, 43, 44]. Red-CNN[8] is the typical single CNN baseline denoising method, achiev-ing excellent noise suppression by mean square error loss. Yanget. al [50] leveraged Wasserstein-GAN [5] (WGAN) and percep-tual loss [23] to achieve well data style transfer from the LDCTimage to the NDCT image. Based on this, many researches aimedto improve the ability of the generator of GAN. For example, CPCE[44] adopted a conveying path-based CNN. MAP-NN [43] proposeda modularized LDCT image denoising deep neural network. Forthe GAN-based framework, the perceptual loss is calculated on apre-trained VGG [41] model. Servel recent works also proposed toreplaced the perceptual loss with other losses (e.g., SSIM loss [29, 52]and autoencoder loss [24]) as they argued that the pre-trained VGGmodel (trained through ImageNet [11]) has the domain mismatchwith medical images. In summary, existing methods do not con-centrate on the actual usability of denoised image in downstreamtasks, which leads to the disconnection with downstream tasks.Meanwhile, existing approaches do not explicitly care about theperformance of the ROIs.
2.2 Deep learning-based lesion detectionGirshick et. al [15] first proposed a deep learning-based object de-tection model: R-CNN, which significantly inproved the accuracyof detection compared to traditional object detection algorithms.Since then, various detection models based on deep learning havebeen proposed (e.g., Faster R-CNN [38], YoLo [37], center Net [12]),which also opened up a new direction for the detection of lesions inmedical images. Anantharaman et. al [3] applied Mask R-CNN [19]to the oral pathology domain and used it to detect and segmentherpes labialis and aphthous ulcer. Tajbakhsh et. al [46] proposed aCNN based detection network for pulmonary embolism detection,
Lesion-Inspired Denoising Network: Connecting Medical Image Denoising and Lesion Detection Conference’17, July 2017, Washington, DC, USA
which achieved better performance than traditional pulmonaryembolism detection algorithms. Zhu et. al [54] proposed a deep 3Ddual path network for pulmonary nodule detection and classifica-tion. U-Net [39], a encoder-decoder network, has a wide range ofapplications in the field of medical images, which is usually usedto automatically segment lesions. All the models mentioned aboveneed a high quality image as input, even slight noise may makethe detection performance unacceptable. But in clinical, it is verydifficult to obtain high quality image. Therefore, denoising the inputimage before detection may be a feasible solution to improve thedetection result.
2.3 Connection between denoising anddownstream tasks
To the best of our knowledge, for medical images, there is no ef-fective connection between medical image denoising and lesiondetection methods, which is a crucial motivation for this paper. Liuet al. [25] proposed to connect the denoising task with semanticsegmentation for natural images. However, this connection schemeis not customized for medical images because the concern ROIs ofmedical image can not be considered into this framework. Theyalso do not concentrate on the collaborative optimization for twotasks.
3 THE PROPOSED METHODOLOGYPreliminary: For existing LDCT image denoising model and le-sions detection model, the training procedures of two models areusually disconnected. In this paper, we aim to connect the denoisingand detection tasks. We denote the training samples on a joint space𝑋 ×𝑌 ×𝑍 as𝐷 = {(𝑥𝑖 , 𝑦𝑖 , (𝑧𝑖𝑦_𝑟 , 𝑧𝑖𝑦_𝑐 , 𝑧𝑖𝑦_𝑤 , 𝑧𝑖𝑦_ℎ, 𝐿
𝑖𝑦))}𝑁𝑖=1, where 𝑥𝑖
and 𝑦𝑖 denote the 𝑖th LDCT image and corresponding normal-doseCT (NDCT) image, (𝑧𝑖𝑦_𝑟 , 𝑧𝑖𝑦_𝑐 , 𝑧𝑖𝑦_𝑤 , 𝑧𝑖𝑦_ℎ) denote 4 coordinates ofbounding box of detection target for the 𝑖th NDCT image 𝑦𝑖 , and𝐿𝑖𝑦 is the classification label of detection target.
For denoising purpose, our goal is to learn a mapping network𝐹 that can map 𝑥 → 𝑦 between two domains X and Y with pairedtraining samples (𝑥,𝑦) ∈ (𝑋,𝑌 ). For lesions detection, the processcan be roughly divided into two branches, including the generatingof region proposal and lesion recognition.
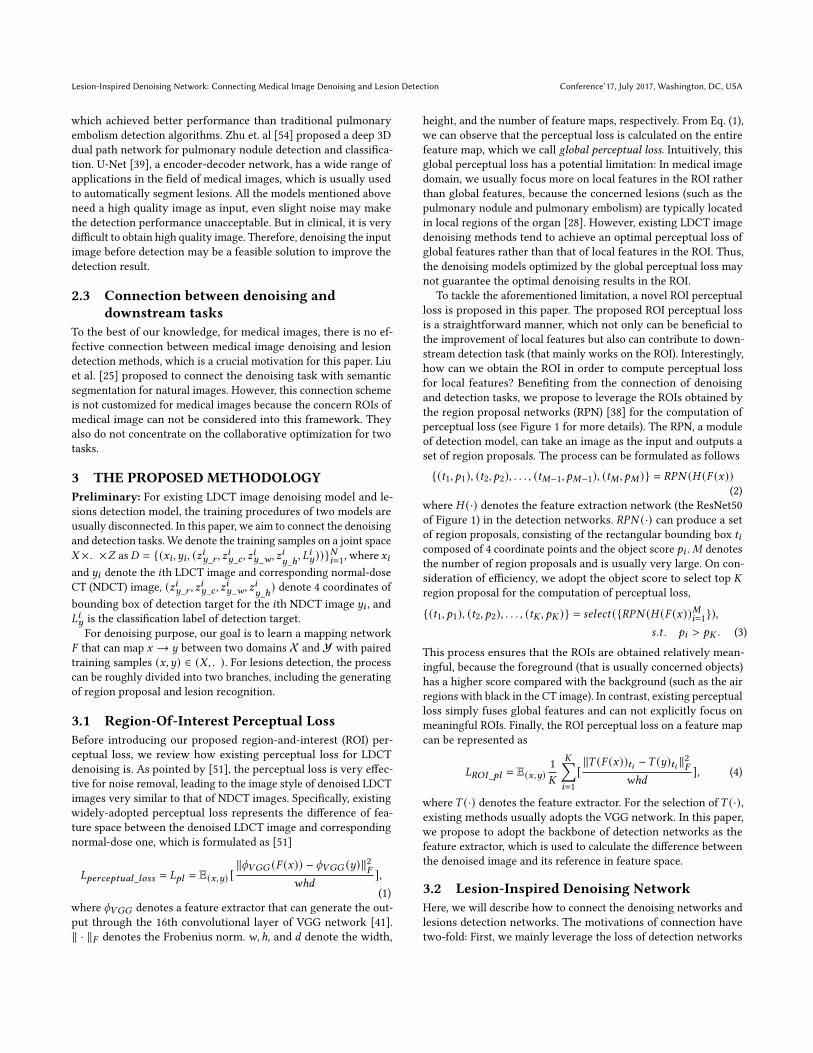
3.1 Region-Of-Interest Perceptual LossBefore introducing our proposed region-and-interest (ROI) per-ceptual loss, we review how existing perceptual loss for LDCTdenoising is. As pointed by [51], the perceptual loss is very effec-tive for noise removal, leading to the image style of denoised LDCTimages very similar to that of NDCT images. Specifically, existingwidely-adopted perceptual loss represents the difference of fea-ture space between the denoised LDCT image and correspondingnormal-dose one, which is formulated as [51]
𝐿𝑝𝑒𝑟𝑐𝑒𝑝𝑡𝑢𝑎𝑙_𝑙𝑜𝑠𝑠 = 𝐿𝑝𝑙 = E(𝑥,𝑦) [∥𝜙𝑉𝐺𝐺 (𝐹 (𝑥)) − 𝜙𝑉𝐺𝐺 (𝑦)∥2𝐹
𝑤ℎ𝑑],(1)
where 𝜙𝑉𝐺𝐺 denotes a feature extractor that can generate the out-put through the 16th convolutional layer of VGG network [41].∥ · ∥𝐹 denotes the Frobenius norm. 𝑤,ℎ, and 𝑑 denote the width,
height, and the number of feature maps, respectively. From Eq. (1),we can observe that the perceptual loss is calculated on the entirefeature map, which we call global perceptual loss. Intuitively, thisglobal perceptual loss has a potential limitation: In medical imagedomain, we usually focus more on local features in the ROI ratherthan global features, because the concerned lesions (such as thepulmonary nodule and pulmonary embolism) are typically locatedin local regions of the organ [28]. However, existing LDCT imagedenoising methods tend to achieve an optimal perceptual loss ofglobal features rather than that of local features in the ROI. Thus,the denoising models optimized by the global perceptual loss maynot guarantee the optimal denoising results in the ROI.
To tackle the aforementioned limitation, a novel ROI perceptualloss is proposed in this paper. The proposed ROI perceptual lossis a straightforward manner, which not only can be beneficial tothe improvement of local features but also can contribute to down-stream detection task (that mainly works on the ROI). Interestingly,how can we obtain the ROI in order to compute perceptual lossfor local features? Benefiting from the connection of denoisingand detection tasks, we propose to leverage the ROIs obtained bythe region proposal networks (RPN) [38] for the computation ofperceptual loss (see Figure 1 for more details). The RPN, a moduleof detection model, can take an image as the input and outputs aset of region proposals. The process can be formulated as follows
{(𝑡1, 𝑝1), (𝑡2, 𝑝2), . . . , (𝑡𝑀−1, 𝑝𝑀−1), (𝑡𝑀 , 𝑝𝑀 )} = 𝑅𝑃𝑁 (𝐻 (𝐹 (𝑥))(2)
where 𝐻 (·) denotes the feature extraction network (the ResNet50of Figure 1) in the detection networks. 𝑅𝑃𝑁 (·) can produce a setof region proposals, consisting of the rectangular bounding box 𝑡𝑖composed of 4 coordinate points and the object score 𝑝𝑖 .𝑀 denotesthe number of region proposals and is usually very large. On con-sideration of efficiency, we adopt the object score to select top 𝐾region proposal for the computation of perceptual loss,
{(𝑡1, 𝑝1), (𝑡2, 𝑝2), . . . , (𝑡𝐾 , 𝑝𝐾 )} = 𝑠𝑒𝑙𝑒𝑐𝑡 ({𝑅𝑃𝑁 (𝐻 (𝐹 (𝑥))𝑀𝑖=1}),𝑠 .𝑡 . 𝑝𝑖 > 𝑝𝐾 . (3)
This process ensures that the ROIs are obtained relatively mean-ingful, because the foreground (that is usually concerned objects)has a higher score compared with the background (such as the airregions with black in the CT image). In contrast, existing perceptualloss simply fuses global features and can not explicitly focus onmeaningful ROIs. Finally, the ROI perceptual loss on a feature mapcan be represented as
𝐿𝑅𝑂𝐼_𝑝𝑙 = E(𝑥,𝑦)1𝐾
𝐾∑︁𝑖=1[∥𝑇 (𝐹 (𝑥))𝑡𝑖 −𝑇 (𝑦)𝑡𝑖 ∥2𝐹
𝑤ℎ𝑑], (4)
where 𝑇 (·) denotes the feature extractor. For the selection of 𝑇 (·),existing methods usually adopts the VGG network. In this paper,we propose to adopt the backbone of detection networks as thefeature extractor, which is used to calculate the difference betweenthe denoised image and its reference in feature space.
3.2 Lesion-Inspired Denoising NetworkHere, we will describe how to connect the denoising networks andlesions detection networks. The motivations of connection havetwo-fold: First, we mainly leverage the loss of detection networks
Conference’17, July 2017, Washington, DC, USA Kecheng Chen, Kun Long, Yazhou Ren, Jiayu Sun, and Xiaorong Pu
LDCT
Generator
Denoised CT
Discriminator
ResNet50
NDCT
Detection Label
Pulmonary Embolism
Region Proposal Network
…
Generative ROI Proposals
…
Generative Object Scores
Top K
… …
ROI-1
ROI-2
ROI-K
… …
ROI-1
ROI-2
ROI-K
Denoised CT ROIs
NDCT ROIs
ROI Perceptual Loss
Subsequent Networks
Detection LossReconstruction Loss
Detection NetworksDenoising Networks
⊕ ⊕
𝒑𝒑𝟏𝟏:𝟎𝟎.𝟗𝟗𝟏𝟏𝒑𝒑𝟐𝟐:𝟎𝟎.𝟖𝟖𝟖𝟖 𝒑𝒑𝑴𝑴−𝟏𝟏:𝟎𝟎.𝟖𝟖𝟗𝟗
𝒑𝒑𝑴𝑴:𝟎𝟎.𝟏𝟏𝟏𝟏
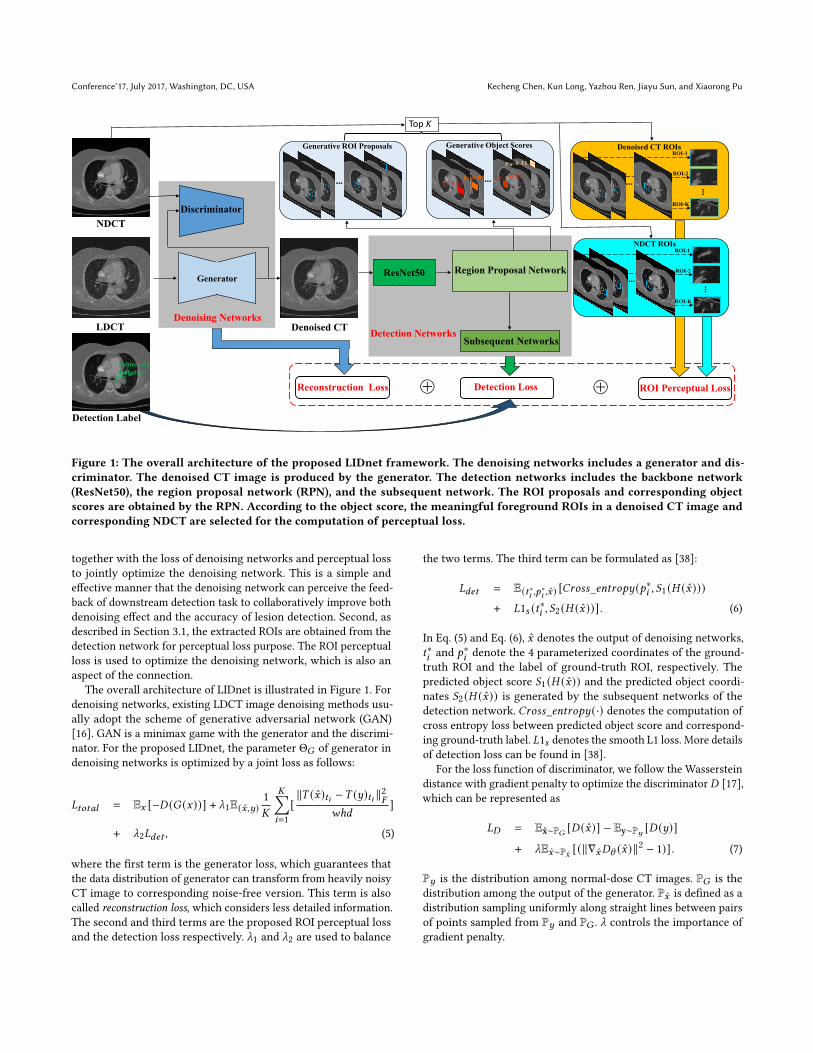
Figure 1: The overall architecture of the proposed LIDnet framework. The denoising networks includes a generator and dis-criminator. The denoised CT image is produced by the generator. The detection networks includes the backbone network(ResNet50), the region proposal network (RPN), and the subsequent network. The ROI proposals and corresponding objectscores are obtained by the RPN. According to the object score, the meaningful foreground ROIs in a denoised CT image andcorresponding NDCT are selected for the computation of perceptual loss.
together with the loss of denoising networks and perceptual lossto jointly optimize the denoising network. This is a simple andeffective manner that the denoising network can perceive the feed-back of downstream detection task to collaboratively improve bothdenoising effect and the accuracy of lesion detection. Second, asdescribed in Section 3.1, the extracted ROIs are obtained from thedetection network for perceptual loss purpose. The ROI perceptualloss is used to optimize the denoising network, which is also anaspect of the connection.
The overall architecture of LIDnet is illustrated in Figure 1. Fordenoising networks, existing LDCT image denoising methods usu-ally adopt the scheme of generative adversarial network (GAN)[16]. GAN is a minimax game with the generator and the discrimi-nator. For the proposed LIDnet, the parameter Θ𝐺 of generator indenoising networks is optimized by a joint loss as follows:
𝐿𝑡𝑜𝑡𝑎𝑙 = E𝑥 [−𝐷 (𝐺 (𝑥))] + _1E(𝑥,𝑦)1𝐾
𝐾∑︁𝑖=1[∥𝑇 (𝑥)𝑡𝑖 −𝑇 (𝑦)𝑡𝑖 ∥2𝐹
𝑤ℎ𝑑]
+ _2𝐿𝑑𝑒𝑡 , (5)
where the first term is the generator loss, which guarantees thatthe data distribution of generator can transform from heavily noisyCT image to corresponding noise-free version. This term is alsocalled reconstruction loss, which considers less detailed information.The second and third terms are the proposed ROI perceptual lossand the detection loss respectively. _1 and _2 are used to balance
the two terms. The third term can be formulated as [38]:
𝐿𝑑𝑒𝑡 = E(𝑡∗𝑖,𝑝∗
𝑖,𝑥) [𝐶𝑟𝑜𝑠𝑠_𝑒𝑛𝑡𝑟𝑜𝑝𝑦 (𝑝∗𝑖 , 𝑆1 (𝐻 (𝑥)))
+ 𝐿1𝑠 (𝑡∗𝑖 , 𝑆2 (𝐻 (𝑥))] . (6)
In Eq. (5) and Eq. (6), 𝑥 denotes the output of denoising networks,𝑡∗𝑖and 𝑝∗
𝑖denote the 4 parameterized coordinates of the ground-
truth ROI and the label of ground-truth ROI, respectively. Thepredicted object score 𝑆1 (𝐻 (𝑥)) and the predicted object coordi-nates 𝑆2 (𝐻 (𝑥)) is generated by the subsequent networks of thedetection network. 𝐶𝑟𝑜𝑠𝑠_𝑒𝑛𝑡𝑟𝑜𝑝𝑦 (·) denotes the computation ofcross entropy loss between predicted object score and correspond-ing ground-truth label. 𝐿1𝑠 denotes the smooth L1 loss. More detailsof detection loss can be found in [38].
For the loss function of discriminator, we follow the Wassersteindistance with gradient penalty to optimize the discriminator 𝐷 [17],which can be represented as
𝐿𝐷 = Ex̂∼P𝐺 [𝐷 (𝑥)] − Ey∼P𝑦 [𝐷 (𝑦)]
+ _E𝑥∼P�̂� [(∥∇𝑥𝐷\ (𝑥)∥2 − 1)] . (7)
P𝑦 is the distribution among normal-dose CT images. P𝐺 is thedistribution among the output of the generator. P𝑥 is defined as adistribution sampling uniformly along straight lines between pairsof points sampled from P𝑦 and P𝐺 . _ controls the importance ofgradient penalty.
Lesion-Inspired Denoising Network: Connecting Medical Image Denoising and Lesion Detection Conference’17, July 2017, Washington, DC, USA
Algorithm 1 The training procedure of proposed LIDnet.Input:1: LDCT images X = {x1, . . . , x𝑁 }, corresponding NDCT images
Y = {y1, . . . , y𝑁 }, ground-truth object coordinates of NDCTimages T∗ = {t∗1, . . . , t
∗𝑁}, and ground-truth object labels of
NDCT images P∗ = {p∗1, . . . , p∗𝑁}. Initial denoising network’s
parameters Θ and detection networks’ parameters𝜓 .2: Initial steps for pre-trained detection network 𝑇13: Training steps of denoising network in a round 𝑇24: Training steps of detection network based on denoise image in
a round 𝑇3Output: Learned parameters: Θ∗ and𝜓∗.5: Freeze Θ6: for i=0 to 𝑇1 do7: Sample a mini-batch X𝑑 , Y𝑑 , T∗𝑑 , and P
∗𝑑from X, Y, T∗, and
P∗, respectively.8: Optimize 𝜓 with (6) w.r.t. 𝑆1, 𝑆2 and 𝑅𝑃𝑁 on Y𝑑 , T∗𝑑 , and
P∗𝑑.
9: end for10: while Stopping criterion is not met do11: Unfreeze Θ. Freeze𝜓 .12: for i=0 to 𝑇2 do13: Sample a mini-batch X𝑑 , Y𝑑 , T∗𝑑 , and P∗
𝑑from X, Y, T∗,
and P∗, respectively.14: Optimize Θ with (5) (7) w.r.t. D and G (or optimize Θ
with (8) w.r.t. G) on X𝑑 , Y𝑑 , T∗𝑑 , and P∗𝑑.
15: end for16: Freeze Θ. Unfreeze𝜓 .17: for i=0 to 𝑇3 do18: Sample a mini-batch X𝑑 , Y𝑑 , T∗𝑑 , and P∗
𝑑from X, Y, T∗,
and P∗, respectively.19: Compute denoising output by denoising network:
𝑋𝑑𝑒𝑛𝑜𝑖𝑠𝑒 ← 𝐺 (𝑋𝑑 )20: Optimize𝜓 with (6) w.r.t. 𝑆1, 𝑆2 and 𝑅𝑃𝑁 on X𝑑𝑒𝑛𝑜𝑖𝑠𝑒 ,
T∗𝑑, and P∗
𝑑.
21: end for22: end while
Except for the scheme of GAN, some state-of-the-art LDCT imagedenoising methods (such as Red-CNN [8]) also adopt a single CNN-based network for denoising purpose. They can be also inserted intothe proposed LIDnet framework through replacing the GAN-baseddenoising networks with the single CNN-based network. By doingso, the objective of denoising networks can be formulated as:
𝐿𝑡𝑜𝑡𝑎𝑙 = E𝑥,𝑦 [1𝑁∥𝐹 (𝑥) − 𝑦∥2𝐹 ] + _1𝐿𝑅𝑂𝐼_𝑝𝑙 + _2𝐿𝑑𝑒𝑡 , (8)
where the first term is also the reconstruction loss. 𝑁 denotes thenumber of samples in a batch. For the detection networks, theloss function proposed in faster R-CNN is adopted to optimize theparameters.
From Eq. (5) and Eq. (8), the input of detection networks is thedenoised CT image produced by upstream denoising networks.This means that if the loss of detection network (the last term) ishigher, the denoising quality of denoising network may be worse.To this end, the high detection loss will push the denoising network
Table 1: The details of used datasets.
Dataset PE-CT 1 L-CT-A 2 L-CT-G 3
Scaning parts Chest Lung LungLesion Pulmoanry nodule Adenocarcinoma Carcinoma
Object Size small large largeSlice thickness ≤1mm 2𝑚𝑚 2𝑚𝑚Slice interval ≤ 1.5𝑚𝑚 0.625𝑚𝑚 ∼ 5𝑚𝑚 0.625𝑚𝑚 ∼ 5𝑚𝑚Resolution 512 × 512 512 × 512 512 × 512
Total 2304 3000 3000training 2000 2500 2500test 304 500 500
to learn a better pattern, which can collaboratively improve bothdenoising performance and the accuracy of detection results.
3.3 Collaborative Training for LIDnetThe proposed LIDnet framework involves multiple networks. Wecan observe that these networks are mutually constrained. Specifi-cally, the denoising networks need the detection networks to pro-vide ROI proposals in order to calculate the perceptual loss. Mean-while, the detection networks need the output of the denoising net-works as its input. If one of the two networks is not strong enough,the other network will also suffer from terrible optimization direc-tion. To tackle this issue, we proposed a customized collaborativetraining strategy (CTS) for LIDnet framework, which is similar tothe training process of GAN (iterative optimization). To be morespecific, we first use high-quality NDCT images to train the de-tection networks with predefined 𝑇1 steps, so that the detectionnetworks are optimized in a right direction and could provide ac-ceptable precise ROIs gradually. Then, the training of the denoisingnetworks and detection networks are carried out alternately withmultiple rounds. For a round, the denoising networks are trainedfirstly according to Eq. (5) or Eq. (8) with predefined 𝑇2 steps. Here,the ROIs for perceptual loss calculation are provided through theregion proposal network of detection networks. After training acertain number of steps, the detection networks are trained againbased on the output of denoising networks with predefined𝑇3 steps.The overall algorithm is described in Algorithm 1.
4 EXPERIMENTSIn this section, we carry out experiments to evaluate the effec-tiveness of the proposed LIDnet framework. To the best of ourknowledge, there is no open-source medical image datasets jointlyconsidering CT denoising and detection. To this end, we use NDCTimage detection datasets to simulate corresponding LDCT images.The jointly simulated low/normal-dose and detection datasets canbe obtained finally. Similar simulated schemes are widely adoptedin the fields of LDCT image denoising [9, 14], because it is unaccept-able for patients to be scaned using low and normal-dose radiationstwice. The details of used datasets are reported in Table 1. We adopta simple and effective LDCT simulation method as shown in [14].For PE-CT, L-CT-A and L-CT-G datasets, the noise levels 𝑁0 are setto 3000, 1000, and 1000, respectively.
Conference’17, July 2017, Washington, DC, USA Kecheng Chen, Kun Long, Yazhou Ren, Jiayu Sun, and Xiaorong Pu
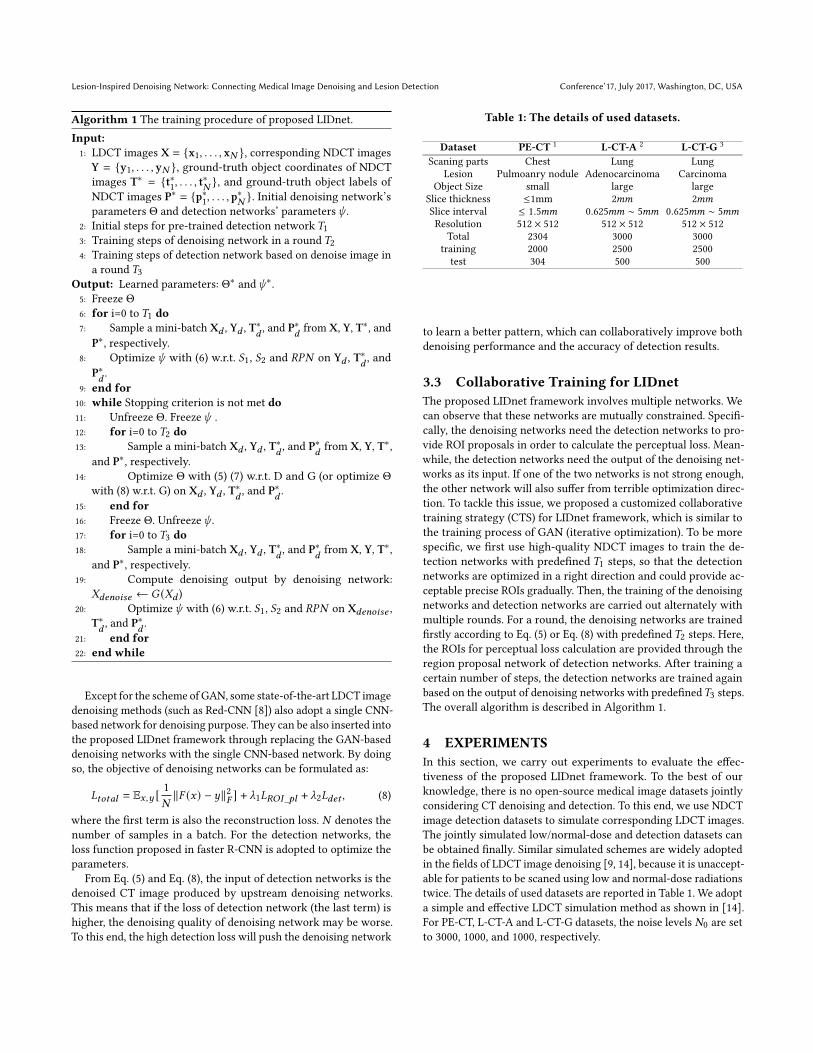
Table 2: The quantitative results of detection task on three datasets, in terms of AP-50, and AP-75, respectively. For adoptedbaselines, our proposed framework is used to implement their improved versions. The better score between the baseline andits improved version is bolded with blue. For the AP-50 and AP-75, the higher the better.
DATASET WGAN-VGG[50] Ours-WGAN-VGG CPCE[44] Ours-CPCE MAPNN[43] Ours-MAPNN SSMS [52] Ours-SSMS Res-HLF[29] Ours-Res-HLF
PE-CT AP-50 74.56 74.59 74.60 75.69 75.03 76.79 73.16 74.07 74.34 76.44AP-75 25.46 26.70 25.74 26.26 25.75 27.01 23.02 24.62 25.74 24.77
L-CT-G AP-50 93.90 95.31 91.62 93.74 92.84 95.14 91.15 93.89 94.24 95.28AP-75 46.15 48.14 35.89 46.67 45.04 45.53 38.76 44.00 47.74 48.90
L-CT-A AP-50 91.51 91.31 88.01 89.76 86.98 91.44 84.02 88.50 89.32 90.60AP-75 41.34 41.48 41.30 41.30 40.00 43.21 37.49 40.39 39.85 40.36
Table 3: The quantitative results of denoising task on three datasets for the ROIs and the overall image. For adopted baselines,our proposed framework is used to implement their improved versions. The better score between the baseline and its improvedversion is bolded with blue. For the correlation, homogeneity, RMSR, and energy, the lower the better. For the PSNR and theSSIM, the higher the better.
DATASET PE-CT L-CT-G L-CT-A
ROI Overall ROI Overall ROI OverallCorrelation Homogeneity Energy PSNR SSIM RMSE Correlation Homogeneity Energy PSNR SSIM RMSE Correlation Homogeneity Energy PSNR SSIM RMSE
WGAN-VGG 0.023 0.038 0.009 27.49 99.97 0.046 0.048 0.068 0.019 26.74 99.97 0.049 0.042 0.085 0.025 27.18 99.94 0.049Ours-WGAN-VGG 0.023 0.058 0.013 35.51 1.00 0.017 0.049 0.076 0.018 30.94 99.99 0.032 0.048 0.104 0.029 29.13 99.96 0.042
CPCE 0.021 0.045 0.012 26.34 99.97 0.049 0.055 0.090 0.022 28.45 99.98 0.042 0.049 0.109 0.030 26.30 99.93 0.057Ours-CPCE 0.019 0.034 0.009 31.76 99.99 0.028 0.054 0.078 0.018 29.90 99.99 0.035 0.043 0.105 0.030 28.01 99.95 0.047
MAPNN 0.024 0.045 0.011 27.33 99.97 0.043 0.052 0.078 0.018 23.37 99.91 0.077 0.047 0.102 0.027 28.20 99.95 0.046Ours-MAPNN 0.018 0.038 0.009 31.85 99.99 0.027 0.046 0.077 0.017 30.70 99.99 0.032 0.045 0.101 0.027 28.45 99.96 0.045
SSMS 0.040 0.138 0.043 33.89 99.99 0.021 0.071 0.109 0.022 24.55 99.95 0.061 0.047 0.125 0.032 27.56 99.94 0.049Ours-SSMS 0.028 0.087 0.021 31.86 99.99 0.027 0.070 0.010 0.022 29.84 99.99 0.035 0.046 0.105 0.030 25.85 99.94 0.057
Res-HLF 0.023 0.107 0.031 31.35 99.99 0.030 0.025 0.080 0.022 32.30 99.99 0.027 0.036 0.105 0.029 29.70 99.96 0.049Ours-Res-HLF 0.122 0.106 0.021 32.11 99.99 0.027 0.033 0.063 0.016 31.67 99.99 0.026 0.054 0.097 0.026 30.78 99.98 0.034
4.1 Baseline Methods and Evaluation MetricsWe compared our proposed LIDnet framework with following base-line methods, in terms of the quantitative/visual results of denoisedimages and the detection accuracy of denoised images. The detailsof baseline methods are described as follows:
• WGAN-VGG (2018) [50]: We consider the WGAN-VGGmodel proposed in [50] as the baseline. WGAN-VGG adoptsthe Wasserstein-GAN and perceptual loss (computed by theVGG network) for LDCT image denoising.• CPCE [44] (2018): We train a Conveying Path based Con-volutional Encoder-decoder (CPCE) network. This networkachieves impressive LDCT image denoising performanceand also uses the VGG-based perceptual loss for training.• MAP-NN [43] (2019): We apply a modularized LDCT imagedenoising deep neural network (MAP-NN). This networkincludes multiple equal denoising modules. We choose theversion with 3 modules in order to balance the denoisinglevel and the detailed retention. MAP-NN also adopts theVGG-based perceptual loss.• SSMS [52] (2019): This network adopts a Structurally-SensitiveMulti-Scale (SSMS) deep neural network for low-dose CTdenoising. Instead of using VGG-based perceptual loss, thestructured similarity index measure (SSIM) loss is used tomeasure the structural and perceptual similarity betweentwo images.
• Res-HLF [29] (2020): We apply a generative adversarial net-work with a hybrid loss function for LDCT image denois-ing. Similar to SSMS, Res-HLF also replaces the VGG-basedperceptual loss with SSIM loss in order to measure the per-ceptual similarity. In addition, the residual learning is intro-duced.
To evaluate the denoising performance of different methods,we calculate quantitative performance of denoising results on theregion-of-interest (ROI) and overall image, respectively. The se-lected ROIs are from the detection labels (the region of the lesion),which can deliver more useful pathological information. For theROIs, we use the mean absolute difference of radiomics featuresbetween the denoised images and corresponding NDCT imagesto evaluate the retention capacity of the underlying disease char-acteristics. The radiomics feature has powerful ability to uncoverthe microcosmic feature of the lesion in the ROIs. We empiricallyselect three typical radiomics features (including the correlation,homogeneity, and energy) in this paper. The Pyradiomics platform 4
is used to calculate single values per feature for a region of interest.More detail about computational radiomics features can be found in[47]. For overall performance, the peak signal-to-noise ratio (PSNR),structured similarity index measure (SSIM), and root mean squareerror (RMSE) are adopted.
To evaluate the detection performance of different methods, theAverage Precision (AP)-50 and AP-75 are used in this paper. Itshould be noted that the quantitative detection results for every
4https://pyradiomics.readthedocs.io/en/latest/
Lesion-Inspired Denoising Network: Connecting Medical Image Denoising and Lesion Detection Conference’17, July 2017, Washington, DC, USA
iou:0.60
LDCT NDCT Ours MAP-NN
SSMSRes-HLFWGAN-VGGCPCE
NDCTLDCT Ours MAP-NN CPCE WGAN-VGG Res-HLF SSMS
Pulmonary
Embolism IoU: 0.67 IoU: 0.60
IoU: 0.60 IoU: 0.57 IoU: 0.10IoU: 0 (Fail)
No object (Fail)
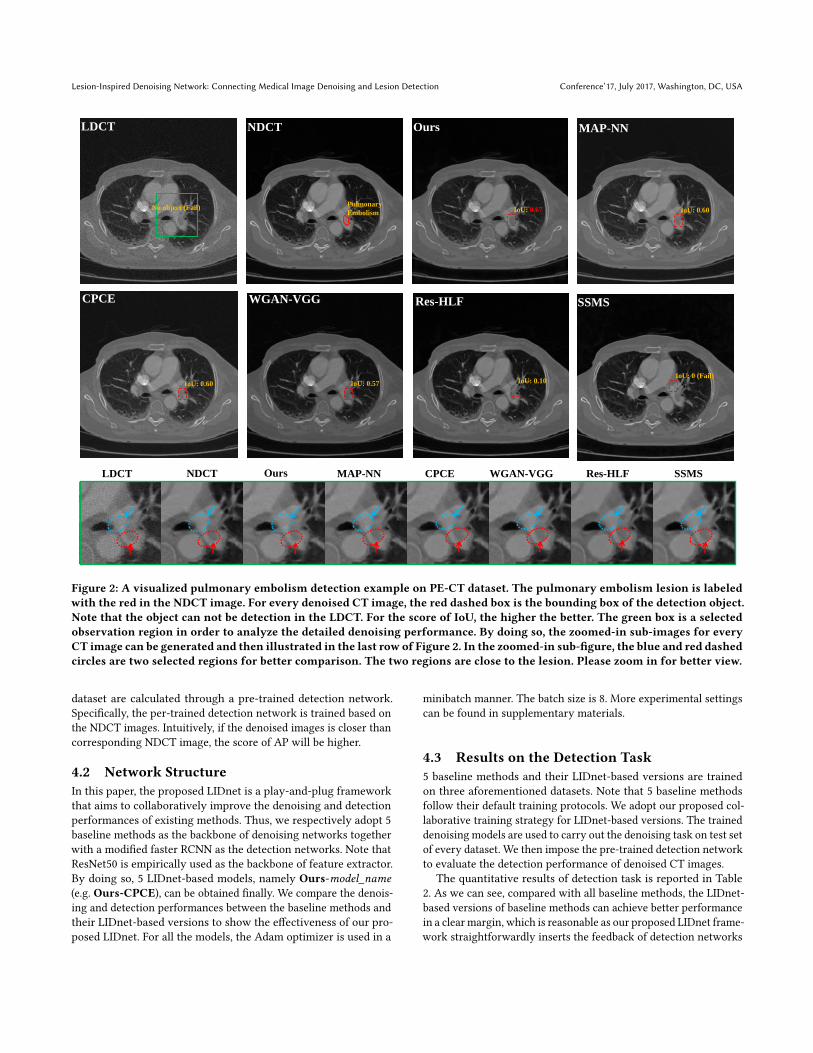
Figure 2: A visualized pulmonary embolism detection example on PE-CT dataset. The pulmonary embolism lesion is labeledwith the red in the NDCT image. For every denoised CT image, the red dashed box is the bounding box of the detection object.Note that the object can not be detection in the LDCT. For the score of IoU, the higher the better. The green box is a selectedobservation region in order to analyze the detailed denoising performance. By doing so, the zoomed-in sub-images for everyCT image can be generated and then illustrated in the last row of Figure 2. In the zoomed-in sub-figure, the blue and red dashedcircles are two selected regions for better comparison. The two regions are close to the lesion. Please zoom in for better view.
dataset are calculated through a pre-trained detection network.Specifically, the per-trained detection network is trained based onthe NDCT images. Intuitively, if the denoised images is closer thancorresponding NDCT image, the score of AP will be higher.
4.2 Network StructureIn this paper, the proposed LIDnet is a play-and-plug frameworkthat aims to collaboratively improve the denoising and detectionperformances of existing methods. Thus, we respectively adopt 5baseline methods as the backbone of denoising networks togetherwith a modified faster RCNN as the detection networks. Note thatResNet50 is empirically used as the backbone of feature extractor.By doing so, 5 LIDnet-based models, namely Ours-model_name(e.g. Ours-CPCE), can be obtained finally. We compare the denois-ing and detection performances between the baseline methods andtheir LIDnet-based versions to show the effectiveness of our pro-posed LIDnet. For all the models, the Adam optimizer is used in a
minibatch manner. The batch size is 8. More experimental settingscan be found in supplementary materials.
4.3 Results on the Detection Task5 baseline methods and their LIDnet-based versions are trainedon three aforementioned datasets. Note that 5 baseline methodsfollow their default training protocols. We adopt our proposed col-laborative training strategy for LIDnet-based versions. The traineddenoising models are used to carry out the denoising task on test setof every dataset. We then impose the pre-trained detection networkto evaluate the detection performance of denoised CT images.
The quantitative results of detection task is reported in Table2. As we can see, compared with all baseline methods, the LIDnet-based versions of baseline methods can achieve better performancein a clear margin, which is reasonable as our proposed LIDnet frame-work straightforwardly inserts the feedback of detection networks
Conference’17, July 2017, Washington, DC, USA Kecheng Chen, Kun Long, Yazhou Ren, Jiayu Sun, and Xiaorong Pu
2k 4k 6k 8k 10k 12k 14k 16k 18k 20k0
5
10
15
20
25
30
Iter.
AP
Baseline
Proposed CTS
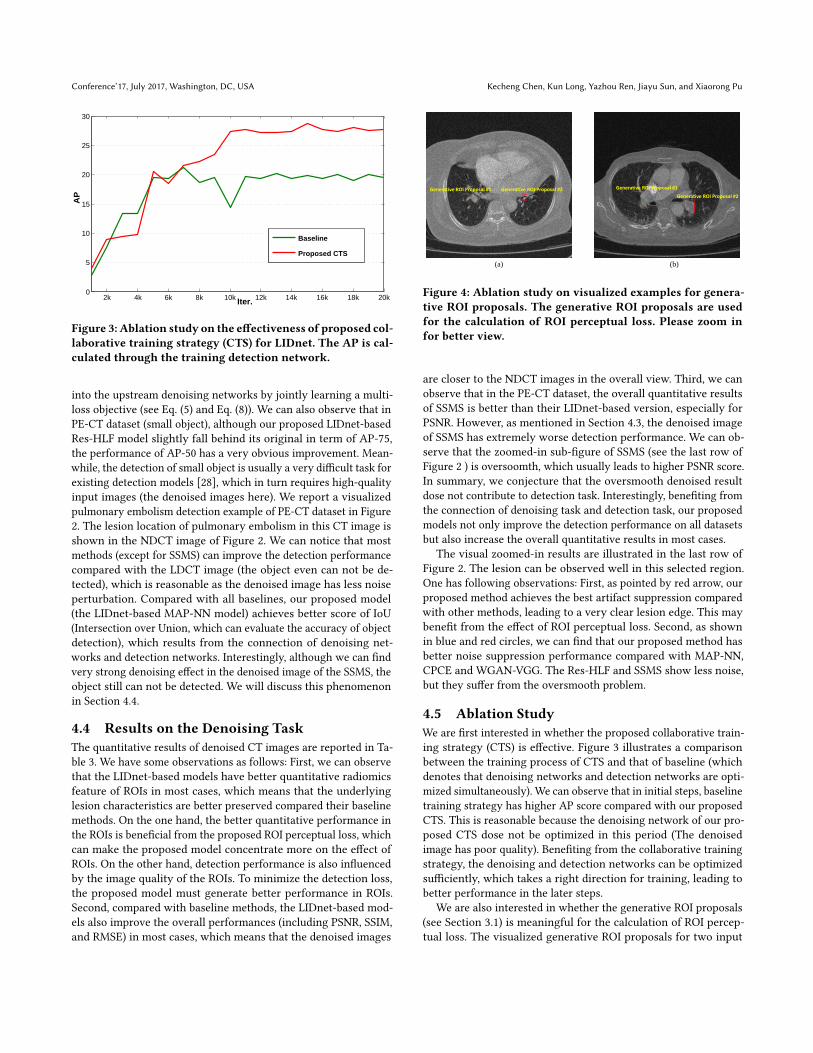
Figure 3: Ablation study on the effectiveness of proposed col-laborative training strategy (CTS) for LIDnet. The AP is cal-culated through the training detection network.
into the upstream denoising networks by jointly learning a multi-loss objective (see Eq. (5) and Eq. (8)). We can also observe that inPE-CT dataset (small object), although our proposed LIDnet-basedRes-HLF model slightly fall behind its original in term of AP-75,the performance of AP-50 has a very obvious improvement. Mean-while, the detection of small object is usually a very difficult task forexisting detection models [28], which in turn requires high-qualityinput images (the denoised images here). We report a visualizedpulmonary embolism detection example of PE-CT dataset in Figure2. The lesion location of pulmonary embolism in this CT image isshown in the NDCT image of Figure 2. We can notice that mostmethods (except for SSMS) can improve the detection performancecompared with the LDCT image (the object even can not be de-tected), which is reasonable as the denoised image has less noiseperturbation. Compared with all baselines, our proposed model(the LIDnet-based MAP-NN model) achieves better score of IoU(Intersection over Union, which can evaluate the accuracy of objectdetection), which results from the connection of denoising net-works and detection networks. Interestingly, although we can findvery strong denoising effect in the denoised image of the SSMS, theobject still can not be detected. We will discuss this phenomenonin Section 4.4.
4.4 Results on the Denoising TaskThe quantitative results of denoised CT images are reported in Ta-ble 3. We have some observations as follows: First, we can observethat the LIDnet-based models have better quantitative radiomicsfeature of ROIs in most cases, which means that the underlyinglesion characteristics are better preserved compared their baselinemethods. On the one hand, the better quantitative performance inthe ROIs is beneficial from the proposed ROI perceptual loss, whichcan make the proposed model concentrate more on the effect ofROIs. On the other hand, detection performance is also influencedby the image quality of the ROIs. To minimize the detection loss,the proposed model must generate better performance in ROIs.Second, compared with baseline methods, the LIDnet-based mod-els also improve the overall performances (including PSNR, SSIM,and RMSE) in most cases, which means that the denoised images
(a) (b)
Generative ROI Proposal #1
Generative ROI Proposal #2
Generative ROI Proposal #2Generative ROI Proposal #1
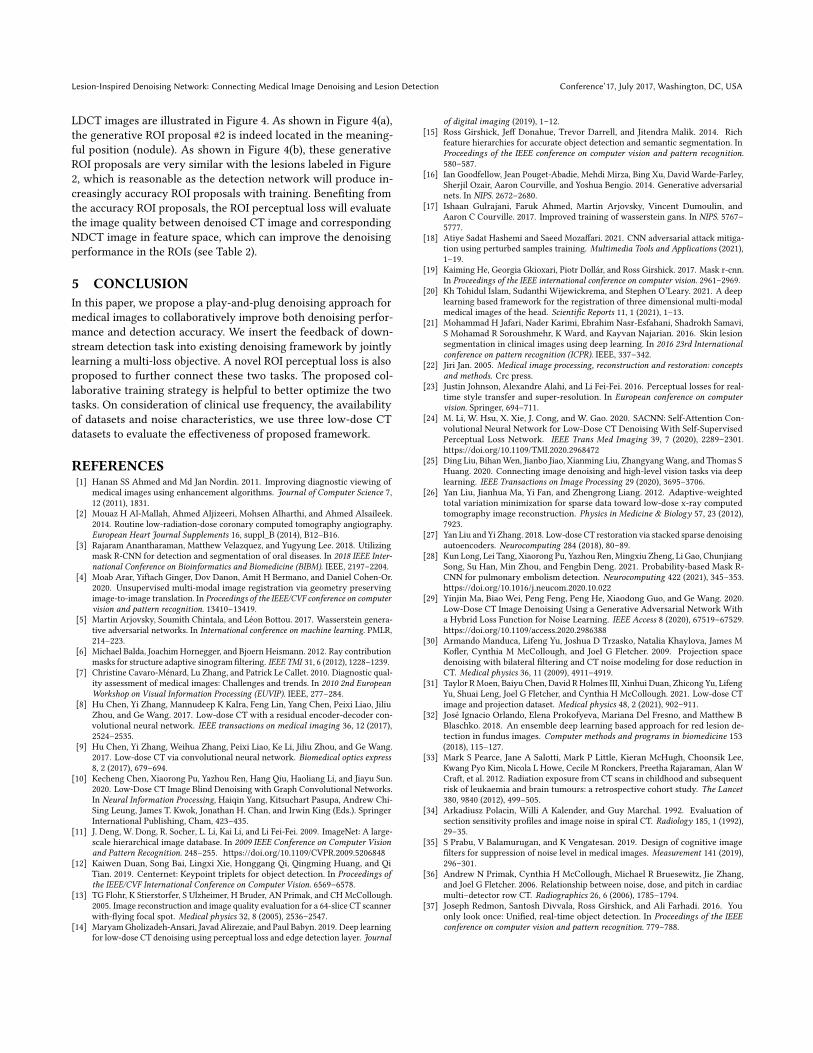
Figure 4: Ablation study on visualized examples for genera-tive ROI proposals. The generative ROI proposals are usedfor the calculation of ROI perceptual loss. Please zoom infor better view.
are closer to the NDCT images in the overall view. Third, we canobserve that in the PE-CT dataset, the overall quantitative resultsof SSMS is better than their LIDnet-based version, especially forPSNR. However, as mentioned in Section 4.3, the denoised imageof SSMS has extremely worse detection performance. We can ob-serve that the zoomed-in sub-figure of SSMS (see the last row ofFigure 2 ) is oversoomth, which usually leads to higher PSNR score.In summary, we conjecture that the oversmooth denoised resultdose not contribute to detection task. Interestingly, benefiting fromthe connection of denoising task and detection task, our proposedmodels not only improve the detection performance on all datasetsbut also increase the overall quantitative results in most cases.
The visual zoomed-in results are illustrated in the last row ofFigure 2. The lesion can be observed well in this selected region.One has following observations: First, as pointed by red arrow, ourproposed method achieves the best artifact suppression comparedwith other methods, leading to a very clear lesion edge. This maybenefit from the effect of ROI perceptual loss. Second, as shownin blue and red circles, we can find that our proposed method hasbetter noise suppression performance compared with MAP-NN,CPCE and WGAN-VGG. The Res-HLF and SSMS show less noise,but they suffer from the oversmooth problem.
4.5 Ablation StudyWe are first interested in whether the proposed collaborative train-ing strategy (CTS) is effective. Figure 3 illustrates a comparisonbetween the training process of CTS and that of baseline (whichdenotes that denoising networks and detection networks are opti-mized simultaneously). We can observe that in initial steps, baselinetraining strategy has higher AP score compared with our proposedCTS. This is reasonable because the denoising network of our pro-posed CTS dose not be optimized in this period (The denoisedimage has poor quality). Benefiting from the collaborative trainingstrategy, the denoising and detection networks can be optimizedsufficiently, which takes a right direction for training, leading tobetter performance in the later steps.
We are also interested in whether the generative ROI proposals(see Section 3.1) is meaningful for the calculation of ROI percep-tual loss. The visualized generative ROI proposals for two input
Lesion-Inspired Denoising Network: Connecting Medical Image Denoising and Lesion Detection Conference’17, July 2017, Washington, DC, USA
LDCT images are illustrated in Figure 4. As shown in Figure 4(a),the generative ROI proposal #2 is indeed located in the meaning-ful position (nodule). As shown in Figure 4(b), these generativeROI proposals are very similar with the lesions labeled in Figure2, which is reasonable as the detection network will produce in-creasingly accuracy ROI proposals with training. Benefiting fromthe accuracy ROI proposals, the ROI perceptual loss will evaluatethe image quality between denoised CT image and correspondingNDCT image in feature space, which can improve the denoisingperformance in the ROIs (see Table 2).
5 CONCLUSIONIn this paper, we propose a play-and-plug denoising approach formedical images to collaboratively improve both denoising perfor-mance and detection accuracy. We insert the feedback of down-stream detection task into existing denoising framework by jointlylearning a multi-loss objective. A novel ROI perceptual loss is alsoproposed to further connect these two tasks. The proposed col-laborative training strategy is helpful to better optimize the twotasks. On consideration of clinical use frequency, the availabilityof datasets and noise characteristics, we use three low-dose CTdatasets to evaluate the effectiveness of proposed framework.
REFERENCES[1] Hanan SS Ahmed and Md Jan Nordin. 2011. Improving diagnostic viewing of
medical images using enhancement algorithms. Journal of Computer Science 7,12 (2011), 1831.
[2] Mouaz H Al-Mallah, Ahmed Aljizeeri, Mohsen Alharthi, and Ahmed Alsaileek.2014. Routine low-radiation-dose coronary computed tomography angiography.European Heart Journal Supplements 16, suppl_B (2014), B12–B16.
[3] Rajaram Anantharaman, Matthew Velazquez, and Yugyung Lee. 2018. Utilizingmask R-CNN for detection and segmentation of oral diseases. In 2018 IEEE Inter-national Conference on Bioinformatics and Biomedicine (BIBM). IEEE, 2197–2204.
[4] Moab Arar, Yiftach Ginger, Dov Danon, Amit H Bermano, and Daniel Cohen-Or.2020. Unsupervised multi-modal image registration via geometry preservingimage-to-image translation. In Proceedings of the IEEE/CVF conference on computervision and pattern recognition. 13410–13419.
[5] Martin Arjovsky, Soumith Chintala, and Léon Bottou. 2017. Wasserstein genera-tive adversarial networks. In International conference on machine learning. PMLR,214–223.
[6] Michael Balda, Joachim Hornegger, and Bjoern Heismann. 2012. Ray contributionmasks for structure adaptive sinogram filtering. IEEE TMI 31, 6 (2012), 1228–1239.
[7] Christine Cavaro-Ménard, Lu Zhang, and Patrick Le Callet. 2010. Diagnostic qual-ity assessment of medical images: Challenges and trends. In 2010 2nd EuropeanWorkshop on Visual Information Processing (EUVIP). IEEE, 277–284.
[8] Hu Chen, Yi Zhang, Mannudeep K Kalra, Feng Lin, Yang Chen, Peixi Liao, JiliuZhou, and Ge Wang. 2017. Low-dose CT with a residual encoder-decoder con-volutional neural network. IEEE transactions on medical imaging 36, 12 (2017),2524–2535.
[9] Hu Chen, Yi Zhang, Weihua Zhang, Peixi Liao, Ke Li, Jiliu Zhou, and Ge Wang.2017. Low-dose CT via convolutional neural network. Biomedical optics express8, 2 (2017), 679–694.
[10] Kecheng Chen, Xiaorong Pu, Yazhou Ren, Hang Qiu, Haoliang Li, and Jiayu Sun.2020. Low-Dose CT Image Blind Denoising with Graph Convolutional Networks.In Neural Information Processing, Haiqin Yang, Kitsuchart Pasupa, Andrew Chi-Sing Leung, James T. Kwok, Jonathan H. Chan, and Irwin King (Eds.). SpringerInternational Publishing, Cham, 423–435.
[11] J. Deng, W. Dong, R. Socher, L. Li, Kai Li, and Li Fei-Fei. 2009. ImageNet: A large-scale hierarchical image database. In 2009 IEEE Conference on Computer Visionand Pattern Recognition. 248–255. https://doi.org/10.1109/CVPR.2009.5206848
[12] Kaiwen Duan, Song Bai, Lingxi Xie, Honggang Qi, Qingming Huang, and QiTian. 2019. Centernet: Keypoint triplets for object detection. In Proceedings ofthe IEEE/CVF International Conference on Computer Vision. 6569–6578.
[13] TG Flohr, K Stierstorfer, S Ulzheimer, H Bruder, AN Primak, and CH McCollough.2005. Image reconstruction and image quality evaluation for a 64-slice CT scannerwith-flying focal spot. Medical physics 32, 8 (2005), 2536–2547.
[14] MaryamGholizadeh-Ansari, Javad Alirezaie, and Paul Babyn. 2019. Deep learningfor low-dose CT denoising using perceptual loss and edge detection layer. Journal
of digital imaging (2019), 1–12.[15] Ross Girshick, Jeff Donahue, Trevor Darrell, and Jitendra Malik. 2014. Rich
feature hierarchies for accurate object detection and semantic segmentation. InProceedings of the IEEE conference on computer vision and pattern recognition.580–587.
[16] Ian Goodfellow, Jean Pouget-Abadie, Mehdi Mirza, Bing Xu, David Warde-Farley,Sherjil Ozair, Aaron Courville, and Yoshua Bengio. 2014. Generative adversarialnets. In NIPS. 2672–2680.
[17] Ishaan Gulrajani, Faruk Ahmed, Martin Arjovsky, Vincent Dumoulin, andAaron C Courville. 2017. Improved training of wasserstein gans. In NIPS. 5767–5777.
[18] Atiye Sadat Hashemi and Saeed Mozaffari. 2021. CNN adversarial attack mitiga-tion using perturbed samples training. Multimedia Tools and Applications (2021),1–19.
[19] Kaiming He, Georgia Gkioxari, Piotr Dollár, and Ross Girshick. 2017. Mask r-cnn.In Proceedings of the IEEE international conference on computer vision. 2961–2969.
[20] Kh Tohidul Islam, Sudanthi Wijewickrema, and Stephen O’Leary. 2021. A deeplearning based framework for the registration of three dimensional multi-modalmedical images of the head. Scientific Reports 11, 1 (2021), 1–13.
[21] Mohammad H Jafari, Nader Karimi, Ebrahim Nasr-Esfahani, Shadrokh Samavi,S Mohamad R Soroushmehr, K Ward, and Kayvan Najarian. 2016. Skin lesionsegmentation in clinical images using deep learning. In 2016 23rd Internationalconference on pattern recognition (ICPR). IEEE, 337–342.
[22] Jiri Jan. 2005. Medical image processing, reconstruction and restoration: conceptsand methods. Crc press.
[23] Justin Johnson, Alexandre Alahi, and Li Fei-Fei. 2016. Perceptual losses for real-time style transfer and super-resolution. In European conference on computervision. Springer, 694–711.
[24] M. Li, W. Hsu, X. Xie, J. Cong, and W. Gao. 2020. SACNN: Self-Attention Con-volutional Neural Network for Low-Dose CT Denoising With Self-SupervisedPerceptual Loss Network. IEEE Trans Med Imaging 39, 7 (2020), 2289–2301.https://doi.org/10.1109/TMI.2020.2968472
[25] Ding Liu, BihanWen, Jianbo Jiao, Xianming Liu, ZhangyangWang, and Thomas SHuang. 2020. Connecting image denoising and high-level vision tasks via deeplearning. IEEE Transactions on Image Processing 29 (2020), 3695–3706.
[26] Yan Liu, Jianhua Ma, Yi Fan, and Zhengrong Liang. 2012. Adaptive-weightedtotal variation minimization for sparse data toward low-dose x-ray computedtomography image reconstruction. Physics in Medicine & Biology 57, 23 (2012),7923.
[27] Yan Liu and Yi Zhang. 2018. Low-dose CT restoration via stacked sparse denoisingautoencoders. Neurocomputing 284 (2018), 80–89.
[28] Kun Long, Lei Tang, Xiaorong Pu, Yazhou Ren, Mingxiu Zheng, Li Gao, ChunjiangSong, Su Han, Min Zhou, and Fengbin Deng. 2021. Probability-based Mask R-CNN for pulmonary embolism detection. Neurocomputing 422 (2021), 345–353.https://doi.org/10.1016/j.neucom.2020.10.022
[29] Yinjin Ma, Biao Wei, Peng Feng, Peng He, Xiaodong Guo, and Ge Wang. 2020.Low-Dose CT Image Denoising Using a Generative Adversarial Network Witha Hybrid Loss Function for Noise Learning. IEEE Access 8 (2020), 67519–67529.https://doi.org/10.1109/access.2020.2986388
[30] Armando Manduca, Lifeng Yu, Joshua D Trzasko, Natalia Khaylova, James MKofler, Cynthia M McCollough, and Joel G Fletcher. 2009. Projection spacedenoising with bilateral filtering and CT noise modeling for dose reduction inCT. Medical physics 36, 11 (2009), 4911–4919.
[31] Taylor RMoen, Baiyu Chen, David R Holmes III, Xinhui Duan, Zhicong Yu, LifengYu, Shuai Leng, Joel G Fletcher, and Cynthia H McCollough. 2021. Low-dose CTimage and projection dataset. Medical physics 48, 2 (2021), 902–911.
[32] José Ignacio Orlando, Elena Prokofyeva, Mariana Del Fresno, and Matthew BBlaschko. 2018. An ensemble deep learning based approach for red lesion de-tection in fundus images. Computer methods and programs in biomedicine 153(2018), 115–127.
[33] Mark S Pearce, Jane A Salotti, Mark P Little, Kieran McHugh, Choonsik Lee,Kwang Pyo Kim, Nicola L Howe, Cecile M Ronckers, Preetha Rajaraman, Alan WCraft, et al. 2012. Radiation exposure from CT scans in childhood and subsequentrisk of leukaemia and brain tumours: a retrospective cohort study. The Lancet380, 9840 (2012), 499–505.
[34] Arkadiusz Polacin, Willi A Kalender, and Guy Marchal. 1992. Evaluation ofsection sensitivity profiles and image noise in spiral CT. Radiology 185, 1 (1992),29–35.
[35] S Prabu, V Balamurugan, and K Vengatesan. 2019. Design of cognitive imagefilters for suppression of noise level in medical images. Measurement 141 (2019),296–301.
[36] Andrew N Primak, Cynthia H McCollough, Michael R Bruesewitz, Jie Zhang,and Joel G Fletcher. 2006. Relationship between noise, dose, and pitch in cardiacmulti–detector row CT. Radiographics 26, 6 (2006), 1785–1794.
[37] Joseph Redmon, Santosh Divvala, Ross Girshick, and Ali Farhadi. 2016. Youonly look once: Unified, real-time object detection. In Proceedings of the IEEEconference on computer vision and pattern recognition. 779–788.
Conference’17, July 2017, Washington, DC, USA Kecheng Chen, Kun Long, Yazhou Ren, Jiayu Sun, and Xiaorong Pu
[38] Shaoqing Ren, Kaiming He, Ross Girshick, and Jian Sun. 2015. Faster r-cnn:Towards real-time object detection with region proposal networks. arXiv preprintarXiv:1506.01497 (2015).
[39] Olaf Ronneberger, Philipp Fischer, and Thomas Brox. 2015. U-net: Convolutionalnetworks for biomedical image segmentation. In International Conference onMedical image computing and computer-assisted intervention. Springer, 234–241.
[40] Ma Guadalupe Sanchez, Ma Guadalupe Sánchez, Vicente Vidal, GumersindoVerdu, Gumersindo Verdú, Patricia Mayo, and Francisco Rodenas. 2012. Medicalimage restoration with different types of noise. In 2012 Annual InternationalConference of the IEEE Engineering in Medicine and Biology Society. IEEE, 4382–4385.
[41] Abhronil Sengupta, Yuting Ye, Robert Wang, Chiao Liu, and Kaushik Roy. 2019.Going deeper in spiking neural networks: VGG and residual architectures. Fron-tiers in neuroscience 13 (2019), 95.
[42] Hongming Shan, Atul Padole, Fatemeh Homayounieh, Uwe Kruger, Ruhani DodaKhera, Chayanin Nitiwarangkul, Mannudeep K Kalra, and Ge Wang. 2019. Com-petitive performance of a modularized deep neural network compared to commer-cial algorithms for low-dose CT image reconstruction. NatureMachine Intelligence1, 6 (2019), 269.
[43] Hongming Shan, Atul Padole, Fatemeh Homayounieh, Uwe Kruger, Ruhani DodaKhera, Chayanin Nitiwarangkul, Mannudeep K. Kalra, and Ge Wang. 2019. Com-petitive performance of a modularized deep neural network compared to commer-cial algorithms for low-dose CT image reconstruction. NatureMachine Intelligence1, 6 (2019), 269–276. https://doi.org/10.1038/s42256-019-0057-9
[44] H. Shan, Y. Zhang, Q. Yang, U. Kruger, M. K. Kalra, L. Sun, W. Cong, and G.Wang. 2018. 3-D Convolutional Encoder-Decoder Network for Low-Dose CT viaTransfer Learning From a 2-D Trained Network. IEEE Trans Med Imaging 37, 6(2018), 1522–1534. https://doi.org/10.1109/TMI.2018.2832217
[45] Mohamed Yacin Sikkandar, Bader Awadh Alrasheadi, NB Prakash, GR Hemalak-shmi, A Mohanarathinam, and K Shankar. 2020. Deep learning based an auto-mated skin lesion segmentation and intelligent classification model. Journal ofambient intelligence and humanized computing (2020), 1–11.
[46] Nima Tajbakhsh, Jae Y Shin, Michael B Gotway, and Jianming Liang. 2019.Computer-aided detection and visualization of pulmonary embolism using anovel, compact, and discriminative image representation. Medical image analysis58 (2019), 101541.
[47] Joost JM Van Griethuysen, Andriy Fedorov, Chintan Parmar, Ahmed Hosny,Nicole Aucoin, Vivek Narayan, Regina GH Beets-Tan, Jean-Christophe Fillion-Robin, Steve Pieper, and Hugo JWL Aerts. 2017. Computational radiomics systemto decode the radiographic phenotype. Cancer research 77, 21 (2017), e104–e107.
[48] Jing Wang, Hongbing Lu, Tianfang Li, and Zhengrong Liang. 2005. Sinogramnoise reduction for low-dose CT by statistics-based nonlinear filters. In MIIP,Vol. 5747. International Society for Optics and Photonics, 2058–2066.
[49] Ke Yan, Xiaosong Wang, Le Lu, and Ronald M Summers. 2018. DeepLesion:automated mining of large-scale lesion annotations and universal lesion detectionwith deep learning. Journal of medical imaging 5, 3 (2018), 036501.
[50] Q. Yang, P. Yan, Y. Zhang, H. Yu, Y. Shi, X. Mou, M. K. Kalra, Y. Zhang, L. Sun, andG. Wang. 2018. Low-Dose CT Image Denoising Using a Generative AdversarialNetworkWithWasserstein Distance and Perceptual Loss. IEEE TransMed Imaging37, 6 (2018), 1348–1357. https://doi.org/10.1109/TMI.2018.2827462
[51] Chenyu You, Qingsong Yang, Lars Gjesteby, Guang Li, Shenghong Ju, ZhuiyangZhang, Zhen Zhao, Yi Zhang, Wenxiang Cong, Ge Wang, et al. 2018. Structurally-sensitive multi-scale deep neural network for low-dose CT denoising. IEEE Access6 (2018), 41839–41855.
[52] C. You, Q. Yang, H. Shan, L. Gjesteby, G. Li, S. Ju, Z. Zhang, Z. Zhao, Y. Zhang, C.Wenxiang, and G. Wang. 2018. Structurally-sensitive Multi-scale Deep NeuralNetwork for Low-Dose CT Denoising. IEEE Access 6 (2018), 41839–41855. https://doi.org/10.1109/ACCESS.2018.2858196
[53] Yanbo Zhang, Xuanqin Mou, Ge Wang, and Hengyong Yu. 2016. Tensor-baseddictionary learning for spectral CT reconstruction. IEEE TMI 36, 1 (2016), 142–154.
[54] Wentao Zhu, Chaochun Liu, Wei Fan, and Xiaohui Xie. 2018. Deeplung: Deep 3ddual path nets for automated pulmonary nodule detection and classification. In2018 IEEE Winter Conference on Applications of Computer Vision (WACV). IEEE,673–681.
A DETAIL OF ARCHITECTURES ANDEXPERIMENTAL SETTINGS
For baseline methods, we tune the hyperparameters in a wide range.For WGAN-VGG, MAP-NN and CPCE, the importance term _′
(called in their papers) of the perceptual loss is 100 among threedatasets. For SSMS and Res-HLF, the importance term 𝛽𝑠𝑠𝑖𝑚 (called
in their papers) of SSIM loss is 50 among three datasets. The trainingwas stopped when the model converged.
For the LIDnet-based baseline method, we use the generatorof every baseline method as the denoiser of single CNN-baseddenoising network on considerations of training time and resourceconsumption. Because we find that, compared with the versionof GAN-based network, the single CNN-based network not onlycan achieve competitive performance but also can significantlyreduce the training consumption. The results of a ablation studyare reported in Table 4. For the hyperparameters, we choose _1 = 5and _2 = 5 among three datasets. To avoid the oversmooth results,the mean absolute error is used as the reconstruction loss. 𝐾 isempirically set to 5. For proposed collaborative training strategy,𝑇1 = 4000, 𝑇2 = 4000 and 𝑇3 = 2000 .
For the all models, the learning rate of generator is 1× 10⁻⁴, andthe learning rate of discriminator is 4×10⁻⁴. _ = 10 for the gradientpenalty in Eq. (7). We use two NVIDIA GeForce 1080Ti GPUs totrain the all models. The size of minibatch is 8. For the fairness, allmodels are trained with the entire image as the input, rather thanthe manner of patches.
For detection networks, the learning rate is set to 5 × 10⁻³. Thepre-trained ResNet50 network is used.
Table 4: Ablation study about different frameworks ofLIDnet-based CPCE model on PE-CT dataset.
Method Detection Denoising- ROI Overall
AP-50 AP-75 Correlation Homogeneity Energy PSNR SSIM RMSE Training time𝑂𝑢𝑟𝑠 −𝐶𝑃𝐶𝐸𝐶𝑁𝑁 75.69 26.26 0.019 0.034 0.009 31.76 99.99 0.028 ∼7 hours𝑂𝑢𝑟𝑠 −𝐶𝑃𝐶𝐸𝐺𝐴𝑁 75.99 26.34 0.016 0.045 0.011 28.46 99.98 0.039 ∼32 hours
Lesion-Inspired Denoising Network: Connecting Medical Image Denoising and Lesion Detection Conference’17, July 2017, Washington, DC, USA
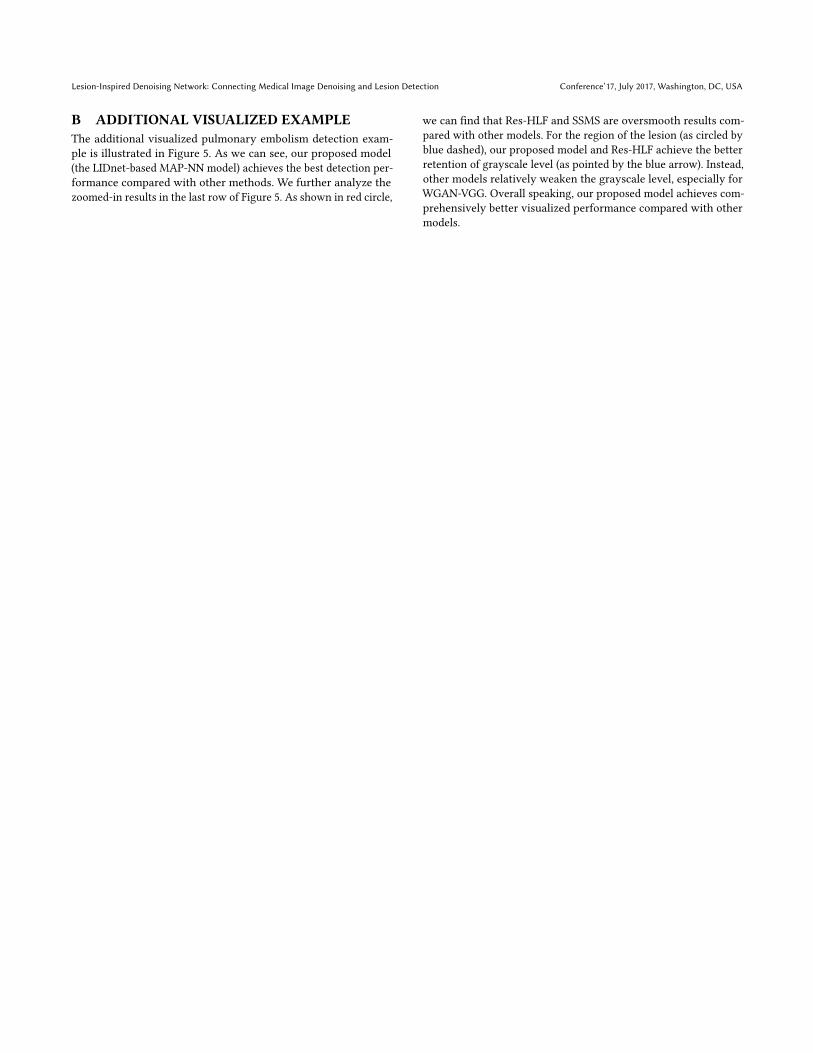
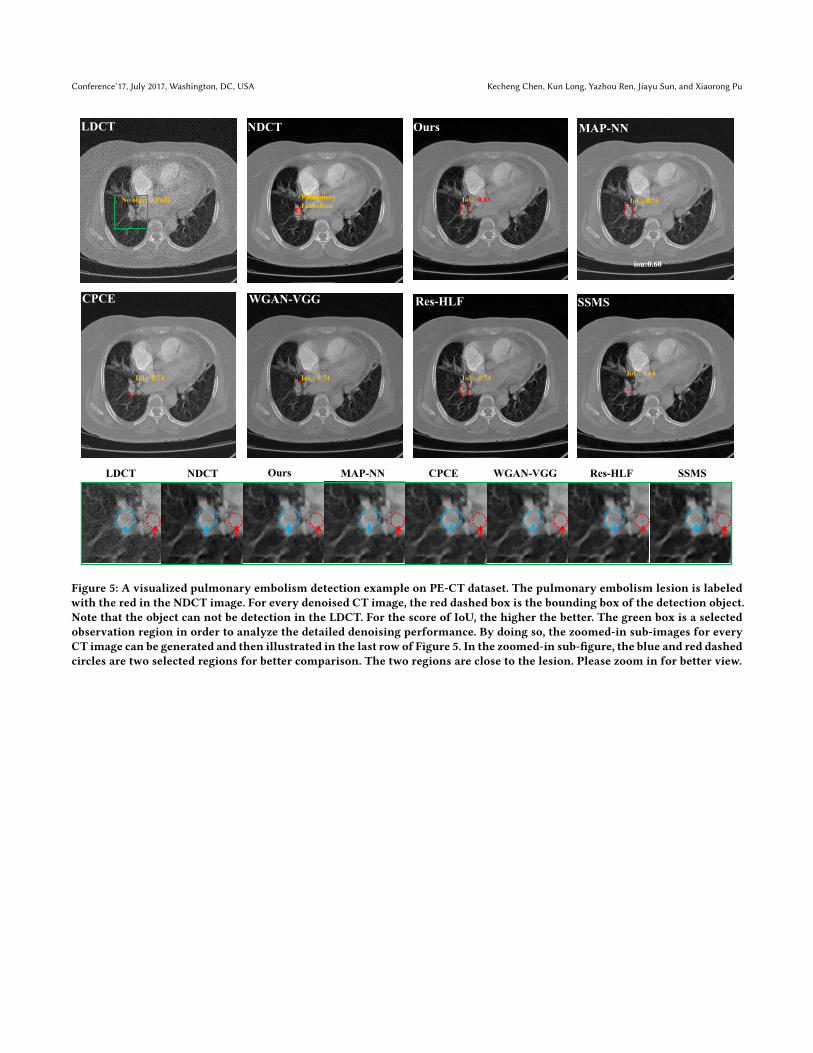
B ADDITIONAL VISUALIZED EXAMPLEThe additional visualized pulmonary embolism detection exam-ple is illustrated in Figure 5. As we can see, our proposed model(the LIDnet-based MAP-NN model) achieves the best detection per-formance compared with other methods. We further analyze thezoomed-in results in the last row of Figure 5. As shown in red circle,
we can find that Res-HLF and SSMS are oversmooth results com-pared with other models. For the region of the lesion (as circled byblue dashed), our proposed model and Res-HLF achieve the betterretention of grayscale level (as pointed by the blue arrow). Instead,other models relatively weaken the grayscale level, especially forWGAN-VGG. Overall speaking, our proposed model achieves com-prehensively better visualized performance compared with othermodels.
Conference’17, July 2017, Washington, DC, USA Kecheng Chen, Kun Long, Yazhou Ren, Jiayu Sun, and Xiaorong Pu
iou:0.60
LDCT NDCT Ours MAP-NN
SSMSRes-HLFWGAN-VGGCPCE
NDCTLDCT Ours MAP-NN CPCE WGAN-VGG Res-HLF SSMS
Pulmonary Embolism
IoU: 0.83 IoU: 0.76
IoU: 0.74 IoU: 0.74 IoU: 0.74 IoU: 0.64
No object (Fail)
Figure 5: A visualized pulmonary embolism detection example on PE-CT dataset. The pulmonary embolism lesion is labeledwith the red in the NDCT image. For every denoised CT image, the red dashed box is the bounding box of the detection object.Note that the object can not be detection in the LDCT. For the score of IoU, the higher the better. The green box is a selectedobservation region in order to analyze the detailed denoising performance. By doing so, the zoomed-in sub-images for everyCT image can be generated and then illustrated in the last row of Figure 5. In the zoomed-in sub-figure, the blue and red dashedcircles are two selected regions for better comparison. The two regions are close to the lesion. Please zoom in for better view.

![Directional Weight Based Contourlet Transform Denoising ... · The review of the OCT image denoising methods ... contourlet-based image denoising algorithms are introduced in [8–11]](https://img.pdfslide.us/doc/110x75/5e920a152beef11a6d19fb1e/directional-weight-based-contourlet-transform-denoising-the-review-of-the-oct.jpg)