Embed Size (px)
Citation preview
LEP1.5.10
-00Optical determination of velocity of sound in liquids
PHYWE series of publications • Laboratory Experiments • Physics • © PHYWE SYSTEME GMBH & Co. KG • D-37070 Göttingen 21510-00 1
Related topicsUltrasonics, sound velocity, frequency, wavelength, soundpressure, stationary waves.
PrincipleA stationary ultrasonic wave in a glass cell full of liquid is tra-versed by a divergent beam of light. The sound wavelengthcan be determined from the central projection of the soundfield on the basis of the refractive index which canges with thesound pressure.
EquipmentUltrasonic generator 11744.93 1Laser, He-Ne 1.0 mW, 230 V AC 08181.93 1Glass cell, 150�55�100 mm 03504.00 1Lens holder 08012.00 1Lens, mounted, f = +20 mm 08018.01 1Screen, metal, 300�300 mm 08062.00 1Optical profile-bench, l = 1000 mm 08282.00 1Base f. opt. profile-bench, adjust. 08284.00 2Slide mount f. opt. pr.-bench, h = 80 mm 08286.02 1Slide mount f. opt. pr.-bench, h = 30 mm 08286.01 3Swinging arm 08256.00 1Table top on rod, 18.5�11 cm 08060.00 1Thermometer -10...+30 °C 05949.00 1Right angle clamp -PASS- 02040.55 1Support rod, l = 250 mm 02031.00 1Universal clamp 37715.00 1
Glycerol, 250 ml 30084.25 3Water, distilled, 5 l 31246.81 1
TasksTo determine the wavelength of sound in liquids, and from thiscalucate the sound velocity, from the structure of the central-ly projected image.
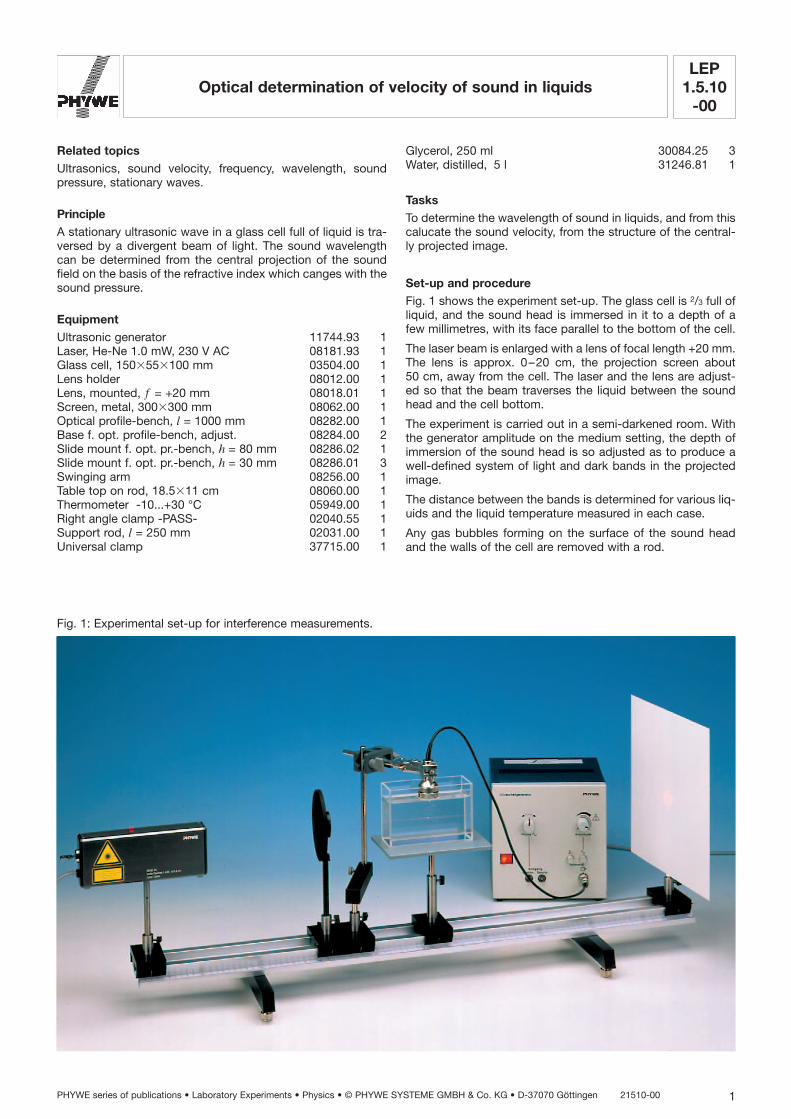
Set-up and procedureFig. 1 shows the experiment set-up. The glass cell is 2/3 full ofliquid, and the sound head is immersed in it to a depth of afew millimetres, with its face parallel to the bottom of the cell.
The laser beam is enlarged with a lens of focal length +20 mm.The lens is approx. 0–20 cm, the projection screen about50 cm, away from the cell. The laser and the lens are adjust-ed so that the beam traverses the liquid between the soundhead and the cell bottom.
The experiment is carried out in a semi-darkened room. Withthe generator amplitude on the medium setting, the depth ofimmersion of the sound head is so adjusted as to produce awell-defined system of light and dark bands in the projectedimage.
The distance between the bands is determined for various liq-uids and the liquid temperature measured in each case.
Any gas bubbles forming on the surface of the sound headand the walls of the cell are removed with a rod.
Fig. 1: Experimental set-up for interference measurements.
LEP1.5.10
-00Optical determination of velocity of sound in liquids
21510-00 PHYWE series of publications • Laboratory Experiments • Physics • © PHYWE SYSTEME GMBH & Co. KG • D-37070 Göttingen2
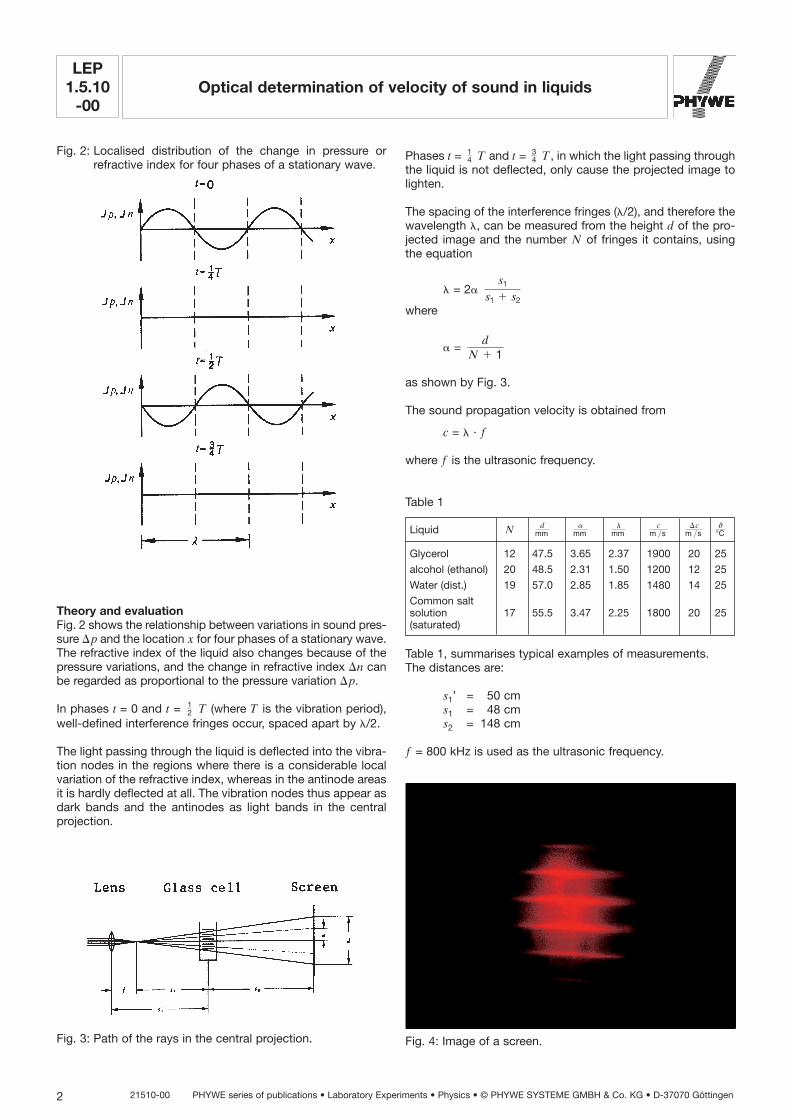
Fig. 2: Localised distribution of the change in pressure orrefractive index for four phases of a stationary wave.
Theory and evaluationFig. 2 shows the relationship between variations in sound pres-sure %p and the location x for four phases of a stationary wave.The refractive index of the liquid also changes because of thepressure variations, and the change in refractive index %n canbe regarded as proportional to the pressure variation %p.
In phases t = 0 and t = T (where T is the vibration period),well-defined interference fringes occur, spaced apart by M/2.
The light passing through the liquid is deflected into the vibra-tion nodes in the regions where there is a considerable localvariation of the refractive index, whereas in the antinode areasit is hardly deflected at all. The vibration nodes thus appear asdark bands and the antinodes as light bands in the centralprojection.
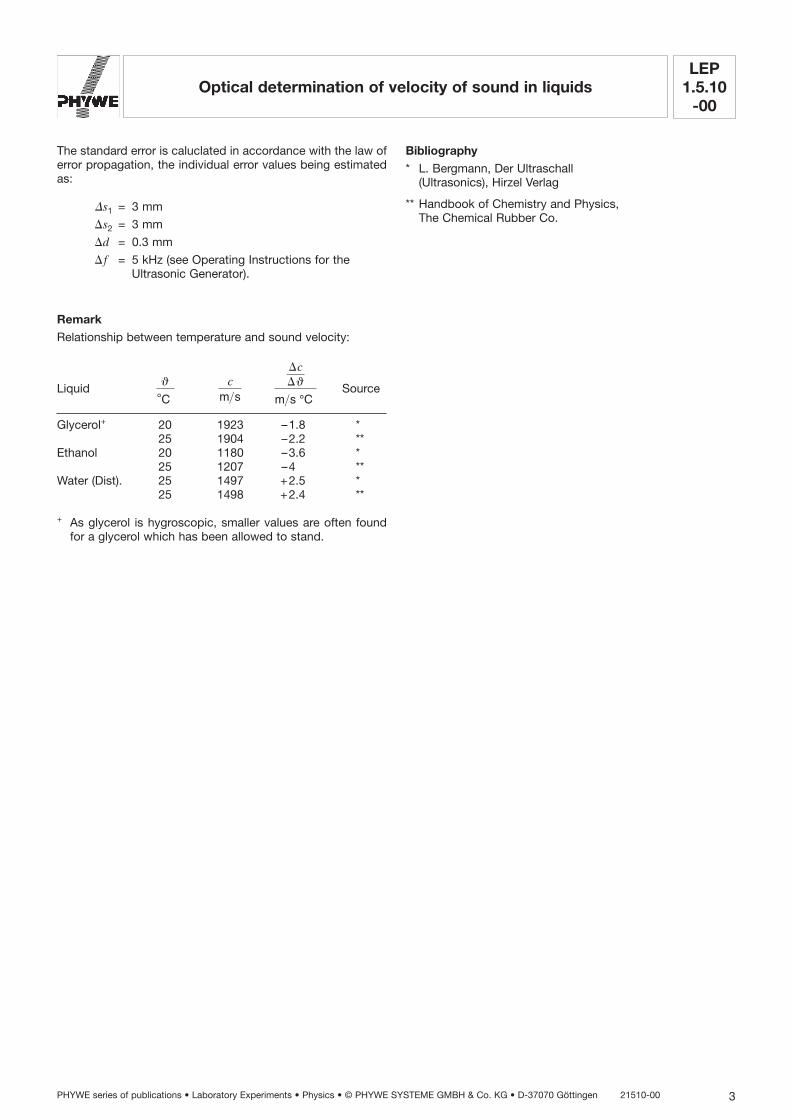
Fig. 3: Path of the rays in the central projection.
Phases t = T and t = T, in which the light passing throughthe liquid is not deflected, only cause the projected image tolighten.
The spacing of the interference fringes (M/2), and therefore thewavelength M, can be measured from the height d of the pro-jected image and the number N of fringes it contains, usingthe equation
M = 2B
where
B =
as shown by Fig. 3.
The sound propagation velocity is obtained from
c = M · f
where f is the ultrasonic frequency.
Table 1
Table 1, summarises typical examples of measurements.The distances are:
s1’ = 50 cms1 = 48 cms2 = 148 cm
f = 800 kHz is used as the ultrasonic frequency.
dN � 1
s1
s1 � s2
34
14
12
Liquid N
Glycerol 12 47.5 3.65 2.37 1900 20 25
alcohol (ethanol) 20 48.5 2.31 1.50 1200 12 25
Water (dist.) 19 57.0 2.85 1.85 1480 14 25
Common saltsolution 17 55.5 3.47 2.25 1800 20 25(saturated)
q°C
¢cm >s
cm >s
lmm
amm
dmm
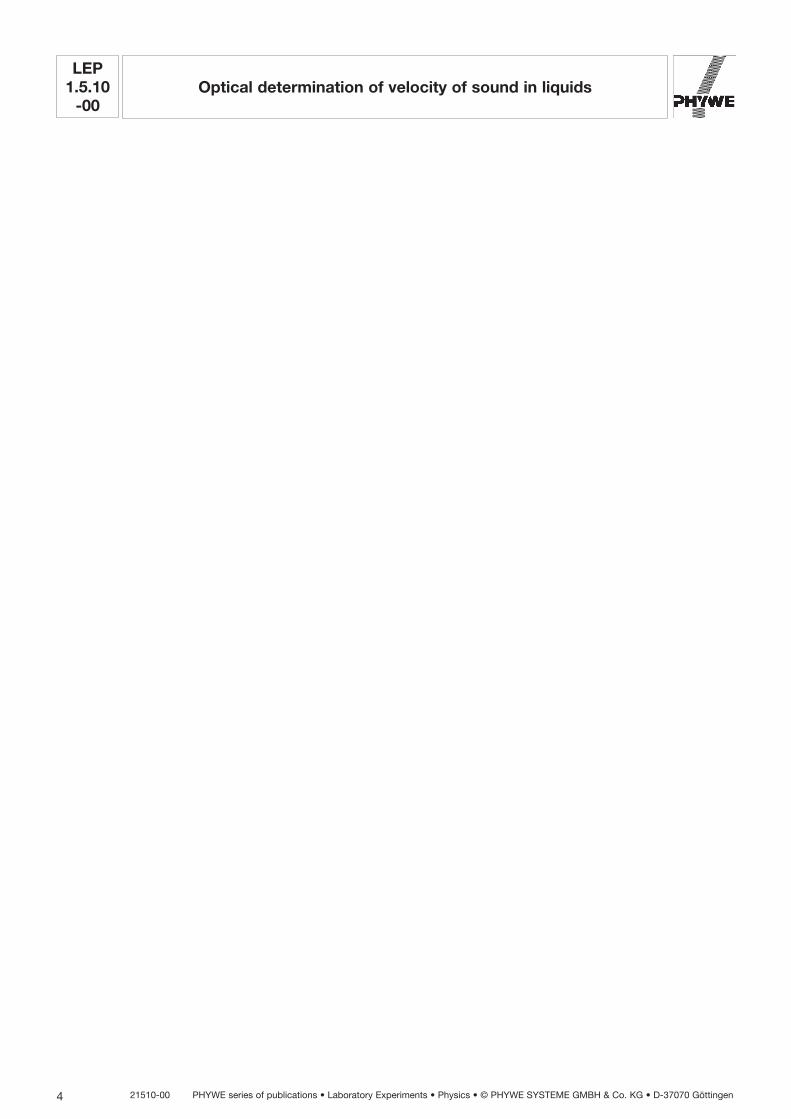
Fig. 4: Image of a screen.
LEP1.5.10
-00Optical determination of velocity of sound in liquids
PHYWE series of publications • Laboratory Experiments • Physics • © PHYWE SYSTEME GMBH & Co. KG • D-37070 Göttingen 21510-00 3
The standard error is caluclated in accordance with the law oferror propagation, the individual error values being estimatedas:
%s1 = 3 mm
%s2 = 3 mm
%d = 0.3 mm
%f = 5 kHz (see Operating Instructions for theUltrasonic Generator).
RemarkRelationship between temperature and sound velocity:
Liquid Source
Glycerol+ 20 1923 –1.8 *25 1904 –2.2 **
Ethanol 20 1180 –3.6 *25 1207 –4 **
Water (Dist). 25 1497 +2.5 *25 1498 +2.4 **
+ As glycerol is hygroscopic, smaller values are often foundfor a glycerol which has been allowed to stand.
Bibliography* L. Bergmann, Der Ultraschall
(Ultrasonics), Hirzel Verlag
** Handbook of Chemistry and Physics, The Chemical Rubber Co.
¢c¢q
m>s °C
cm>s
q
°C
LEP1.5.10
-00Optical determination of velocity of sound in liquids
21510-00 PHYWE series of publications • Laboratory Experiments • Physics • © PHYWE SYSTEME GMBH & Co. KG • D-37070 Göttingen4


![Sound the Trumpet - American Choral Directors Association · [Allegro Moderato] Purcell Sound 4 the Sound trum- pet, the 7 Sound the trum pet, sound, sound, sound the trum - tillpet](https://img.pdfslide.us/doc/110x75/5afa256f7f8b9ae92b8d54d8/sound-the-trumpet-american-choral-directors-association-allegro-moderato-purcell.jpg)