Embed Size (px)
Citation preview
Presented and adopted at the Board meeting on 28 February 2018.
Chairman: Peter Kjeldsen Hansen
LEO FoundationLautrupsgade 7, 5.
DK-2100 CopenhagenDenmark
CVR no: 11 62 33 36
LEO FoundationAnnual Report2017

A N N UA L R EP O R T 2 017 – L EO F O U N DAT I O N
3
Contents
About LEO Foundation . . . . . . . . . . . . . . . . . . . . . . . . . . . . . . . . . . . . . . . . . . . . . . . . . . . . . . . . . . . . . . . . . . . . . 4 Management review . . . . . . . . . . . . . . . . . . . . . . . . . . . . . . . . . . . . . . . . . . . . . . . . . . . . . . . . . . . . . . . . . . . . . . . . 6
LEO Pharma .......................................................................................................................9
Investment report ...........................................................................................................12
Grant activities ................................................................................................................14
Governance ......................................................................................................................20
Corporate social responsibility .......................................................................................24
Risk management ............................................................................................................25
Financial highlights . . . . . . . . . . . . . . . . . . . . . . . . . . . . . . . . . . . . . . . . . . . . . . . . . . . . . . . . . . . . . . . . . . . . . . . . 27 Consolidated Financial Statements . . . . . . . . . . . . . . . . . . . . . . . . . . . . . . . . . . . . . . . . . . . . . . . . . . . 29
Notes – Group ..................................................................................................................37
Financial Statements – Parent company . . . . . . . . . . . . . . . . . . . . . . . . . . . . . . . . . . . . . . . . . . . . . 71
Notes – Parent company .................................................................................................77
Management statement. . . . . . . . . . . . . . . . . . . . . . . . . . . . . . . . . . . . . . . . . . . . . . . . . . . . . . . . . . . . . . . . . . . 82 Independent auditor's report . . . . . . . . . . . . . . . . . . . . . . . . . . . . . . . . . . . . . . . . . . . . . . . . . . . . . . . . . . . 84 Foundation information . . . . . . . . . . . . . . . . . . . . . . . . . . . . . . . . . . . . . . . . . . . . . . . . . . . . . . . . . . . . . . . . . . 86
A N N UA L R EP O R T 2 017 – L EO F O U N DAT I O N
4
AboutLEO Foundation
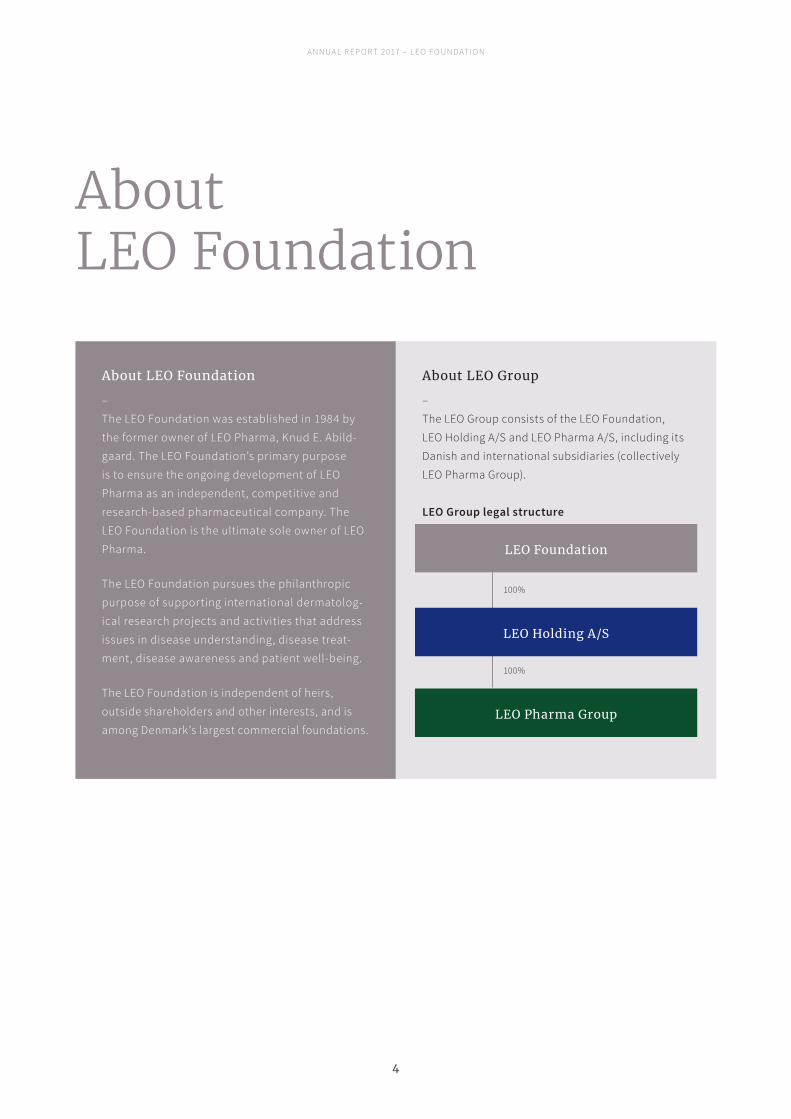
About LEO Foundation
– The LEO Foundation was established in 1984 by the former owner of LEO Pharma, Knud E. Abild-gaard. The LEO Foundation’s primary purpose is to ensure the ongoing development of LEO Pharma as an independent, competitive and research-based pharmaceutical company. The LEO Foundation is the ultimate sole owner of LEO Pharma.
The LEO Foundation pursues the philanthropic purpose of supporting international dermatolog-ical research projects and activities that address issues in disease understanding, disease treat-ment, disease awareness and patient well-being.
The LEO Foundation is independent of heirs, outside shareholders and other interests, and is among Denmark’s largest commercial foundations.
About LEO Group – The LEO Group consists of the LEO Foundation, LEO Holding A/S and LEO Pharma A/S, including its Danish and international subsidiaries (collectively LEO Pharma Group).
LEO Group legal structure
LEO Foundation
LEO Holding A/S
LEO Pharma Group
100%
100%
A N N UA L R EP O R T 2 017 – L EO F O U N DAT I O N
5
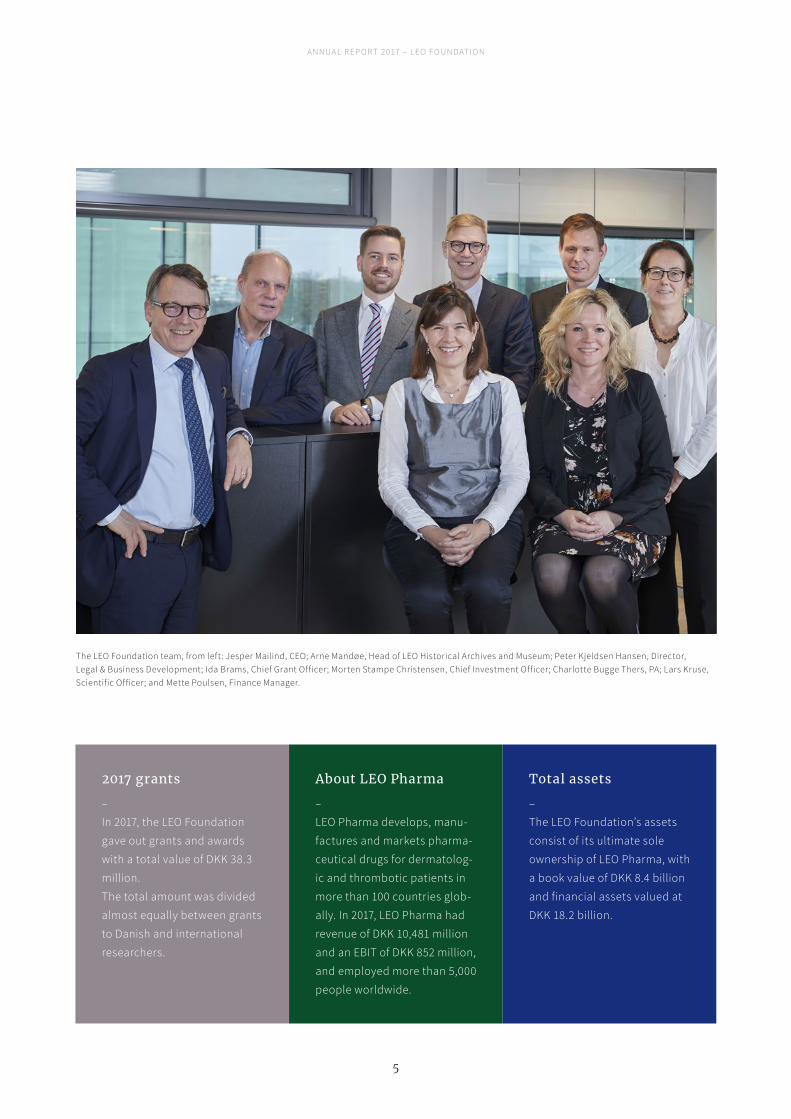
The LEO Foundation team, from left: Jesper Mailind, CEO; Arne Mandøe, Head of LEO Historical Archives and Museum; Peter Kjeldsen Hansen, Director, Legal & Business Development; Ida Brams, Chief Grant Officer; Morten Stampe Christensen, Chief Investment Officer; Charlotte Bugge Thers, PA; Lars Kruse, Scientific Officer; and Mette Poulsen, Finance Manager.
2017 grants
– In 2017, the LEO Foundation gave out grants and awards with a total value of DKK 38.3 million. The total amount was divided almost equally between grants to Danish and international researchers.
About LEO Pharma
– LEO Pharma develops, manu-factures and markets pharma-ceutical drugs for dermatolog-ic and thrombotic patients in more than 100 countries glob-ally. In 2017, LEO Pharma had revenue of DKK 10,481 million and an EBIT of DKK 852 million, and employed more than 5,000 people worldwide.
Total assets
– The LEO Foundation’s assets consist of its ultimate sole ownership of LEO Pharma, with a book value of DKK 8.4 billion and financial assets valued at DKK 18.2 billion.
A N N UA L R EP O R T 2 017 – L EO F O U N DAT I O N
6
Managementreview
2017 represented a significant milestone for the LEO Foun-dation. During the year, the Foundation took several steps to develop the LEO Group, including the LEO Foundation and LEO Pharma, in order to have a more modern govern-ance structure similar to that of other large Danish commer-cial foundations. As we enter 2018, the LEO Foundation is fully operational, with its own independent organisation, processes and systems.
The new structure and governance model enables the LEO Foundation to exert active ownership of LEO Pharma, man-age its financial assets and develop its grant activities to increase impact. A new organisation has been built to man-age the Foundation’s activities. Jesper Mailind assumed the position of CEO on 1 April 2017, and the organisation has since developed, with the addition of relevant competenc-es within investments, grants, finance, legal and business development. By year-end, the organisation had reached a level where it is fully capable of independently handling its future role.
Substantial efforts have been made to define the scope of the Foundation’s active ownership of LEO Pharma. A man-date has been issued to LEO Pharma’s Board of Directors, long-term performance targets for the company have been agreed and a new capital structure has been implement-ed in the LEO Group. All efforts have been made with the objective of ensuring LEO Pharma’s continued success as a research-based pharmaceutical company delivering inno-vative solutions to patients.
In 2017, two major structural changes were made to ensure a modern and future-proof corporate structure for the LEO Group.
The first and most significant change was the establish-ment of a wholly owned holding company, LEO Holding A/S,
which now holds all the shares in LEO Pharma. In connec-tion with this, the accumulated capital reserves in LEO Pharma amounting to DKK 17.2 billion were transferred to LEO Holding A/S, where all asset management activities will reside.
The second change was the consolidation of the LEO Pharma Research Foundation and the LEO Foundation. As a result, the LEO Foundation has taken over all the activ-ities previously carried out by the LEO Pharma Research Foundation.
At the Annual General Meeting in March 2017, the LEO Foundation Board of Trustees was strengthened with the election of Eivind Kolding and Peter Schwarz as new members. Eivind Kolding and Peter Schwarz bring strong competences and insight to the Board of Trustees within general management, finance, science and grants.
In terms of grants, 2017 represented a transitional year. Following a grant level in 2016 of DKK 85 million, the LEO Foundation Board of Trustees decided to temporarily lower the grant level in 2017 to allow for sufficient focus on implementing the new structure and governance model and building a new grant organisation, including relevant processes and systems.
A key event in 2017 was the inauguration on 15 June of the LEO Foundation Center for Cutaneous Drug Delivery (LFCCDD) at the University of Copenhagen, Denmark. The LFCCDD is a strategic initiative which the LEO Foundation hopes will develop into a global excellence centre enabling new discoveries with the potential to lead to better and more effective treatments for people living with skin diseas-es. The LEO Foundation’s 2017 grants and awards support-ed basic and translational dermatology research.
A N N UA L R EP O R T 2 017 – L EO F O U N DAT I O N
7
From left: Jesper Mailind, CEO, and Lars Olsen, Chairman of the Board of Trustees.
Towards the end of 2017, the LEO Foundation began updat-ing its strategies with the objective of outlining the future scope and activities of the Foundation. The strategies are prepared with the active involvement of members of the Board of Trustees. With a clear strategy, a strong organisa-tion and efficient processes in place, the LEO Foundation will be able to substantially increase its grant level and subsequent impact in the coming years.
Going forward, the LEO Foundation is fully dedicated to fulfilling its role as an active owner of LEO Pharma, generating attractive returns from its financial investments and promoting leading research projects within the dermatological field worldwide.

A N N UA L R EP O R T 2 017 – L EO F O U N DAT I O N
8
LEO PHARMA
LEO Pharma headquartersLEO Pharma develops, manufactures and markets pharmaceutical drugs for dermatologic and thrombotic patients in more than 100 countries globally. LEO Pharma has its own sales forces in 61 countries and employs more than 5,000 employees worldwide. The company is headquartered in Ballerup, Denmark.
A N N UA L R EP O R T 2 017 – L EO F O U N DAT I O N
9
Key events2017 was a significant year for LEO Pharma as revenue exceeded DKK 10 billion for the first time in LEO Pharma’s more than 100-year history.
In 2017, LEO Pharma took significant steps towards help-ing more people with biologic treatments. In May, phase 3 clinical studies were initiated for tralokinumab – a biologic compound under development for the treatment of moder-ate-to-severe atopic dermatitis. In September, the company launched Kyntheum® (brodalumab), a new biologic treat-ment for people with moderate-to-severe plaque psoriasis.
In March, LEO Pharma started construction of a new R&D hub in Shanghai, China, to increase its presence and ca-pabilities on the Chinese market. The company’s ambition is to be the preferred partner and leading dermatology company in China by 2020.
Furthermore, the company joined forces with Almirall by entering into a collaboration to advance science in derma-tology by setting a new standard for skin sampling. The aim is to develop and clinically validate a painless, minimally invasive skin sampling method.
RevenueLEO Pharma’s revenue in 2017 increased by DKK 618 million, or 8%, compared to 2016, to DKK 10,481 million in local cur-rencies. Of this growth, DKK 440 million related to the full-year effect of the new LEO portfolio acquired from Astellas in 2016. Adjusted for this, organic growth was 3%.
Revenue by regionRegion Europe+ grew by DKK 297 million, or 6% in local currencies to DKK 6,379 million. The full-year impact of the new LEO portfolio acquired from Astellas contributed DKK 194 million. Excluding this effect, Region Europe+ grew by 4% in local currencies in 2017.
Region US grew by DKK 132 million, or 13% in local currencies to DKK 1,357 million. The topical psoriasis market in the US is dominated by generic solutions due to the continued focus on higher rebates combined with increased patient payment.
Region International grew by DKK 189 million, or 8% in local currencies to DKK 2,745 million. Excluding the full-year im-pact of the new LEO portfolio acquired from Astellas, sales grew by 2%. The new LEO portfolio grew by 6%, driven by LAMEA and Asia, particularly China.
Operating profitOperating profit before depreciation and amortisation increased from DKK 1,343 million to DKK 2,005 million. Op-erating profit rose from DKK 338 million to DKK 852 million in 2017 – an increase of more than 100%.
The increase in operating profit was predominantly driven by realised cost savings from the efficiency projects launched in 2016, and the total impact of these projects was DKK 325 million in 2017. The efficiency projects will continue, and an additional impact is expected in 2018 from optimised processes, IT infrastructure and product portfolio.
In December, LEO Pharma announced its decision to discontinue its ingenol disoxate pipeline project. Ingenol disoxate was intended to be produced at LEO Pharma's production site at Southport, Australia, and the site will be shut down during 2018. A write-down of DKK 170 million was made in December 2017 for impairment of assets and to cover expected shutdown costs.
Research and development costs increased from DKK 1,290 million to DKK 1,602 million. The plan is to gradually increase R&D investments towards 2025. In 2017, LEO Pharma sucess-fully progressed its pipeline within biologic and systemic treatments. This led to increased investments in the R&D portfolio, such as the development of Kyntheum® (brodalum-ab) and the initiation of phase 3 studies for tralokinumab.
LEO Pharma
A N N UA L R EP O R T 2 017 – L EO F O U N DAT I O N
10
Shaping dermatologyAll over the world, skin diseases are a burden for individ-uals, families and societies. A strong focus on addressing high unmet needs lies at the heart of LEO Pharma’s corpo-rate strategy.
Dermatology is changing due to scientific progress and the application of new technologies such as immunologic approaches. LEO Pharma is determined to play a key part in driving this development and is recognised for having made significant and bold advances in dermatology.
A strong and expanding pipeline In 2017, LEO Pharma successfully progressed its pipeline within biologic and systemic treatments. The pipeline represents a strong mix of projects aimed at topical, oral and injectable treatments. The clinical stage part of LEO Pharma's pipeline includes tralokinumab, an IL-13 antibody for the systemic treatment of atopic dermatitis (phase 3a), and Kyntheum® (brodalumab), an IL-17R antibody for the systemic treatment of moderate-to-severe psoriasis (launched in Europe in 2017).
The pipeline also includes a novel JAK (Janus kinase) inhibitor (phase 2b) and a SEGRA (selective glucocorticoid receptor antagonist) molecule (explorative clinical testing), both candidates for the non-steroidal topical treatment of inflammatory skin conditions. Finally, the pipeline includes an orally bioavailable PDE4 (phosphodiesterase 4) inhibitor for psoriasis (phase 2b) and an injectable anti-IL-22R anti-body for the systemic treatment of severe eczema (phase 1).
Furthermore, LEO Pharma has taken its first steps towards developing new medicines for rare skin diseases to help the many people whose treatment needs are currently unmet.
Innovation ecosystemIn 2017, LEO Pharma continued its efforts to pursue inno-vation for healthy skin through its own R&D capabilities, its global partnerships, the LEO Science & Tech Hub, LEO Inno-vation Lab and the LEO Pharma Open Innovation platform.With the LEO Science & Tech Hub in Boston, US, LEO Phar-ma has key people precisely where some of the most signif-icant innovation is taking place, and in 2017 this led to new collaborations and partnerships with several innovative start-up companies and leading US academic institutions.
Through the company’s LEO Innovation Lab, digital technol-ogies are successfully being explored and implemented to optimise the interaction between patients and physicians, improve patients’ individual awareness and treatment, and provide new data and insights.
Via the LEO Pharma Open Innovation platform, any external partner can have their compound tested – confidential-ly and for free – for its potential to treat dermatological diseases. A key principle of LEO Pharma’s Open Innovation initiative is trust between the parties.
OutlookIn 2018, growth at LEO Pharma is expected to come primar-ily from the continued launches of Enstilar® and Kyntheum® as well as Daivobet® in Japan, leading to annual revenue in the DKK 10-10.5 billion range. The financial result will be challenged by continued pressure for price reductions in the US and the risk of increased generic competition for Daivobet® Ointment and Protopic® in Europe.
LEO Pharma will significantly increase its spending on research and development, including spending related to the phase 3 studies with tralokinumab. Combined with modest growth in sales, LEO Pharma expects this to lead to an operating profit around break-even.
LEO Pharma’s 2025 strategy focuses on addressing high unmet needs with the aim of helping 125 million people in 2025. To achieve this goal, the company plans to make further acquisitions and invest significantly in innovation within new biologic, systemic and topical treatments.
Elements of uncertaintyFinancial expectations are subject to uncertainties and assumptions. This may cause actual results to differ from expectations. The factors that may affect future results include delayed or unsuccessful development projects, market-driven price reductions for products, exposure to product liability and other lawsuits, and changes in reim-bursement rules and legislation.
For further information about the LEO Pharma Group, please refer to LEO Pharma’s Annual Report.

A N N UA L R EP O R T 2 017 – L EO F O U N DAT I O N
11
Imagine is a mobile app to track and analyse skin condition over time using advanced image analysis.
Imagine is one of the products developed by LEO Innovation Lab, which looks at every aspect of everyday life and develops digital solutions that can help people living with skin conditions.
Read more here: https://getimagine.io/
A N N UA L R EP O R T 2 017 – L EO F O U N DAT I O N
12
Investment report
2017 proved – like 2016 – to be a good year for global financial assets, with synchronised global growth providing support for risky assets. Furthermore, an accommodative monetary policy from the European Central Bank and only three interest rate increases from the US Federal Reserve not only kept longer-term yields fairly unchanged but also made investors continue their search for yield, thereby compressing credit spreads even further.
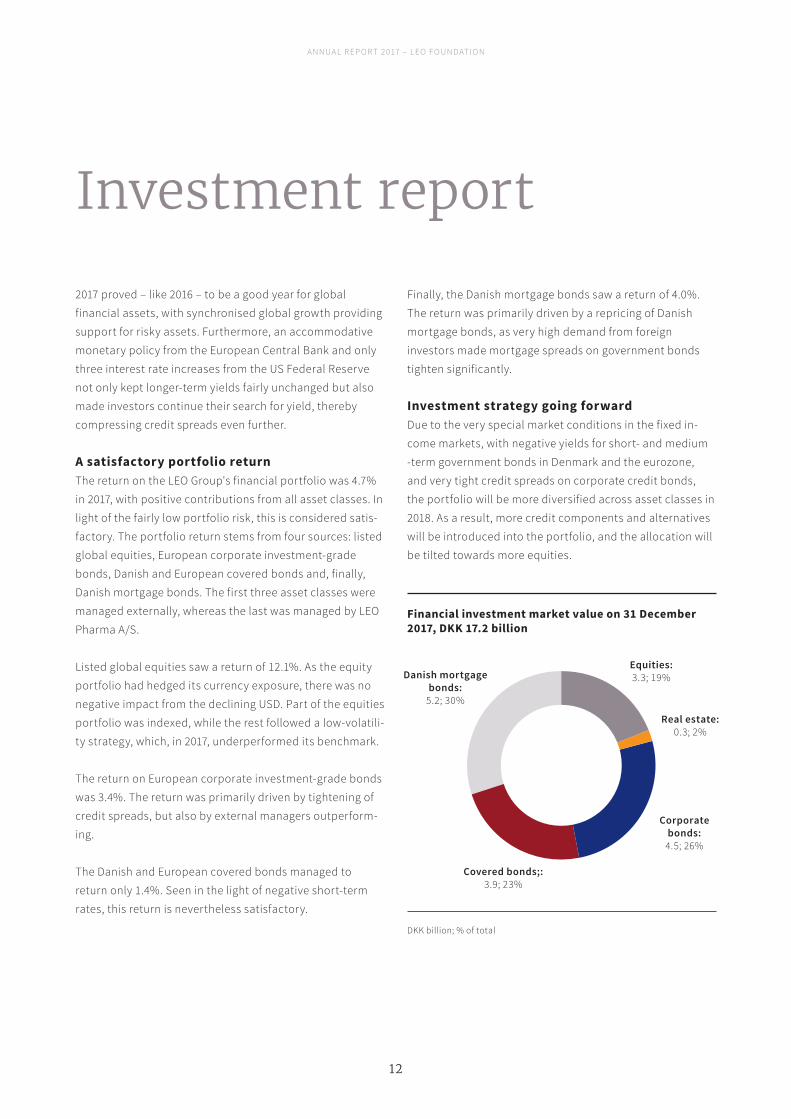
A satisfactory portfolio returnThe return on the LEO Group's financial portfolio was 4.7% in 2017, with positive contributions from all asset classes. In light of the fairly low portfolio risk, this is considered satis-factory. The portfolio return stems from four sources: listed global equities, European corporate investment-grade bonds, Danish and European covered bonds and, finally, Danish mortgage bonds. The first three asset classes were managed externally, whereas the last was managed by LEO Pharma A/S.
Listed global equities saw a return of 12.1%. As the equity portfolio had hedged its currency exposure, there was no negative impact from the declining USD. Part of the equities portfolio was indexed, while the rest followed a low-volatili-ty strategy, which, in 2017, underperformed its benchmark.
The return on European corporate investment-grade bonds was 3.4%. The return was primarily driven by tightening of credit spreads, but also by external managers outperform-ing.
The Danish and European covered bonds managed to return only 1.4%. Seen in the light of negative short-term rates, this return is nevertheless satisfactory.
Finally, the Danish mortgage bonds saw a return of 4.0%. The return was primarily driven by a repricing of Danish mortgage bonds, as very high demand from foreign investors made mortgage spreads on government bonds tighten significantly.
Investment strategy going forwardDue to the very special market conditions in the fixed in-come markets, with negative yields for short- and medium -term government bonds in Denmark and the eurozone, and very tight credit spreads on corporate credit bonds, the portfolio will be more diversified across asset classes in 2018. As a result, more credit components and alternatives will be introduced into the portfolio, and the allocation will be tilted towards more equities.
Danish mortgage bonds:
5.2; 30%
Equities:3.3; 19%
Real estate:0.3; 2%
Corporatebonds:
4.5; 26%
Covered bonds;:3.9; 23%
Financial investment market value on 31 December 2017, DKK 17.2 billion
DKK billion; % of total

A N N UA L R EP O R T 2 017 – L EO F O U N DAT I O N
13
GRANT ACTIVITIES 2017
A N N UA L R EP O R T 2 017 – L EO F O U N DAT I O N
14
Grant activities
Grants and awards2017 represented a transitional year for the LEO Foundation in terms of grants and awards. The Board of Trustees de-cided on a grant level of DKK 40 million, which was signif-icantly lower than the total grant sum of DKK 85 million in 2016. This decision was taken to allow sufficient focus on implementing the new structure and building the organisa-tion, including relevant processes and systems.
3,000 different skin diseasesAt any point in time, an estimated one in four people world-wide are living with a skin disease, making skin diseases some of the most prevalent diseases. There are approxi-mately 3,000 different skin diseases – all of which carry a psychosocial burden and most of which have associated comorbidities. Yet skin diseases continue to receive little attention in global health and, as a result, the burden of disease remains high.
By supporting the best research projects and activities within dermatology on a global scale, the LEO Foundation aims to make an impact that will ultimately mean signifi-cantly improved quality of life for those living with a skin disease.
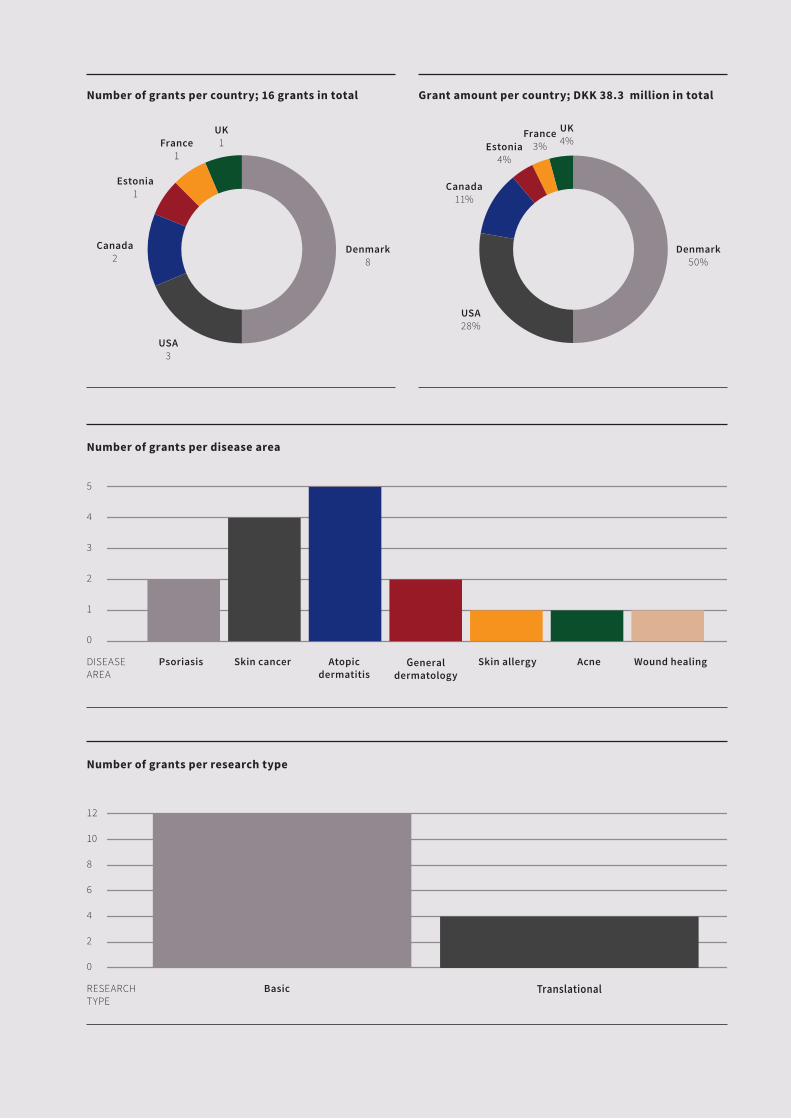
16 research projects supported in 2017A total of 16 research projects were supported in 2017, of which 8 were in Denmark. Approximately half of the total grant sum was awarded to the Danish projects, while the remainder was given to international projects. Most of the 2017 projects were focused on atopic dermatitis and skin cancer, and were basic research projects.
Two projects that received LEO Foundation grants in 2017 are highlighted here, and more details about all 16 projects can be found on www.leo-foundation.org.
Malignant melanoma has the highest mortality rate among skin cancers, and developing new therapeutic targets is extremely important. Professor Francesco Cecconi from
the Danish Cancer Society Research Center received DKK 3.8 million to further investigate the AMBRA1 gene in mela-noma as one possible route towards using the body’s own defence against diseases such as cancer.
Professor Cecconi was the first to identify the AMBRA1 gene and has been unravelling its multiple functions for the past 10 years. He has already demonstrated that AMBRA1 plays a role as a tumour suppressor in vivo, and preliminary data indicate the gene’s potential role as a therapeutic target in cancer. Intriguingly, most AMBRA1 gene mutations were found in melanoma patients.
Furthermore, psoriasis research was granted support, with DKK 3 million being given to a team of researchers in Boston, US, led by Associate Professor Markus Frank from Harvard Medical School, Boston Children’s Hospital, and Assistant Professor Christine G. Lian and Professor George F. Murphy, both from Harvard Medical School, Brigham and Women’s Hospital. Their work represents a new, targeted therapeutic approach designed to cure psoriasis, since, despite decades of research, the root cause of psoriasis re-mains unknown and targeted approaches to cure psoriasis have been elusive.
The team in Boston has proposed a novel hypothesis that psoriasis is driven by immune-mediated dysregulation of stem cells within the epidermal and dermal compartments. In this project, the team will test their hypothesis with a highly focused goal of defining the primary event(s) in lesion formation.
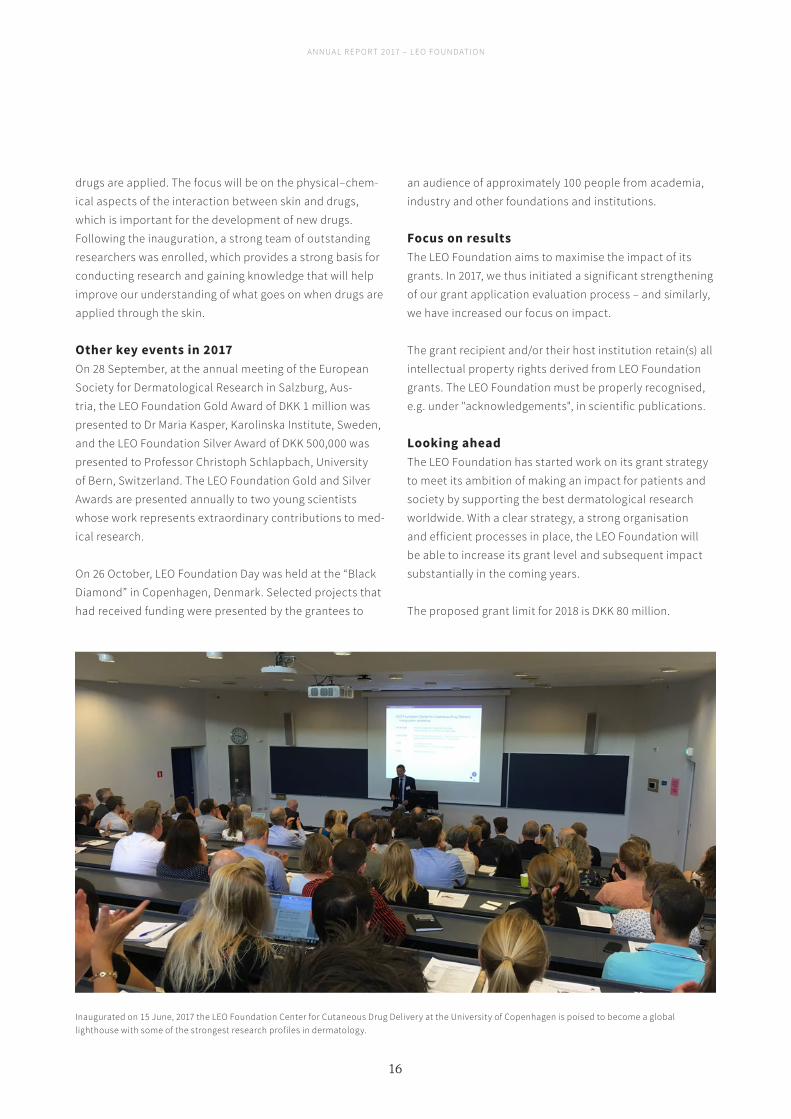
LEO Foundation Center for Cutaneous Drug DeliveryOn 15 June 2017, the inauguration of the LEO Foundation Center for Cutaneous Drug Delivery (LFCCDD) at the Univer-sity of Copenhagen was celebrated, following a strategic grant of DKK 40 million over 10 years awarded in 2016. Headed by Professor Martin Malmsten, the centre will con-duct research into what happens in and on the skin when
A N N UA L R EP O R T 2 017 – L EO F O U N DAT I O N
15
MANAGEMENT’S REVIEW
UK1
UK4%France
1
France3%
Estonia1
Estonia4%
Canada2
Canada11%
Denmark8
Denmark50%
USA3
USA28%
Number of grants per country; 16 grants in total Grant amount per country; DKK 38.3 million in total
PsoriasisDISEASE AREA
RESEARCH TYPE
5
4
0
1
2
3
Skin cancer Atopic dermatitis
General dermatology
Skin allergy Acne Wound healing
Number of grants per disease area
12
10
0
4
2
6
8
Basic Translational
Number of grants per research type
A N N UA L R EP O R T 2 017 – L EO F O U N DAT I O N
16
drugs are applied. The focus will be on the physical–chem-ical aspects of the interaction between skin and drugs, which is important for the development of new drugs. Following the inauguration, a strong team of outstanding researchers was enrolled, which provides a strong basis for conducting research and gaining knowledge that will help improve our understanding of what goes on when drugs are applied through the skin.
Other key events in 2017On 28 September, at the annual meeting of the European Society for Dermatological Research in Salzburg, Aus-tria, the LEO Foundation Gold Award of DKK 1 million was presented to Dr Maria Kasper, Karolinska Institute, Sweden, and the LEO Foundation Silver Award of DKK 500,000 was presented to Professor Christoph Schlapbach, University of Bern, Switzerland. The LEO Foundation Gold and Silver Awards are presented annually to two young scientists whose work represents extraordinary contributions to med-ical research.
On 26 October, LEO Foundation Day was held at the “Black Diamond” in Copenhagen, Denmark. Selected projects that had received funding were presented by the grantees to
an audience of approximately 100 people from academia, industry and other foundations and institutions.
Focus on resultsThe LEO Foundation aims to maximise the impact of its grants. In 2017, we thus initiated a significant strengthening of our grant application evaluation process – and similarly, we have increased our focus on impact.
The grant recipient and/or their host institution retain(s) all intellectual property rights derived from LEO Foundation grants. The LEO Foundation must be properly recognised, e.g. under "acknowledgements", in scientific publications.
Looking ahead The LEO Foundation has started work on its grant strategy to meet its ambition of making an impact for patients and society by supporting the best dermatological research worldwide. With a clear strategy, a strong organisation and efficient processes in place, the LEO Foundation will be able to increase its grant level and subsequent impact substantially in the coming years.
The proposed grant limit for 2018 is DKK 80 million.
Inaugurated on 15 June, 2017 the LEO Foundation Center for Cutaneous Drug Delivery at the University of Copenhagen is poised to become a global lighthouse with some of the strongest research profiles in dermatology.

A N N UA L R EP O R T 2 017 – L EO F O U N DAT I O N
17
“I believe that the centre has the potential to be a creative space dedicated to innovative research methods and new analytical technologies. And that it will be able to generate knowledge that can and will benefit patients as well as society in general.”
– Lars Olsen, Chairman of the LEO Foundation.
A N N UA L R EP O R T 2 017 – L EO F O U N DAT I O N
18
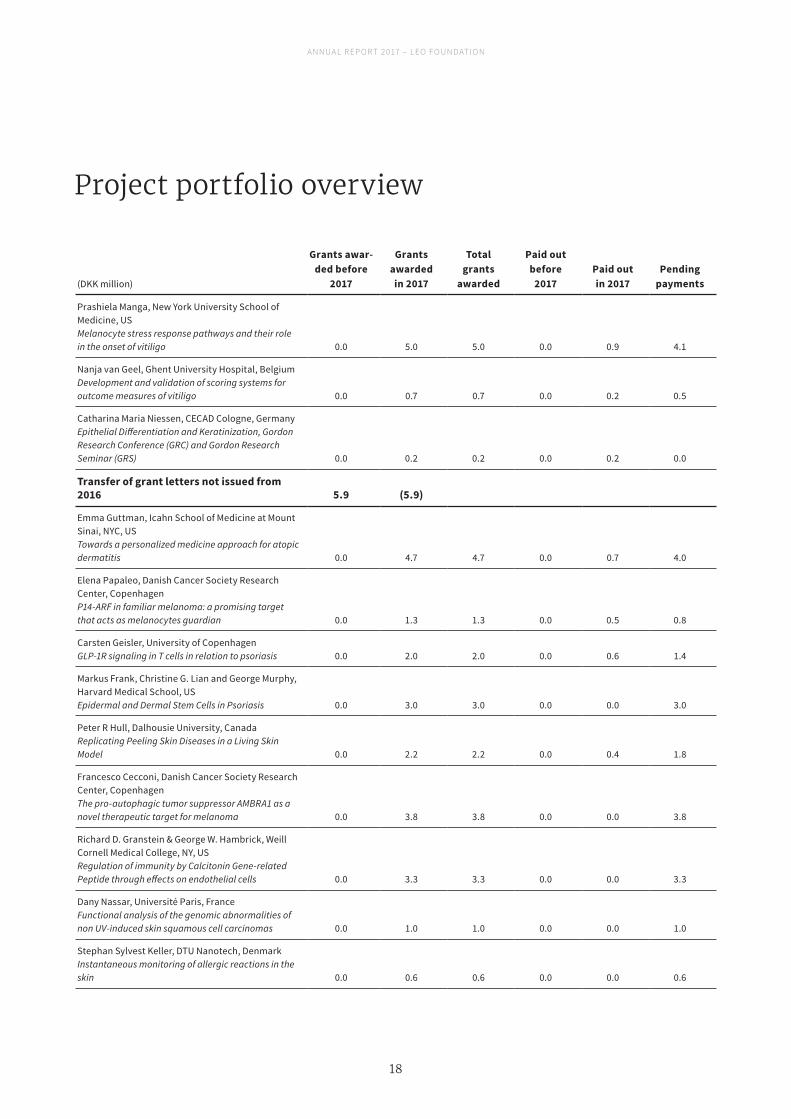
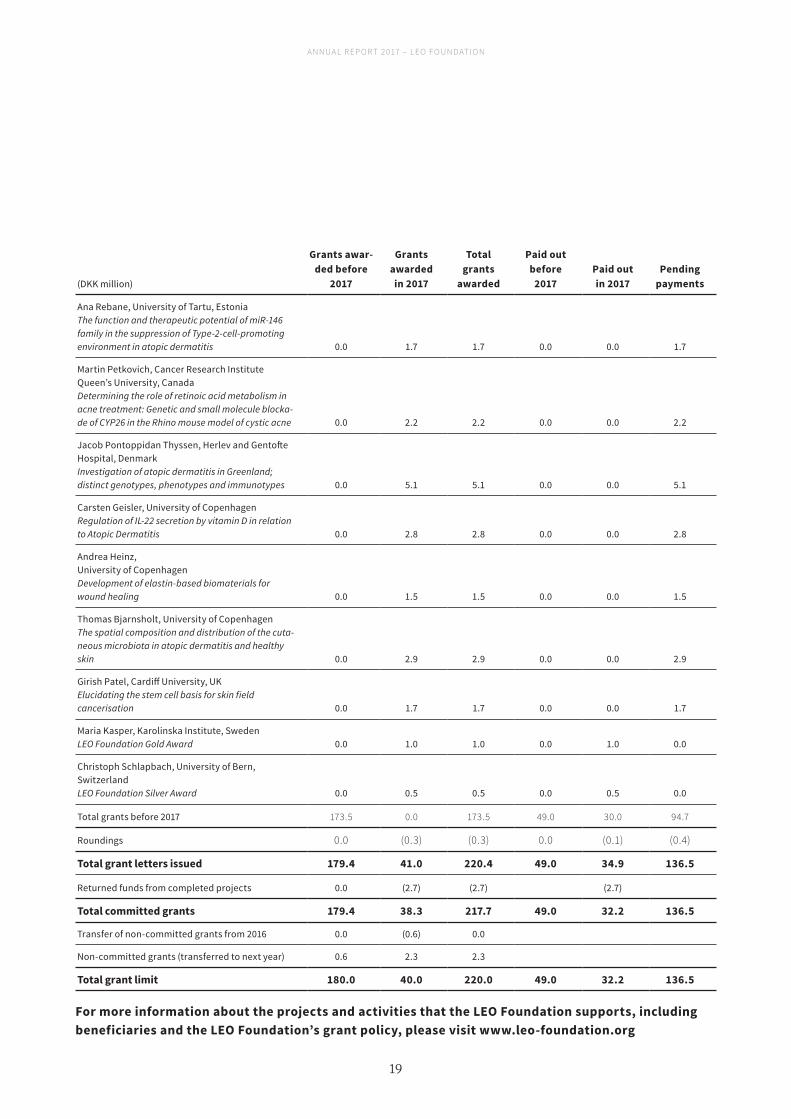
Project portfolio overview
(DKK million)
Grants awar-ded before
2017
Grants awarded in 2017
Total grants
awarded
Paid out before
2017Paid out in 2017
Pending payments
Prashiela Manga, New York University School of Medicine, USMelanocyte stress response pathways and their role in the onset of vitiligo 0.0 5.0 5.0 0.0 0.9 4.1
Nanja van Geel, Ghent University Hospital, BelgiumDevelopment and validation of scoring systems for outcome measures of vitiligo 0.0 0.7 0.7 0.0 0.2 0.5
Catharina Maria Niessen, CECAD Cologne, GermanyEpithelial Differentiation and Keratinization, Gordon Research Conference (GRC) and Gordon Research Seminar (GRS) 0.0 0.2 0.2 0.0 0.2 0.0
Transfer of grant letters not issued from 2016 5.9 (5.9)
Emma Guttman, Icahn School of Medicine at Mount Sinai, NYC, USTowards a personalized medicine approach for atopic dermatitis 0.0 4.7 4.7 0.0 0.7 4.0
Elena Papaleo, Danish Cancer Society Research Center, CopenhagenP14-ARF in familiar melanoma: a promising target that acts as melanocytes guardian 0.0 1.3 1.3 0.0 0.5 0.8
Carsten Geisler, University of CopenhagenGLP-1R signaling in T cells in relation to psoriasis 0.0 2.0 2.0 0.0 0.6 1.4
Markus Frank, Christine G. Lian and George Murphy, Harvard Medical School, USEpidermal and Dermal Stem Cells in Psoriasis 0.0 3.0 3.0 0.0 0.0 3.0
Peter R Hull, Dalhousie University, CanadaReplicating Peeling Skin Diseases in a Living Skin Model 0.0 2.2 2.2 0.0 0.4 1.8
Francesco Cecconi, Danish Cancer Society Research Center, CopenhagenThe pro-autophagic tumor suppressor AMBRA1 as a novel therapeutic target for melanoma 0.0 3.8 3.8 0.0 0.0 3.8
Richard D. Granstein & George W. Hambrick, Weill Cornell Medical College, NY, USRegulation of immunity by Calcitonin Gene-related Peptide through effects on endothelial cells 0.0 3.3 3.3 0.0 0.0 3.3
Dany Nassar, Université Paris, FranceFunctional analysis of the genomic abnormalities of non UV-induced skin squamous cell carcinomas 0.0 1.0 1.0 0.0 0.0 1.0
Stephan Sylvest Keller, DTU Nanotech, DenmarkInstantaneous monitoring of allergic reactions in the skin 0.0 0.6 0.6 0.0 0.0 0.6
A N N UA L R EP O R T 2 017 – L EO F O U N DAT I O N
19
(DKK million)
Grants awar-ded before
2017
Grants awarded in 2017
Total grants
awarded
Paid out before
2017Paid out in 2017
Pending payments
Ana Rebane, University of Tartu, Estonia The function and therapeutic potential of miR-146 family in the suppression of Type-2-cell-promoting environment in atopic dermatitis 0.0 1.7 1.7 0.0 0.0 1.7
Martin Petkovich, Cancer Research Institute Queen’s University, CanadaDetermining the role of retinoic acid metabolism in acne treatment: Genetic and small molecule blocka-de of CYP26 in the Rhino mouse model of cystic acne 0.0 2.2 2.2 0.0 0.0 2.2
Jacob Pontoppidan Thyssen, Herlev and Gentofte Hospital, DenmarkInvestigation of atopic dermatitis in Greenland; distinct genotypes, phenotypes and immunotypes 0.0 5.1 5.1 0.0 0.0 5.1
Carsten Geisler, University of Copenhagen Regulation of IL-22 secretion by vitamin D in relation to Atopic Dermatitis 0.0 2.8 2.8 0.0 0.0 2.8
Andrea Heinz, University of Copenhagen Development of elastin-based biomaterials for wound healing 0.0 1.5 1.5 0.0 0.0 1.5
Thomas Bjarnsholt, University of Copenhagen The spatial composition and distribution of the cuta-neous microbiota in atopic dermatitis and healthy skin 0.0 2.9 2.9 0.0 0.0 2.9
Girish Patel, Cardiff University, UKElucidating the stem cell basis for skin field cancerisation 0.0 1.7 1.7 0.0 0.0 1.7
Maria Kasper, Karolinska Institute, SwedenLEO Foundation Gold Award 0.0 1.0 1.0 0.0 1.0 0.0
Christoph Schlapbach, University of Bern, SwitzerlandLEO Foundation Silver Award 0.0 0.5 0.5 0.0 0.5 0.0
Total grants before 2017 173.5 0.0 173.5 49.0 30.0 94.7
Roundings 0.0 (0.3) (0.3) 0.0 (0.1) (0.4)
Total grant letters issued 179.4 41.0 220.4 49.0 34.9 136.5
Returned funds from completed projects 0.0 (2.7) (2.7) (2.7)
Total committed grants 179.4 38.3 217.7 49.0 32.2 136.5
Transfer of non-committed grants from 2016 0.0 (0.6) 0.0
Non-committed grants (transferred to next year) 0.6 2.3 2.3
Total grant limit 180.0 40.0 220.0 49.0 32.2 136.5
For more information about the projects and activities that the LEO Foundation supports, including beneficiaries and the LEO Foundation’s grant policy, please visit www.leo-foundation.org
A N N UA L R EP O R T 2 017 – L EO F O U N DAT I O N
20
Governance
As the ultimate sole owner of LEO Pharma and as a large Danish commercial foundation with increasing philanthro pic activities in the form of grants and awards, the LEO Foundation has considerable societal influence in Den-mark and beyond. Thus, we have an important obligation to operate transparently and with integrity, and we fully support and comply with all the recommendations of the Danish Committee on Foundation Governance. For further information, please visitwww.leo-foundation.org/governancerecommendations.
The members of the Board of Trustees of the LEO Founda-tion also make up the Board of Directors of LEO Holding A/S. Both Boards meet at least four times a year and, in addition, hold an annual seminar to discuss and review strategies.
Two permanent Board committees have been set up: a Grant Committee (as part of LEO Foundation) and an Invest-ment Committee (as part of LEO Holding A/S). Both meet at regular intervals. In addition, ad hoc committees are estab-lished when deemed relevant, to handle specific matters.
The LEO Foundation Board of Trustees consists of 10 mem-bers. Seven members are appointed in accordance with the Foundation’s charter, while three members are elected by LEO Pharma employees. The composition of the Board reflects the qualifications and skills necessary for the LEO Foundation to fulfil the objectives specified in its charter. In 2017, Eivind Kolding and Peter Schwarz were appointed as new members, contributing solid skills and experience within general management, finance, science and grants to the Board of Trustees.
Statutory Report on Gender DiversityThe Board strives to ensure that, by 2020, at least 40% of charter-appointed members are female and, similarly, that at least 40% of its members appointed according to the charter are male. At the end of 2017, 30% of the charter-appointed members were women.
In 2015, LEO Pharma set the goal to have at least two female members on its Board of Directors (in addition to the em-ployee-elected mem bers) by 2019. With the appointment of one additional female board member in 2017, this goal was achieved. A new goal will be set by the company at the begin-ning of 2018. On average, both genders are equally represent-ed (by at least 40%) at management levels below the Board of Directors of LEO Pharma A/S.
Active ownership of LEO PharmaThe LEO Foundation’s primary objective is to ensure the long-term success of LEO Pharma. We exert our ownership actively by electing highly qualified professionals to the LEO Pharma Board of Directors and by: • Issuing a mandate to LEO Pharma’s Board of Directors
specifying the fundamental values, frame and scope of the company
• Approving the long-term performance targets and capital structure of the company
• Endorsing the strategy proposed by LEO Pharma’s Board of Directors.
LEO Pharma issues a quarterly report on the progress and performance of the business, followed by status meetings. In addition, an annual “Capital Market Day” is held, during which the strategic progress is reviewed and discussed. LEO Holding A/S holds two ordinary seats on the company’s Board of Directors.
Grant Committee and grant workOur grant activities aim to support the best international dermatological research. The Grant Committee supervises the grant activities and advises the Board of Trustees on grant-related matters, including strategies and policies.
A Scientific Evaluation Committee with external members has been set up to assist the Grant Committee in evaluat-ing all research grant applications. The applications are assessed in a consistent manner based on the scientific quality of the project, the qualifications of the applicant and the academic standard of the host institution. The
A N N UA L R EP O R T 2 017 – L EO F O U N DAT I O N
21
final decisions to award grants are made by the Board of Trustees.
Investment CommitteeThe Investment Committee advises the Board on matters relating to investments and asset management. It prepares
and recommends investment strategies and policies to the Board, and ensures their implementation in cooperation with the Executive Management. The Committee also mon-itors and reviews relevant internal controls, risk manage-ment and governance models.
A N N UA L R EP O R T 2 017 – L EO F O U N DAT I O N
22
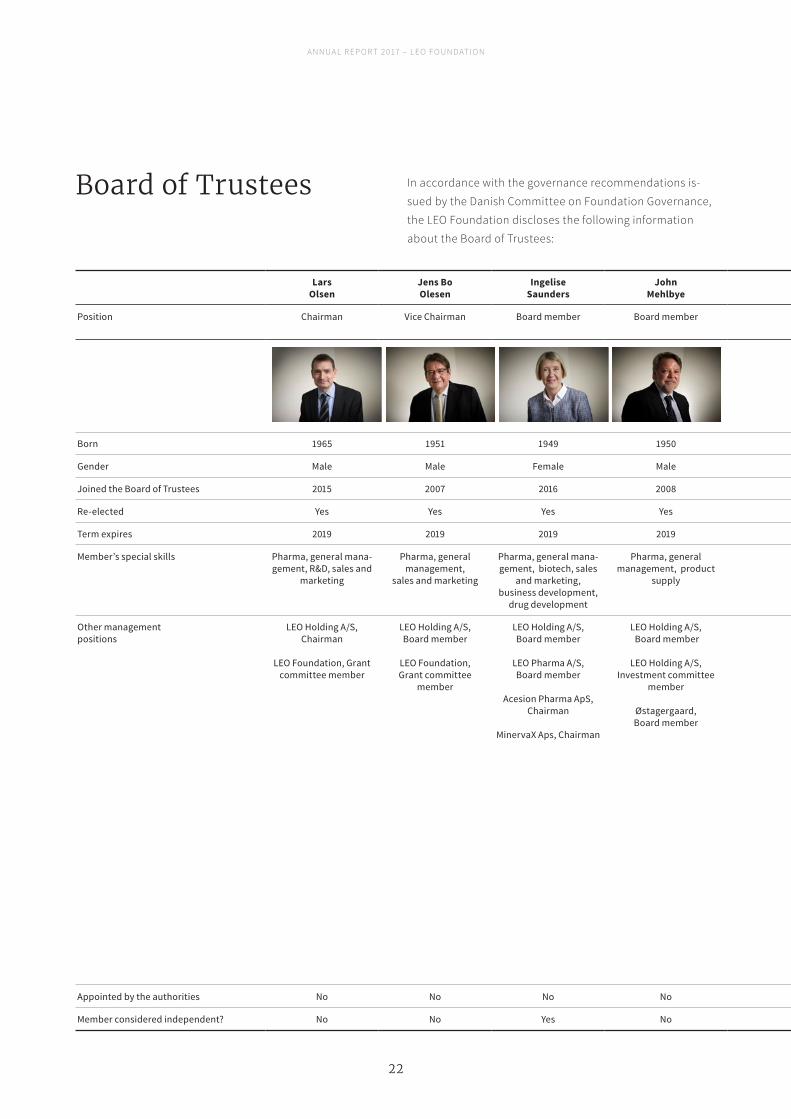
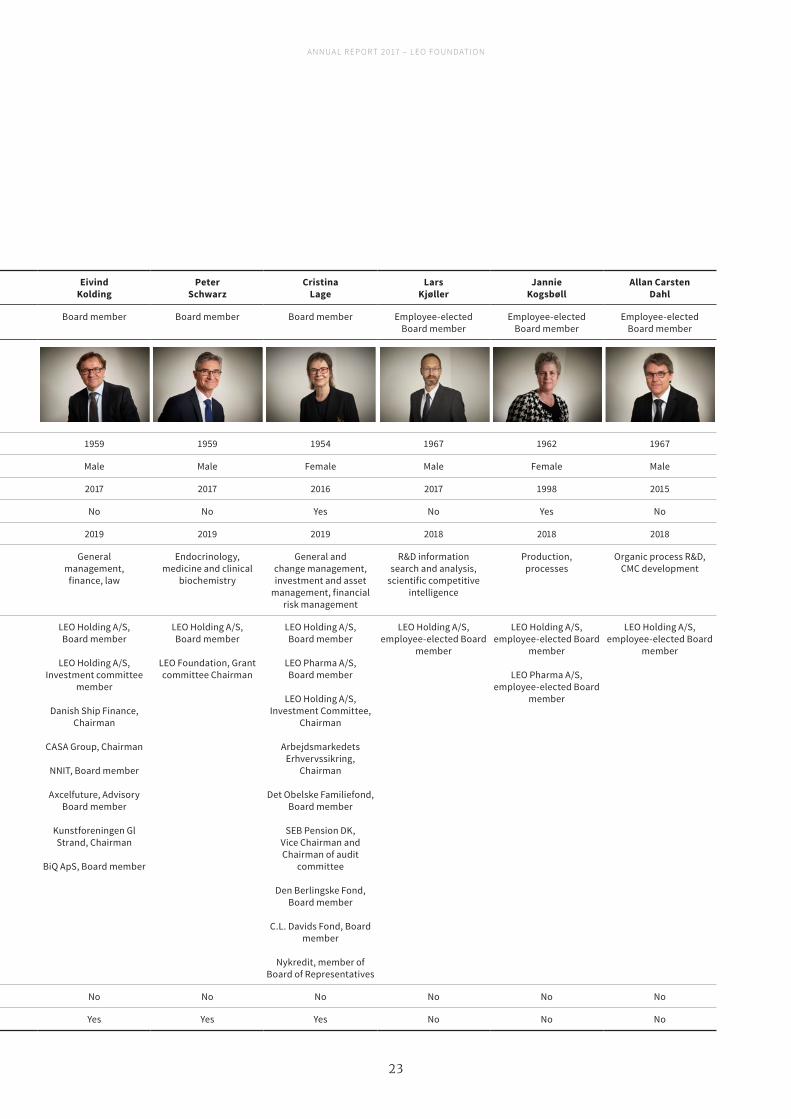
Board of Trustees In accordance with the governance recommendations is-sued by the Danish Committee on Foundation Governance, the LEO Foundation discloses the following information about the Board of Trustees:
Lars Olsen
Jens Bo Olesen
Ingelise Saunders
John Mehlbye
Eivind Kolding
PeterSchwarz
Cristina Lage
Lars Kjøller
Jannie Kogsbøll
Allan Carsten Dahl
Position Chairman Vice Chairman Board member Board member Board member Board member Board member Employee-elected Board member
Employee-elected Board member
Employee-elected Board member
Born 1965 1951 1949 1950 1959 1959 1954 1967 1962 1967
Gender Male Male Female Male Male Male Female Male Female Male
Joined the Board of Trustees 2015 2007 2016 2008 2017 2017 2016 2017 1998 2015
Re-elected Yes Yes Yes Yes No No Yes No Yes No
Term expires 2019 2019 2019 2019 2019 2019 2019 2018 2018 2018
Member’s special skills Pharma, general mana-gement, R&D, sales and
marketing
Pharma, general management,
sales and marketing
Pharma, general mana-gement, biotech, sales
and marketing, business development,
drug development
Pharma, general management, product
supply
General management,
finance, law
Endocrinology,medicine and clinical
biochemistry
General and change management, investment and asset
management, financial risk management
R&D informationsearch and analysis,
scientific competitiveintelligence
Production, processes
Organic process R&D, CMC development
Other management positions
LEO Holding A/S, Chairman
LEO Foundation, Grantcommittee member
LEO Holding A/S, Board member
LEO Foundation,Grant committee
member
LEO Holding A/S,Board member
LEO Pharma A/S,Board member
Acesion Pharma ApS, Chairman
MinervaX Aps, Chairman
LEO Holding A/S, Board member
LEO Holding A/S,Investment committee
member
Østagergaard, Board member
LEO Holding A/S,Board member
LEO Holding A/S, Investment committee
member
Danish Ship Finance, Chairman
CASA Group, Chairman
NNIT, Board member
Axcelfuture, Advisory Board member
Kunstforeningen Gl Strand, Chairman
BiQ ApS, Board member
LEO Holding A/S, Board member
LEO Foundation, Grant committee Chairman
LEO Holding A/S,Board member
LEO Pharma A/S,Board member
LEO Holding A/S, Investment Committee,
Chairman
Arbejdsmarkedets Erhvervssikring,
Chairman
Det Obelske Familiefond, Board member
SEB Pension DK, Vice Chairman and Chairman of audit
committee
Den Berlingske Fond, Board member
C.L. Davids Fond, Board member
Nykredit, member of Board of Representatives
LEO Holding A/S,employee-elected Board
member
LEO Holding A/S, employee-elected Board
member
LEO Pharma A/S, employee-elected Board
member
LEO Holding A/S,employee-elected Board
member
Appointed by the authorities No No No No No No No No No No
Member considered independent? No No Yes No Yes Yes Yes No No No
A N N UA L R EP O R T 2 017 – L EO F O U N DAT I O N
23
Lars Olsen
Jens Bo Olesen
Ingelise Saunders
John Mehlbye
Eivind Kolding
PeterSchwarz
Cristina Lage
Lars Kjøller
Jannie Kogsbøll
Allan Carsten Dahl
Position Chairman Vice Chairman Board member Board member Board member Board member Board member Employee-elected Board member
Employee-elected Board member
Employee-elected Board member
Born 1965 1951 1949 1950 1959 1959 1954 1967 1962 1967
Gender Male Male Female Male Male Male Female Male Female Male
Joined the Board of Trustees 2015 2007 2016 2008 2017 2017 2016 2017 1998 2015
Re-elected Yes Yes Yes Yes No No Yes No Yes No
Term expires 2019 2019 2019 2019 2019 2019 2019 2018 2018 2018
Member’s special skills Pharma, general mana-gement, R&D, sales and
marketing
Pharma, general management,
sales and marketing
Pharma, general mana-gement, biotech, sales
and marketing, business development,
drug development
Pharma, general management, product
supply
General management,
finance, law
Endocrinology,medicine and clinical
biochemistry
General and change management, investment and asset
management, financial risk management
R&D informationsearch and analysis,
scientific competitiveintelligence
Production, processes
Organic process R&D, CMC development
Other management positions
LEO Holding A/S, Chairman
LEO Foundation, Grantcommittee member
LEO Holding A/S, Board member
LEO Foundation,Grant committee
member
LEO Holding A/S,Board member
LEO Pharma A/S,Board member
Acesion Pharma ApS, Chairman
MinervaX Aps, Chairman
LEO Holding A/S, Board member
LEO Holding A/S,Investment committee
member
Østagergaard, Board member
LEO Holding A/S,Board member
LEO Holding A/S, Investment committee
member
Danish Ship Finance, Chairman
CASA Group, Chairman
NNIT, Board member
Axcelfuture, Advisory Board member
Kunstforeningen Gl Strand, Chairman
BiQ ApS, Board member
LEO Holding A/S, Board member
LEO Foundation, Grant committee Chairman
LEO Holding A/S,Board member
LEO Pharma A/S,Board member
LEO Holding A/S, Investment Committee,
Chairman
Arbejdsmarkedets Erhvervssikring,
Chairman
Det Obelske Familiefond, Board member
SEB Pension DK, Vice Chairman and Chairman of audit
committee
Den Berlingske Fond, Board member
C.L. Davids Fond, Board member
Nykredit, member of Board of Representatives
LEO Holding A/S,employee-elected Board
member
LEO Holding A/S, employee-elected Board
member
LEO Pharma A/S, employee-elected Board
member
LEO Holding A/S,employee-elected Board
member
Appointed by the authorities No No No No No No No No No No
Member considered independent? No No Yes No Yes Yes Yes No No No
A N N UA L R EP O R T 2 017 – L EO F O U N DAT I O N
24
Corporate Social Responsibility
The LEO Foundation plays an active role in society through our substantial grants to science and research both in Denmark and abroad. Please refer to the Grant activities section above for further details about projects and bene-ficiaries.
Transparency, integrity and social responsibility are key values throughout our organisation. The LEO Foundation has not defined its own detailed policies for CSR, environ-mental and climate impact, or human rights, as the vast majority of the LEO Group’s business and activities is car-ried out in LEO Pharma, which has comprehensive policies and procedures in place within all three areas.
To support its ambition of taking CSR efforts to the next level, LEO Pharma has chosen right to health, right to privacy, mental well-being at work, anti-corruption and responsible supply chain management as focus areas for 2018-2020. For the next three years, the company will work actively to achieve the KPIs set within each of these areas. Specific action plans have been developed to drive pro-gress within the CSR focus areas. The LEO Foundation fully supports and encourages these efforts through our active ownership of the company. For further description of the activities implementing the LEO Pharma CSR policy and the 2017 performance and results, please refer to LEO Phar-ma’s annual report and the CSR report available at www.leo-pharma.com/home/leo-pharma/business-ethics
Given the type of business conducted in the LEO Foun-dation, our direct impact on climate end environment is limited. On LEO Group level, the main impact stems from LEO Pharma’s six production facilities. Protecting and preserving the environment is an integral part of LEO Pharma’s daily business, and the company works actively to minimize its impact. One of the goals achieved by LEO Pharma in 2017 was the establishment of a carbon footprint baseline for the thrombosis product, innohep®. A product carbon footprints provides an overview of the negative environmental impact of a product and makes it possible to prioritise efforts to protect the climate.
The LEO Foundation supports and respects the protection of internationally adopted human rights. On LEO Group level one of the key focus areas is supplier assessment and management, ensuring that suppliers respect and protect human rights when supplying their goods and services. The vast majority of the LEO Group’s supplier relationships tie into LEO Pharma which has implemented supplier risk assessment procedures inspired by the UN Guiding Princi-ples for Business and Human Rights. An important result in 2017 was the completion of an update of LEO Pharma’s third party compliance procedure. Through close collabo-ration between relevant internal stakeholders, the existing procedure for third party compliance was replaced by a procedure for sustainable procurement.
A N N UA L R EP O R T 2 017 – L EO F O U N DAT I O N
25
LEO PharmaBusiness and financial risks associated with operations are managed by LEO Pharma, which has defined risk management policies and procedures. LEO Pharma works continuously to ensure a reasonable balance between risk exposure and value creation. The LEO Foundation is kept updated about relevant risks through regular reporting from LEO Pharma’s Management and via our two seats on LEO Pharma’s Board of Directors.
Financial portfolio risksIn December 2017, the financial portfolio was transferred from LEO Pharma to the newly established holding com-pany, LEO Holding A/S. Going forward, the portfolio will be managed in accordance with LEO Holding’s Investment Pol-
icy issued annually by LEO Holding’s Board of Directors. The Investment Policy states the strategic asset allocation and the boundaries for each asset class within which tactical asset allocation decisions can be made. Furthermore, the Investment Policy defines the limits on counterparty risk, overall duration risk and liquidity of the financial portfo-lio. Currency risk is hedged for all fixed income exposure, while equity investments are generally with full currency exposure. All asset classes, external managers and external investment funds are approved by the Board's Investment Committee prior to any investments.
Compliance with the Investment Policy is verified by our fi-nance department, and investment results are documented in reports to the Investment Committee and the CEO.
Risk management

A N N UA L R EP O R T 2 017 – L EO F O U N DAT I O N
26
A N N UA L R EP O R T 2 017 – L EO F O U N DAT I O N
27
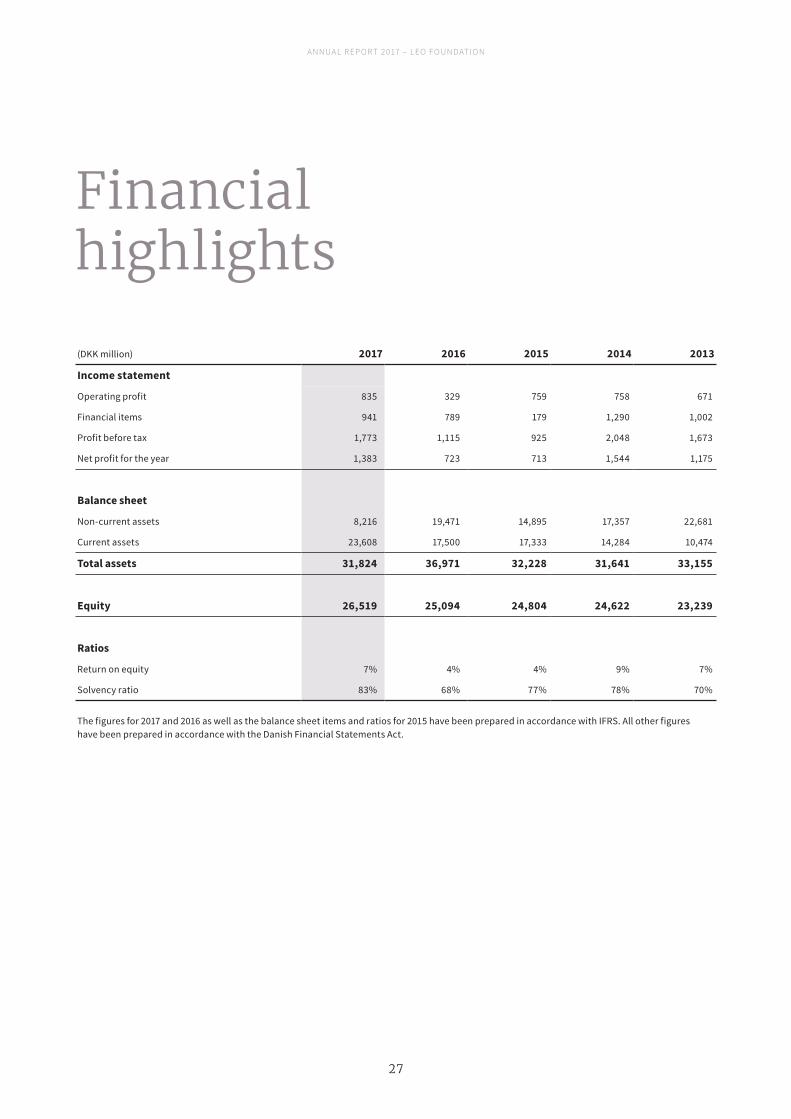
Financial highlights
(DKK million) 2017 2016 2015 2014 2013
Income statement
Operating profit 835 329 759 758 671
Financial items 941 789 179 1,290 1,002
Profit before tax 1,773 1,115 925 2,048 1,673
Net profit for the year 1,383 723 713 1,544 1,175
Balance sheet
Non-current assets 8,216 19,471 14,895 17,357 22,681
Current assets 23,608 17,500 17,333 14,284 10,474
Total assets 31,824 36,971 32,228 31,641 33,155
Equity 26,519 25,094 24,804 24,622 23,239
Ratios
Return on equity 7% 4% 4% 9% 7%
Solvency ratio 83% 68% 77% 78% 70%
The figures for 2017 and 2016 as well as the balance sheet items and ratios for 2015 have been prepared in accordance with IFRS. All other figures have been prepared in accordance with the Danish Financial Statements Act.

A N N UA L R EP O R T 2 017 – L EO F O U N DAT I O N
28
A N N UA L R EP O R T 2 017 – L EO F O U N DAT I O N
29
Consolidated Financial Statements – LEO Group
Financial Statements Income statement . . . . . . . . . . . . . . . . . . . . . . . . . . . . . . . . . . . . . . . . . . . . . . . . . . . . . . . . . . . . . . . . . . . . . . . . . . . 30Statement of comprehensive income . . . . . . . . . . . . . . . . . . . . . . . . . . . . . . . . . . . . . . . . . . . . . . . . . . . . . . 31Balance sheet at 31 December . . . . . . . . . . . . . . . . . . . . . . . . . . . . . . . . . . . . . . . . . . . . . . . . . . . . . . . . . . . . . 32Statement of changes in equity . . . . . . . . . . . . . . . . . . . . . . . . . . . . . . . . . . . . . . . . . . . . . . . . . . . . . . . . . . . . 34 Cash flow statement . . . . . . . . . . . . . . . . . . . . . . . . . . . . . . . . . . . . . . . . . . . . . . . . . . . . . . . . . . . . . . . . . . . . . . . . 35
Notes
Note 1 Basis of reporting . . . . . . . . . . . . . . . . . . . . . . . . . . . . . . . . . . . . . . . . . . . . . . . . . . . . . . . . . . . . . . . . 38Note 2 Consolidated financial statements . . . . . . . . . . . . . . . . . . . . . . . . . . . . . . . . . . . . . . . . . . . . . 40Note 3 Revenue . . . . . . . . . . . . . . . . . . . . . . . . . . . . . . . . . . . . . . . . . . . . . . . . . . . . . . . . . . . . . . . . . . . . . . . . . . . 41Note 4 Staff expenses . . . . . . . . . . . . . . . . . . . . . . . . . . . . . . . . . . . . . . . . . . . . . . . . . . . . . . . . . . . . . . . . . . . . 43Note 5 Audit fees . . . . . . . . . . . . . . . . . . . . . . . . . . . . . . . . . . . . . . . . . . . . . . . . . . . . . . . . . . . . . . . . . . . . . . . . . 44Note 6 Financial income and expenses . . . . . . . . . . . . . . . . . . . . . . . . . . . . . . . . . . . . . . . . . . . . . . . . . 44 Note 7 Tax on profit for the year . . . . . . . . . . . . . . . . . . . . . . . . . . . . . . . . . . . . . . . . . . . . . . . . . . . . . . . . 45 Note 8 Intangible assets . . . . . . . . . . . . . . . . . . . . . . . . . . . . . . . . . . . . . . . . . . . . . . . . . . . . . . . . . . . . . . . . . 46Note 9 Property, plant and equipment . . . . . . . . . . . . . . . . . . . . . . . . . . . . . . . . . . . . . . . . . . . . . . . . . 49Note 10 Financial instruments . . . . . . . . . . . . . . . . . . . . . . . . . . . . . . . . . . . . . . . . . . . . . . . . . . . . . . . . . . . . 51Note 11 Deferred tax . . . . . . . . . . . . . . . . . . . . . . . . . . . . . . . . . . . . . . . . . . . . . . . . . . . . . . . . . . . . . . . . . . . . . . 59Note 12 Inventories . . . . . . . . . . . . . . . . . . . . . . . . . . . . . . . . . . . . . . . . . . . . . . . . . . . . . . . . . . . . . . . . . . . . . . . . 61Note 13 Trade receivables . . . . . . . . . . . . . . . . . . . . . . . . . . . . . . . . . . . . . . . . . . . . . . . . . . . . . . . . . . . . . . . . 62Note 14 Foundation capital . . . . . . . . . . . . . . . . . . . . . . . . . . . . . . . . . . . . . . . . . . . . . . . . . . . . . . . . . . . . . . . 63Note 15 Retirement benefit obligations . . . . . . . . . . . . . . . . . . . . . . . . . . . . . . . . . . . . . . . . . . . . . . . . . 63Note 16 Provisions . . . . . . . . . . . . . . . . . . . . . . . . . . . . . . . . . . . . . . . . . . . . . . . . . . . . . . . . . . . . . . . . . . . . . . . . . 65Note 17 Other adjustments . . . . . . . . . . . . . . . . . . . . . . . . . . . . . . . . . . . . . . . . . . . . . . . . . . . . . . . . . . . . . . . 66Note 18 Contractual obligations . . . . . . . . . . . . . . . . . . . . . . . . . . . . . . . . . . . . . . . . . . . . . . . . . . . . . . . . . 67Note 19 Contingencies . . . . . . . . . . . . . . . . . . . . . . . . . . . . . . . . . . . . . . . . . . . . . . . . . . . . . . . . . . . . . . . . . . . . 67Note 20 Related parties . . . . . . . . . . . . . . . . . . . . . . . . . . . . . . . . . . . . . . . . . . . . . . . . . . . . . . . . . . . . . . . . . . . 67Note 21 Events after the balance sheet date . . . . . . . . . . . . . . . . . . . . . . . . . . . . . . . . . . . . . . . . . . . . 68Note 22 Companies in the LEO Group . . . . . . . . . . . . . . . . . . . . . . . . . . . . . . . . . . . . . . . . . . . . . . . . . . . . 68
A N N UA L R EP O R T 2 017 – L EO F O U N DAT I O N
30
CONSOLIDATED FINANCIAL STATEMENTS – LEO GROuP
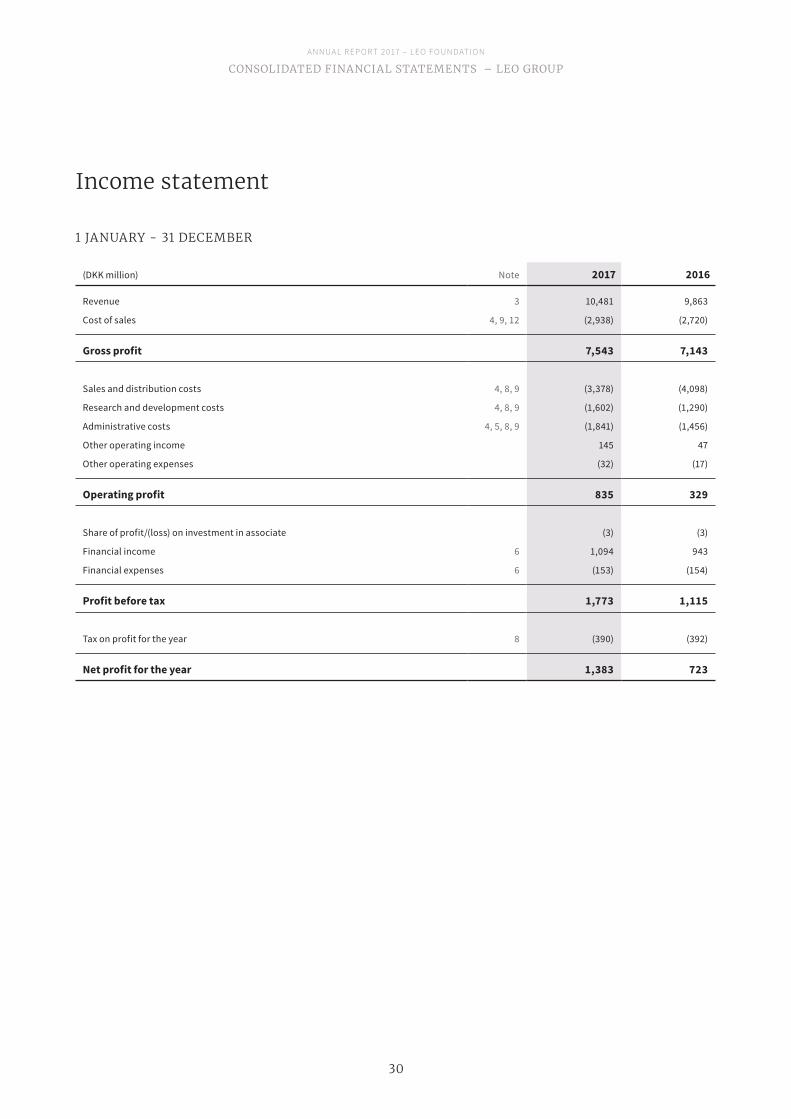
Income statement
(DKK million) Note 2017 2016
Revenue 3 10,481 9,863
Cost of sales 4, 9, 12 (2,938) (2,720)
Gross profit 7,543 7,143
Sales and distribution costs 4, 8, 9 (3,378) (4,098)
Research and development costs 4, 8, 9 (1,602) (1,290)
Administrative costs 4, 5, 8, 9 (1,841) (1,456)
Other operating income 145 47
Other operating expenses (32) (17)
Operating profit 835 329
Share of profit/(loss) on investment in associate (3) (3)
Financial income 6 1,094 943
Financial expenses 6 (153) (154)
Profit before tax 1,773 1,115
Tax on profit for the year 8 (390) (392)
Net profit for the year 1,383 723
1 JANUARY - 31 DECEMBER
A N N UA L R EP O R T 2 017 – L EO F O U N DAT I O N
31
CONSOLIDATED FINANCIAL STATEMENTS – LEO GROuP
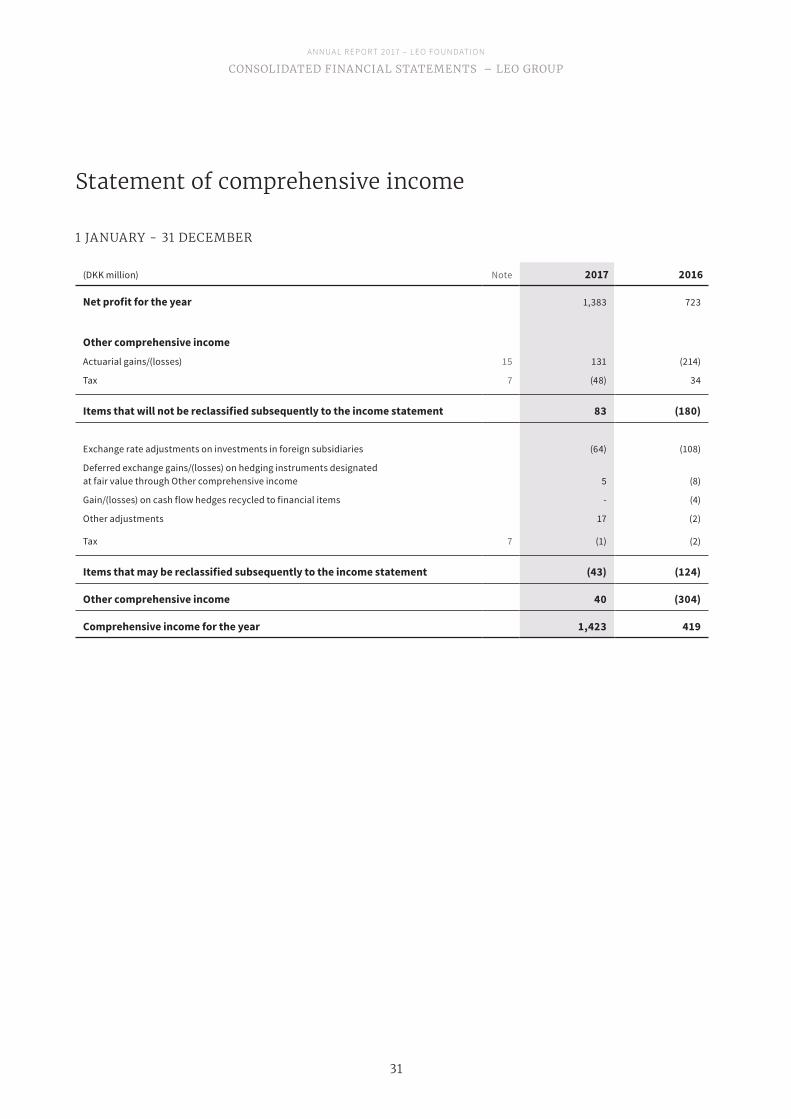
Statement of comprehensive income
(DKK million) Note 2017 2016
Net profit for the year 1,383 723
Other comprehensive incomeActuarial gains/(losses) 15 131 (214)
Tax 7 (48) 34
Items that will not be reclassified subsequently to the income statement 83 (180)
Exchange rate adjustments on investments in foreign subsidiaries (64) (108)
Deferred exchange gains/(losses) on hedging instruments designated at fair value through Other comprehensive income 5 (8)
Gain/(losses) on cash flow hedges recycled to financial items - (4)
Other adjustments 17 (2)
Tax 7 (1) (2)
Items that may be reclassified subsequently to the income statement (43) (124)
Other comprehensive income 40 (304)
Comprehensive income for the year 1,423 419
1 JANUARY - 31 DECEMBER
A N N UA L R EP O R T 2 017 – L EO F O U N DAT I O N
32
CONSOLIDATED FINANCIAL STATEMENTS – LEO GROuP
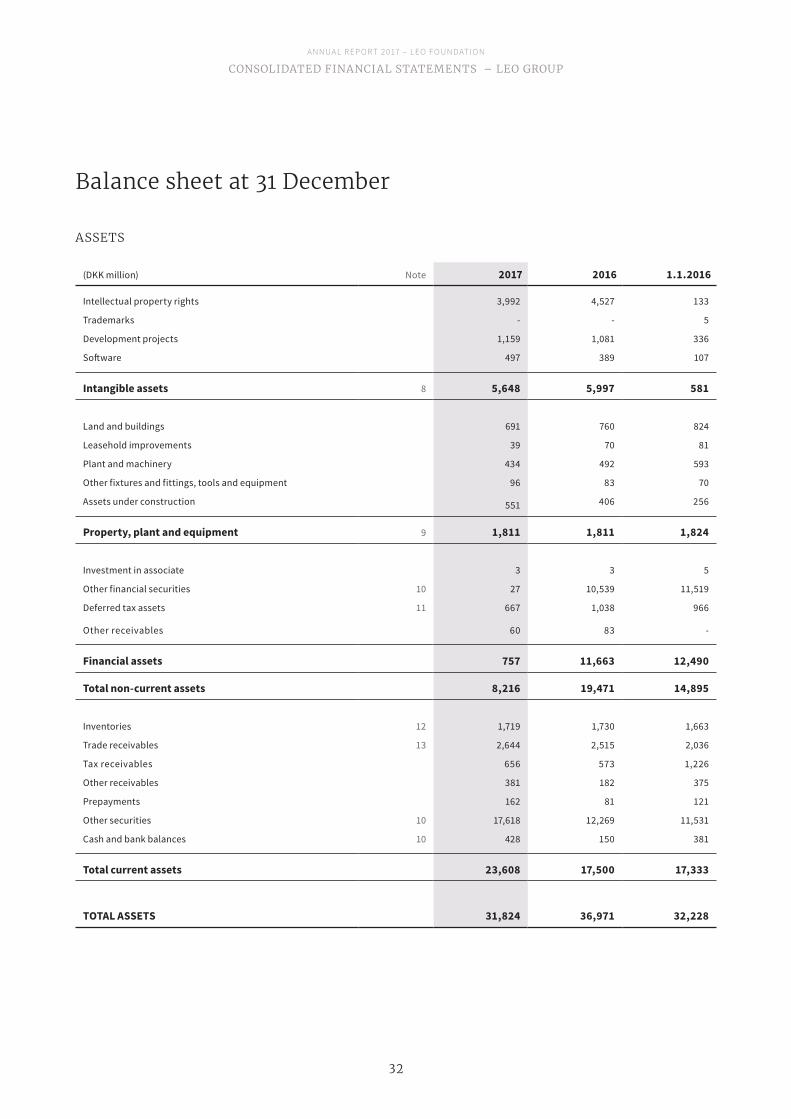
Balance sheet at 31 December
(DKK million) Note 2017 2016 1.1.2016
Intellectual property rights 3,992 4,527 133
Trademarks - - 5
Development projects 1,159 1,081 336
Software 497 389 107
Intangible assets 8 5,648 5,997 581
Land and buildings 691 760 824
Leasehold improvements 39 70 81
Plant and machinery 434 492 593
Other fixtures and fittings, tools and equipment 96 83 70
Assets under construction 551 406 256
Property, plant and equipment 9 1,811 1,811 1,824
Investment in associate 3 3 5
Other financial securities 10 27 10,539 11,519
Deferred tax assets 11 667 1,038 966
Other receivables 60 83 -
Financial assets 757 11,663 12,490
Total non-current assets 8,216 19,471 14,895
Inventories 12 1,719 1,730 1,663
Trade receivables 13 2,644 2,515 2,036
Tax receivables 656 573 1,226
Other receivables 381 182 375
Prepayments 162 81 121
Other securities 10 17,618 12,269 11,531
Cash and bank balances 10 428 150 381
Total current assets 23,608 17,500 17,333
TOTAL ASSETS 31,824 36,971 32,228
ASSETS
A N N UA L R EP O R T 2 017 – L EO F O U N DAT I O N
33
CONSOLIDATED FINANCIAL STATEMENTS – LEO GROuP
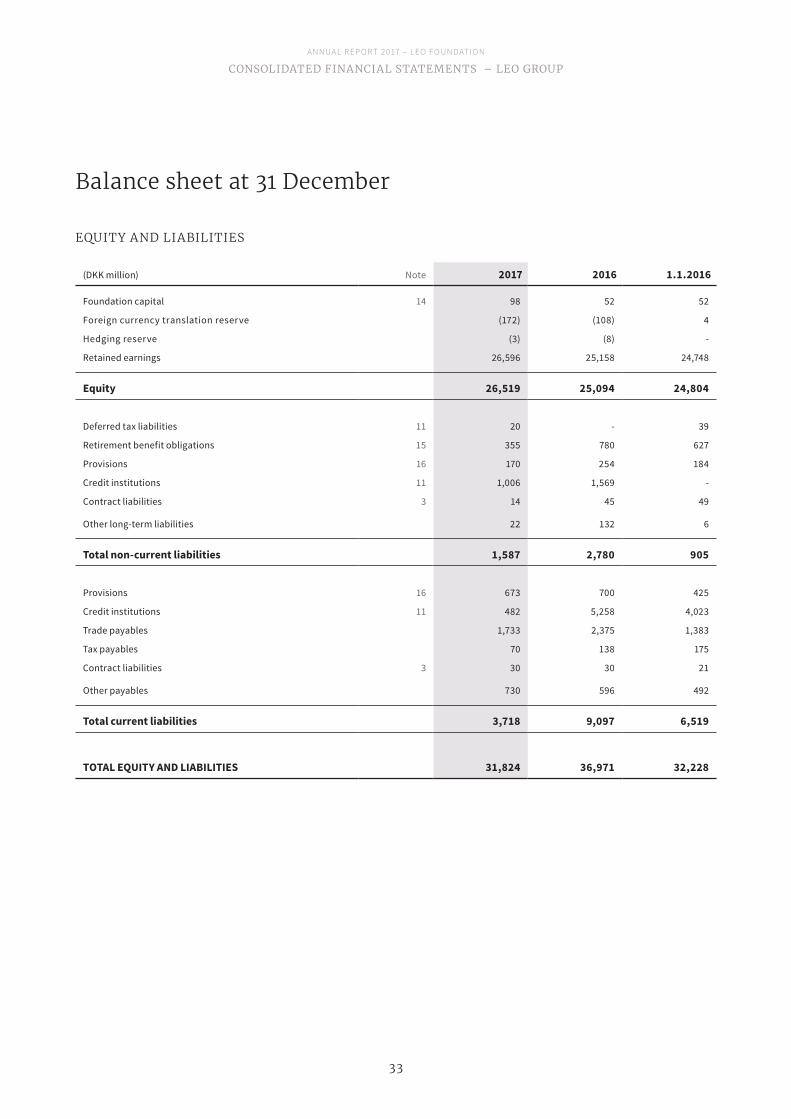
Balance sheet at 31 December
(DKK million) Note 2017 2016 1.1.2016
Foundation capital 14 98 52 52
Foreign currency translation reserve (172) (108) 4
Hedging reserve (3) (8) -
Retained earnings 26,596 25,158 24,748
Equity 26,519 25,094 24,804
Deferred tax liabilities 11 20 - 39
Retirement benefit obligations 15 355 780 627
Provisions 16 170 254 184
Credit institutions 11 1,006 1,569 -
Contract liabilities 3 14 45 49
Other long-term liabilities 22 132 6
Total non-current liabilities 1,587 2,780 905
Provisions 16 673 700 425
Credit institutions 11 482 5,258 4,023
Trade payables 1,733 2,375 1,383
Tax payables 70 138 175
Contract liabilities 3 30 30 21
Other payables 730 596 492
Total current liabilities 3,718 9,097 6,519
TOTAL EQUITY AND LIABILITIES 31,824 36,971 32,228
EQUITY AND LIABILITIES
A N N UA L R EP O R T 2 017 – L EO F O U N DAT I O N
34
CONSOLIDATED FINANCIAL STATEMENTS – LEO GROuP
Statement of changes in equity
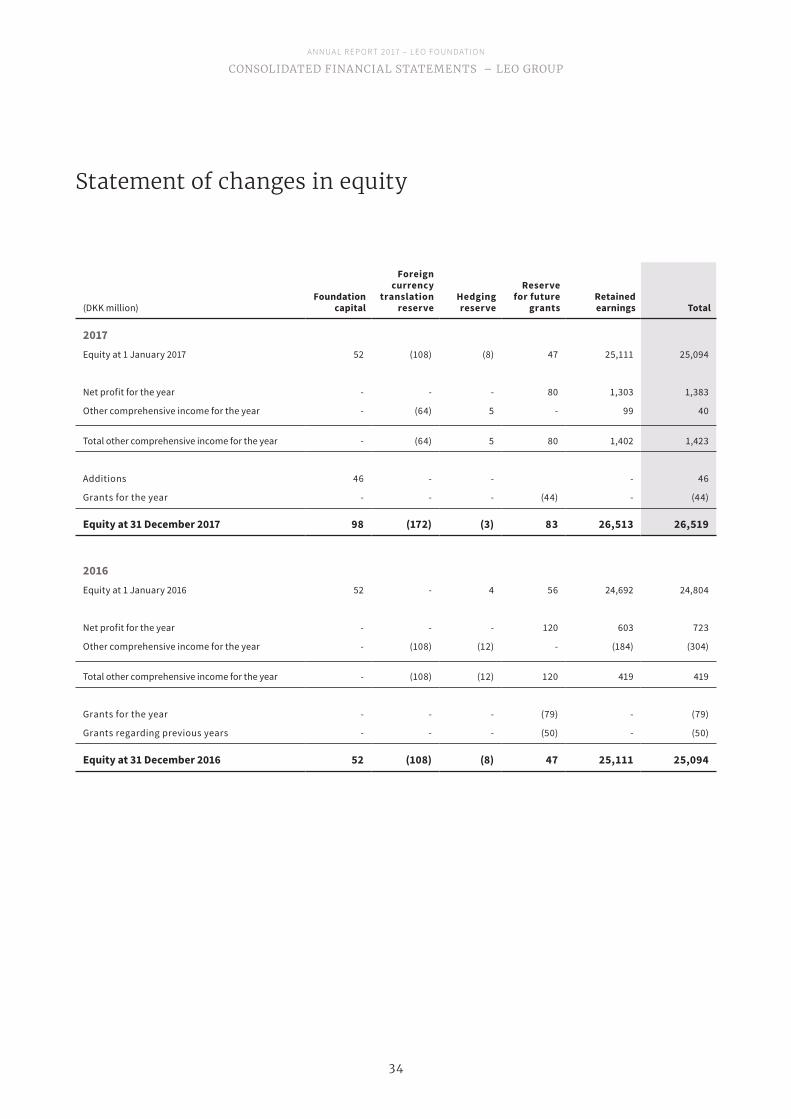
(DKK million)Foundation
capital
Foreign currency
translation reserve
Hedging reserve
Reserve for future
grantsRetained earnings Total
2017Equity at 1 January 2017 52 (108) (8) 47 25,111 25,094
Net profit for the year - - - 80 1,303 1,383
Other comprehensive income for the year - (64) 5 - 99 40
Total other comprehensive income for the year - (64) 5 80 1,402 1,423
Additions 46 - - - 46
Grants for the year - - - (44) - (44)
Equity at 31 December 2017 98 (172) (3) 83 26,513 26,519
2016Equity at 1 January 2016 52 - 4 56 24,692 24,804
Net profit for the year - - - 120 603 723
Other comprehensive income for the year - (108) (12) - (184) (304)
Total other comprehensive income for the year - (108) (12) 120 419 419
Grants for the year - - - (79) - (79)
Grants regarding previous years - - - (50) - (50)
Equity at 31 December 2016 52 (108) (8) 47 25,111 25,094
A N N UA L R EP O R T 2 017 – L EO F O U N DAT I O N
35
CONSOLIDATED FINANCIAL STATEMENTS – LEO GROuP
Cash flow statement
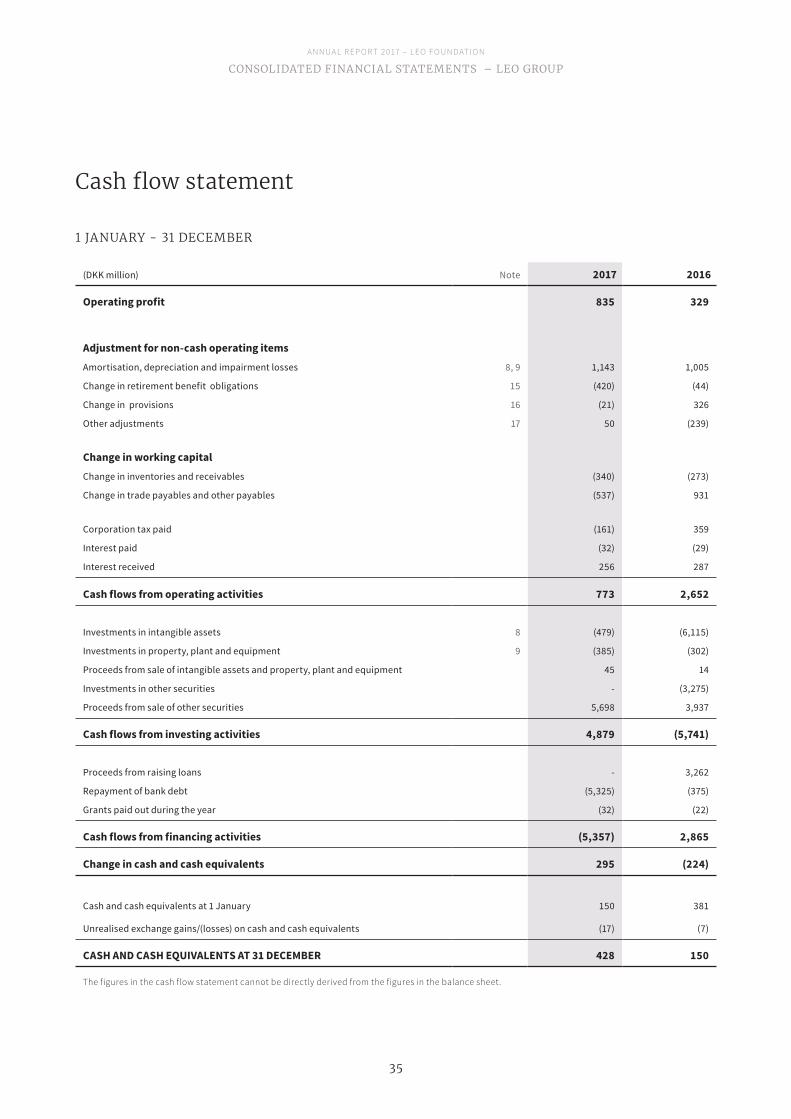
(DKK million) Note 2017 2016
Operating profit 835 329
Adjustment for non-cash operating itemsAmortisation, depreciation and impairment losses 8, 9 1,143 1,005
Change in retirement benefit obligations 15 (420) (44)
Change in provisions 16 (21) 326
Other adjustments 17 50 (239)
Change in working capitalChange in inventories and receivables (340) (273)
Change in trade payables and other payables (537) 931
Corporation tax paid (161) 359
Interest paid (32) (29)
Interest received 256 287
Cash flows from operating activities 773 2,652
Investments in intangible assets 8 (479) (6,115)
Investments in property, plant and equipment 9 (385) (302)
Proceeds from sale of intangible assets and property, plant and equipment 45 14
Investments in other securities - (3,275)
Proceeds from sale of other securities 5,698 3,937
Cash flows from investing activities 4,879 (5,741)
Proceeds from raising loans - 3,262
Repayment of bank debt (5,325) (375)
Grants paid out during the year (32) (22)
Cash flows from financing activities (5,357) 2,865
Change in cash and cash equivalents 295 (224)
Cash and cash equivalents at 1 January 150 381
Unrealised exchange gains/(losses) on cash and cash equivalents (17) (7)
CASH AND CASH EQUIVALENTS AT 31 DECEMBER 428 150
The figures in the cash flow statement cannot be directly derived from the figures in the balance sheet.
1 JANUARY - 31 DECEMBER

A N N UA L R EP O R T 2 017 – L EO F O U N DAT I O N
36

A N N UA L R EP O R T 2 017 – L EO F O U N DAT I O N
37
Notes – LEO Group
A N N UA L R EP O R T 2 017 – L EO F O U N DAT I O N
38
NOTES – LEO GROuP
NOTE 1 BASIS OF REPORTING
BASIS OF PREPARATIONThe Consolidated Financial Statements have been prepared in accordance with International Financial Reporting Standards (IFRS) as endorsed by the EU, and the additional requirements of the Danish Financial Statements Act.
As set out in note 2, these are the Group’s first Consolidated Financial Statements prepared in accordance with IFRS.
LEO Group has applied IFRS 9 Financial Instruments (as revised in July 2014) and the related consequential amendments to other IFRSs in advance of their effective dates. Details of IFRS 9 requirements and their impact on the Consolidated Financial Statements are described in note 10. IFRS 9 has been applied in accordance with the transition provisions set out in the standard and IFRS 1 First-time adoption of IFRS.
Furthermore, the LEO Group has applied IFRS 15 Revenue from Contracts with Customers. The early application of IFRS 15 has had no impact on the Consolidated Financial Statements other than the extended disclosure requirements.
The Consolidated Financial Statements are presented in Danish kroner (DKK), which is also the functional currency of the Parent Company.
The accounting policies applied to the Consolidated Financial Statements in general are described below, while the remaining accounting policies are described in the notes to which they relate.
APPLYING MATERIALITYIn the preparation of the Consolidated Financial Statements, the LEO Group aims to focus on information which is considered to be material and relevant to the users of the Consolidated Financial Statements.
The Consolidated Financial Statements are a result of aggregating large numbers of transactions into classes of similar items according to their nature or function in the Consolidated Financial Statements. If a line item is not individually material, it is aggregated with other items of a similar nature in the Consolidated Financial Statements or in the notes.
The provisions in IFRS contain extensive disclosure requirements. The specific disclosures required by IFRS are provided in the Consolidated Financial Statements unless the information is considered immaterial to the users of the financial statements.
KEY ACCOUNTING ESTIMATES AND JUDGEMENTS The Executive Management has made certain estimates regarding valuation and judgements that affect the accounting policies and the reported amounts in the Consolidated Financial Statements. Estimates are based on historical experience and assumptions reasonable under the circumstances. They are based on whatever information is currently available. Therefore the actual amounts may differ from the estimated amounts.
Below are listed the key accounting estimates and judgements relevant to the specific notes:- Note 8 Intangible assets: Estimated useful lives, impairment test and judgement on acquisition of intangible assets- Note 10 Financial instruments: Judgement on measurement of fair value, classifications and assessment of credit risk- Note 11 Deferred tax: Estimates of deferred tax assets - Note 12 Inventories: Estimates of valuation of inventories - Note 16 Provisions: Estimates of provision for legal disputes and sales deductions
GENERAL ACCOUNTING POLICIESConsolidationThe Consolidated Financial Statements comprise the LEO Foundation and entities in which the LEO Foundation directly holds more than 50% of the votes or otherwise exercises control (its subsidiaries).
The Consolidated Financial Statements are prepared by combining the Financial Statements of the Parent Company and all subsidiaries with subsequent elimination of intercompany transactions, intercompany shareholdings and balances, as well as
A N N UA L R EP O R T 2 017 – L EO F O U N DAT I O N
39
NOTES – LEO GROuP
unrealised profits from intercompany transactions. The Financial Statements of all companies have been prepared according to the same accounting policies as applied by the LEO Group.
Foreign currency translationOn initial recognition, transactions in foreign currencies are translated at the exchange rates at the transaction dates. Exchange differences arising between the rates on the transaction and payment dates are recognised in Financial income and Financial expenses in the income statement.
Receivables, payables and other monetary items in foreign currencies are translated at the exchange rates at the balance sheet date. Any differences between the exchange rates at the balance sheet date and the rate at the time when the receivable or the payable arises, or on recognition in the most recent Financial Statements, are recognised in Financial income and Financial expenses in the income statement.
On consolidation of foreign subsidiaries having a functional currency other than DKK, income statements are translated into DKK at the average exchange rates for the period, and balance sheet items are translated at the exchange rates at the balance sheet date. The effects of the translation of the opening equity of foreign subsidiaries at the exchange rates at the balance sheet date and the translation of the statement of comprehensive income from average exchange rates to the exchange rates at the balance sheet date are recognised in Other comprehensive income.
Cash flow statementThe cash flow statement is prepared according to the indirect method based on operating profit. The statement shows cash flows from operating, investing and financing activities, as well as cash and cash equivalents at the start and end of the year. Cash flows from operating activities are calculated as the Group’s operating profit, adjusted for non-cash operating items such as depreciation, amortisation and impairment losses, as well as changes in working capital. Working capital comprises inventories, trade receivables and trade payables, etc.
Cash flows from investing activities comprise payments from acquisitions and disposals of intangible assets, property, plant and equipment as well as fixed asset investments.
Cash flows from financing activities comprise payments from the raising and repayment of short-term and long-term debt, and payments to and from shareholders. Cash and cash equivalents comprise solely cash at bank and in hand.
GrantsGrants paid out: Grants that have been adopted and paid out in accordance with the purpose of the Foundation at the balance sheet date are deducted from the equity.
Grants not yet paid out: Grants that have been adopted in accordance with the purpose of the Foundation at the balance sheet date and have been announced to the recipients, but have not yet been paid out at the balance sheet date, are deducted from the equity and recognised as debt.
Grant limit : At the meeting of the Board of Trustees at which the Annual Report is adopted, the Board of Trustees lays down a grant limit in respect of the amount expected to be granted. This amount is transferred from retained earnings to the grant limit. Concurrently with being announced to the recipients, the grant amounts are paid out, or they are transferred to debt or, in rare cases, to provisions relating to grants.
NOTE 1 BASIS OF REPORTING (CONTINUED)
DEFINITION OF KEY FIGURES
Return on equity1 Profit before tax Average equity x 100
Solvency ratio1 Equity Assets x 100
1. Definitions according to the Danish Society of Financial Analysts’ Recommendations & Financial Ratios
A N N UA L R EP O R T 2 017 – L EO F O U N DAT I O N
40
NOTES – LEO GROuP
NEW AND REVISED IFRSs ISSUED BUT NOT YET EFFECTIVE THAT ARE RELEVANT TO THE LEO GROUPThe LEO Group has not applied the following standards that have been issued but are not yet effective:
- IFRS 16 Leases (effective for annual periods beginning on or after 1 January 2019, with earlier application permitted) In January 2016, IASB issued IFRS 16 Leases, which is effective from 1 January 2019. LEO Group will adopt the new standard
from the effective date. The changed lease accounting will have an impact, as the major part of the leases will be recognised in the balance sheet as right-of-use assets with a related lease liability at the present value of future lease payments. The income statement will also be affected, as the lease costs will be split between depreciation of the right-of-use asset recognised in operating costs and interest on the lease liabilities recognised in Financial expenses. The impact of implementing the standard in the LEO Group is expected to be low.
- Amendments to IFRS 10 and IAS 28 Sale or Contribution of Assets between an Investor and its Associate or Joint Venture. The amendments clarify that the gain or loss resulting from the sale or contribution of assets that constitute a business, as
defined in IFRS 3, between an investor and its associate or joint venture, is recognised in full. Any gain or loss that does not constitute a business, however, is recognised only to the extent of unrelated investors’ interests in the associate or joint venture. IASB has deferred the effective date of these amendments. The LEO Group will apply these amendments when they become effective.
- Annual Improvement Cycle – 2014-2016 - IFRS 1 First-time Adoption of International Financial Reporting Standards – deletion of short-term exemptions for first-time
adopters (effective from 1 January 2018). The amendment is not applicable to the LEO Group, as IFRS has been first-time adopted on 1 January 2017.
- IAS 28 Investment in Associates and Joint Ventures – clarification that measuring investees at fair value through profit or loss is an investment-by-investment choice (effective from 1 January 2018). These amendments are not applicable to the LEO Group.
- IFRIC 22 Foreign Currency Transactions and Advance Consideration The interpretation clarifies that, in determining the spot exchange rate to use on initial recognition of the related assets,
expense or income on derecognition of a non-monetary asset or a non-monetary liability relating to advance consideration, the transaction date is the date on which an entity initially recognises the non-monetary asset or non-monetary liability arising from the advance consideration (effective from 1 January 2018). The LEO Group does not expect any effect from this interpretation.
- IFRIC 23 Uncertainty over Income Tax Treatments (effective for annual periods beginning on or after 1 January 2019, but certain transition reliefs are available)
The interpretation addresses the accounting for income taxes when tax treatments involve uncertainty affecting the application of IAS 12 and does not apply to taxes and levies outside the scope of IAS 12, nor does it specifically include requirements relating to interest and penalties associated with uncertain tax treatments. The LEO Group will apply the interpretation from its effective date and perform the necessary procedures to ensure implementation in a timely manner.
NOTE 1 BASIS OF REPORTING (CONTINUED)
NOTE 2 CONSOLIDATED FINANCIAL STATEMENTS
The Consolidated Financial Statements, for the year ended 31 December 2017, are the first Consolidated Financial Statements that the LEO Group has prepared. The Consolidated Financial Statements for 2017 are prepared in accordance with IFRS as adopted by the EU. For periods up to and including the year ended 31 December 2016, the LEO Foundation prepared its Financial Statements in accordance with the Danish Financial Statements Act applying to large enterprises of reporting class C, and in accordance with the exemption clause in section 111(3), no Consolidated Financial Statements were prepared for the LEO Foundation.
The LEO Pharma Group has prepared its Consolidated Financial Statements in accordance with IFRS for the first time for the year ended 31 December 2017.
A N N UA L R EP O R T 2 017 – L EO F O U N DAT I O N
41
NOTES – LEO GROuP
NOTE 3 REVENUE
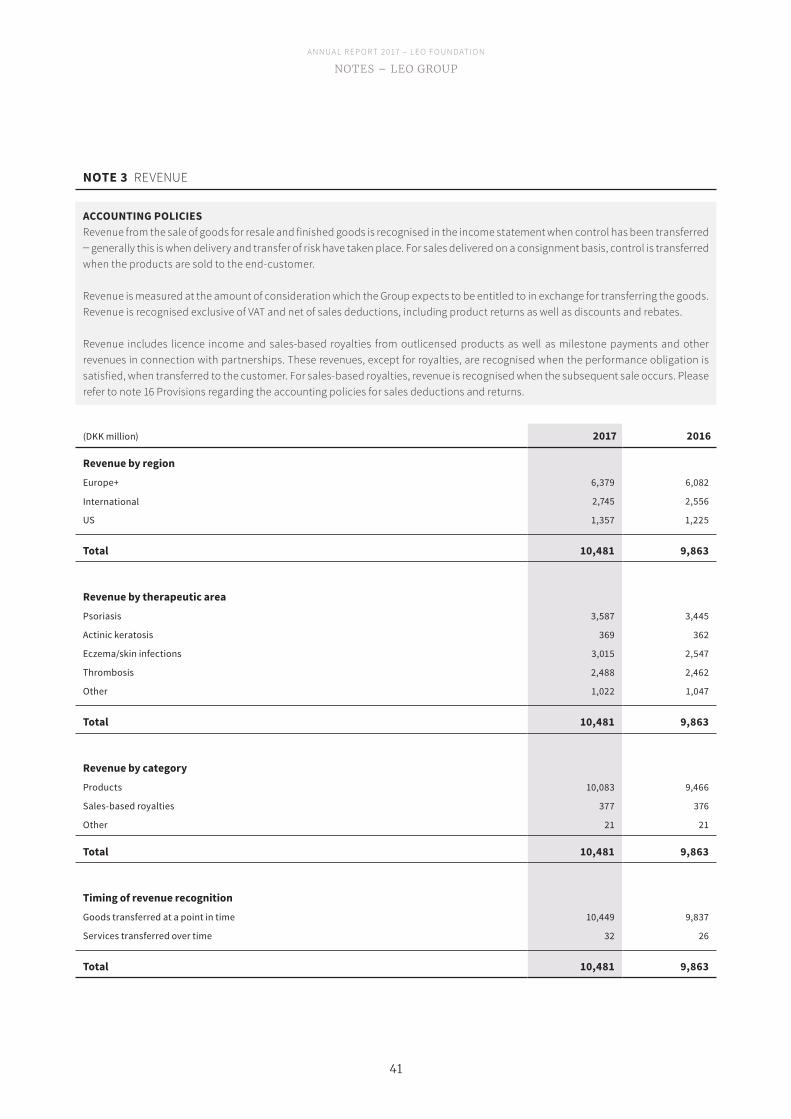
ACCOUNTING POLICIESRevenue from the sale of goods for resale and finished goods is recognised in the income statement when control has been transferred – generally this is when delivery and transfer of risk have taken place. For sales delivered on a consignment basis, control is transferred when the products are sold to the end-customer.
Revenue is measured at the amount of consideration which the Group expects to be entitled to in exchange for transferring the goods. Revenue is recognised exclusive of VAT and net of sales deductions, including product returns as well as discounts and rebates.
Revenue includes licence income and sales-based royalties from outlicensed products as well as milestone payments and other revenues in connection with partnerships. These revenues, except for royalties, are recognised when the performance obligation is satisfied, when transferred to the customer. For sales-based royalties, revenue is recognised when the subsequent sale occurs. Please refer to note 16 Provisions regarding the accounting policies for sales deductions and returns.
(DKK million) 2017 2016
Revenue by regionEurope+ 6,379 6,082
International 2,745 2,556
US 1,357 1,225
Total 10,481 9,863
Revenue by therapeutic areaPsoriasis 3,587 3,445
Actinic keratosis 369 362
Eczema/skin infections 3,015 2,547
Thrombosis 2,488 2,462
Other 1,022 1,047
Total 10,481 9,863
Revenue by categoryProducts 10,083 9,466
Sales-based royalties 377 376
Other 21 21
Total 10,481 9,863
Timing of revenue recognitionGoods transferred at a point in time 10,449 9,837
Services transferred over time 32 26
Total 10,481 9,863
A N N UA L R EP O R T 2 017 – L EO F O U N DAT I O N
42
NOTES – LEO GROuP
NOTE 3 REVENUE (CONTINUED)
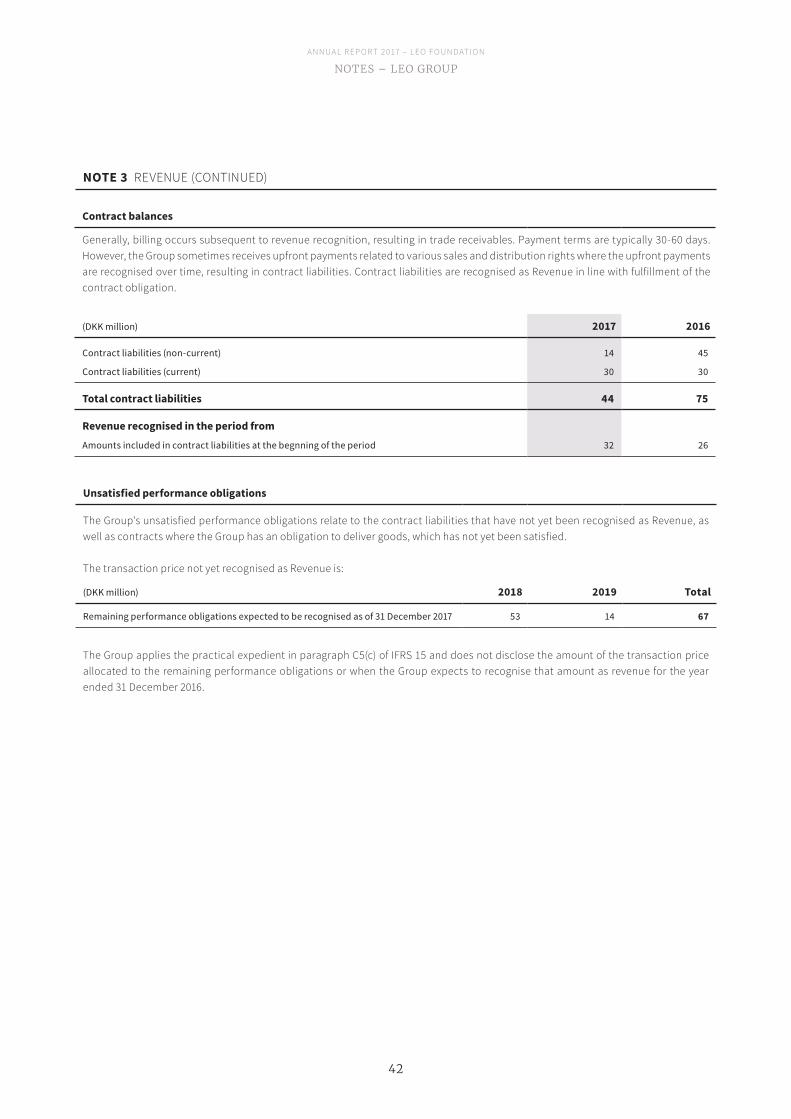
Contract balances
Generally, billing occurs subsequent to revenue recognition, resulting in trade receivables. Payment terms are typically 30-60 days. However, the Group sometimes receives upfront payments related to various sales and distribution rights where the upfront payments are recognised over time, resulting in contract liabilities. Contract liabilities are recognised as Revenue in line with fulfillment of the contract obligation.
(DKK million) 2017 2016
Contract liabilities (non-current) 14 45
Contract liabilities (current) 30 30
Total contract liabilities 44 75
Revenue recognised in the period fromAmounts included in contract liabilities at the begnning of the period 32 26
Unsatisfied performance obligations
The Group's unsatisfied performance obligations relate to the contract liabilities that have not yet been recognised as Revenue, as well as contracts where the Group has an obligation to deliver goods, which has not yet been satisfied.
The transaction price not yet recognised as Revenue is:
(DKK million) 2018 2019 Total
Remaining performance obligations expected to be recognised as of 31 December 2017 53 14 67
The Group applies the practical expedient in paragraph C5(c) of IFRS 15 and does not disclose the amount of the transaction price allocated to the remaining performance obligations or when the Group expects to recognise that amount as revenue for the year ended 31 December 2016.
A N N UA L R EP O R T 2 017 – L EO F O U N DAT I O N
43
NOTES – LEO GROuP
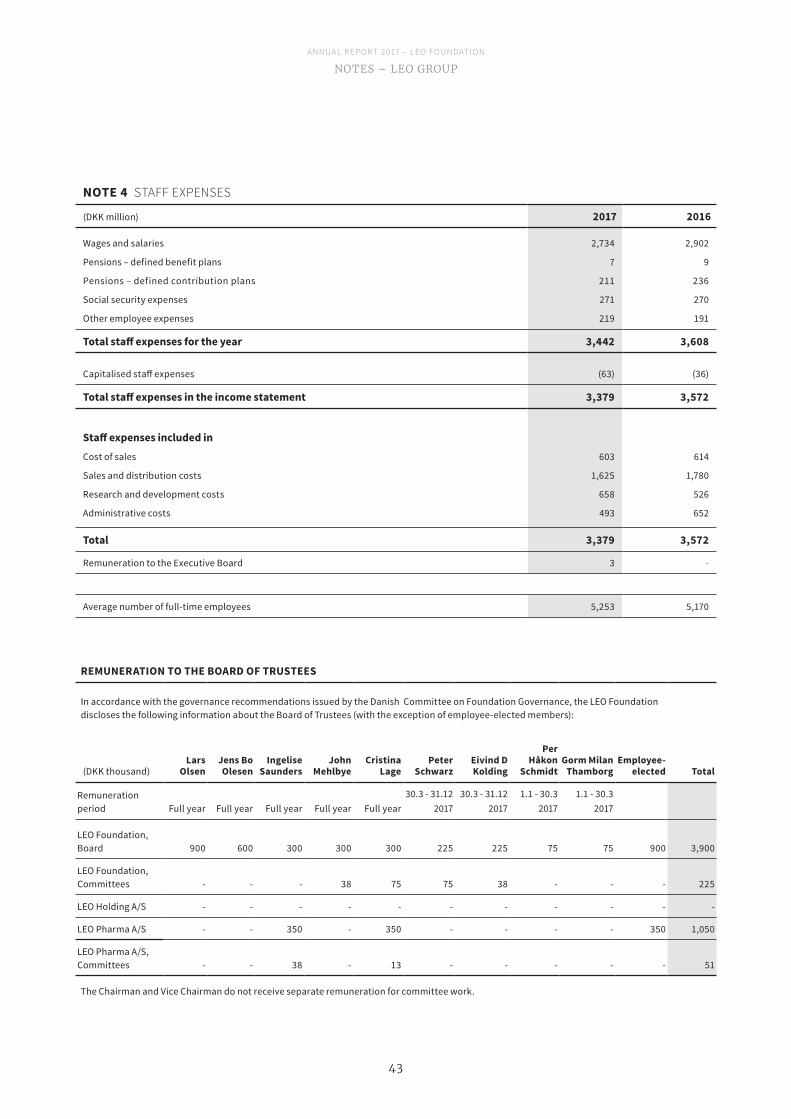
NOTE 4 STAFF EXPENSES
(DKK million) 2017 2016
Wages and salaries 2,734 2,902
Pensions – defined benefit plans 7 9
Pensions – defined contribution plans 211 236
Social security expenses 271 270
Other employee expenses 219 191
Total staff expenses for the year 3,442 3,608
Capitalised staff expenses (63) (36)
Total staff expenses in the income statement 3,379 3,572
Staff expenses included inCost of sales 603 614
Sales and distribution costs 1,625 1,780
Research and development costs 658 526
Administrative costs 493 652
Total 3,379 3,572
Remuneration to the Executive Board 3 -
Average number of full-time employees 5,253 5,170
REMUNERATION TO THE BOARD OF TRUSTEES
In accordance with the governance recommendations issued by the Danish Committee on Foundation Governance, the LEO Foundation discloses the following information about the Board of Trustees (with the exception of employee-elected members):
(DKK thousand)Lars
OlsenJens Bo Olesen
Ingelise Saunders
John Mehlbye
Cristina Lage
Peter Schwarz
Eivind D Kolding
Per Håkon
SchmidtGorm Milan
ThamborgEmployee-
elected Total
Remuneration period Full year Full year Full year Full year Full year
30.3 - 31.12 2017
30.3 - 31.12 2017
1.1 - 30.3 2017
1.1 - 30.3 2017
LEO Foundation, Board 900 600 300 300 300 225 225 75 75 900 3,900
LEO Foundation, Committees - - - 38 75 75 38 - - - 225
LEO Holding A/S - - - - - - - - - - -
LEO Pharma A/S - - 350 - 350 - - - - 350 1,050
LEO Pharma A/S,Committees - - 38 - 13 - - - - - 51
The Chairman and Vice Chairman do not receive separate remuneration for committee work.
A N N UA L R EP O R T 2 017 – L EO F O U N DAT I O N
44
NOTES – LEO GROuP
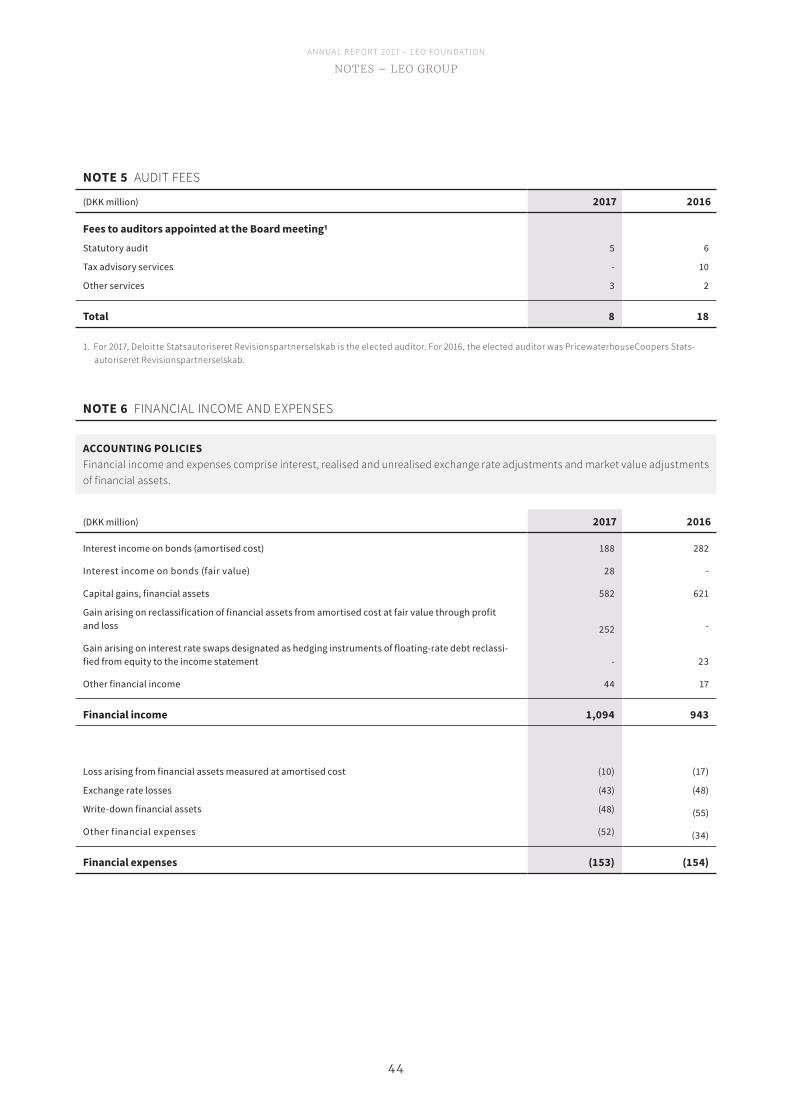
NOTE 5 AUDIT FEES
(DKK million) 2017 2016
Fees to auditors appointed at the Board meeting1Statutory audit 5 6
Tax advisory services - 10
Other services 3 2
Total 8 18
1. For 2017, Deloitte Statsautoriseret Revisionspartnerselskab is the elected auditor. For 2016, the elected auditor was PricewaterhouseCoopers Stats-autoriseret Revisionspartnerselskab.
NOTE 6 FINANCIAL INCOME AND EXPENSES
ACCOUNTING POLICIESFinancial income and expenses comprise interest, realised and unrealised exchange rate adjustments and market value adjustments of financial assets.
(DKK million) 2017 2016
Interest income on bonds (amortised cost) 188 282
Interest income on bonds (fair value) 28 -
Capital gains, financial assets 582 621
Gain arising on reclassification of financial assets from amortised cost at fair value through profit and loss 252 -
Gain arising on interest rate swaps designated as hedging instruments of floating-rate debt reclassi-fied from equity to the income statement - 23
Other financial income 44 17
Financial income 1,094 943
Loss arising from financial assets measured at amortised cost (10) (17)
Exchange rate losses (43) (48)
Write-down financial assets (48) (55)
Other financial expenses (52) (34)
Financial expenses (153) (154)
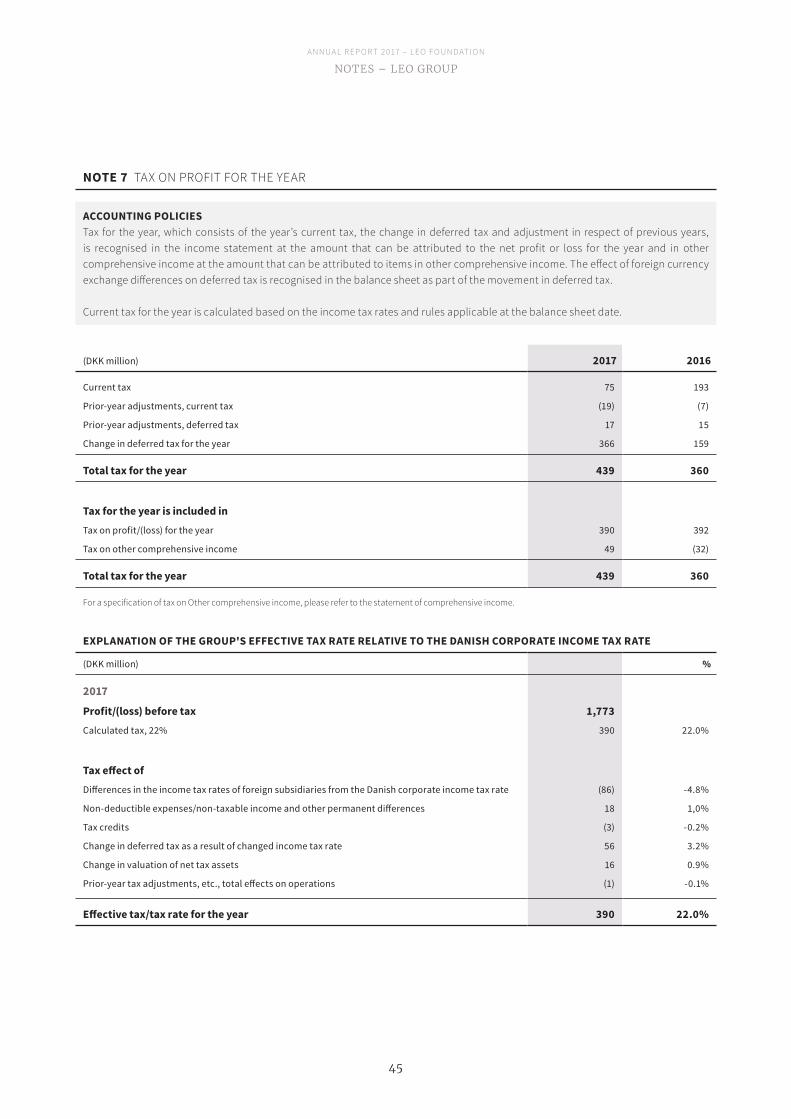
A N N UA L R EP O R T 2 017 – L EO F O U N DAT I O N
45
NOTES – LEO GROuP
NOTE 7 TAX ON PROFIT FOR THE YEAR
(DKK million) 2017 2016
Current tax 75 193
Prior-year adjustments, current tax (19) (7)
Prior-year adjustments, deferred tax 17 15
Change in deferred tax for the year 366 159
Total tax for the year 439 360
Tax for the year is included inTax on profit/(loss) for the year 390 392
Tax on other comprehensive income 49 (32)
Total tax for the year 439 360
For a specification of tax on Other comprehensive income, please refer to the statement of comprehensive income.
ACCOUNTING POLICIESTax for the year, which consists of the year’s current tax, the change in deferred tax and adjustment in respect of previous years, is recognised in the income statement at the amount that can be attributed to the net profit or loss for the year and in other comprehensive income at the amount that can be attributed to items in other comprehensive income. The effect of foreign currency exchange differences on deferred tax is recognised in the balance sheet as part of the movement in deferred tax.
Current tax for the year is calculated based on the income tax rates and rules applicable at the balance sheet date.
EXPLANATION OF THE GROUP'S EFFECTIVE TAX RATE RELATIVE TO THE DANISH CORPORATE INCOME TAX RATE
(DKK million) %
2017Profit/(loss) before tax 1,773Calculated tax, 22% 390 22.0%
Tax effect ofDifferences in the income tax rates of foreign subsidiaries from the Danish corporate income tax rate (86) -4.8%
Non-deductible expenses/non-taxable income and other permanent differences 18 1,0%
Tax credits (3) -0.2%
Change in deferred tax as a result of changed income tax rate 56 3.2%
Change in valuation of net tax assets 16 0.9%
Prior-year tax adjustments, etc., total effects on operations (1) -0.1%
Effective tax/tax rate for the year 390 22.0%
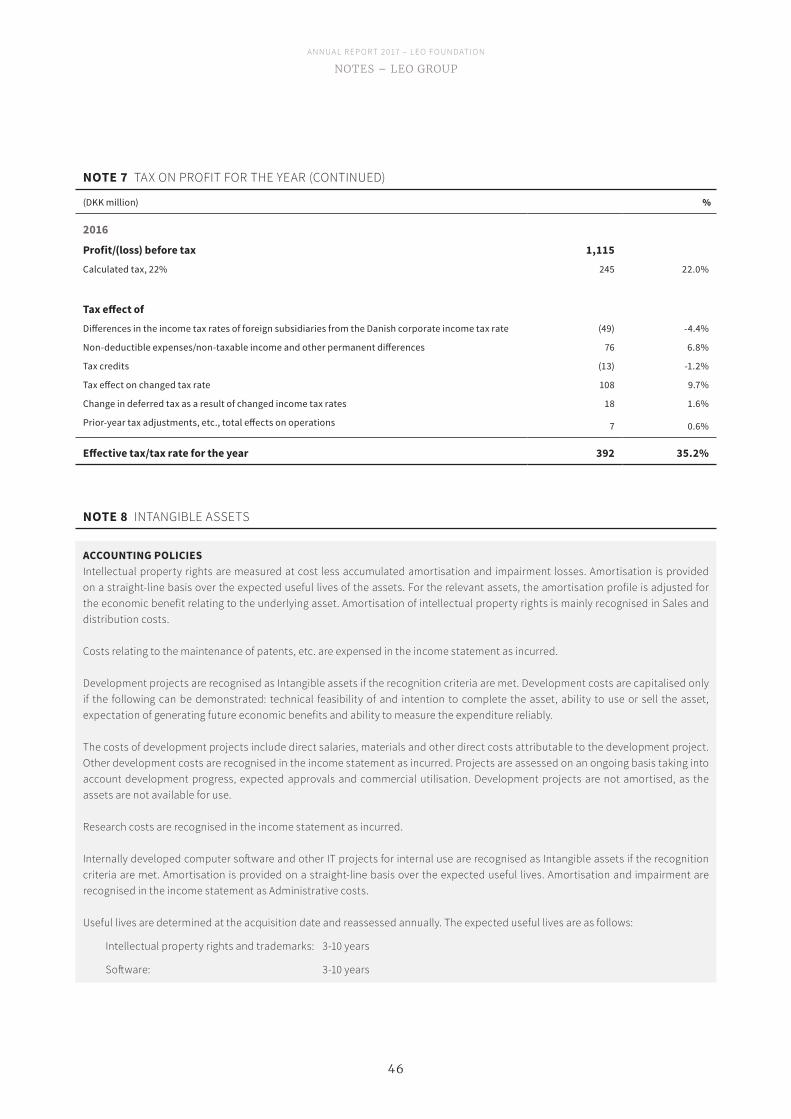
A N N UA L R EP O R T 2 017 – L EO F O U N DAT I O N
46
NOTES – LEO GROuP
(DKK million) %
2016Profit/(loss) before tax 1,115Calculated tax, 22% 245 22.0%
Tax effect ofDifferences in the income tax rates of foreign subsidiaries from the Danish corporate income tax rate (49) -4.4%
Non-deductible expenses/non-taxable income and other permanent differences 76 6.8%
Tax credits (13) -1.2%
Tax effect on changed tax rate 108 9.7%
Change in deferred tax as a result of changed income tax rates 18 1.6%
Prior-year tax adjustments, etc., total effects on operations 7 0.6%
Effective tax/tax rate for the year 392 35.2%
NOTE 7 TAX ON PROFIT FOR THE YEAR (CONTINUED)
ACCOUNTING POLICIESIntellectual property rights are measured at cost less accumulated amortisation and impairment losses. Amortisation is provided on a straight-line basis over the expected useful lives of the assets. For the relevant assets, the amortisation profile is adjusted for the economic benefit relating to the underlying asset. Amortisation of intellectual property rights is mainly recognised in Sales and distribution costs.
Costs relating to the maintenance of patents, etc. are expensed in the income statement as incurred.
Development projects are recognised as Intangible assets if the recognition criteria are met. Development costs are capitalised only if the following can be demonstrated: technical feasibility of and intention to complete the asset, ability to use or sell the asset, expectation of generating future economic benefits and ability to measure the expenditure reliably.
The costs of development projects include direct salaries, materials and other direct costs attributable to the development project. Other development costs are recognised in the income statement as incurred. Projects are assessed on an ongoing basis taking into account development progress, expected approvals and commercial utilisation. Development projects are not amortised, as the assets are not available for use.
Research costs are recognised in the income statement as incurred.
Internally developed computer software and other IT projects for internal use are recognised as Intangible assets if the recognition criteria are met. Amortisation is provided on a straight-line basis over the expected useful lives. Amortisation and impairment are recognised in the income statement as Administrative costs.
Useful lives are determined at the acquisition date and reassessed annually. The expected useful lives are as follows:
Intellectual property rights and trademarks: 3-10 years
Software: 3-10 years
NOTE 8 INTANGIBLE ASSETS
A N N UA L R EP O R T 2 017 – L EO F O U N DAT I O N
47
NOTES – LEO GROuP
IMPAIRMENT At the end of each reporting period, the carrying amounts of the intangible assets are reviewed to determine whether there is any indication that they have suffered an impairment loss. If any such indication exists, the recoverable amount of the asset is estimated in order to determine the extent of the impairment loss.
Intangible assets not yet available for use are tested for impairment at least annually, and whenever there is an indication that the asset may be impaired.
The recoverable amount is the higher of fair value less costs of disposal and value in use. In assessing value in use, the estimated future cash flows are discounted to their present value using a pre-tax discount rate that reflects current market assessments of the time value of money and the risks specific to the asset for which the estimates of future cash flows have not been adjusted.
NOTE 8 INTANGIBLE ASSETS (CONTINUED)
KEY ACCOUNTING ESTIMATES AND JUDGEMENTSTo determine the value in use, the expected cash flow approach is applied. The expected future cash flows are based on the budget and target plans for the next five years for marketable products and up to 15 years for licences where products have not yet been launched. Useful life is estimated individually in each case. In addition, the budgets and target plans are based on the Executive Management's expectations of current market conditions and future growth expectations. The key factors used in calculating the value are revenue, EBIT, working capital and discount rate.
The LEO Pharma Group has identified capitalised software relating to the ERP system (GLOBE) as corporate assets. During the year, the Executive Management considers the recoverability of the assets and assesses indications of impairment.
Useful lives are initially assessed when the assets are acquired. The Executive Management assesses intangible assets for changes in useful lives and impairment on an annual basis. The assessment of the value may involve judgement and inherent uncertainties, as there is often no active market for the intangible assets.
IMPAIRMENT TESTING Irrespective of whether there is an indication of impairment, intangible assets not yet available for use are tested for impairment annually. Intangible assets in use with definite useful lives are tested for impairment if there is any indication of impairment.Indications of impairment are the following:
- Changes in patent and licence rights- Changes to future cash inflows in the Group- R&D results- Technological changes- Development of competing products
Assessment of acquisitions On initial recognition of investments in intellectual property rights, the Executive Management assesses whether the acquisition comprises a business combination or solely an intangible asset. In making this judgement, the Executive Management assesses key issues relating to each case, as the distinction can be uncertain.
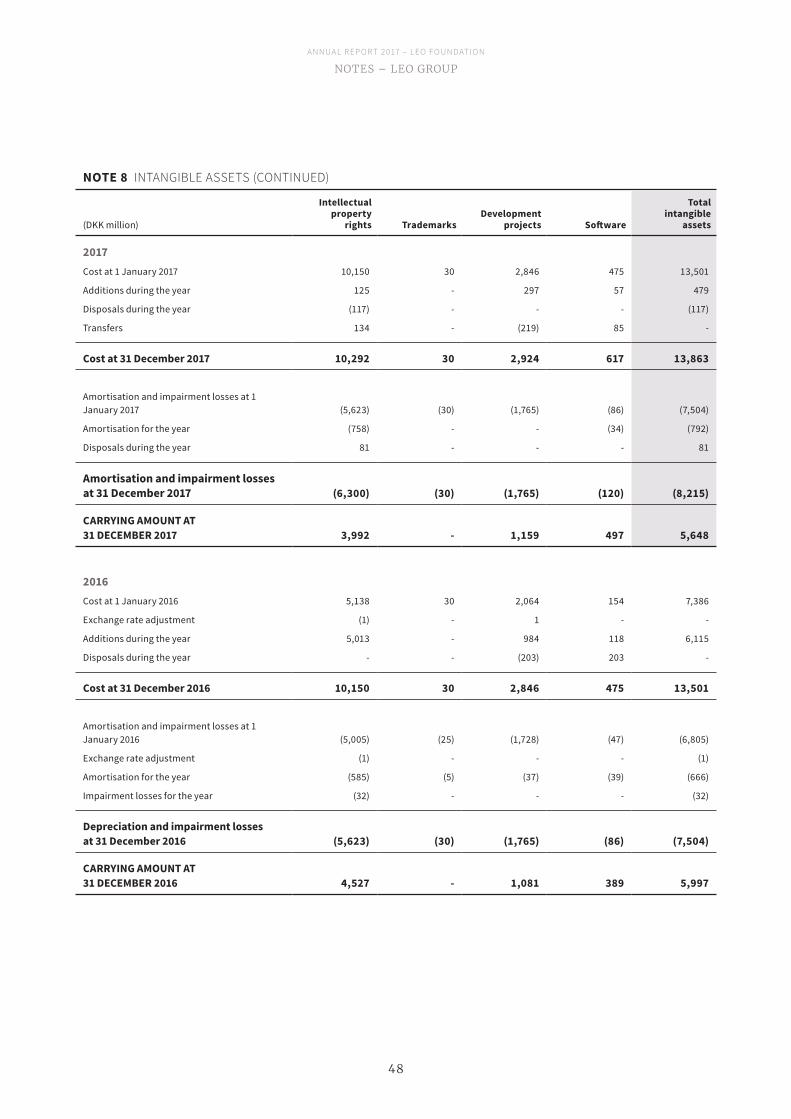
A N N UA L R EP O R T 2 017 – L EO F O U N DAT I O N
48
NOTES – LEO GROuP
NOTE 8 INTANGIBLE ASSETS (CONTINUED)
(DKK million)
Intellectual property
rights TrademarksDevelopment
projects Software
Total intangible
assets
2017Cost at 1 January 2017 10,150 30 2,846 475 13,501
Additions during the year 125 - 297 57 479
Disposals during the year (117) - - - (117)
Transfers 134 - (219) 85 -
Cost at 31 December 2017 10,292 30 2,924 617 13,863
Amortisation and impairment losses at 1 January 2017 (5,623) (30) (1,765) (86) (7,504)
Amortisation for the year (758) - - (34) (792)
Disposals during the year 81 - - - 81
Amortisation and impairment losses at 31 December 2017 (6,300) (30) (1,765) (120) (8,215)
CARRYING AMOUNT AT 31 DECEMBER 2017 3,992 - 1,159 497 5,648
2016Cost at 1 January 2016 5,138 30 2,064 154 7,386
Exchange rate adjustment (1) - 1 - -
Additions during the year 5,013 - 984 118 6,115
Disposals during the year - - (203) 203 -
Cost at 31 December 2016 10,150 30 2,846 475 13,501
Amortisation and impairment losses at 1 January 2016 (5,005) (25) (1,728) (47) (6,805)
Exchange rate adjustment (1) - - - (1)
Amortisation for the year (585) (5) (37) (39) (666)
Impairment losses for the year (32) - - - (32)
Depreciation and impairment losses at 31 December 2016 (5,623) (30) (1,765) (86) (7,504)
CARRYING AMOUNT AT 31 DECEMBER 2016 4,527 - 1,081 389 5,997
A N N UA L R EP O R T 2 017 – L EO F O U N DAT I O N
49
NOTES – LEO GROuP
(DKK million) 2017 2016
Amortisation and impairment losses are specified as follow:
Sales and distribution costs 714 552
Administrative costs 78 146
Total 792 698
NOTE 8 INTANGIBLE ASSETS (CONTINUED)
NOTE 9 PROPERTY, PLANT AND EQUIPMENT
ACCOUNTING POLICIESProperty, plant and equipment are measured at cost less accumulated depreciation and impairment. Cost comprises the acquisition price and other directly attributable costs until the date the asset is available for use. For self-constructed assets, cost comprises direct costs of materials, sub-suppliers and salaries, etc. The total cost of an asset is broken down into components that are depreciated separately if the expected useful lives of the individual components are not the same.
Depreciation is provided on a straight-line basis from the time of acquisition, or when the asset is available for use, over the expected useful life. A reassessment is made once a year to ascertain that the depreciation basis reflects the expected useful life and future residual values of the assets. Land is not depreciated.
The expected useful lives are as follows: Buildings: 10-50 years
Leasehold improvements: Up to 10 years
Plant and machinery: 5-10 years
Other fixtures and fittings, tools and equipment: 3-10 years
In 2017, research and development costs recognised in the income statement amounted to DKK 1,602 million (2016: DKK 1,290 million). Research and development costs primarily comprise internal and external costs related to studies, employee costs, materials, depreciation and other directly attributable costs.
The value of intellectual property rights acquired from Astellas amounted to DKK 5,013 million when purchased in 2016. The carrying amount at 31 December 2017 was DKK 3,760 million (2016: DKK 4,473 million). The remaining amortisation period is six years (seven years in 2016).
The value of intellectual property rights of Kyntheum® amounted to DKK 136 million when purchased in 2016. The carrying amount was DKK 253 million at 31 December 2017 (2016: DKK 136 million). Amortisation started in August 2017 and the remai-ning amortisation period is 10 years.
IMPAIRMENT TESTINGThe carrying amount of property, plant and equipment is reviewed to determine whether there is any indication of impairment loss. If the recoverable amount of an asset is estimated to be less than the carrying amount, an impairment loss is recognised.
For 2017, the impairment test resulted in an impairment loss of DKK 147 million on the production facilities in Southport, Australia, where production of ingenol disoxate was planned. Based on results from phase 3 studies, ingenol disoxate was deemed not commercially viable for LEO Pharma. The impairment loss has been recognised in Cost of sales in the income statement.
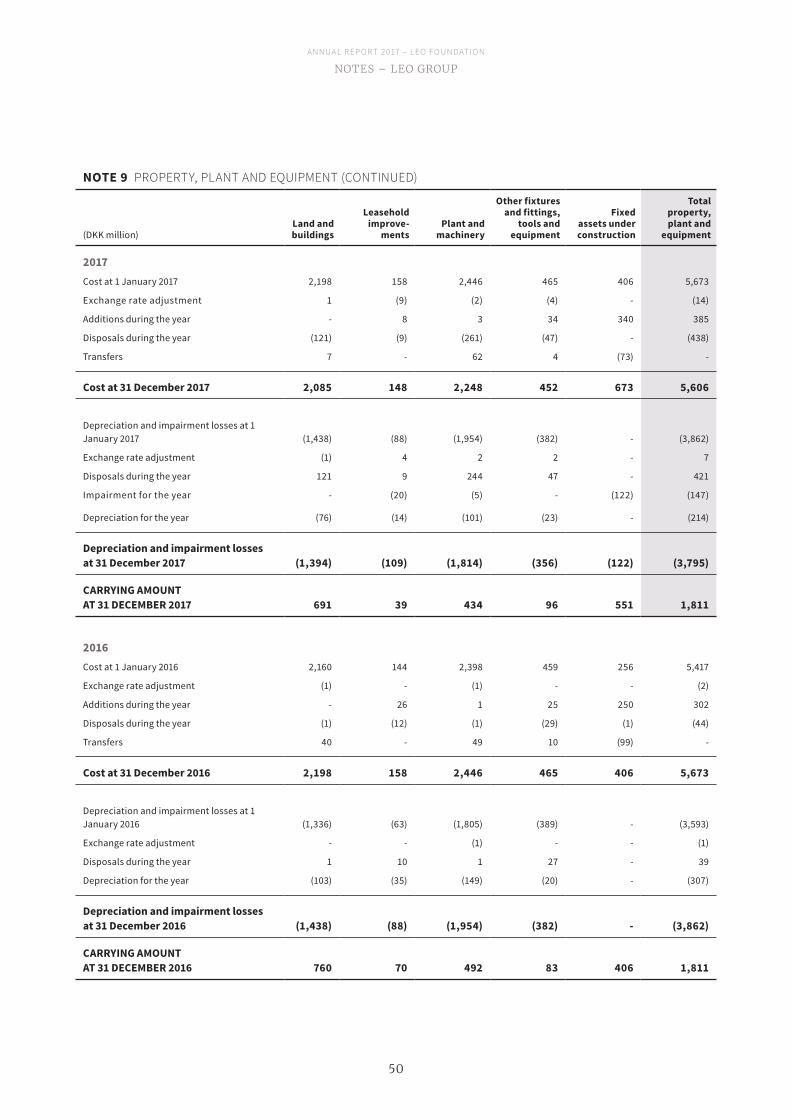
A N N UA L R EP O R T 2 017 – L EO F O U N DAT I O N
50
NOTES – LEO GROuP
NOTE 9 PROPERTY, PLANT AND EQUIPMENT (CONTINUED)
(DKK million)Land and buildings
Leasehold improve-
mentsPlant and
machinery
Other fixtures and fittings,
tools and equipment
Fixed assets under construction
Total property, plant and
equipment
2017Cost at 1 January 2017 2,198 158 2,446 465 406 5,673
Exchange rate adjustment 1 (9) (2) (4) - (14)
Additions during the year - 8 3 34 340 385
Disposals during the year (121) (9) (261) (47) - (438)
Transfers 7 - 62 4 (73) -
Cost at 31 December 2017 2,085 148 2,248 452 673 5,606
Depreciation and impairment losses at 1 January 2017 (1,438) (88) (1,954) (382) - (3,862)
Exchange rate adjustment (1) 4 2 2 - 7
Disposals during the year 121 9 244 47 - 421
Impairment for the year - (20) (5) - (122) (147)
Depreciation for the year (76) (14) (101) (23) - (214)
Depreciation and impairment losses at 31 December 2017 (1,394) (109) (1,814) (356) (122) (3,795)
CARRYING AMOUNT AT 31 DECEMBER 2017 691 39 434 96 551 1,811
2016Cost at 1 January 2016 2,160 144 2,398 459 256 5,417
Exchange rate adjustment (1) - (1) - - (2)
Additions during the year - 26 1 25 250 302
Disposals during the year (1) (12) (1) (29) (1) (44)
Transfers 40 - 49 10 (99) -
Cost at 31 December 2016 2,198 158 2,446 465 406 5,673
Depreciation and impairment losses at 1 January 2016 (1,336) (63) (1,805) (389) - (3,593)
Exchange rate adjustment - - (1) - - (1)
Disposals during the year 1 10 1 27 - 39
Depreciation for the year (103) (35) (149) (20) - (307)
Depreciation and impairment losses at 31 December 2016 (1,438) (88) (1,954) (382) - (3,862)
CARRYING AMOUNT AT 31 DECEMBER 2016 760 70 492 83 406 1,811
A N N UA L R EP O R T 2 017 – L EO F O U N DAT I O N
51
NOTES – LEO GROuP
NOTE 10 FINANCIAL INSTRUMENTS
ACCOUNTING POLICIES
Financial instruments Financial assets and financial liabilities are recognised when the Group becomes a party to the contractual provisions of the instrument. Financial assets except for trade receivables are initially measured at fair value. Transaction costs that are directly attributable to the acquisition or issue of the financial assets and financial liabilities (other than financial assets and financial liabilities at fair value through profit and loss) are added to or deducted from the fair value of the financial assets or financial liabilities, as appropiate, on intitial recognition.
Financial assets All recognised financial assets are required to be measured subsequently at amortised cost or fair value on the basis of the business model for managing the financial assets and the contractual cash flow characteristics of the financial assets. Other financial securities consist of equity investments and bonds.
Investments in bonds that are held within a business model which objective is to collect the contractual cash flows are subsequently measured at amortised cost. Investments that are held within a business model which objective is both to collect the contractual cash flows and to sell are subsequently measured at fair value through Other comprehensive income. All other investments including equity investments, are subsequently measured at fair value through profit and loss.
Other securities, which comprise listed bonds and shares, are classified as current assets and measured at fair value through profit and loss. Securities that are subsequently measured at amortised cost or at fair value through Other comprehensive income are subject to impairment.
Financial liabilities All financial liabilities are subsequently measured at amortised cost using the effective interest method.
Derivative financial instrumentsDerivative financial instruments are used to manage the exposure to interest rate and foreign exchange rate risk. None of the derivative financial instruments are held for trading. On initiation of the contract, the Group designates each derivative financial contract as either a hedge of the fair value of a recognised asset or liability (fair value hedge) or as a hedge of a future transaction (cash flow hedge). All contracts are initially recognised at fair value and subsequently remeasured at fair value at the end of the reporting period. The resulting gain or loss is recognised in profit and loss immediately, unless the derivative is designated and effective as a hedging instrument, in which case the timing of the recognition in profit and loss depends on the nature of the hedge relationship.
Hedge accounting The Group designates certain derivatives as hedging instruments in respect of foreign currency risk as fair value hedges, and certain derivatives as hedging instruments in respect of interest rate risk as cash flow hedges.
NOTE 9 PROPERTY, PLANT AND EQUIPMENT (CONTINUED)
(DKK million) 2017 2016
Depreciation and impairment losses are specified as follow:
Cost of sales 326 276
Sales and distribution costs 15 13
Research and development costs 10 11
Administrative costs 10 7
Total 361 307
A N N UA L R EP O R T 2 017 – L EO F O U N DAT I O N
52
NOTES – LEO GROuP
The fair value adjustment on qualifying hedging instruments is recognised in profit and loss in the same line as the hedged item when the hedging instrument is designated as fair value hedge.
Value adjustments of the effective part of cash flow hedges are recognised in equity through Other comprehensive income. The cumulative value adjustment of these contracts is transferred from Other comprehensive income to the income statement in the same period and the same line as the hedged item.
Discontinuance of cash flow hedgingWhen a hedging instrument expires or is sold but the hedge still meets the criteria for hedge accounting, any cumulative gain or loss existing in equity at that time remains in equity and is recognised when the forecast transaction is ultimately recognised in the income statement. If a forecast transaction is no longer expected to occur, the cumulative gain or loss that was reported in equity is immediately transferred to the income statement under Financial income or Financial expenses.
NOTE 10 FINANCIAL INSTRUMENTS (CONTINUED)
KEY ACCOUNTING ESTIMATES AND JUDGEMENTSThe application of IFRS 9 and IFRS 13 requires significant judgements including: - Judgement on measurement of fair value - Classification of financial assets and assessment of business model within which the assets are held - Assessment of credit risks on financial assets and impairment within IFRS 9
FINANCIAL RISKSFinancial Portfolio risksFinancial portfolio risks are managed according to the LEO Holding Investment Policy, which is approved by the LEO Holding Board of Directors. The Investment Policy states the strategic asset allocation and the boundaries for each asset class within which tactical asset allocation positions can be made. Furthermore, the policy defines the limits on counterparty risk, overall duration risk and liquidity of the financial portfolio. Currency risk is hedged for all fixed income exposure, while equity investments are generally with full currency exposure.
OPERATIONAL FINANCIAL RISKSOperational financial risks are managed by LEO Pharma Group, which has centralised risk management. The overall objectives and policies for LEO Pharma Group’s financial risk management are outlined in an internal Treasury Policy, which has been approved by the LEO Pharma Board of Directors. The Treasury Policy consists of the Foreign Exchange Policy, the Investment Policy and the Policy regarding Credit Risk on Financial Counterparties, and includes a description of permitted use of financial instruments. LEO Pharma Group hedges only commercial exposures and consequently does not enter into derivative transactions for trading or speculative purposes. LEO Pharma Group uses a fully integrated Treasury Management System to manage all financial positions. The LEO Pharma Group may use forward exchange contracts and currency options to hedge the recognised assets and liabilities. Currently, net investments in foreign subsidiaries are not hedged.
To manage credit risk on financial counterparties, the LEO Pharma Group enters into derivative financial instruments and money market deposits only with financial counterparties possessing a satisfactory long-term credit rating assigned by at least one out of the three international credit-rating agencies: Standard and Poor’s, Moody’s and Fitch. If a counterparty possesses a rating below Investment Grade, the LEO Pharma Group minimises the risk by keeping the lowest possible bank balance or by spreading the risk between several banks. At year-end the bank balances held with counterparties below Investment Grade is low, and the credit risk is considered low. Furthermore, the credit risk on bond investments is limited, as investments are made in highly liquid bonds with solid credit ratings such as Investment Grade.
A N N UA L R EP O R T 2 017 – L EO F O U N DAT I O N
53
NOTES – LEO GROuP
(DKK million) Monetary assets Monetary liabilities
2017 2016 2017 2016USD 1,251 881 1,000 2,033
GBP 280 315 350 601
CAD 183 52 10 36
JPY 112 129 46 40
RUB 111 10 0 0
SAR 97 100 0 0
CNY 77 195 38 69
AUD 43 52 241 141
Monetary assets and monetary liabilities include trade receivables, other receivables, securities, cash, trade payables and other payables.
FOREIGN CURRENCY SENSITIVITY ANALYSISThe sensitivity analysis below shows the estimated impact on operating profit of a 5% change in DKK versus the key currencies. The analysis shows the impact of foreign currency exchange differences on the Group's monetary assets and liabilities and foreign exchange forwards. A similar negative change in exchange rates would have a similar opposite effect on operating profit.
ESTIMATED IMPACT ON PROFIT/(LOSS) FOR THE YEAR AND EQUITY FROM A 5% INCREASE IN YEAR-END EX-CHANGE RATES OF THE MAJOR CURRENCIES
(DKK million) CAD CNY GBP JPY USD RUB
2017Profit/(loss) for the year/Equity - 2 (4) 1 (2) 1
2016Profit/(loss) for the year/Equity - (1) (6) (1) (19) 1
NOTE 10 FINANCIAL INSTRUMENTS (CONTINUED)
CREDIT RISK LEO Pharma's products are sold primarily to pharmacies, wholesalers and hospitals. Historically, realised losses sustained on debtors have been insignificant, which was also the case both in 2017 and 2016. However, the LEO Pharma Group has a number of ongoing legal actions against customers in receivership and other financial difficulties that are nearing completion.The LEO Pharma Group has no significant concentration of credit risk related to Trade receivables as the exposure is spread over a large number of counterparties and customers. As such, the LEO Pharma Group has no significant reliance on any specific customer, but continues to monitor the credit exposure on all customers, both new and existing. Thus, the risk of significant loss is minimised, and is at an acceptable level.
FOREIGN EXCHANGE RISKAs a global company, the LEO Pharma Group undertakes transactions denominated in foreign currencies and therefore foreign exchange risk has a significant impact on the income statement, balance sheet and cash flow statement. The overall objective of foreign exchange risk management is to reduce the short-term negative impact of exchange rate fluctuations on net profit before tax by entering into fair value hedges using forward exchange contracts. The LEO Pharma Group's policy is to hedge minimum 80% of the recognised assets and liabilities.
MONETARY ASSETS AND MONETARY LIABILITIES FOR THE MAJOR CURRENCIES AT 31 DECEMBERLEO Pharma is mainly exposed to USD, GBP, CAD, JPY, RUB and CNY, either through direct sales to third parties or indirect sales through a subsidiary. The foreign currency-denominated monetary assets and liabilities located in Ireland and Denmark that were hedged at the end of the reporting period can be seen in the following table. The monetary assets and liabilities are not divided into EUR and DKK because of the narrow band between the two currencies.
A N N UA L R EP O R T 2 017 – L EO F O U N DAT I O N
54
NOTES – LEO GROuP
NOTE 10 FINANCIAL INSTRUMENTS (CONTINUED)
FINANCIAL DERIVATIVES – FAIR VALUE HEDGES
Forward exchange contracts (against DKK) (DKK million)
Contract value
Fair value at year-end
Maturity end date
Contract value
Fair value at year-end
Maturity end date
2017 2016
Sold CAD 178 (1) 12/03/2018 35 - 10/01/2017
Sold CNY1 - - N/A 135 (1) 28/07/2017
Bought GBP - - N/A 156 - 31/01/2017
Sold JPY 43 - 28/03/2018 100 3 15/03/2017
Sold SAR 98 - 11/06/2018 89 (3) 09/05/2017
Sold RUB 100 - 21/03/2018 10 - 23/01/2017
Sold USD 2017 / Bought USD 2016 299 5 31/07/2018 779 4 20/01/2017
Bought AUD 41 - 29/01/2018 - - 09/05/2017
Bought EUR2 1,845 1 28/06/2018 1,862 - 01/08/2017
Sold other currencies 461 (1) 15/06/2018 473 (2) 01/08/2017
Total 3,065 4 3,639 1
1. Chinese yuan traded offshore (CNH) is used as a proxy when hedging the CNY currency exposure of the Group. 2. Even though the exchange rate risk of EUR is considered low, EUR is still hedged.
The fair value gain of the forward exchange contracts of DKK 4 million at the end of 2017 is recognised in the income statement in Financial income (2016: DKK 1 million).
INTEREST RATE RISKThe Group is exposed to interest rate risk if entities in the Group borrow funds at floating interest rates. The Group manages the risk by choosing to pay fixed rate on this financing by entering into interest rate swaps as hedging instruments and paying fixed and receiving floating rates (CIBOR 12M). Hedging of interest rate risk is approved by the Executive Management and hedge effectiveness is assessed on a regular basis. No ineffectiveness has been observed so far. The current hedging instruments are shown in the table below.
Outstanding receivable floating-rate fixed contracts (DKK million)
Notional principal value
Change in fair value recognised in Other compre-
hensive incomeFair value assets
(liabilities)Average fixed
interest rateMaturity end date
2017DKK 100 - - 0.325% 28/03/2018
DKK 400 2 (1) 0.386% 29/03/2019
DKK 370 3 (2) 0.445% 30/12/2019
Total 5 (3)
2016DKK 400 - - 0.325% 28/03/2018
DKK 400 (3) (3) 0.386% 29/03/2019
DKK 370 (5) (5) 0.445% 30/12/2019
Total (8) (8)
At 31 December 2017, the fair value of DKK 3 million has been recognised in Other payables. At 31 December 2016, the fair value of DKK 8 million was recognised in Other payables.
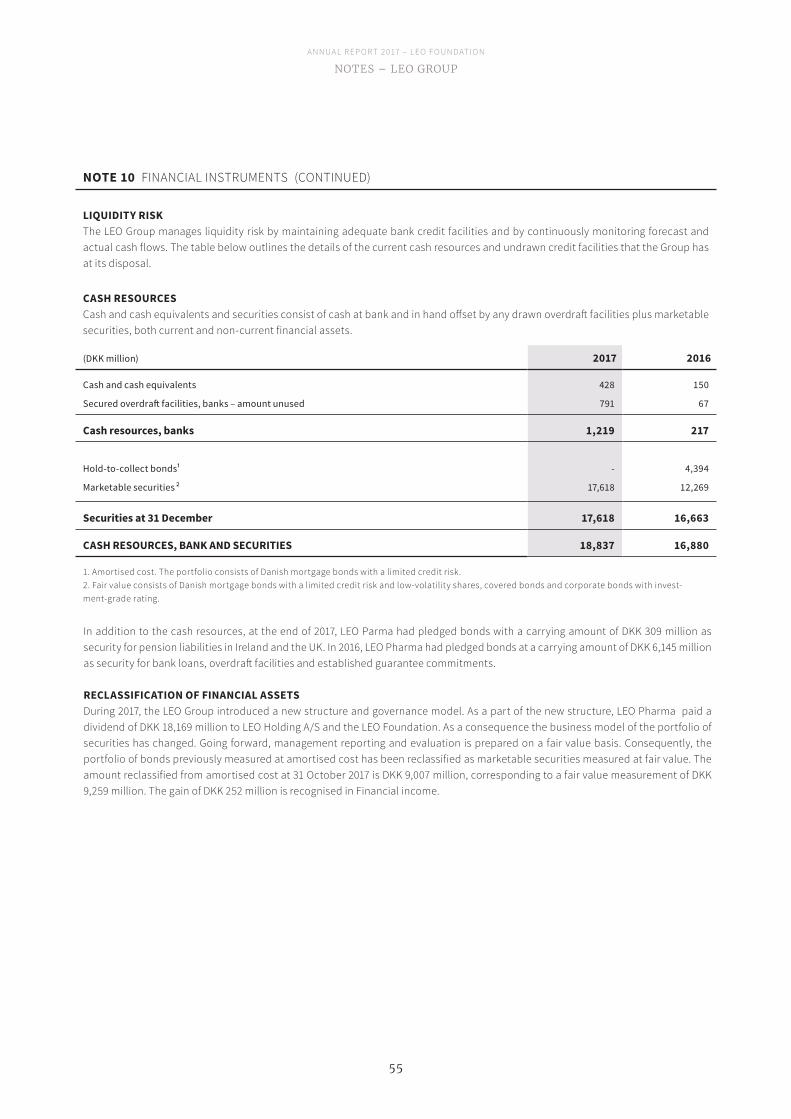
A N N UA L R EP O R T 2 017 – L EO F O U N DAT I O N
55
NOTES – LEO GROuP
In addition to the cash resources, at the end of 2017, LEO Parma had pledged bonds with a carrying amount of DKK 309 million as security for pension liabilities in Ireland and the UK. In 2016, LEO Pharma had pledged bonds at a carrying amount of DKK 6,145 million as security for bank loans, overdraft facilities and established guarantee commitments.
RECLASSIFICATION OF FINANCIAL ASSETSDuring 2017, the LEO Group introduced a new structure and governance model. As a part of the new structure, LEO Pharma paid a dividend of DKK 18,169 million to LEO Holding A/S and the LEO Foundation. As a consequence the business model of the portfolio of securities has changed. Going forward, management reporting and evaluation is prepared on a fair value basis. Consequently, the portfolio of bonds previously measured at amortised cost has been reclassified as marketable securities measured at fair value. The amount reclassified from amortised cost at 31 October 2017 is DKK 9,007 million, corresponding to a fair value measurement of DKK 9,259 million. The gain of DKK 252 million is recognised in Financial income.
NOTE 10 FINANCIAL INSTRUMENTS (CONTINUED)
LIQUIDITY RISKThe LEO Group manages liquidity risk by maintaining adequate bank credit facilities and by continuously monitoring forecast and actual cash flows. The table below outlines the details of the current cash resources and undrawn credit facilities that the Group has at its disposal.
CASH RESOURCESCash and cash equivalents and securities consist of cash at bank and in hand offset by any drawn overdraft facilities plus marketable securities, both current and non-current financial assets.
(DKK million) 2017 2016
Cash and cash equivalents 428 150
Secured overdraft facilities, banks – amount unused 791 67
Cash resources, banks 1,219 217
Hold-to-collect bonds1 - 4,394
Marketable securities 2 17,618 12,269
Securities at 31 December 17,618 16,663
CASH RESOURCES, BANK AND SECURITIES 18,837 16,880
1. Amortised cost. The portfolio consists of Danish mortgage bonds with a limited credit risk. 2. Fair value consists of Danish mortgage bonds with a limited credit risk and low-volatility shares, covered bonds and corporate bonds with invest-ment-grade rating.
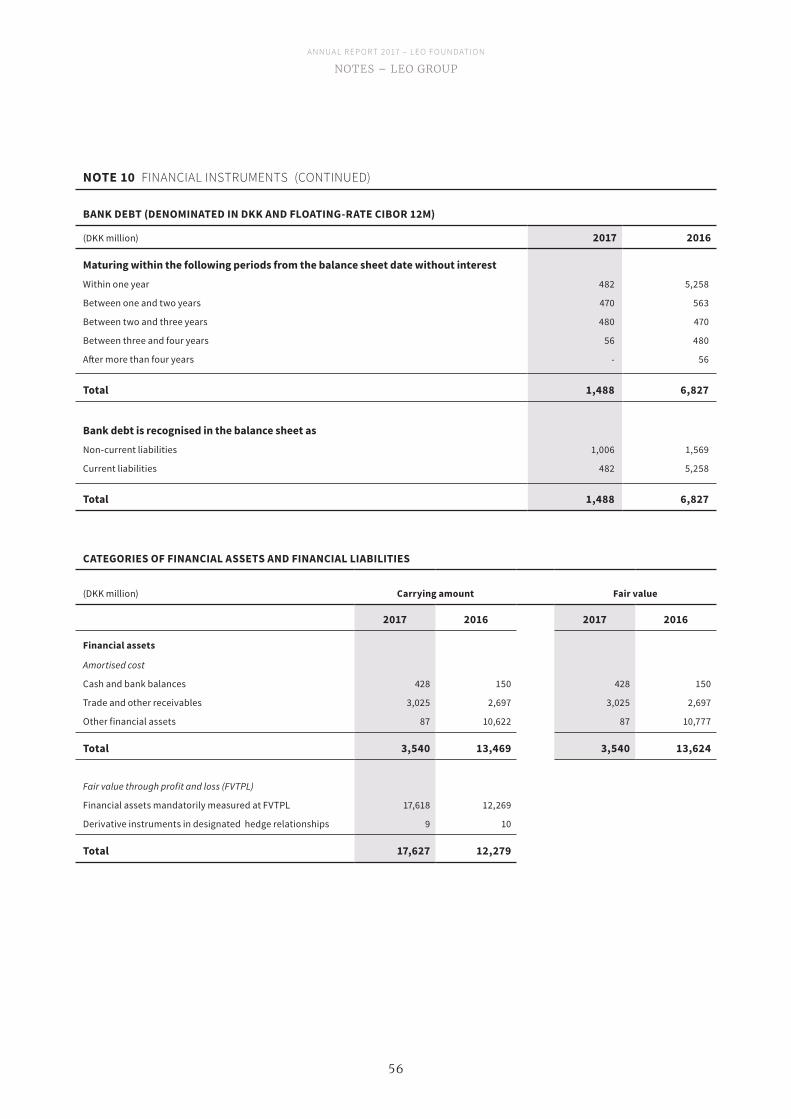
A N N UA L R EP O R T 2 017 – L EO F O U N DAT I O N
56
NOTES – LEO GROuP
BANK DEBT (DENOMINATED IN DKK AND FLOATING-RATE CIBOR 12M)
(DKK million) 2017 2016
Maturing within the following periods from the balance sheet date without interestWithin one year 482 5,258
Between one and two years 470 563
Between two and three years 480 470
Between three and four years 56 480
After more than four years - 56
Total 1,488 6,827
Bank debt is recognised in the balance sheet asNon-current liabilities 1,006 1,569
Current liabilities 482 5,258
Total 1,488 6,827
CATEGORIES OF FINANCIAL ASSETS AND FINANCIAL LIABILITIES
(DKK million) Carrying amount Fair value
2017 2016 2017 2016
Financial assets
Amortised cost
Cash and bank balances 428 150 428 150
Trade and other receivables 3,025 2,697 3,025 2,697
Other financial assets 87 10,622 87 10,777
Total 3,540 13,469 3,540 13,624
Fair value through profit and loss (FVTPL)
Financial assets mandatorily measured at FVTPL 17,618 12,269
Derivative instruments in designated hedge relationships 9 10
Total 17,627 12,279
NOTE 10 FINANCIAL INSTRUMENTS (CONTINUED)
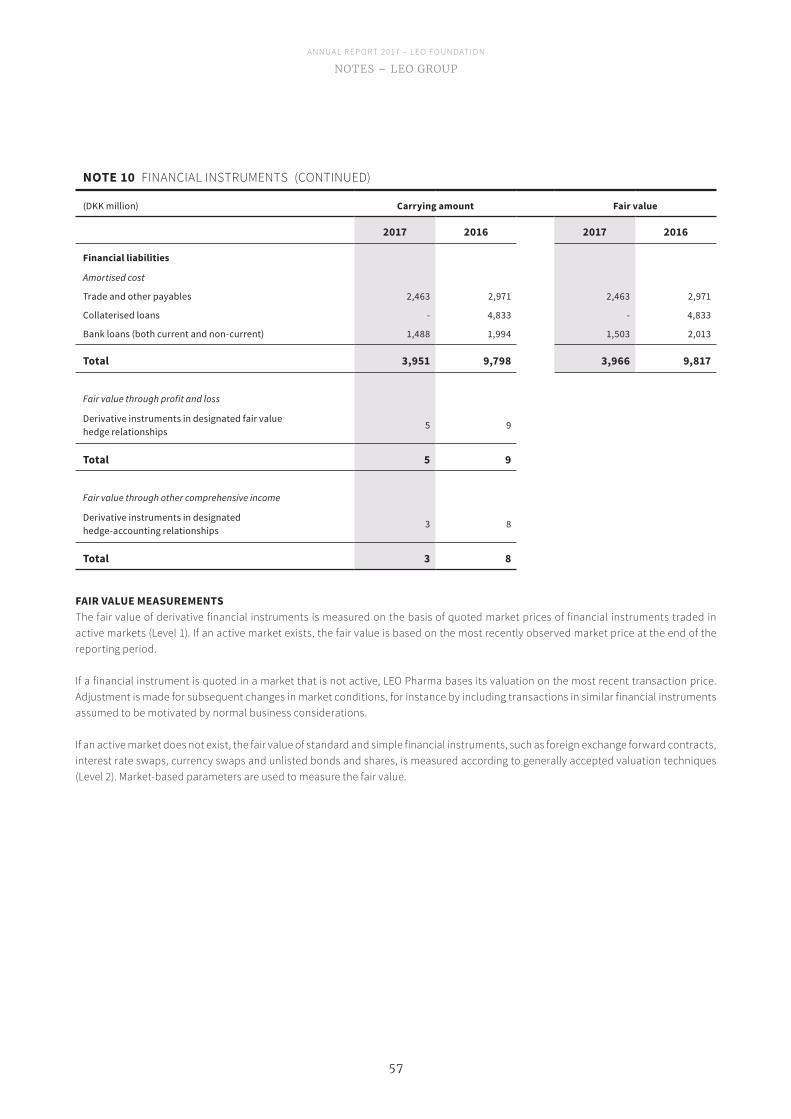
A N N UA L R EP O R T 2 017 – L EO F O U N DAT I O N
57
NOTES – LEO GROuP
(DKK million) Carrying amount Fair value
2017 2016 2017 2016
Financial liabilities
Amortised cost
Trade and other payables 2,463 2,971 2,463 2,971
Collaterised loans - 4,833 - 4,833
Bank loans (both current and non-current) 1,488 1,994 1,503 2,013
Total 3,951 9,798 3,966 9,817
Fair value through profit and loss
Derivative instruments in designated fair value hedge relationships 5 9
Total 5 9
Fair value through other comprehensive income
Derivative instruments in designated hedge-accounting relationships 3 8
Total 3 8
NOTE 10 FINANCIAL INSTRUMENTS (CONTINUED)
FAIR VALUE MEASUREMENTSThe fair value of derivative financial instruments is measured on the basis of quoted market prices of financial instruments traded in active markets (Level 1). If an active market exists, the fair value is based on the most recently observed market price at the end of the reporting period.
If a financial instrument is quoted in a market that is not active, LEO Pharma bases its valuation on the most recent transaction price. Adjustment is made for subsequent changes in market conditions, for instance by including transactions in similar financial instruments assumed to be motivated by normal business considerations.
If an active market does not exist, the fair value of standard and simple financial instruments, such as foreign exchange forward contracts, interest rate swaps, currency swaps and unlisted bonds and shares, is measured according to generally accepted valuation techniques (Level 2). Market-based parameters are used to measure the fair value.
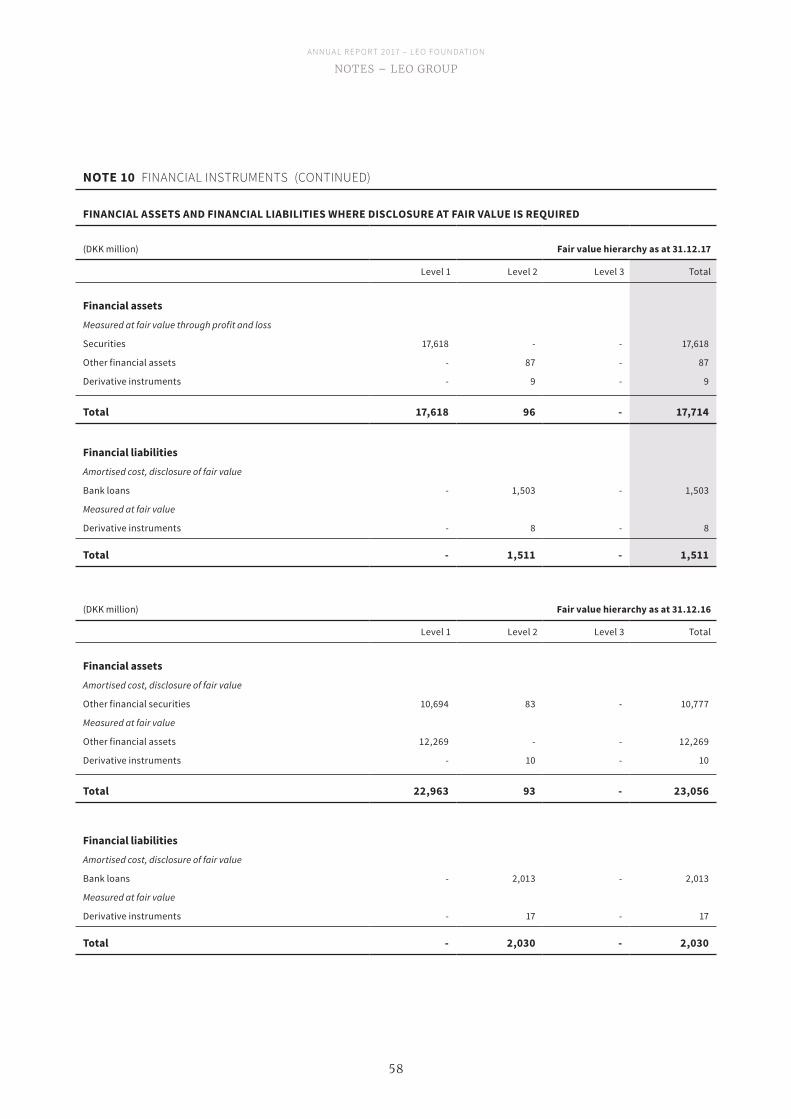
A N N UA L R EP O R T 2 017 – L EO F O U N DAT I O N
58
NOTES – LEO GROuP
FINANCIAL ASSETS AND FINANCIAL LIABILITIES WHERE DISCLOSURE AT FAIR VALUE IS REQUIRED
(DKK million) Fair value hierarchy as at 31.12.17
Level 1 Level 2 Level 3 Total
Financial assetsMeasured at fair value through profit and loss
Securities 17,618 - - 17,618
Other financial assets - 87 - 87
Derivative instruments - 9 - 9
Total 17,618 96 - 17,714
Financial liabilitiesAmortised cost, disclosure of fair value
Bank loans - 1,503 - 1,503
Measured at fair value
Derivative instruments - 8 - 8
Total - 1,511 - 1,511
(DKK million) Fair value hierarchy as at 31.12.16
Level 1 Level 2 Level 3 Total
Financial assetsAmortised cost, disclosure of fair value
Other financial securities 10,694 83 - 10,777
Measured at fair value
Other financial assets 12,269 - - 12,269
Derivative instruments - 10 - 10
Total 22,963 93 - 23,056
Financial liabilitiesAmortised cost, disclosure of fair value
Bank loans - 2,013 - 2,013
Measured at fair value
Derivative instruments - 17 - 17
Total - 2,030 - 2,030
NOTE 10 FINANCIAL INSTRUMENTS (CONTINUED)
A N N UA L R EP O R T 2 017 – L EO F O U N DAT I O N
59
NOTES – LEO GROuP
NOTE 11 DEFERRED TAX
ACCOUNTING POLICIESDeferred tax is recognised on all temporary differences between the carrying amounts of assets and liabilities and their tax bases, except for temporary differences arising on initial recognition from a transaction that is not a business combination and with the temporary difference ascertained at the time of the initial recognition affecting neither the financial result nor the taxable income. Deferred tax is measured on the basis of the income tax rates and tax rules in force in the respective countries on the balance sheet date. Change in deferred tax as a result of changed income tax rates or tax rules is recognised in the income statement.
Deferred tax assets, including the tax value of tax loss carryforwards, are recognised in the balance sheet at the value at which the assets are expected to be realised.
KEY ACCOUNTING ESTIMATES AND JUDGEMENTS The Executive Management’s estimate of future income according to budgets, forecasts, business plans and initiatives scheduled for the coming years supports the utilisation of the deferred tax assets within the foreseeable future.
The Group operates in a multinational tax environment. Complying with tax rules can be complex, as the interpretation of legislation and case law may not always be clear or may change over time. Transfer pricing disputes with the tax authorities may occur. Execu-tive Management judgement is applied to assess the possible effect of exposures and the possible outcome of disputes or interpre-tational uncertainties.
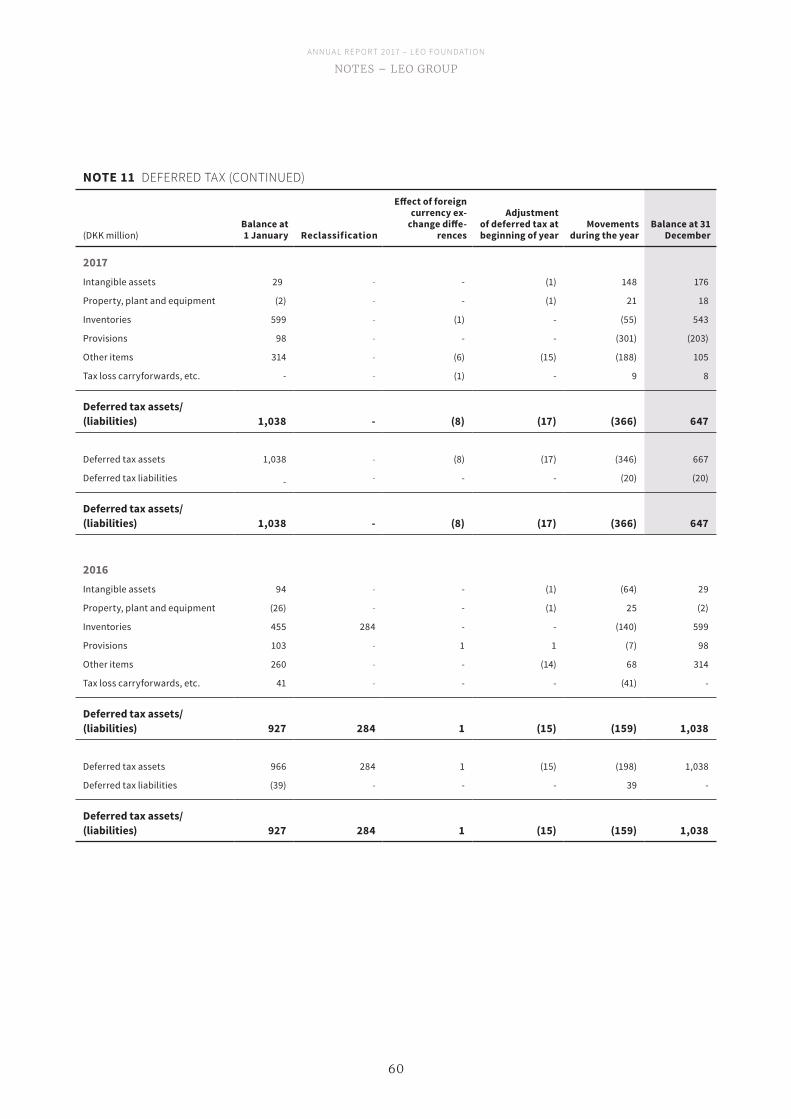
A N N UA L R EP O R T 2 017 – L EO F O U N DAT I O N
60
NOTES – LEO GROuP
(DKK million)Balance at 1 January Reclassification
Effect of foreign currency ex-
change diffe-rences
Adjustment of deferred tax at beginning of year
Movements during the year
Balance at 31 December
2017Intangible assets 29 - - (1) 148 176
Property, plant and equipment (2) - - (1) 21 18
Inventories 599 - (1) - (55) 543
Provisions 98 - - - (301) (203)
Other items 314 - (6) (15) (188) 105
Tax loss carryforwards, etc. - - (1) - 9 8
Deferred tax assets/ (liabilities) 1,038 - (8) (17) (366) 647
Deferred tax assets 1,038 - (8) (17) (346) 667
Deferred tax liabilities - - - - (20) (20)
Deferred tax assets/ (liabilities) 1,038 - (8) (17) (366) 647
2016Intangible assets 94 - - (1) (64) 29
Property, plant and equipment (26) - - (1) 25 (2)
Inventories 455 284 - - (140) 599
Provisions 103 - 1 1 (7) 98
Other items 260 - - (14) 68 314
Tax loss carryforwards, etc. 41 - - - (41) -
Deferred tax assets/ (liabilities) 927 284 1 (15) (159) 1,038
Deferred tax assets 966 284 1 (15) (198) 1,038
Deferred tax liabilities (39) - - - 39 -
Deferred tax assets/ (liabilities) 927 284 1 (15) (159) 1,038
NOTE 11 DEFERRED TAX (CONTINUED)
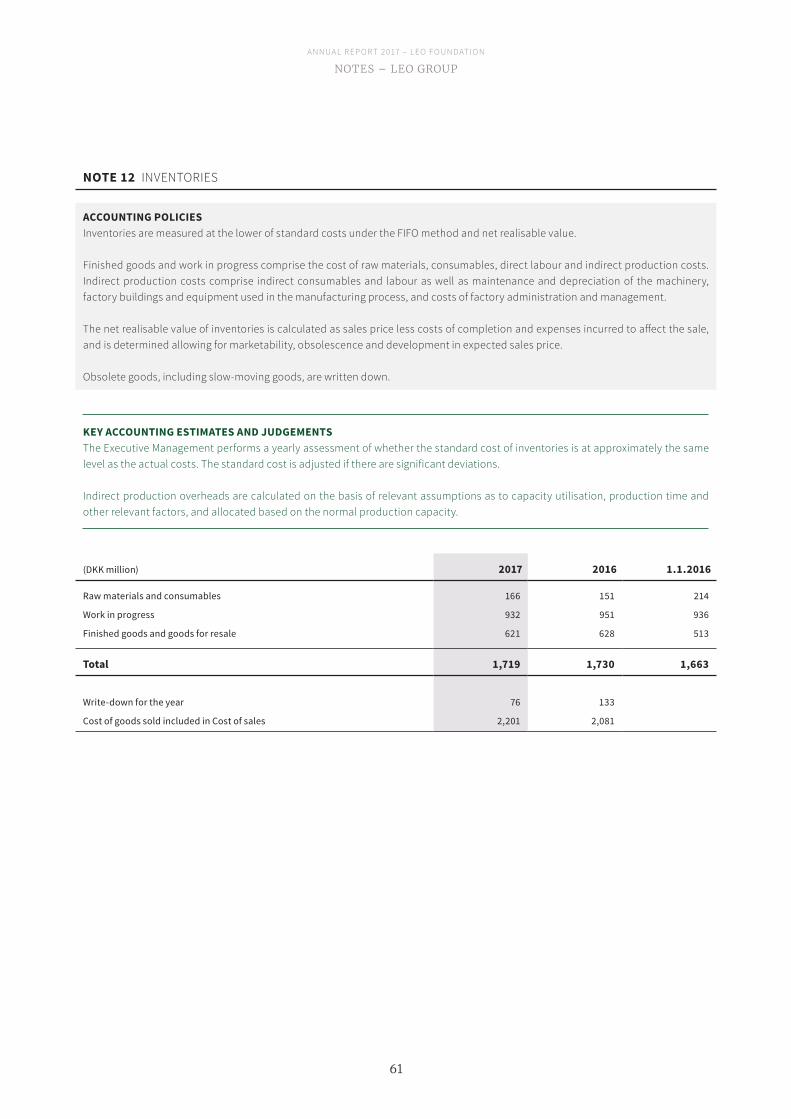
A N N UA L R EP O R T 2 017 – L EO F O U N DAT I O N
61
NOTES – LEO GROuP
NOTE 12 INVENTORIES
ACCOUNTING POLICIESInventories are measured at the lower of standard costs under the FIFO method and net realisable value.
Finished goods and work in progress comprise the cost of raw materials, consumables, direct labour and indirect production costs. Indirect production costs comprise indirect consumables and labour as well as maintenance and depreciation of the machinery, factory buildings and equipment used in the manufacturing process, and costs of factory administration and management.
The net realisable value of inventories is calculated as sales price less costs of completion and expenses incurred to affect the sale, and is determined allowing for marketability, obsolescence and development in expected sales price.
Obsolete goods, including slow-moving goods, are written down.
(DKK million) 2017 2016 1.1.2016
Raw materials and consumables 166 151 214
Work in progress 932 951 936
Finished goods and goods for resale 621 628 513
Total 1,719 1,730 1,663
Write-down for the year 76 133
Cost of goods sold included in Cost of sales 2,201 2,081
KEY ACCOUNTING ESTIMATES AND JUDGEMENTSThe Executive Management performs a yearly assessment of whether the standard cost of inventories is at approximately the same level as the actual costs. The standard cost is adjusted if there are significant deviations.
Indirect production overheads are calculated on the basis of relevant assumptions as to capacity utilisation, production time and other relevant factors, and allocated based on the normal production capacity.
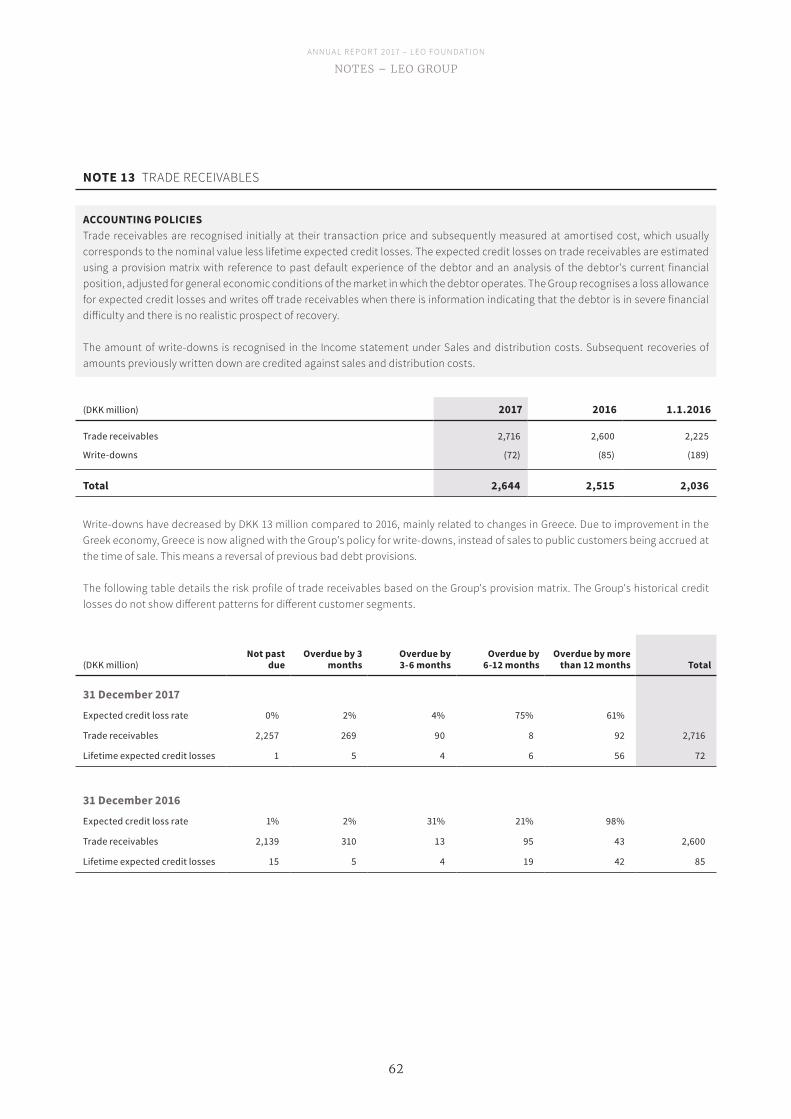
A N N UA L R EP O R T 2 017 – L EO F O U N DAT I O N
62
NOTES – LEO GROuP
(DKK million) 2017 2016 1.1.2016
Trade receivables 2,716 2,600 2,225
Write-downs (72) (85) (189)
Total 2,644 2,515 2,036
Write-downs have decreased by DKK 13 million compared to 2016, mainly related to changes in Greece. Due to improvement in the Greek economy, Greece is now aligned with the Group's policy for write-downs, instead of sales to public customers being accrued at the time of sale. This means a reversal of previous bad debt provisions.
The following table details the risk profile of trade receivables based on the Group's provision matrix. The Group's historical credit losses do not show different patterns for different customer segments.
(DKK million)Not past
due Overdue by 3
months Overdue by 3-6 months
Overdue by 6-12 months
Overdue by more than 12 months Total
31 December 2017Expected credit loss rate 0% 2% 4% 75% 61%
Trade receivables 2,257 269 90 8 92 2,716
Lifetime expected credit losses 1 5 4 6 56 72
31 December 2016Expected credit loss rate 1% 2% 31% 21% 98%
Trade receivables 2,139 310 13 95 43 2,600
Lifetime expected credit losses 15 5 4 19 42 85
NOTE 13 TRADE RECEIVABLES
ACCOUNTING POLICIESTrade receivables are recognised initially at their transaction price and subsequently measured at amortised cost, which usually corresponds to the nominal value less lifetime expected credit losses. The expected credit losses on trade receivables are estimated using a provision matrix with reference to past default experience of the debtor and an analysis of the debtor's current financial position, adjusted for general economic conditions of the market in which the debtor operates. The Group recognises a loss allowance for expected credit losses and writes off trade receivables when there is information indicating that the debtor is in severe financial difficulty and there is no realistic prospect of recovery.
The amount of write-downs is recognised in the Income statement under Sales and distribution costs. Subsequent recoveries of amounts previously written down are credited against sales and distribution costs.
A N N UA L R EP O R T 2 017 – L EO F O U N DAT I O N
63
NOTES – LEO GROuP
NOTE 14 FOUNDATION CAPITAL
The nominal value of the Foundation capital amounts to DKK 98 million (2016: DKK 52 million).
In December 2017, the LEO Pharma Research Foundation was consolidated with the LEO Foundation with financial effect from 1 January 2017. As a result of the consolidation, LEO Foundation's registered capital increased by DKK 46 million.
NOTE 15 RETIREMENT BENEFIT OBLIGATIONS
ACCOUNTING POLICIESDefined contribution plansPayments to defined contribution plans are recognised in the income statement in the period to which they relate, and any amounts payable are recognised in Other payables in the balance sheet.
Defined benefit plansWhere defined benefit plans are concerned, an annual actuarial calculation is made of the present value of future payments under the scheme. The present value is calculated based on assumptions relating to future developments in salary, interest rates, inflation, mortality and other factors. Present value is calculated only for the benefits to which the employees have earned a right through their employment with the Group. Plan assets are recognised to the extent the Group is able to obtain future economic benefits in the form of reimbursement from the pension scheme or reduction of future payments.
Pension costs for the year are recognised in the income statement based on actuarial estimates and financial expectations at the beginning of the year.
Any differences between expected developments in plan assets and defined benefit obligations on the one hand and the realised values calculated at the beginning of the year on the other are considered actuarial gains or losses. Actuarial gains and losses are recognised in Other comprehensive income. Past service costs are recognised in the income statement as incurred.
DEFINED CONTRIBUTION PLANSThe Group operates a number of defined contribution plans throughout the world. These plans are externally funded in entities that are legally separate from the Group.
DEFINED BENEFIT PLANSIn a few countries, the Group operates defined benefit plans. The most significant of these are operated in Ireland, the UK and France. The defined benefit plans expose the Group to actuarial risks, such as longevity, interest rate, salary, market and currency risks.
The plans in Ireland and the UK are funded and constituted under a trust whose assets are legally separated from those of the Group. Under the scheme-funding regime introduced by the UK Pensions Act 2004, the trustees are required to carry out regular scheme-funding valuations for the plans and establish a schedule of contributions and a recovery plan when there is a shortfall in the plan. The plans entitle the employees to an annual pension on retirement based on the service and salary level up to retirement.
The plan in France is funded and covered by an insurance contract whose assets are legally separated from those of the Group. The plan is defined by the collective agreement of "Pharmacie; Industrie" and covers all employees, who are entitled to a lump-sum payment on retirement based on the service and salary level up to retirement.
ENHANCED TRANSFER VALUE IN IRELANDIn 2017, the employees in Ireland were offered an enhanced transfer value (ETV), which was exercised and carried out during the year. The ETV resulted in a net settlement gain of DKK 98 million, recognised under Other operating income. As of 31 December 2017, the net retirement benefit obligation in Ireland amounted to DKK 164 million (2016: DKK 535 million).
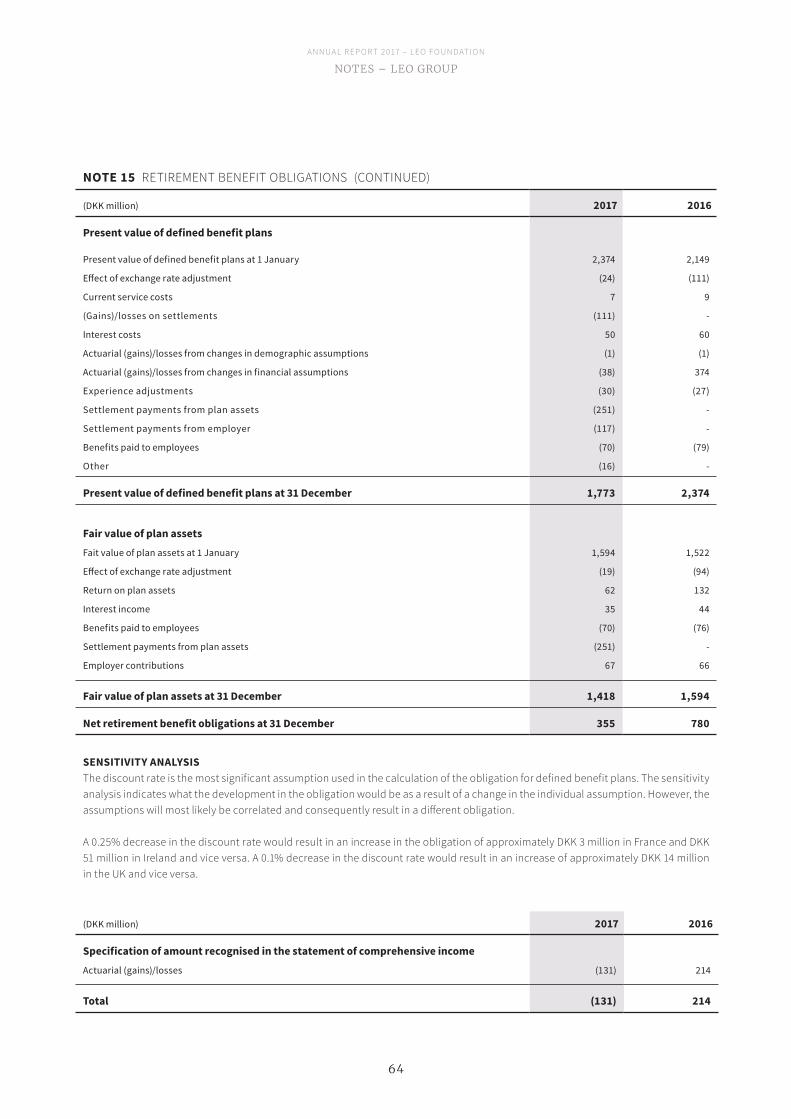
A N N UA L R EP O R T 2 017 – L EO F O U N DAT I O N
64
NOTES – LEO GROuP
NOTE 15 RETIREMENT BENEFIT OBLIGATIONS (CONTINUED)
(DKK million) 2017 2016
Present value of defined benefit plans
Present value of defined benefit plans at 1 January 2,374 2,149
Effect of exchange rate adjustment (24) (111)
Current service costs 7 9
(Gains)/losses on settlements (111) -
Interest costs 50 60
Actuarial (gains)/losses from changes in demographic assumptions (1) (1)
Actuarial (gains)/losses from changes in financial assumptions (38) 374
Experience adjustments (30) (27)
Settlement payments from plan assets (251) -
Settlement payments from employer (117) -
Benefits paid to employees (70) (79)
Other (16) -
Present value of defined benefit plans at 31 December 1,773 2,374
Fair value of plan assetsFait value of plan assets at 1 January 1,594 1,522
Effect of exchange rate adjustment (19) (94)
Return on plan assets 62 132
Interest income 35 44
Benefits paid to employees (70) (76)
Settlement payments from plan assets (251) -
Employer contributions 67 66
Fair value of plan assets at 31 December 1,418 1,594
Net retirement benefit obligations at 31 December 355 780
SENSITIVITY ANALYSISThe discount rate is the most significant assumption used in the calculation of the obligation for defined benefit plans. The sensitivity analysis indicates what the development in the obligation would be as a result of a change in the individual assumption. However, the assumptions will most likely be correlated and consequently result in a different obligation.
A 0.25% decrease in the discount rate would result in an increase in the obligation of approximately DKK 3 million in France and DKK 51 million in Ireland and vice versa. A 0.1% decrease in the discount rate would result in an increase of approximately DKK 14 million in the UK and vice versa.
(DKK million) 2017 2016
Specification of amount recognised in the statement of comprehensive incomeActuarial (gains)/losses (131) 214
Total (131) 214
A N N UA L R EP O R T 2 017 – L EO F O U N DAT I O N
65
NOTES – LEO GROuP
NOTE 16 PROVISIONS
ACCOUNTING POLICIESProvisions are recognised when, as a result of events before or at the balance sheet date, the Group has a legal or a constructive obligation, it is probable that there may be an outflow of economic resources to settle the obligation and the obligation can be measured reliably. Provisions are measured as the best estimate of the costs required to settle the liabilities at the balance sheet date.
Provisions for sales deductions and returns are recognised at the time the related revenues are recognised. Unsettled deductions and returns are recognised as Provisions when the timing or amount is uncertain. Where absolute amounts are known, the deductions are recognised as Other liabilities.
Staff-related provisions include employee benefits such as long-term incentive programmes and long-service awards as well as provisions for restructuring. Provisions for restructuring are made only for liabilities set out in a specific restructuring plan, either by starting to implement the plan or announcing its main components.
Other provisions consist of different types of other provisions, including provisions for legal disputes and other restructuring provisions.
KEY ACCOUNTING ESTIMATES AND JUDGEMENTSProvisions for legal disputesProvisions for legal disputes consist of various types of provisions linked to ongoing legal disputes. The Executive Management makes judgements about provisions and contingencies, including the probability of pending and potential future litigation outcomes, which, by their very nature, are dependent on inherently uncertain future events. When determining likely outcomes of litigations, etc., the Executive Management considers the input of external counsels on each case, as well as known outcomes in case law.
Although the Executive Management believes that the total provisions for legal proceedings are adequate based on currently available information, there can be no assurance that there will not be any changes in facts or matters, or that any future lawsuits, claims, proceedings or investigations will not be material.
Provisions for sales deductionsSales discounts and rebates are predominantly issued in the US in connection with the US Federal and State Government Healthcare programmes, primarily commercial rebates, Copay schemes, Medicare and Medicaid.
The Executive Management's estimate of sales discounts and rebates is based on a calculation which includes a combination of historical utilisation data, combined with expectations in relation to the development in sales and utilisation. Furthermore, specific circumstances regarding the different programmes are considered. The obligations for discounts and rebates are incurred at the time the sale is recorded. However, the actual discount or rebate related to a specific sale may be invoiced six to nine months later.
The Group considers the provisions established for sales discounts and rebates to be reasonable and appropriate based on currently available information. However, the actual amount of discounts and rebates may differ from the amounts estimated by Executive Management as more detailed information becomes available.
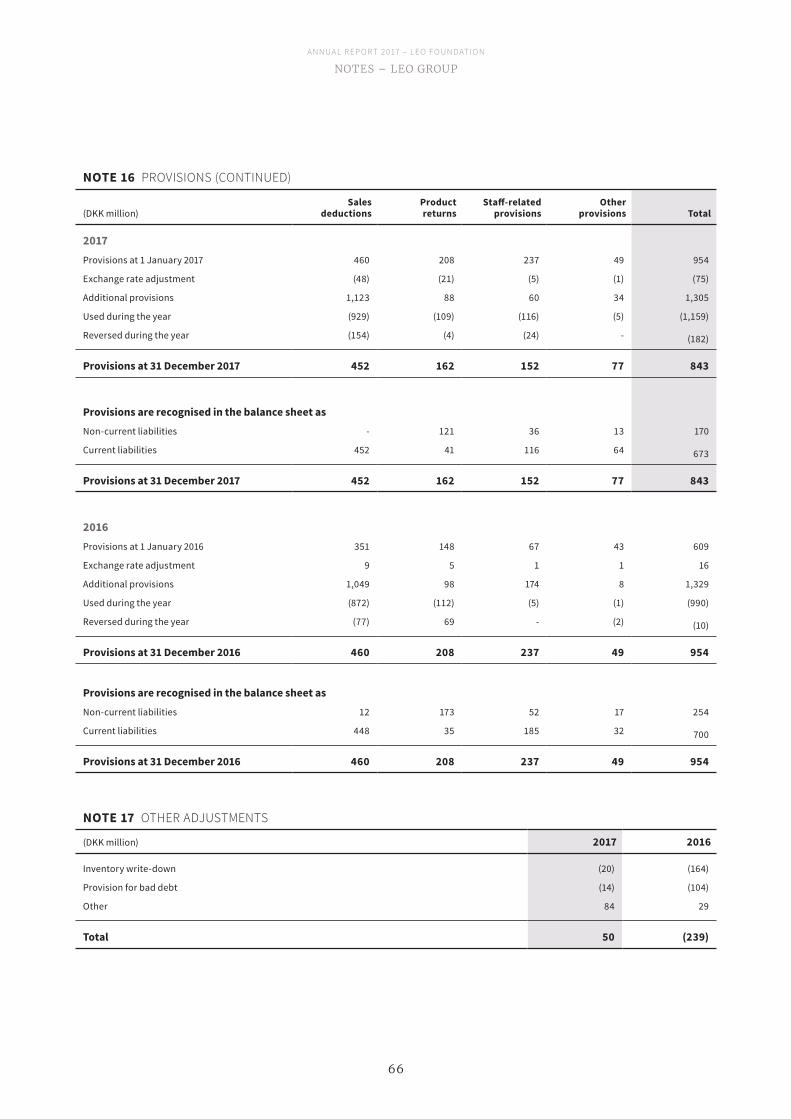
A N N UA L R EP O R T 2 017 – L EO F O U N DAT I O N
66
NOTES – LEO GROuP
(DKK million)Sales
deductionsProduct returns
Staff-related provisions
Other provisions Total
2017Provisions at 1 January 2017 460 208 237 49 954
Exchange rate adjustment (48) (21) (5) (1) (75)
Additional provisions 1,123 88 60 34 1,305
Used during the year (929) (109) (116) (5) (1,159)
Reversed during the year (154) (4) (24) - (182)
Provisions at 31 December 2017 452 162 152 77 843
Provisions are recognised in the balance sheet asNon-current liabilities - 121 36 13 170
Current liabilities 452 41 116 64 673
Provisions at 31 December 2017 452 162 152 77 843
2016Provisions at 1 January 2016 351 148 67 43 609
Exchange rate adjustment 9 5 1 1 16
Additional provisions 1,049 98 174 8 1,329
Used during the year (872) (112) (5) (1) (990)
Reversed during the year (77) 69 - (2) (10)
Provisions at 31 December 2016 460 208 237 49 954
Provisions are recognised in the balance sheet asNon-current liabilities 12 173 52 17 254
Current liabilities 448 35 185 32 700
Provisions at 31 December 2016 460 208 237 49 954
NOTE 16 PROVISIONS (CONTINUED)
NOTE 17 OTHER ADJUSTMENTS
(DKK million) 2017 2016
Inventory write-down (20) (164)
Provision for bad debt (14) (104)
Other 84 29
Total 50 (239)
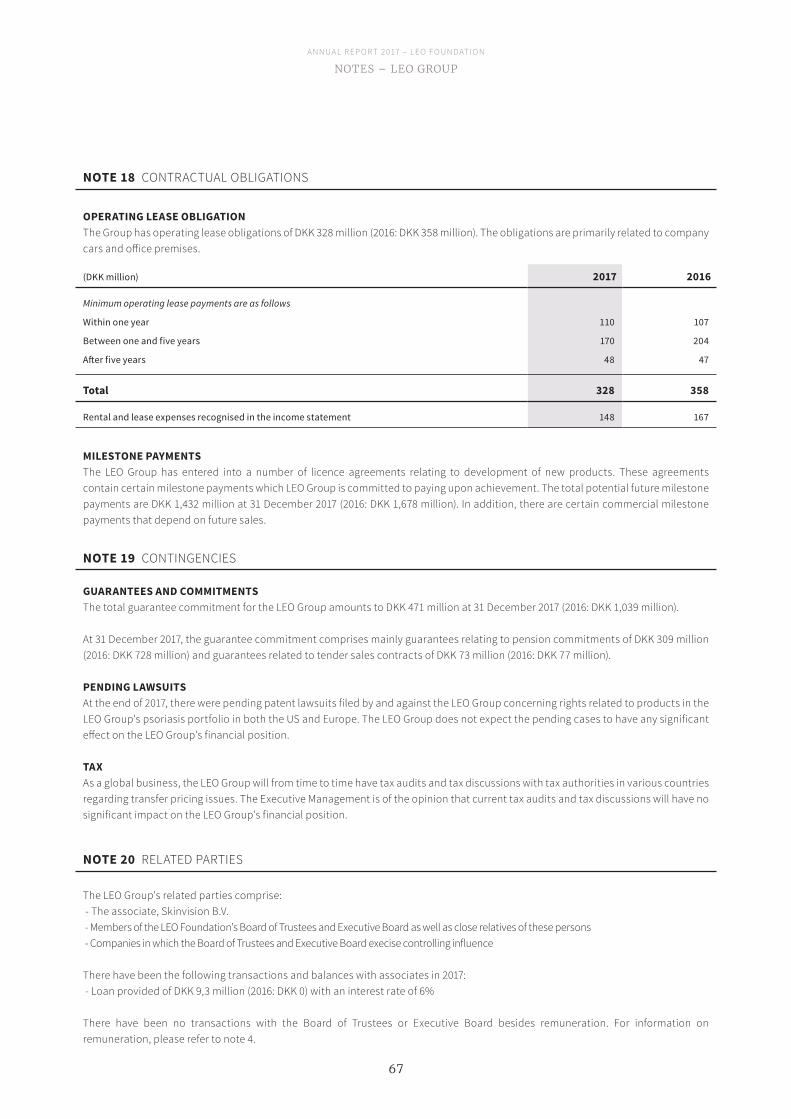
A N N UA L R EP O R T 2 017 – L EO F O U N DAT I O N
67
NOTES – LEO GROuP
OPERATING LEASE OBLIGATIONThe Group has operating lease obligations of DKK 328 million (2016: DKK 358 million). The obligations are primarily related to company cars and office premises.
MILESTONE PAYMENTSThe LEO Group has entered into a number of licence agreements relating to development of new products. These agreements contain certain milestone payments which LEO Group is committed to paying upon achievement. The total potential future milestone payments are DKK 1,432 million at 31 December 2017 (2016: DKK 1,678 million). In addition, there are certain commercial milestone payments that depend on future sales.
NOTE 18 CONTRACTUAL OBLIGATIONS
(DKK million) 2017 2016
Minimum operating lease payments are as follows
Within one year 110 107
Between one and five years 170 204
After five years 48 47
Total 328 358
Rental and lease expenses recognised in the income statement 148 167
NOTE 19 CONTINGENCIES
GUARANTEES AND COMMITMENTSThe total guarantee commitment for the LEO Group amounts to DKK 471 million at 31 December 2017 (2016: DKK 1,039 million).
At 31 December 2017, the guarantee commitment comprises mainly guarantees relating to pension commitments of DKK 309 million (2016: DKK 728 million) and guarantees related to tender sales contracts of DKK 73 million (2016: DKK 77 million).
PENDING LAWSUITSAt the end of 2017, there were pending patent lawsuits filed by and against the LEO Group concerning rights related to products in the LEO Group's psoriasis portfolio in both the US and Europe. The LEO Group does not expect the pending cases to have any significant effect on the LEO Group's financial position.
TAXAs a global business, the LEO Group will from time to time have tax audits and tax discussions with tax authorities in various countries regarding transfer pricing issues. The Executive Management is of the opinion that current tax audits and tax discussions will have no significant impact on the LEO Group's financial position.
NOTE 20 RELATED PARTIES
The LEO Group's related parties comprise: - The associate, Skinvision B.V. - Members of the LEO Foundation’s Board of Trustees and Executive Board as well as close relatives of these persons - Companies in which the Board of Trustees and Executive Board execise controlling influence
There have been the following transactions and balances with associates in 2017: - Loan provided of DKK 9,3 million (2016: DKK 0) with an interest rate of 6%
There have been no transactions with the Board of Trustees or Executive Board besides remuneration. For information on remuneration, please refer to note 4.
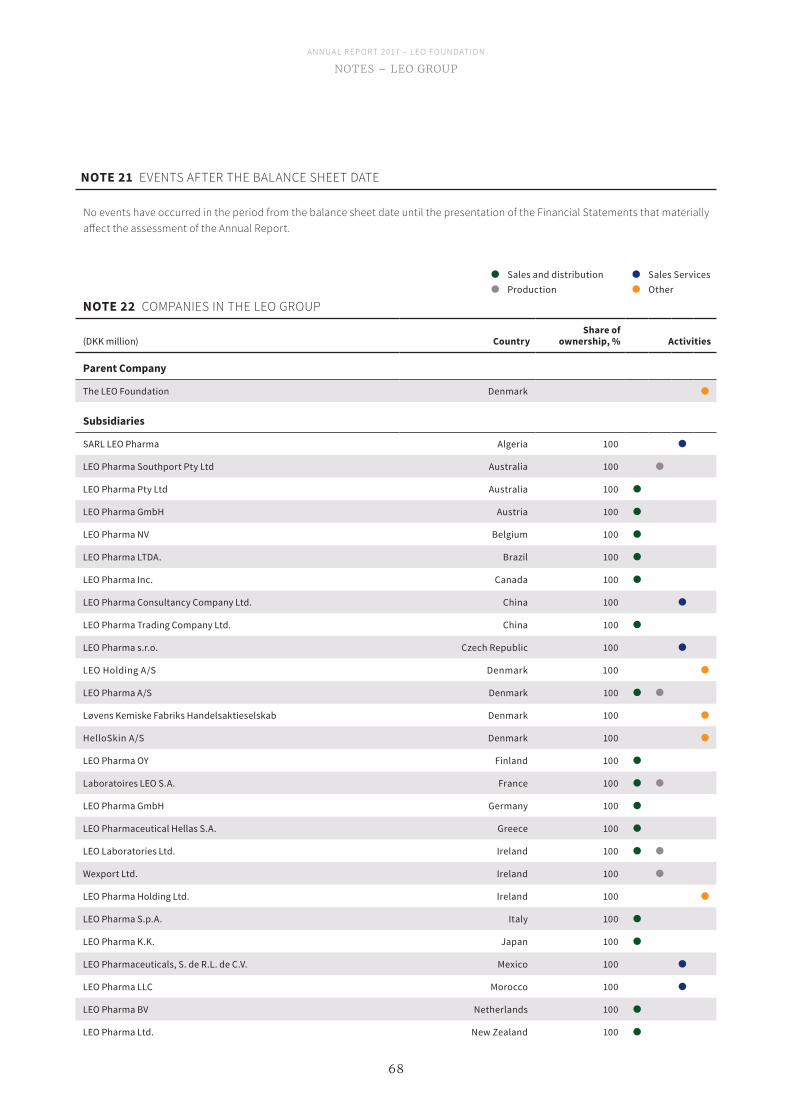
A N N UA L R EP O R T 2 017 – L EO F O U N DAT I O N
68
NOTES – LEO GROuP
NOTE 21 EVENTS AFTER THE BALANCE SHEET DATE
No events have occurred in the period from the balance sheet date until the presentation of the Financial Statements that materially affect the assessment of the Annual Report.
NOTE 22 COMPANIES IN THE LEO GROUP
(DKK million) CountryShare of
ownership, % Activities
Parent Company
The LEO Foundation Denmark
Subsidiaries
SARL LEO Pharma Algeria 100
LEO Pharma Southport Pty Ltd Australia 100
LEO Pharma Pty Ltd Australia 100
LEO Pharma GmbH Austria 100
LEO Pharma NV Belgium 100
LEO Pharma LTDA. Brazil 100
LEO Pharma Inc. Canada 100
LEO Pharma Consultancy Company Ltd. China 100
LEO Pharma Trading Company Ltd. China 100
LEO Pharma s.r.o. Czech Republic 100
LEO Holding A/S Denmark 100
LEO Pharma A/S Denmark 100
Løvens Kemiske Fabriks Handelsaktieselskab Denmark 100
HelloSkin A/S Denmark 100
LEO Pharma OY Finland 100
Laboratoires LEO S.A. France 100
LEO Pharma GmbH Germany 100
LEO Pharmaceutical Hellas S.A. Greece 100
LEO Laboratories Ltd. Ireland 100
Wexport Ltd. Ireland 100
LEO Pharma Holding Ltd. Ireland 100
LEO Pharma S.p.A. Italy 100
LEO Pharma K.K. Japan 100
LEO Pharmaceuticals, S. de R.L. de C.V. Mexico 100
LEO Pharma LLC Morocco 100
LEO Pharma BV Netherlands 100
LEO Pharma Ltd. New Zealand 100
Sales and distribution Production
Sales Services Other
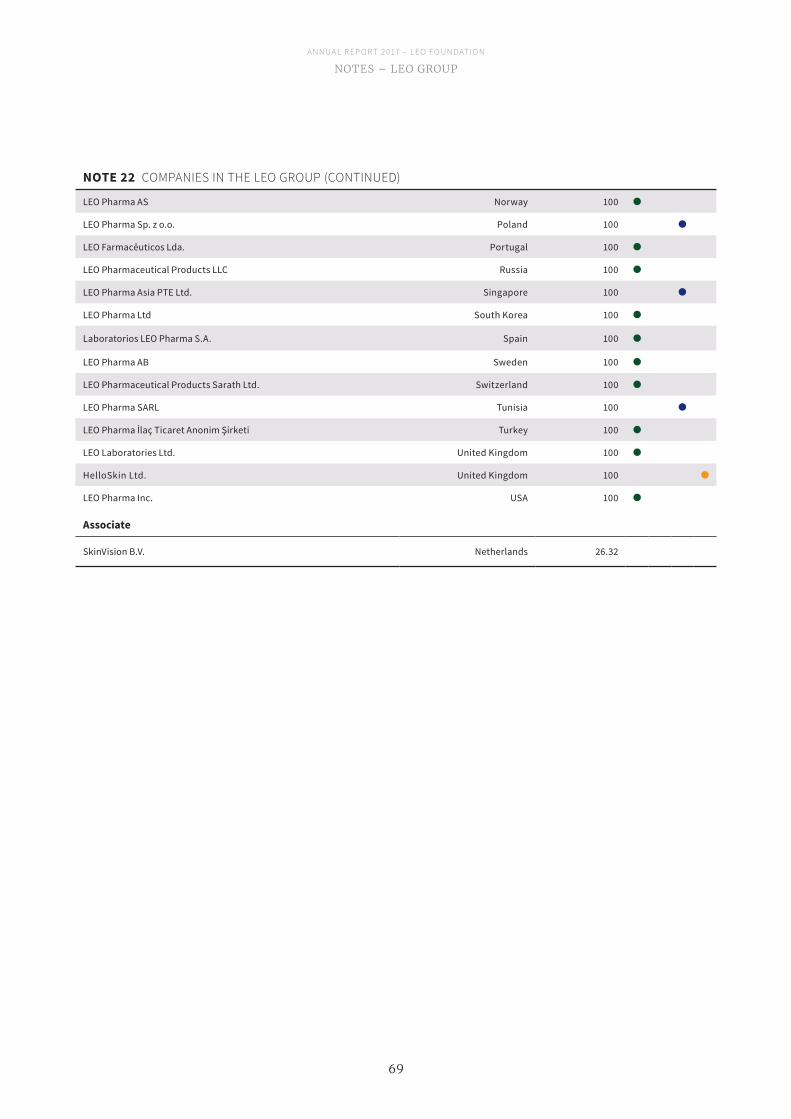
A N N UA L R EP O R T 2 017 – L EO F O U N DAT I O N
69
NOTES – LEO GROuP
LEO Pharma AS Norway 100
LEO Pharma Sp. z o.o. Poland 100
LEO Farmacêuticos Lda. Portugal 100
LEO Pharmaceutical Products LLC Russia 100
LEO Pharma Asia PTE Ltd. Singapore 100
LEO Pharma Ltd South Korea 100
Laboratorios LEO Pharma S.A. Spain 100
LEO Pharma AB Sweden 100
LEO Pharmaceutical Products Sarath Ltd. Switzerland 100
LEO Pharma SARL Tunisia 100
LEO Pharma İlaç Ticaret Anonim Şirketi Turkey 100
LEO Laboratories Ltd. United Kingdom 100
HelloSkin Ltd. United Kingdom 100
LEO Pharma Inc. USA 100
Associate
SkinVision B.V. Netherlands 26.32
NOTE 22 COMPANIES IN THE LEO GROUP (CONTINUED)

A N N UA L R EP O R T 2 017 – L EO F O U N DAT I O N
70
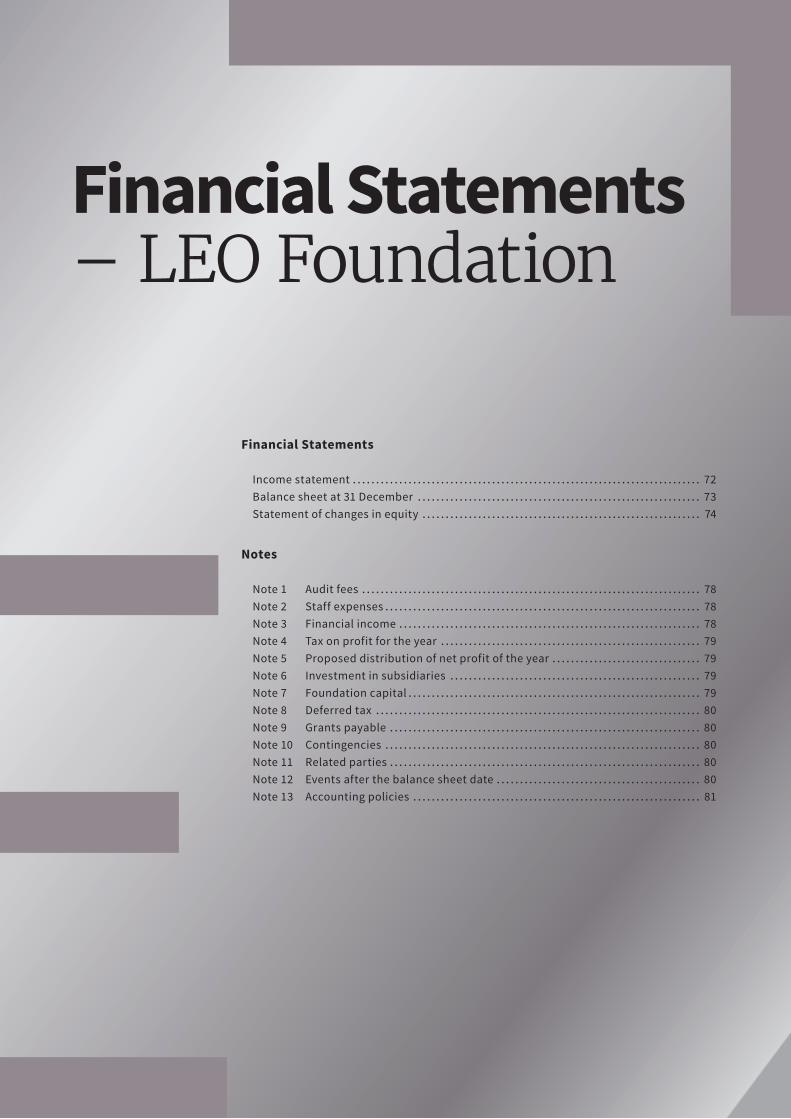
A N N UA L R EP O R T 2 017 – L EO F O U N DAT I O N
71
Financial Statements – LEO Foundation
Financial Statements Income statement . . . . . . . . . . . . . . . . . . . . . . . . . . . . . . . . . . . . . . . . . . . . . . . . . . . . . . . . . . . . . . . . . . . . . . . . . . . 72Balance sheet at 31 December . . . . . . . . . . . . . . . . . . . . . . . . . . . . . . . . . . . . . . . . . . . . . . . . . . . . . . . . . . . . . 73Statement of changes in equity . . . . . . . . . . . . . . . . . . . . . . . . . . . . . . . . . . . . . . . . . . . . . . . . . . . . . . . . . . . . 74
Notes
Note 1 Audit fees . . . . . . . . . . . . . . . . . . . . . . . . . . . . . . . . . . . . . . . . . . . . . . . . . . . . . . . . . . . . . . . . . . . . . . . . . 78Note 2 Staff expenses . . . . . . . . . . . . . . . . . . . . . . . . . . . . . . . . . . . . . . . . . . . . . . . . . . . . . . . . . . . . . . . . . . . . 78 Note 3 Financial income . . . . . . . . . . . . . . . . . . . . . . . . . . . . . . . . . . . . . . . . . . . . . . . . . . . . . . . . . . . . . . . . . 78Note 4 Tax on profit for the year . . . . . . . . . . . . . . . . . . . . . . . . . . . . . . . . . . . . . . . . . . . . . . . . . . . . . . . . 79Note 5 Proposed distribution of net profit of the year . . . . . . . . . . . . . . . . . . . . . . . . . . . . . . . . 79Note 6 Investment in subsidiaries . . . . . . . . . . . . . . . . . . . . . . . . . . . . . . . . . . . . . . . . . . . . . . . . . . . . . . 79 Note 7 Foundation capital . . . . . . . . . . . . . . . . . . . . . . . . . . . . . . . . . . . . . . . . . . . . . . . . . . . . . . . . . . . . . . . 79 Note 8 Deferred tax . . . . . . . . . . . . . . . . . . . . . . . . . . . . . . . . . . . . . . . . . . . . . . . . . . . . . . . . . . . . . . . . . . . . . . 80Note 9 Grants payable . . . . . . . . . . . . . . . . . . . . . . . . . . . . . . . . . . . . . . . . . . . . . . . . . . . . . . . . . . . . . . . . . . . 80Note 10 Contingencies . . . . . . . . . . . . . . . . . . . . . . . . . . . . . . . . . . . . . . . . . . . . . . . . . . . . . . . . . . . . . . . . . . . . 80Note 11 Related parties . . . . . . . . . . . . . . . . . . . . . . . . . . . . . . . . . . . . . . . . . . . . . . . . . . . . . . . . . . . . . . . . . . . 80Note 12 Events after the balance sheet date . . . . . . . . . . . . . . . . . . . . . . . . . . . . . . . . . . . . . . . . . . . . 80Note 13 Accounting policies . . . . . . . . . . . . . . . . . . . . . . . . . . . . . . . . . . . . . . . . . . . . . . . . . . . . . . . . . . . . . . 81
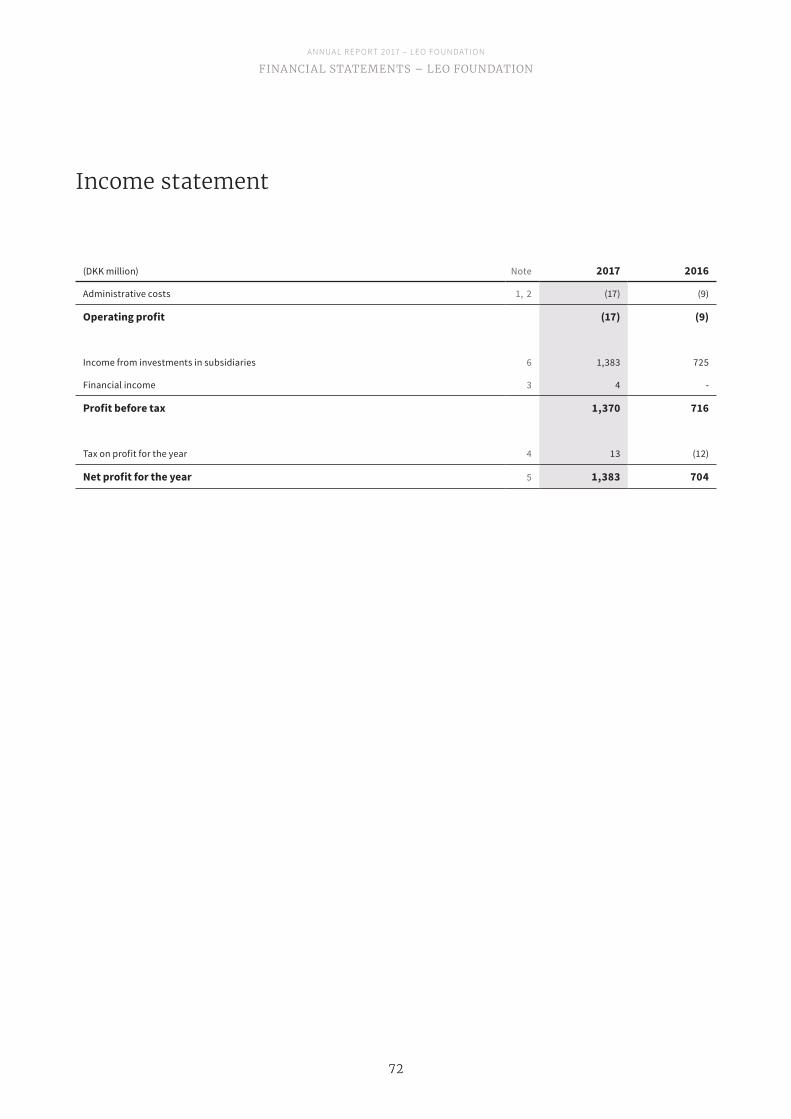
A N N UA L R EP O R T 2 017 – L EO F O U N DAT I O N
72
FINANCIAL STATEMENTS – LEO FOuNDATION
Income statement
(DKK million) Note 2017 2016
Administrative costs 1, 2 (17) (9)
Operating profit (17) (9)
Income from investments in subsidiaries 6 1,383 725
Financial income 3 4 -
Profit before tax 1,370 716
Tax on profit for the year 4 13 (12)
Net profit for the year 5 1,383 704
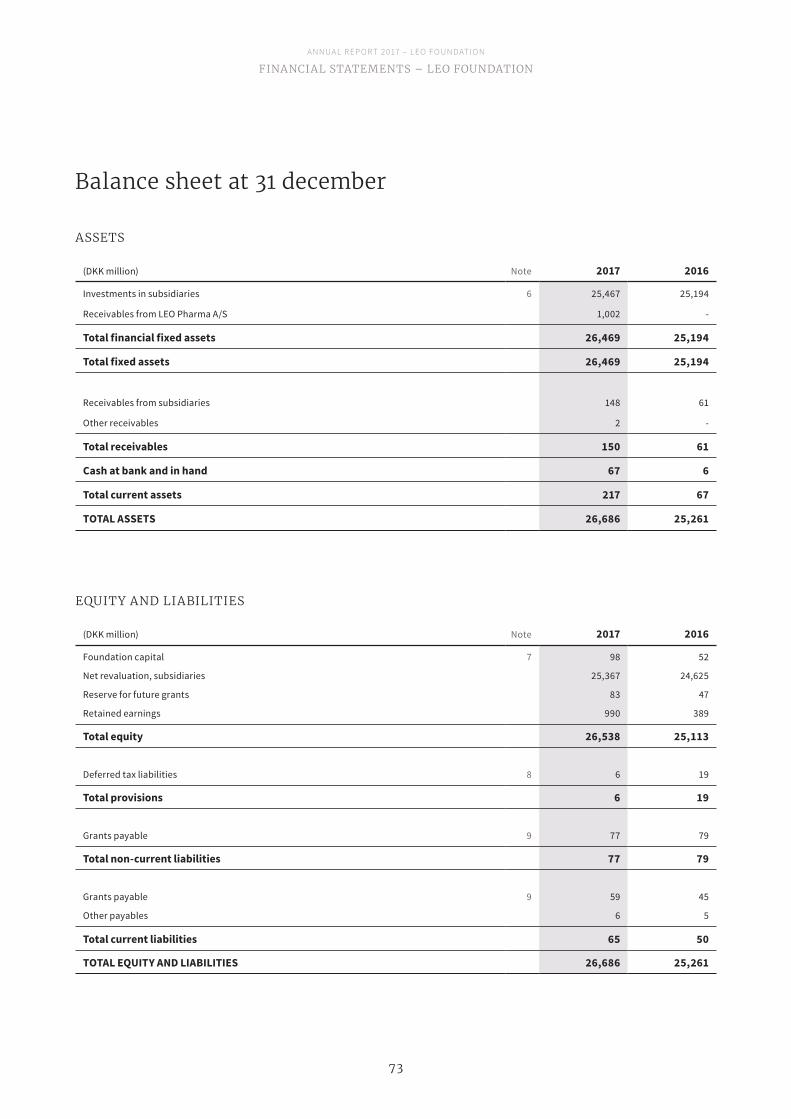
A N N UA L R EP O R T 2 017 – L EO F O U N DAT I O N
73
FINANCIAL STATEMENTS – LEO FOuNDATION
Balance sheet at 31 december
(DKK million) Note 2017 2016
Investments in subsidiaries 6 25,467 25,194
Receivables from LEO Pharma A/S 1,002 -
Total financial fixed assets 26,469 25,194
Total fixed assets 26,469 25,194
Receivables from subsidiaries 148 61
Other receivables 2 -
Total receivables 150 61
Cash at bank and in hand 67 6
Total current assets 217 67
TOTAL ASSETS 26,686 25,261
(DKK million) Note 2017 2016
Foundation capital 7 98 52
Net revaluation, subsidiaries 25,367 24,625
Reserve for future grants 83 47
Retained earnings 990 389
Total equity 26,538 25,113
Deferred tax liabilities 8 6 19
Total provisions 6 19
Grants payable 9 77 79
Total non-current liabilities 77 79
Grants payable 9 59 45
Other payables 6 5
Total current liabilities 65 50
TOTAL EQUITY AND LIABILITIES 26,686 25,261
EQUITY AND LIABILITIES
ASSETS
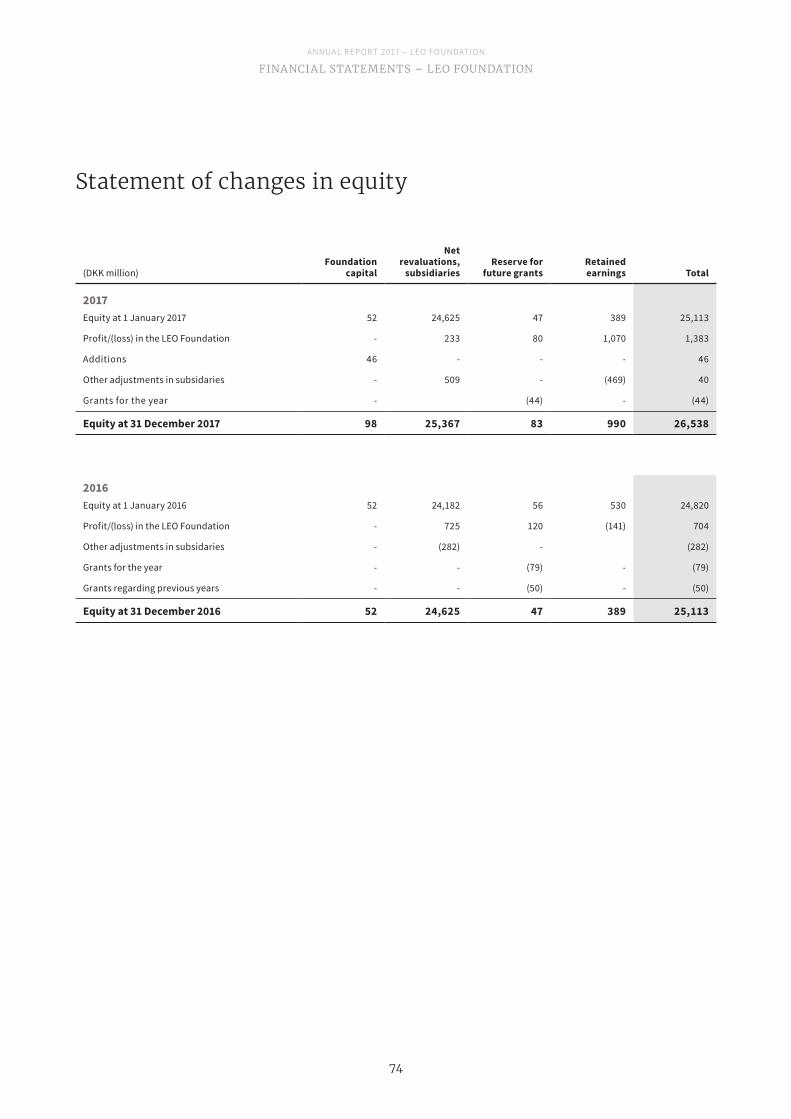
A N N UA L R EP O R T 2 017 – L EO F O U N DAT I O N
74
FINANCIAL STATEMENTS – LEO FOuNDATION
Statement of changes in equity
(DKK million)Foundation
capital
Net revaluations,
subsidiariesReserve for
future grants Retained earnings Total
2017Equity at 1 January 2017 52 24,625 47 389 25,113
Profit/(loss) in the LEO Foundation - 233 80 1,070 1,383
Additions 46 - - - 46
Other adjustments in subsidaries - 509 - (469) 40
Grants for the year - (44) - (44)
Equity at 31 December 2017 98 25,367 83 990 26,538
2016Equity at 1 January 2016 52 24,182 56 530 24,820
Profit/(loss) in the LEO Foundation - 725 120 (141) 704
Other adjustments in subsidaries - (282) - (282)
Grants for the year - - (79) - (79)
Grants regarding previous years - - (50) - (50)
Equity at 31 December 2016 52 24,625 47 389 25,113

A N N UA L R EP O R T 2 017 – L EO F O U N DAT I O N
75

A N N UA L R EP O R T 2 017 – L EO F O U N DAT I O N
76

A N N UA L R EP O R T 2 017 – L EO F O U N DAT I O N
77
Notes – LEO Foundation
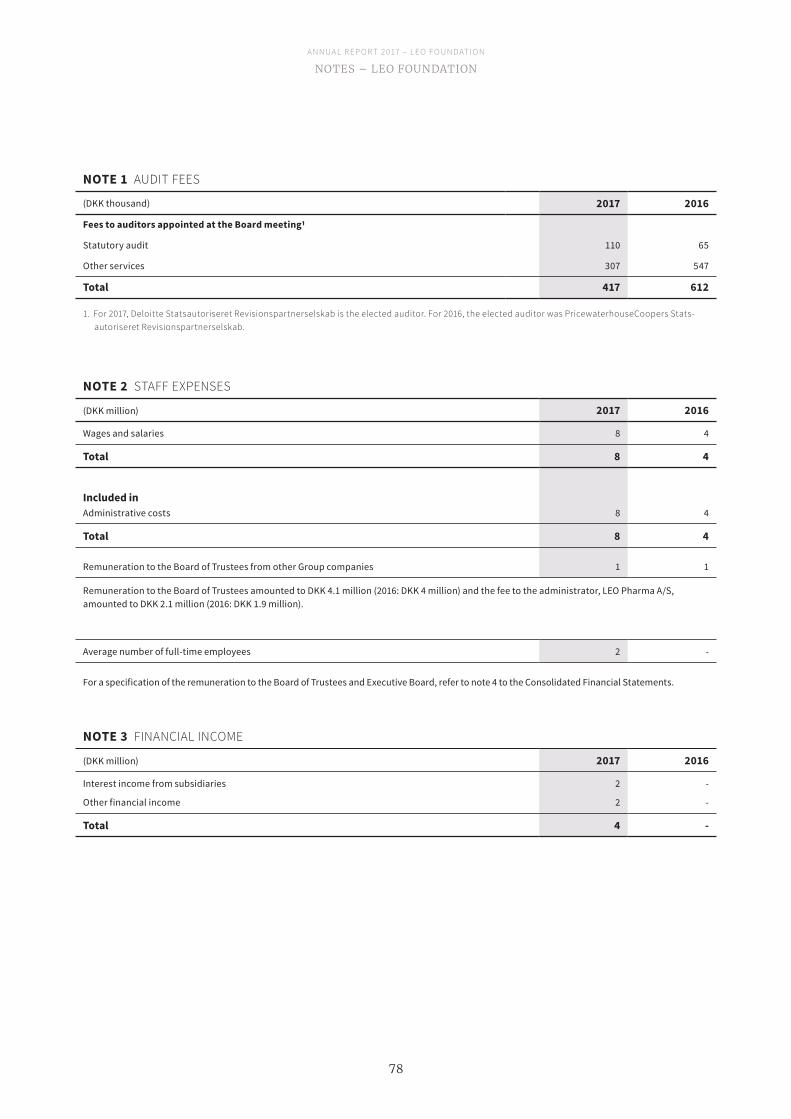
A N N UA L R EP O R T 2 017 – L EO F O U N DAT I O N
78
NOTES – LEO FOuNDATION
NOTE 1 AUDIT FEES
(DKK thousand) 2017 2016
Fees to auditors appointed at the Board meeting1
Statutory audit 110 65
Other services 307 547
Total 417 612
1. For 2017, Deloitte Statsautoriseret Revisionspartnerselskab is the elected auditor. For 2016, the elected auditor was PricewaterhouseCoopers Stats-autoriseret Revisionspartnerselskab.
NOTE 2 STAFF EXPENSES
(DKK million) 2017 2016
Wages and salaries 8 4
Total 8 4
Included inAdministrative costs 8 4
Total 8 4
Remuneration to the Board of Trustees from other Group companies 1 1
Remuneration to the Board of Trustees amounted to DKK 4.1 million (2016: DKK 4 million) and the fee to the administrator, LEO Pharma A/S, amounted to DKK 2.1 million (2016: DKK 1.9 million).
Average number of full-time employees 2 -
For a specification of the remuneration to the Board of Trustees and Executive Board, refer to note 4 to the Consolidated Financial Statements.
NOTE 3 FINANCIAL INCOME
(DKK million) 2017 2016
Interest income from subsidiaries 2 -
Other financial income 2 -
Total 4 -
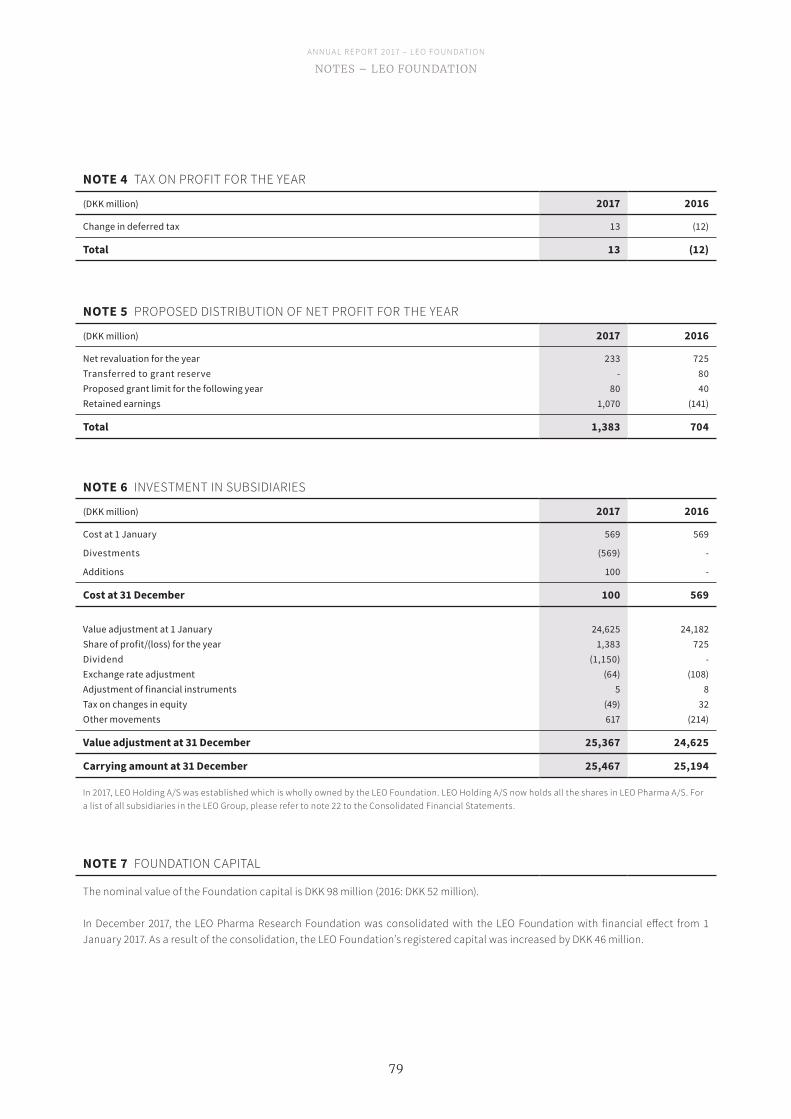
A N N UA L R EP O R T 2 017 – L EO F O U N DAT I O N
79
NOTES – LEO FOuNDATION
NOTE 4 TAX ON PROFIT FOR THE YEAR
(DKK million) 2017 2016
Change in deferred tax 13 (12)
Total 13 (12)
NOTE 5 PROPOSED DISTRIBUTION OF NET PROFIT FOR THE YEAR
(DKK million) 2017 2016
Net revaluation for the year 233 725 Transferred to grant reserve - 80Proposed grant limit for the following year 80 40 Retained earnings 1,070 (141)
Total 1,383 704
NOTE 6 INVESTMENT IN SUBSIDIARIES
(DKK million) 2017 2016
Cost at 1 January 569 569
Divestments (569) -
Additions 100 -
Cost at 31 December 100 569
Value adjustment at 1 January 24,625 24,182Share of profit/(loss) for the year 1,383 725 Dividend (1,150) -Exchange rate adjustment (64) (108)Adjustment of financial instruments 5 8Tax on changes in equity (49) 32 Other movements 617 (214)
Value adjustment at 31 December 25,367 24,625
Carrying amount at 31 December 25,467 25,194
In 2017, LEO Holding A/S was established which is wholly owned by the LEO Foundation. LEO Holding A/S now holds all the shares in LEO Pharma A/S. For a list of all subsidiaries in the LEO Group, please refer to note 22 to the Consolidated Financial Statements.
NOTE 7 FOUNDATION CAPITAL
The nominal value of the Foundation capital is DKK 98 million (2016: DKK 52 million).
In December 2017, the LEO Pharma Research Foundation was consolidated with the LEO Foundation with financial effect from 1 January 2017. As a result of the consolidation, the LEO Foundation’s registered capital was increased by DKK 46 million.
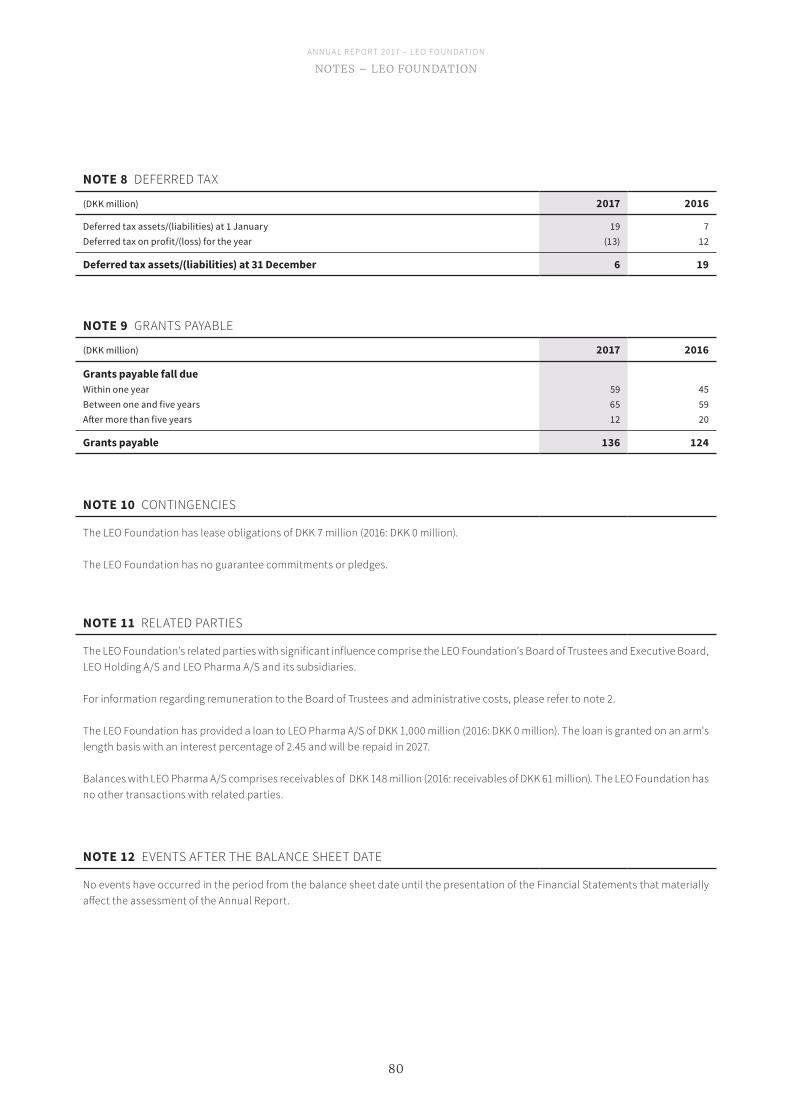
A N N UA L R EP O R T 2 017 – L EO F O U N DAT I O N
80
NOTES – LEO FOuNDATION
NOTE 9 GRANTS PAYABLE
(DKK million) 2017 2016
Grants payable fall dueWithin one year 59 45Between one and five years 65 59After more than five years 12 20
Grants payable 136 124
NOTE 10 CONTINGENCIES
The LEO Foundation has lease obligations of DKK 7 million (2016: DKK 0 million).
The LEO Foundation has no guarantee commitments or pledges.
NOTE 11 RELATED PARTIES
The LEO Foundation’s related parties with significant influence comprise the LEO Foundation’s Board of Trustees and Executive Board, LEO Holding A/S and LEO Pharma A/S and its subsidiaries.
For information regarding remuneration to the Board of Trustees and administrative costs, please refer to note 2.
The LEO Foundation has provided a loan to LEO Pharma A/S of DKK 1,000 million (2016: DKK 0 million). The loan is granted on an arm's length basis with an interest percentage of 2.45 and will be repaid in 2027.
Balances with LEO Pharma A/S comprises receivables of DKK 148 million (2016: receivables of DKK 61 million). The LEO Foundation has no other transactions with related parties.
NOTE 12 EVENTS AFTER THE BALANCE SHEET DATE
No events have occurred in the period from the balance sheet date until the presentation of the Financial Statements that materially affect the assessment of the Annual Report.
NOTE 8 DEFERRED TAX
(DKK million) 2017 2016
Deferred tax assets/(liabilities) at 1 January 19 7Deferred tax on profit/(loss) for the year (13) 12
Deferred tax assets/(liabilities) at 31 December 6 19
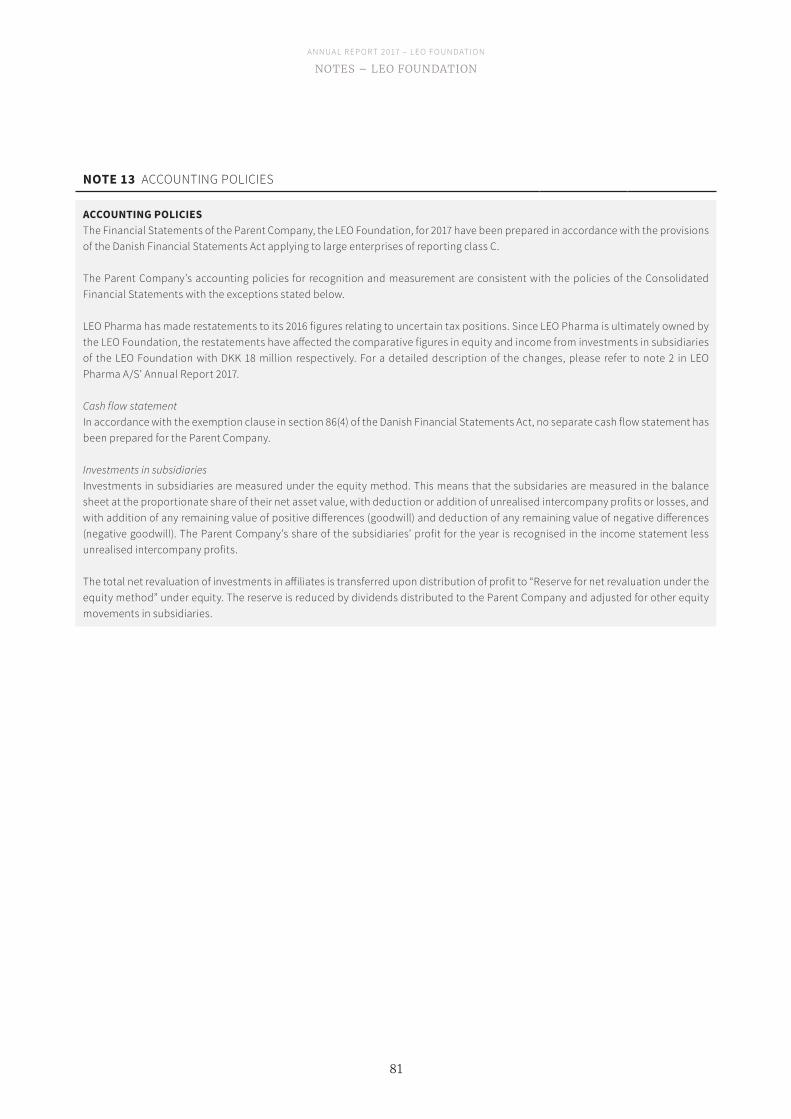
A N N UA L R EP O R T 2 017 – L EO F O U N DAT I O N
81
NOTES – LEO FOuNDATION
NOTE 13 ACCOUNTING POLICIES
ACCOUNTING POLICIESThe Financial Statements of the Parent Company, the LEO Foundation, for 2017 have been prepared in accordance with the provisions of the Danish Financial Statements Act applying to large enterprises of reporting class C.
The Parent Company’s accounting policies for recognition and measurement are consistent with the policies of the Consolidated Financial Statements with the exceptions stated below.
LEO Pharma has made restatements to its 2016 figures relating to uncertain tax positions. Since LEO Pharma is ultimately owned by the LEO Foundation, the restatements have affected the comparative figures in equity and income from investments in subsidiaries of the LEO Foundation with DKK 18 million respectively. For a detailed description of the changes, please refer to note 2 in LEO Pharma A/S’ Annual Report 2017. Cash flow statementIn accordance with the exemption clause in section 86(4) of the Danish Financial Statements Act, no separate cash flow statement has been prepared for the Parent Company.
Investments in subsidiariesInvestments in subsidiaries are measured under the equity method. This means that the subsidaries are measured in the balance sheet at the proportionate share of their net asset value, with deduction or addition of unrealised intercompany profits or losses, and with addition of any remaining value of positive differences (goodwill) and deduction of any remaining value of negative differences (negative goodwill). The Parent Company’s share of the subsidiaries’ profit for the year is recognised in the income statement less unrealised intercompany profits.
The total net revaluation of investments in affiliates is transferred upon distribution of profit to “Reserve for net revaluation under the equity method” under equity. The reserve is reduced by dividends distributed to the Parent Company and adjusted for other equity movements in subsidiaries.
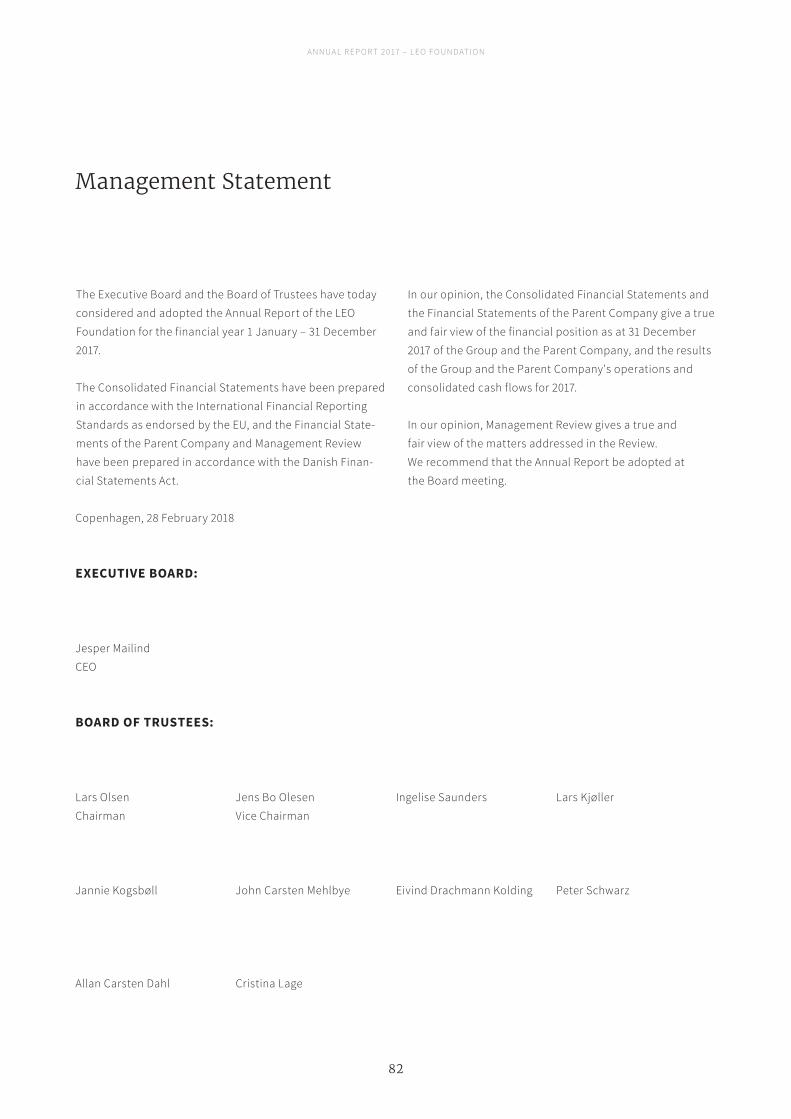
A N N UA L R EP O R T 2 017 – L EO F O U N DAT I O N
82
Management Statement
The Executive Board and the Board of Trustees have today considered and adopted the Annual Report of the LEO Foundation for the financial year 1 January – 31 December 2017.
The Consolidated Financial Statements have been prepared in accordance with the International Financial Reporting Standards as endorsed by the EU, and the Financial State-ments of the Parent Company and Management Review have been prepared in accordance with the Danish Finan-cial Statements Act.
In our opinion, the Consolidated Financial Statements and the Financial Statements of the Parent Company give a true and fair view of the financial position as at 31 December 2017 of the Group and the Parent Company, and the results of the Group and the Parent Company's operations and consolidated cash flows for 2017.
In our opinion, Management Review gives a true and fair view of the matters addressed in the Review. We recommend that the Annual Report be adopted at the Board meeting.
Copenhagen, 28 February 2018
Lars Olsen Chairman
Jens Bo OlesenVice Chairman
Ingelise Saunders Lars Kjøller
Jannie Kogsbøll John Carsten Mehlbye Eivind Drachmann Kolding Peter Schwarz
Allan Carsten Dahl Cristina Lage
Jesper MailindCEO
BOARD OF TRUSTEES:
EXECUTIVE BOARD:

A N N UA L R EP O R T 2 017 – L EO F O U N DAT I O N
83
A N N UA L R EP O R T 2 017 – L EO F O U N DAT I O N
84
TO THE BOARD OF TRuSTEES OF LEO FONDET
Independent auditor’s report
OpinionWe have audited the Consolidated Financial Statements and the Parent Financial Statements for LEO Fondet for the financial year 01.01.2017 - 31.12.2017, which comprise the income statement, balance sheet, statement of changes in equity and notes, including a summary of significant accounting policies, for the Group as well as the Parent, and the statement of comprehensive income and the cash flow statement of the Group. The Consolidated Financial Statements are prepared in accordance with International Financial Reporting Standards as adopted by the EU and additional requirements of the Danish Financial Statements Act, and the Parent Financial Statements are prepared in accordance with the Danish Financial Statements Act.
In our opinion, the Consolidated Financial Statements give a true and fair view of the Group’s financial position at 31.12.2017, and of the results of its operations and cash flows for the financial year 01.01.2017 - 31.12.2017 in accordance with International Financial Reporting Standards as adopted by the EU and additional requirements under the Danish Financial Statements Act.
Further, in our opinion, the Parent Financial Statements give a true and fair view of the Parent’s financial position at 31.12.2017, and of the results of its operations for the financial year 01.01.2017 - 31.12.2017 in accordance with the Danish Financial Statements Act.
Basis for opinionWe conducted our audit in accordance with International Standards on Auditing (ISAs) and the additional requirements applicable in Denmark. Our responsibilities under those standards and requirements are further described in the Auditor’s responsibilities for the audit of the Consolidated Financial Statements and the Parent Financial Statements section of this auditor’s report. We are independent of the Group in accordance with the International Ethics Standards Board of Accountants’ Code of Ethics for Professional Accountants (IESBA Code) and the additional require-ments applicable in Denmark, and we have fulfilled our other ethical responsibilities in accordance with these requirements. We believe that the audit evidence we have obtained is sufficient and appropriate to provide a basis for our opinion.
Statement on the Management ReviewManagement is responsible for the Management Review.
Our opinion on the Consolidated Financial Statements and the Parent Financial Statements does not cover the Management
Review, and we do not express any form of assurance conclusion thereon.
In connection with our audit of the Consolidated Financial Statements and the Parent Financial Statements, our responsibility is to read the Management Review and, in doing so, consider whether the Management Review is materially inconsistent with the Consolidated Financial Statements and the Parent Financial Statements or our knowledge obtained in the audit or otherwise appears to be materially misstated.
Moreover, it is our responsibility to consider whether the Management Review provides the information required under the Danish Financial Statements Act.
Based on the work we have performed, we conclude that the Management Review is in accordance with the Consolidated Financial Statements and the Parent Financial Statements and has been prepared in accordance with the requirements of the Danish Financial Statements Act. We did not identify any material misstatement of the Management Review.
Management’s responsibilities for the Consolidated Financial Statements and the Parent Financial StatementsManagement is responsible for the preparation of Consolidated Financial Statements that give a true and fair view in accordance with International Financial Reporting Standards as adopted by the EU and additional requirements of the Danish Financial Statements Act as well as the preparation of Parent Financial Statements that give a true and fair view in accordance with the Danish Financial Statements Act, and for such internal control as Management determines is necessary to enable the preparation of Consolidated Financial Statements and Parent Financial Statements that are free from material misstatement, whether due to fraud or error.
In preparing the Consolidated Financial Statements and the Parent Financial Statements, Management is responsible for assessing the Group’s and the Parent’s ability to continue as a going concern, for disclosing, as applicable, matters related to going concern, and for using the going concern basis of accounting in preparing the Consolidated Financial Statements and the Parent Financial Statements unless Management either intends to liquidate the Group or the Entity or to cease operations, or has no realistic alternative but to do so.
A N N UA L R EP O R T 2 017 – L EO F O U N DAT I O N
85
Auditor’s responsibilities for the audit of the Consolidated Financial Statements and the Parent Financial StatementsOur objectives are to obtain reasonable assurance about whether the Consolidated Financial Statements and the Parent Financial Statements as a whole are free from material misstatement, whether due to fraud or error, and to issue an auditor’s report that includes our opinion. Reasonable assurance is a high level of assurance, but is not a guarantee that an audit conducted in accordance with ISAs and the additional requirements applicable in Denmark will always detect a material misstatement when it exists. Misstatements can arise from fraud or error and are considered material if, individually or in the aggregate, they could reasonably be expected to influence the economic decisions of users taken on the basis of these Consolidated Financial Statements and the Parent Financial Statements.
As part of an audit conducted in accordance with ISAs and the additional requirements applicable in Denmark, we exercise professional judgement and maintain professional scepticism throughout the audit. We also:
• Identify and assess the risks of material misstatement of the Consolidated Financial Statements and the Parent Financial Statements, whether due to fraud or error, design and perform audit procedures responsive to those risks, and obtain audit evidence that is sufficient and appropriate to provide a basis for our opinion. The risk of not detecting a material misstatement resulting from fraud is higher than for one resulting from error, as fraud may involve collusion, forgery, intentional omissions, misrepresentations, or the override of internal control.
• Obtain an understanding of internal control relevant to the audit in order to design audit procedures that are appropriate in the circumstances, but not for the purpose of expressing an opinion on the effectiveness of the Group’s and the Parent’s internal control.
• Evaluate the appropriateness of accounting policies used and the reasonableness of accounting estimates and related disclosures made by Management.
• Conclude on the appropriateness of Management’s use of the going concern basis of accounting in preparing the Consolidated Financial Statements and the Parent Financial Statements, and, based on the audit evidence obtained, whether a material uncertainty exists related to events or conditions that may cast significant doubt on the Group’s and the Parent’s ability to continue as a going concern. If we
conclude that a material uncertainty exists, we are required to draw attention in our auditor’s report to the related disclosures in the Consolidated Financial Statements and the Parent Financial Statements or, if such disclosures are in-adequate, to modify our opinion. Our conclusions are based on the audit evidence obtained up to the date of our auditor’s report. However, future events or conditions may cause the Group and the Entity to cease to continue as a going concern.
• Evaluate the overall presentation, structure and content of the Consolidated Financial Statements and the parent financial statements, including the disclosures in the notes, and whether the Consolidated Financial Statements and the Parent Financial Statements represent the underlying transactions and events in a manner that gives a true and fair view.
• Obtain sufficient appropriate audit evidence regarding the financial information of the entities or business activities within the Group to express an opinion on the Consolidated Financial Statements. We are responsible for the direction, supervision and performance of the group audit. We remain solely responsible for our audit opinion.
We communicate with those charged with governance regarding, among other matters, the planned scope and timing of the audit and significant audit findings, including any significant deficiencies in internal control that we identify during our audit.
Copenhagen, 28 February 2018
DeloitteStatsautoriseret RevisionspartnerselskabBusiness Registration No 33 96 35 56
Erik Holst Jørgensen Kirsten Aaskov MikkelsenState Authorised State Authorised Public Accountant Public AccountantMNE no. 9943 MNE no. 21358
A N N UA L R EP O R T 2 017 – L EO F O U N DAT I O N
86
Foundation information
LEO FoundationLEO FondetLautrupsgade 7, 5.DK-2100 CopenhagenDenmark
CVR no.: 11 62 33 36
Financial year: 1 January – 31 December
Executive BoardJesper Mailind, CEO
Board of TrusteesLars Olsen, ChairmanJens Bo Olesen, Vice ChairmanIngelise SaundersJohn Carsten MehlbyeEivind Drachmann KoldingPeter SchwarzLars KjøllerJannie KogsbøllAllan Carsten DahlCristina Lage
AuditorsDeloitte Statsautoriseret Revisionspartnerselskab
Weidekampsgade 6DK-2300 Copenhagen SDenmark

A N N UA L R EP O R T 2 017 – L EO F O U N DAT I O N
87

LEO FoundationLautrupsgade 7, 5.
DK-2100 CopenhagenDenmark
leo-foundation.org
© LEO Fondet Februar y 2018. CVR no. 11623336.