Embed Size (px)
Citation preview
Legalized Cannabis: Fiscal Considerations
Ottawa, Canada 1 November 2016 www.pbo-dpb.gc.ca
The mandate of the Parliamentary Budget Officer (PBO) is to provide independent analysis to Parliament on the state of the nation’s finances, the Government’s estimates and trends in the Canadian economy; and, upon request from a committee or parliamentarian, to estimate the financial cost of any proposal for matters over which Parliament has jurisdiction.
PBO wishes to acknowledge officials from Aphria Medical Marijuana, Organigram, Public Safety Canada, Statistics Canada, Tilray, and Tweed Marijuana who graciously provided data and clarifications. Dr. Luca Giommoni and Michelle Rotermann in particular provided extensive data.
This report was prepared by the staff of the Parliamentary Budget Officer. Nigel Wodrich wrote the report. Jason Jacques, Philip Bagnoli and Mostafa Askari provided comments. Nancy Beauchamp and Jocelyne Scrim assisted with the preparation of the report for publication. Please contact [email protected] for further information.
Jean-Denis Fréchette Parliamentary Budget Officer
Table of Contents Executive Summary 1
1. Introduction 6
1.1. Context 6 1.2. Scope 7
2. Consumption 9
2.1. Users 9 2.2. Volume 14
3. Prices 18
3.1. Illicit Market 18 3.2. Legal Market 21
4. Fiscal Space 25
5. Price Sensitivity 29
Extended Analysis & Detailed Methodology 37 Appendix A:
Users 37 A.1A.2 Volume 45 A.3 Illicit Market Price 47 A.4 Legal Market Price 54 A.5 Fiscal Space 56 A.6 Price Sensitivity 58
References 67
Notes 72
Legalized Cannabis: Fiscal Considerations
1
Executive Summary In Spring 2017, the federal government intends to introduce legislation to legalize and regulate the cultivation, distribution, sale and consumption of recreational cannabis in Canada.
The legalization of recreational cannabis will introduce an entirely new sector into the formal economy. Given the government’s intention to regulate and tax this new sector, legalization will create new government revenues and expenses. Legal sales of recreational cannabis may begin as early as January 2018.
This report provides a forecast of the economic parameters in the cannabis market, including the number of users, aggregate consumption and product prices. It also provides an overview of potential revenues that could arise from legal cannabis sales, based on existing and projected market data, as well as the government’s stated policy objectives.
In addition, it discusses key economic and fiscal issues around legalizing recreational cannabis to help inform parliamentary debate. PBO finds:
• In 2018, an estimated 4.6 million individuals aged 15 and over will use cannabis at least once, according to PBO projections. By 2021, this level could rise to 5.2 million.
Legalized Cannabis: Fiscal Considerations
2
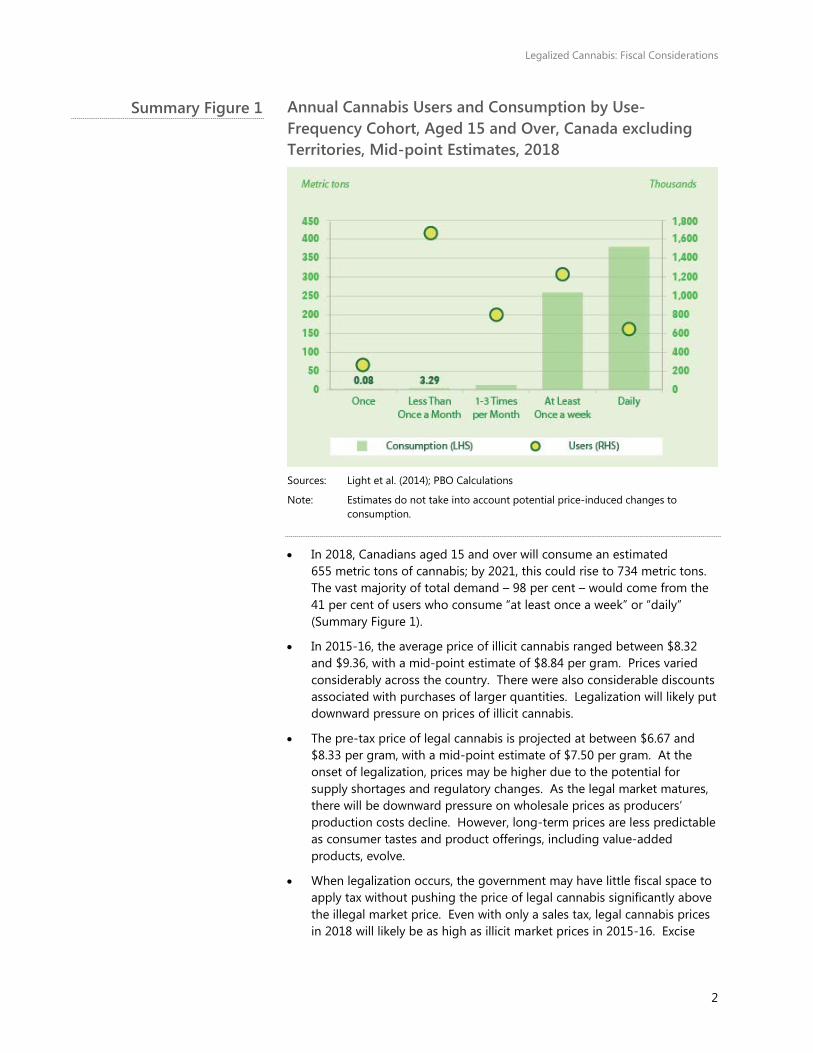
Annual Cannabis Users and Consumption by Use-Frequency Cohort, Aged 15 and Over, Canada excluding Territories, Mid-point Estimates, 2018
Sources: Light et al. (2014); PBO Calculations
Note: Estimates do not take into account potential price-induced changes to consumption.
• In 2018, Canadians aged 15 and over will consume an estimated655 metric tons of cannabis; by 2021, this could rise to 734 metric tons.The vast majority of total demand – 98 per cent – would come from the41 per cent of users who consume “at least once a week” or “daily”(Summary Figure 1).
• In 2015-16, the average price of illicit cannabis ranged between $8.32and $9.36, with a mid-point estimate of $8.84 per gram. Prices variedconsiderably across the country. There were also considerable discountsassociated with purchases of larger quantities. Legalization will likely putdownward pressure on prices of illicit cannabis.
• The pre-tax price of legal cannabis is projected at between $6.67 and$8.33 per gram, with a mid-point estimate of $7.50 per gram. At theonset of legalization, prices may be higher due to the potential forsupply shortages and regulatory changes. As the legal market matures,there will be downward pressure on wholesale prices as producers’production costs decline. However, long-term prices are less predictableas consumer tastes and product offerings, including value-addedproducts, evolve.
• When legalization occurs, the government may have little fiscal space toapply tax without pushing the price of legal cannabis significantly abovethe illegal market price. Even with only a sales tax, legal cannabis pricesin 2018 will likely be as high as illicit market prices in 2015-16. Excise
Summary Figure 1
Legalized Cannabis: Fiscal Considerations
3
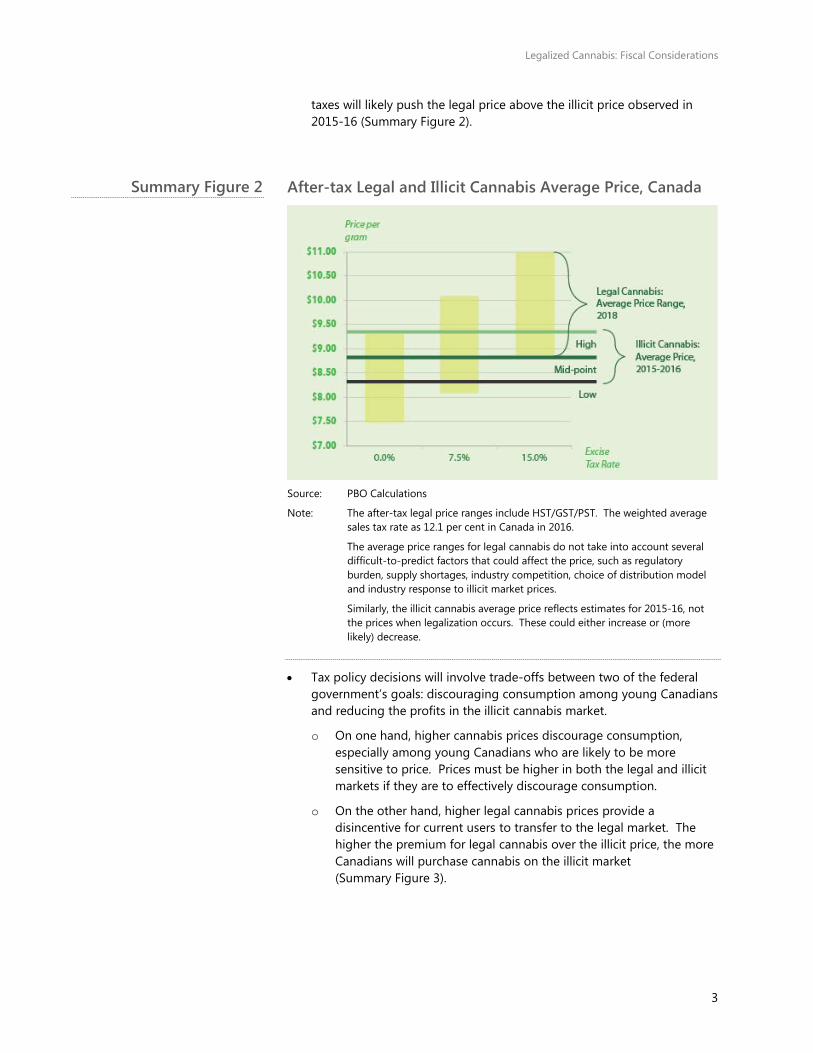
taxes will likely push the legal price above the illicit price observed in 2015-16 (Summary Figure 2).
After-tax Legal and Illicit Cannabis Average Price, Canada
Source: PBO Calculations
Note: The after-tax legal price ranges include HST/GST/PST. The weighted average sales tax rate as 12.1 per cent in Canada in 2016.
The average price ranges for legal cannabis do not take into account several difficult-to-predict factors that could affect the price, such as regulatory burden, supply shortages, industry competition, choice of distribution model and industry response to illicit market prices.
Similarly, the illicit cannabis average price reflects estimates for 2015-16, not the prices when legalization occurs. These could either increase or (more likely) decrease.
• Tax policy decisions will involve trade-offs between two of the federalgovernment’s goals: discouraging consumption among young Canadiansand reducing the profits in the illicit cannabis market.
o On one hand, higher cannabis prices discourage consumption,especially among young Canadians who are likely to be moresensitive to price. Prices must be higher in both the legal and illicitmarkets if they are to effectively discourage consumption.
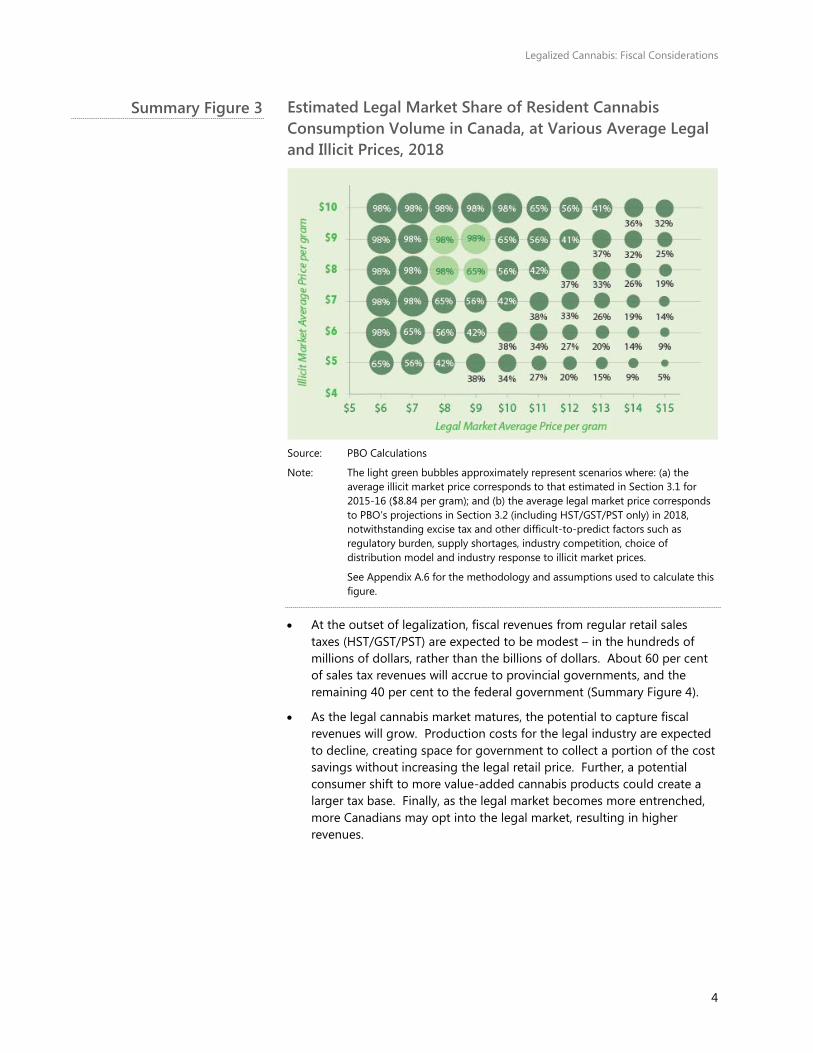
o On the other hand, higher legal cannabis prices provide adisincentive for current users to transfer to the legal market. Thehigher the premium for legal cannabis over the illicit price, the moreCanadians will purchase cannabis on the illicit market(Summary Figure 3).
Summary Figure 2
Legalized Cannabis: Fiscal Considerations
4
Estimated Legal Market Share of Resident Cannabis Consumption Volume in Canada, at Various Average Legal and Illicit Prices, 2018
Source: PBO Calculations
Note: The light green bubbles approximately represent scenarios where: (a) the average illicit market price corresponds to that estimated in Section 3.1 for 2015-16 ($8.84 per gram); and (b) the average legal market price corresponds to PBO’s projections in Section 3.2 (including HST/GST/PST only) in 2018, notwithstanding excise tax and other difficult-to-predict factors such as regulatory burden, supply shortages, industry competition, choice of distribution model and industry response to illicit market prices.
See Appendix A.6 for the methodology and assumptions used to calculate this figure.
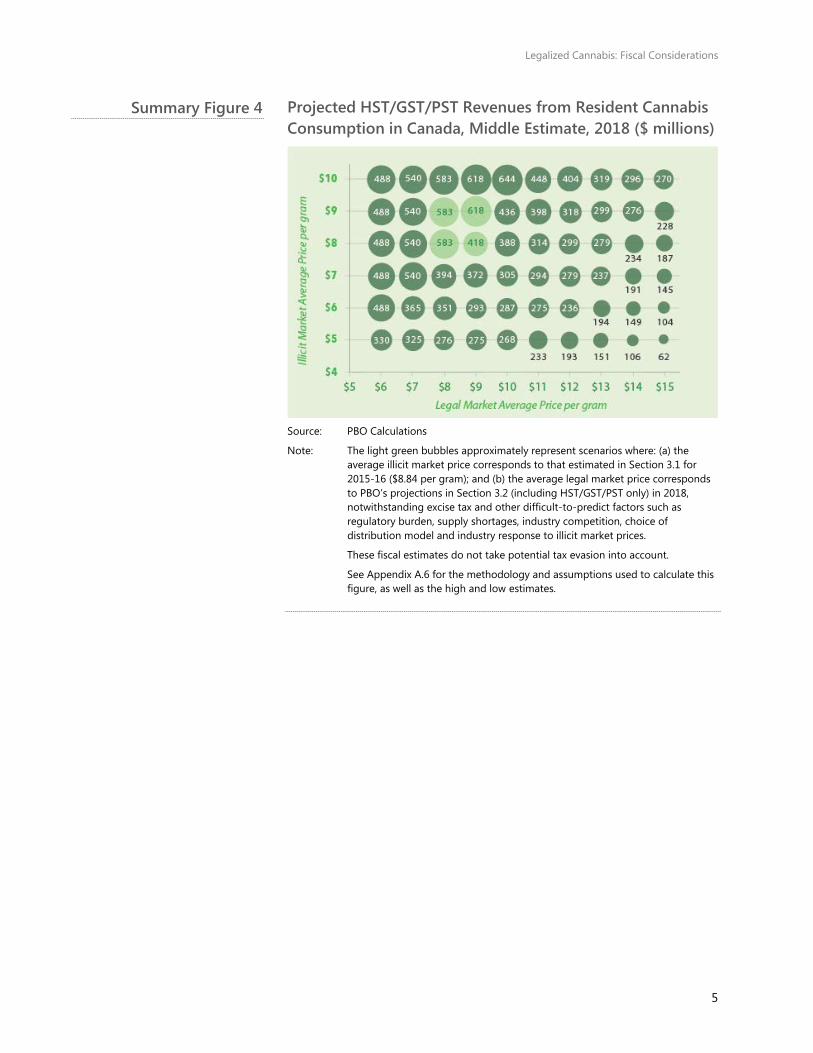
• At the outset of legalization, fiscal revenues from regular retail salestaxes (HST/GST/PST) are expected to be modest – in the hundreds ofmillions of dollars, rather than the billions of dollars. About 60 per centof sales tax revenues will accrue to provincial governments, and theremaining 40 per cent to the federal government (Summary Figure 4).
• As the legal cannabis market matures, the potential to capture fiscalrevenues will grow. Production costs for the legal industry are expectedto decline, creating space for government to collect a portion of the costsavings without increasing the legal retail price. Further, a potentialconsumer shift to more value-added cannabis products could create alarger tax base. Finally, as the legal market becomes more entrenched,more Canadians may opt into the legal market, resulting in higherrevenues.
Summary Figure 3
Legalized Cannabis: Fiscal Considerations
5
Projected HST/GST/PST Revenues from Resident Cannabis Consumption in Canada, Middle Estimate, 2018 ($ millions)
Source: PBO Calculations
Note: The light green bubbles approximately represent scenarios where: (a) the average illicit market price corresponds to that estimated in Section 3.1 for 2015-16 ($8.84 per gram); and (b) the average legal market price corresponds to PBO’s projections in Section 3.2 (including HST/GST/PST only) in 2018, notwithstanding excise tax and other difficult-to-predict factors such as regulatory burden, supply shortages, industry competition, choice of distribution model and industry response to illicit market prices.
These fiscal estimates do not take potential tax evasion into account.
See Appendix A.6 for the methodology and assumptions used to calculate this figure, as well as the high and low estimates.
Summary Figure 4
Legalized Cannabis: Fiscal Considerations
6
1. Introduction
1.1. Context
In April 2016, the Canadian Government announced it would introduce legislation to legalize cannabis in Spring 2017.1 The government intends to legalize and regulate the cultivation, distribution, sale and consumption of recreational cannabis in Canada. Industry stakeholders believe legal sales of recreational cannabis may begin as early as January 2018.
To seek input on the design of an eventual legal cannabis system, the federal government convened The Task Force on Marijuana Legalization and Regulation.2 The Task Force has consulted experts, governments, stakeholders and the general public ahead submitting its final report, expected in November 2016.
In the interim, the Task Force has articulated the federal government’s objectives with respect to legal access to cannabis. Many of these goals will have economic and fiscal implications, including objectives to:
• Reduce the consumption of cannabis by young people;
• Keep profits from the cannabis market out of the hands of criminals;
• Strengthen law enforcement measures to deter selling cannabis outside the legal framework, especially to youth;
• Establish and enforce strict regulations around producing, distributing and selling cannabis;
• Continue to provide access to cannabis for medical purposes; and
• Apply taxes to legal cannabis sales.3
Canada will not be the first jurisdiction in the world to legalize the production, distribution and sale of cannabis. Four American states – Colorado, Washington, Oregon and Alaska, along with the District of Columbia – have legalized recreational cannabis. At least an additional five states have confirmed ballot measures on legalizing recreational cannabis in November 2016.4
Uruguay has also legalized the production, distribution and sale of cannabis. The Netherlands allows retail sales, but has not legalized its cultivation and distribution. Canada will, therefore, be only the second country to comprehensively legalize recreational cannabis, nationwide.
Legalized Cannabis: Fiscal Considerations
7
1.2. Scope
The mandate of the Parliamentary Budget Officer (PBO) includes providing independent analysis to Parliament on trends in the Canadian economy and the state of the nation’s finances. The legalization of recreational cannabis will introduce an entirely new sector into the formal economy. Given the government’s intention to regulate and tax this new sector, the government will have new revenues and expenses.
This report provides a forecast of the economic parameters in the cannabis market, including the number of users, aggregate consumption and product prices.
It also provides an overview of potential revenues that could arise from legal cannabis sales, based on existing and projected market data, as well as the government’s stated policy objectives.
It does not, however, assess aspects of cannabis legalization pertaining to:
• Potential fiscal revenues from the cannabis market arising from taxesapplied beyond the point of sale, such as corporate income tax onlicensed producers, income tax on legitimized cannabis-relatedoccupations, and licencing and compliance fees;
• Knock-on impacts of cannabis legalization on other economic activityand fiscal parameters;
• Program expenses, savings or revenues associated with legalization,notably in the areas of criminal justice, health, law enforcement, publicsafety and trade; and
• Social benefits and/or costs, including substitution and complementaritywith other substances.
This report makes projections for 2018, the first plausible year for legal recreational sales, and 2021, when the legal cannabis market will be more mature.
Projections are also presented in terms of high, low and middle estimates. This approach takes into account the present uncertainty in the government’s policies, as well as the uncertainty in the limited data that exist. Highlighting this last point, Public Safety (2016b) found that, of 45 identified cannabis metrics, Canada currently collects information to calculate seven, partial information on 17, and little or no data on the remaining 21 metrics. Policy-makers will require more, better, current, Canada-specific cannabis data, including economic and fiscal data.
Ultimately, no one knows exactly how legalization will impact the cannabis market – in particular, how use patterns will evolve, especially among frequent or youth consumers; how illicit and legal market prices will respond; the extent to which Canadians will participate in the recreational, medical and
Legalized Cannabis: Fiscal Considerations
8
illicit markets; or how consumer tastes and product offerings, including value-added products, will change.
This report’s contribution is to suggest orders of magnitude around important cannabis parameters, and to provide a framework to consider the economic and fiscal aspects of cannabis legalization.
Legalized Cannabis: Fiscal Considerations
9
2. ConsumptionAs in many other countries, cannabis is the most commonly used illicit substance in Canada. Its legalization can be expected to influence consumption trends. The quantity of cannabis consumed depends on the number of users as well as the amount that each consumes. This section deals with each in turn.
2.1. Users
This report used data on cannabis use from Statistics Canada’s 2012 Canadian Community Health Survey – Mental Health (CCHS-MH). The survey sampled thousands of individuals and determined characteristics of the prevalence and correlates of cannabis use in the country.
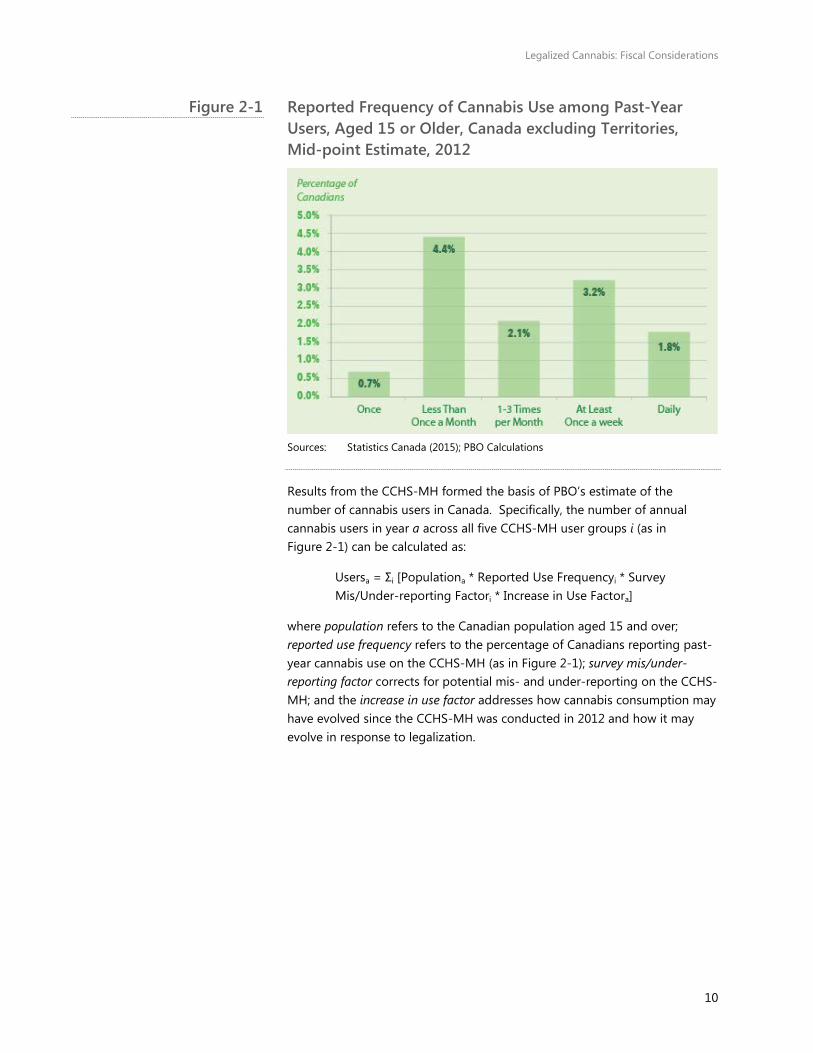
According to the CCHS-MH, 12.2% of Canada’s non-territorial population aged 15 and over reported having used cannabis at least once in the past year.5 Over 40 per cent of past-year users – as well as 5.1 per cent of the Canadian population aged 15 and over – reported that they were infrequent cannabis users, meaning they consumed it less than once a month.
Conversely, 1.8 per cent of the population aged 15 and over reported using cannabis daily (Figure 2-1). More detailed analysis on user prevalance in Canada is in Appendix A.1.
Legalized Cannabis: Fiscal Considerations
10
Reported Frequency of Cannabis Use among Past-Year Users, Aged 15 or Older, Canada excluding Territories, Mid-point Estimate, 2012
Sources: Statistics Canada (2015); PBO Calculations
Results from the CCHS-MH formed the basis of PBO’s estimate of the number of cannabis users in Canada. Specifically, the number of annual cannabis users in year a across all five CCHS-MH user groups i (as in Figure 2-1) can be calculated as:
Usersa = Σi [Populationa * Reported Use Frequencyi * Survey Mis/Under-reporting Factori * Increase in Use Factora]
where population refers to the Canadian population aged 15 and over; reported use frequency refers to the percentage of Canadians reporting past-year cannabis use on the CCHS-MH (as in Figure 2-1); survey mis/under-reporting factor corrects for potential mis- and under-reporting on the CCHS-MH; and the increase in use factor addresses how cannabis consumption may have evolved since the CCHS-MH was conducted in 2012 and how it may evolve in response to legalization.
Figure 2-1
Legalized Cannabis: Fiscal Considerations
11
Detailed calculations of each variable and discussion of the relevant assumptions are in Appendix A.1.
PBO projects that in 2018, the first plausible year of legalization, between 3.4 million and 6.0 million individuals will consume cannabis at least once, with a mid-point estimate of 4.6 million. By 2021, this level could rise to between 3.7 million and 7.0 million, with a mid-point estimate of 5.2 million.
These estimates take into account the existing and planned policies of the federal government, as defined in the Task Force on marijuana legalization and Regulation Discussion Paper. They do not, however, take into account potential demand from non-residents and tourists.
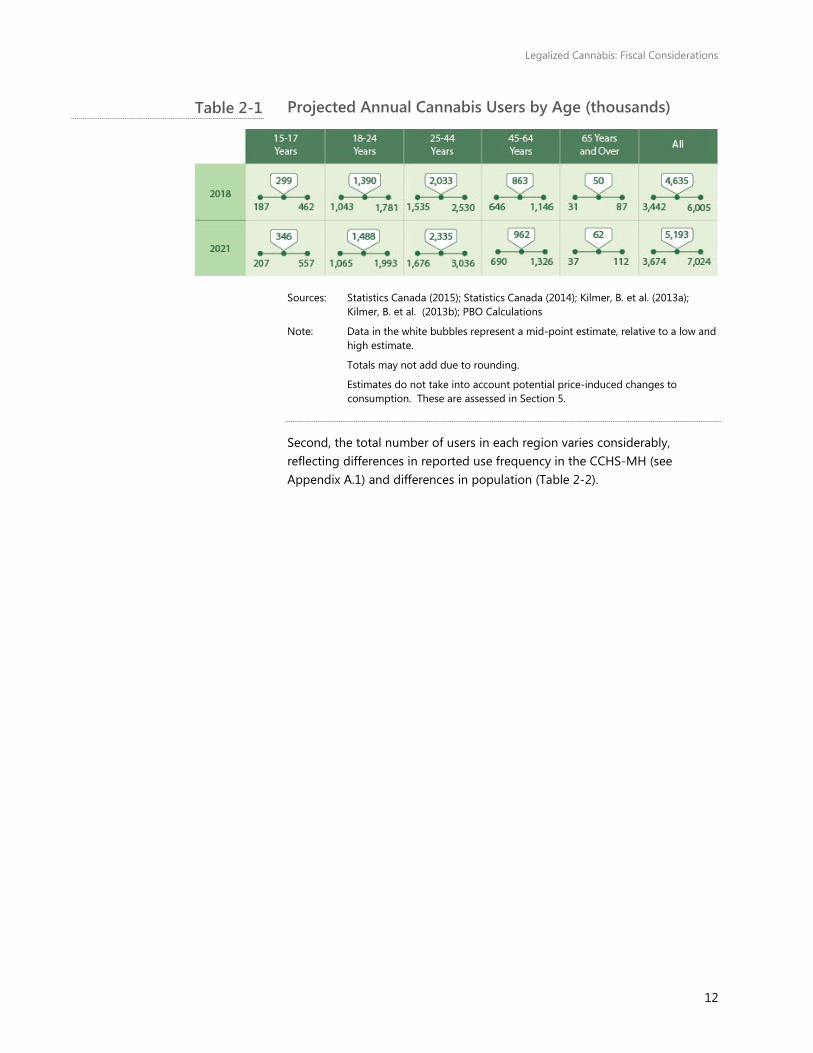
Data on projected cannabis use reveal certain characteristics about consumption. For instance, younger individuals are far more likely to use cannabis than their older counterparts. Of the 4.6 million people projected to use cannabis at least once in 2018, nearly 1.7 million, or more than one-third (36.4 per cent), would be in the 15-24 age group.
In contrast, only 18.6 per cent would be in the age group 45 to 64, while seniors aged 65 and over would account for just 1.1 per cent (Table 2-1).
Box 1: Due to data limitations, PBO considered cannabis consumption in terms of dried flower only. However, there is a variety of different cannabis products including:
Flower
Concentrates (e.g. oils, wax)
Tinctures and sprays
Edibles (e.g. infused food and drink, ingestible oils)
Topical products (e.g. creams, salves, balms)
Each product can vary in its mode of delivery, potency, and effect (on the user physical, mental, social, and/or behavioural).
Legalized Cannabis: Fiscal Considerations
12
Projected Annual Cannabis Users by Age (thousands)
Sources: Statistics Canada (2015); Statistics Canada (2014); Kilmer, B. et al. (2013a); Kilmer, B. et al. (2013b); PBO Calculations
Note: Data in the white bubbles represent a mid-point estimate, relative to a low and high estimate.
Totals may not add due to rounding.
Estimates do not take into account potential price-induced changes to consumption. These are assessed in Section 5.
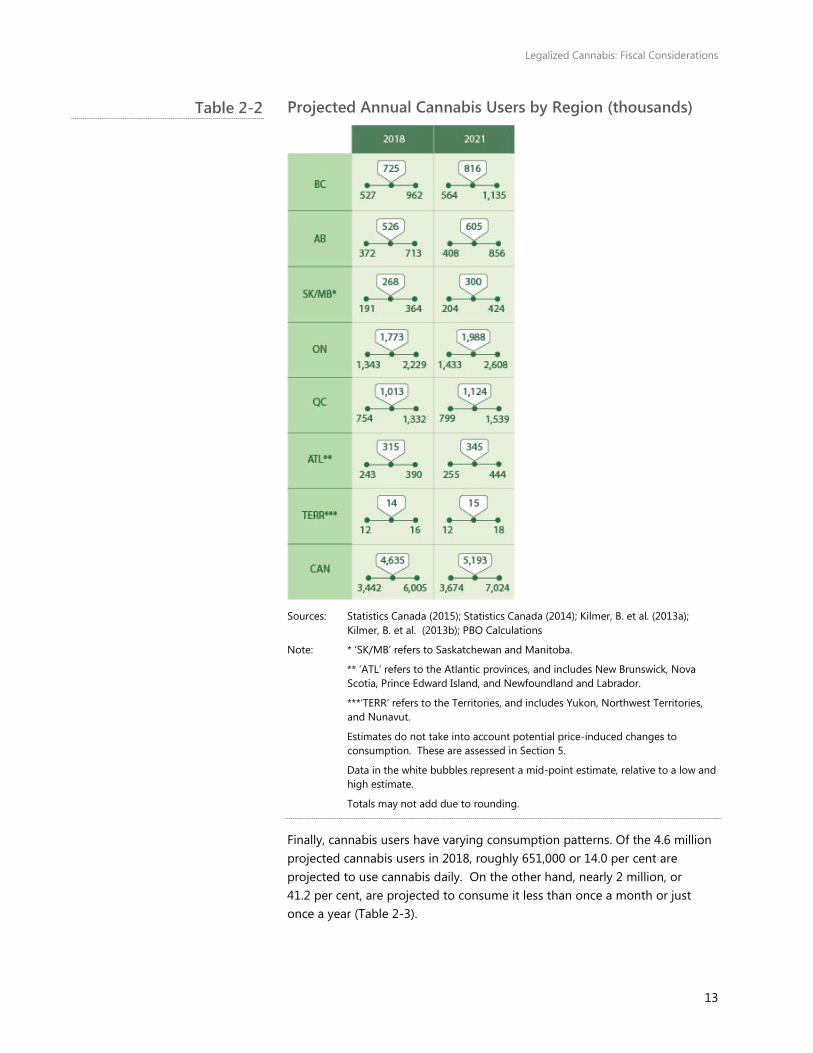
Second, the total number of users in each region varies considerably, reflecting differences in reported use frequency in the CCHS-MH (see Appendix A.1) and differences in population (Table 2-2).
Table 2-1
Legalized Cannabis: Fiscal Considerations
13
Projected Annual Cannabis Users by Region (thousands)
Sources: Statistics Canada (2015); Statistics Canada (2014); Kilmer, B. et al. (2013a); Kilmer, B. et al. (2013b); PBO Calculations
Note: * ‘SK/MB’ refers to Saskatchewan and Manitoba.
** ‘ATL’ refers to the Atlantic provinces, and includes New Brunswick, Nova Scotia, Prince Edward Island, and Newfoundland and Labrador.
***’TERR’ refers to the Territories, and includes Yukon, Northwest Territories, and Nunavut.
Estimates do not take into account potential price-induced changes to consumption. These are assessed in Section 5.
Data in the white bubbles represent a mid-point estimate, relative to a low and high estimate.
Totals may not add due to rounding.
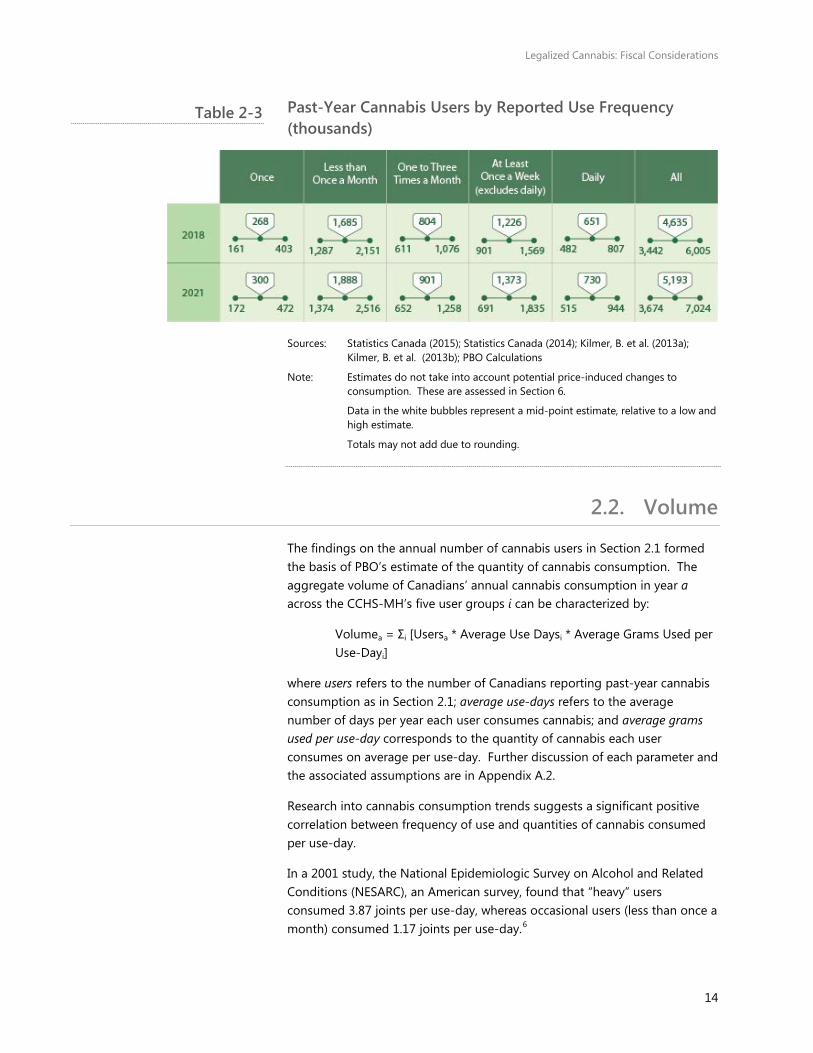
Finally, cannabis users have varying consumption patterns. Of the 4.6 million projected cannabis users in 2018, roughly 651,000 or 14.0 per cent are projected to use cannabis daily. On the other hand, nearly 2 million, or 41.2 per cent, are projected to consume it less than once a month or just once a year (Table 2-3).
Table 2-2
Legalized Cannabis: Fiscal Considerations
14
Past-Year Cannabis Users by Reported Use Frequency (thousands)
Sources: Statistics Canada (2015); Statistics Canada (2014); Kilmer, B. et al. (2013a); Kilmer, B. et al. (2013b); PBO Calculations
Note: Estimates do not take into account potential price-induced changes to consumption. These are assessed in Section 6.
Data in the white bubbles represent a mid-point estimate, relative to a low and high estimate.
Totals may not add due to rounding.
2.2. Volume
The findings on the annual number of cannabis users in Section 2.1 formed the basis of PBO’s estimate of the quantity of cannabis consumption. The aggregate volume of Canadians’ annual cannabis consumption in year a across the CCHS-MH’s five user groups i can be characterized by:
Volumea = Σi [Usersa * Average Use Daysi * Average Grams Used per Use-Dayi]
where users refers to the number of Canadians reporting past-year cannabis consumption as in Section 2.1; average use-days refers to the average number of days per year each user consumes cannabis; and average grams used per use-day corresponds to the quantity of cannabis each user consumes on average per use-day. Further discussion of each parameter and the associated assumptions are in Appendix A.2.
Research into cannabis consumption trends suggests a significant positive correlation between frequency of use and quantities of cannabis consumed per use-day.
In a 2001 study, the National Epidemiologic Survey on Alcohol and Related Conditions (NESARC), an American survey, found that “heavy” users consumed 3.87 joints per use-day, whereas occasional users (less than once a month) consumed 1.17 joints per use-day.6
Table 2-3
Legalized Cannabis: Fiscal Considerations
15
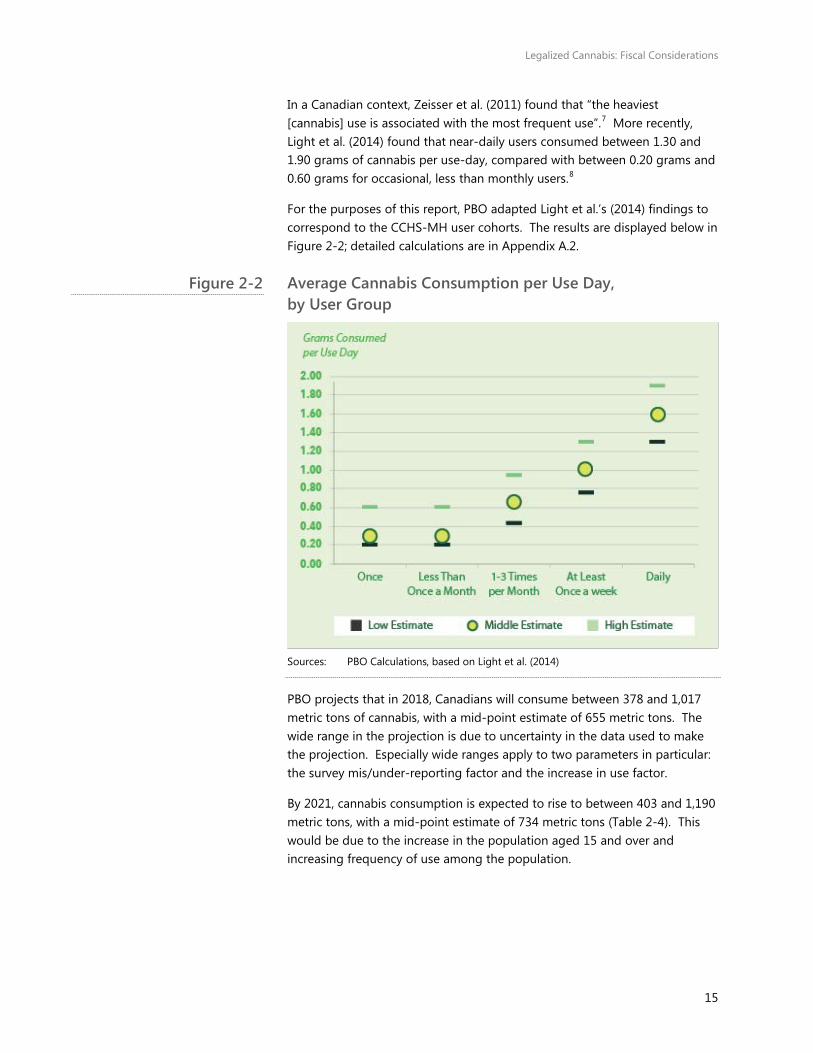
In a Canadian context, Zeisser et al. (2011) found that “the heaviest [cannabis] use is associated with the most frequent use”.7 More recently, Light et al. (2014) found that near-daily users consumed between 1.30 and 1.90 grams of cannabis per use-day, compared with between 0.20 grams and 0.60 grams for occasional, less than monthly users.8
For the purposes of this report, PBO adapted Light et al.’s (2014) findings to correspond to the CCHS-MH user cohorts. The results are displayed below in Figure 2-2; detailed calculations are in Appendix A.2.
Average Cannabis Consumption per Use Day, by User Group
Sources: PBO Calculations, based on Light et al. (2014)
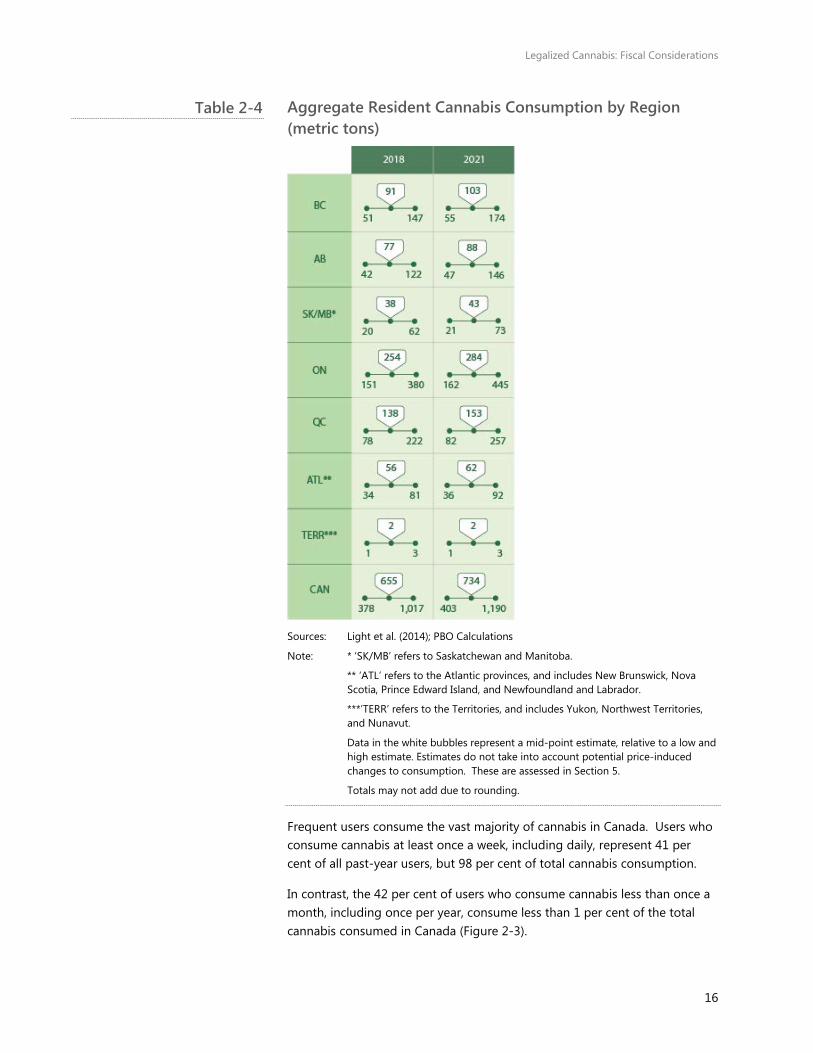
PBO projects that in 2018, Canadians will consume between 378 and 1,017 metric tons of cannabis, with a mid-point estimate of 655 metric tons. The wide range in the projection is due to uncertainty in the data used to make the projection. Especially wide ranges apply to two parameters in particular: the survey mis/under-reporting factor and the increase in use factor.
By 2021, cannabis consumption is expected to rise to between 403 and 1,190 metric tons, with a mid-point estimate of 734 metric tons (Table 2-4). This would be due to the increase in the population aged 15 and over and increasing frequency of use among the population.
Figure 2-2
Legalized Cannabis: Fiscal Considerations
16
Aggregate Resident Cannabis Consumption by Region (metric tons)
Sources: Light et al. (2014); PBO Calculations
Note: * ‘SK/MB’ refers to Saskatchewan and Manitoba.
** ‘ATL’ refers to the Atlantic provinces, and includes New Brunswick, Nova Scotia, Prince Edward Island, and Newfoundland and Labrador.
***’TERR’ refers to the Territories, and includes Yukon, Northwest Territories, and Nunavut.
Data in the white bubbles represent a mid-point estimate, relative to a low and high estimate. Estimates do not take into account potential price-induced changes to consumption. These are assessed in Section 5.
Totals may not add due to rounding.
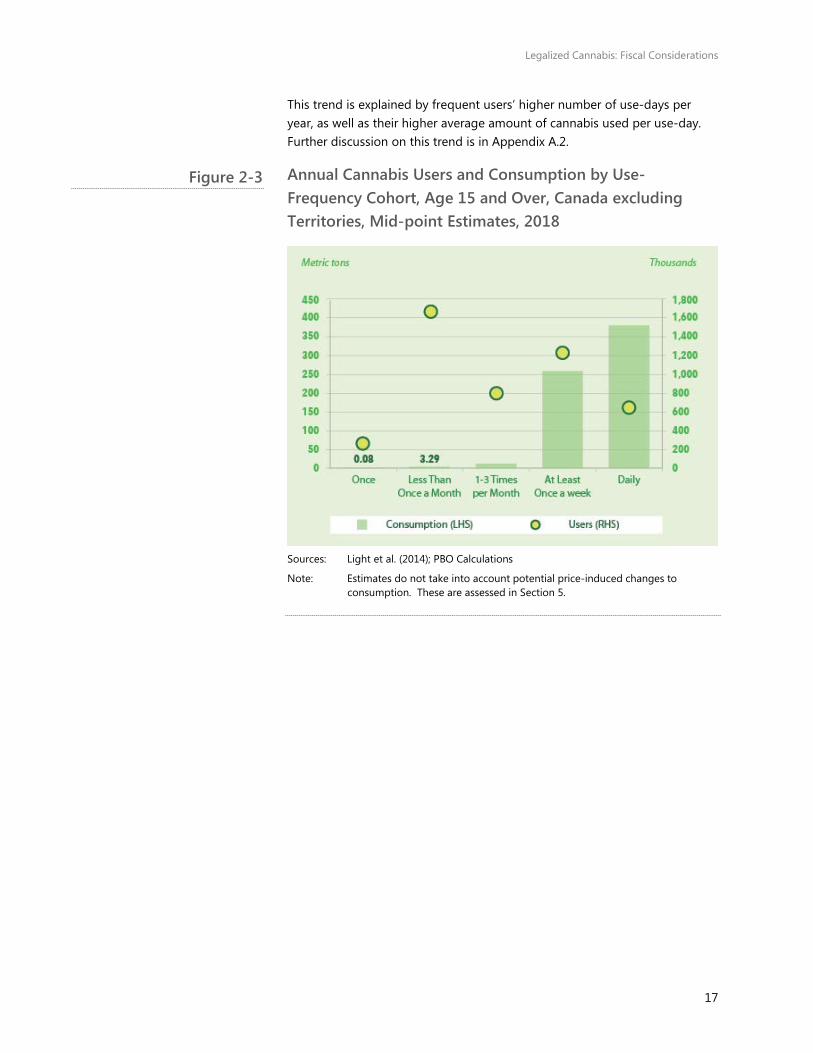
Frequent users consume the vast majority of cannabis in Canada. Users who consume cannabis at least once a week, including daily, represent 41 per cent of all past-year users, but 98 per cent of total cannabis consumption.
In contrast, the 42 per cent of users who consume cannabis less than once a month, including once per year, consume less than 1 per cent of the total cannabis consumed in Canada (Figure 2-3).
Table 2-4
Legalized Cannabis: Fiscal Considerations
17
This trend is explained by frequent users’ higher number of use-days per year, as well as their higher average amount of cannabis used per use-day. Further discussion on this trend is in Appendix A.2.
Annual Cannabis Users and Consumption by Use-Frequency Cohort, Age 15 and Over, Canada excluding Territories, Mid-point Estimates, 2018
Sources: Light et al. (2014); PBO Calculations
Note: Estimates do not take into account potential price-induced changes to consumption. These are assessed in Section 5.
Figure 2-3
Legalized Cannabis: Fiscal Considerations
18
3. PricesWhen the cultivation, distribution and sale of cannabis becomes legal, the new market for recreational cannabis will not emerge in a void; it will be competing with an established illicit market. The extent to which Canadians participate in the illicit, legal medical and legal recreational markets will depend, among other factors, on the relative prices of product in each market. This section assesses cannabis prices in those markets.
3.1. Illicit Market
Because of the illicit nature of the cannabis market in Canada, it is difficult to assess with certainty product prices on the street. Fortunately, a large dataset containing the details of thousands of cannabis transactions in Canada exists, from the website priceofweed.com. Price of Weed is an online survey that anonymously crowdsources the street value of cannabis from users.
PBO drew on the methodologies developed in Boucher, Lawrence, and Maslov (2013) and Caulkins, Andrzejewski, and Dahlkemper (2013) to collect, clean and analyze the data from Price of Weed. The data cover an 18-month period from February 2015 to August 2016 and provide insight on the illicit market price of cannabis. A more extensive discussion on data collection and cleaning appears in Appendix A.3.
There are multiple ways to arrive at an “average” price of cannabis while correcting for biases in the Price of Weed sample. One salient approach is to calculate a regionally-weighted average price. This approach weighs the average cannabis price of each region according to its estimated share of national cannabis consumption.
The weighting is helpful since some regions (Quebec) are under-represented in the Price of Weed sample and others (most of the rest of Canada) are over-represented to varying degrees. In applying this method, PBO arrives at a regionally-weighted average price of $8.32 per gram.
This result is somewhat higher than Boucher, Lawrence, and Maslov (2013) who also used data from Price of Weed and a methodology similar to PBO’s to find an average price of $7.54 per gram from September 2010 to November 2012.9 Detailed calculations are in Appendix A.3.
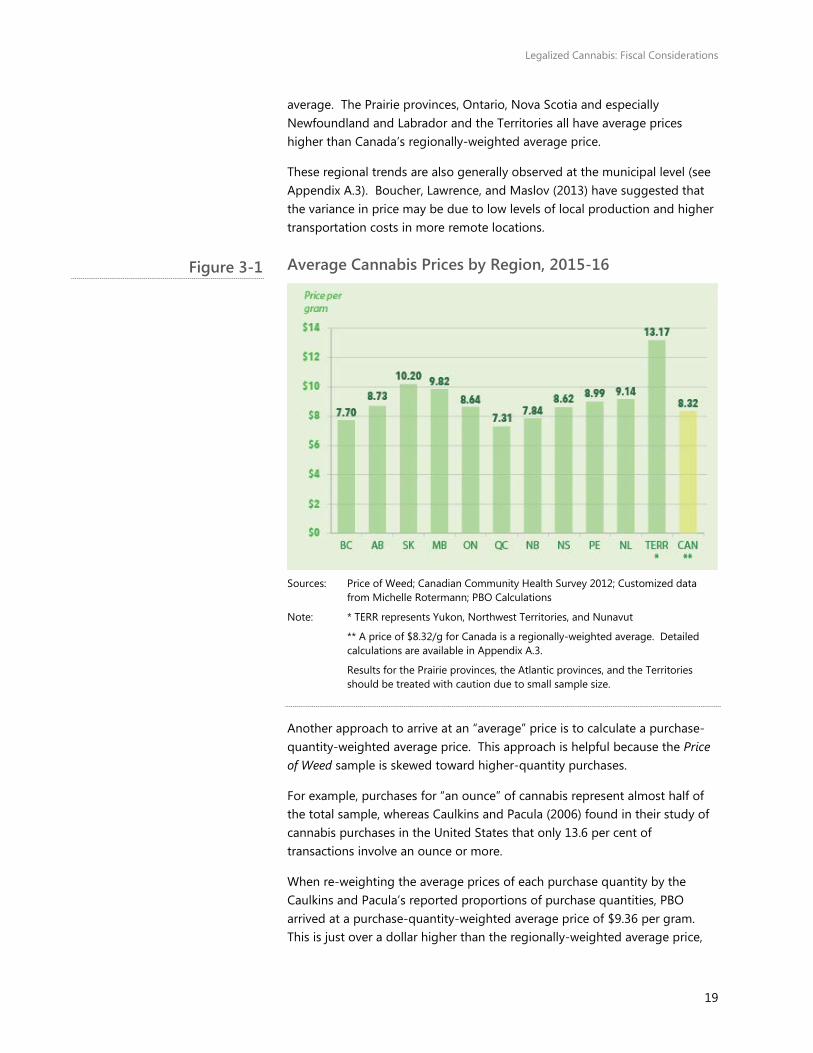
Cannabis prices show considerable regional variance across the country. British Columbia, Quebec, New Brunswick and Prince Edward Island each have average cannabis prices below the regionally-weighted Canadian
Legalized Cannabis: Fiscal Considerations
19
average. The Prairie provinces, Ontario, Nova Scotia and especially Newfoundland and Labrador and the Territories all have average prices higher than Canada’s regionally-weighted average price.
These regional trends are also generally observed at the municipal level (see Appendix A.3). Boucher, Lawrence, and Maslov (2013) have suggested that the variance in price may be due to low levels of local production and higher transportation costs in more remote locations.
Average Cannabis Prices by Region, 2015-16
Sources: Price of Weed; Canadian Community Health Survey 2012; Customized data
from Michelle Rotermann; PBO Calculations
Note: * TERR represents Yukon, Northwest Territories, and Nunavut
** A price of $8.32/g for Canada is a regionally-weighted average. Detailed calculations are available in Appendix A.3.
Results for the Prairie provinces, the Atlantic provinces, and the Territories should be treated with caution due to small sample size.
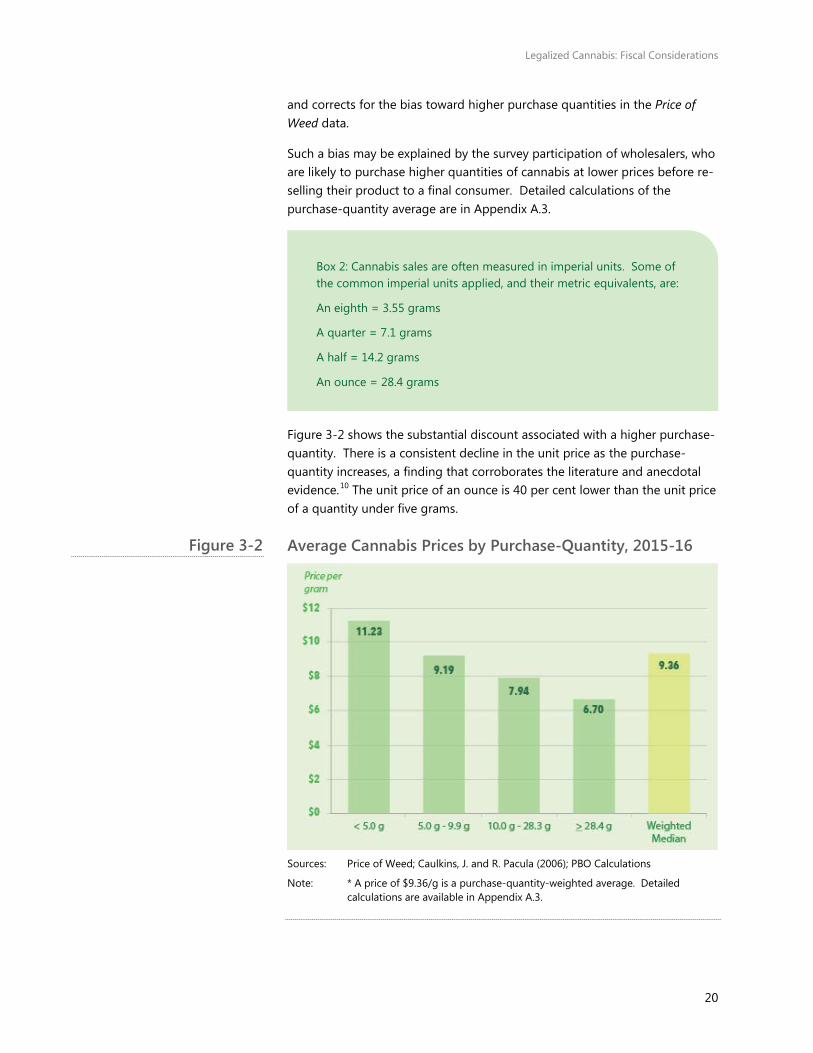
Another approach to arrive at an “average” price is to calculate a purchase-quantity-weighted average price. This approach is helpful because the Price of Weed sample is skewed toward higher-quantity purchases.
For example, purchases for “an ounce” of cannabis represent almost half of the total sample, whereas Caulkins and Pacula (2006) found in their study of cannabis purchases in the United States that only 13.6 per cent of transactions involve an ounce or more.
When re-weighting the average prices of each purchase quantity by the Caulkins and Pacula’s reported proportions of purchase quantities, PBO arrived at a purchase-quantity-weighted average price of $9.36 per gram. This is just over a dollar higher than the regionally-weighted average price,
Figure 3-1
Legalized Cannabis: Fiscal Considerations
20
and corrects for the bias toward higher purchase quantities in the Price of Weed data.
Such a bias may be explained by the survey participation of wholesalers, who are likely to purchase higher quantities of cannabis at lower prices before re-selling their product to a final consumer. Detailed calculations of the purchase-quantity average are in Appendix A.3.
Figure 3-2 shows the substantial discount associated with a higher purchase-quantity. There is a consistent decline in the unit price as the purchase-quantity increases, a finding that corroborates the literature and anecdotal evidence.10 The unit price of an ounce is 40 per cent lower than the unit price of a quantity under five grams.
Average Cannabis Prices by Purchase-Quantity, 2015-16
Sources: Price of Weed; Caulkins, J. and R. Pacula (2006); PBO Calculations
Note: * A price of $9.36/g is a purchase-quantity-weighted average. Detailed calculations are available in Appendix A.3.
Box 2: Cannabis sales are often measured in imperial units. Some of the common imperial units applied, and their metric equivalents, are:
An eighth = 3.55 grams
A quarter = 7.1 grams
A half = 14.2 grams
An ounce = 28.4 grams
Figure 3-2
Legalized Cannabis: Fiscal Considerations
21
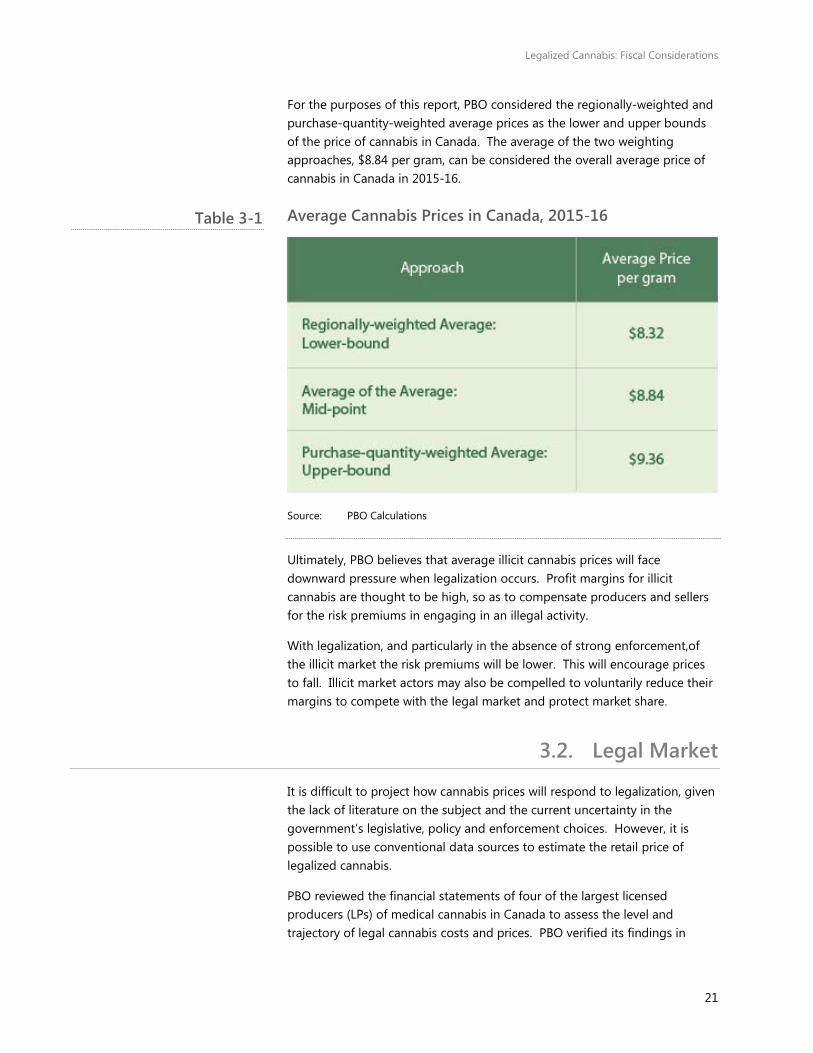
For the purposes of this report, PBO considered the regionally-weighted and purchase-quantity-weighted average prices as the lower and upper bounds of the price of cannabis in Canada. The average of the two weighting approaches, $8.84 per gram, can be considered the overall average price of cannabis in Canada in 2015-16.
Average Cannabis Prices in Canada, 2015-16
Source: PBO Calculations
Ultimately, PBO believes that average illicit cannabis prices will face downward pressure when legalization occurs. Profit margins for illicit cannabis are thought to be high, so as to compensate producers and sellers for the risk premiums in engaging in an illegal activity.
With legalization, and particularly in the absence of strong enforcement,of the illicit market the risk premiums will be lower. This will encourage prices to fall. Illicit market actors may also be compelled to voluntarily reduce their margins to compete with the legal market and protect market share.
3.2. Legal Market
It is difficult to project how cannabis prices will respond to legalization, given the lack of literature on the subject and the current uncertainty in the government’s legislative, policy and enforcement choices. However, it is possible to use conventional data sources to estimate the retail price of legalized cannabis.
PBO reviewed the financial statements of four of the largest licensed producers (LPs) of medical cannabis in Canada to assess the level and trajectory of legal cannabis costs and prices. PBO verified its findings in
Table 3-1
Legalized Cannabis: Fiscal Considerations
22
consultations with the management of four LPs.11 The results appear in Table 3-2.
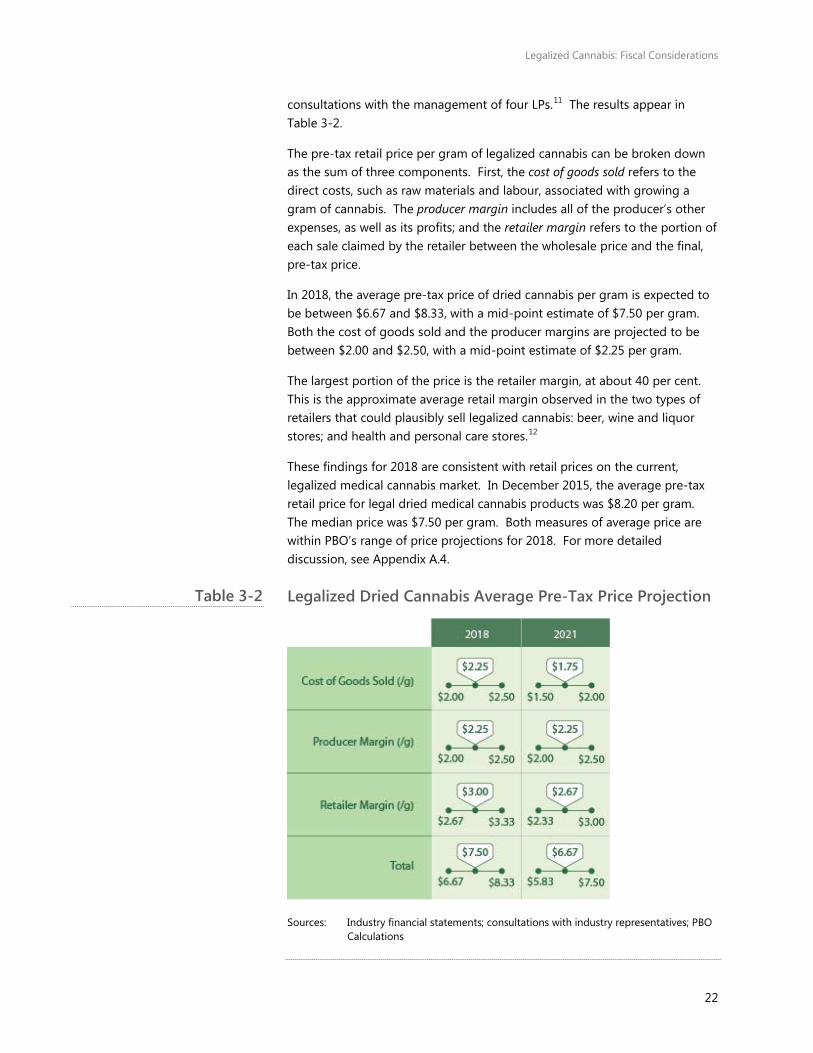
The pre-tax retail price per gram of legalized cannabis can be broken down as the sum of three components. First, the cost of goods sold refers to the direct costs, such as raw materials and labour, associated with growing a gram of cannabis. The producer margin includes all of the producer’s other expenses, as well as its profits; and the retailer margin refers to the portion of each sale claimed by the retailer between the wholesale price and the final, pre-tax price.
In 2018, the average pre-tax price of dried cannabis per gram is expected to be between $6.67 and $8.33, with a mid-point estimate of $7.50 per gram. Both the cost of goods sold and the producer margins are projected to be between $2.00 and $2.50, with a mid-point estimate of $2.25 per gram.
The largest portion of the price is the retailer margin, at about 40 per cent. This is the approximate average retail margin observed in the two types of retailers that could plausibly sell legalized cannabis: beer, wine and liquor stores; and health and personal care stores.12
These findings for 2018 are consistent with retail prices on the current, legalized medical cannabis market. In December 2015, the average pre-tax retail price for legal dried medical cannabis products was $8.20 per gram. The median price was $7.50 per gram. Both measures of average price are within PBO’s range of price projections for 2018. For more detailed discussion, see Appendix A.4.
Legalized Dried Cannabis Average Pre-Tax Price Projection
Sources: Industry financial statements; consultations with industry representatives; PBO Calculations
Table 3-2
Legalized Cannabis: Fiscal Considerations
23
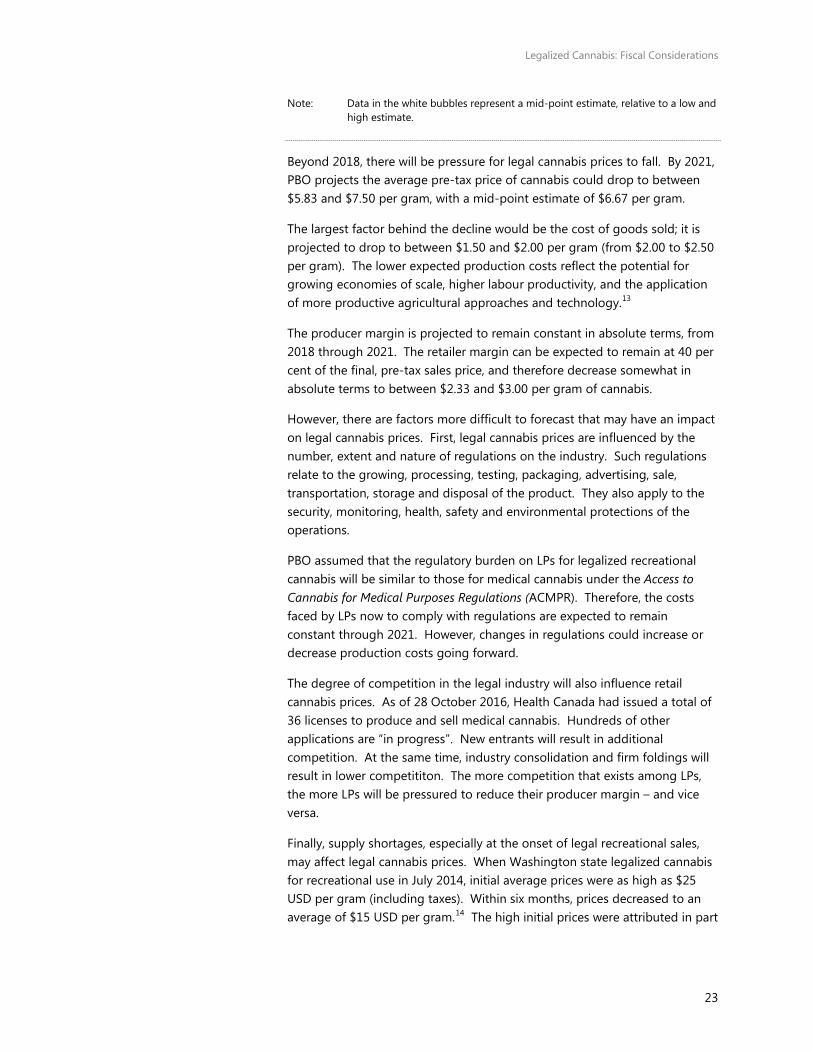
Note: Data in the white bubbles represent a mid-point estimate, relative to a low and high estimate.
Beyond 2018, there will be pressure for legal cannabis prices to fall. By 2021, PBO projects the average pre-tax price of cannabis could drop to between $5.83 and $7.50 per gram, with a mid-point estimate of $6.67 per gram.
The largest factor behind the decline would be the cost of goods sold; it is projected to drop to between $1.50 and $2.00 per gram (from $2.00 to $2.50 per gram). The lower expected production costs reflect the potential for growing economies of scale, higher labour productivity, and the application of more productive agricultural approaches and technology.13
The producer margin is projected to remain constant in absolute terms, from 2018 through 2021. The retailer margin can be expected to remain at 40 per cent of the final, pre-tax sales price, and therefore decrease somewhat in absolute terms to between $2.33 and $3.00 per gram of cannabis.
However, there are factors more difficult to forecast that may have an impact on legal cannabis prices. First, legal cannabis prices are influenced by the number, extent and nature of regulations on the industry. Such regulations relate to the growing, processing, testing, packaging, advertising, sale, transportation, storage and disposal of the product. They also apply to the security, monitoring, health, safety and environmental protections of the operations.
PBO assumed that the regulatory burden on LPs for legalized recreational cannabis will be similar to those for medical cannabis under the Access to Cannabis for Medical Purposes Regulations (ACMPR). Therefore, the costs faced by LPs now to comply with regulations are expected to remain constant through 2021. However, changes in regulations could increase or decrease production costs going forward.
The degree of competition in the legal industry will also influence retail cannabis prices. As of 28 October 2016, Health Canada had issued a total of 36 licenses to produce and sell medical cannabis. Hundreds of other applications are “in progress”. New entrants will result in additional competition. At the same time, industry consolidation and firm foldings will result in lower competititon. The more competition that exists among LPs, the more LPs will be pressured to reduce their producer margin – and vice versa.
Finally, supply shortages, especially at the onset of legal recreational sales, may affect legal cannabis prices. When Washington state legalized cannabis for recreational use in July 2014, initial average prices were as high as $25 USD per gram (including taxes). Within six months, prices decreased to an average of $15 USD per gram.14 The high initial prices were attributed in part
Legalized Cannabis: Fiscal Considerations
24
to supply shortages, and were brought down as the state licensed more cannabis producers and retailers.
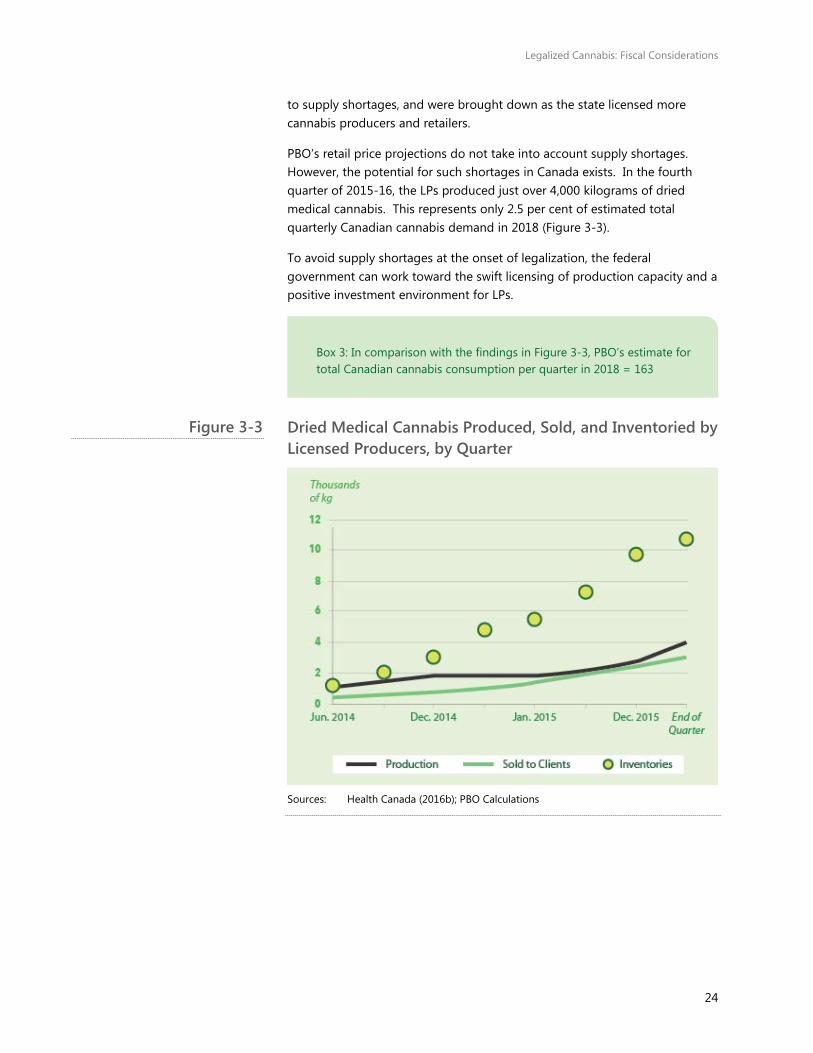
PBO’s retail price projections do not take into account supply shortages. However, the potential for such shortages in Canada exists. In the fourth quarter of 2015-16, the LPs produced just over 4,000 kilograms of dried medical cannabis. This represents only 2.5 per cent of estimated total quarterly Canadian cannabis demand in 2018 (Figure 3-3).
To avoid supply shortages at the onset of legalization, the federal government can work toward the swift licensing of production capacity and a positive investment environment for LPs.
Dried Medical Cannabis Produced, Sold, and Inventoried by Licensed Producers, by Quarter
Sources: Health Canada (2016b); PBO Calculations
Box 3: In comparison with the findings in Figure 3-3, PBO’s estimate for total Canadian cannabis consumption per quarter in 2018 = 163
Figure 3-3
Legalized Cannabis: Fiscal Considerations
25
4. Fiscal Space The federal government has stated its intention to tax legal cannabis sales.15 Total tax revenues will depend on total cannabis consumption and average retail prices. They will also depend on the level of taxation applied to legal cannabis products, as well as the relative market shares among the recreational, medical and illicit markets. This section considers how much room is available to apply taxes on cannabis, given the experience from other jurisdictions and current market conditions.
Generally speaking, the most important function of taxation is to raise revenues for government. However, in the case of cannabis, tax may also serve other ends, for example:
• to pay for any negative external costs of cannabis use to society;
• to discourage consumption, especially among youth;
• to manage the final price, including preventing a large price decline; and
• to fund programs associated with cannabis legalization.
As is the case with alcohol, tobacco and other demerit goods, the federal government may apply an excise tax in order to tax legal cannabis sales. There are multiple ways to do so. First, the tax may be levied at various stages of the production process: cultivation or distribution, or at the point of sales. The excise tax may also be levied on different bases: for example, by weight, potency (for example, the THC, or tetrahydrocannabinol content), or price.
Different products, such as edibles and concentrates, may require entirely different approaches to taxation. These variations, along with others, each have different implications for market incentives and fiscal revenues.16 For the purposes of this report – to provide an overview of potential revenues – PBO only considered retail and excise taxes applied at the point of sale, based on price.
Any excise or sales tax will only apply to legal cannabis, making it less competitive compared with illicit cannabis. Higher tax levels and, by extension, legal cannabis prices will act as a disincentive for current users to transfer to the legal market.
The legalization experience of other jurisdictions demonstrates the importance of having a competitive legal price for cannabis. When Colorado legalized recreational cannabis in 2014, it applied a combined tax rate approaching 30 per cent on recreational sales and a much lower state and local sales tax on medical purchases.
Legalized Cannabis: Fiscal Considerations
26
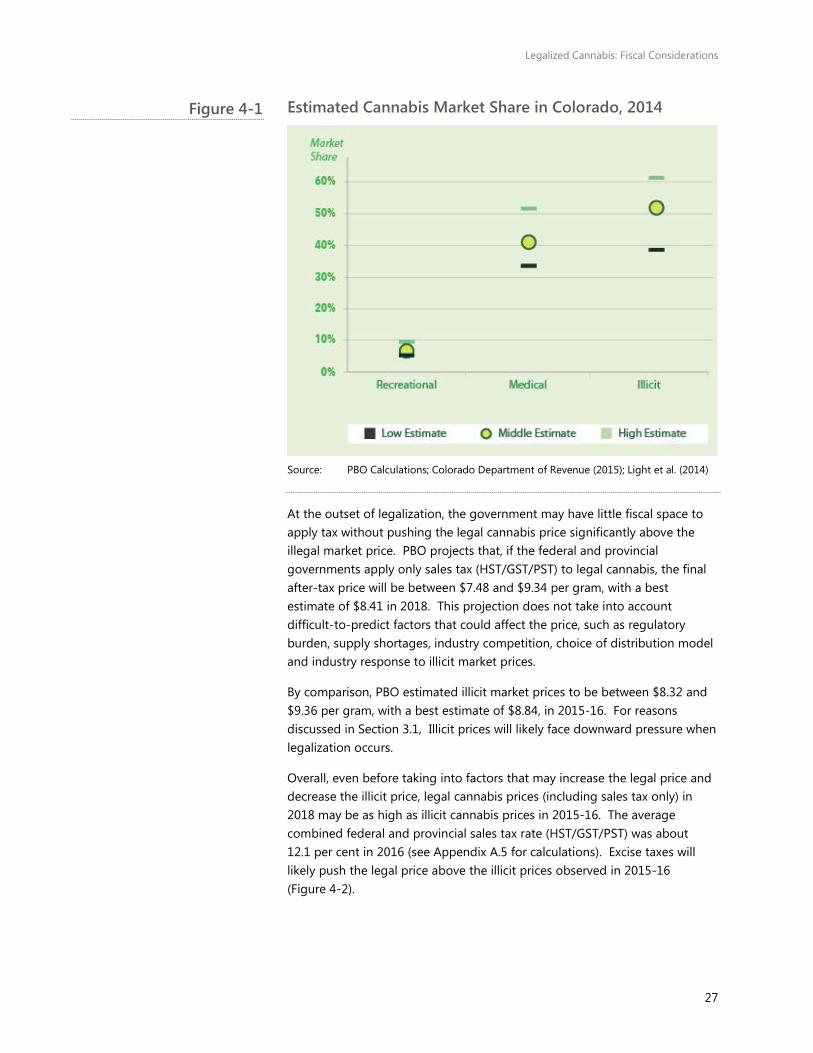
PBO estimates that, in the first full year of legal sales (2014), roughly half (40 to 60 per cent) of aggregate resident cannabis consumption in Colorado remained in the illicit market. Of the approximately 50 per cent of resident consumption in the legal market, about 80 per cent of that occurred in the lower-taxed medical market. Only 5 to 10 per cent of total resident consumption occurred in the fully-taxed, legal recreational market (Figure 4-1; see Appendix A.5 for detailed calculations and relevant assumptions).
The legalization experience of other jurisdictions also demonstrates the implications of medical cannabis tax policy. A lower tax rate on medical cannabis may provide an incentive for would-be recreational users to obtain a medical prescription. In Colorado in 2014, the majority of legal consumption consisted of medical consumption.
As of November 2016, legal medical cannabis sales in Canada were subject to sales tax. However, the latter may be deducted from income taxes as an allowable expense.17 Illicit cannabis sales are also ostensibly subject to sales tax.18
19
Box 4: When it legalized recreational cannabis sales in 2014, Colorado applied a combined tax rate approaching 30 per cent.19 The recreational cannabis tax structure consisted of:
• A wholesale excise tax (15.0 per cent, but whose effective rate is closer to 10.0 per cent since the tax is levied on the wholesale value of the product
• A (special) state cannabis sales tax (10.0 per cent), plus optional local cannabis sales tax
• A (regular) state sales tax (2.9 per cent) and local sales tax (0.0 to 7.5 per cent)
Medical cannabis sales were only subject to the regular state and local sales tax.
Legalized Cannabis: Fiscal Considerations
27
Estimated Cannabis Market Share in Colorado, 2014
Source: PBO Calculations; Colorado Department of Revenue (2015); Light et al. (2014)
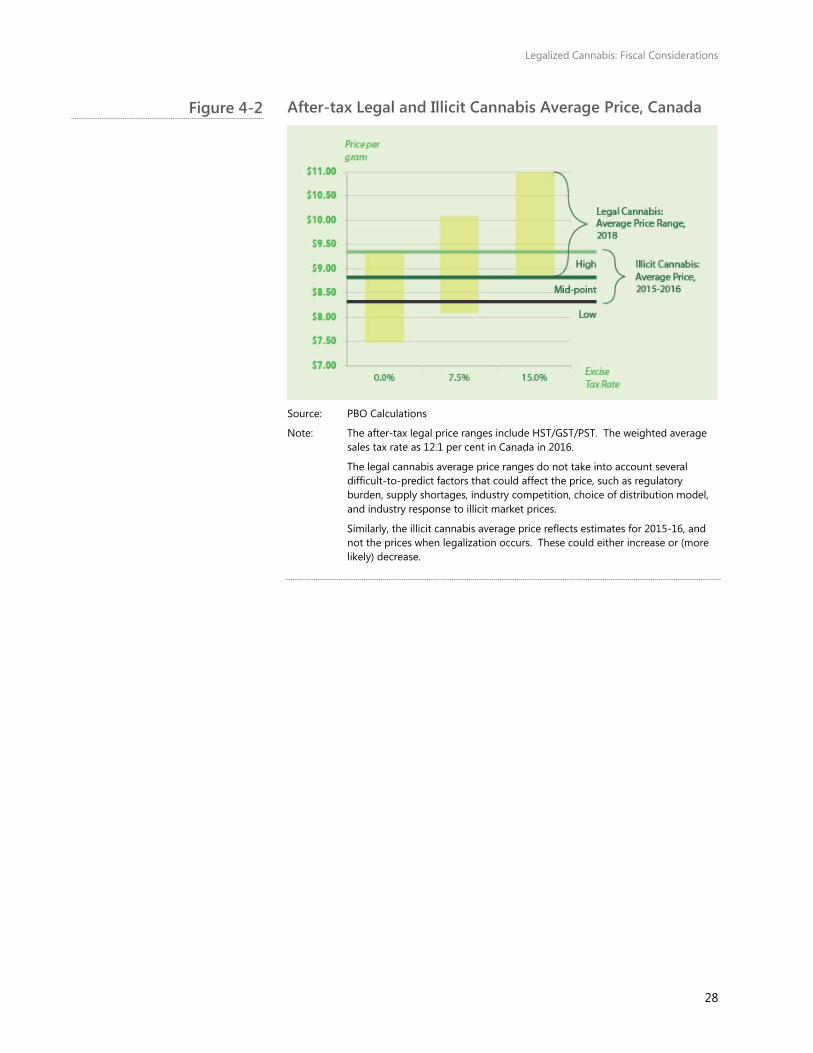
At the outset of legalization, the government may have little fiscal space to apply tax without pushing the legal cannabis price significantly above the illegal market price. PBO projects that, if the federal and provincial governments apply only sales tax (HST/GST/PST) to legal cannabis, the final after-tax price will be between $7.48 and $9.34 per gram, with a best estimate of $8.41 in 2018. This projection does not take into account difficult-to-predict factors that could affect the price, such as regulatory burden, supply shortages, industry competition, choice of distribution model and industry response to illicit market prices.
By comparison, PBO estimated illicit market prices to be between $8.32 and $9.36 per gram, with a best estimate of $8.84, in 2015-16. For reasons discussed in Section 3.1, Illicit prices will likely face downward pressure when legalization occurs.
Overall, even before taking into factors that may increase the legal price and decrease the illicit price, legal cannabis prices (including sales tax only) in 2018 may be as high as illicit cannabis prices in 2015-16. The average combined federal and provincial sales tax rate (HST/GST/PST) was about 12.1 per cent in 2016 (see Appendix A.5 for calculations). Excise taxes will likely push the legal price above the illicit prices observed in 2015-16 (Figure 4-2).
Figure 4-1
Legalized Cannabis: Fiscal Considerations
28
After-tax Legal and Illicit Cannabis Average Price, Canada
Source: PBO Calculations
Note: The after-tax legal price ranges include HST/GST/PST. The weighted average sales tax rate as 12.1 per cent in Canada in 2016.
The legal cannabis average price ranges do not take into account several difficult-to-predict factors that could affect the price, such as regulatory burden, supply shortages, industry competition, choice of distribution model, and industry response to illicit market prices.
Similarly, the illicit cannabis average price reflects estimates for 2015-16, and not the prices when legalization occurs. These could either increase or (more likely) decrease.
Figure 4-2
Legalized Cannabis: Fiscal Considerations
29
5. Price Sensitivity Up to this point, PBO’s analysis has not taken into account how different absolute and relative prices of legal and illicit cannabis may impact the economic and fiscal cannabis parameters. The legal and illicit prices, and how they interact with one another, will likely influence cannabis consumption, expenditure and tax revenues. This section presents a sensitivity analysis of different legal and illicit price scenarios and their impacts on other metrics.
PBO performed sensitivity analysis around average legal prices between $6.00 and $15.00 per gram, and average illicit prices between $5.00 and $10.00 per gram. The chosen legal price range is largely higher than PBO’s projections in Section 3.2 ($7.50 per gram; $8.41 including the average HST rate). This reflects the balance of factors that have more potential to increase the actual legal price in 2018, such as regulatory burden, supply shortages, and taxes.
Conversely, the chosen illicit price range is mostly lower than PBO’s estimate of the average illicit price in 2015-16 ($8.84 per gram). The lower range accounts for the likelihood for downward price pressure in the illicit market when legalization occurs.
The statistical starting point for sensitivity analysis was data from the Washington Cannabis Consumption Survey (CCS), as reported in Caulkins et al. (2015). The survey asked respondents how much of a premium users would be willing to pay for legal cannabis over similarly potent illicit cannabis. 3,488 responses were received during a ten-day period in 2013.
The survey has several limitations. First, it was an opt-in survey, so the respondents may not be representative of the user population. The survey was also conducted in Washington state, where users’ willingness to pay may be different than that of Canadians. Further, the survey is from 2013; user attitudes toward legal and illicit cannabis products and their willingness to pay for them may have changed since then. Finally, users’ reported willingness to pay may not accurately describe their actual behaviour when confronted with various legal and illicit cannabis prices. However, given the lack of data on users’ willingness to pay for legal cannabis, in any jurisdiction, the data from the Caulkins et al. (2015) formed a helpful basis for PBO’s sensitivity analysis.
Caulkins et al.’s (2015) results indicate that some users are willing to pay more, sometimes significantly more, for legal cannabis. Among the four surveyed user groups, between 35 and 55 per cent of users were willing to pay at least $5.00 USD more for legal cannabis over the illicit market price.
Legalized Cannabis: Fiscal Considerations
30
At the same time, between 15 and 40 per cent of users were not willing to pay any premium for legal cannabis.
However, willingness to pay is not equal across user groups. Frequent users are less willing to pay higher prices for legal cannabis than infrequent users. For example, among respondents who reported 1-3 cannabis past-month use-days, 21 per cent were not willing to pay a premium for legal cannabis, compared with 37.8 per cent among those reporting 21-30 past-month use-days. This result is intuitive, as frequent users with higher cannabis consumption are more sensitive to a higher cannabis price. The results from Caulkins et al. (2015) suggest that price is an important factor in a user’s decision to participate in the legal or illegal cannabis market. All else being equal, taxation will increase the legal price of cannabis and decrease legal market participation.
Given that a significant number of CCS respondents indicated a willingness to pay a premium for legal cannabis, price cannot be the only factor to determine consumption decisions. A non-exhaustive list of other factors that influence a user’s decision between buying from the legal or illicit market include:
• Accessibility;
• Convenience;
• Confidence in product safety and labelling;
• Compliance (real or perceived) with the the law;
• Safety comfort or agreeableness of the buying environment;
• Product quality;
• Product consistency;
• Product variety;
• Vendor expertise or connection;
• Brand appeal, loyalty or self-identification.
Government policy and regulatory decisions can influence the extent to which these factors are present in the legal cannabis market, and therefore impact users’ willingness to pay a premium for legal cannabis.
Legalized Cannabis: Fiscal Considerations
31
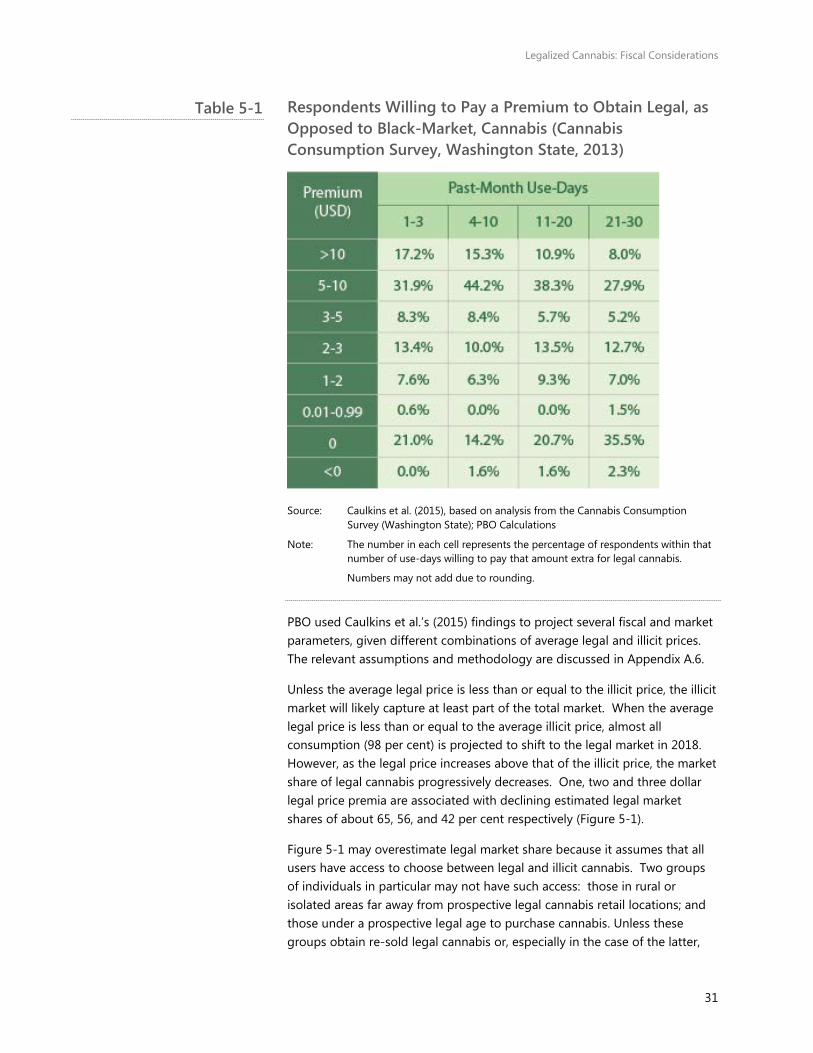
Respondents Willing to Pay a Premium to Obtain Legal, as Opposed to Black-Market, Cannabis (Cannabis Consumption Survey, Washington State, 2013)
Source: Caulkins et al. (2015), based on analysis from the Cannabis Consumption Survey (Washington State); PBO Calculations
Note: The number in each cell represents the percentage of respondents within that number of use-days willing to pay that amount extra for legal cannabis.
Numbers may not add due to rounding.
PBO used Caulkins et al.’s (2015) findings to project several fiscal and market parameters, given different combinations of average legal and illicit prices. The relevant assumptions and methodology are discussed in Appendix A.6.
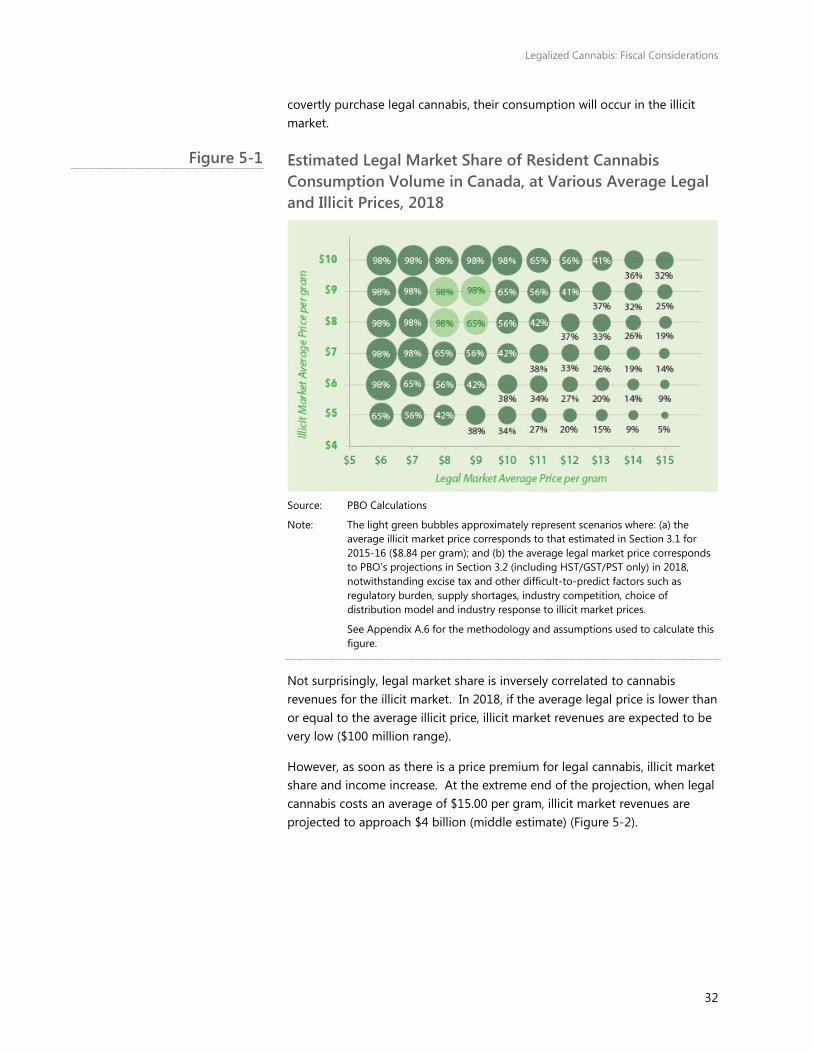
Unless the average legal price is less than or equal to the illicit price, the illicit market will likely capture at least part of the total market. When the average legal price is less than or equal to the average illicit price, almost all consumption (98 per cent) is projected to shift to the legal market in 2018. However, as the legal price increases above that of the illicit price, the market share of legal cannabis progressively decreases. One, two and three dollar legal price premia are associated with declining estimated legal market shares of about 65, 56, and 42 per cent respectively (Figure 5-1).
Figure 5-1 may overestimate legal market share because it assumes that all users have access to choose between legal and illicit cannabis. Two groups of individuals in particular may not have such access: those in rural or isolated areas far away from prospective legal cannabis retail locations; and those under a prospective legal age to purchase cannabis. Unless these groups obtain re-sold legal cannabis or, especially in the case of the latter,
Table 5-1
Legalized Cannabis: Fiscal Considerations
32
covertly purchase legal cannabis, their consumption will occur in the illicit market.
Estimated Legal Market Share of Resident Cannabis Consumption Volume in Canada, at Various Average Legal and Illicit Prices, 2018
Source: PBO Calculations
Note: The light green bubbles approximately represent scenarios where: (a) the average illicit market price corresponds to that estimated in Section 3.1 for 2015-16 ($8.84 per gram); and (b) the average legal market price corresponds to PBO’s projections in Section 3.2 (including HST/GST/PST only) in 2018, notwithstanding excise tax and other difficult-to-predict factors such as regulatory burden, supply shortages, industry competition, choice of distribution model and industry response to illicit market prices.
See Appendix A.6 for the methodology and assumptions used to calculate this figure.
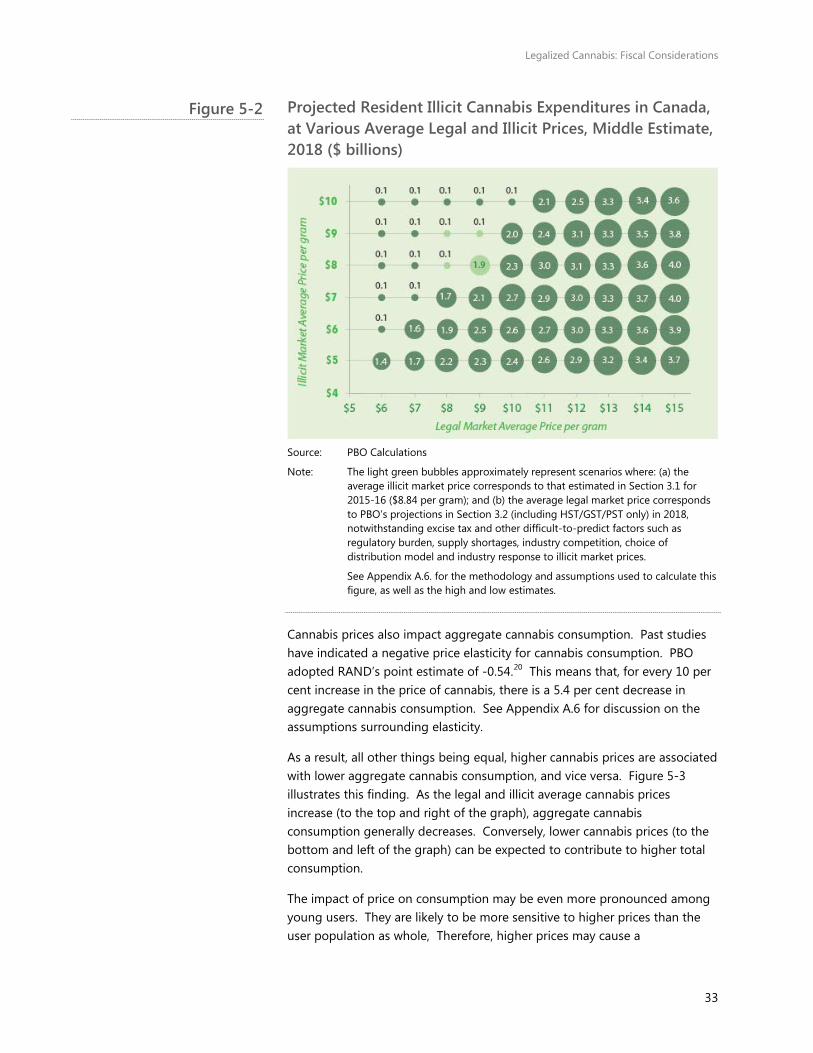
Not surprisingly, legal market share is inversely correlated to cannabis revenues for the illicit market. In 2018, if the average legal price is lower than or equal to the average illicit price, illicit market revenues are expected to be very low ($100 million range).
However, as soon as there is a price premium for legal cannabis, illicit market share and income increase. At the extreme end of the projection, when legal cannabis costs an average of $15.00 per gram, illicit market revenues are projected to approach $4 billion (middle estimate) (Figure 5-2).
Figure 5-1
Legalized Cannabis: Fiscal Considerations
33
Projected Resident Illicit Cannabis Expenditures in Canada, at Various Average Legal and Illicit Prices, Middle Estimate, 2018 ($ billions)
Source: PBO Calculations
Note: The light green bubbles approximately represent scenarios where: (a) the average illicit market price corresponds to that estimated in Section 3.1 for 2015-16 ($8.84 per gram); and (b) the average legal market price corresponds to PBO’s projections in Section 3.2 (including HST/GST/PST only) in 2018, notwithstanding excise tax and other difficult-to-predict factors such as regulatory burden, supply shortages, industry competition, choice of distribution model and industry response to illicit market prices.
See Appendix A.6. for the methodology and assumptions used to calculate this figure, as well as the high and low estimates.
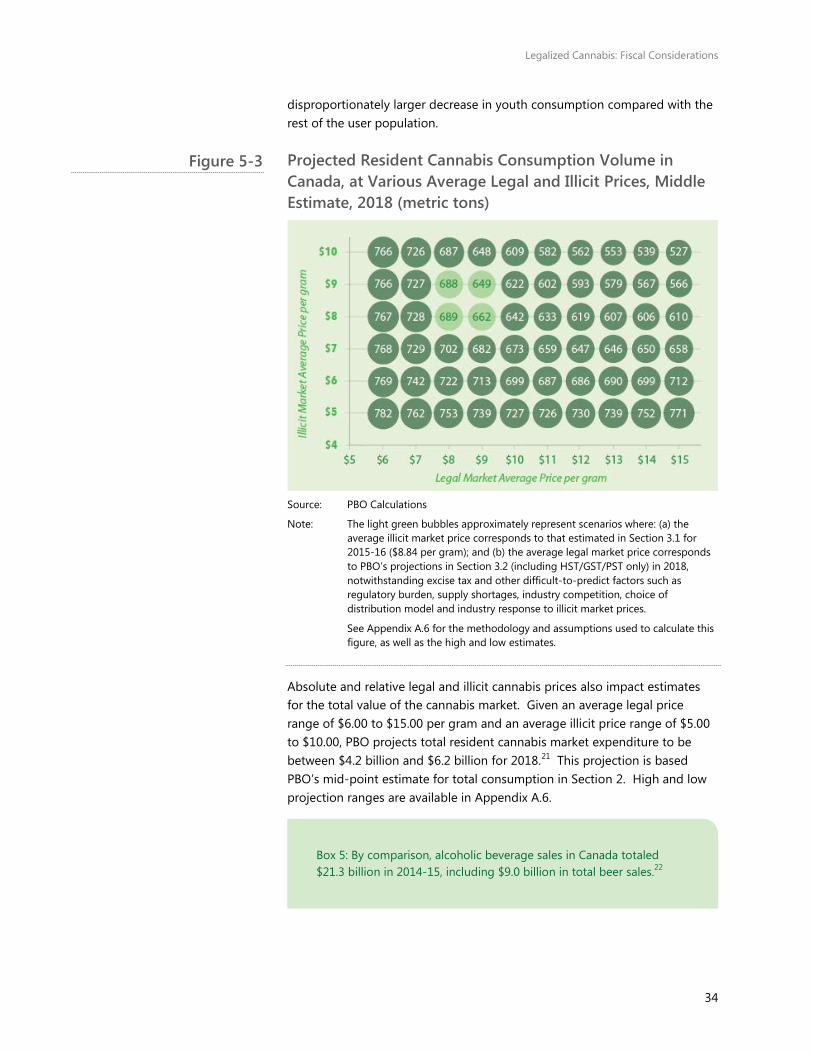
Cannabis prices also impact aggregate cannabis consumption. Past studies have indicated a negative price elasticity for cannabis consumption. PBO adopted RAND’s point estimate of -0.54.20 This means that, for every 10 per cent increase in the price of cannabis, there is a 5.4 per cent decrease in aggregate cannabis consumption. See Appendix A.6 for discussion on the assumptions surrounding elasticity.
As a result, all other things being equal, higher cannabis prices are associated with lower aggregate cannabis consumption, and vice versa. Figure 5-3 illustrates this finding. As the legal and illicit average cannabis prices increase (to the top and right of the graph), aggregate cannabis consumption generally decreases. Conversely, lower cannabis prices (to the bottom and left of the graph) can be expected to contribute to higher total consumption.
The impact of price on consumption may be even more pronounced among young users. They are likely to be more sensitive to higher prices than the user population as whole, Therefore, higher prices may cause a
Figure 5-2
Legalized Cannabis: Fiscal Considerations
34
disproportionately larger decrease in youth consumption compared with the rest of the user population.
Projected Resident Cannabis Consumption Volume in Canada, at Various Average Legal and Illicit Prices, Middle Estimate, 2018 (metric tons)
Source: PBO Calculations
Note: The light green bubbles approximately represent scenarios where: (a) the average illicit market price corresponds to that estimated in Section 3.1 for 2015-16 ($8.84 per gram); and (b) the average legal market price corresponds to PBO’s projections in Section 3.2 (including HST/GST/PST only) in 2018, notwithstanding excise tax and other difficult-to-predict factors such as regulatory burden, supply shortages, industry competition, choice of distribution model and industry response to illicit market prices.
See Appendix A.6 for the methodology and assumptions used to calculate this figure, as well as the high and low estimates.
Absolute and relative legal and illicit cannabis prices also impact estimates for the total value of the cannabis market. Given an average legal price range of $6.00 to $15.00 per gram and an average illicit price range of $5.00 to $10.00, PBO projects total resident cannabis market expenditure to be between $4.2 billion and $6.2 billion for 2018.21 This projection is based PBO’s mid-point estimate for total consumption in Section 2. High and low projection ranges are available in Appendix A.6.
22
Box 5: By comparison, alcoholic beverage sales in Canada totaled $21.3 billion in 2014-15, including $9.0 billion in total beer sales.22
Figure 5-3
Legalized Cannabis: Fiscal Considerations
35
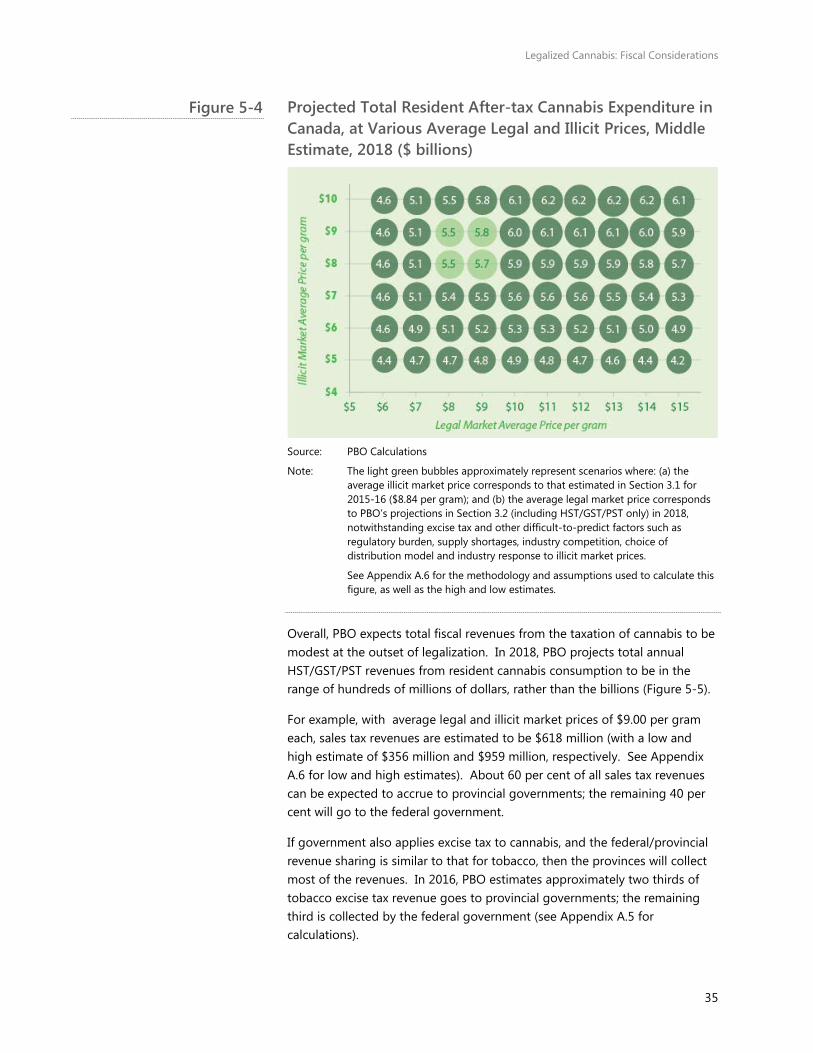
Projected Total Resident After-tax Cannabis Expenditure in Canada, at Various Average Legal and Illicit Prices, Middle Estimate, 2018 ($ billions)
Source: PBO Calculations
Note: The light green bubbles approximately represent scenarios where: (a) the average illicit market price corresponds to that estimated in Section 3.1 for 2015-16 ($8.84 per gram); and (b) the average legal market price corresponds to PBO’s projections in Section 3.2 (including HST/GST/PST only) in 2018, notwithstanding excise tax and other difficult-to-predict factors such as regulatory burden, supply shortages, industry competition, choice of distribution model and industry response to illicit market prices.
See Appendix A.6 for the methodology and assumptions used to calculate this figure, as well as the high and low estimates.
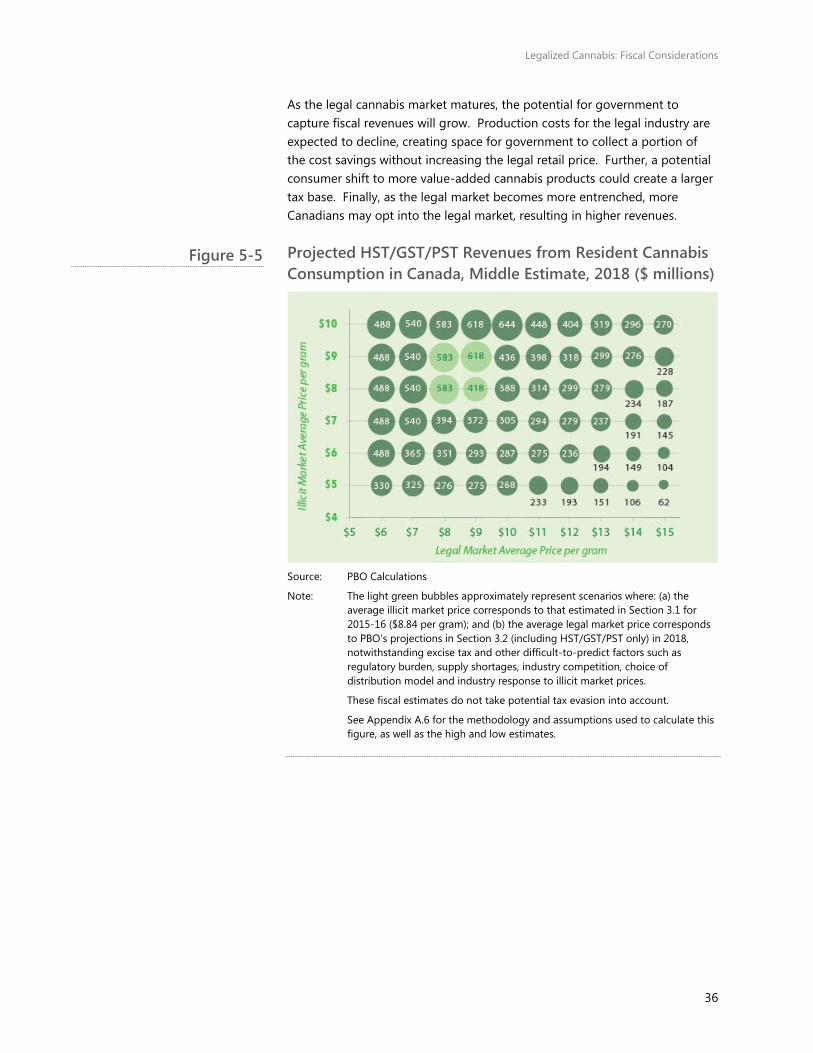
Overall, PBO expects total fiscal revenues from the taxation of cannabis to be modest at the outset of legalization. In 2018, PBO projects total annual HST/GST/PST revenues from resident cannabis consumption to be in the range of hundreds of millions of dollars, rather than the billions (Figure 5-5).
For example, with average legal and illicit market prices of $9.00 per gram each, sales tax revenues are estimated to be $618 million (with a low and high estimate of $356 million and $959 million, respectively. See Appendix A.6 for low and high estimates). About 60 per cent of all sales tax revenues can be expected to accrue to provincial governments; the remaining 40 per cent will go to the federal government.
If government also applies excise tax to cannabis, and the federal/provincial revenue sharing is similar to that for tobacco, then the provinces will collect most of the revenues. In 2016, PBO estimates approximately two thirds of tobacco excise tax revenue goes to provincial governments; the remaining third is collected by the federal government (see Appendix A.5 for calculations).
Figure 5-4
Legalized Cannabis: Fiscal Considerations
36
As the legal cannabis market matures, the potential for government to capture fiscal revenues will grow. Production costs for the legal industry are expected to decline, creating space for government to collect a portion of the cost savings without increasing the legal retail price. Further, a potential consumer shift to more value-added cannabis products could create a larger tax base. Finally, as the legal market becomes more entrenched, more Canadians may opt into the legal market, resulting in higher revenues.
Projected HST/GST/PST Revenues from Resident Cannabis Consumption in Canada, Middle Estimate, 2018 ($ millions)
Source: PBO Calculations
Note: The light green bubbles approximately represent scenarios where: (a) the average illicit market price corresponds to that estimated in Section 3.1 for 2015-16 ($8.84 per gram); and (b) the average legal market price corresponds to PBO’s projections in Section 3.2 (including HST/GST/PST only) in 2018, notwithstanding excise tax and other difficult-to-predict factors such as regulatory burden, supply shortages, industry competition, choice of distribution model and industry response to illicit market prices.
These fiscal estimates do not take potential tax evasion into account.
See Appendix A.6 for the methodology and assumptions used to calculate this figure, as well as the high and low estimates.
Figure 5-5
Legalized Cannabis: Fiscal Considerations
37
Extended Analysis & Appendix A:Detailed Methodology
Users A.1
There are four primary approaches to estimate the size of the cannabis market. Estimates can be based on production, seizures, expenditure, and consumption. This report makes a consumption-based estimate, as this approach has more available and reliable data in the Canadian context.
The most robust, recent, and Canada-specific source of data on cannabis use in Canada come from the 2012 Canadian Community Health Survey – Mental Health (CCHS-MH). The CCHS-MH, administered by Statistics Canada, sampled thousands of Canadians to determine characteristics of the prevalence and correlates of cannabis use in the country.
PBO transformed the CCHS-MH findings of reported use frequency into an estimate for the number of annual cannabis users in year a among all user groups i with the following formula:
Usersa = Σi [Populationa * Reported Use Frequencyi * Survey Mis/Underreporting Factori * Increase in Use Factora]
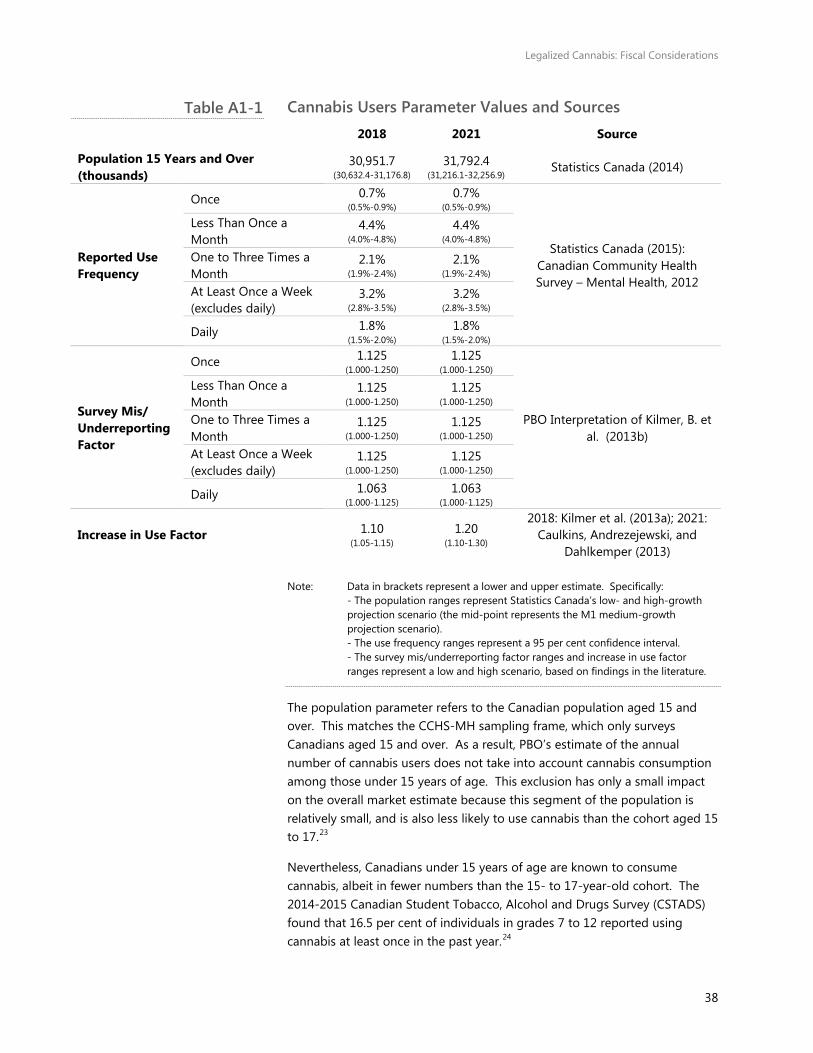
The values and ranges assigned to each parameter, and the associated source, are shown in Table A1-1.
Legalized Cannabis: Fiscal Considerations
38
Cannabis Users Parameter Values and Sources 2018 2021 Source
Population 15 Years and Over (thousands)
30,951.7 (30,632.4-31,176.8)
31,792.4 (31,216.1-32,256.9) Statistics Canada (2014)
Reported Use Frequency
Once 0.7%
(0.5%-0.9%) 0.7%
(0.5%-0.9%)
Statistics Canada (2015): Canadian Community Health Survey – Mental Health, 2012
Less Than Once a Month
4.4% (4.0%-4.8%)
4.4% (4.0%-4.8%)
One to Three Times a Month
2.1% (1.9%-2.4%)
2.1% (1.9%-2.4%)
At Least Once a Week (excludes daily)
3.2% (2.8%-3.5%)
3.2% (2.8%-3.5%)
Daily 1.8% (1.5%-2.0%)
1.8% (1.5%-2.0%)
Survey Mis/ Underreporting Factor
Once 1.125 (1.000-1.250)
1.125 (1.000-1.250)
PBO Interpretation of Kilmer, B. et al. (2013b)
Less Than Once a Month
1.125 (1.000-1.250)
1.125 (1.000-1.250)
One to Three Times a Month
1.125 (1.000-1.250)
1.125 (1.000-1.250)
At Least Once a Week (excludes daily)
1.125 (1.000-1.250)
1.125 (1.000-1.250)
Daily 1.063 (1.000-1.125)
1.063 (1.000-1.125)
Increase in Use Factor 1.10 (1.05-1.15)
1.20 (1.10-1.30)
2018: Kilmer et al. (2013a); 2021: Caulkins, Andrezejewski, and
Dahlkemper (2013) Note: Data in brackets represent a lower and upper estimate. Specifically: - The population ranges represent Statistics Canada’s low- and high-growth
projection scenario (the mid-point represents the M1 medium-growth projection scenario).
- The use frequency ranges represent a 95 per cent confidence interval. - The survey mis/underreporting factor ranges and increase in use factor
ranges represent a low and high scenario, based on findings in the literature.
The population parameter refers to the Canadian population aged 15 and over. This matches the CCHS-MH sampling frame, which only surveys Canadians aged 15 and over. As a result, PBO’s estimate of the annual number of cannabis users does not take into account cannabis consumption among those under 15 years of age. This exclusion has only a small impact on the overall market estimate because this segment of the population is relatively small, and is also less likely to use cannabis than the cohort aged 15 to 17.23
Nevertheless, Canadians under 15 years of age are known to consume cannabis, albeit in fewer numbers than the 15- to 17-year-old cohort. The 2014-2015 Canadian Student Tobacco, Alcohol and Drugs Survey (CSTADS) found that 16.5 per cent of individuals in grades 7 to 12 reported using cannabis at least once in the past year.24
Table A1-1
Legalized Cannabis: Fiscal Considerations
39
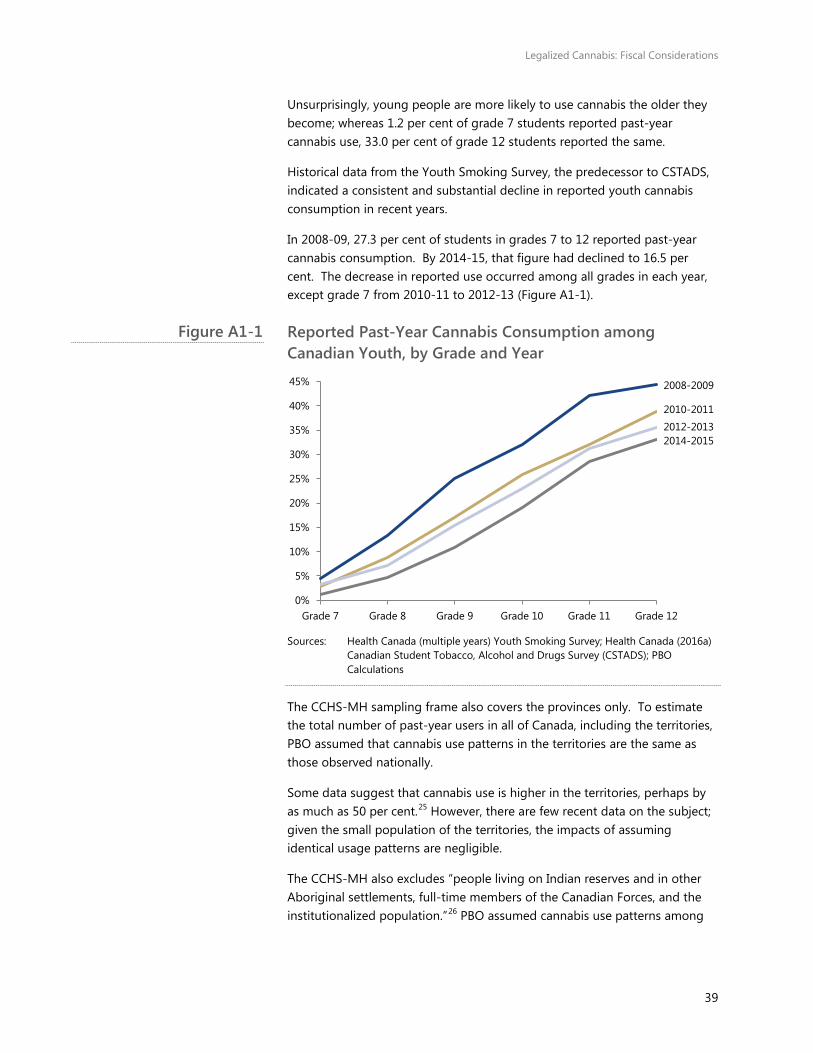
Unsurprisingly, young people are more likely to use cannabis the older they become; whereas 1.2 per cent of grade 7 students reported past-year cannabis use, 33.0 per cent of grade 12 students reported the same.
Historical data from the Youth Smoking Survey, the predecessor to CSTADS, indicated a consistent and substantial decline in reported youth cannabis consumption in recent years.
In 2008-09, 27.3 per cent of students in grades 7 to 12 reported past-year cannabis consumption. By 2014-15, that figure had declined to 16.5 per cent. The decrease in reported use occurred among all grades in each year, except grade 7 from 2010-11 to 2012-13 (Figure A1-1).
Reported Past-Year Cannabis Consumption among Canadian Youth, by Grade and Year
Sources: Health Canada (multiple years) Youth Smoking Survey; Health Canada (2016a)
Canadian Student Tobacco, Alcohol and Drugs Survey (CSTADS); PBO Calculations
The CCHS-MH sampling frame also covers the provinces only. To estimate the total number of past-year users in all of Canada, including the territories, PBO assumed that cannabis use patterns in the territories are the same as those observed nationally.
Some data suggest that cannabis use is higher in the territories, perhaps by as much as 50 per cent.25 However, there are few recent data on the subject; given the small population of the territories, the impacts of assuming identical usage patterns are negligible.
The CCHS-MH also excludes “people living on Indian reserves and in other Aboriginal settlements, full-time members of the Canadian Forces, and the institutionalized population.”26 PBO assumed cannabis use patterns among
2008-2009
2010-2011 2012-2013 2014-2015
0%
5%
10%
15%
20%
25%
30%
35%
40%
45%
Grade 7 Grade 8 Grade 9 Grade 10 Grade 11 Grade 12
Figure A1-1
Legalized Cannabis: Fiscal Considerations
40
the population excluded from Statistics Canada’s sampling frame reflect those of the rest of the Canadian population aged 15 and over.
However, there is evidence that cannabis use is higher among Indigenous Canadians on-reserve,27 lower among active members of the Armed Forces,28 and higher or lower among the institutionalized population.29 Further research into the usage patterns among these sub-groups would be instructive for policy-making.
But given the small size of the excluded population – under 3 per cent of Statistics Canada’s target population – and the offsetting cannabis use trends among the excluded populations in the literature, the impact of assuming identical usage patterns is negligible.
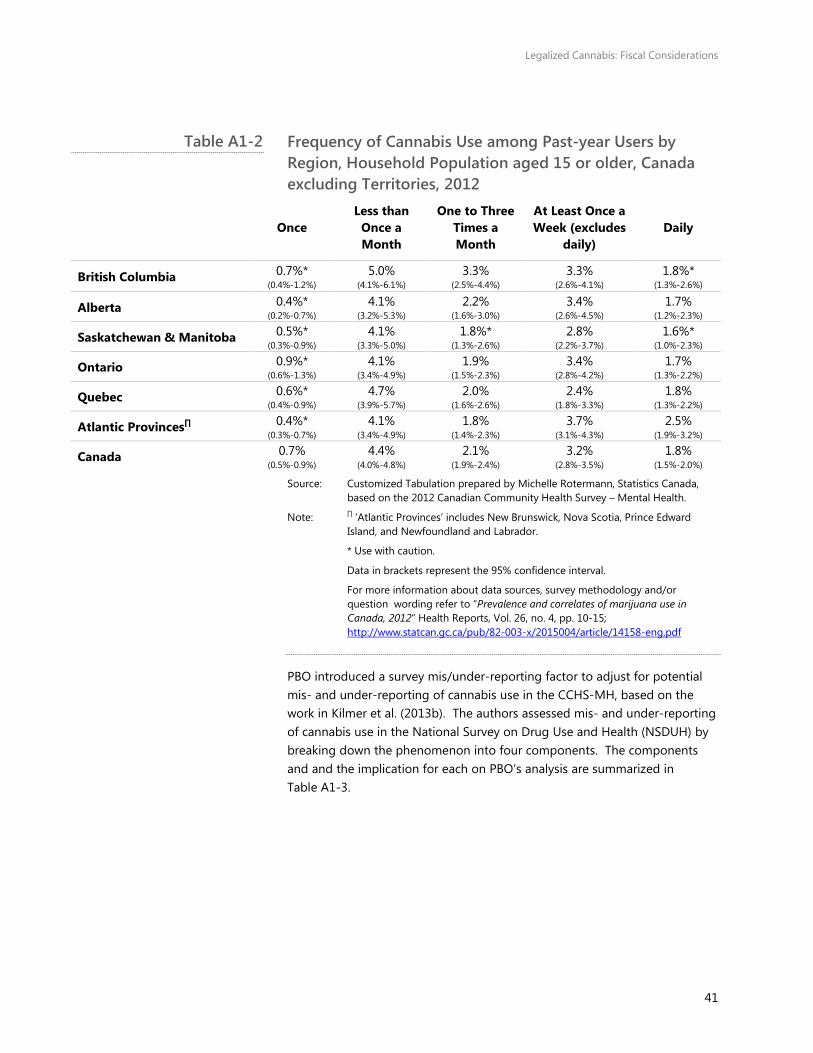
Statitics Canada prepared a customized tabulation for PBO on cannabis use patterns in different regions. With Statistics Canada’s permission, the results are displayed below in Table A1-2.
For the most part, there are no statistically significant differences in cannabis use patterns across the country; the confidence intervals around the provincial means largely encompass the national averages. There are two notable exceptions to the trend. There are more British Columbians reporting cannabis use one to three times a month compared with the national average. There are also more Atlantic Canadians reporting daily cannabis use compared with the national average.
Legalized Cannabis: Fiscal Considerations
41
Frequency of Cannabis Use among Past-year Users by Region, Household Population aged 15 or older, Canada excluding Territories, 2012
Once Less than
Once a Month
One to Three Times a Month
At Least Once a Week (excludes
daily) Daily
British Columbia 0.7%* (0.4%-1.2%)
5.0% (4.1%-6.1%)
3.3% (2.5%-4.4%)
3.3% (2.6%-4.1%)
1.8%* (1.3%-2.6%)
Alberta 0.4%* (0.2%-0.7%)
4.1% (3.2%-5.3%)
2.2% (1.6%-3.0%)
3.4% (2.6%-4.5%)
1.7% (1.2%-2.3%)
Saskatchewan & Manitoba 0.5%* (0.3%-0.9%)
4.1% (3.3%-5.0%)
1.8%* (1.3%-2.6%)
2.8% (2.2%-3.7%)
1.6%* (1.0%-2.3%)
Ontario 0.9%* (0.6%-1.3%)
4.1% (3.4%-4.9%)
1.9% (1.5%-2.3%)
3.4% (2.8%-4.2%)
1.7% (1.3%-2.2%)
Quebec 0.6%* (0.4%-0.9%)
4.7% (3.9%-5.7%)
2.0% (1.6%-2.6%)
2.4% (1.8%-3.3%)
1.8% (1.3%-2.2%)
Atlantic Provinces∏ 0.4%* (0.3%-0.7%)
4.1% (3.4%-4.9%)
1.8% (1.4%-2.3%)
3.7% (3.1%-4.3%)
2.5% (1.9%-3.2%)
Canada 0.7% (0.5%-0.9%)
4.4% (4.0%-4.8%)
2.1% (1.9%-2.4%)
3.2% (2.8%-3.5%)
1.8% (1.5%-2.0%)
Source: Customized Tabulation prepared by Michelle Rotermann, Statistics Canada, based on the 2012 Canadian Community Health Survey – Mental Health.
Note: ∏ ‘Atlantic Provinces’ includes New Brunswick, Nova Scotia, Prince Edward Island, and Newfoundland and Labrador.
* Use with caution.
Data in brackets represent the 95% confidence interval.
For more information about data sources, survey methodology and/or question wording refer to “Prevalence and correlates of marijuana use in Canada, 2012” Health Reports, Vol. 26, no. 4, pp. 10-15; http://www.statcan.gc.ca/pub/82-003-x/2015004/article/14158-eng.pdf
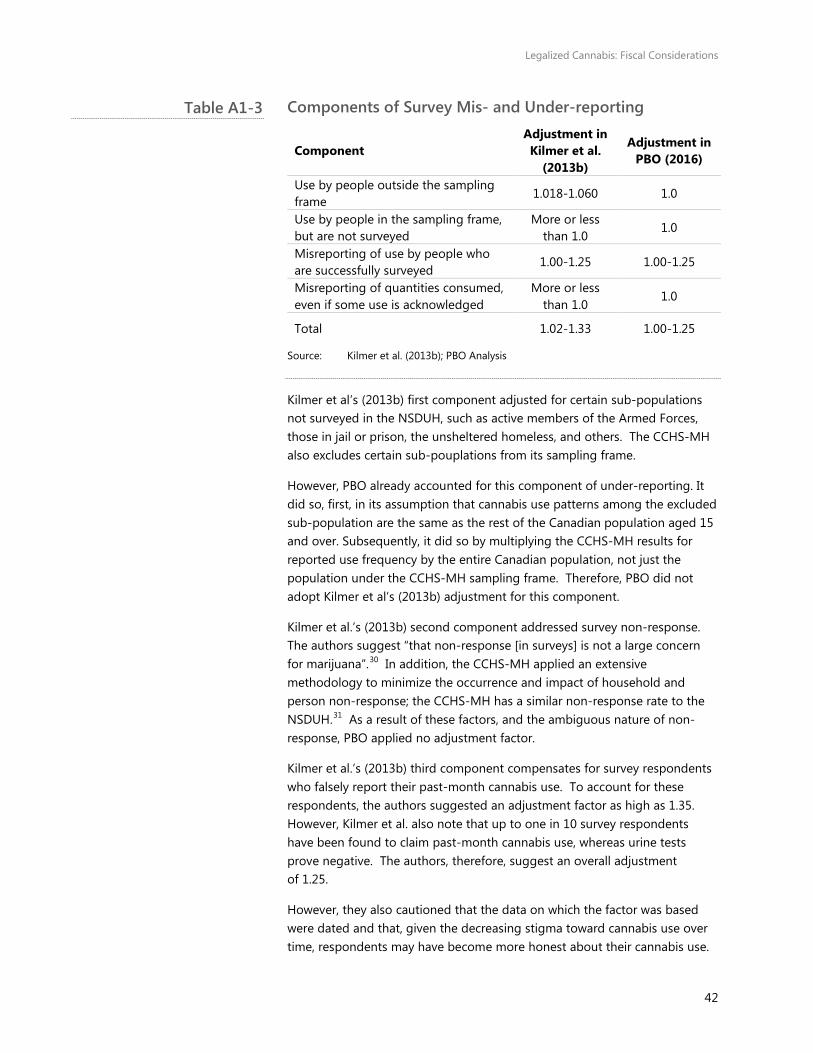
PBO introduced a survey mis/under-reporting factor to adjust for potential mis- and under-reporting of cannabis use in the CCHS-MH, based on the work in Kilmer et al. (2013b). The authors assessed mis- and under-reporting of cannabis use in the National Survey on Drug Use and Health (NSDUH) by breaking down the phenomenon into four components. The components and and the implication for each on PBO’s analysis are summarized in Table A1-3.
Table A1-2
Legalized Cannabis: Fiscal Considerations
42
Components of Survey Mis- and Under-reporting
Component Adjustment in Kilmer et al.
(2013b)
Adjustment in PBO (2016)
Use by people outside the sampling frame
1.018-1.060 1.0
Use by people in the sampling frame, but are not surveyed
More or less than 1.0
1.0
Misreporting of use by people who are successfully surveyed
1.00-1.25 1.00-1.25
Misreporting of quantities consumed, even if some use is acknowledged
More or less than 1.0
1.0
Total 1.02-1.33 1.00-1.25
Source: Kilmer et al. (2013b); PBO Analysis
Kilmer et al’s (2013b) first component adjusted for certain sub-populations not surveyed in the NSDUH, such as active members of the Armed Forces, those in jail or prison, the unsheltered homeless, and others. The CCHS-MH also excludes certain sub-pouplations from its sampling frame.
However, PBO already accounted for this component of under-reporting. It did so, first, in its assumption that cannabis use patterns among the excluded sub-population are the same as the rest of the Canadian population aged 15 and over. Subsequently, it did so by multiplying the CCHS-MH results for reported use frequency by the entire Canadian population, not just the population under the CCHS-MH sampling frame. Therefore, PBO did not adopt Kilmer et al’s (2013b) adjustment for this component.
Kilmer et al.’s (2013b) second component addressed survey non-response. The authors suggest “that non-response [in surveys] is not a large concern for marijuana”.30 In addition, the CCHS-MH applied an extensive methodology to minimize the occurrence and impact of household and person non-response; the CCHS-MH has a similar non-response rate to the NSDUH.31 As a result of these factors, and the ambiguous nature of non-response, PBO applied no adjustment factor.
Kilmer et al.’s (2013b) third component compensates for survey respondents who falsely report their past-month cannabis use. To account for these respondents, the authors suggested an adjustment factor as high as 1.35. However, Kilmer et al. also note that up to one in 10 survey respondents have been found to claim past-month cannabis use, whereas urine tests prove negative. The authors, therefore, suggest an overall adjustment of 1.25.
However, they also cautioned that the data on which the factor was based were dated and that, given the decreasing stigma toward cannabis use over time, respondents may have become more honest about their cannabis use.
Table A1-3
Legalized Cannabis: Fiscal Considerations
43
PBO, therefore, considered an adjustment factor of 1.25 as an upper-bound, 1.00 as a lower-bound (no mis-reporting), and applied the mid-point – 1.125 – as its adjustment factor for mis-reporting.
Kilmer et al. (2013b) found that the fourth component of mis- and under-reporting – those who acknowledge past-month cannabis use but mis-state how much they used – is also ambiguous in the direction of its impact. PBO, therefore, applied no adjustment factor.
PBO applied one further measure to nuance the mis/under-reporting factor. Following Light et al. (2014), PBO divided the mis/under-reporting factor range in half for daily cannabis users. This was done because (a) frequent cannabis users are less able to conceal, and therefore more willing to be comfortable and open with their use habits; and (b) some daily users may be medical cannabis patients who are legally allowed to consume. Therefore, they have less reason to conceal their consumption when responding to a survey.
Finally, the increase in use parameter was necessary to account for changes in cannabis use prevalence in Canada since the CCHS-MH was conducted in 2012, especially in light of the potential impacts of legalization on cannabis use.
The literature is not conclusive on the overall impact of cannabis legalization on use frequency – though on balance, legalization appears more likely to increase aggregate consumption. There are a number of offsetting factors that could plausibly impact cannabis demand following legalization. Demand could increase due to factors such as:
• Increased social acceptance and changing cultural attitudes toward cannabis consumption;
• Change in legal risk;
• Lower prices;
• Potential substitution and complementary effects with other substances, notably alcohol, tobacco and opioids;
• Marketing and advertising;
• The introduction of new cannabis products and new applications of existing cannabis products; and
• Increased access to cannabis.
Demand could also decrease due to other factors such as:
• Fewer youth and young people using cannabis;
• Education and public health efforts that discourage consumption; and
• Higher prices.
Legalized Cannabis: Fiscal Considerations
44
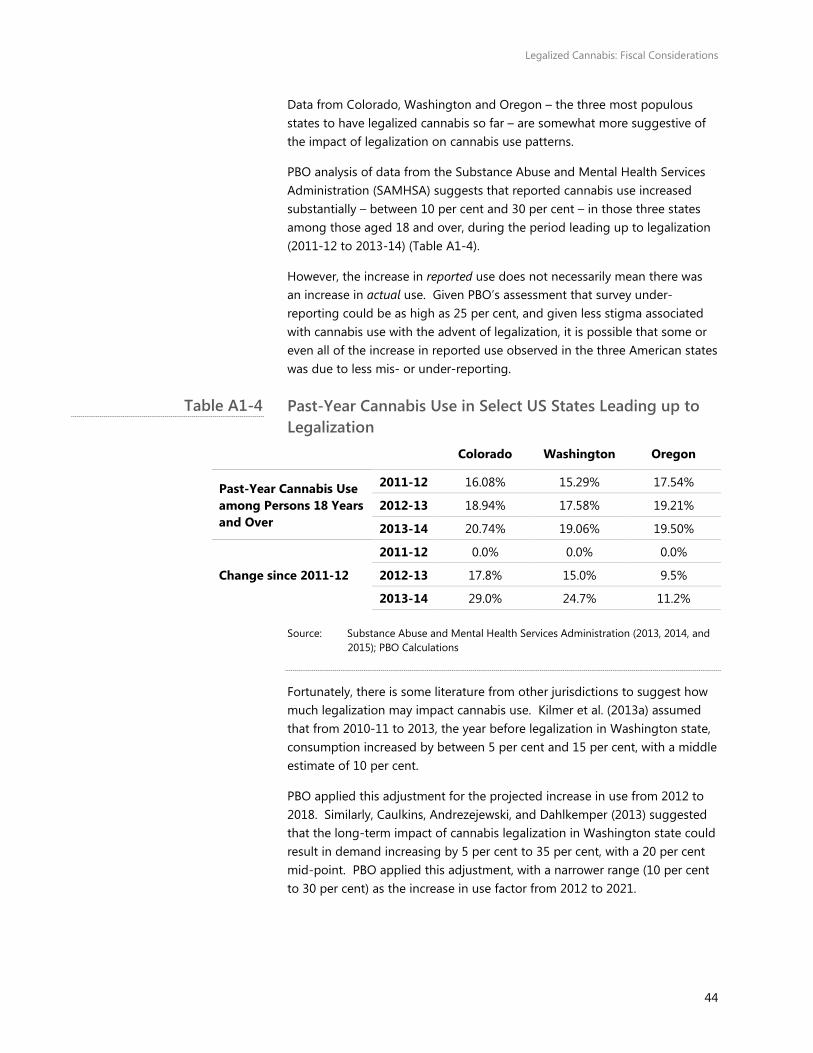
Data from Colorado, Washington and Oregon – the three most populous states to have legalized cannabis so far – are somewhat more suggestive of the impact of legalization on cannabis use patterns.
PBO analysis of data from the Substance Abuse and Mental Health Services Administration (SAMHSA) suggests that reported cannabis use increased substantially – between 10 per cent and 30 per cent – in those three states among those aged 18 and over, during the period leading up to legalization (2011-12 to 2013-14) (Table A1-4).
However, the increase in reported use does not necessarily mean there was an increase in actual use. Given PBO’s assessment that survey under-reporting could be as high as 25 per cent, and given less stigma associated with cannabis use with the advent of legalization, it is possible that some or even all of the increase in reported use observed in the three American states was due to less mis- or under-reporting.
Past-Year Cannabis Use in Select US States Leading up to Legalization
Colorado Washington Oregon
Past-Year Cannabis Use among Persons 18 Years and Over
2011-12 16.08% 15.29% 17.54%
2012-13 18.94% 17.58% 19.21%
2013-14 20.74% 19.06% 19.50%
Change since 2011-12
2011-12 0.0% 0.0% 0.0%
2012-13 17.8% 15.0% 9.5%
2013-14 29.0% 24.7% 11.2%
Source: Substance Abuse and Mental Health Services Administration (2013, 2014, and 2015); PBO Calculations
Fortunately, there is some literature from other jurisdictions to suggest how much legalization may impact cannabis use. Kilmer et al. (2013a) assumed that from 2010-11 to 2013, the year before legalization in Washington state, consumption increased by between 5 per cent and 15 per cent, with a middle estimate of 10 per cent.
PBO applied this adjustment for the projected increase in use from 2012 to 2018. Similarly, Caulkins, Andrezejewski, and Dahlkemper (2013) suggested that the long-term impact of cannabis legalization in Washington state could result in demand increasing by 5 per cent to 35 per cent, with a 20 per cent mid-point. PBO applied this adjustment, with a narrower range (10 per cent to 30 per cent) as the increase in use factor from 2012 to 2021.
Table A1-4
Legalized Cannabis: Fiscal Considerations
45
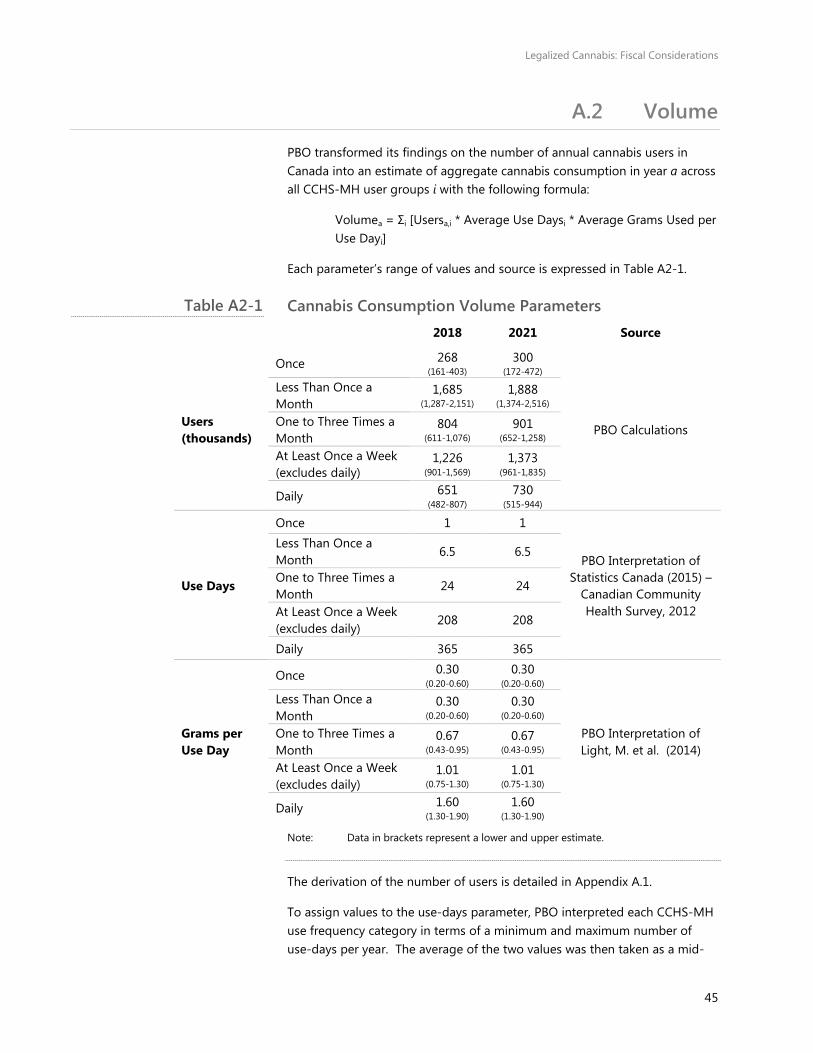
A.2 Volume
PBO transformed its findings on the number of annual cannabis users in Canada into an estimate of aggregate cannabis consumption in year a across all CCHS-MH user groups i with the following formula:
Volumea = Σi [Usersa,i * Average Use Daysi * Average Grams Used per Use Dayi]
Each parameter’s range of values and source is expressed in Table A2-1.
Cannabis Consumption Volume Parameters 2018 2021 Source
Users (thousands)
Once 268
(161-403) 300
(172-472)
PBO Calculations
Less Than Once a Month
1,685 (1,287-2,151)
1,888 (1,374-2,516)
One to Three Times a Month
804 (611-1,076)
901 (652-1,258)
At Least Once a Week (excludes daily)
1,226 (901-1,569)
1,373 (961-1,835)
Daily 651 (482-807)
730 (515-944)
Use Days
Once 1 1
PBO Interpretation of Statistics Canada (2015) –
Canadian Community Health Survey, 2012
Less Than Once a Month
6.5 6.5
One to Three Times a Month
24 24
At Least Once a Week (excludes daily)
208 208
Daily 365 365
Grams per Use Day
Once 0.30 (0.20-0.60)
0.30 (0.20-0.60)
PBO Interpretation of Light, M. et al. (2014)
Less Than Once a Month
0.30 (0.20-0.60)
0.30 (0.20-0.60)
One to Three Times a Month
0.67 (0.43-0.95)
0.67 (0.43-0.95)
At Least Once a Week (excludes daily)
1.01 (0.75-1.30)
1.01 (0.75-1.30)
Daily 1.60 (1.30-1.90)
1.60 (1.30-1.90)
Note: Data in brackets represent a lower and upper estimate.
The derivation of the number of users is detailed in Appendix A.1.
To assign values to the use-days parameter, PBO interpreted each CCHS-MH use frequency category in terms of a minimum and maximum number of use-days per year. The average of the two values was then taken as a mid-
Table A2-1
Legalized Cannabis: Fiscal Considerations
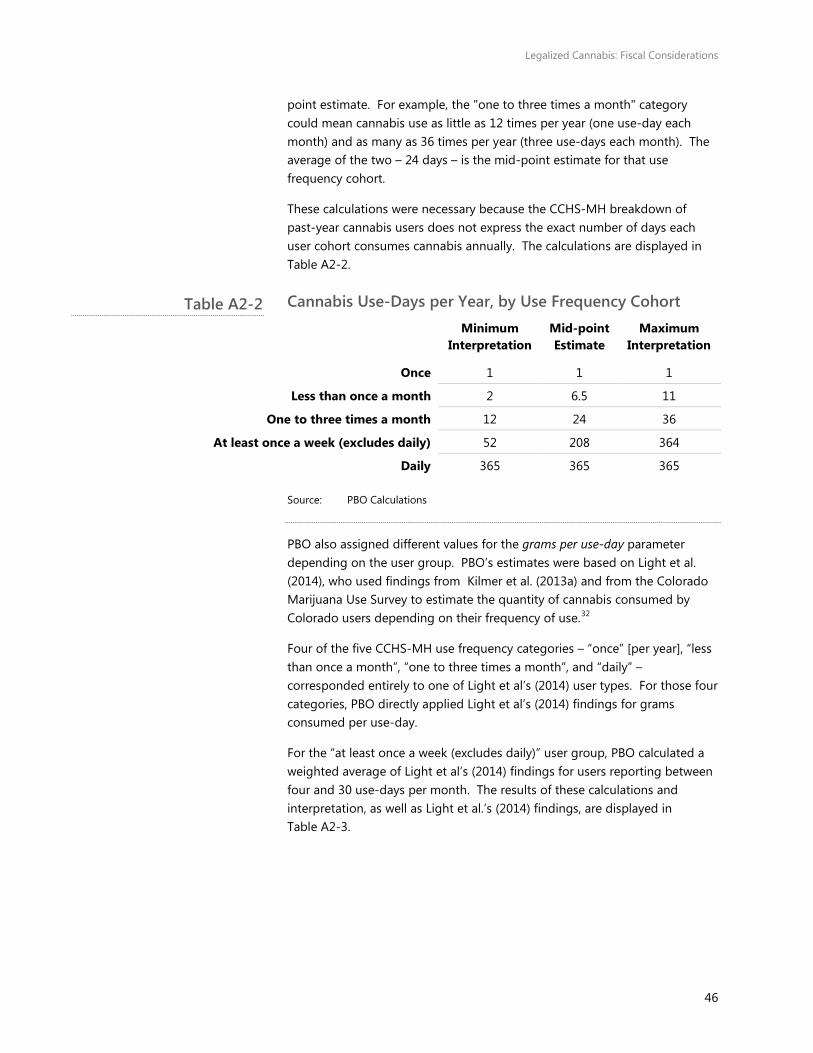
46
point estimate. For example, the "one to three times a month" category could mean cannabis use as little as 12 times per year (one use-day each month) and as many as 36 times per year (three use-days each month). The average of the two – 24 days – is the mid-point estimate for that use frequency cohort.
These calculations were necessary because the CCHS-MH breakdown of past-year cannabis users does not express the exact number of days each user cohort consumes cannabis annually. The calculations are displayed in Table A2-2.
Cannabis Use-Days per Year, by Use Frequency Cohort
Minimum
Interpretation Mid-point Estimate
Maximum Interpretation
Once 1 1 1
Less than once a month 2 6.5 11
One to three times a month 12 24 36
At least once a week (excludes daily) 52 208 364
Daily 365 365 365
Source: PBO Calculations
PBO also assigned different values for the grams per use-day parameter depending on the user group. PBO’s estimates were based on Light et al. (2014), who used findings from Kilmer et al. (2013a) and from the Colorado Marijuana Use Survey to estimate the quantity of cannabis consumed by Colorado users depending on their frequency of use.32
Four of the five CCHS-MH use frequency categories – “once” [per year], “less than once a month”, “one to three times a month”, and “daily” – corresponded entirely to one of Light et al’s (2014) user types. For those four categories, PBO directly applied Light et al’s (2014) findings for grams consumed per use-day.
For the “at least once a week (excludes daily)” user group, PBO calculated a weighted average of Light et al’s (2014) findings for users reporting between four and 30 use-days per month. The results of these calculations and interpretation, as well as Light et al.’s (2014) findings, are displayed in Table A2-3.
Table A2-2
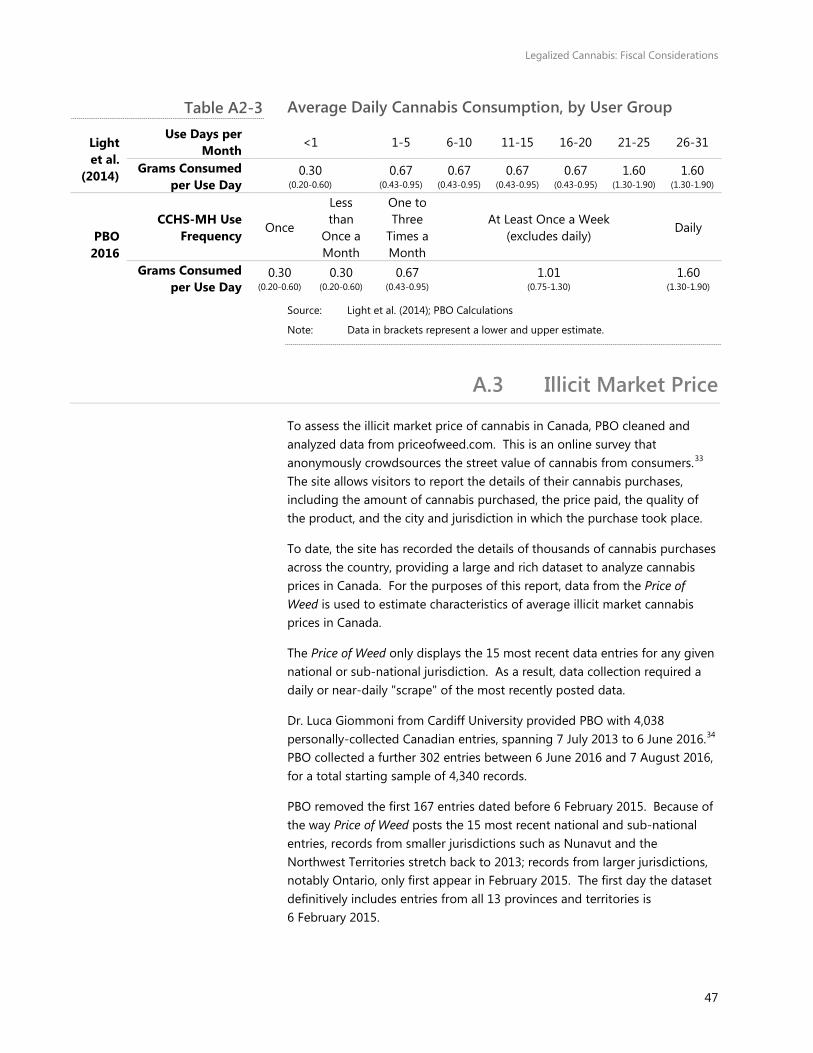
Legalized Cannabis: Fiscal Considerations
47
Average Daily Cannabis Consumption, by User Group
Light et al.
(2014)
Use Days per Month <1 1-5 6-10 11-15 16-20 21-25 26-31
Grams Consumed per Use Day
0.30 (0.20-0.60)
0.67 (0.43-0.95)
0.67 (0.43-0.95)
0.67 (0.43-0.95)
0.67 (0.43-0.95)
1.60 (1.30-1.90)
1.60 (1.30-1.90)
PBO 2016
CCHS-MH Use Frequency
Once
Less than
Once a Month
One to Three
Times a Month
At Least Once a Week (excludes daily)
Daily
Grams Consumed per Use Day
0.30 (0.20-0.60)
0.30 (0.20-0.60)
0.67 (0.43-0.95)
1.01 (0.75-1.30)
1.60 (1.30-1.90)
Source: Light et al. (2014); PBO Calculations
Note: Data in brackets represent a lower and upper estimate.
A.3 Illicit Market Price
To assess the illicit market price of cannabis in Canada, PBO cleaned and analyzed data from priceofweed.com. This is an online survey that anonymously crowdsources the street value of cannabis from consumers.33 The site allows visitors to report the details of their cannabis purchases, including the amount of cannabis purchased, the price paid, the quality of the product, and the city and jurisdiction in which the purchase took place.
To date, the site has recorded the details of thousands of cannabis purchases across the country, providing a large and rich dataset to analyze cannabis prices in Canada. For the purposes of this report, data from the Price of Weed is used to estimate characteristics of average illicit market cannabis prices in Canada.
The Price of Weed only displays the 15 most recent data entries for any given national or sub-national jurisdiction. As a result, data collection required a daily or near-daily "scrape" of the most recently posted data.
Dr. Luca Giommoni from Cardiff University provided PBO with 4,038 personally-collected Canadian entries, spanning 7 July 2013 to 6 June 2016.34 PBO collected a further 302 entries between 6 June 2016 and 7 August 2016, for a total starting sample of 4,340 records.
PBO removed the first 167 entries dated before 6 February 2015. Because of the way Price of Weed posts the 15 most recent national and sub-national entries, records from smaller jurisdictions such as Nunavut and the Northwest Territories stretch back to 2013; records from larger jurisdictions, notably Ontario, only first appear in February 2015. The first day the dataset definitively includes entries from all 13 provinces and territories is 6 February 2015.
Table A2-3
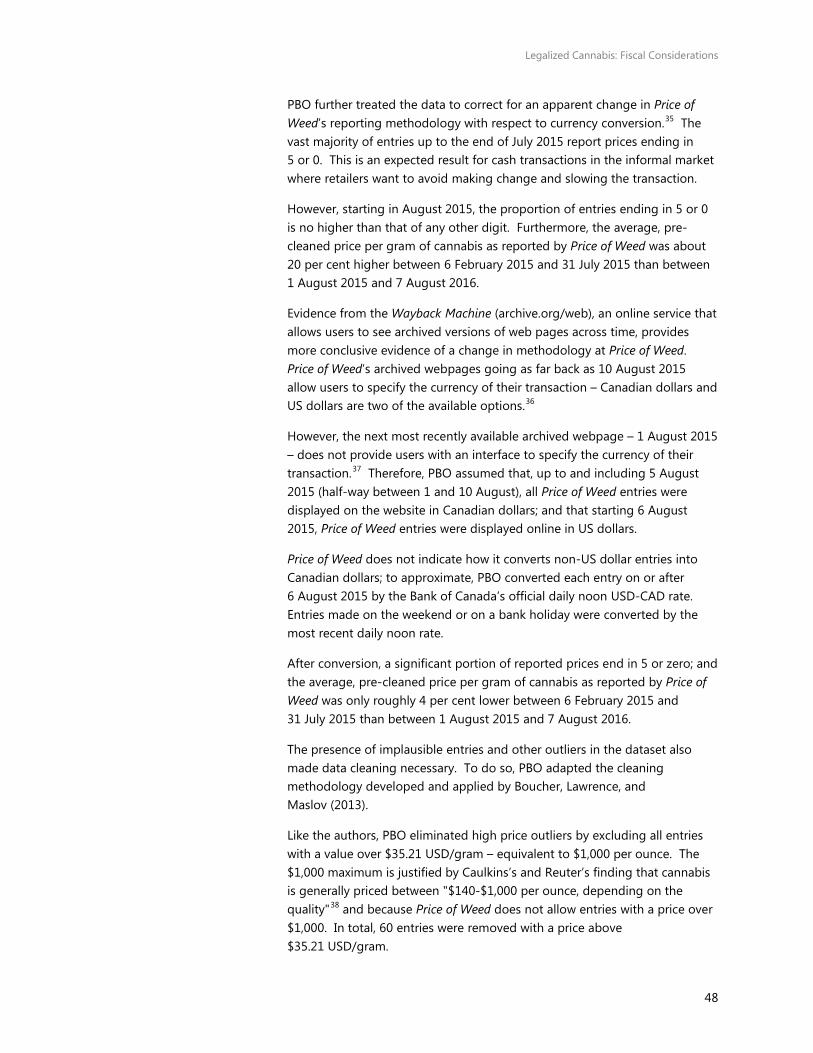
Legalized Cannabis: Fiscal Considerations
48
PBO further treated the data to correct for an apparent change in Price of Weed’s reporting methodology with respect to currency conversion.35 The vast majority of entries up to the end of July 2015 report prices ending in 5 or 0. This is an expected result for cash transactions in the informal market where retailers want to avoid making change and slowing the transaction.
However, starting in August 2015, the proportion of entries ending in 5 or 0 is no higher than that of any other digit. Furthermore, the average, pre-cleaned price per gram of cannabis as reported by Price of Weed was about 20 per cent higher between 6 February 2015 and 31 July 2015 than between 1 August 2015 and 7 August 2016.
Evidence from the Wayback Machine (archive.org/web), an online service that allows users to see archived versions of web pages across time, provides more conclusive evidence of a change in methodology at Price of Weed. Price of Weed’s archived webpages going as far back as 10 August 2015 allow users to specify the currency of their transaction – Canadian dollars and US dollars are two of the available options.36
However, the next most recently available archived webpage – 1 August 2015 – does not provide users with an interface to specify the currency of their transaction.37 Therefore, PBO assumed that, up to and including 5 August 2015 (half-way between 1 and 10 August), all Price of Weed entries were displayed on the website in Canadian dollars; and that starting 6 August 2015, Price of Weed entries were displayed online in US dollars.
Price of Weed does not indicate how it converts non-US dollar entries into Canadian dollars; to approximate, PBO converted each entry on or after 6 August 2015 by the Bank of Canada’s official daily noon USD-CAD rate. Entries made on the weekend or on a bank holiday were converted by the most recent daily noon rate.
After conversion, a significant portion of reported prices end in 5 or zero; and the average, pre-cleaned price per gram of cannabis as reported by Price of Weed was only roughly 4 per cent lower between 6 February 2015 and 31 July 2015 than between 1 August 2015 and 7 August 2016.
The presence of implausible entries and other outliers in the dataset also made data cleaning necessary. To do so, PBO adapted the cleaning methodology developed and applied by Boucher, Lawrence, and Maslov (2013).
Like the authors, PBO eliminated high price outliers by excluding all entries with a value over $35.21 USD/gram – equivalent to $1,000 per ounce. The $1,000 maximum is justified by Caulkins’s and Reuter’s finding that cannabis is generally priced between "$140-$1,000 per ounce, depending on the quality"38 and because Price of Weed does not allow entries with a price over $1,000. In total, 60 entries were removed with a price above $35.21 USD/gram.
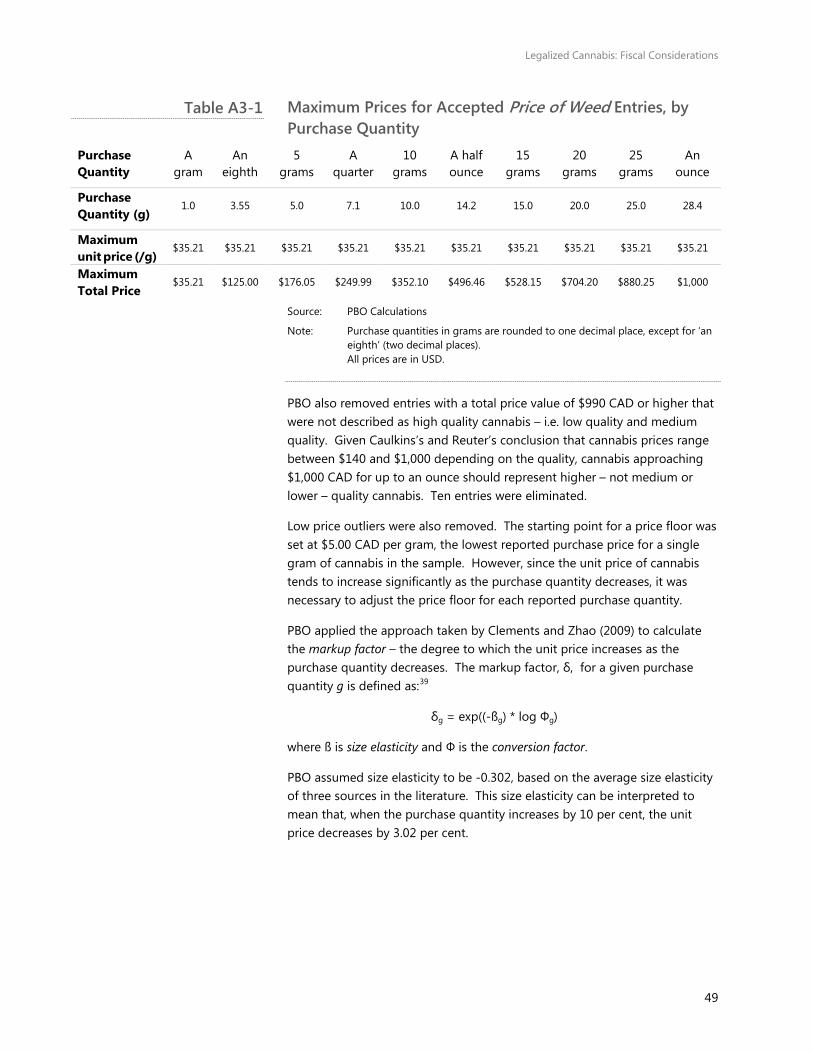
Legalized Cannabis: Fiscal Considerations
49
Maximum Prices for Accepted Price of Weed Entries, by Purchase Quantity
Purchase Quantity
A gram
An eighth
5 grams
A quarter
10 grams
A half ounce
15 grams
20 grams
25 grams
An ounce
Purchase Quantity (g)
1.0 3.55 5.0 7.1 10.0 14.2 15.0 20.0 25.0 28.4
Maximum unit price (/g)
$35.21 $35.21 $35.21 $35.21 $35.21 $35.21 $35.21 $35.21 $35.21 $35.21
Maximum Total Price
$35.21 $125.00 $176.05 $249.99 $352.10 $496.46 $528.15 $704.20 $880.25 $1,000
Source: PBO Calculations
Note: Purchase quantities in grams are rounded to one decimal place, except for ‘an eighth’ (two decimal places).
All prices are in USD.
PBO also removed entries with a total price value of $990 CAD or higher that were not described as high quality cannabis – i.e. low quality and medium quality. Given Caulkins’s and Reuter’s conclusion that cannabis prices range between $140 and $1,000 depending on the quality, cannabis approaching $1,000 CAD for up to an ounce should represent higher – not medium or lower – quality cannabis. Ten entries were eliminated.
Low price outliers were also removed. The starting point for a price floor was set at $5.00 CAD per gram, the lowest reported purchase price for a single gram of cannabis in the sample. However, since the unit price of cannabis tends to increase significantly as the purchase quantity decreases, it was necessary to adjust the price floor for each reported purchase quantity.
PBO applied the approach taken by Clements and Zhao (2009) to calculate the markup factor – the degree to which the unit price increases as the purchase quantity decreases. The markup factor, δ, for a given purchase quantity g is defined as:39
δg = exp((-ßg) * log Фg)
where ß is size elasticity and Ф is the conversion factor.
PBO assumed size elasticity to be -0.302, based on the average size elasticity of three sources in the literature. This size elasticity can be interpreted to mean that, when the purchase quantity increases by 10 per cent, the unit price decreases by 3.02 per cent.
Table A3-1
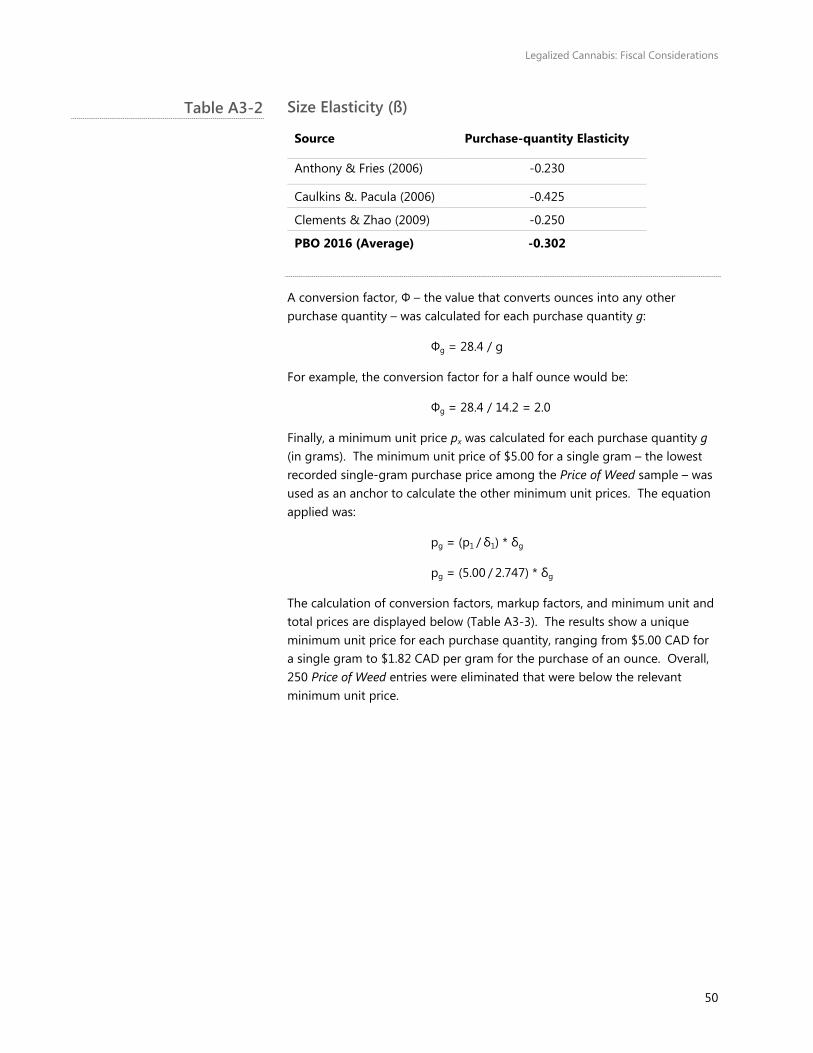
Legalized Cannabis: Fiscal Considerations
50
Size Elasticity (ß)
Source Purchase-quantity Elasticity
Anthony & Fries (2006) -0.230
Caulkins &. Pacula (2006) -0.425
Clements & Zhao (2009) -0.250
PBO 2016 (Average) -0.302
A conversion factor, Ф – the value that converts ounces into any other purchase quantity – was calculated for each purchase quantity g:
Фg = 28.4 / g
For example, the conversion factor for a half ounce would be:
Фg = 28.4 / 14.2 = 2.0
Finally, a minimum unit price px was calculated for each purchase quantity g (in grams). The minimum unit price of $5.00 for a single gram – the lowest recorded single-gram purchase price among the Price of Weed sample – was used as an anchor to calculate the other minimum unit prices. The equation applied was:
pg = (p1 / δ1) * δg
pg = (5.00 / 2.747) * δg
The calculation of conversion factors, markup factors, and minimum unit and total prices are displayed below (Table A3-3). The results show a unique minimum unit price for each purchase quantity, ranging from $5.00 CAD for a single gram to $1.82 CAD per gram for the purchase of an ounce. Overall, 250 Price of Weed entries were eliminated that were below the relevant minimum unit price.
Table A3-2
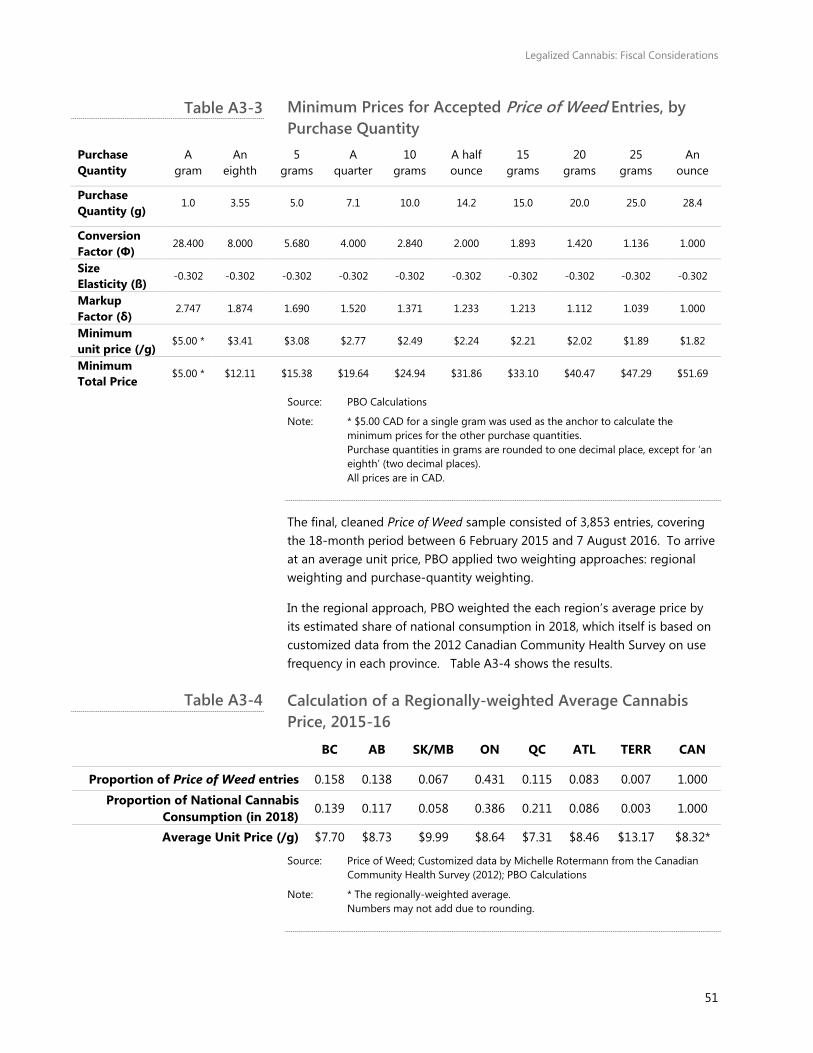
Legalized Cannabis: Fiscal Considerations
51
Minimum Prices for Accepted Price of Weed Entries, by Purchase Quantity
Purchase Quantity
A gram
An eighth
5 grams
A quarter
10 grams
A half ounce
15 grams
20 grams
25 grams
An ounce
Purchase Quantity (g)
1.0 3.55 5.0 7.1 10.0 14.2 15.0 20.0 25.0 28.4
Conversion Factor (Ф)
28.400 8.000 5.680 4.000 2.840 2.000 1.893 1.420 1.136 1.000
Size Elasticity (ß)
-0.302 -0.302 -0.302 -0.302 -0.302 -0.302 -0.302 -0.302 -0.302 -0.302
Markup Factor (δ)
2.747 1.874 1.690 1.520 1.371 1.233 1.213 1.112 1.039 1.000
Minimum unit price (/g)
$5.00 * $3.41 $3.08 $2.77 $2.49 $2.24 $2.21 $2.02 $1.89 $1.82
Minimum Total Price
$5.00 * $12.11 $15.38 $19.64 $24.94 $31.86 $33.10 $40.47 $47.29 $51.69
Source: PBO Calculations
Note: * $5.00 CAD for a single gram was used as the anchor to calculate the minimum prices for the other purchase quantities.
Purchase quantities in grams are rounded to one decimal place, except for ‘an eighth’ (two decimal places).
All prices are in CAD.
The final, cleaned Price of Weed sample consisted of 3,853 entries, covering the 18-month period between 6 February 2015 and 7 August 2016. To arrive at an average unit price, PBO applied two weighting approaches: regional weighting and purchase-quantity weighting.
In the regional approach, PBO weighted the each region’s average price by its estimated share of national consumption in 2018, which itself is based on customized data from the 2012 Canadian Community Health Survey on use frequency in each province. Table A3-4 shows the results.
Calculation of a Regionally-weighted Average Cannabis Price, 2015-16
BC AB SK/MB ON QC ATL TERR CAN
Proportion of Price of Weed entries 0.158 0.138 0.067 0.431 0.115 0.083 0.007 1.000
Proportion of National Cannabis Consumption (in 2018)
0.139 0.117 0.058 0.386 0.211 0.086 0.003 1.000
Average Unit Price (/g) $7.70 $8.73 $9.99 $8.64 $7.31 $8.46 $13.17 $8.32*
Source: Price of Weed; Customized data by Michelle Rotermann from the Canadian Community Health Survey (2012); PBO Calculations
Note: * The regionally-weighted average. Numbers may not add due to rounding.
Table A3-3
Table A3-4
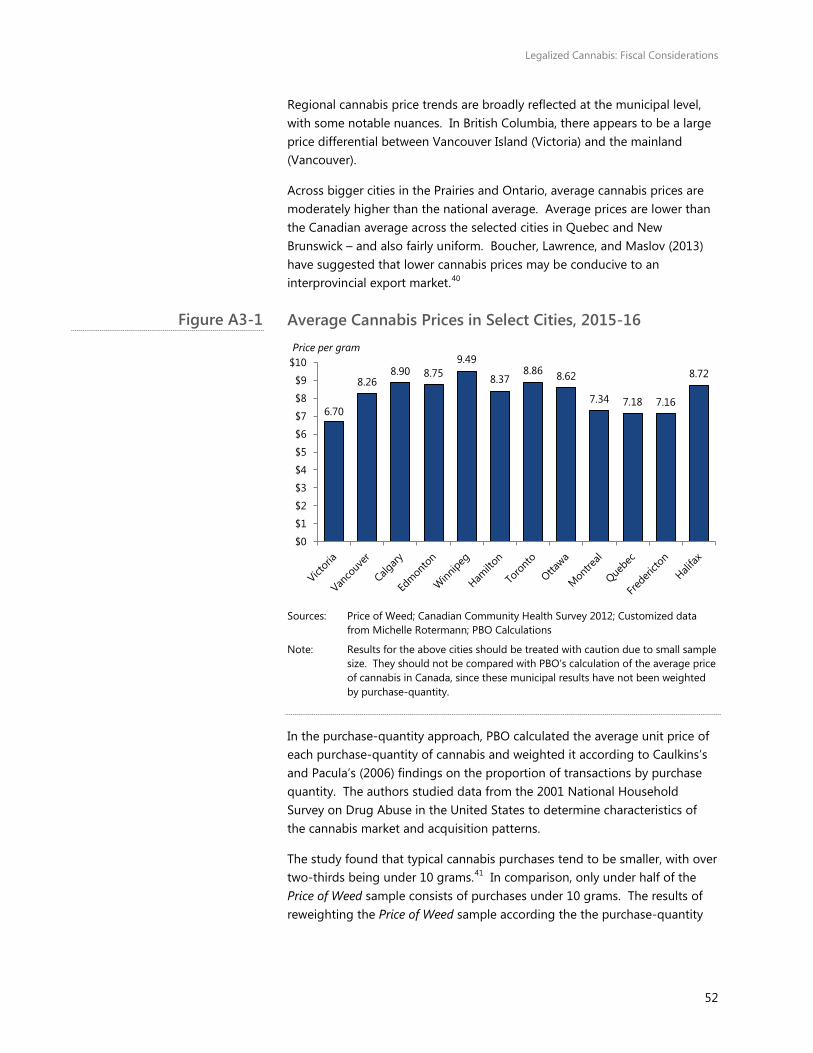
Legalized Cannabis: Fiscal Considerations
52
Regional cannabis price trends are broadly reflected at the municipal level, with some notable nuances. In British Columbia, there appears to be a large price differential between Vancouver Island (Victoria) and the mainland (Vancouver).
Across bigger cities in the Prairies and Ontario, average cannabis prices are moderately higher than the national average. Average prices are lower than the Canadian average across the selected cities in Quebec and New Brunswick – and also fairly uniform. Boucher, Lawrence, and Maslov (2013) have suggested that lower cannabis prices may be conducive to an interprovincial export market.40
Average Cannabis Prices in Select Cities, 2015-16
Sources: Price of Weed; Canadian Community Health Survey 2012; Customized data
from Michelle Rotermann; PBO Calculations
Note: Results for the above cities should be treated with caution due to small sample size. They should not be compared with PBO’s calculation of the average price of cannabis in Canada, since these municipal results have not been weighted by purchase-quantity.
In the purchase-quantity approach, PBO calculated the average unit price of each purchase-quantity of cannabis and weighted it according to Caulkins’s and Pacula’s (2006) findings on the proportion of transactions by purchase quantity. The authors studied data from the 2001 National Household Survey on Drug Abuse in the United States to determine characteristics of the cannabis market and acquisition patterns.
The study found that typical cannabis purchases tend to be smaller, with over two-thirds being under 10 grams.41 In comparison, only under half of the Price of Weed sample consists of purchases under 10 grams. The results of reweighting the Price of Weed sample according the the purchase-quantity
6.70
8.26 8.90 8.75
9.49
8.37 8.86 8.62
7.34 7.18 7.16
8.72
$0
$1
$2
$3
$4
$5
$6
$7
$8
$9
$10Price per gram
Figure A3-1
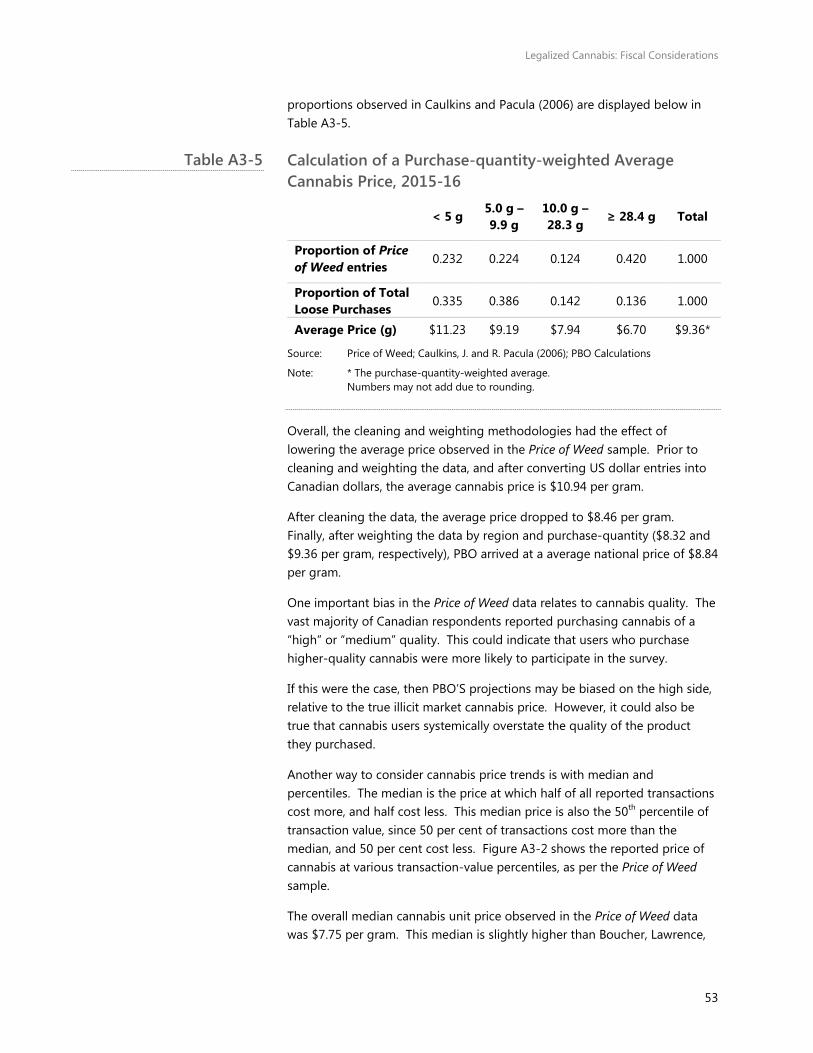
Legalized Cannabis: Fiscal Considerations
53
proportions observed in Caulkins and Pacula (2006) are displayed below in Table A3-5.
Calculation of a Purchase-quantity-weighted Average Cannabis Price, 2015-16
< 5 g 5.0 g – 9.9 g
10.0 g – 28.3 g
≥ 28.4 g Total
Proportion of Price of Weed entries
0.232 0.224 0.124 0.420 1.000
Proportion of Total Loose Purchases 0.335 0.386 0.142 0.136 1.000
Average Price (g) $11.23 $9.19 $7.94 $6.70 $9.36*
Source: Price of Weed; Caulkins, J. and R. Pacula (2006); PBO Calculations
Note: * The purchase-quantity-weighted average. Numbers may not add due to rounding.
Overall, the cleaning and weighting methodologies had the effect of lowering the average price observed in the Price of Weed sample. Prior to cleaning and weighting the data, and after converting US dollar entries into Canadian dollars, the average cannabis price is $10.94 per gram.
After cleaning the data, the average price dropped to $8.46 per gram. Finally, after weighting the data by region and purchase-quantity ($8.32 and $9.36 per gram, respectively), PBO arrived at a average national price of $8.84 per gram.
One important bias in the Price of Weed data relates to cannabis quality. The vast majority of Canadian respondents reported purchasing cannabis of a “high” or “medium” quality. This could indicate that users who purchase higher-quality cannabis were more likely to participate in the survey.
If this were the case, then PBO’S projections may be biased on the high side, relative to the true illicit market cannabis price. However, it could also be true that cannabis users systemically overstate the quality of the product they purchased.
Another way to consider cannabis price trends is with median and percentiles. The median is the price at which half of all reported transactions cost more, and half cost less. This median price is also the 50th percentile of transaction value, since 50 per cent of transactions cost more than the median, and 50 per cent cost less. Figure A3-2 shows the reported price of cannabis at various transaction-value percentiles, as per the Price of Weed sample.
The overall median cannabis unit price observed in the Price of Weed data was $7.75 per gram. This median is slightly higher than Boucher, Lawrence,
Table A3-5
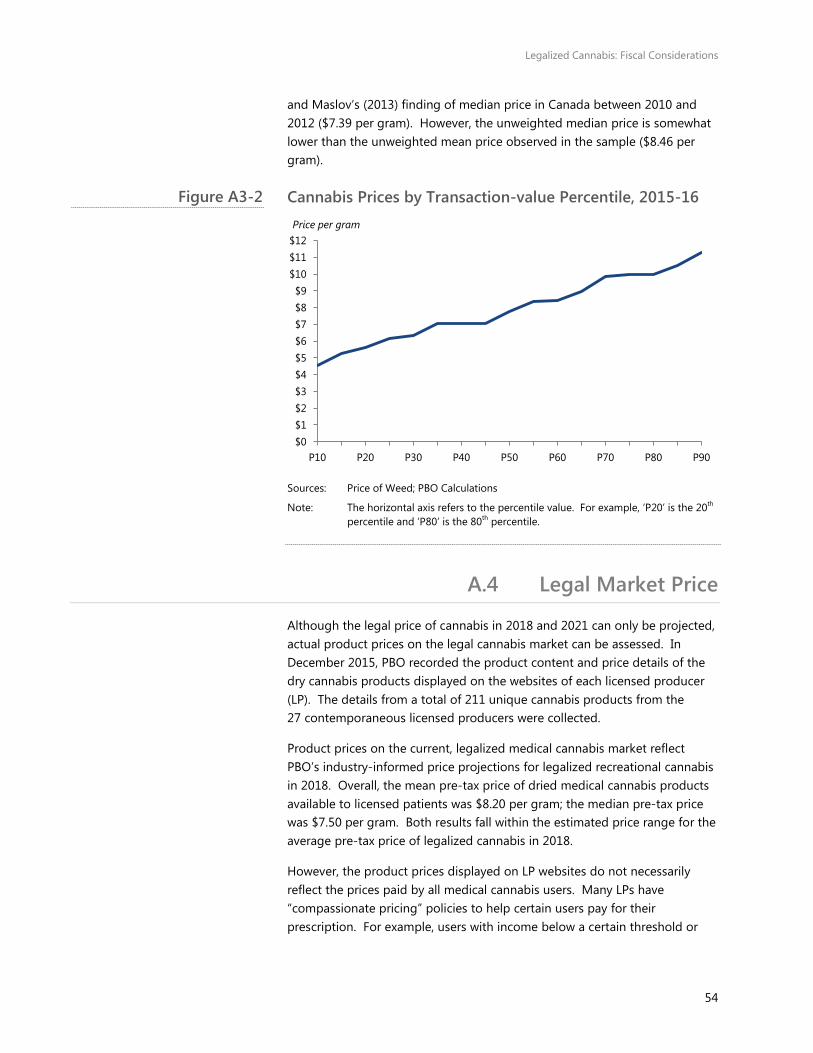
Legalized Cannabis: Fiscal Considerations
54
and Maslov’s (2013) finding of median price in Canada between 2010 and 2012 ($7.39 per gram). However, the unweighted median price is somewhat lower than the unweighted mean price observed in the sample ($8.46 per gram).
Cannabis Prices by Transaction-value Percentile, 2015-16
Sources: Price of Weed; PBO Calculations
Note: The horizontal axis refers to the percentile value. For example, ‘P20’ is the 20th percentile and ‘P80’ is the 80th percentile.
A.4 Legal Market Price
Although the legal price of cannabis in 2018 and 2021 can only be projected, actual product prices on the legal cannabis market can be assessed. In December 2015, PBO recorded the product content and price details of the dry cannabis products displayed on the websites of each licensed producer (LP). The details from a total of 211 unique cannabis products from the 27 contemporaneous licensed producers were collected.
Product prices on the current, legalized medical cannabis market reflect PBO’s industry-informed price projections for legalized recreational cannabis in 2018. Overall, the mean pre-tax price of dried medical cannabis products available to licensed patients was $8.20 per gram; the median pre-tax price was $7.50 per gram. Both results fall within the estimated price range for the average pre-tax price of legalized cannabis in 2018.
However, the product prices displayed on LP websites do not necessarily reflect the prices paid by all medical cannabis users. Many LPs have “compassionate pricing” policies to help certain users pay for their prescription. For example, users with income below a certain threshold or
$0$1$2$3$4$5$6$7$8$9
$10$11$12
P10 P20 P30 P40 P50 P60 P70 P80 P90
Price per gram
Figure A3-2
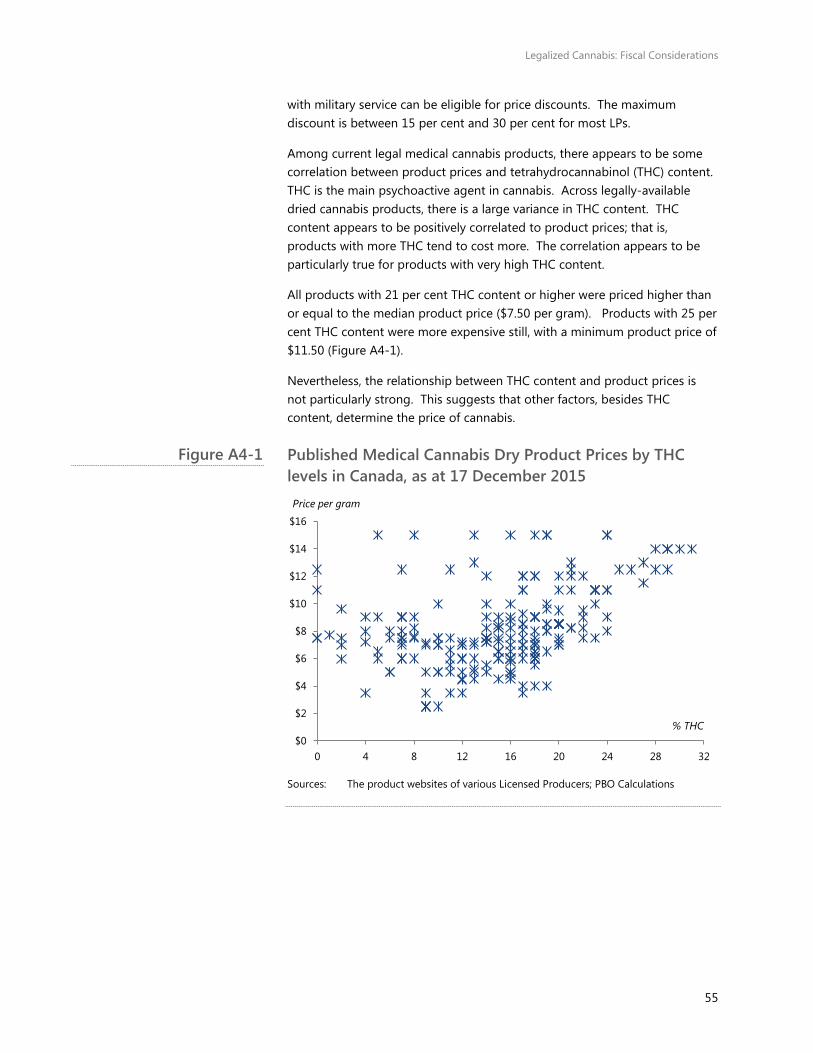
Legalized Cannabis: Fiscal Considerations
55
with military service can be eligible for price discounts. The maximum discount is between 15 per cent and 30 per cent for most LPs.
Among current legal medical cannabis products, there appears to be some correlation between product prices and tetrahydrocannabinol (THC) content. THC is the main psychoactive agent in cannabis. Across legally-available dried cannabis products, there is a large variance in THC content. THC content appears to be positively correlated to product prices; that is, products with more THC tend to cost more. The correlation appears to be particularly true for products with very high THC content.
All products with 21 per cent THC content or higher were priced higher than or equal to the median product price ($7.50 per gram). Products with 25 per cent THC content were more expensive still, with a minimum product price of $11.50 (Figure A4-1).
Nevertheless, the relationship between THC content and product prices is not particularly strong. This suggests that other factors, besides THC content, determine the price of cannabis.
Published Medical Cannabis Dry Product Prices by THC levels in Canada, as at 17 December 2015
Sources: The product websites of various Licensed Producers; PBO Calculations
$0
$2
$4
$6
$8
$10
$12
$14
$16
0 4 8 12 16 20 24 28 32
Price per gram
% THC
Figure A4-1
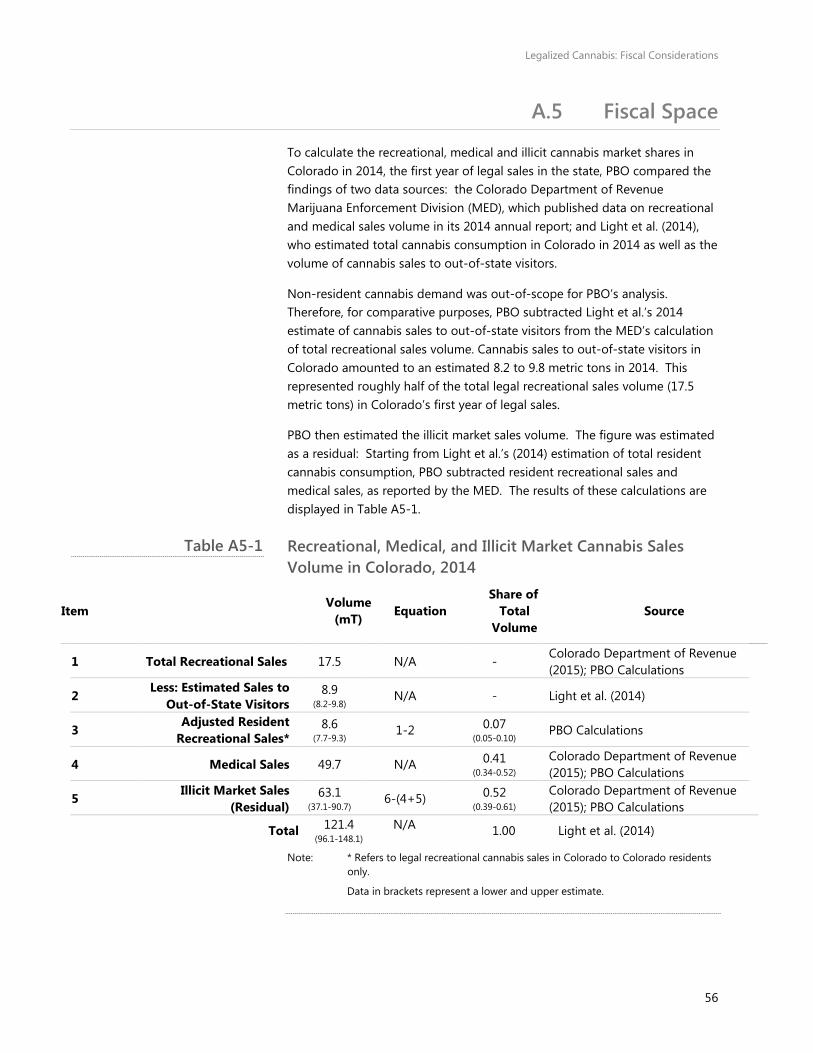
Legalized Cannabis: Fiscal Considerations
56
A.5 Fiscal Space
To calculate the recreational, medical and illicit cannabis market shares in Colorado in 2014, the first year of legal sales in the state, PBO compared the findings of two data sources: the Colorado Department of Revenue Marijuana Enforcement Division (MED), which published data on recreational and medical sales volume in its 2014 annual report; and Light et al. (2014), who estimated total cannabis consumption in Colorado in 2014 as well as the volume of cannabis sales to out-of-state visitors.
Non-resident cannabis demand was out-of-scope for PBO’s analysis. Therefore, for comparative purposes, PBO subtracted Light et al.’s 2014 estimate of cannabis sales to out-of-state visitors from the MED’s calculation of total recreational sales volume. Cannabis sales to out-of-state visitors in Colorado amounted to an estimated 8.2 to 9.8 metric tons in 2014. This represented roughly half of the total legal recreational sales volume (17.5 metric tons) in Colorado’s first year of legal sales.
PBO then estimated the illicit market sales volume. The figure was estimated as a residual: Starting from Light et al.’s (2014) estimation of total resident cannabis consumption, PBO subtracted resident recreational sales and medical sales, as reported by the MED. The results of these calculations are displayed in Table A5-1.
Recreational, Medical, and Illicit Market Cannabis Sales Volume in Colorado, 2014
Item Volume
(mT) Equation Share of
Total Volume
Source
1 Total Recreational Sales 17.5 N/A - Colorado Department of Revenue (2015); PBO Calculations
2 Less: Estimated Sales to
Out-of-State Visitors 8.9
(8.2-9.8) N/A - Light et al. (2014)
3 Adjusted Resident
Recreational Sales* 8.6
(7.7-9.3) 1-2 0.07 (0.05-0.10) PBO Calculations
4 Medical Sales 49.7 N/A 0.41 (0.34-0.52)
Colorado Department of Revenue (2015); PBO Calculations
5 Illicit Market Sales (Residual)
63.1 (37.1-90.7) 6-(4+5) 0.52
(0.39-0.61) Colorado Department of Revenue (2015); PBO Calculations
Total 121.4 (96.1-148.1)
N/A 1.00 Light et al. (2014)
Note: * Refers to legal recreational cannabis sales in Colorado to Colorado residents only.
Data in brackets represent a lower and upper estimate.
Table A5-1
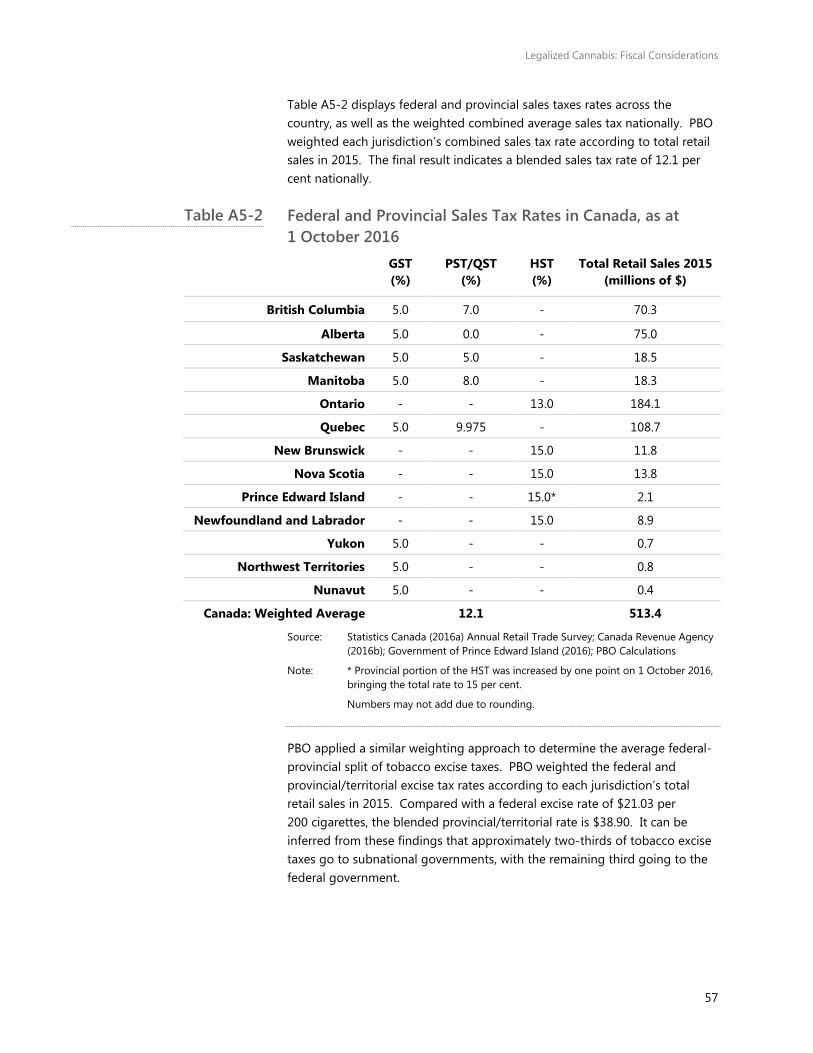
Legalized Cannabis: Fiscal Considerations
57
Table A5-2 displays federal and provincial sales taxes rates across the country, as well as the weighted combined average sales tax nationally. PBO weighted each jurisdiction’s combined sales tax rate according to total retail sales in 2015. The final result indicates a blended sales tax rate of 12.1 per cent nationally.
Federal and Provincial Sales Tax Rates in Canada, as at 1 October 2016
GST (%)
PST/QST (%)
HST (%)
Total Retail Sales 2015 (millions of $)
British Columbia 5.0 7.0 - 70.3
Alberta 5.0 0.0 - 75.0
Saskatchewan 5.0 5.0 - 18.5
Manitoba 5.0 8.0 - 18.3
Ontario - - 13.0 184.1
Quebec 5.0 9.975 - 108.7
New Brunswick - - 15.0 11.8
Nova Scotia - - 15.0 13.8
Prince Edward Island - - 15.0* 2.1
Newfoundland and Labrador - - 15.0 8.9
Yukon 5.0 - - 0.7
Northwest Territories 5.0 - - 0.8
Nunavut 5.0 - - 0.4
Canada: Weighted Average 12.1 513.4
Source: Statistics Canada (2016a) Annual Retail Trade Survey; Canada Revenue Agency (2016b); Government of Prince Edward Island (2016); PBO Calculations
Note: * Provincial portion of the HST was increased by one point on 1 October 2016, bringing the total rate to 15 per cent.
Numbers may not add due to rounding.
PBO applied a similar weighting approach to determine the average federal-provincial split of tobacco excise taxes. PBO weighted the federal and provincial/territorial excise tax rates according to each jurisdiction’s total retail sales in 2015. Compared with a federal excise rate of $21.03 per 200 cigarettes, the blended provincial/territorial rate is $38.90. It can be inferred from these findings that approximately two-thirds of tobacco excise taxes go to subnational governments, with the remaining third going to the federal government.
Table A5-2
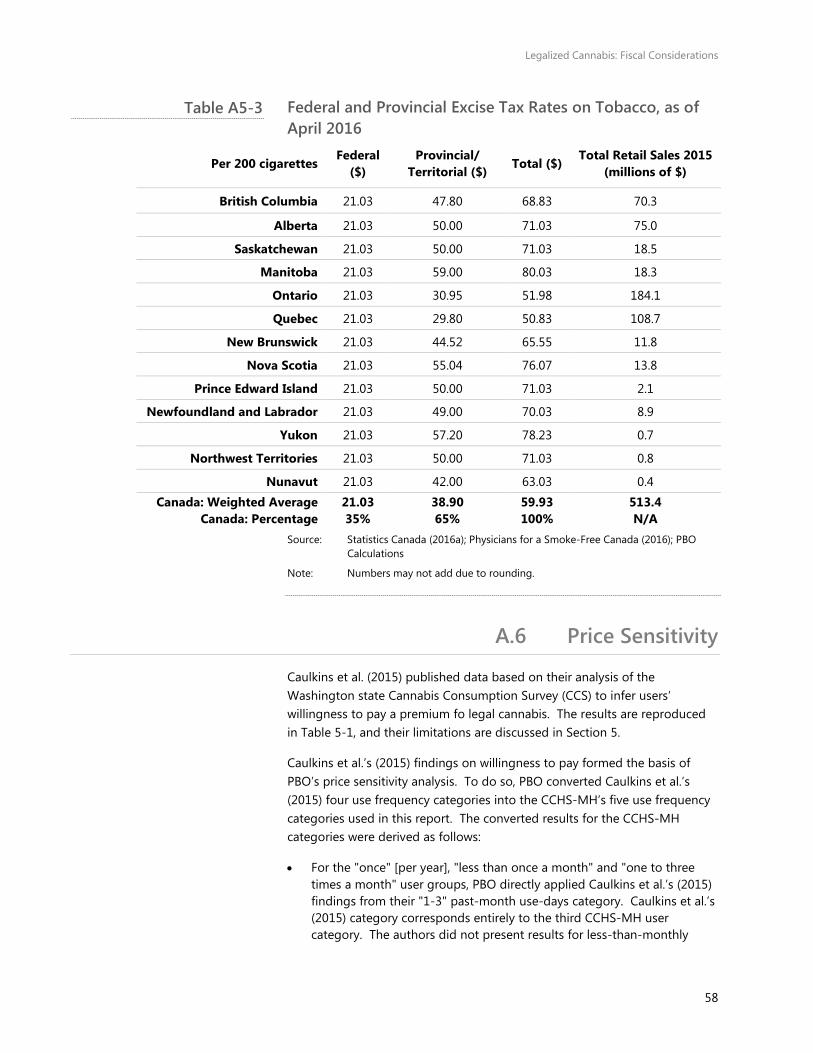
Legalized Cannabis: Fiscal Considerations
58
Federal and Provincial Excise Tax Rates on Tobacco, as of April 2016
Per 200 cigarettes Federal
($) Provincial/
Territorial ($) Total ($) Total Retail Sales 2015
(millions of $)
British Columbia 21.03 47.80 68.83 70.3
Alberta 21.03 50.00 71.03 75.0
Saskatchewan 21.03 50.00 71.03 18.5
Manitoba 21.03 59.00 80.03 18.3
Ontario 21.03 30.95 51.98 184.1
Quebec 21.03 29.80 50.83 108.7
New Brunswick 21.03 44.52 65.55 11.8
Nova Scotia 21.03 55.04 76.07 13.8
Prince Edward Island 21.03 50.00 71.03 2.1
Newfoundland and Labrador 21.03 49.00 70.03 8.9
Yukon 21.03 57.20 78.23 0.7
Northwest Territories 21.03 50.00 71.03 0.8
Nunavut 21.03 42.00 63.03 0.4 Canada: Weighted Average
Canada: Percentage 21.03 35%
38.90 65%
59.93 100%
513.4 N/A
Source: Statistics Canada (2016a); Physicians for a Smoke-Free Canada (2016); PBO Calculations
Note: Numbers may not add due to rounding.
A.6 Price Sensitivity
Caulkins et al. (2015) published data based on their analysis of the Washington state Cannabis Consumption Survey (CCS) to infer users’ willingness to pay a premium fo legal cannabis. The results are reproduced in Table 5-1, and their limitations are discussed in Section 5.
Caulkins et al.’s (2015) findings on willingness to pay formed the basis of PBO’s price sensitivity analysis. To do so, PBO converted Caulkins et al.’s (2015) four use frequency categories into the CCHS-MH’s five use frequency categories used in this report. The converted results for the CCHS-MH categories were derived as follows:
• For the "once" [per year], "less than once a month" and "one to three times a month" user groups, PBO directly applied Caulkins et al.’s (2015) findings from their "1-3" past-month use-days category. Caulkins et al.’s (2015) category corresponds entirely to the third CCHS-MH user category. The authors did not present results for less-than-monthly
Table A5-3
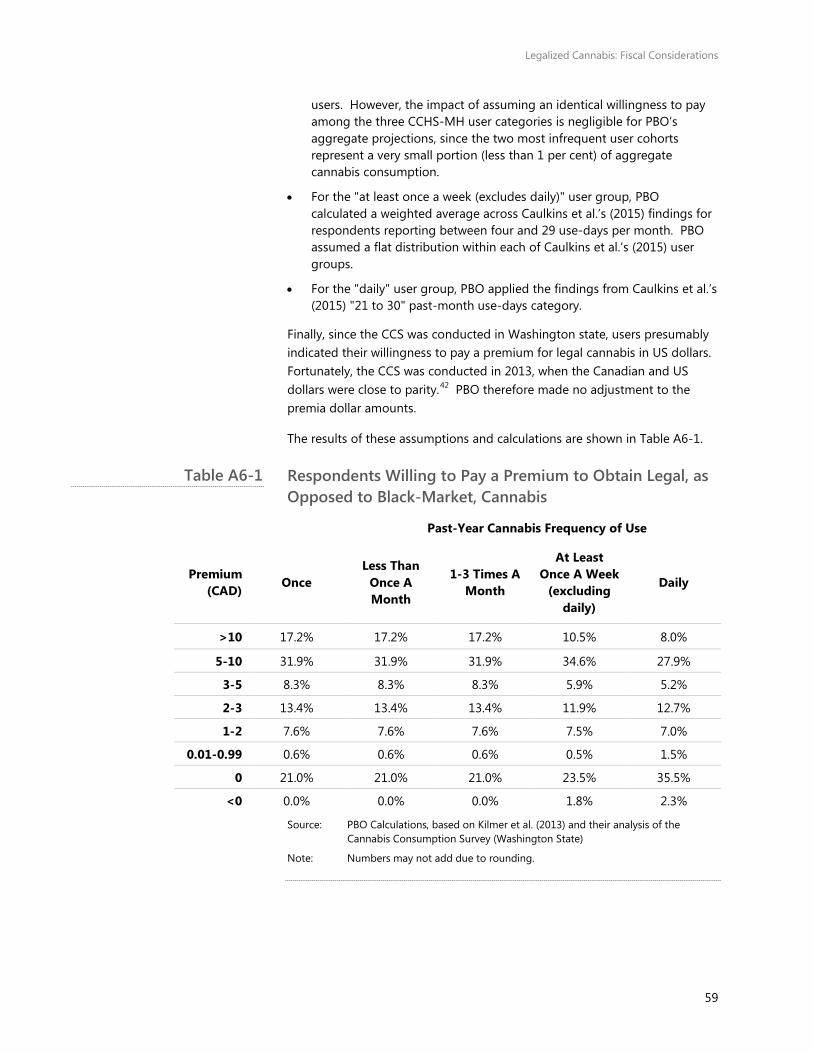
Legalized Cannabis: Fiscal Considerations
59
users. However, the impact of assuming an identical willingness to pay among the three CCHS-MH user categories is negligible for PBO’s aggregate projections, since the two most infrequent user cohorts represent a very small portion (less than 1 per cent) of aggregate cannabis consumption.
• For the "at least once a week (excludes daily)" user group, PBO calculated a weighted average across Caulkins et al.’s (2015) findings for respondents reporting between four and 29 use-days per month. PBO assumed a flat distribution within each of Caulkins et al.’s (2015) user groups.
• For the "daily" user group, PBO applied the findings from Caulkins et al.’s (2015) "21 to 30" past-month use-days category.
Finally, since the CCS was conducted in Washington state, users presumably indicated their willingness to pay a premium for legal cannabis in US dollars. Fortunately, the CCS was conducted in 2013, when the Canadian and US dollars were close to parity.42 PBO therefore made no adjustment to the premia dollar amounts.
The results of these assumptions and calculations are shown in Table A6-1.
Respondents Willing to Pay a Premium to Obtain Legal, as Opposed to Black-Market, Cannabis
Past-Year Cannabis Frequency of Use
Premium (CAD) Once
Less Than Once A Month
1-3 Times A Month
At Least Once A Week
(excluding daily)
Daily
>10 17.2% 17.2% 17.2% 10.5% 8.0%
5-10 31.9% 31.9% 31.9% 34.6% 27.9%
3-5 8.3% 8.3% 8.3% 5.9% 5.2%
2-3 13.4% 13.4% 13.4% 11.9% 12.7%
1-2 7.6% 7.6% 7.6% 7.5% 7.0%
0.01-0.99 0.6% 0.6% 0.6% 0.5% 1.5%
0 21.0% 21.0% 21.0% 23.5% 35.5%
<0 0.0% 0.0% 0.0% 1.8% 2.3%
Source: PBO Calculations, based on Kilmer et al. (2013) and their analysis of the Cannabis Consumption Survey (Washington State)
Note: Numbers may not add due to rounding.
Table A6-1
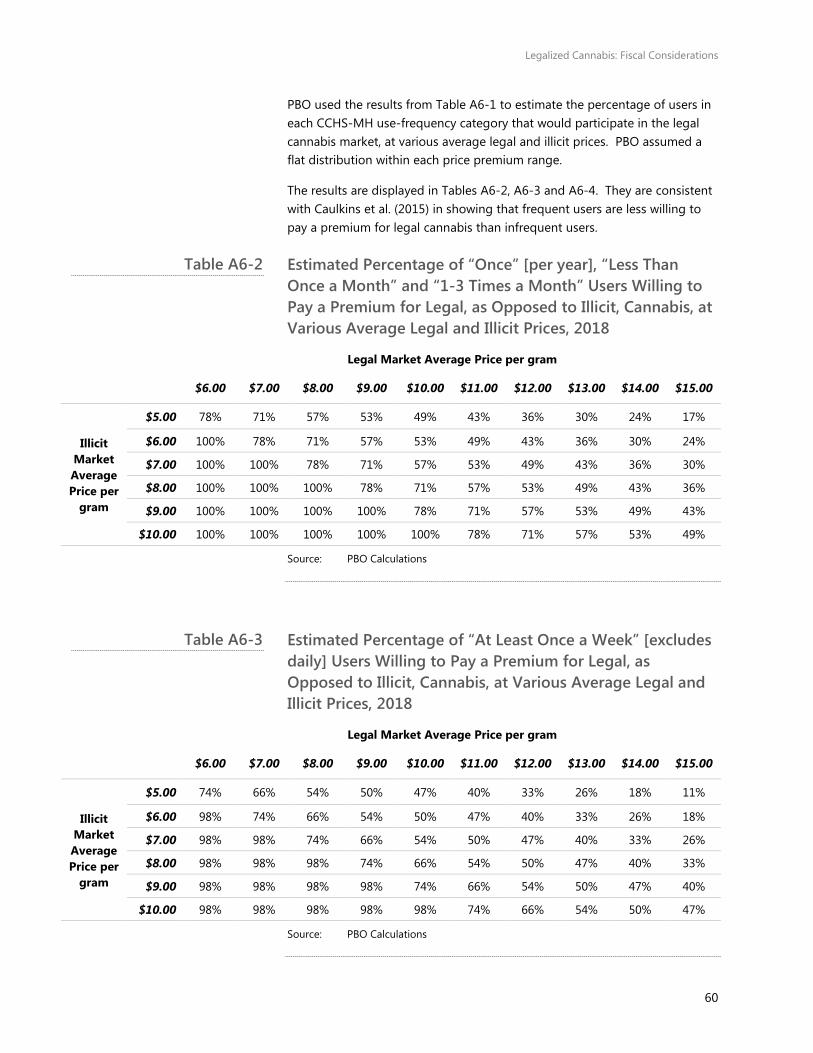
Legalized Cannabis: Fiscal Considerations
60
PBO used the results from Table A6-1 to estimate the percentage of users in each CCHS-MH use-frequency category that would participate in the legal cannabis market, at various average legal and illicit prices. PBO assumed a flat distribution within each price premium range.
The results are displayed in Tables A6-2, A6-3 and A6-4. They are consistent with Caulkins et al. (2015) in showing that frequent users are less willing to pay a premium for legal cannabis than infrequent users.
Estimated Percentage of “Once” [per year], “Less Than Once a Month” and “1-3 Times a Month” Users Willing to Pay a Premium for Legal, as Opposed to Illicit, Cannabis, at Various Average Legal and Illicit Prices, 2018
Legal Market Average Price per gram
$6.00 $7.00 $8.00 $9.00 $10.00 $11.00 $12.00 $13.00 $14.00 $15.00
Illicit Market Average Price per
gram
$5.00 78% 71% 57% 53% 49% 43% 36% 30% 24% 17%
$6.00 100% 78% 71% 57% 53% 49% 43% 36% 30% 24%
$7.00 100% 100% 78% 71% 57% 53% 49% 43% 36% 30%
$8.00 100% 100% 100% 78% 71% 57% 53% 49% 43% 36%
$9.00 100% 100% 100% 100% 78% 71% 57% 53% 49% 43%
$10.00 100% 100% 100% 100% 100% 78% 71% 57% 53% 49%
Source: PBO Calculations
Estimated Percentage of “At Least Once a Week” [excludes daily] Users Willing to Pay a Premium for Legal, as Opposed to Illicit, Cannabis, at Various Average Legal and Illicit Prices, 2018
Legal Market Average Price per gram
$6.00 $7.00 $8.00 $9.00 $10.00 $11.00 $12.00 $13.00 $14.00 $15.00
Illicit Market Average Price per
gram
$5.00 74% 66% 54% 50% 47% 40% 33% 26% 18% 11%
$6.00 98% 74% 66% 54% 50% 47% 40% 33% 26% 18%
$7.00 98% 98% 74% 66% 54% 50% 47% 40% 33% 26%
$8.00 98% 98% 98% 74% 66% 54% 50% 47% 40% 33%
$9.00 98% 98% 98% 98% 74% 66% 54% 50% 47% 40%
$10.00 98% 98% 98% 98% 98% 74% 66% 54% 50% 47%
Source: PBO Calculations
Table A6-2
Table A6-3
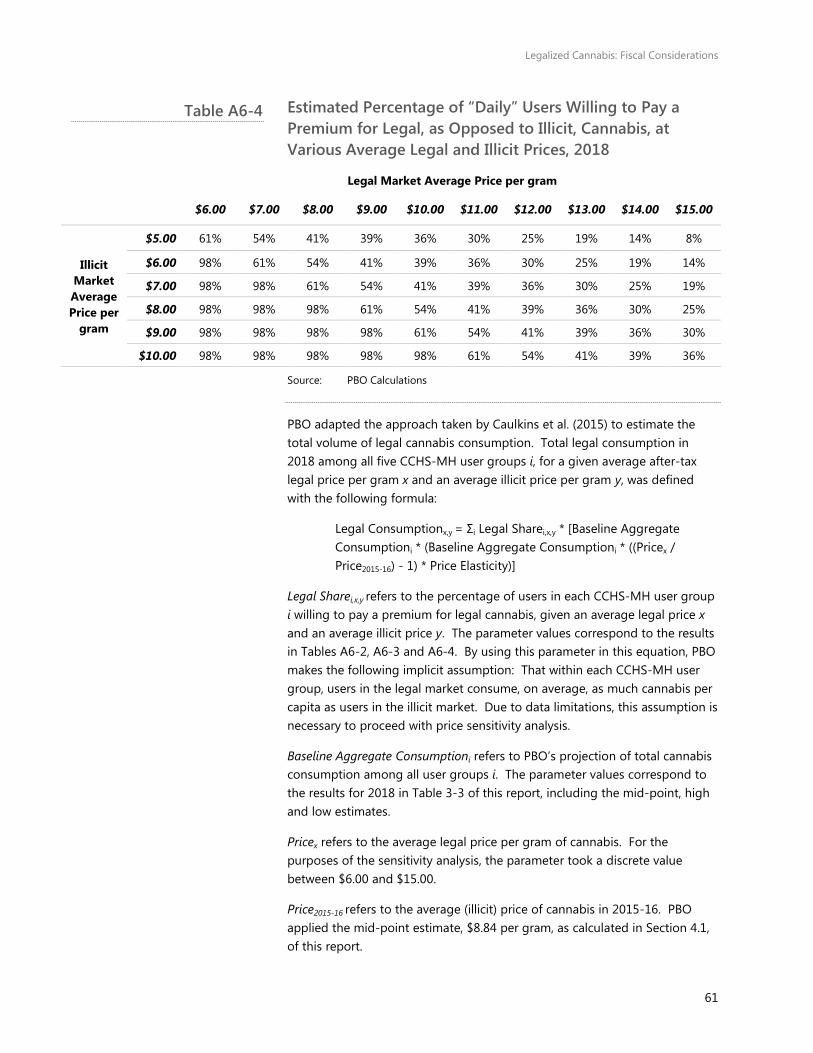
Legalized Cannabis: Fiscal Considerations
61
Estimated Percentage of “Daily” Users Willing to Pay a Premium for Legal, as Opposed to Illicit, Cannabis, at Various Average Legal and Illicit Prices, 2018
Legal Market Average Price per gram
$6.00 $7.00 $8.00 $9.00 $10.00 $11.00 $12.00 $13.00 $14.00 $15.00
Illicit Market Average Price per
gram
$5.00 61% 54% 41% 39% 36% 30% 25% 19% 14% 8%
$6.00 98% 61% 54% 41% 39% 36% 30% 25% 19% 14%
$7.00 98% 98% 61% 54% 41% 39% 36% 30% 25% 19%
$8.00 98% 98% 98% 61% 54% 41% 39% 36% 30% 25%
$9.00 98% 98% 98% 98% 61% 54% 41% 39% 36% 30%
$10.00 98% 98% 98% 98% 98% 61% 54% 41% 39% 36%
Source: PBO Calculations
PBO adapted the approach taken by Caulkins et al. (2015) to estimate the total volume of legal cannabis consumption. Total legal consumption in 2018 among all five CCHS-MH user groups i, for a given average after-tax legal price per gram x and an average illicit price per gram y, was defined with the following formula:
Legal Consumptionx,y = Σi Legal Sharei,x,y * [Baseline Aggregate Consumptioni * (Baseline Aggregate Consumptioni * ((Pricex / Price2015-16) - 1) * Price Elasticity)]
Legal Sharei,x,y refers to the percentage of users in each CCHS-MH user group i willing to pay a premium for legal cannabis, given an average legal price x and an average illicit price y. The parameter values correspond to the results in Tables A6-2, A6-3 and A6-4. By using this parameter in this equation, PBO makes the following implicit assumption: That within each CCHS-MH user group, users in the legal market consume, on average, as much cannabis per capita as users in the illicit market. Due to data limitations, this assumption is necessary to proceed with price sensitivity analysis.
Baseline Aggregate Consumptioni refers to PBO’s projection of total cannabis consumption among all user groups i. The parameter values correspond to the results for 2018 in Table 3-3 of this report, including the mid-point, high and low estimates.
Pricex refers to the average legal price per gram of cannabis. For the purposes of the sensitivity analysis, the parameter took a discrete value between $6.00 and $15.00.
Price2015-16 refers to the average (illicit) price of cannabis in 2015-16. PBO applied the mid-point estimate, $8.84 per gram, as calculated in Section 4.1, of this report.
Table A6-4
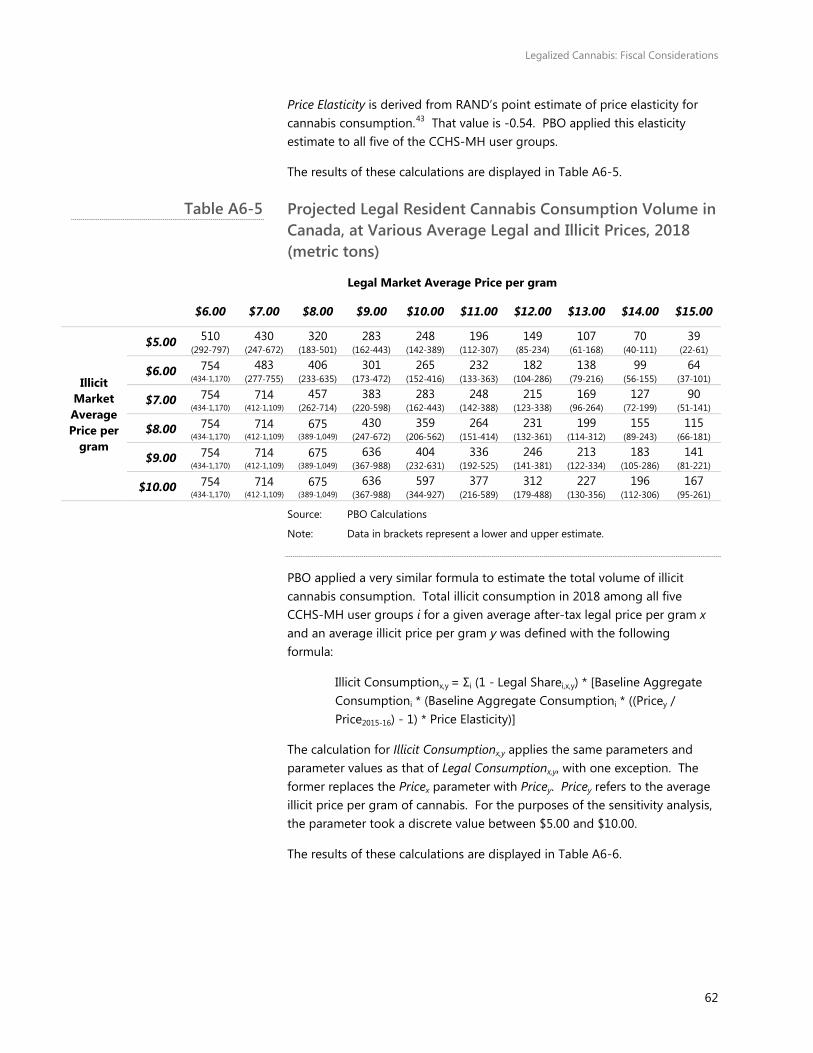
Legalized Cannabis: Fiscal Considerations
62
Price Elasticity is derived from RAND’s point estimate of price elasticity for cannabis consumption.43 That value is -0.54. PBO applied this elasticity estimate to all five of the CCHS-MH user groups.
The results of these calculations are displayed in Table A6-5.
Projected Legal Resident Cannabis Consumption Volume in Canada, at Various Average Legal and Illicit Prices, 2018 (metric tons)
Legal Market Average Price per gram
$6.00 $7.00 $8.00 $9.00 $10.00 $11.00 $12.00 $13.00 $14.00 $15.00
Illicit Market Average Price per
gram
$5.00 510 (292-797)
430 (247-672)
320 (183-501)
283 (162-443)
248 (142-389)
196 (112-307)
149 (85-234)
107 (61-168)
70 (40-111)
39 (22-61)
$6.00 754 (434-1,170)
483 (277-755)
406 (233-635)
301 (173-472)
265 (152-416)
232 (133-363)
182 (104-286)
138 (79-216)
99 (56-155)
64 (37-101)
$7.00 754 (434-1,170)
714 (412-1,109)
457 (262-714)
383 (220-598)
283 (162-443)
248 (142-388)
215 (123-338)
169 (96-264)
127 (72-199)
90 (51-141)
$8.00 754 (434-1,170)
714 (412-1,109)
675 (389-1,049)
430 (247-672)
359 (206-562)
264 (151-414)
231 (132-361)
199 (114-312)
155 (89-243)
115 (66-181)
$9.00 754 (434-1,170)
714 (412-1,109)
675 (389-1,049)
636 (367-988)
404 (232-631)
336 (192-525)
246 (141-381)
213 (122-334)
183 (105-286)
141 (81-221)
$10.00 754 (434-1,170)
714 (412-1,109)
675 (389-1,049)
636 (367-988)
597 (344-927)
377 (216-589)
312 (179-488)
227 (130-356)
196 (112-306)
167 (95-261)
Source: PBO Calculations
Note: Data in brackets represent a lower and upper estimate.
PBO applied a very similar formula to estimate the total volume of illicit cannabis consumption. Total illicit consumption in 2018 among all five CCHS-MH user groups i for a given average after-tax legal price per gram x and an average illicit price per gram y was defined with the following formula:
Illicit Consumptionx,y = Σi (1 - Legal Sharei,x,y) * [Baseline Aggregate Consumptioni * (Baseline Aggregate Consumptioni * ((Pricey / Price2015-16) - 1) * Price Elasticity)]
The calculation for Illicit Consumptionx,y applies the same parameters and parameter values as that of Legal Consumptionx,y, with one exception. The former replaces the Pricex parameter with Pricey. Pricey refers to the average illicit price per gram of cannabis. For the purposes of the sensitivity analysis, the parameter took a discrete value between $5.00 and $10.00.
The results of these calculations are displayed in Table A6-6.
Table A6-5
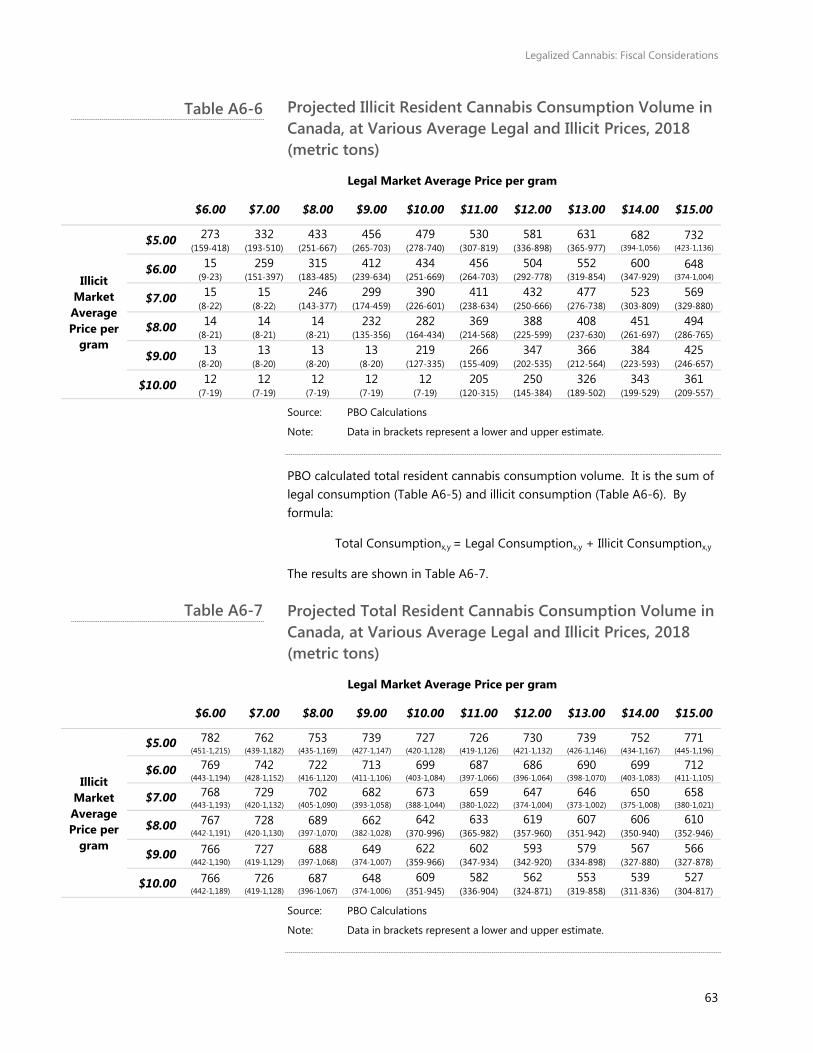
Legalized Cannabis: Fiscal Considerations
63
Projected Illicit Resident Cannabis Consumption Volume in Canada, at Various Average Legal and Illicit Prices, 2018 (metric tons)
Legal Market Average Price per gram
$6.00 $7.00 $8.00 $9.00 $10.00 $11.00 $12.00 $13.00 $14.00 $15.00
Illicit Market Average Price per
gram
$5.00 273 (159-418)
332 (193-510)
433 (251-667)
456 (265-703)
479 (278-740)
530 (307-819)
581 (336-898)
631 (365-977)
682 (394-1,056)
732 (423-1,136)
$6.00 15 (9-23)
259 (151-397)
315 (183-485)
412 (239-634)
434 (251-669)
456 (264-703)
504 (292-778)
552 (319-854)
600 (347-929)
648 (374-1,004)
$7.00 15 (8-22)
15 (8-22)
246 (143-377)
299 (174-459)
390 (226-601)
411 (238-634)
432 (250-666)
477 (276-738)
523 (303-809)
569 (329-880)
$8.00 14 (8-21)
14 (8-21)
14 (8-21)
232 (135-356)
282 (164-434)
369 (214-568)
388 (225-599)
408 (237-630)
451 (261-697)
494 (286-765)
$9.00 13 (8-20)
13 (8-20)
13 (8-20)
13 (8-20)
219 (127-335)
266 (155-409)
347 (202-535)
366 (212-564)
384 (223-593)
425 (246-657)
$10.00 12 (7-19)
12 (7-19)
12 (7-19)
12 (7-19)
12 (7-19)
205 (120-315)
250 (145-384)
326 (189-502)
343 (199-529)
361 (209-557)
Source: PBO Calculations
Note: Data in brackets represent a lower and upper estimate.
PBO calculated total resident cannabis consumption volume. It is the sum of legal consumption (Table A6-5) and illicit consumption (Table A6-6). By formula:
Total Consumptionx,y = Legal Consumptionx,y + Illicit Consumptionx,y
The results are shown in Table A6-7.
Projected Total Resident Cannabis Consumption Volume in Canada, at Various Average Legal and Illicit Prices, 2018 (metric tons)
Legal Market Average Price per gram
$6.00 $7.00 $8.00 $9.00 $10.00 $11.00 $12.00 $13.00 $14.00 $15.00
Illicit Market Average Price per
gram
$5.00 782 (451-1,215)
762 (439-1,182)
753 (435-1,169)
739 (427-1,147)
727 (420-1,128)
726 (419-1,126)
730 (421-1,132)
739 (426-1,146)
752 (434-1,167)
771 (445-1,196)
$6.00 769 (443-1,194)
742 (428-1,152)
722 (416-1,120)
713 (411-1,106)
699 (403-1,084)
687 (397-1,066)
686 (396-1,064)
690 (398-1,070)
699 (403-1,083)
712 (411-1,105)
$7.00 768 (443-1,193)
729 (420-1,132)
702 (405-1,090)
682 (393-1,058)
673 (388-1,044)
659 (380-1,022)
647 (374-1,004)
646 (373-1,002)
650 (375-1,008)
658 (380-1,021)
$8.00 767 (442-1,191)
728 (420-1,130)
689 (397-1,070)
662 (382-1,028)
642 (370-996)
633 (365-982)
619 (357-960)
607 (351-942)
606 (350-940)
610 (352-946)
$9.00 766 (442-1,190)
727 (419-1,129)
688 (397-1,068)
649 (374-1,007)
622 (359-966)
602 (347-934)
593 (342-920)
579 (334-898)
567 (327-880)
566 (327-878)
$10.00 766 (442-1,189)
726 (419-1,128)
687 (396-1,067)
648 (374-1,006)
609 (351-945)
582 (336-904)
562 (324-871)
553 (319-858)
539 (311-836)
527 (304-817)
Source: PBO Calculations
Note: Data in brackets represent a lower and upper estimate.
Table A6-6
Table A6-7
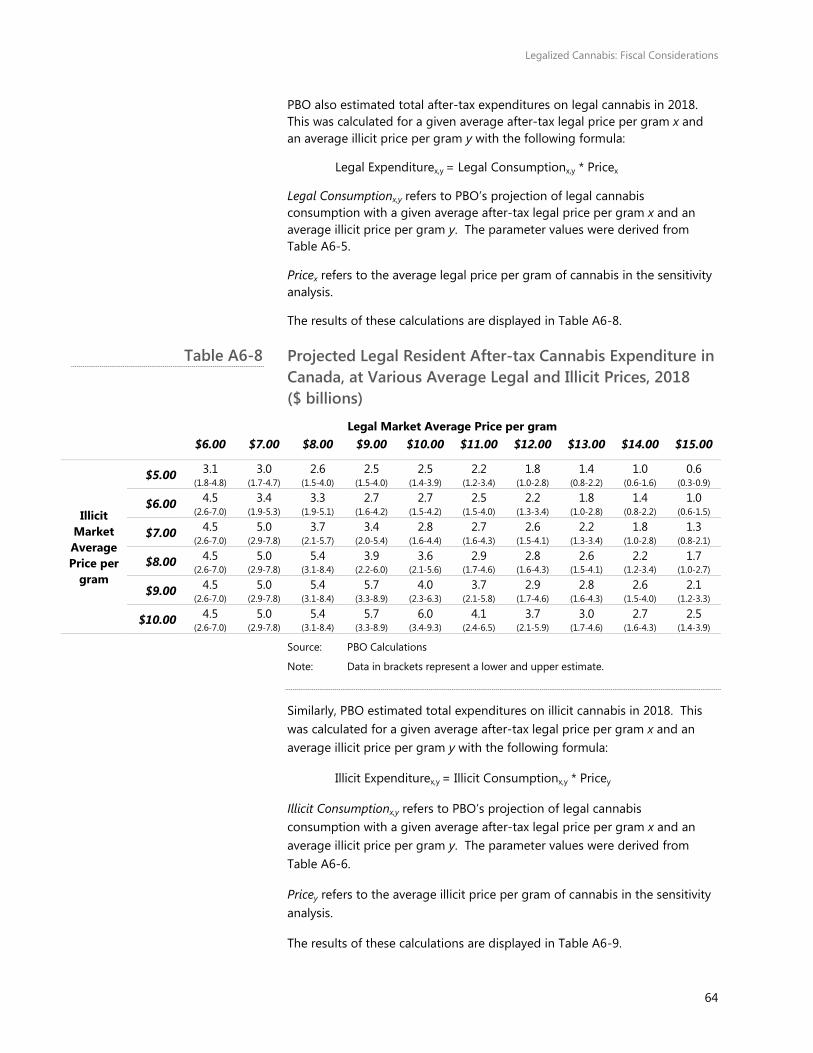
Legalized Cannabis: Fiscal Considerations
64
PBO also estimated total after-tax expenditures on legal cannabis in 2018. This was calculated for a given average after-tax legal price per gram x and an average illicit price per gram y with the following formula:
Legal Expenditurex,y = Legal Consumptionx,y * Pricex
Legal Consumptionx,y refers to PBO’s projection of legal cannabis consumption with a given average after-tax legal price per gram x and an average illicit price per gram y. The parameter values were derived from Table A6-5.
Pricex refers to the average legal price per gram of cannabis in the sensitivity analysis.
The results of these calculations are displayed in Table A6-8.
Projected Legal Resident After-tax Cannabis Expenditure in Canada, at Various Average Legal and Illicit Prices, 2018 ($ billions)
Legal Market Average Price per gram $6.00 $7.00 $8.00 $9.00 $10.00 $11.00 $12.00 $13.00 $14.00 $15.00
Illicit Market Average Price per
gram
$5.00 3.1 (1.8-4.8)
3.0 (1.7-4.7)
2.6 (1.5-4.0)
2.5 (1.5-4.0)
2.5 (1.4-3.9)
2.2 (1.2-3.4)
1.8 (1.0-2.8)
1.4 (0.8-2.2)
1.0 (0.6-1.6)
0.6 (0.3-0.9)
$6.00 4.5 (2.6-7.0)
3.4 (1.9-5.3)
3.3 (1.9-5.1)
2.7 (1.6-4.2)
2.7 (1.5-4.2)
2.5 (1.5-4.0)
2.2 (1.3-3.4)
1.8 (1.0-2.8)
1.4 (0.8-2.2)
1.0 (0.6-1.5)
$7.00 4.5 (2.6-7.0)
5.0 (2.9-7.8)
3.7 (2.1-5.7)
3.4 (2.0-5.4)
2.8 (1.6-4.4)
2.7 (1.6-4.3)
2.6 (1.5-4.1)
2.2 (1.3-3.4)
1.8 (1.0-2.8)
1.3 (0.8-2.1)
$8.00 4.5 (2.6-7.0)
5.0 (2.9-7.8)
5.4 (3.1-8.4)
3.9 (2.2-6.0)
3.6 (2.1-5.6)
2.9 (1.7-4.6)
2.8 (1.6-4.3)
2.6 (1.5-4.1)
2.2 (1.2-3.4)
1.7 (1.0-2.7)
$9.00 4.5 (2.6-7.0)
5.0 (2.9-7.8)
5.4 (3.1-8.4)
5.7 (3.3-8.9)
4.0 (2.3-6.3)
3.7 (2.1-5.8)
2.9 (1.7-4.6)
2.8 (1.6-4.3)
2.6 (1.5-4.0)
2.1 (1.2-3.3)
$10.00 4.5 (2.6-7.0)
5.0 (2.9-7.8)
5.4 (3.1-8.4)
5.7 (3.3-8.9)
6.0 (3.4-9.3)
4.1 (2.4-6.5)
3.7 (2.1-5.9)
3.0 (1.7-4.6)
2.7 (1.6-4.3)
2.5 (1.4-3.9)
Source: PBO Calculations
Note: Data in brackets represent a lower and upper estimate.
Similarly, PBO estimated total expenditures on illicit cannabis in 2018. This was calculated for a given average after-tax legal price per gram x and an average illicit price per gram y with the following formula:
Illicit Expenditurex,y = Illicit Consumptionx,y * Pricey
Illicit Consumptionx,y refers to PBO’s projection of legal cannabis consumption with a given average after-tax legal price per gram x and an average illicit price per gram y. The parameter values were derived from Table A6-6.
Pricey refers to the average illicit price per gram of cannabis in the sensitivity analysis.
The results of these calculations are displayed in Table A6-9.
Table A6-8
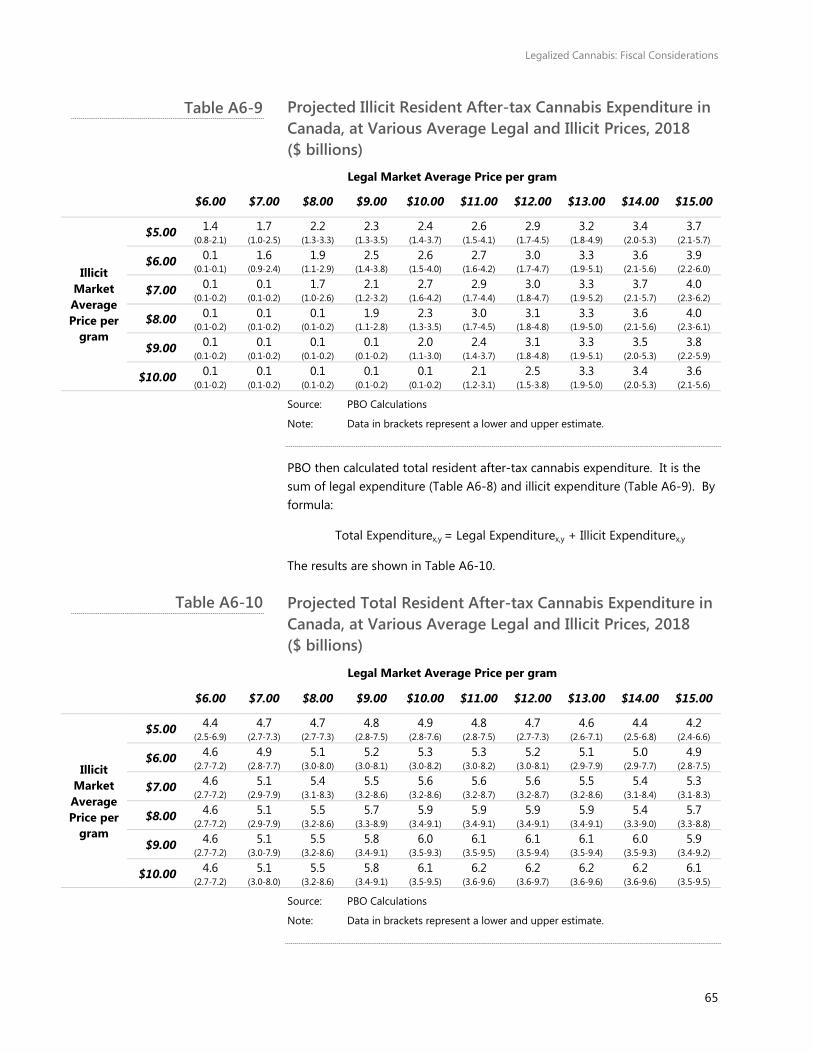
Legalized Cannabis: Fiscal Considerations
65
Projected Illicit Resident After-tax Cannabis Expenditure in Canada, at Various Average Legal and Illicit Prices, 2018 ($ billions)
Legal Market Average Price per gram
$6.00 $7.00 $8.00 $9.00 $10.00 $11.00 $12.00 $13.00 $14.00 $15.00
Illicit Market Average Price per
gram
$5.00 1.4 (0.8-2.1)
1.7 (1.0-2.5)
2.2 (1.3-3.3)
2.3 (1.3-3.5)
2.4 (1.4-3.7)
2.6 (1.5-4.1)
2.9 (1.7-4.5)
3.2 (1.8-4.9)
3.4 (2.0-5.3)
3.7 (2.1-5.7)
$6.00 0.1 (0.1-0.1)
1.6 (0.9-2.4)
1.9 (1.1-2.9)
2.5 (1.4-3.8)
2.6 (1.5-4.0)
2.7 (1.6-4.2)
3.0 (1.7-4.7)
3.3 (1.9-5.1)
3.6 (2.1-5.6)
3.9 (2.2-6.0)
$7.00 0.1 (0.1-0.2)
0.1 (0.1-0.2)
1.7 (1.0-2.6)
2.1 (1.2-3.2)
2.7 (1.6-4.2)
2.9 (1.7-4.4)
3.0 (1.8-4.7)
3.3 (1.9-5.2)
3.7 (2.1-5.7)
4.0 (2.3-6.2)
$8.00 0.1 (0.1-0.2)
0.1 (0.1-0.2)
0.1 (0.1-0.2)
1.9 (1.1-2.8)
2.3 (1.3-3.5)
3.0 (1.7-4.5)
3.1 (1.8-4.8)
3.3 (1.9-5.0)
3.6 (2.1-5.6)
4.0 (2.3-6.1)
$9.00 0.1 (0.1-0.2)
0.1 (0.1-0.2)
0.1 (0.1-0.2)
0.1 (0.1-0.2)
2.0 (1.1-3.0)
2.4 (1.4-3.7)
3.1 (1.8-4.8)
3.3 (1.9-5.1)
3.5 (2.0-5.3)
3.8 (2.2-5.9)
$10.00 0.1 (0.1-0.2)
0.1 (0.1-0.2)
0.1 (0.1-0.2)
0.1 (0.1-0.2)
0.1 (0.1-0.2)
2.1 (1.2-3.1)
2.5 (1.5-3.8)
3.3 (1.9-5.0)
3.4 (2.0-5.3)
3.6 (2.1-5.6)
Source: PBO Calculations
Note: Data in brackets represent a lower and upper estimate.
PBO then calculated total resident after-tax cannabis expenditure. It is the sum of legal expenditure (Table A6-8) and illicit expenditure (Table A6-9). By formula:
Total Expenditurex,y = Legal Expenditurex,y + Illicit Expenditurex,y
The results are shown in Table A6-10.
Projected Total Resident After-tax Cannabis Expenditure in Canada, at Various Average Legal and Illicit Prices, 2018 ($ billions)
Legal Market Average Price per gram
$6.00 $7.00 $8.00 $9.00 $10.00 $11.00 $12.00 $13.00 $14.00 $15.00
Illicit Market Average Price per
gram
$5.00 4.4 (2.5-6.9)
4.7 (2.7-7.3)
4.7 (2.7-7.3)
4.8 (2.8-7.5)
4.9 (2.8-7.6)
4.8 (2.8-7.5)
4.7 (2.7-7.3)
4.6 (2.6-7.1)
4.4 (2.5-6.8)
4.2 (2.4-6.6)
$6.00 4.6 (2.7-7.2)
4.9 (2.8-7.7)
5.1 (3.0-8.0)
5.2 (3.0-8.1)
5.3 (3.0-8.2)
5.3 (3.0-8.2)
5.2 (3.0-8.1)
5.1 (2.9-7.9)
5.0 (2.9-7.7)
4.9 (2.8-7.5)
$7.00 4.6 (2.7-7.2)
5.1 (2.9-7.9)
5.4 (3.1-8.3)
5.5 (3.2-8.6)
5.6 (3.2-8.6)
5.6 (3.2-8.7)
5.6 (3.2-8.7)
5.5 (3.2-8.6)
5.4 (3.1-8.4)
5.3 (3.1-8.3)
$8.00 4.6 (2.7-7.2)
5.1 (2.9-7.9)
5.5 (3.2-8.6)
5.7 (3.3-8.9)
5.9 (3.4-9.1)
5.9 (3.4-9.1)
5.9 (3.4-9.1)
5.9 (3.4-9.1)
5.4 (3.3-9.0)
5.7 (3.3-8.8)
$9.00 4.6 (2.7-7.2)
5.1 (3.0-7.9)
5.5 (3.2-8.6)
5.8 (3.4-9.1)
6.0 (3.5-9.3)
6.1 (3.5-9.5)
6.1 (3.5-9.4)
6.1 (3.5-9.4)
6.0 (3.5-9.3)
5.9 (3.4-9.2)
$10.00 4.6 (2.7-7.2)
5.1 (3.0-8.0)
5.5 (3.2-8.6)
5.8 (3.4-9.1)
6.1 (3.5-9.5)
6.2 (3.6-9.6)
6.2 (3.6-9.7)
6.2 (3.6-9.6)
6.2 (3.6-9.6)
6.1 (3.5-9.5)
Source: PBO Calculations
Note: Data in brackets represent a lower and upper estimate.
Table A6-9
Table A6-10
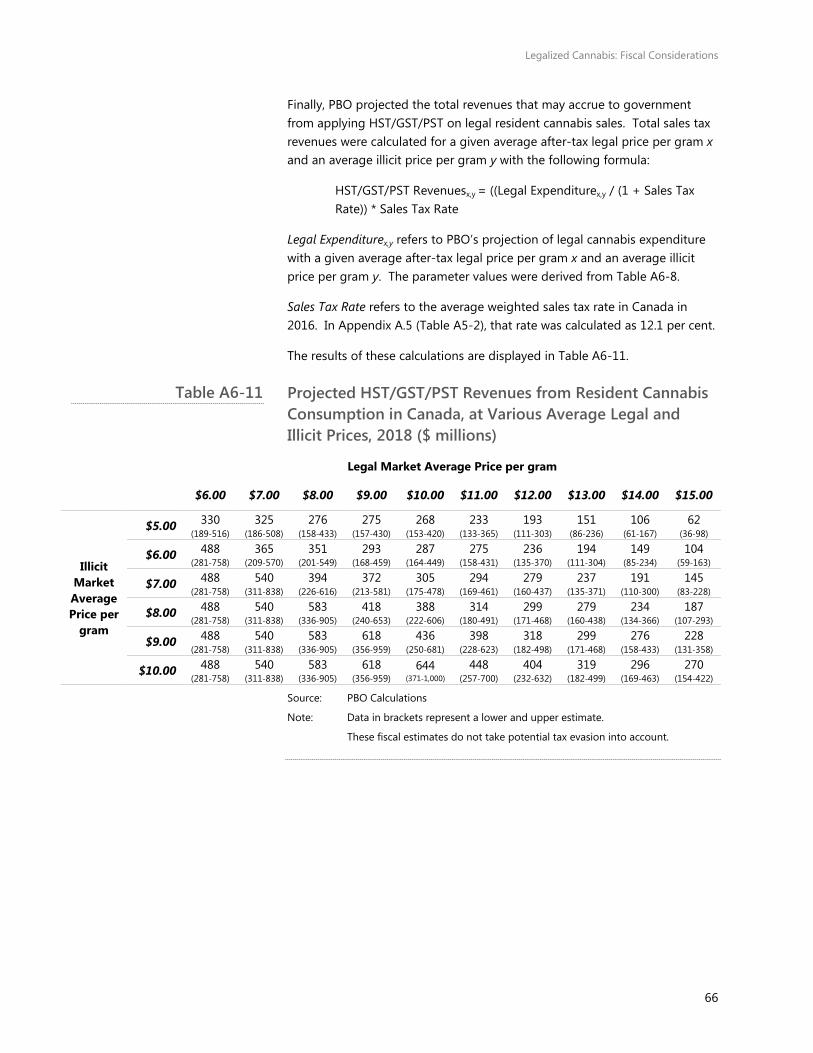
Legalized Cannabis: Fiscal Considerations
66
Finally, PBO projected the total revenues that may accrue to government from applying HST/GST/PST on legal resident cannabis sales. Total sales tax revenues were calculated for a given average after-tax legal price per gram x and an average illicit price per gram y with the following formula:
HST/GST/PST Revenuesx,y = ((Legal Expenditurex,y / (1 + Sales Tax Rate)) * Sales Tax Rate
Legal Expenditurex,y refers to PBO’s projection of legal cannabis expenditure with a given average after-tax legal price per gram x and an average illicit price per gram y. The parameter values were derived from Table A6-8.
Sales Tax Rate refers to the average weighted sales tax rate in Canada in 2016. In Appendix A.5 (Table A5-2), that rate was calculated as 12.1 per cent.
The results of these calculations are displayed in Table A6-11.
Projected HST/GST/PST Revenues from Resident Cannabis Consumption in Canada, at Various Average Legal and Illicit Prices, 2018 ($ millions)
Legal Market Average Price per gram
$6.00 $7.00 $8.00 $9.00 $10.00 $11.00 $12.00 $13.00 $14.00 $15.00
Illicit Market Average Price per
gram
$5.00 330 (189-516)
325 (186-508)
276 (158-433)
275 (157-430)
268 (153-420)
233 (133-365)
193 (111-303)
151 (86-236)
106 (61-167)
62 (36-98)
$6.00 488 (281-758)
365 (209-570)
351 (201-549)
293 (168-459)
287 (164-449)
275 (158-431)
236 (135-370)
194 (111-304)
149 (85-234)
104 (59-163)
$7.00 488 (281-758)
540 (311-838)
394 (226-616)
372 (213-581)
305 (175-478)
294 (169-461)
279 (160-437)
237 (135-371)
191 (110-300)
145 (83-228)
$8.00 488 (281-758)
540 (311-838)
583 (336-905)
418 (240-653)
388 (222-606)
314 (180-491)
299 (171-468)
279 (160-438)
234 (134-366)
187 (107-293)
$9.00 488 (281-758)
540 (311-838)
583 (336-905)
618 (356-959)
436 (250-681)
398 (228-623)
318 (182-498)
299 (171-468)
276 (158-433)
228 (131-358)
$10.00 488 (281-758)
540 (311-838)
583 (336-905)
618 (356-959)
644 (371-1,000)
448 (257-700)
404 (232-632)
319 (182-499)
296 (169-463)
270 (154-422)
Source: PBO Calculations
Note: Data in brackets represent a lower and upper estimate.
These fiscal estimates do not take potential tax evasion into account.
Table A6-11
Legalized Cannabis: Fiscal Considerations
67
References Anthony, R. and A. Fries. (2006). Empirical modelling of narcotics trafficking from farm gate to street. In United Nations Office on Drugs and Crime (UNODC), Bulletin on Narcotics: Illicit drug markets, Volume LVI, Nos. 1 and 2, 2004.
Bank of Canada. (2013). Year Average of Exchange Rates. Retrieved from http://www.bankofcanada.ca/stats/assets/pdf/nraa-2013-en.pdf.
Bank of Canada. (2016). Daily Noon Exchange Rates: 10-Year Lookup. Retrieved from http://www.bankofcanada.ca/rates/exchange/10-year-lookup/.
Bouchard, M. (2008). Towards a realistic method to estimate cannabis production in industrialized countries. Contemporary Drug Problems, 35(2-3), 291-320.
Boucher, A., A. Lawrence, and A. Maslov. (2013). The Price of Marijuana in Canada: Preliminary Discussion of Using Price Data for Operational and Policy Purposes. Public Safety Canada. Retrieved from http://static.globalnews.ca/content/interactives/documents/general_news_bucket/A-2013-00415.PDF.
Canada Revenue Agency. (2016a). Details of medical expenses. Retrieved from http://www.cra-arc.gc.ca/tx/ndvdls/tpcs/ncm-tx/rtrn/cmpltng/ddctns/lns300-350/330-331/dtlxpns-eng.html#mrjn.
Canada Revenue Agency. (2016b). GST/HST calculator and GST/HST rates table. Retrieved from http://www.cra-arc.gc.ca/tx/bsnss/tpcs/gst-tps/rts-eng.html.
Caulkins, J. and R. Padman. (1993). Quantity Discounts and Quality Premia for Illicit Drugs. Journal of the American Statistical Association, 88(423), 748-757.
Caulkins, J. and P. Reuter. (1998). What price data tell us about drug market. Journal of Drug Issues, 28(3), 593-612.
Caulkins, J. and R. Pacula. (2006). Marijuana Markets: Inferences from Reports by the Household Population. Journal of Drug Issues, 36(1), 173-200.
Caulkins, J. (2010). Estimated Cost of Production for Legalized Cannabis. RAND Corporation. Retrieved from http://www.rand.org/content/dam/rand/pubs/working_papers/2010/RAND_WR764.pdf.
Caulkins, J., S. Andrzejewski, and L. Dahlkemper. (2013). How much revenue could the cannabis tax generate, under different scenarios? BOTEC Analysis Corporation. Retrieved from http://liq.wa.gov/publications/Marijuana/BOTEC%20reports/8b_Tax_revenue_under_different_scenarios-%20Final.pdf.
Caulkins, J. et al. (2015). Considering Marijuana Legalization: Insights for Vermont and Other Jurisdictions. RAND Corporation. Retrieved from http://www.rand.org/pubs/research_reports/RR864.html.
Clements, K. and X. Zhao. (2009). Economic and Marijuana: Consumption, Pricing and Legalization. New York: Cambridge University Press.
Colorado Department of Revenue. (2015). Annual Update: Enforcement Division – Marijuana. Retrieved from
Legalized Cannabis: Fiscal Considerations
68
https://www.colorado.gov/pacific/sites/default/files/2014%20MED%20Annual%20Report_1.pdf.
Crawford, S. (2014). Estimating the Quasi-Underground: Oregon’s Informal Marijuana Economy. Humboldt Journal of Social Relations, 36, 118-137.
Department of Finance Canada. (2016). Growing the Middle Class: Budget 2016. Retrieved from http://www.budget.gc.ca/2016/docs/plan/budget2016-en.pdf.
First Nations Centre. (2005). First Nations Regional Longitudinal Health Survey (RHS) 2002/03. Retrieved from http://fnigc.ca/sites/default/files/ENpdf/RHS_2002/rhs2002-03-technical_report.pdf.
Government of Canada. (2015). Speech from the Throne: Making Real Change Happen. Retrieved from http://speech.gc.ca/en/content/making-real-change-happen.
Government of Canada. (2016a). Government of Canada moves forward on Marijuana Legalization and Regulation. Retrieved from http://news.gc.ca/web/article-en.do?nid=1092399.
Government of Canada. (2016b). Plenary Statement for the Honourable Jane Philpott Minister of Health – UNGASS on the World Drug Problem. Retrieved from http://news.gc.ca/web/article-en.do?nid=1054489.
Government of the Northwest Territories. (2006). Northwest Territories Addiction Survey. Retrieved from http://pubs.aina.ucalgary.ca/health/62225E.pdf.
Government of Prince Edward Island. (2016). Revenue Tax (PST). Retrieved from http://www.gov.pe.ca/infopei/index.php3?number=1010944&lang=E.
Government of Yukon. (2006). Yukon Addictions Survey (YAS): Preliminary Results 2005. Retrieved from http://pubs.aina.ucalgary.ca/health/60755YT.pdf.
Gravelle, J. and S. Lowry. (2014). Federal Proposals to Tax Marijuana: An Economic Analysis. Congressional Research Service. Retrieved from https://fas.org/sgp/crs/misc/R43785.pdf.
Health Canada. (2005). Canadian Addiction Survey (CAS): Detailed Report. Retrieved from http://www.ccsa.ca/Resource%20Library/ccsa-004028-2005.pdf.
Health Canada. (2010). Youth Smoking Survey 2008-2009 – Supplementary Tables. Retrieved from https://uwaterloo.ca/canadian-student-tobacco-alcohol-drugs-survey/sites/ca.canadian-student-tobacco-alcohol-drugs-survey/files/uploads/files/YSS2008-2009_supplementary_tables_en.pdf.
Health Canada. (2012). Youth Smoking Survey 2010-2011 – Supplementary Tables. Retrieved from http://www.hc-sc.gc.ca/hc-ps/tobac-tabac/research-recherche/stat/_survey-sondage_2010-2011/table-eng.php#t16.
Health Canada. (2014). Youth Smoking Survey 2012-2013 – Supplementary Tables. Retrieved from http://healthycanadians.gc.ca/publications/healthy-living-vie-saine/youth-smoking-survey-tables-2012-2013-tableaux-enquete-jeunes-tabagisme/index-eng.php#t16.
Health Canada. (2016a). Canadian Student Tobacco, Alcohol and Drugs Survey (CSTADS) – Detailed Tables for 2014-15. Retrieved from http://healthycanadians.gc.ca/science-research-sciences-recherches/data-donnees/cstads-ectade/tables-tableaux-2014-15-eng.php#t19.
Legalized Cannabis: Fiscal Considerations
69
Health Canada. (2016b). Medical Use of Marijuana – Market Data. Retrieved from http://www.hc-sc.gc.ca/dhp-mps/marihuana/info/market-marche-eng.php.
Hedges v. Canada. (2016). Federal Court of Appeal 19 (CanLII). Retreived from http://www.canlii.org/en/ca/fca/doc/2016/2016fca19/2016fca19.html.
Kilmer, B. and R. Pacula. (2009). Estimating the size of the global drug market: A demand-side approach. RAND Corporation. Retrieved from http://www.rand.org/content/dam/rand/pubs/technical_reports/2009/RAND_TR711.pdf.
Kilmer, B. et al. (2010a). Altered State? Assessing How Marijuana Legalization in California Could Influence Marijuana Consumption and Public Budgets. RAND Corporation. Retrieved from http://www.rand.org/content/dam/rand/pubs/occasional_papers/2010/RAND_OP315.pdf.
Kilmer, B. et al. (2010b). Reducing Drug Trafficking Revenues and Violence in Mexico. Retrieved from https://www.rand.org/content/dam/rand/pubs/occasional_papers/2010/RAND_OP325.pdf.
Kilmer, B. et al. (2011). Bringing perspective to illicit markets: Estimating the size of the U.S. marijuana market. Drug and Alocohol Dependence, 119(1-2), 153-160.
Kilmer, B. et al. (2013a). Before the Grand Opening: Measuring Washington State’s Marijuana market in the Last Year Before Legalized Commercial Sales, RAND Corporation. Retrieved from http://www.rand.org/pubs/research_reports/RR466.html.
Kilmer, B. et al. (2013b). Before the Grand Opening: Measuring Washington State’s Marijuana Market in the Last Year Before Legalized Commercial Sales (Appendixes A, B, and C). RAND Corporation. Retrieved from http://www.rand.org/content/dam/rand/pubs/research_reports/RR400/RR466/RAND_RR466.appendixes.pdf.
Lawrence, A. (2016). Ways to Consider Non-Medical Cannabis: Reasoning from Conceptual Analogues. Public Safety Research Division, Research Report 2016-R011.
Light, M. et al. (2014). Market Size and Demand for Marijuana in Colorado. The Marijuana Policy Group [for the Colorado Department of Revenue]. Retrieved from https://www.colorado.gov/pacific/sites/default/files/Market%20Size%20and%20Demand%20Study,%20July%209,%202014%5B1%5D.pdf.
MacKay, R. and K. Phillips. (2016). The Legal Regulation of Marijuana in Canada and Selected Other Countries. Library of Parliament, Legal and Social Affairs Division. Retrieved from http://www.lop.parl.gc.ca/Content/LOP/ResearchPublications/2016-94-e.html?cat=law.
Office of the Prime Minister. (2015a). Minister of Health Mandate Letter. Retrieved from http://pm.gc.ca/eng/minister-health-mandate-letter.
Office of the Prime Minister. (2015b). Minister of Justice and Attorney General of Canada Mandate Letter. Retrieved from http://pm.gc.ca/eng/minister-justice-and-attorney-general-canada-mandate-letter.
Legalized Cannabis: Fiscal Considerations
70
Office of the Prime Minister. (2015c). Minister of Public Safety and Emergency Preparedness Mandate Letter. Retrieved from http://pm.gc.ca/eng/minister-public-safety-and-emergency-preparedness-mandate-letter.
Ohio Office of Budget and Management, Ohio Department of Taxation. (2015). 2015 State Issue 3 – Consolidated Estimate. Retrieved from http://www.dispatch.com/content/downloads/2015/10/3-economicimpact.pdf.
Pacula, R. and R. Lundberg. (2014). Why Changes in Price Matter When Thinking About Marijuana Policy: A Review of the Literature on the Elasticity of Demand. Public Health Review, 35(2), 1-18.
Physicians for a Smoke-Free Canada. (2016). Taxes on cigarettes in Canadian jurisdictions. Retrieved from http://www.smoke-free.ca/factsheets/pdf/taxrates.pdf.
Price of Weed (2016). What is Marijuana Really Worth? Retrieved from http://www.priceofweed.com/.
Public Safety Canada. (2016a). Cannabis Policy Analogues: Ways to Consider Non-Medical Cannabis. Retrieved from https://www.publicsafety.gc.ca/cnt/rsrcs/pblctns/2016-s011/2016-s011-eng.pdf.
Public Safety Canada. (2016b). Cannabis Policy Performance Metrics. Retrieved from https://www.publicsafety.gc.ca/cnt/rsrcs/pblctns/2016-s009/2016-s009-en.pdf.
Robinson, P. (2015). Price of Legal Pot Plunges 40% in Washington as Shortages Ease. Bloomberg. Retrieved from http://www.bloomberg.com/news/articles/2015-01-07/price-of-legal-pot-plunges-40-in-washington-as-shortages-ease.
Shenfield, A. (2016). Growing Their Own Revenue: The Fiscal Impacts of Cannabis Legalization. CIBC World Markets. Retrieved from http://research.cibcwm.com/economic_public/download/eijan16.pdf.
Sobetski, G. (2015). HB15-1367 State and Local Revised Fiscal Impact. Colorado Legislative Council. Retrieved from http://www.leg.state.co.us/clics/clics2015a/csl.nsf/billcontainers/CE570342F005495687257E27007E922D/$FILE/HB1367_00.pdf.
Substance Abuse and Mental Health Services Administration. (2013). National Survey on Drug Use and Health: Comparison of 2010-2011 and 2011-2012 Model-Based Prevalence Estimates for Adults Aged 18 or Older (50 States and the District of Columbia). Retrieved from http://www.samhsa.gov/data/sites/default/files/NSDUHStateEst2011-2012/AdultTabs/Web/NSDUHsaeAdultTabs2012.pdf.
Substance Abuse and Mental Health Services Administration. (2014). National Survey on Drug Use and Health: Comparison of 2011-2012 and 2012-2013 Model-Based Prevalence Estimates for Adults Aged 18 or Older (50 States and the District of Columbia). Retrieved from http://www.samhsa.gov/data/sites/default/files/NSDUHStateEst2012-2013-p1/ChangeTabs/NSDUHsaeShortTermCHG2013.htm.
Substance Abuse and Mental Health Services Administration. (2015). National Survey on Drug Use and Health: Comparison of 2012-2013 and 2013-2014 Model-Based Prevalence Estimates for Adults Aged 18 or Older (50 States and the District of Columbia). Retrieved from
Legalized Cannabis: Fiscal Considerations
71
http://www.samhsa.gov/data/sites/default/files/NSDUHsaeShortTermCHG2014/NSDUHsaeShortTermCHG2014.pdf.
Statistics Canada. (2013). Canadian Community Health Survey – Mental Health (CCHS). Retrieved from http://www23.statcan.gc.ca/imdb/p2SV.pl?Function=getSurvey&SDDS=5015.
Statistics Canada. (2014). Population Projections for Canada (2013 to 2063), Provinces and Territories (2013 to 2038). Retrieved from http://www.statcan.gc.ca/pub/91-520-x/91-520-x2014001-eng.htm.
Statistics Canada. (2015). Prevalence and correlates of marijuana use in Canada, 2012. Retrieved from http://www.statcan.gc.ca/pub/82-003-x/2015004/article/14158-eng.htm.
Statistics Canada. (2016a). Annual retail trade survey, financial estimates by North American Industry Classification System (NAICS) and store type, annual. Retrieved from http://www5.statcan.gc.ca/cansim/a26?lang=eng&id=800020.
Statistics Canada. (2016b). Sales of alcoholic beverages of liquor authorities and other retail outlets, by value, volume, and beverage type, annual. Retrieved from http://www.statcan.gc.ca/daily-quotidien/160510/dq160510b-eng.pdf .
Task Force on Marijuana Legalization and Regulation. (2016). Toward the Legalization, Regulation and Restriction of Access to Marijuana: Discussion Paper. Retrieved from http://healthycanadians.gc.ca/health-system-systeme-sante/consultations/legalization-marijuana-legalisation/alt/legalization-marijuana-legalisation-eng.pdf.
Wallace, A. (2016). Definitive guide to marijuana on the 2016 ballot: Recreational & medical initiatives. The Cannabist. Retrieved from http://www.thecannabist.co/2016/07/14/definitive-guide-us-states-voting-recreational-medical-marijuana-inovember-2016-election/58063/.
Wayback Machine (2016a). Price of Weed [homepage – 1 August 2015]. Retrieved from https://web.archive.org/web/20150801081150/http://www.priceofweed.com/.
Wayback Machine (2016b). Price of Weed [homepage – 10 August 2015]. Retrieved from https://web.archive.org/web/20150810110257/http://www.priceofweed.com/.
Werb, D. et al. (2012). Estimating the economic value of British Columbia’s domestic cannabis market: Implications for provincial cannabis policy. International Journal of Drug Policy, 23(6), 436-441.
Zeisser, C. et al. (2011). A ‘standard joint’? The role of quantity in predicting cannabis-related problems. Addiction Research & Theory, 20(1), 82-92.
Legalized Cannabis: Fiscal Considerations
72
Notes
1. Government of Canada (2016b). Multiple prominent government publications also affirm the government's intention to legalize and regulate cannabis, including: the ministerial mandate letters; the Speech from the Throne; and Budget 2016.
2. Government of Canada (2016a)
3. Task Force on Marijuana Legalization and Regulation (2016). The government objectives listed by PBO are non-exhaustive; the complete list can be found at the source document.
4. Wallace, A. (2016)
5. Statistics Canada (2015). The 12.2% is a point estimate; the 95% confidence interval places the percentage of Canadians 15 or older who have used marijuana in the past year at between 11.5% and 12.8%. The survey frame excludes the approximately 3% of people "living on Indian reserves and in other Aboriginal settlements, full-time members of the Canadian Forces, and the institutionalized population."
6. Kilmer et al. (2013a)
7. Zeisser et al. (2011)
8. Light et al. (2014)
9. Boucher, A., A. Lawrence, and A. Maslov (2013)
10. Caulkins, J. and R. Padman (1993); Anthony, R. and A. Fries (2006); Caulkins, J. and R. Pacula (2006); and Clements, K. and X. Zhao (2009)
11. The consulted Licensed Producers are Aphria Medical Marijuana, Organigram, Tilray, and Tweed Marijuana.
12. Statistics Canada (2016a). In 2013, beer, wine, and liquor stores reported an average gross margin of 43.6 per cent. In that same year, health and personal care stores reported an average gross margin of 37.3 per cent. 40 per cent falls roughly between the reported margins in these two types of retailers.
13. Caulkins (2010) analyzes in detail the factors driving the post-legalization cost of production for cannabis.
14. Robinson, P. (2015)
15. Task Force on Marijuana Legalization and Regulation (2016)
16. Caulkins, J. et al. (2015) includes an extensive discussion of the market incentives associated with various models of cannabis taxation.
17. Canada Revenue Agency (2016a)
18. Hedges v. Canada (2016)
Legalized Cannabis: Fiscal Considerations
73
19. PBO Calculations, based on Colorado Department of Revenue (2015)
20. Kilmer et al. (2010a); Kilmer et al. (2010b); Caulkins et al. (2015). While the literature is consistent on a negative price elasticity for cannabis consumption, a wide range of values exist in the literature. In their review of the literature, Pacula, R. and R. Lundberg (2014) find values ranging from -0.24 (30 day participation elasticity) in Williams et al. (2004) to -1.01 to -1.51 (full demand elasticity) in Nisbet & Vakil (1972).
21. PBO's middle projection range is somewhat lower than the Marijuana Task Force's oft-cited estimate of $7 billion in annual income that is generated from the illegal trade of marijuana. There are a couple of plausible explanations for the discrepancy.
First, the Task Force's definition around its figure seems to encompass export income; by contrast, PBO's projection only includes resident cannabis consumption. Thus, the Task Force's measure of the market is broader than PBO's and should therefore be higher.
Further, while the Task Force's estimate is outside of PBO's middle projection, it is consistent with PBO's high projection. Differences around assumptions may have contributed to the difference in projections.
Nevertheless, given the paucity of data available to make such estimates, it is encouraging that both estimates are of the same order of magnitude.
22. Statistics Canada (2016b)
23. Health Canada (2014). The 2012-2013 Youth Smoking Survey reports past-year cannabis use among grade 7, 8, and 9 students (who correspond approximately to 12, 13, and 14 year-olds) to have been 3.2%, 7.1%, and 15.4%. These levels are lower than than past-year use among grade 10, 11, and 12 students (23.0%, 31.2%, and 35.6%).
24. Ibid
25. Government of the Northwest Territories (2006); Government of Yukon (2006). In 2004-05 Health Canada facilitated the "Canadian Addiction Survey," for which specific results for the Yukon and the Northwest Territories were published separately. Whereas 14.1% of all Canadians aged 15 and older reported using cannabis within the one year preceding the survey, 21.0% of respondents in the Yukon and 20.7% of respondents in the Northwest Territories reported the same.
26. Statistics Canada (2015)
27. First Nations Centre (2005). The 2002/03 Regional Longitudinal Health Survey (RHS) found that 26.7% of Aboriginal respondents had used cannabis over the past year, comparied with 14.1% of the general population.
28. Kilmer, B. et al. (2013b)
29. Ibid
30. Ibid
31. Kilmer, B. et al. (2013b) and Statistics Canada (2013). The 2011 NSDUH obtained information from 89 per cent of eligible dwelling units, and 80 per cent of persons within those households completed the survey. In the 2012
Legalized Cannabis: Fiscal Considerations
74
CCHS-MH, 79.8 per cent of households agreed to participate in the survey, and 86.3 per cent of persons completed the survey.
32. The choice to use data from Colorado to estimate cannabis consumption per use day was made due to a lack of such data from Canada. It is possible that cannabis use amounts may be systematically different – higher or lower – in Colorado compared with Canada due to differences in cannabis culture.
33. Price of Weed (2016)
34. Dr. Giommoni reported some problems collecting data between the end of July 2015 and the beginning of November 2015, resulting in fewer entries during that period. Nevertheless, the sample's reduced size does not appear to have significantly affected its randomness; a month-by-month time series analysis of the data does not demonstrate any notable difference in cannabis prices between July 2015 and November 2015, relative to the months immediately before and after the period, with the exception of cannabis prices in August 2015.
35. PBO tried, without success, to contact Price of Weed for more information on their data and methodology.
36. Wayback Machine (2016b)
37. Wayback Machine (2016a)
38. Caulkins, J. and P. Reuter (1998)
39. Clements, K. and X. Zhao (2009)
40. Bouchard (2007) found that Quebec, which currently has cannabis prices below the national average, likely had a substantial cannabis market in 2002-03. The author estimated total provincial consumption (around 100 metric tons) was significantly lower than estimated production (about 300 metric tons). After accounting for police seizures (31 metric tons), about 169 metric tons of cannabis were estimated to have been available for export in 2002-03.
41. Caulkins, J. and R. Pacula (2006)
42. Bank of Canada (2013). In 2013, one US dollar bought, on average, 1.02991480 Canadian dollars.
43. Kilmer et al. (2010a); Kilmer et al. (2010b); Caulkins et al. (2015)