Embed Size (px)
Citation preview


Page i
POWER FORECAST 2012 - OCTOBER 2012
Legal Notice/Disclaimer
This report was prepared by Kadrmas, Lee & Jackson, Inc., pursuant to a contract with the North Dakota
Transmission Authority. Neither Kadrmas, Lee & Jackson Inc., nor any of its subcontractors, nor the North
Dakota Transmission Authority or any person acting on its behalf:
A. Makes any warranty or representation, expressed or implied, with respect to the accuracy,
completeness or usefulness of the information contained in this report, or that the use of any
information, apparatus, method or process disclosed in this report may not infringe privately-owned
rights; or
B. Assumes any liabilities with respect to the use of, or for damages resulting from the use of, any
information, apparatus, method or process disclosed in this report.
Reference herein to any specific commercial product, process or service by trade name, trademark,
manufacturer, or otherwise, does not necessarily constitute or imply its endorsement, recommendation or
favoring by the North Dakota Transmission Authority. The views and opinions of authors expressed herein do
not necessarily state or reflect those of the North Dakota Transmission Authority.

Page ii
POWER FORECAST 2012 - OCTOBER 2012
This page intentionally left blank
Page iii
POWER FORECAST 2012 - OCTOBER 2012
Contents
Acknowledgements ................................................................................................................................... vii
1. Executive Summary .......................................................................................................................... 1
2. Background ........................................................................................................................................ 7
2.1 Williston Basin and Bakken Formation ..................................................................................................... 7
2.2 Study Area ............................................................................................................................................... 11
2.3 Research Methodology ............................................................................................................................ 12
2.4 Base Assumptions .................................................................................................................................... 12
2.5 Stakeholder Input Process ........................................................................................................................ 16
3. Electrical Power Forecast ............................................................................................................... 17
3.1 Current Demand ....................................................................................................................................... 18
3.2 2017 Brings Rapid Rises .......................................................................................................................... 18
3.3 Energy Usage Continues to Increase in 2022 .......................................................................................... 19
3.4 2027 Experiences Increased Usage Across the Board ............................................................................. 19
3.5 Peak Demand Expected in 2032 .............................................................................................................. 19
3.6 Modeling the Load Growth Forecasts ...................................................................................................... 27
4. Oil and Gas Development Details and Outlook ............................................................................ 33
4.1 Oilfield Infrastructure Power Requirements ............................................................................................ 33
4.2 Well Site Power Load Assumptions ........................................................................................................ 38
4.3 Drilling Activity Forecasts ....................................................................................................................... 38
4.4 Existing and Undrilled Well Production Forecast ................................................................................... 39
4.5 Oil Development by Region .................................................................................................................... 41
4.6 Drilling Rig Efficiency ............................................................................................................................ 45
4.7 Water Injection Forecasts ........................................................................................................................ 46
4.8 Well Lifecycle and Reservoir Analysis ................................................................................................... 47
4.9 Oil Price Forecasts ................................................................................................................................... 50
4.10 Oil Price Forecasts and Impacts to Electric Load .................................................................................. 53
5. Pipelines, Refining and Gas Processing ......................................................................................... 55
5.1 Crude Oil Pipelines .................................................................................................................................. 55
5.2 Proposed Crude Oil Pipelines .................................................................................................................. 57
5.3 Natural Gas Pipelines............................................................................................................................... 59
5.4 Proposed Natural Gas and Natural Gas Liquid Pipelines ........................................................................ 60
5.5 Proposed Natural Gas Processing Facilities ............................................................................................ 60
5.6 Potential Pipeline Electrical Load Growth .............................................................................................. 62
5.7 Williston Basin Oil Refining ................................................................................................................... 62
5.8 Proposed Williston Basin Oil Refining .................................................................................................... 63
Page iv
POWER FORECAST 2012 - OCTOBER 2012
5.9 Potential Electrical Load Growth............................................................................................................. 65
5.10 Natural Gas ............................................................................................................................................ 65
6. Population Estimate Modeling ....................................................................................................... 70
6.1 Temporary Workforce and Permanent Workforce .................................................................................. 70
7. Housing Demand Modeling ............................................................................................................ 72
8. Permanent and Service Population ............................................................................................... 75
8.1 Permanent Population .............................................................................................................................. 75
8.2 Total Service Population .......................................................................................................................... 75
8.3 Population Estimate Assumptions ........................................................................................................... 78
9. Legislative Factors .......................................................................................................................... 79
10. Glossary ............................................................................................................................................ 81
List of Appendices
Appendix A Oil, Gas and Water Production per Region Exhibits
Appendix B Employment Projections
Appendix C Reference Summaries
Appendix D References
Appendix E Public Policy and Legislation Summaries
Page v
POWER FORECAST 2012 - OCTOBER 2012
Figures
Figure 1: Williston Basin Study Regions .............................................................................................................. 2
Figure 2: Williston Basin Electrical Demand – All Regions ................................................................................ 3
Figure 3: Electric Load Growth Forecast 2032 Total Load Demand .................................................................... 5
Figure 4: Williston Basin & Bakken Formation ................................................................................................... 8
Figure 5: Horizontal Hydraulic Fracing .............................................................................................................. 10
Figure 6: Williston Basin - Three Study Regions ............................................................................................... 11
Figure 7: Electrical Demand - Region 1 ............................................................................................................. 20
Figure 8: Electrical Demand - Region 2 ............................................................................................................. 21
Figure 9: Electrical Demand - Region 3 ............................................................................................................. 21
Figure 10: Electrical Demand - All Regions ....................................................................................................... 22
Figure 11: Relative Energy Distribution in 2012 ................................................................................................ 27
Figure 12: Relative Per-County Energy Use in 2032 Associated with Population ............................................. 28
Figure 13: Relative Energy Use in 2032 Associated with Oilfield Infrastructure .............................................. 31
Figure 14: Spatial Load Growth Modeling ......................................................................................................... 31
Figure 15: Electric Load Forecast 2032 - Relative Demand ............................................................................... 32
Figure 16: Williston Basin Rig Counts - High, Consensus and Low Scenarios ................................................. 39
Figure 17: Oil Production Rates for Williston Basin .......................................................................................... 40
Figure 18: Natural Gas Production Rates for Williston Basin ............................................................................ 40
Figure 19: Water Production Rates for Williston Basin ..................................................................................... 41
Figure 20: Study Region 1 .................................................................................................................................. 42
Figure 21: Study Region 2 .................................................................................................................................. 43
Figure 22: Study Region 3 .................................................................................................................................. 44
Figure 23: Drilling Rig Efficiencies in North Dakota, 1998-2011 ..................................................................... 46
Figure 24: Total Water Injection Rates in the Williston Basin ........................................................................... 47
Figure 25: Williston Basin Oil Well Production Profiles ................................................................................... 49
Figure 26: Price Comparison of Brent and WTI in USD per Bbl ....................................................................... 50
Figure 27: Existing and Proposed Crude Oil Pipelines ....................................................................................... 57
Figure 28: Existing and Proposed Natural Gas and NGL Pipelines and Processing Facilities ........................... 61
Figure 29: U.S. Refinery Capacity ...................................................................................................................... 62
Figure 30: Existing and Proposed Refinery Locations ....................................................................................... 64
Figure 31: Average Annual Natural Gas Prices per MMBtu .............................................................................. 68
Figure 32: Housing Units Demand - Consensus Scenario - Study Region 1 ...................................................... 73
Figure 33: Housing Unit Demand - Consensus Scenario - Study Region 2 ....................................................... 74
Figure 34: Housing Unit Demand - Consensus Scenario - Study Region 3 ....................................................... 74
Figure 35: Population Potential - Consensus Scenario - Study Region 1 ........................................................... 76
Figure 36: Population Potential - Consensus Scenario - Study Region 2 ........................................................... 77
Figure 37: Population Potential - Consensus Scenario - Study Region 3 ........................................................... 77
Page vi
POWER FORECAST 2012 - OCTOBER 2012
Tables
Table 1: Williston Basin Cumulative Total New Wells........................................................................................ 1
Table 2: Counties by Region Experiencing Highest Electrical Demand Increase ................................................ 4
Table 3: Forecasted Electrical Loads - All Regions............................................................................................ 22
Table 4: Consensus Scenario - MW Electrical Demand by County for Region 1 .............................................. 23
Table 5: Consensus Scenario - MW Electrical Demand by County for Region 2 .............................................. 24
Table 6: Consensus Scenario - MW Electrical Demand by County for Region 3 .............................................. 24
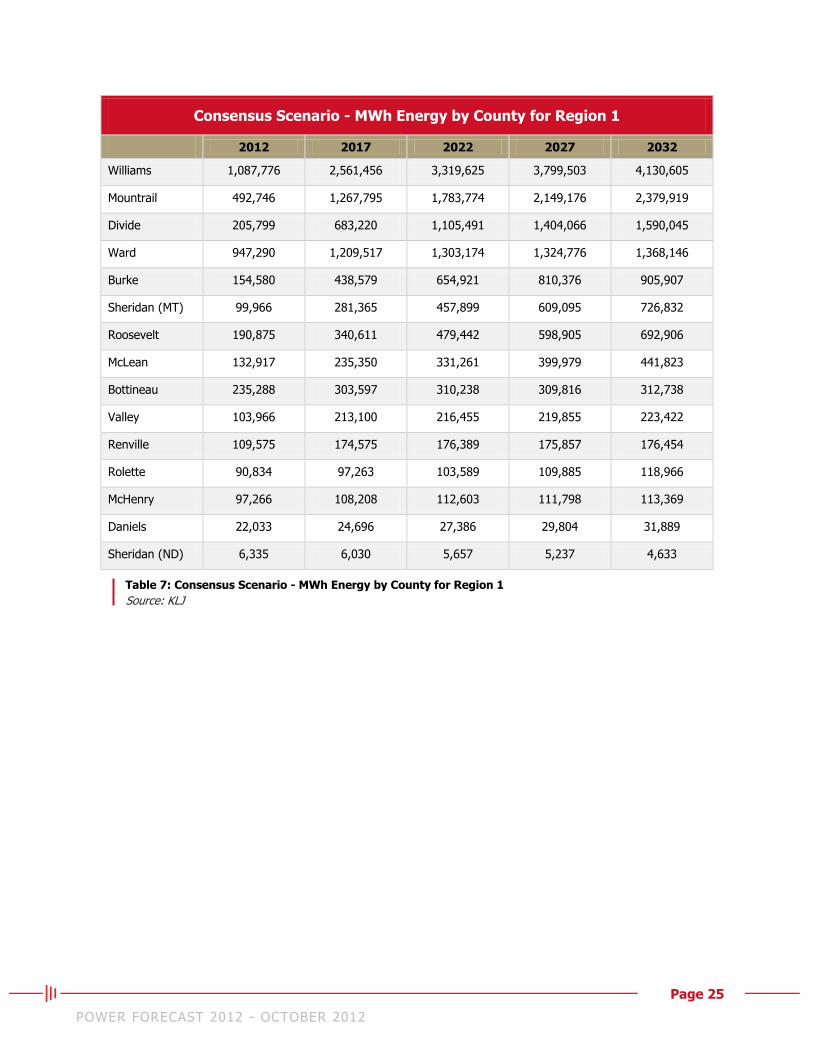
Table 7: Consensus Scenario - MWh Energy by County for Region 1 .............................................................. 25
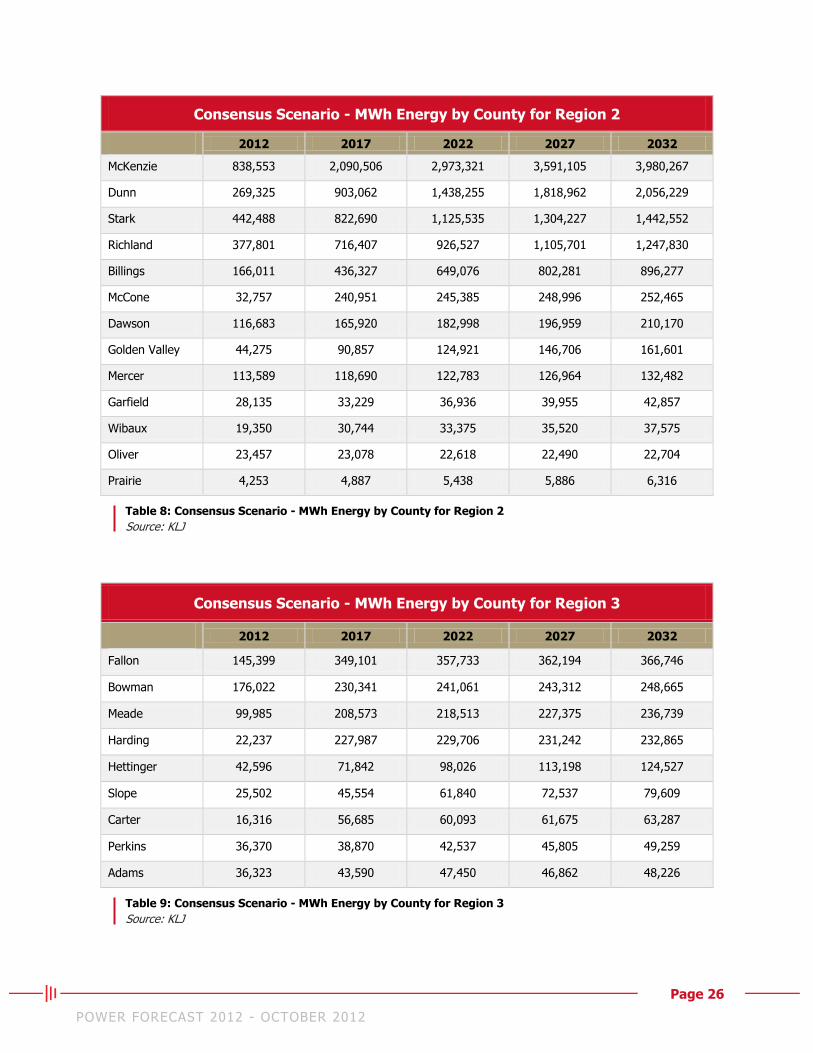
Table 8: Consensus Scenario - MWh Energy by County for Region 2 .............................................................. 26
Table 9: Consensus Scenario - MWh Energy by County for Region 3 .............................................................. 26
Table 10: Generic Assumptions of Significant Infrastructure Energy Use ......................................................... 37
Table 11: Oil Price Forecasts (2015-2035) in 2012 Dollars (Brent USD) .......................................................... 51
Table 12: Projected Williston Basin Study Area Crude Oil Pipeline Export Capacity (End 2012) ................... 56
Table 13: Williston Basin Proposed Pipeline Projects ........................................................................................ 58
Table 14: Williston Basin Proposed Natural Gas and NGL Pipeline Projects .................................................... 60
Table 15: Proposed Gas Processing Facilities and Capacities ............................................................................ 61
Table 16: Williston Basin Refinery Capacity ..................................................................................................... 64
Table 17: Additional and Proposed Refineries ................................................................................................... 65
Table 18: 20-Year Natural Gas Price Forecasts in 2012 USD per MMBtu ........................................................ 67
Table 19: Natural Gas Key Characteristics ......................................................................................................... 69
Page vii
POWER FORECAST 2012 - OCTOBER 2012
Acknowledgements
The project team consisting of KLJ, University of North Dakota-Department of Petroleum Engineering and
North Dakota State University-Department of Agribusiness and Applied Economics developed the Williston
Basin Oil and Gas Related Electrical Load Growth Forecast with valuable information from public and private
industry experts. The project team thanks the following report contributors:
North Dakota Industrial Commission
North Dakota Department of Mineral Resources
consisting of the North Dakota Oil and Gas Division
and the North Dakota Geological Survey
North Dakota Transmission Authority
North Dakota Petroleum Council
North Dakota Housing Finance Agency
North Dakota Pipeline Authority
Montana Board of Oil and Gas
Upper Great Plains Transportation Institute
Basin Electric Power Cooperative
Montana Dakota Utilities Co.
McKenzie Electric Cooperative, Inc.
Roughrider Electric Cooperative, Inc.
Alliance Oil Company Ltd.
Aux Sable
Denbury Resources, Inc.
Enbridge Inc.
EOG Resources, Inc.
Fidelity Exploration & Production Company
Hess Corporation
Kodiak Oil and Gas Corporation
Marathon Oil Corporation
ONEOK, Inc.
Petro-Hunt LLC
QEP Resources, Inc.
Samson
Sanjel Corporation
Slawson Exploration Company, Inc.
Statoil
Whiting Petroleum Corporation
XTO Energy Inc.

Page viii POWER FORECAST 2012 - OCTOBER 2012
This page intentionally left blank
Page 1 POWER FORECAST 2012 - OCTOBER 2012
1. Executive Summary
The North Dakota Transmission Authority (NDTA) commissioned KLJ, an employee-owned, engineering,
surveying and planning firm, to complete the Williston Basin Oil and Gas Related Electrical Load Growth
Forecast (PF 12) and project future electrical load growth in the Williston Basin area.
The results of this extensive study and report will be used by NDTA, Basin Electric Power Cooperative (Basin
Electric) and Montana-Dakota Utilities Co. (MDU) (the Partners) to effectively plan for critical infrastructure
needs and development in North Dakota, South Dakota and Montana. The study and report includes analysis of
petroleum-sector commercial and industrial development, employment, population growth and secondary
employment.
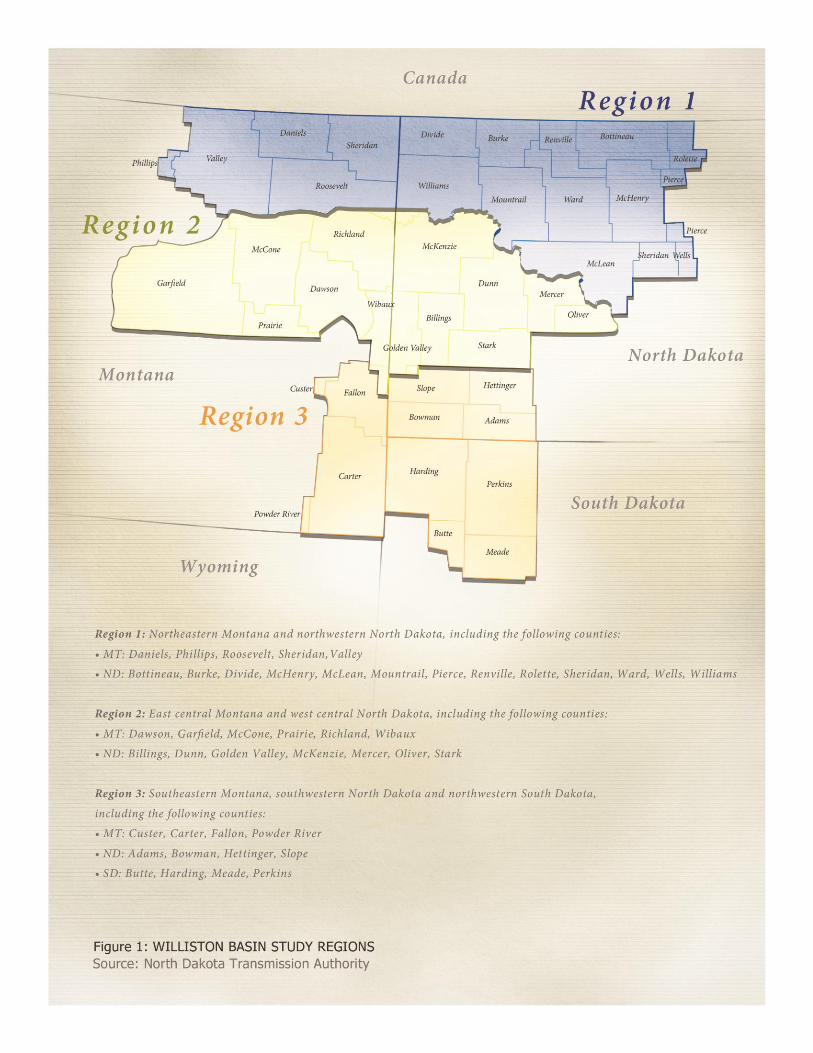
Findings contained in this study and report forecast expected electrical load growth for the next 20 years, from
2012 to 2032, in the study area which spans regions across North Dakota, South Dakota and Montana. These
regions and the 43 counties they represent are shown in Figure 1. Numbers and figures in the Executive
Summary were calculated from a demand amount averaged between historically observed energy use values
and maximum oilfield electrical load requirements, and represent the study’s most likely (consensus) scenario.
Energy use for prior years was provided by the Partners and used to establish a 2011 baseline.
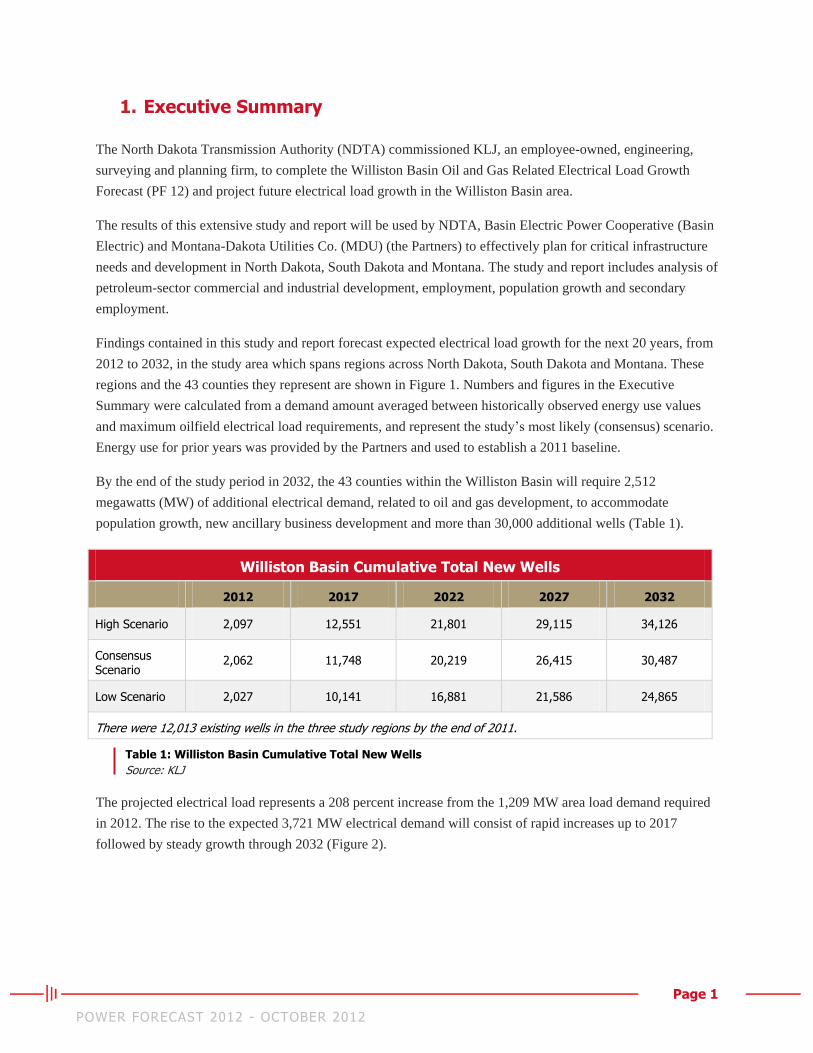
By the end of the study period in 2032, the 43 counties within the Williston Basin will require 2,512
megawatts (MW) of additional electrical demand, related to oil and gas development, to accommodate
population growth, new ancillary business development and more than 30,000 additional wells (Table 1).
Williston Basin Cumulative Total New Wells
2012 2017 2022 2027 2032
High Scenario 2,097 12,551 21,801 29,115 34,126
Consensus Scenario
2,062 11,748 20,219 26,415 30,487
Low Scenario 2,027 10,141 16,881 21,586 24,865
There were 12,013 existing wells in the three study regions by the end of 2011.
Table 1: Williston Basin Cumulative Total New Wells
Source: KLJ
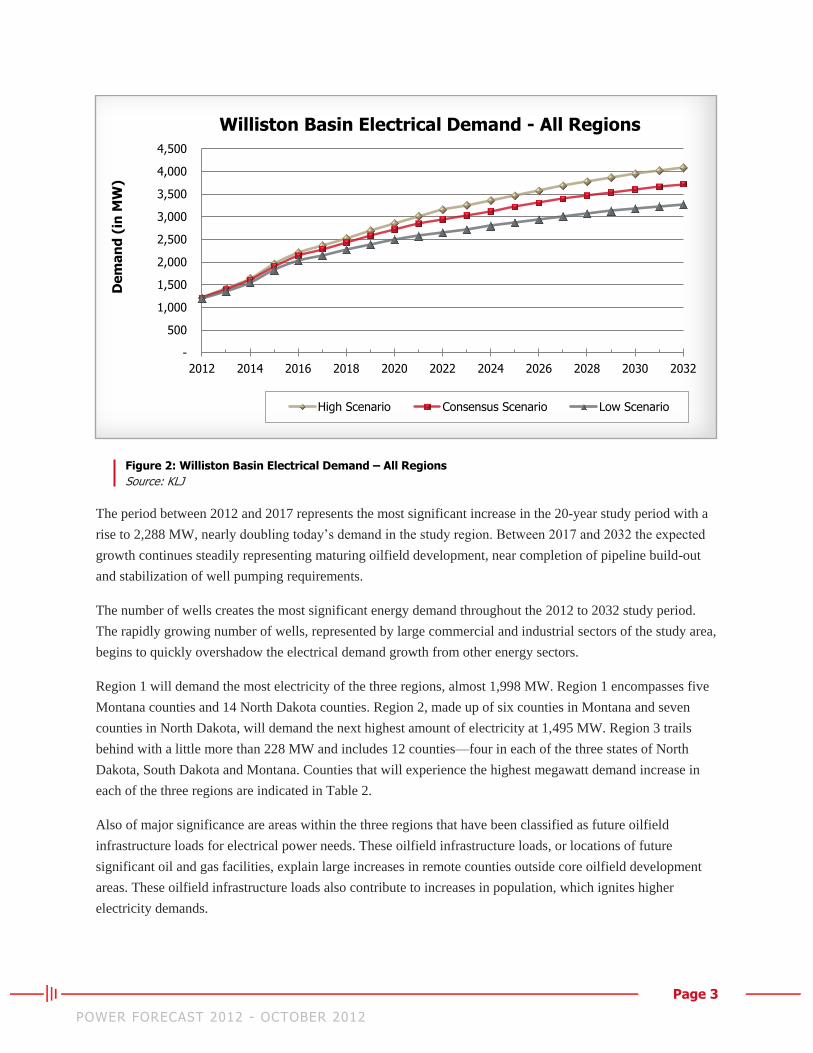
The projected electrical load represents a 208 percent increase from the 1,209 MW area load demand required
in 2012. The rise to the expected 3,721 MW electrical demand will consist of rapid increases up to 2017
followed by steady growth through 2032 (Figure 2).
Page 2 POWER FORECAST 2012 - OCTOBER 2012
Page 3 POWER FORECAST 2012 - OCTOBER 2012
Figure 2: Williston Basin Electrical Demand – All Regions
Source: KLJ
The period between 2012 and 2017 represents the most significant increase in the 20-year study period with a
rise to 2,288 MW, nearly doubling today’s demand in the study region. Between 2017 and 2032 the expected
growth continues steadily representing maturing oilfield development, near completion of pipeline build-out
and stabilization of well pumping requirements.
The number of wells creates the most significant energy demand throughout the 2012 to 2032 study period.
The rapidly growing number of wells, represented by large commercial and industrial sectors of the study area,
begins to quickly overshadow the electrical demand growth from other energy sectors.
Region 1 will demand the most electricity of the three regions, almost 1,998 MW. Region 1 encompasses five
Montana counties and 14 North Dakota counties. Region 2, made up of six counties in Montana and seven
counties in North Dakota, will demand the next highest amount of electricity at 1,495 MW. Region 3 trails
behind with a little more than 228 MW and includes 12 counties—four in each of the three states of North
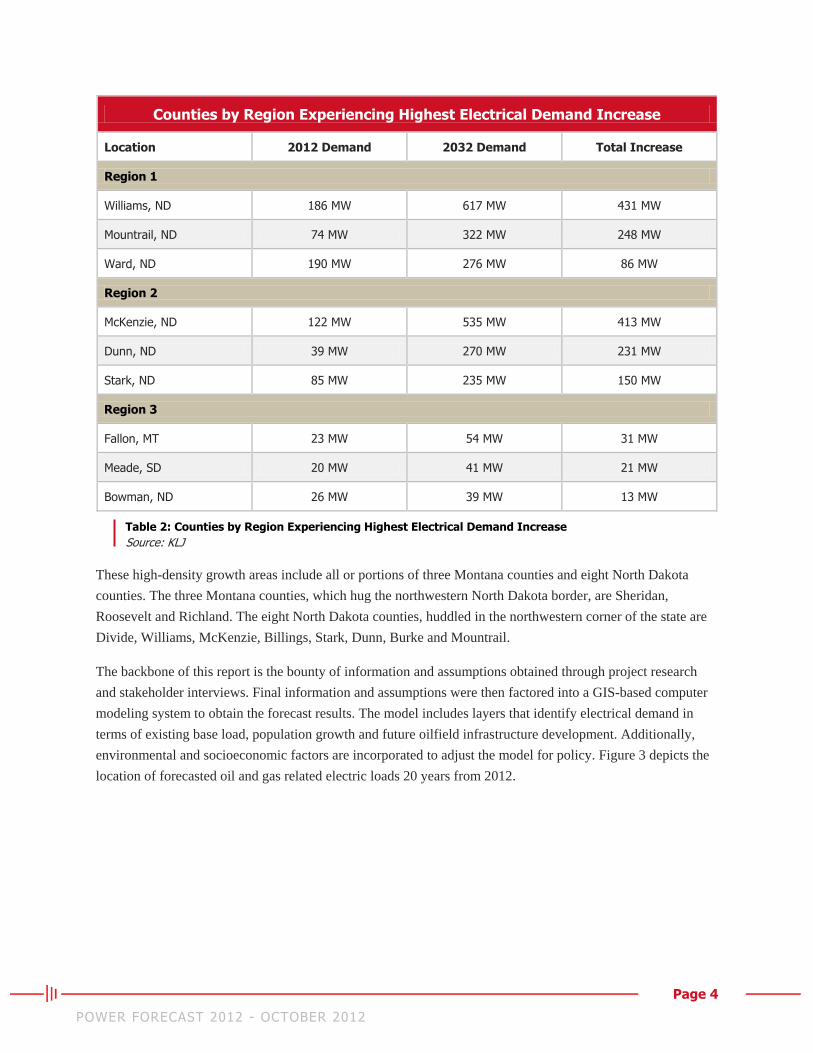
Dakota, South Dakota and Montana. Counties that will experience the highest megawatt demand increase in
each of the three regions are indicated in Table 2.
Also of major significance are areas within the three regions that have been classified as future oilfield
infrastructure loads for electrical power needs. These oilfield infrastructure loads, or locations of future
significant oil and gas facilities, explain large increases in remote counties outside core oilfield development
areas. These oilfield infrastructure loads also contribute to increases in population, which ignites higher
electricity demands.
-
500
1,000
1,500
2,000
2,500
3,000
3,500
4,000
4,500
2012 2014 2016 2018 2020 2022 2024 2026 2028 2030 2032
De
ma
nd
(in
MW
) Williston Basin Electrical Demand - All Regions
High Scenario Consensus Scenario Low Scenario
Page 4 POWER FORECAST 2012 - OCTOBER 2012
Counties by Region Experiencing Highest Electrical Demand Increase
Location 2012 Demand 2032 Demand Total Increase
Region 1
Williams, ND 186 MW 617 MW 431 MW
Mountrail, ND 74 MW 322 MW 248 MW
Ward, ND 190 MW 276 MW 86 MW
Region 2
McKenzie, ND 122 MW 535 MW 413 MW
Dunn, ND 39 MW 270 MW 231 MW
Stark, ND 85 MW 235 MW 150 MW
Region 3
Fallon, MT 23 MW 54 MW 31 MW
Meade, SD 20 MW 41 MW 21 MW
Bowman, ND 26 MW 39 MW 13 MW
Table 2: Counties by Region Experiencing Highest Electrical Demand Increase
Source: KLJ
These high-density growth areas include all or portions of three Montana counties and eight North Dakota
counties. The three Montana counties, which hug the northwestern North Dakota border, are Sheridan,
Roosevelt and Richland. The eight North Dakota counties, huddled in the northwestern corner of the state are
Divide, Williams, McKenzie, Billings, Stark, Dunn, Burke and Mountrail.
The backbone of this report is the bounty of information and assumptions obtained through project research
and stakeholder interviews. Final information and assumptions were then factored into a GIS-based computer
modeling system to obtain the forecast results. The model includes layers that identify electrical demand in
terms of existing base load, population growth and future oilfield infrastructure development. Additionally,
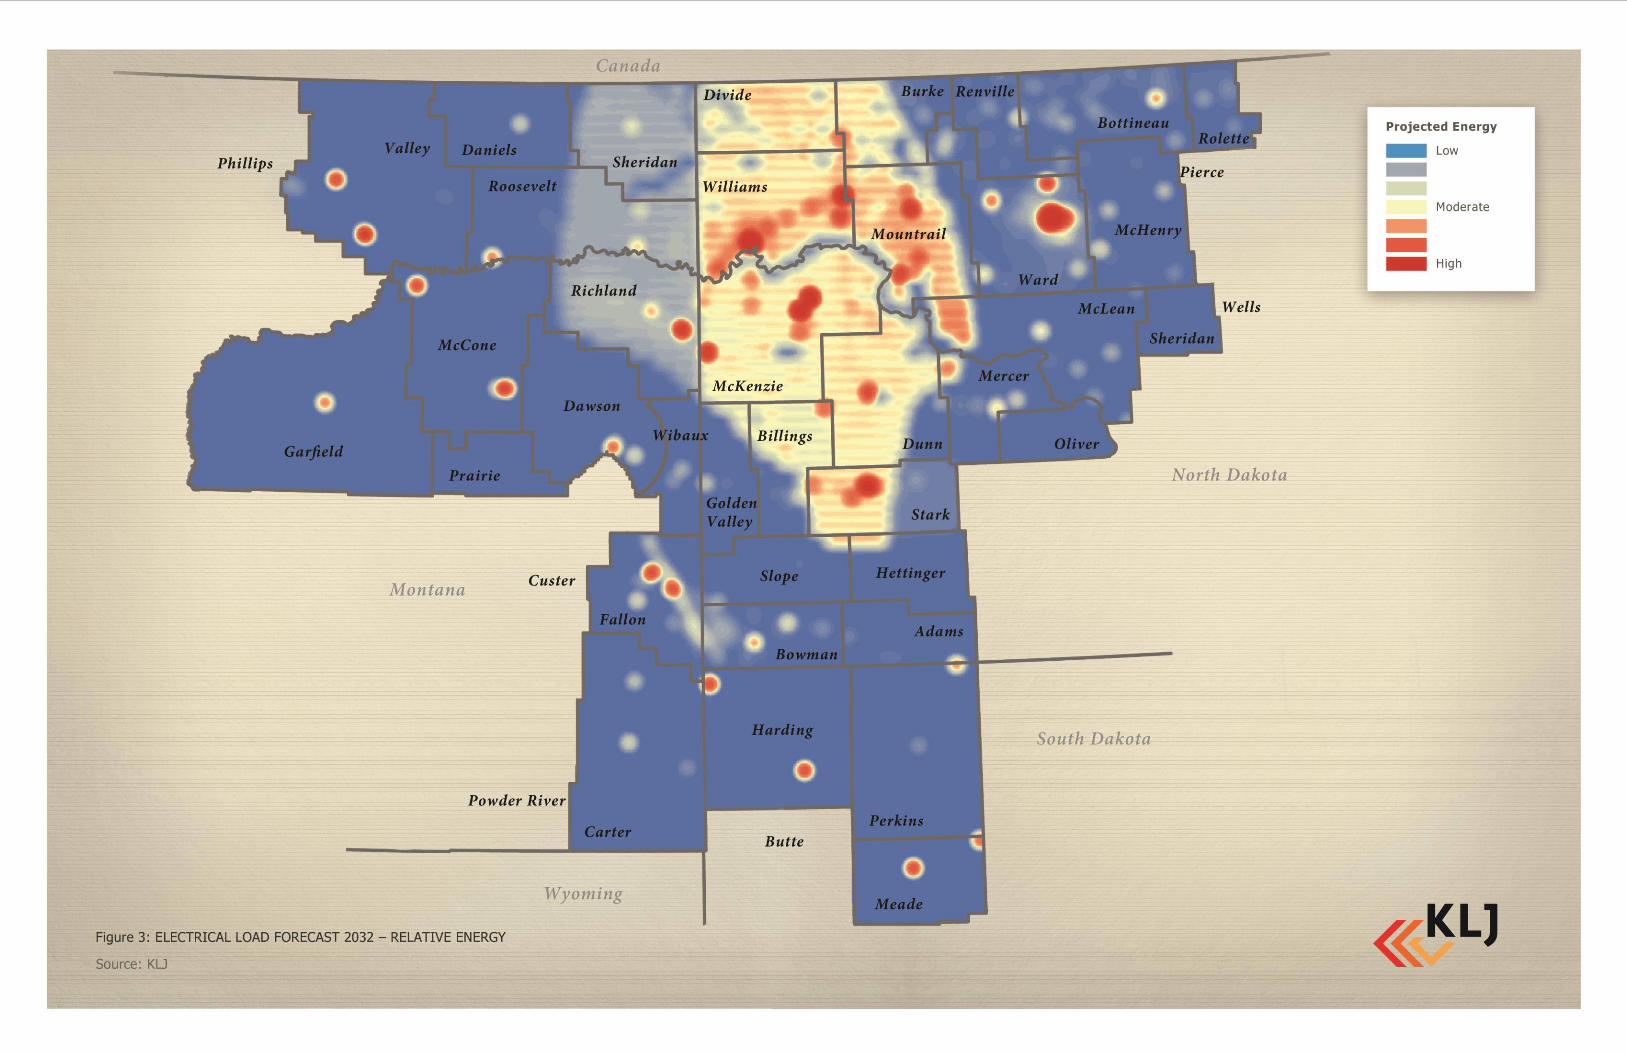
environmental and socioeconomic factors are incorporated to adjust the model for policy. Figure 3 depicts the
location of forecasted oil and gas related electric loads 20 years from 2012.
Page 5 POWER FORECAST 2012 - OCTOBER 2012
Figure 3: Electric Load Growth Forecast 2032 Total Load Demand
Source: KLJ

Page 6
POWER FORECAST 2012 - OCTOBER 2012
This page intentionally left blank
Page 7 POWER FORECAST 2012 - OCTOBER 2012
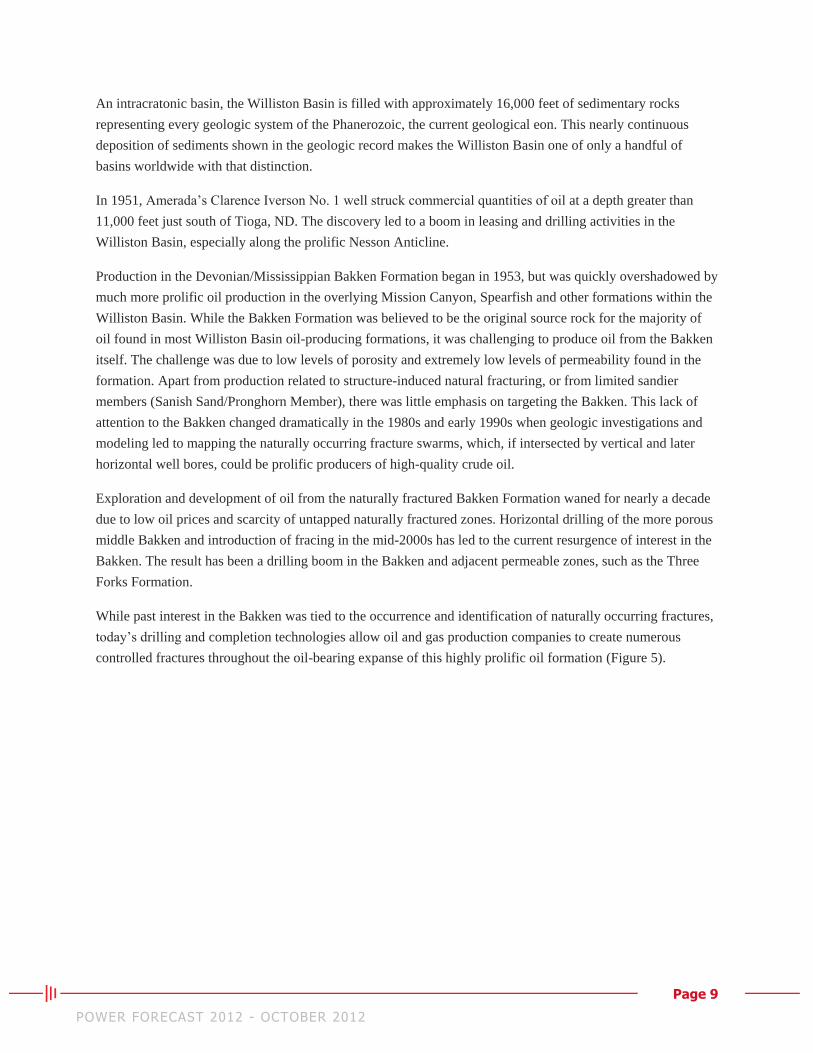
2. Background
In light of recent and anticipated oil and gas development impacts on electrical demand and transmission
capacity, the Partners request projections of future electrical loads for the three regions identified in Figure 1.
The forecast identifies the magnitude and timing of electrical loads per region and county-level, per year, over
20 years. This study, which will be used by the Partners, considers new electrical load expected from oil and
gas activity in the Williston Basin, along with the ancillary services that accompany such development.
2.1 Williston Basin and Bakken Formation
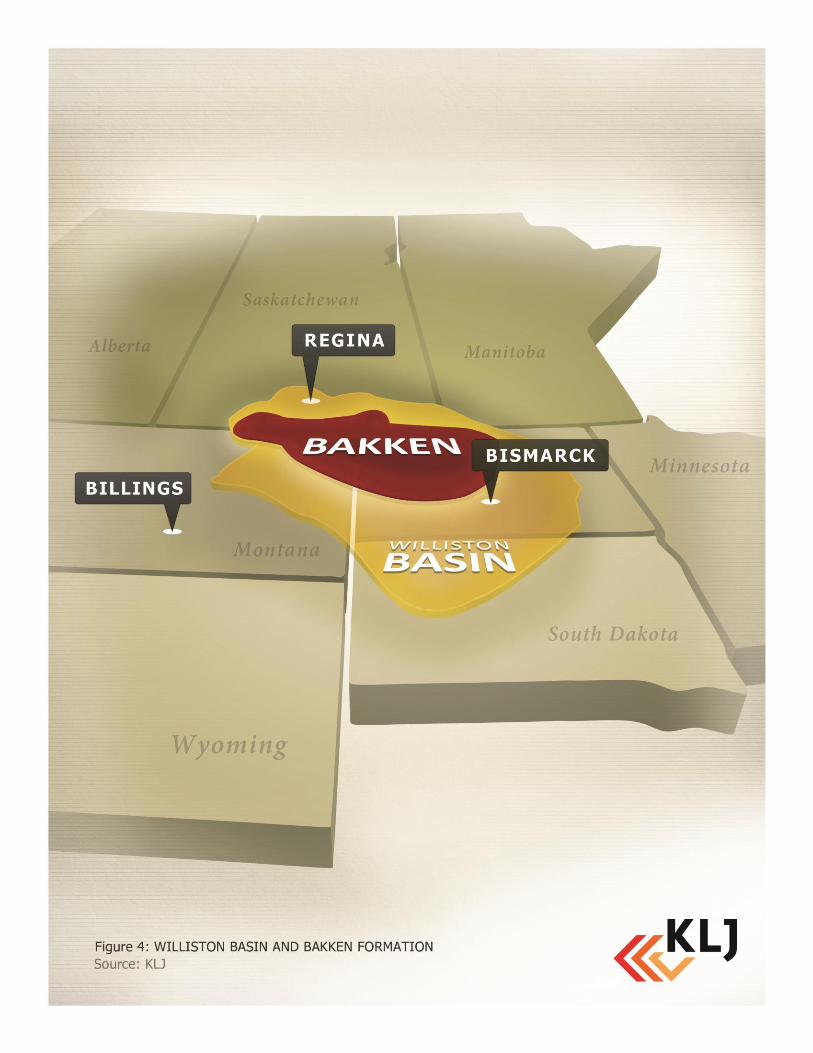
The Williston Basin is an oval-shaped, subsurface sedimentary basin with the deepest point near Watford City,
ND. This major structural feature of central North America spans approximately 200,000 square miles. The
basin reaches approximately 475 miles north and south from southern Saskatchewan, Canada to northern
South Dakota. The basin also extends 300 miles east and west from the eastern third of North Dakota into
western North Dakota and eastern Montana (Figure 4).
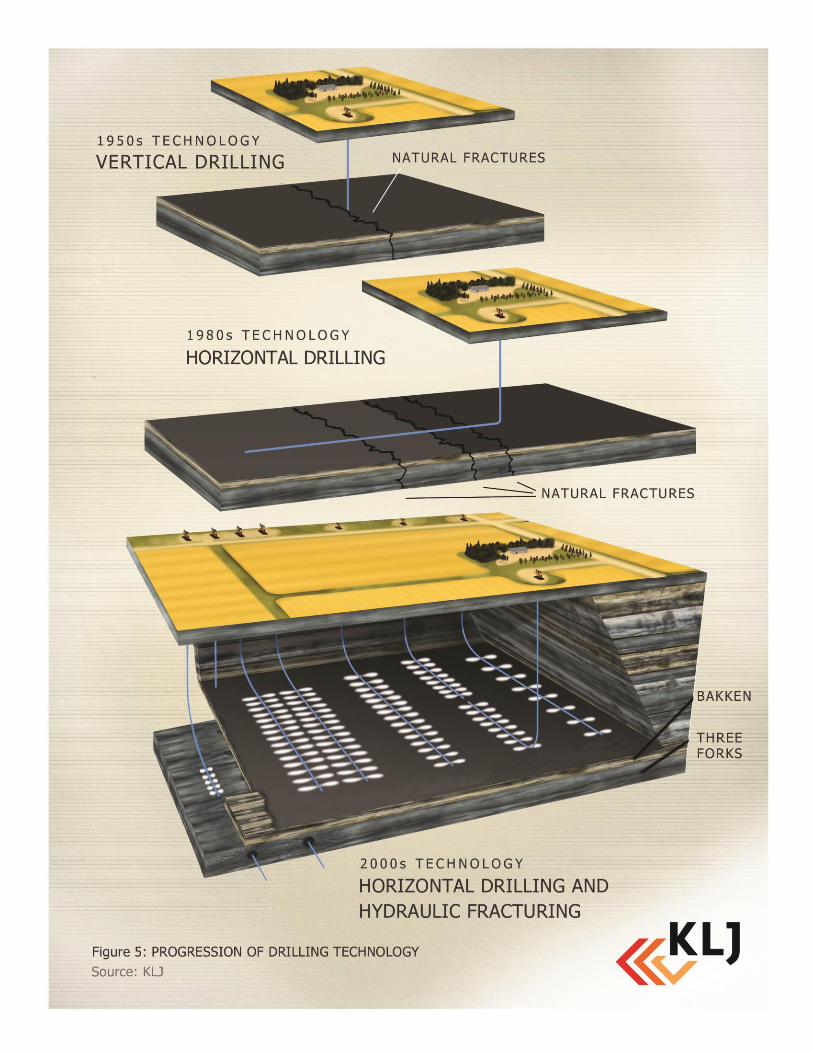
The Bakken, a large subsurface formation within the Williston Basin, is known for its rich petroleum deposits.
The oil-producing formation, initially discovered in 1953, has been experiencing a steady and substantial
increase in oil production since 2004, when the application of horizontal drilling technologies and hydraulic
fracturing (fracing) facilitated oil extraction from previously unviable deposits.
The Bakken Formation is considered the main reservoir and source of a large portion of the oil generated and
produced in the Williston Basin. Formed during the late Devonian, a period and system of the Paleozoic Era,
Bakken shale is naturally fractured and considered both a petroleum source rock and reservoir.
The Bakken Formation consists of three members: 1) the upper Bakken, 2) the middle Bakken and 3) the lower
Bakken. A fourth Bakken Formation member, the Pronghorn Member underlying the lower Bakken has also
been proposed. The upper and lower members are organic rich black shales with greater than 1 percent
carbonaceous material. The middle member is a dolomitic shaley siltstone. Located just above the Bakken
Formation is the Lodgepole Formation, and lying completely below the Bakken Formation is the Three Forks
Formation.
Page 8 POWER FORECAST 2012 - OCTOBER 2012
Page 9 POWER FORECAST 2012 - OCTOBER 2012
An intracratonic basin, the Williston Basin is filled with approximately 16,000 feet of sedimentary rocks
representing every geologic system of the Phanerozoic, the current geological eon. This nearly continuous
deposition of sediments shown in the geologic record makes the Williston Basin one of only a handful of
basins worldwide with that distinction.
In 1951, Amerada’s Clarence Iverson No. 1 well struck commercial quantities of oil at a depth greater than
11,000 feet just south of Tioga, ND. The discovery led to a boom in leasing and drilling activities in the
Williston Basin, especially along the prolific Nesson Anticline.
Production in the Devonian/Mississippian Bakken Formation began in 1953, but was quickly overshadowed by
much more prolific oil production in the overlying Mission Canyon, Spearfish and other formations within the
Williston Basin. While the Bakken Formation was believed to be the original source rock for the majority of
oil found in most Williston Basin oil-producing formations, it was challenging to produce oil from the Bakken
itself. The challenge was due to low levels of porosity and extremely low levels of permeability found in the
formation. Apart from production related to structure-induced natural fracturing, or from limited sandier
members (Sanish Sand/Pronghorn Member), there was little emphasis on targeting the Bakken. This lack of
attention to the Bakken changed dramatically in the 1980s and early 1990s when geologic investigations and
modeling led to mapping the naturally occurring fracture swarms, which, if intersected by vertical and later
horizontal well bores, could be prolific producers of high-quality crude oil.
Exploration and development of oil from the naturally fractured Bakken Formation waned for nearly a decade
due to low oil prices and scarcity of untapped naturally fractured zones. Horizontal drilling of the more porous
middle Bakken and introduction of fracing in the mid-2000s has led to the current resurgence of interest in the
Bakken. The result has been a drilling boom in the Bakken and adjacent permeable zones, such as the Three
Forks Formation.
While past interest in the Bakken was tied to the occurrence and identification of naturally occurring fractures,
today’s drilling and completion technologies allow oil and gas production companies to create numerous
controlled fractures throughout the oil-bearing expanse of this highly prolific oil formation (Figure 5).
Page 10 POWER FORECAST 2012 - OCTOBER 2012
Page 11 POWER FORECAST 2012 - OCTOBER 2012
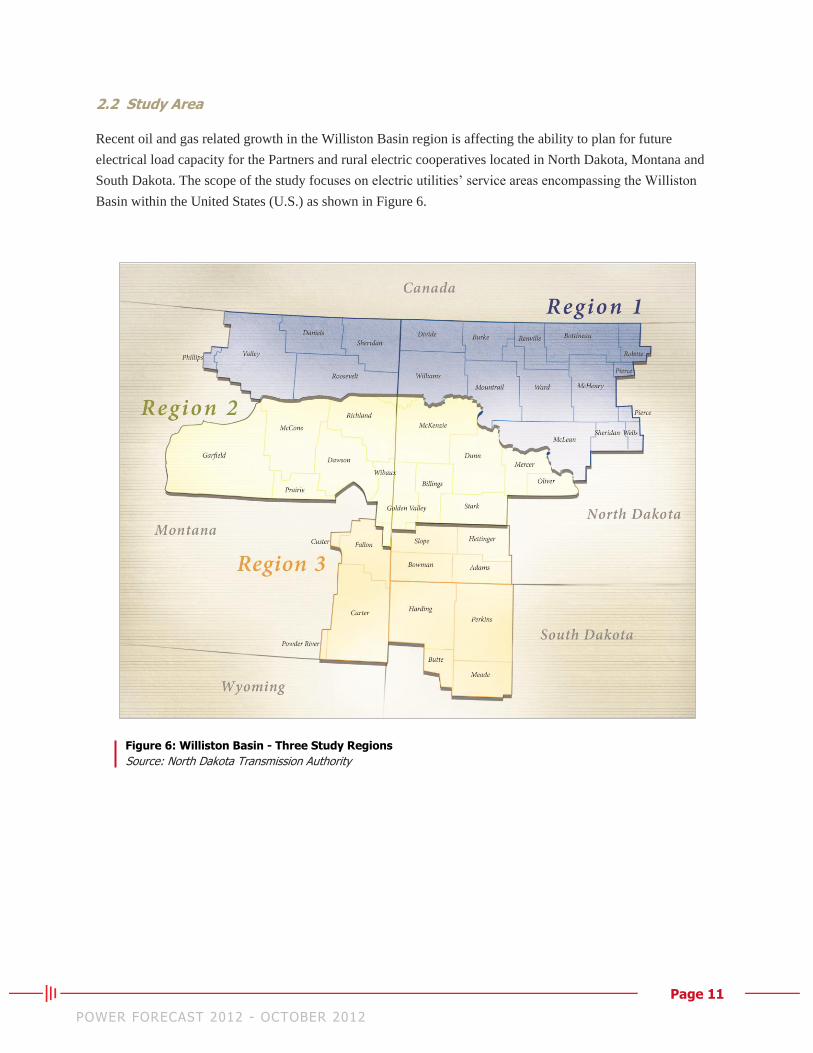
2.2 Study Area
Recent oil and gas related growth in the Williston Basin region is affecting the ability to plan for future
electrical load capacity for the Partners and rural electric cooperatives located in North Dakota, Montana and
South Dakota. The scope of the study focuses on electric utilities’ service areas encompassing the Williston
Basin within the United States (U.S.) as shown in Figure 6.
Figure 6: Williston Basin - Three Study Regions
Source: North Dakota Transmission Authority
Page 12 POWER FORECAST 2012 - OCTOBER 2012
2.3 Research Methodology
The Power Forecast 2012 (PF 12) report contains information and assumptions obtained through project
research and stakeholder interviews. The information and assumptions are factored and input into a GIS-based
computer modeling system to better facilitate geospatial planning for upcoming load requirements. The future
of oil and gas development in the Williston Basin is uncertain. Therefore, three electrical load growth
scenarios were modeled: 1) a less than expected outlook, 2) an expected, or consensus, viewpoint and 3) a
higher than expected expansion of the current Williston Basin over a 20-year period.
The power forecast report involved establishing basic load forecast assumptions that model outputs applicable
to oil and gas development. The most advantageous approach to creating base assumptions of the oil and gas
industry’s electrical needs was to gather expert information from major stakeholders operating in the study
area, develop assumptions and seek industry validation.
Future power requirements are based largely on the rate and extent of development in the Williston Basin shale
formations. Additional factors that may influence oilfield development include transportation infrastructure
modifications, addition of oil and gas processing facilities, housing supply and new government policies or
regulations.
2.4 Base Assumptions
The following sections outline base assumptions established from stakeholder interviews and derived from
expert opinion of professionals within the oil and gas industry.
The assumptions are influenced by the number of drilling rigs, drilling rig efficiencies and producing wells in a
specific region, between 2012 and 2032. The metrics are estimated from public and historical information and
depend on an assumed development growth pattern.
2.4.1 Drilling and Drilling Rigs
Exploration and production efforts within the Williston Basin are not geographically uniform, some areas and
fields are more economical. New drilling will trend toward fewer rig moves and increased utilization of
walking drill rigs and multiple well pads.
From August 2011 through July 2012, the number of drilling rigs in the Williston Basin averaged 217. The
total number of drilling rigs in the Williston Basin will remain near 2012 levels or slightly lower (200 to 210)
for the next three years. The number of wells per pad will vary from a single well in lower production areas to
an average of six wells per pad at optimum locations. The rig count will decrease as drilling becomes more
efficient.

Page 13 POWER FORECAST 2012 - OCTOBER 2012
The number of workover rigs is expected to increase and remain in the Williston Basin long after the study
area is fully developed due to an increase in the number of well bores that will require normal service to extend
their production life.
Typical industry expectations for continued drilling in the Williston Basin are as follows:
Crude price at the wellhead remains at an average price of $75 (2012 USD) per barrel
Bakken crude closely follows West Texas Intermediate (WTI) and maintains 75 to 80 percent of WTI
futures
Natural gas price averages $3 per million British thermal units (Btu) in 2012 and is expected to
increase to $7 per million Btu in 2035
Crude oil production is above 350 barrels per day during initial production and averages 35 barrels per
day over the commercial life of the well
Established recoverable reserves for all formations from a single well exceeds 350,000 barrels of oil
and have an initial 1:1 or better Gas to Oil Ratio (GOR) of natural gas liquids (NGL) rich natural gas
Total cost to develop a well remains less than $11.5 million (2012 USD)
2.4.2 Number of Wells per Rig per Year
Due to limitations of winter weather, load limits on roadways, clearance restrictions and moving-vehicle
capacity, the rig-up and demobilization times cannot be substantially reduced. Longer horizontals will be
drilled to maintain an economical oil rate that justifies drilling costs, which will require higher rated rigs and
more powerful mud pumps. These longer lateral lengths will lead to an increased chance of downhole
challenges and an increased probability of mechanical failure on the rig and auxiliary equipment. Each
respective challenge will result in additional downtime and offsetting potential increases in technology and
management factors.
According to the North Dakota Oil and Gas Division, there is a theoretical maximum of 15 wells that could be
drilled per rig, per year. However, due to environmental and technological limitations, this study will assume
the number of wells drilled per rig over the next 20 years will gradually increase from 10 wells per rig, per
year in 2012, to 12 wells per rig, per year by 2032.
2.4.3 Fracing
As the pace of drilling levels off, the availability of fracing crews will become less of a concern. Frac-water
treatment will become a common practice as the cost of treatment approaches the cost to procure and deliver
frac-water. Central frac-water treatment facilities will consume large amounts of power, while environmental
regulation may increase the timeline of planning efforts.
Page 14 POWER FORECAST 2012 - OCTOBER 2012
2.4.4 Bakken Crude Differential
Bakken crude has a historical differential of 20 to 25 percent discount compared to WTI prices for a barrel of
oil. The differential between Bakken Crude and WTI is the additional costs incurred to deliver oil to the
market. Additionally, the differential is affected because the majority of shale oil production is light and sweet,
which requires additional investment by processors to properly refine these products, as previously they had
focused on poorer quality crude. The differential will drop to 10 percent over the next five years as the
following key issues are resolved:
Lack of pipeline capacity and infrastructure to transport Bakken crude is addressed and refineries are
adjusted or retrofitted to more readily process Bakken crude
Bakken crude transported via rail replaces higher cost crudes (i.e. Brent), feeding refineries in eastern
North America
Glut of oil at Cushing, OK, is eliminated
2.4.5 Natural Gas
Natural gas pricing is largely determined by composition. Each source of natural gas has varying quantities of
methane, the most abundant product today and NGLs, the more desirable product. Bakken wells are currently
more profitable due to the higher ratio of NGLs. As transportation methods and electrical generation more
readily utilize natural gas and as exports of liquid natural gas increase, the U.S. will likely see rising natural
gas (methane) prices as demand increases from business, residential and international sources.
2.4.6 Secondary and Tertiary Oil Recovery
Secondary recovery is the stage of hydrocarbon production when an external fluid, such as water or gas is
injected into reservoirs that have fluid communication with production wells. Water and gas injections act to
maintain reservoir pressure and displace hydrocarbons toward the production wellbore. Tertiary recovery, or
enhanced oil recovery (EOR), covers gas (CO2, natural gas, nitrogen, etc.) injection, chemical injection,
microbial injection or thermal recovery techniques to further increase the amount of oil that can be recovered.
Until the middle of 2012, the primary focus of producers in the Williston Basin was to secure leases, and their
planning focus over the next decade was on increased density drilling. Currently, more attention is turning
toward identifying secondary and tertiary recovery techniques as some areas have begun reaching their bubble
point. The bubble point occurs when reservoir pressure and temperature conditions cause the natural gas in
solution with the oil to come out of solution. At this point it is important for producers to maintain reservoir
pressure to ensure continued oil production.
Page 15 POWER FORECAST 2012 - OCTOBER 2012
2.4.7 Power
A survey of oilfield loads from rural electric cooperatives in North Dakota showed 208 of 1,087 (19 percent)
existing wells currently not tied to the grid. With each site representing 0.03 MW of electricity, this equates to
6.24 MW of electrical demand in that particular region. This figure only accounts for wells in production for
which power has been requested. Assumptions used for the forecast model, based on rural electric cooperative
and stakeholder input and analysis of existing wells, show the following:
80 percent are currently tied to the grid
95 percent will be tied to the grid in 10 years
97.5 percent will be tied to the grid in 15 years and remain at this level
Stakeholder interviews indicated on-site generation has significant cost and reliability issues. Converting to
grid power is a large economic factor, especially for sites not located near sufficient distribution infrastructure.
2.4.8 Transportation
Truck traffic volume will begin to decrease within the years 2012 to 2014 as pipeline infrastructure for both
crude oil and production water becomes available to producers. Water gathering systems will be implemented
where high ratios of production water to crude oil exist, whereas production water will still be collected with
trucks in lower water yield fields.
During stakeholder interviews, many addressed the need to reduce the number of trucks on the study regions
roads. Now that developers have completed the major push to get their leases held, they will focus on
becoming more efficient, thus reducing costs and maintenance. A major part of this efficiency will be moving
more product into pipelines and off the road. In addition, the public sees the high truck volume as a nuisance
and safety hazard. Therefore, the quicker the industry can reduce the truck traffic, the sooner these
development impacts can be mitigated.
2.4.9 Labor
Skilled labor for the oil and gas industry within the study region is limited due to several factors. Education
and training are trying to catch up to the rapid growth, and housing shortages continue to be an issue.
Companies meet their requirements for skilled workers by importing labor from regional and national market
resources and rotating existing skilled employees within project fields. As oilfields are developed and reach the
production stage, the workforce will diminish in size and find employment in other states.
2.4.10 Housing
Housing constraints will remain for several years. Future demand for permanent housing will continue to
increase as demand for housing results from both growth in permanent oil sector workforce and growth in
employment associated with supporting commercial and service activity.
Page 16 POWER FORECAST 2012 - OCTOBER 2012
2.5 Stakeholder Input Process
The full scope of future oilfield development in the Williston Basin is unknown. To frame the context and
scope of future possibilities, a series of stakeholder interviews were designed and conducted to solicit
perceptions and opinions regarding current and expected development of the study regions. Oil and gas
stakeholders were identified considering geographic location of their operations within the Williston Basin,
and type of company operations; involvement with oilfield exploration and production (upstream), or
involvement with the transportation of oil and gas (downstream).
The synthesized discussions, along with price expectations, provided the basis for low, consensus and high
scenarios of future oilfield development in the Williston Basin. Additional factors, such as regulatory
environment, infrastructure development, water resources and anticipated leasing activity, were combined with
stakeholder input in developing the various scenarios.
Stakeholders and government professionals agree oil prices will have a greater impact on production and
electrical load demand than pending legislative or regulatory initiatives. However, industry experts note that if
meaningful changes to current public policies relating to taxation, environmental requirements or fracing
processes associated with oil exploration are made, extraction or production development costs could be
negatively impacted and have a subsequent impact on electrical load requirements. Stakeholders see their
energy demands remaining at the current 2012 rates through the year 2017, pending unforeseen federal
regulation.
Page 17 POWER FORECAST 2012 - OCTOBER 2012
3. Electrical Power Forecast
By combining land use and development data, spatial load forecasting tools are able to model the extents,
locations and activity development timelines and translate results into system load modules. The forecast
involves identifying typical energy consumption profiles for various load classes. Electric load is calculated by
multiplying the rating of a device by the hours used and is measured in either kilowatt-hours (kWh) or
megawatt-hours (MWh). Peak demand is an electrical load request that indicates the maximum amount of
electricity a customer requests from a utility company for service at a single point in time, measured in either
kilowatts (kW) or megawatts (MW). These load classes include residential and commercial loads and primary
and secondary infrastructure load growth that results from oil and gas development.
Future electric energy loads are then calculated from the modeling of impending development activities. These
are gained from the forecasted progression of oil and gas infrastructure build-out scenarios. The result is a
spatial load forecast that includes three modules: 1) a base map of current electric load data, 2) future loads
resulting from population increases based on demographic data and 3) future loads based on oil and gas
development build-out scenarios.
Future loads include build-out assumptions as well as specific loads where known or forecasted large loads are
anticipated at a known geographic point. Future population and point load modules are assigned parameters,
which allows the model to adjust for how less tangible variables affect the industry. These variables, which
may include social metrics, political factors and environmental influences, are then able to be adjusted in
future model updates.
Of particular importance in the electrical power forecasts are the large number of anticipated wells going into
operation across the study region over the next 20 years (2012 to 2032). Loads associated with a single well in
the forecast model become significant very quickly. The study analysis indicates the observed demand of a
single well pump in 2012 was 20 kW. However, it is feasible that the well pumps could potentially be operated
utilizing a demand of 40 kW. To account for variance in well operations throughout the region, two
calculations were made in the forecast model to demonstrate two power requirements:
Observed Demand Case: The observed demand is using an average load of 22 kW per well site; 20
kW has been designated to the well pump load with miscellaneous loads (loads not located directly on
a well pad but are associated with oilfield production and can be averaged on a per well basis) using 2
kW.
Maximum Demand Case: The maximum demand case well pump load ramps up from 24 kW today to
40 kW in the first five years of the study and remain at 40 kW for the remainder of the study period.
Miscellaneous loads ramp up from 6.6 kW today to 25 kW in the first five years and remaining at 25
kW for the remainder of the study period.
Page 18 POWER FORECAST 2012 - OCTOBER 2012
Both demand cases were calculated for low, consensus and high forecast scenarios. For clarification purposes,
the power numbers written into the text of the report are the average of the observed and maximum demand
cases in the consensus scenario.
3.1 Current Demand
Research results show the current 2012 demand for the three region area in this study is 1,209 MW. Of this,
the residential category has the highest demand with urban residential demand at 217 MW and rural residential
demand at 193 MW. Rural areas are defined as areas within the study region with lower populations per
geographic square mile, typically, higher electrical load requirements per customer are generated due to
agriculture-based needs. Urban areas are densely populated cities and towns, typically with lower electrical
load requirements per customer due to shared municipal services.
Following residential is large commercial and industrial (C&I) at 432 MW. This is comprised of 307 MW for
rural large C&I demand and 125 MW for urban large C&I demand. Just behind large C&I is small C&I at a
combined total of 323 MW. The last, and lowest, category is miscellaneous demand at 43 MW, which includes
loads, such as street lighting and irrigation. This represents 24 MW in rural areas and 19 MW in urban areas.
3.2 2017 Brings Rapid Rises
During conducted research, areas were identified as future oilfield infrastructure loads for electrical power
needs. These high-density growth areas include all or parts of nine counties in North Dakota and three counties
in Montana. Future oilfield infrastructure loads were identified by their projected petroleum infrastructure
development as well as industrial and commercial growth areas. The growth ultimately leads to higher
populations, in turn spurring higher electric energy usage. South Dakota counties lie outside the core area in
which oilfield development is assumed to occur within the study period. Therefore, these counties are not
included in the power load calculations.
The nine northwestern North Dakota counties are Divide, Wells, McKenzie, Billings, Stark, Dunn, Burke,
Mountrail and McLean. The three northeastern Montana counties are Sheridan, Roosevelt and Richland.
Total, rising demand for electrical power five years from today brings the expected demand in 2017 up to
2,288 MW. This represents a 89 percent increase from the 2012 demand of 1,209 MW. The main reason
behind this large increase over the five-year period is significant hikes in large C&I electrical demand. In 2017,
this category will claim a 1,330 MW demand for electricity. Rural large C&I leads the increases with 1,107
MW, with urban large C&I at 222 MW. This sharp rise in large C&I results in a 208 percent increase over the
2012 large C&I total of 432 MW.
In 2017, combined demand for urban and rural residential is estimated to be 482 MW. Small C&I will
experience the next largest numbers, with demand at a combined 431 MW. Miscellaneous usage is the lowest
Page 19 POWER FORECAST 2012 - OCTOBER 2012
load area, but still has significant totals of 26 MW in rural areas and 19 MW in urban areas, for a combined
total of 45 MW.
3.3 Energy Usage Continues to Increase in 2022
In 2022, electrical demand is still trending upward and will reach a total of 2,948 MW. Most of that demand
consists of large C&I, which will grow to 1,875 MW, a 41 percent increase from 1,330 MW in 2017. By this
time, residential demand will be at 526 MW and small C&I at 499 MW. Miscellaneous makes up the
remainder of the 2017 demand totals at 47 MW.
3.4 2027 Experiences Increased Usage Across the Board
As in all the years in the 20-year span of this study period (2012 to 2032), there is not a decrease in any load
areas in 2027. It also makes no difference if the loads are urban or rural—the numbers keep increasing across
the board. Total electrical demand 15 years from today is predicted to be 3,395 MW, an increase of almost 181
percent from today’s total of 1,209 MW.
Of the 3,395 MW of power demanded in 2027, large C&I is by far the largest category at 2,281 MW. Breaking
down this total between rural and urban clearly shows the growth in the oil and gas industry as rural demand is
1,920 MW and urban demand is 361 MW. Rounding out the 2027 electrical demand numbers are 544 MW for
residential, 520 MW for small C&I and 50 MW for miscellaneous.
3.5 Peak Demand Expected in 2032
Research indicates by 2032 demand for electrical power in the targeted 43 counties within the Williston Basin
will balloon to 3,721 MW. This represents a hike of almost 208 percent from the 2012 demand of 1,209 MW.
Of the 3,721 MW projected total power demand, the bulk of the electricity—2,540 MW—will be used to
power large C&I needs in the three region area that blankets North Dakota, South Dakota and Montana. While
booming growth in large C&I is experienced in urban and rural areas, the rural areas will experience the largest
gains in electrical power demand.
The second largest power demand 20 years from now will be residential, at 570 MW. This includes 358 MW
demand and 212 MW demand for urban residential and rural residential categories respectively.
Small C&I will need the third largest amount of electricity with an urban and rural total demand of 559 MW.
The breakdown is 256 MW for rural and 303 MW for urban areas. Accounting for the remaining expected
power demand is miscellaneous sources at 52 MW.
Page 20 POWER FORECAST 2012 - OCTOBER 2012
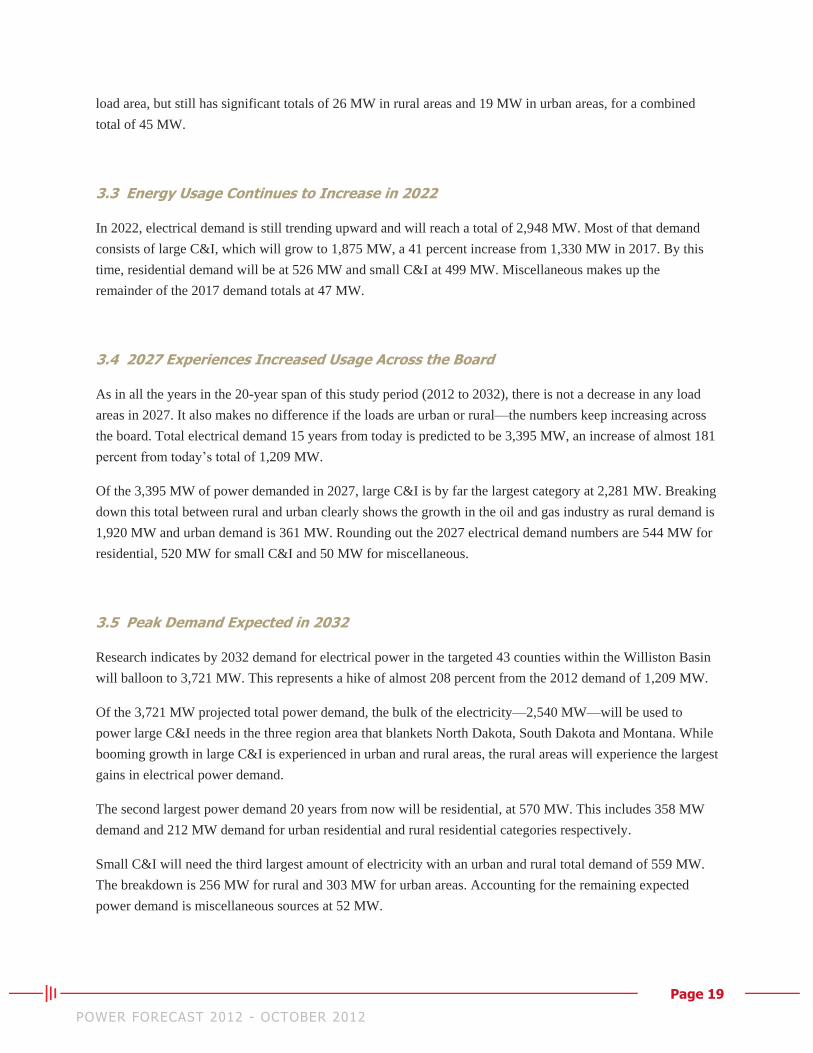
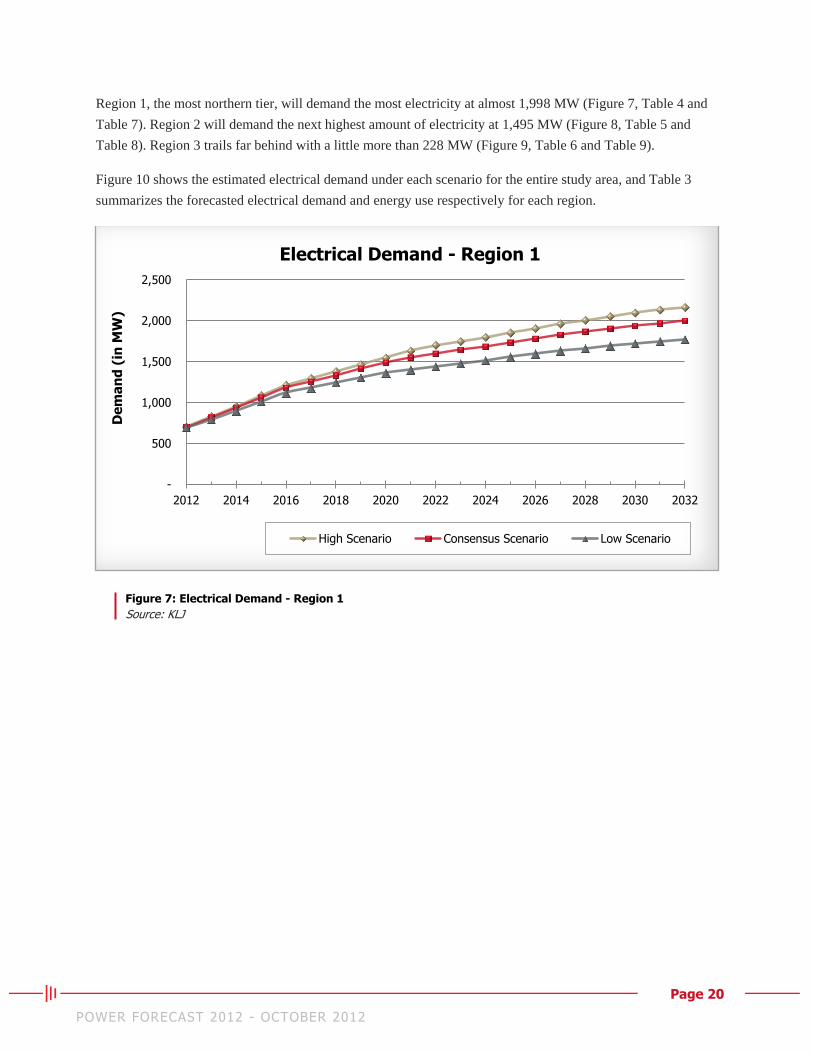
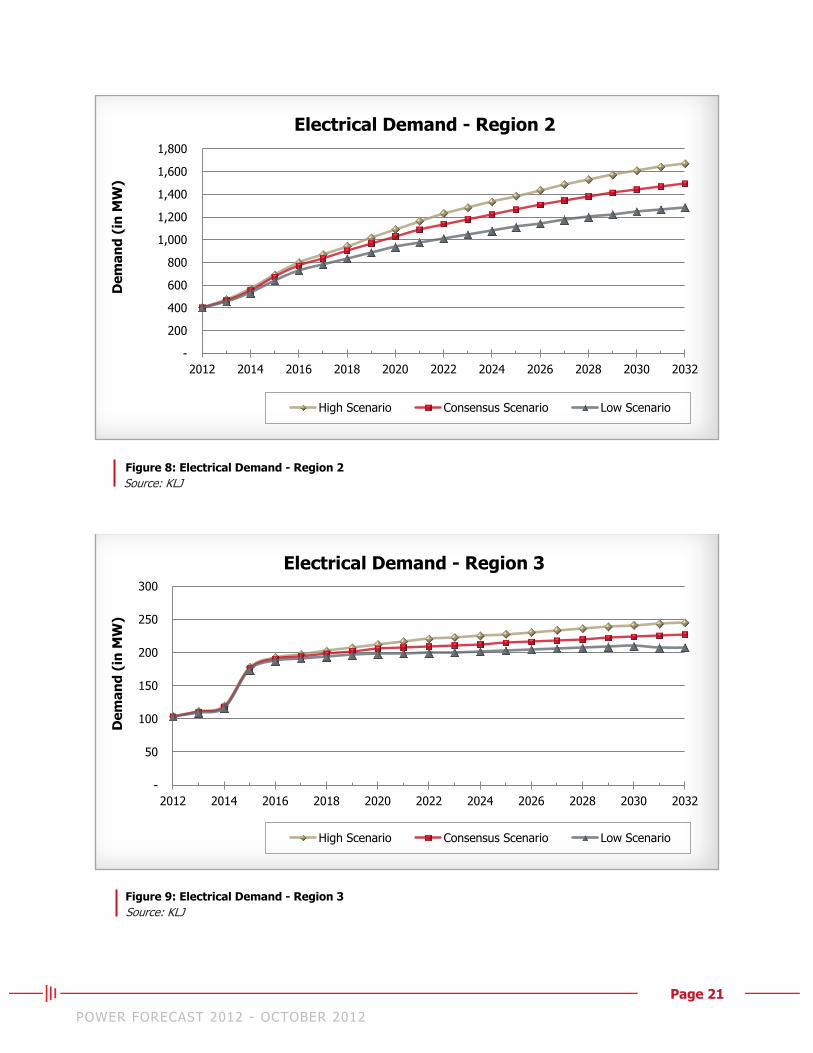
Region 1, the most northern tier, will demand the most electricity at almost 1,998 MW (Figure 7, Table 4 and
Table 7). Region 2 will demand the next highest amount of electricity at 1,495 MW (Figure 8, Table 5 and
Table 8). Region 3 trails far behind with a little more than 228 MW (Figure 9, Table 6 and Table 9).
Figure 10 shows the estimated electrical demand under each scenario for the entire study area, and Table 3
summarizes the forecasted electrical demand and energy use respectively for each region.
Figure 7: Electrical Demand - Region 1
Source: KLJ
-
500
1,000
1,500
2,000
2,500
2012 2014 2016 2018 2020 2022 2024 2026 2028 2030 2032
De
ma
nd
(in
MW
)
Electrical Demand - Region 1
High Scenario Consensus Scenario Low Scenario
Page 21 POWER FORECAST 2012 - OCTOBER 2012
Figure 8: Electrical Demand - Region 2
Source: KLJ
Figure 9: Electrical Demand - Region 3
Source: KLJ
-
200
400
600
800
1,000
1,200
1,400
1,600
1,800
2012 2014 2016 2018 2020 2022 2024 2026 2028 2030 2032
De
ma
nd
(in
MW
)
Electrical Demand - Region 2
High Scenario Consensus Scenario Low Scenario
-
50
100
150
200
250
300
2012 2014 2016 2018 2020 2022 2024 2026 2028 2030 2032
De
ma
nd
(in
MW
)
Electrical Demand - Region 3
High Scenario Consensus Scenario Low Scenario

Page 22 POWER FORECAST 2012 - OCTOBER 2012
Figure 10: Electrical Demand - All Regions
Source: KLJ
Forecasted Electrical Loads - All Regions
Demand (MW)
2012 2017 2022 2027 2032
Region 1 701 1,256 1,599 1,828 1,998
Region 2 404 838 1139 1348 1495
Region 3 104 195 210 218 228
Total Demand 1,209 2,288 2,948 3,395 3,721
Energy (MWh)
Region 1 3,977,246 7,945,361 10,387,903 12,058,128 13,217,653
Region 2 2,476,678 5,677,350 7,887,167 9,445,752 10,489,326
Region 3 600,749 1,272,543 1,356,960 1,404,199 1,449,922
Total Energy 7,054,673 14,895,254 19,632,031 22,908,079 25,156,901
Table 3: Forecasted Electrical Loads - All Regions
Source: KLJ
-
500
1,000
1,500
2,000
2,500
3,000
3,500
4,000
4,500
2012 2014 2016 2018 2020 2022 2024 2026 2028 2030 2032
De
ma
nd
(in
MW
)
Electrical Demand - All Regions
High Scenario Consensus Scenario Low Scenario
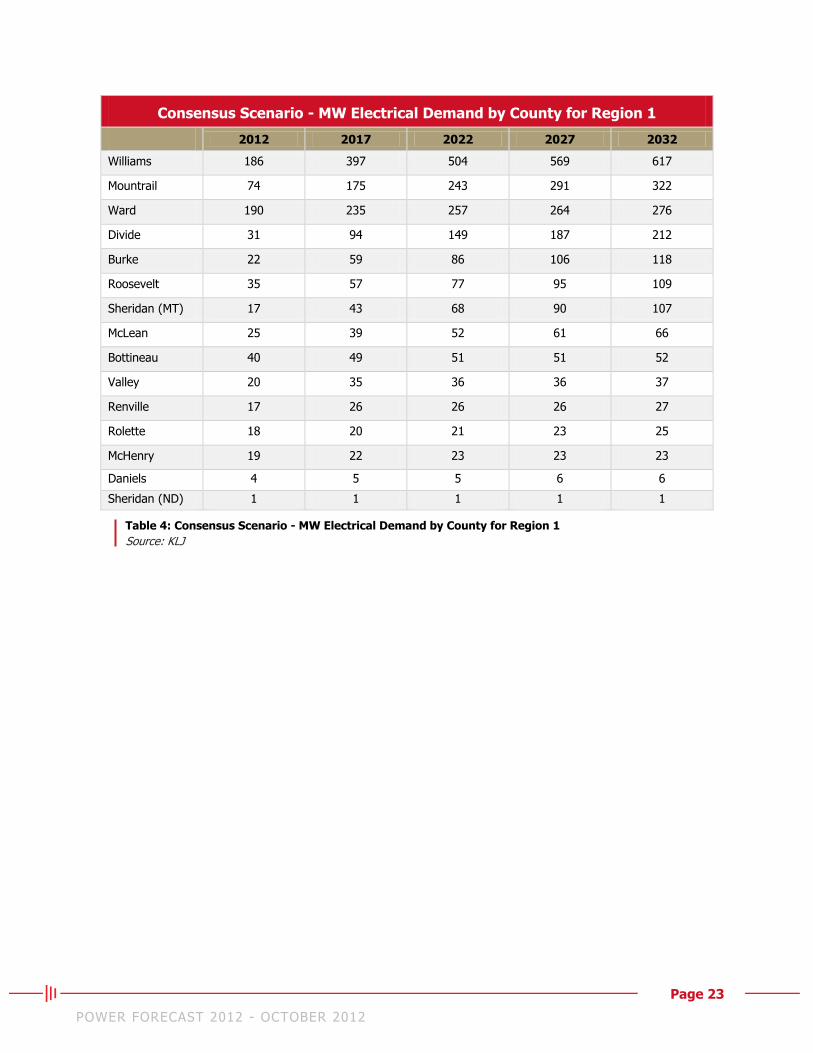
Page 23 POWER FORECAST 2012 - OCTOBER 2012
Consensus Scenario - MW Electrical Demand by County for Region 1
2012 2017 2022 2027 2032
Williams 186 397 504 569 617
Mountrail 74 175 243 291 322
Ward 190 235 257 264 276
Divide 31 94 149 187 212
Burke 22 59 86 106 118
Roosevelt 35 57 77 95 109
Sheridan (MT) 17 43 68 90 107
McLean 25 39 52 61 66
Bottineau 40 49 51 51 52
Valley 20 35 36 36 37
Renville 17 26 26 26 27
Rolette 18 20 21 23 25
McHenry 19 22 23 23 23
Daniels 4 5 5 6 6
Sheridan (ND) 1 1 1 1 1
Table 4: Consensus Scenario - MW Electrical Demand by County for Region 1
Source: KLJ

Page 24 POWER FORECAST 2012 - OCTOBER 2012
Consensus Scenario - MW Electrical Demand by County for Region 2
2012 2017 2022 2027 2032
McKenzie 122 288 404 483 535
Dunn 39 121 190 239 270
Stark 85 141 187 213 235
Richland 61 111 142 169 190
Billings 22 57 84 103 115
Dawson 23 31 35 38 41
McCone 7 33 34 35 36
Mercer 22 24 25 26 27
Golden Valley 8 14 19 22 24
Garfield 6 7 7 8 9
Wibaux 4 6 6 7 7
Oliver 5 5 5 5 5
Prairie 1 1 1 1 1
Table 5: Consensus Scenario - MW Electrical Demand by County for Region 2
Source: KLJ
Consensus Scenario - MW Electrical Demand by County for Region 3
2012 2017 2022 2027 2032
Fallon 23 50 52 53 54
Meade 20 34 37 39 41
Bowman 26 34 37 37 39
Harding 4 30 31 31 31
Hettinger 8 13 17 19 20
Slope 4 7 9 10 11
Perkins 7 8 9 10 10
Carter 3 9 9 10 10
Adams 7 9 10 10 10
Table 6: Consensus Scenario - MW Electrical Demand by County for Region 3
Source: KLJ
Page 25 POWER FORECAST 2012 - OCTOBER 2012
Consensus Scenario - MWh Energy by County for Region 1
2012 2017 2022 2027 2032
Williams 1,087,776 2,561,456 3,319,625 3,799,503 4,130,605
Mountrail 492,746 1,267,795 1,783,774 2,149,176 2,379,919
Divide 205,799 683,220 1,105,491 1,404,066 1,590,045
Ward 947,290 1,209,517 1,303,174 1,324,776 1,368,146
Burke 154,580 438,579 654,921 810,376 905,907
Sheridan (MT) 99,966 281,365 457,899 609,095 726,832
Roosevelt 190,875 340,611 479,442 598,905 692,906
McLean 132,917 235,350 331,261 399,979 441,823
Bottineau 235,288 303,597 310,238 309,816 312,738
Valley 103,966 213,100 216,455 219,855 223,422
Renville 109,575 174,575 176,389 175,857 176,454
Rolette 90,834 97,263 103,589 109,885 118,966
McHenry 97,266 108,208 112,603 111,798 113,369
Daniels 22,033 24,696 27,386 29,804 31,889
Sheridan (ND) 6,335 6,030 5,657 5,237 4,633
Table 7: Consensus Scenario - MWh Energy by County for Region 1
Source: KLJ
Page 26 POWER FORECAST 2012 - OCTOBER 2012
Consensus Scenario - MWh Energy by County for Region 2
2012 2017 2022 2027 2032
McKenzie 838,553 2,090,506 2,973,321 3,591,105 3,980,267
Dunn 269,325 903,062 1,438,255 1,818,962 2,056,229
Stark 442,488 822,690 1,125,535 1,304,227 1,442,552
Richland 377,801 716,407 926,527 1,105,701 1,247,830
Billings 166,011 436,327 649,076 802,281 896,277
McCone 32,757 240,951 245,385 248,996 252,465
Dawson 116,683 165,920 182,998 196,959 210,170
Golden Valley 44,275 90,857 124,921 146,706 161,601
Mercer 113,589 118,690 122,783 126,964 132,482
Garfield 28,135 33,229 36,936 39,955 42,857
Wibaux 19,350 30,744 33,375 35,520 37,575
Oliver 23,457 23,078 22,618 22,490 22,704
Prairie 4,253 4,887 5,438 5,886 6,316
Table 8: Consensus Scenario - MWh Energy by County for Region 2
Source: KLJ
Consensus Scenario - MWh Energy by County for Region 3
2012 2017 2022 2027 2032
Fallon 145,399 349,101 357,733 362,194 366,746
Bowman 176,022 230,341 241,061 243,312 248,665
Meade 99,985 208,573 218,513 227,375 236,739
Harding 22,237 227,987 229,706 231,242 232,865
Hettinger 42,596 71,842 98,026 113,198 124,527
Slope 25,502 45,554 61,840 72,537 79,609
Carter 16,316 56,685 60,093 61,675 63,287
Perkins 36,370 38,870 42,537 45,805 49,259
Adams 36,323 43,590 47,450 46,862 48,226
Table 9: Consensus Scenario - MWh Energy by County for Region 3
Source: KLJ
Page 27 POWER FORECAST 2012 - OCTOBER 2012
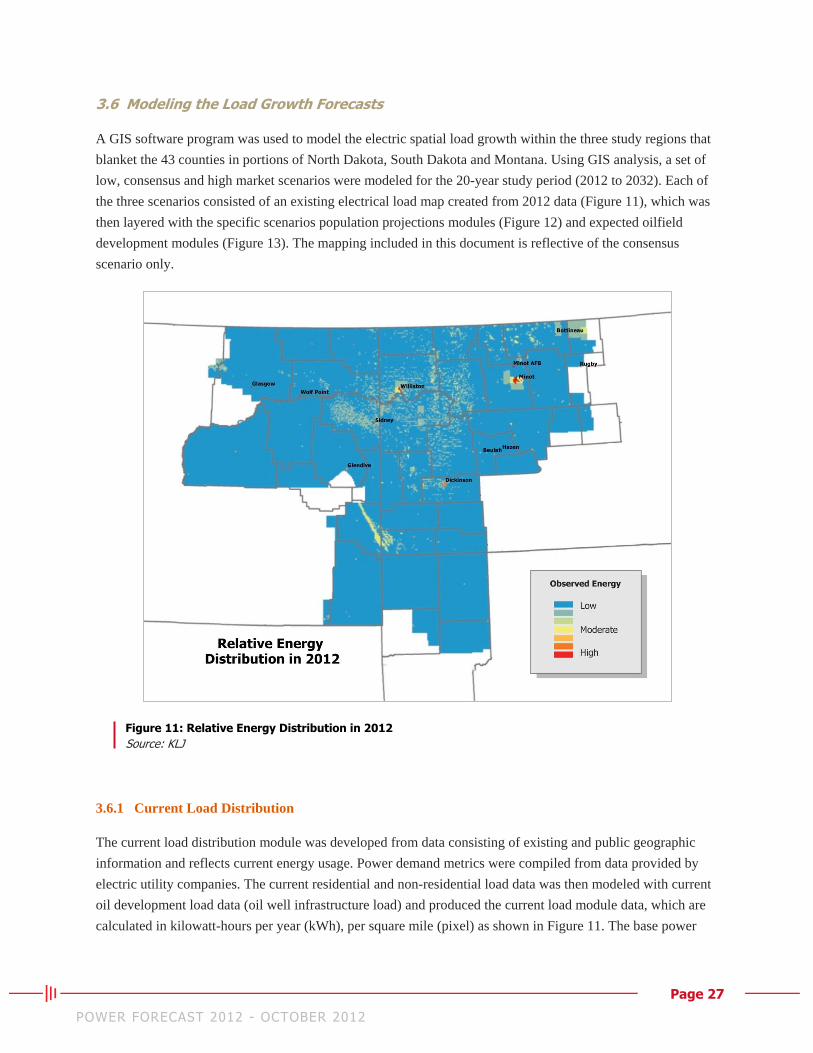
3.6 Modeling the Load Growth Forecasts
A GIS software program was used to model the electric spatial load growth within the three study regions that
blanket the 43 counties in portions of North Dakota, South Dakota and Montana. Using GIS analysis, a set of
low, consensus and high market scenarios were modeled for the 20-year study period (2012 to 2032). Each of
the three scenarios consisted of an existing electrical load map created from 2012 data (Figure 11), which was
then layered with the specific scenarios population projections modules (Figure 12) and expected oilfield
development modules (Figure 13). The mapping included in this document is reflective of the consensus
scenario only.
Figure 11: Relative Energy Distribution in 2012
Source: KLJ
3.6.1 Current Load Distribution
The current load distribution module was developed from data consisting of existing and public geographic
information and reflects current energy usage. Power demand metrics were compiled from data provided by
electric utility companies. The current residential and non-residential load data was then modeled with current
oil development load data (oil well infrastructure load) and produced the current load module data, which are
calculated in kilowatt-hours per year (kWh), per square mile (pixel) as shown in Figure 11. The base power
Page 28 POWER FORECAST 2012 - OCTOBER 2012
load is distributed between urban and rural classifications in four classes across the study area: 1) large C&I, 2)
small C&I, 3) residential and 4) miscellaneous loads.
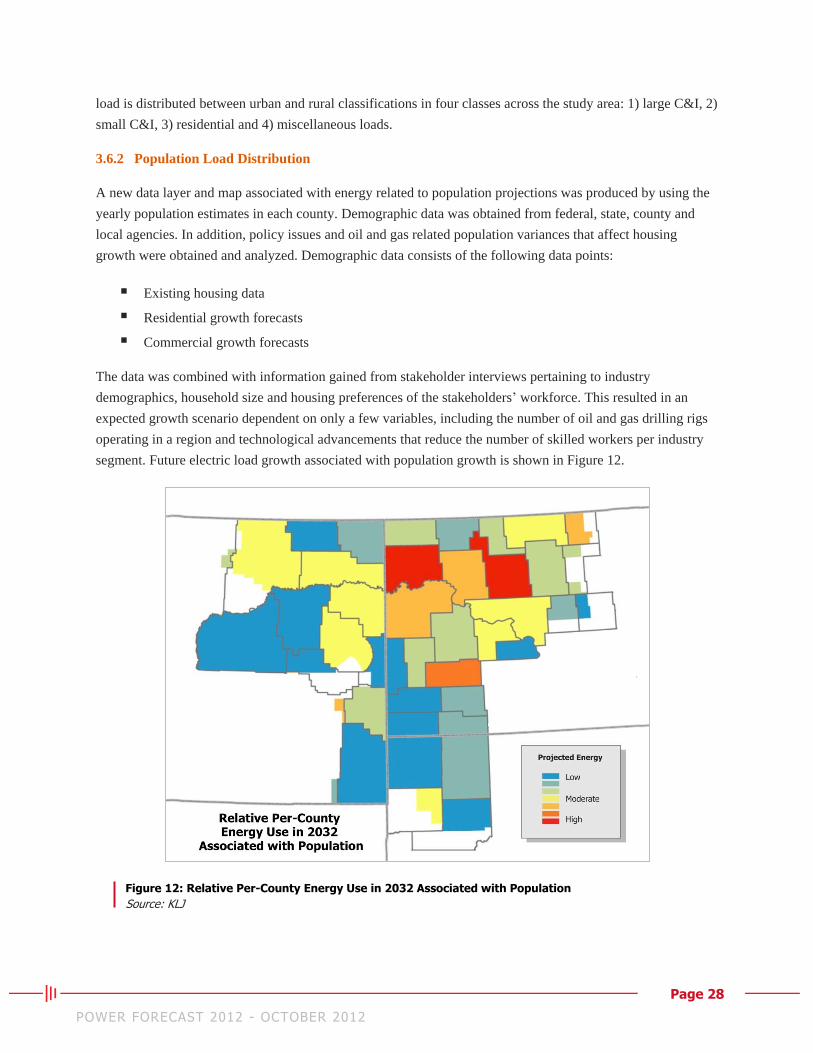
3.6.2 Population Load Distribution
A new data layer and map associated with energy related to population projections was produced by using the
yearly population estimates in each county. Demographic data was obtained from federal, state, county and
local agencies. In addition, policy issues and oil and gas related population variances that affect housing
growth were obtained and analyzed. Demographic data consists of the following data points:
Existing housing data
Residential growth forecasts
Commercial growth forecasts
The data was combined with information gained from stakeholder interviews pertaining to industry
demographics, household size and housing preferences of the stakeholders’ workforce. This resulted in an
expected growth scenario dependent on only a few variables, including the number of oil and gas drilling rigs
operating in a region and technological advancements that reduce the number of skilled workers per industry
segment. Future electric load growth associated with population growth is shown in Figure 12.
Figure 12: Relative Per-County Energy Use in 2032 Associated with Population
Source: KLJ

Page 29 POWER FORECAST 2012 - OCTOBER 2012
3.6.3 Future Electric Loads
Main factors in developing a model illustrating future development of electric load include the relative load
required by both the producing formation associated with the number of wells and related infrastructure, and
the geographic boundaries of those future developing loads. The PF 12 modeling process was developed
through an assessment of known power loads and estimations of future loads as determined by stakeholder
input, analysis of oilfield development and population growth projections. Certain future load factors are not
included due to the lack of reliable, dependable or consistent data. However, these factors can be regarded as a
significant demand. They will be tracked, monitored and factored in future forecast studies as consistent data is
made known and recorded.
Electric load elements that could be factored into future forecast studies are as follows:
Secondary and Tertiary Recovery for new Williston Basin wells: Currently, the vast majority of new
wells are under primary recovery power loads. As secondary, and then tertiary recovery techniques
(including CO2 injection) begin to be consistently deployed, timing, location and power loads for
these methods can be factored into the model and existing well load values and parameters will be
adjusted.
Gas Processing Facilities (2015-2019): In addition to processing plant loads already planned or
currently in construction included in the model, it could be assumed that up to two additional large gas
processing facilities will be built between 2015 to 2019. It is presently assumed the facilities would
have the same level of demand as the existing planned facilities, and have a per facility demand of
approximately 15 MW for every 100 million standard cubic feet a day (MMscf/d)of processing
capability. If these potential plants move to a public planning stage, the loads will be assigned a value,
location and date-of-operation and included in the model.
Production Water Treatment for Re-use Facilities: Currently, water used for fracing and oilfield
development comes from either wells sourcing from the groundwater aquifer or man-made water
storage facilities such as Lake Sakakawea. If production water treatment facilities shift from a
planning stage to a development stage, an appropriate load will be applied to the model. Currently, an
estimated hourly demand of 75 kW would be required for every 10,000 barrels of water treated.
Major Oil Transmission Pipelines (2015-2017): Considering the potential daily production of crude
oil in the Williston Basin, there is an increasing possibility of up to two major oil transmission
pipelines with a capacity of at least 100,000 barrels of oil per day (bopd) each being constructed
between 2015 to 2017. If and when these potential pipelines are firmly in a planning stage with a
designated route and stated capacity, the model will assign the equivalent ratio of 2 MW per 100,000
barrels a day along every 20 miles of pipeline.
In the forecast model, it was assumed a minor percentage of load growth over the next 20 years would occur in
geologic formations other than the Bakken/Three Forks formations. Given the assumption, an effort to map
Page 30 POWER FORECAST 2012 - OCTOBER 2012
boundaries of the core area of future Bakken/Three Forks production was initiated using a variety of source
materials and personal communication with geologists and regulatory personnel working for both private and
governmental entities. It was further assumed there would be relatively uniform production quantities across
the length and breadth of the core development area. Although oil and gas drilling activities progresses and
changes over time, sufficient historical drilling, modeling and mapping data does not exist at this time to refine
this assumption.
Areal boundaries were determined based on the mapped extents of mature Bakken deposits, documented initial
production results of the last 10 years of Bakken/Three Forks wells, regional groundwater flow directions and
personal communication. Within the study region, a boundary delineating the core Bakken/Three Forks
development area within North Dakota and Montana was established. From these extents, a 1,280-acre spacing
grid was created for the study area and trimmed at the Bakken/Three Forks core boundary.
The resulting array of 1,280-acre spacing units allowed counting existing and potential spacing units already
drilled or could be drilled. The count tallied more than 6,000 spacing units in North Dakota and greater than
2,000 spacing units in Montana that could conceivably be leased for oil and gas drilling. As drilling progresses
into the future, there will most likely be areas outside of this core area that will have Bakken/Three Forks
development, and conversely, areas within the core that will not have future development. Current North
Dakota State regulations allow up to eight Bakken/Three Forks wells per 1,280-spacing unit. Montana allows a
maximum of four Bakken/Three Forks wells per spacing unit. A consensus value of 5.98 wells per North
Dakota spacing unit and 2.1 wells per Montana spacing unit was used as a metric for ultimate well-based load
across the core area. Future electric load growth was then calculated by subtracting the number of existing
Bakken/Three Forks wells from the consensus number for each individual spacing unit, ultimately deriving the
potential growth in well-based electric loads.
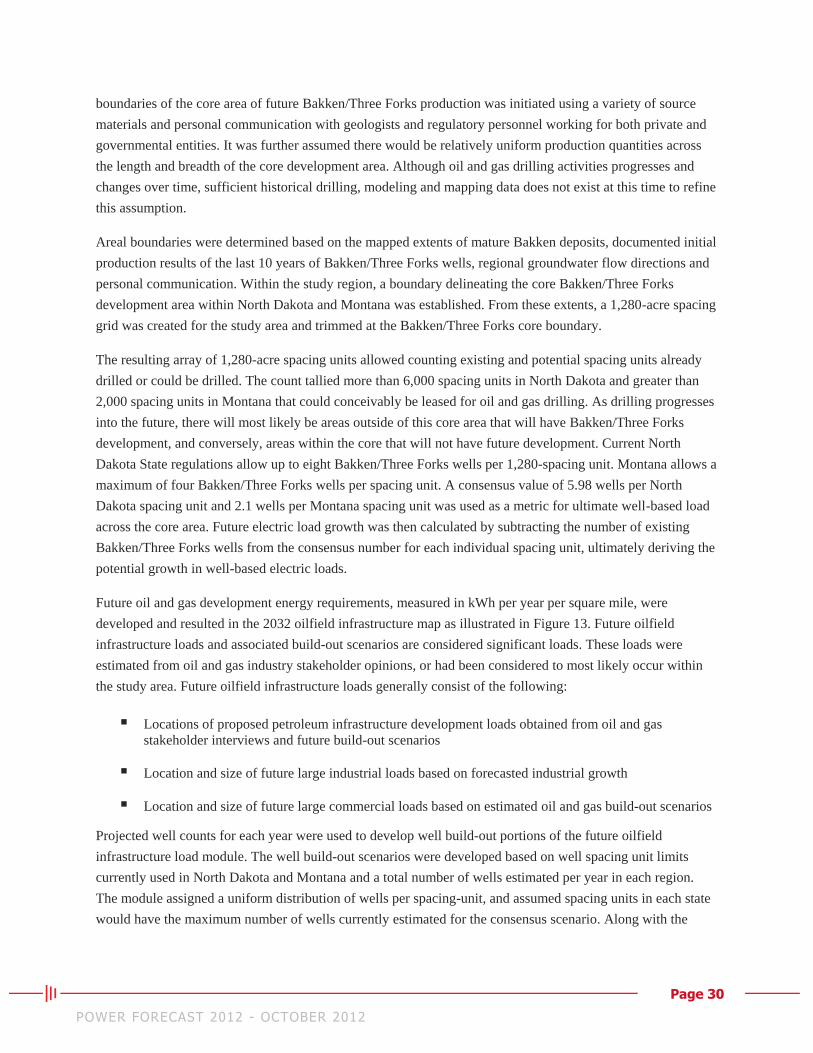
Future oil and gas development energy requirements, measured in kWh per year per square mile, were
developed and resulted in the 2032 oilfield infrastructure map as illustrated in Figure 13. Future oilfield
infrastructure loads and associated build-out scenarios are considered significant loads. These loads were
estimated from oil and gas industry stakeholder opinions, or had been considered to most likely occur within
the study area. Future oilfield infrastructure loads generally consist of the following:
Locations of proposed petroleum infrastructure development loads obtained from oil and gas
stakeholder interviews and future build-out scenarios
Location and size of future large industrial loads based on forecasted industrial growth
Location and size of future large commercial loads based on estimated oil and gas build-out scenarios
Projected well counts for each year were used to develop well build-out portions of the future oilfield
infrastructure load module. The well build-out scenarios were developed based on well spacing unit limits
currently used in North Dakota and Montana and a total number of wells estimated per year in each region.
The module assigned a uniform distribution of wells per spacing-unit, and assumed spacing units in each state
would have the maximum number of wells currently estimated for the consensus scenario. Along with the
Page 31 POWER FORECAST 2012 - OCTOBER 2012
estimated yearly well counts, high load demand assumptions, such as compressor stations, saltwater disposal
sites, saltwater disposal pipeline booster pumps, oil pipeline booster pumps and proposed oil and gas refinery
locations, were assigned to geographic locations (Figure 13).
Figure 13: Relative Energy Use in 2032 Associated with Oilfield Infrastructure
Source: KLJ
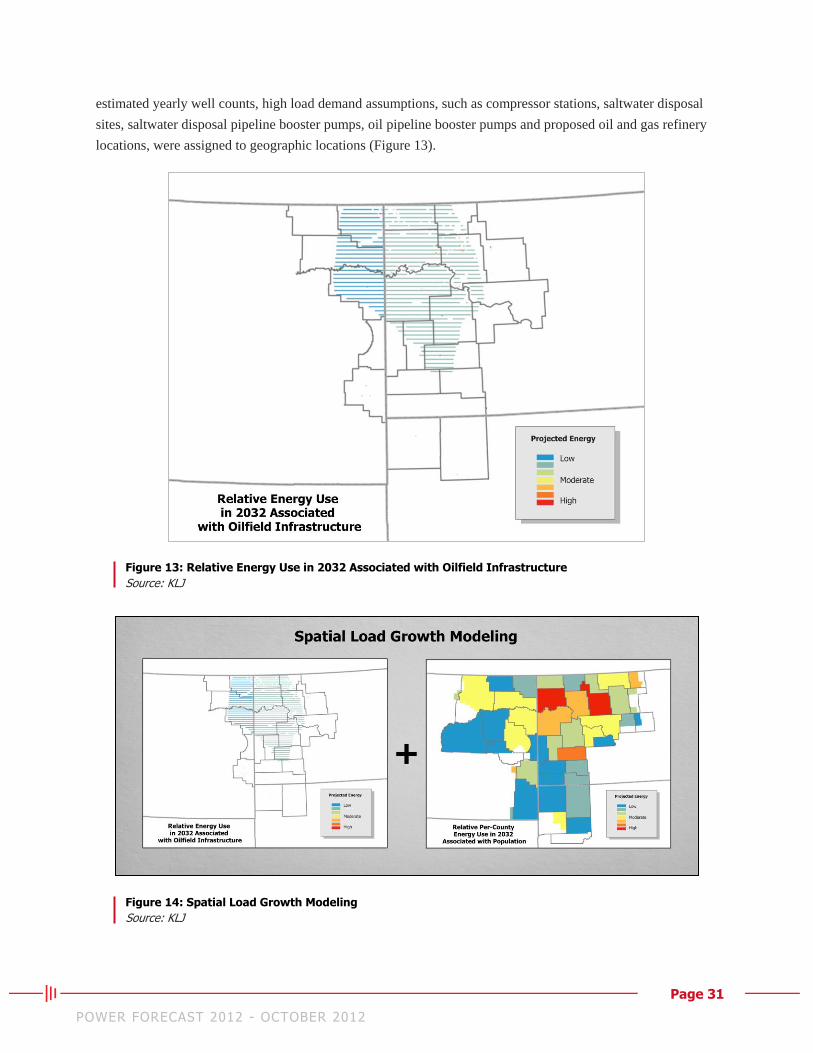
Figure 14: Spatial Load Growth Modeling
Source: KLJ

Page 32 POWER FORECAST 2012 - OCTOBER 2012
3.6.4 Forecast Model Map
When modeled in GIS (Figure 14), the final product produces the spatial electric load forecast per square mile,
per year, as represented in Figure 15.
The combined modules also indicate significant temporary population increases in several towns located near
development activities and large population increases of permanent residents in the larger cities (the population
demographics module assumes permanent workers will gravitate toward residing in higher trade areas).
Figure 15: Electric Load Forecast 2032 - Relative Demand
Source: KLJ
Page 33 POWER FORECAST 2012 - OCTOBER 2012
4. Oil and Gas Development Details and Outlook
Energy costs related to oil and gas production can be broken into three broad stages: 1) lifting, 2) transporting
and 3) processing. Determination of oil and gas development and production-related electric load requirements
depend on factors such as the number of wells to be drilled and completed and gas, oil and water production
rates. Typical drilling activities require reliable electrical energy to power a number of applications, such as
separation, transportation and processing.
4.1 Oilfield Infrastructure Power Requirements
Electric-powered infrastructure vital for the oil and gas industry ranges from small loads, such as
communication or monitoring devices that operate at low power of 12 watts, to large industrial loads, such as
gas processing plants requiring upwards of 20 MW of demand. The following sections describe devices related
to oil and gas infrastructure that have significant energy loads. All scenarios cover the 20-year forecast period.
Energy to drill and complete a well is sourced from onsite generators built into the drilling and workover rigs.
After the well is completed, grid-tied electric energy is required for the primary recovery stage to lift fluid to
the surface, separate the gas, oil, water and solids, compress and transport the oil and gas and treat and dispose
of brine water and processing gases. In secondary and tertiary recovery stages, the energy required typically
remains stable: although, additional electricity may be required to inject fluids into the reservoir and recycle
the injectants.
Monthly meter data of oilfield-related electric loads indicate an average usage of 22 kW per oilfield site. An
analysis of 1,000 oilfield sites show an average of 800 sites were connected to a utility’s power grid during a
given month (80 percent existing load, 20 percent impending load). The study assumes this 4:1 ratio is
consistent across the entire Williston Basin. Additionally, it is assumed all leases held by only one well will
see an addition of at least four additional wells per spacing unit in North Dakota and one additional well per
spacing unit in Montana. Significant infrastructure loads are directly related to primary recovery of a single
well. A low and high demand case for a well pump has been established for each study scenario.
Page 34 POWER FORECAST 2012 - OCTOBER 2012
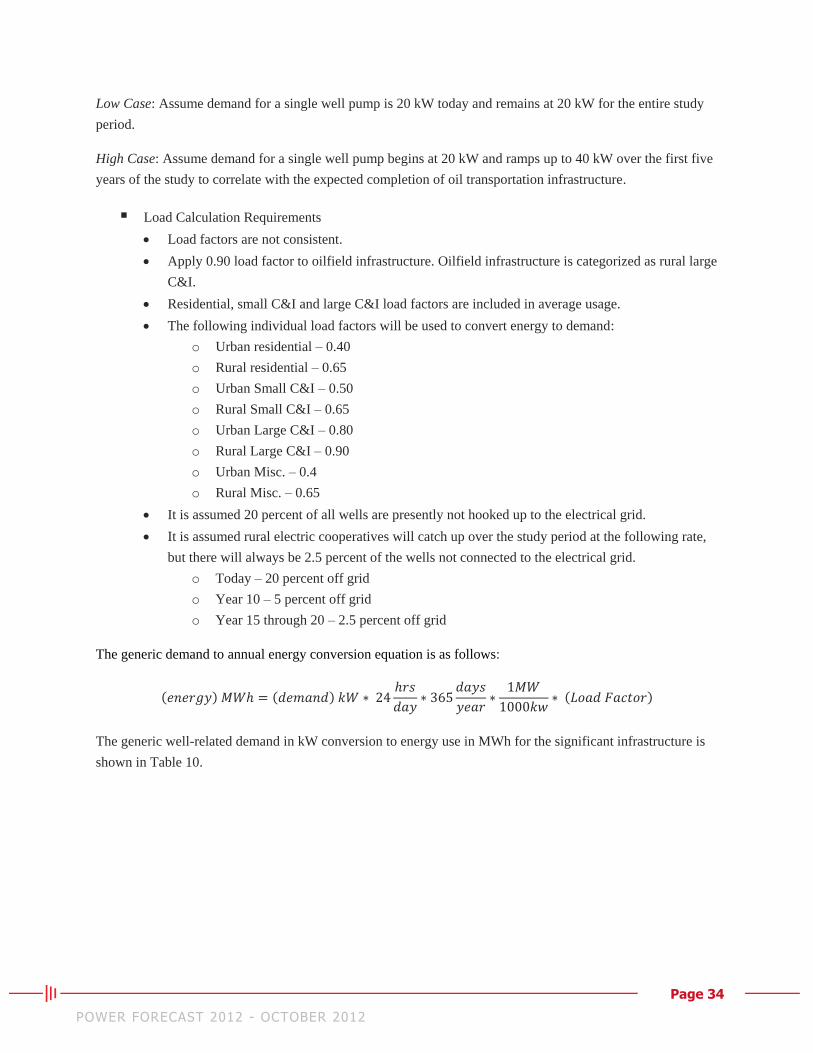
Low Case: Assume demand for a single well pump is 20 kW today and remains at 20 kW for the entire study
period.
High Case: Assume demand for a single well pump begins at 20 kW and ramps up to 40 kW over the first five
years of the study to correlate with the expected completion of oil transportation infrastructure.
Load Calculation Requirements
Load factors are not consistent.
Apply 0.90 load factor to oilfield infrastructure. Oilfield infrastructure is categorized as rural large
C&I.
Residential, small C&I and large C&I load factors are included in average usage.
The following individual load factors will be used to convert energy to demand:
o Urban residential – 0.40
o Rural residential – 0.65
o Urban Small C&I – 0.50
o Rural Small C&I – 0.65
o Urban Large C&I – 0.80
o Rural Large C&I – 0.90
o Urban Misc. – 0.4
o Rural Misc. – 0.65
It is assumed 20 percent of all wells are presently not hooked up to the electrical grid.
It is assumed rural electric cooperatives will catch up over the study period at the following rate,
but there will always be 2.5 percent of the wells not connected to the electrical grid.
o Today – 20 percent off grid
o Year 10 – 5 percent off grid
o Year 15 through 20 – 2.5 percent off grid
The generic demand to annual energy conversion equation is as follows:
( ) ( )
( )
The generic well-related demand in kW conversion to energy use in MWh for the significant infrastructure is
shown in Table 10.
Page 35 POWER FORECAST 2012 - OCTOBER 2012
To estimate impending load per year, these generic loads per well are applied to the well count derived from
estimating the number of wells per county.
4.1.1 Lease Automatic Custody Transfer Unit
Lease Automatic Custody Transfer (LACT) units automate the process of sampling, measuring and
transferring hydrocarbons between a buyer and seller. Composed of electric pumps and various instruments,
these devices are typically used at individual well sites and truck unloading terminals.
4.1.2 Compressor Stations
Transporting natural gas from the wellhead to a processing plant through a pipeline requires placing
compressor stations along the length of the pipeline to maintain constant pressure. Compressor stations use
pumps ranging from 450 kW to 1,200 kW.
4.1.3 Saltwater Disposal Sites
Saltwater disposal sites vary in size and region due to the quantity of water produced at each wellhead. No
linear relationship exists between bopd and barrels of water a day (bbls/d). Site variance at one site could be as
great as 10:1 oil to water output and at another site the opposite at 1:10 oil to water output. Further, each area
is unique in its varying formations. The assumptions for the 20-year forecast period under the consensus
scenario are that about 540 additional saltwater disposal sites will be needed before peak production in the
early 2020s. These disposal sites are assumed to be located within a 20 mile radius of producing wells.
4.1.4 Gas Processing Plants
Gas processing plants are located throughout the three study regions. Actual energy consumed by each plant
depends on the amount of onsite generation utilized. Demand requests for the new 100 MMscf/d capacity
plants have been 20 MW. Based on actual usage rates from local utilities, the forecast study used 15 MW as a
more accurate representation of likely demand. Additional natural gas processing plants will be needed if
drilling activities continue at current levels.
4.1.5 Booster Pump Stations
Booster pump stations increase oil pressure received through a main pipeline to transmit it to the next station
or terminal. Using existing pipeline system and projected future infrastructure data as a baseline, 112 kW for
every 20 miles of transmission line was determined.
4.1.6 Oil Reservoir Storage
Stakeholder interviews aided in determining the total load requirements at oil reservoir storage facilities. Loads
varied from 900 kW to 1,350 kW, with many sites drawing 60 to 70 percent of the total anticipated demand.
Stakeholders indicated many sites are anticipating a doubling of load-out capacity over the next 20 years.
Page 36 POWER FORECAST 2012 - OCTOBER 2012
System components for these facilities include pumps, LACT units, mixers and other various small electrical
systems.
4.1.7 Rail Load-Out Facilities
Rail load-out facilities for crude oil transportation continue to spring up throughout the study region. Ten sites
are now in development. An additional 10 sites are planned in North Dakota including Banner-Dore, Fryburg,
Dickinson and Zap. Electric loads for rail loading facilities range from 450 kW to 1,500 kW.
4.1.8 CO2 EOR Projects Energy Requirements
Today, several experimental pilot projects are being conducted in the Bakken Formation and Williston Basin
to determine the most effective recovery methodology to ensure future long-term production. At this point,
there is not enough conclusive data available to know what the future recovery methodology will be, or to
accurately estimate the electrical loads associated with that methodology. Electrical loads for widespread
secondary and tertiary recovery are not included in this forecast model. One CO2 EOR project is being
developed in the Cedar Creek anticline area of the Williston Basin. Estimates of future electrical demand
received from the producer developing that project are included within the model at that location only.

Page 37 POWER FORECAST 2012 - OCTOBER 2012
Generic Assumptions of Significant Infrastructure Energy Use
Device Assumption Device Metric Ratio
Average Demand Per Well
(kW)
Average Energy (MWh)
Well Pump Average well pump is
65hp. Well pumps tied to Variable Frequency Drives
1:1 30 237
Compressor station
1 well produces 50 Mscf/d (averaged)
1:7,500 Mscf/d gas
1:150 wells
13.6 107 SWD site 1 well produces 300 bbls/d
brine (averaged) 1:6,000 bbls/d
brine 1:20 wells
Booster pump (oil)
1 well produces 40 bopd (averaged)
1:15,000 bopd 1:375 wells
Well pad
Wells pads include:
1:2 wells MT 11.6 91 LACT unit
Vapor recovery unit
1:6 wells ND 5.8 46 Transfer pumps
Separator
Lighting
1:1 wells SD 20.4 161 Heating
Instrumentation
Total per MT well: 55.2 435
Total per ND well: 49.4 390
Total per SD well: 64 505
Table 10: Generic Assumptions of Significant Infrastructure Energy Use
Source: KLJ
Page 38 POWER FORECAST 2012 - OCTOBER 2012
4.2 Well Site Power Load Assumptions
For load growth modeling, a per-year ratio of 10 wells per drilling rig is assumed to gradually increase to 12
wells per drilling rig over the next 20 years. Multiplying the estimated rig count for each county by the wells
per year provides a high-level assumption of the number of wells drilled throughout the study period.
4.3 Drilling Activity Forecasts
Future drilling activity projections primarily depend on reviewing historical drilling activities and assessing
current and near-term drilling climate. Typical drilling plans are controlled by a myriad of factors that range
from reservoir size to the well pattern. Well spacing and the well pattern of most reservoirs in the Williston
Basin follow development of unconventional shale oilfields in other geographic regions. Reservoir flow
capacity after stimulation, drive mechanism, well life, drilling and completion cost and environmental relief
cost are also key factors in drilling plans.
The number of wells to be drilled is determined by the production plan, preparation of drill site, number of
wells per drill site, well construction time and the rigs availability, labor and service. To maintain an
economical oil rate, cost reduction is a tradeoff of any increase in well complexity. The majority of wells in the
Williston Basin require stimulation. Therefore, the availability of fracing equipment, materials and crews act as
a constraint to developers’ drilling plans.
Two factors—volatile oil prices and the geological nature of the Bakken Formation—create uncertainty about
future drilling activity in the Williston Basin. The main driver to produce Bakken oil is a higher than average
oil price. The diversity of Bakken shale leads to two-year drilling plans instead of five-year plans, as is
common in conventional oil and gas reservoirs.
Operator plans for drilling activities beyond one to two years are highly uncertain and rely on results of new
wells in the next two years. Oil prices lower than approximately $60 per barrel approach a marginal revenue
threshold that economically encourages reduction or scaling back of many drilling plans in the Williston Basin.
Therefore, Bakken shale geology plus oil price uncertainty require a low, consensus and high forecast
scenarios for drilling activity. Drilling forecasts were estimated for the Williston Basin after studying historical
drilling activity dating back to 2005, evaluating drilling efficiency, examining the availability of rigs and
reviewing the drilling plans. Estimated future rig counts are shown in Figure 16.
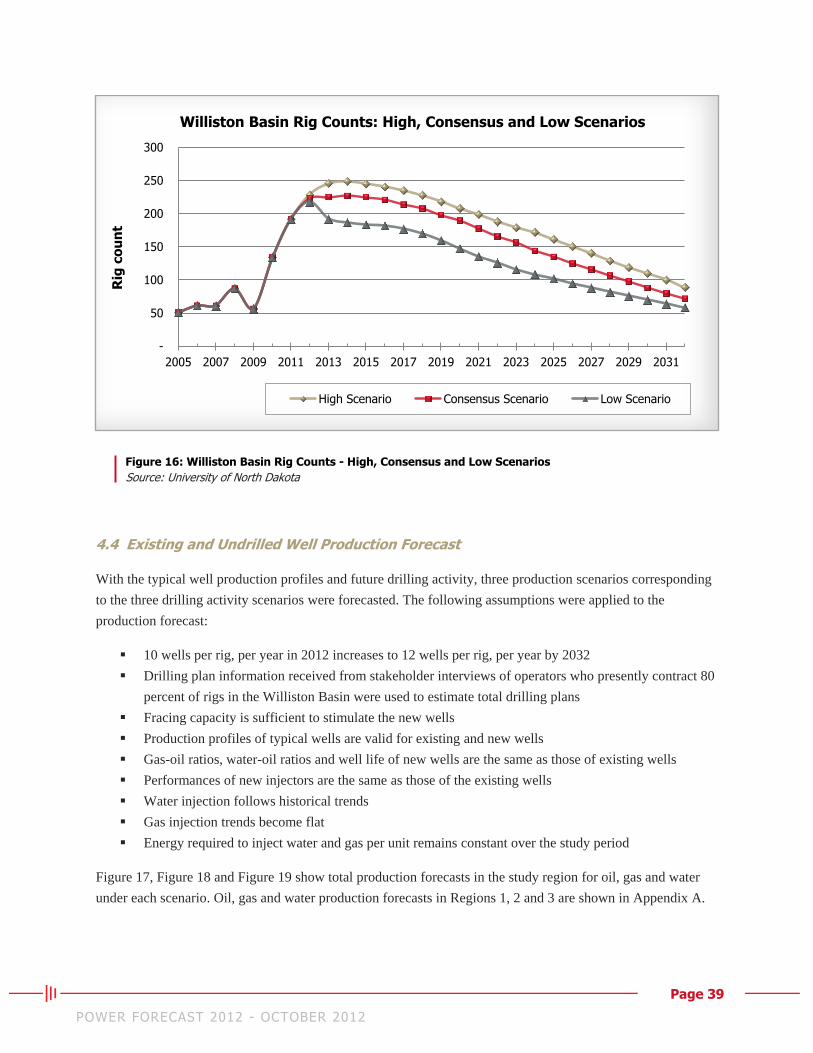
Page 39 POWER FORECAST 2012 - OCTOBER 2012
Figure 16: Williston Basin Rig Counts - High, Consensus and Low Scenarios
Source: University of North Dakota
4.4 Existing and Undrilled Well Production Forecast
With the typical well production profiles and future drilling activity, three production scenarios corresponding
to the three drilling activity scenarios were forecasted. The following assumptions were applied to the
production forecast:
10 wells per rig, per year in 2012 increases to 12 wells per rig, per year by 2032
Drilling plan information received from stakeholder interviews of operators who presently contract 80
percent of rigs in the Williston Basin were used to estimate total drilling plans
Fracing capacity is sufficient to stimulate the new wells
Production profiles of typical wells are valid for existing and new wells
Gas-oil ratios, water-oil ratios and well life of new wells are the same as those of existing wells
Performances of new injectors are the same as those of the existing wells
Water injection follows historical trends
Gas injection trends become flat
Energy required to inject water and gas per unit remains constant over the study period
Figure 17, Figure 18 and Figure 19 show total production forecasts in the study region for oil, gas and water
under each scenario. Oil, gas and water production forecasts in Regions 1, 2 and 3 are shown in Appendix A.
-
50
100
150
200
250
300
2005 2007 2009 2011 2013 2015 2017 2019 2021 2023 2025 2027 2029 2031
Rig
co
un
t Williston Basin Rig Counts: High, Consensus and Low Scenarios
High Scenario Consensus Scenario Low Scenario
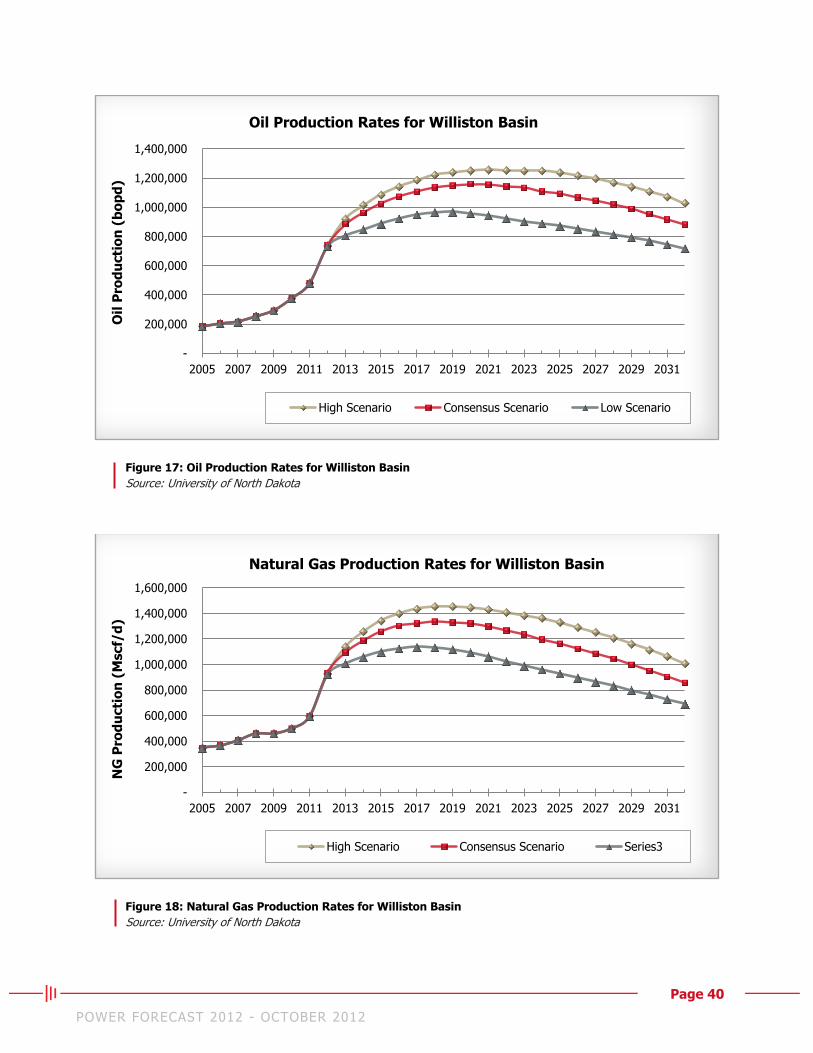
Page 40 POWER FORECAST 2012 - OCTOBER 2012
Figure 17: Oil Production Rates for Williston Basin
Source: University of North Dakota
Figure 18: Natural Gas Production Rates for Williston Basin
Source: University of North Dakota
-
200,000
400,000
600,000
800,000
1,000,000
1,200,000
1,400,000
2005 2007 2009 2011 2013 2015 2017 2019 2021 2023 2025 2027 2029 2031
Oil
Pro
du
cti
on
(b
op
d)
Oil Production Rates for Williston Basin
High Scenario Consensus Scenario Low Scenario
-
200,000
400,000
600,000
800,000
1,000,000
1,200,000
1,400,000
1,600,000
2005 2007 2009 2011 2013 2015 2017 2019 2021 2023 2025 2027 2029 2031
NG
Pro
du
cti
on
(M
scf/
d)
Natural Gas Production Rates for Williston Basin
High Scenario Consensus Scenario Series3
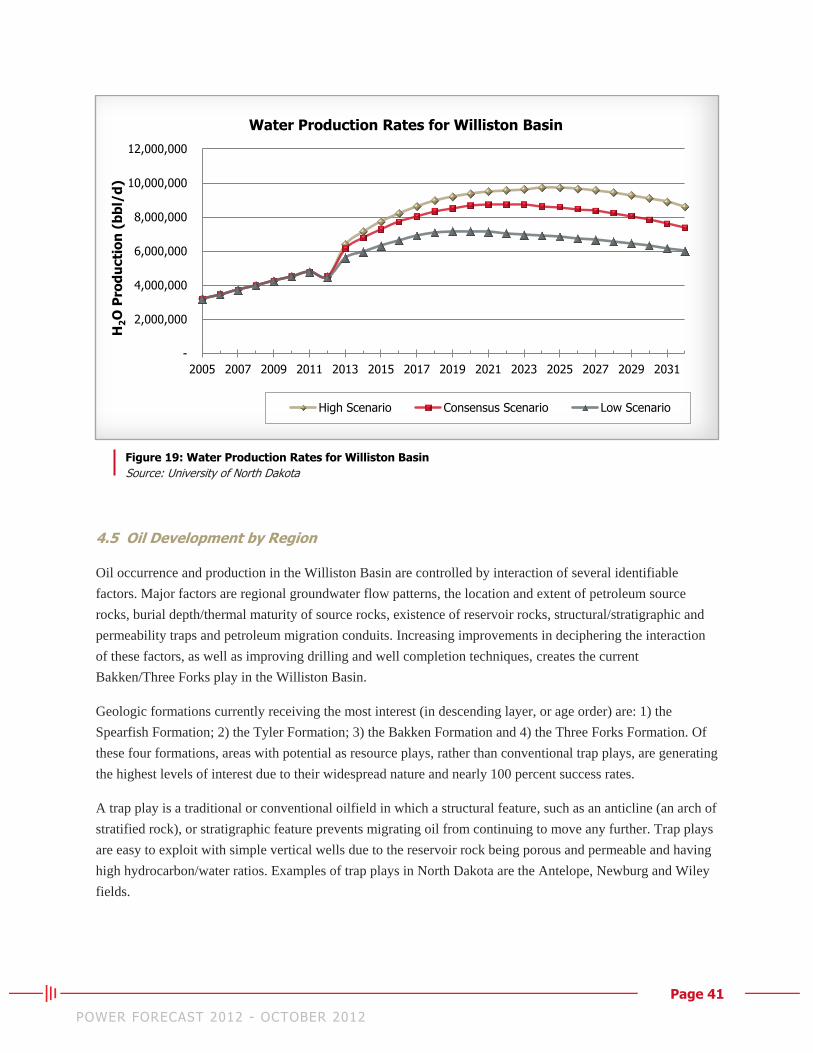
Page 41 POWER FORECAST 2012 - OCTOBER 2012
Figure 19: Water Production Rates for Williston Basin Source: University of North Dakota
4.5 Oil Development by Region
Oil occurrence and production in the Williston Basin are controlled by interaction of several identifiable
factors. Major factors are regional groundwater flow patterns, the location and extent of petroleum source
rocks, burial depth/thermal maturity of source rocks, existence of reservoir rocks, structural/stratigraphic and
permeability traps and petroleum migration conduits. Increasing improvements in deciphering the interaction
of these factors, as well as improving drilling and well completion techniques, creates the current
Bakken/Three Forks play in the Williston Basin.
Geologic formations currently receiving the most interest (in descending layer, or age order) are: 1) the
Spearfish Formation; 2) the Tyler Formation; 3) the Bakken Formation and 4) the Three Forks Formation. Of
these four formations, areas with potential as resource plays, rather than conventional trap plays, are generating
the highest levels of interest due to their widespread nature and nearly 100 percent success rates.
A trap play is a traditional or conventional oilfield in which a structural feature, such as an anticline (an arch of
stratified rock), or stratigraphic feature prevents migrating oil from continuing to move any further. Trap plays
are easy to exploit with simple vertical wells due to the reservoir rock being porous and permeable and having
high hydrocarbon/water ratios. Examples of trap plays in North Dakota are the Antelope, Newburg and Wiley
fields.
-
2,000,000
4,000,000
6,000,000
8,000,000
10,000,000
12,000,000
2005 2007 2009 2011 2013 2015 2017 2019 2021 2023 2025 2027 2029 2031
H2O
Pro
du
cti
on
(b
bl/
d)
Water Production Rates for Williston Basin
High Scenario Consensus Scenario Low Scenario
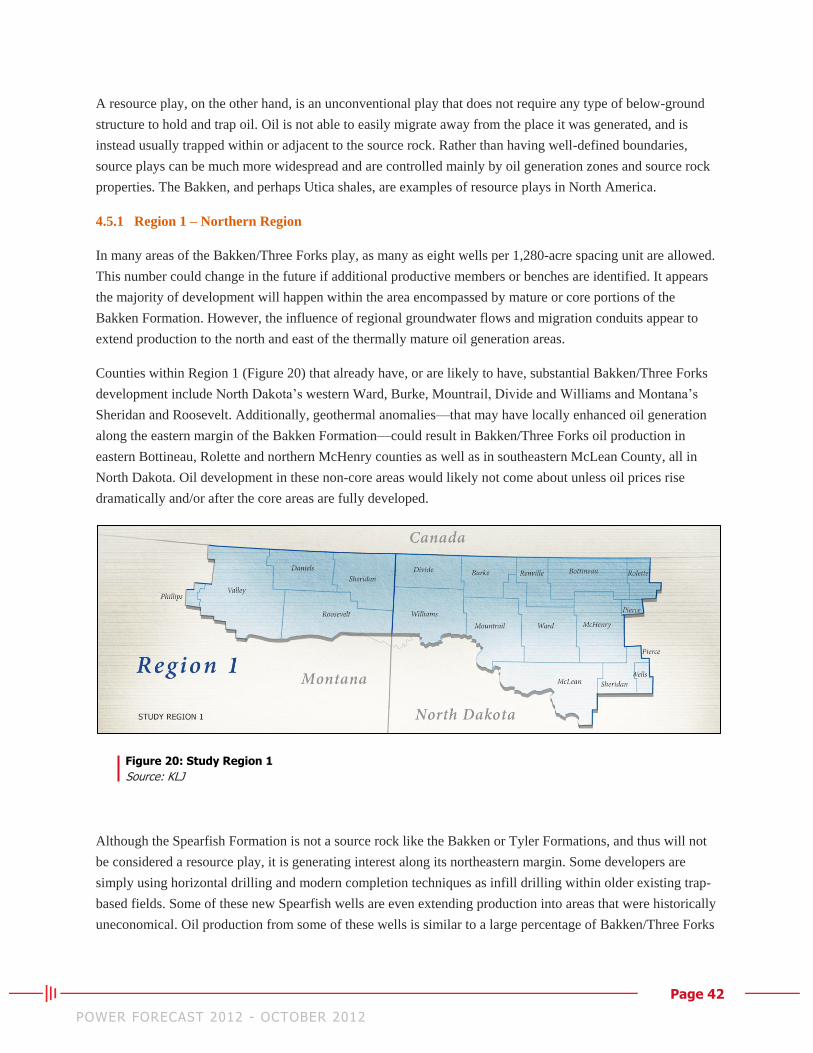
Page 42 POWER FORECAST 2012 - OCTOBER 2012
A resource play, on the other hand, is an unconventional play that does not require any type of below-ground
structure to hold and trap oil. Oil is not able to easily migrate away from the place it was generated, and is
instead usually trapped within or adjacent to the source rock. Rather than having well-defined boundaries,
source plays can be much more widespread and are controlled mainly by oil generation zones and source rock
properties. The Bakken, and perhaps Utica shales, are examples of resource plays in North America.
4.5.1 Region 1 – Northern Region
In many areas of the Bakken/Three Forks play, as many as eight wells per 1,280-acre spacing unit are allowed.
This number could change in the future if additional productive members or benches are identified. It appears
the majority of development will happen within the area encompassed by mature or core portions of the
Bakken Formation. However, the influence of regional groundwater flows and migration conduits appear to
extend production to the north and east of the thermally mature oil generation areas.
Counties within Region 1 (Figure 20) that already have, or are likely to have, substantial Bakken/Three Forks
development include North Dakota’s western Ward, Burke, Mountrail, Divide and Williams and Montana’s
Sheridan and Roosevelt. Additionally, geothermal anomalies—that may have locally enhanced oil generation
along the eastern margin of the Bakken Formation—could result in Bakken/Three Forks oil production in
eastern Bottineau, Rolette and northern McHenry counties as well as in southeastern McLean County, all in
North Dakota. Oil development in these non-core areas would likely not come about unless oil prices rise
dramatically and/or after the core areas are fully developed.
Figure 20: Study Region 1
Source: KLJ
Although the Spearfish Formation is not a source rock like the Bakken or Tyler Formations, and thus will not
be considered a resource play, it is generating interest along its northeastern margin. Some developers are
simply using horizontal drilling and modern completion techniques as infill drilling within older existing trap-
based fields. Some of these new Spearfish wells are even extending production into areas that were historically
uneconomical. Oil production from some of these wells is similar to a large percentage of Bakken/Three Forks
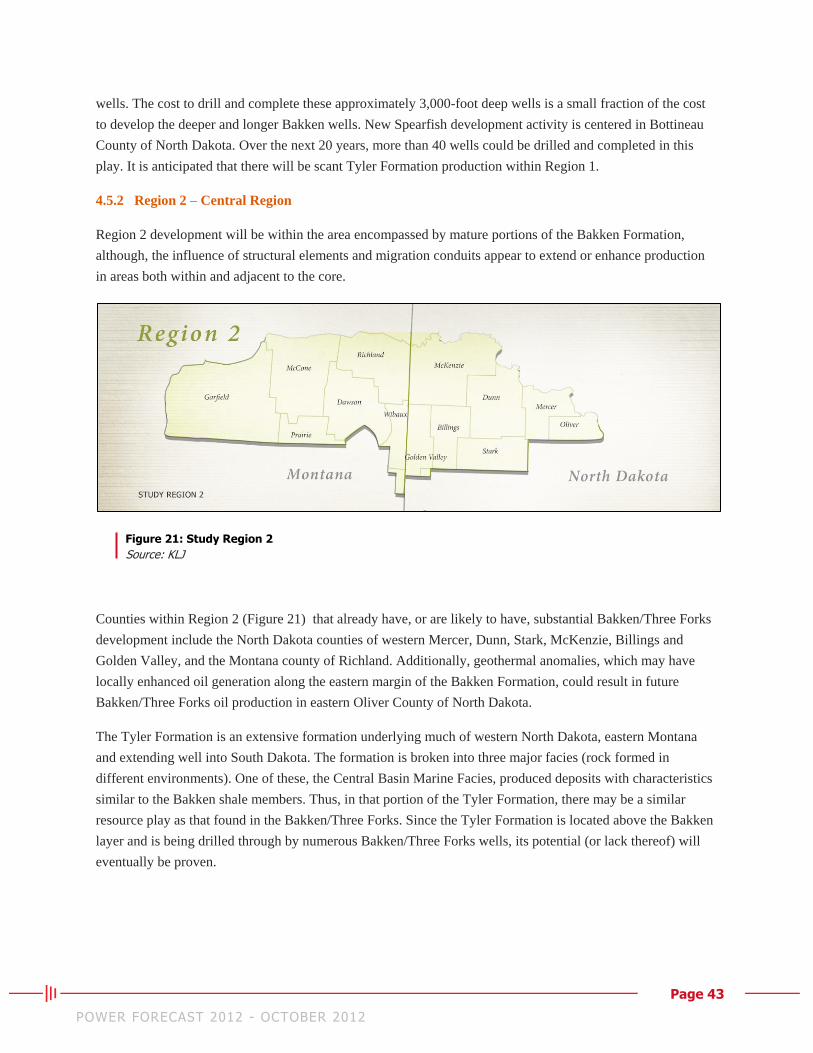
Page 43 POWER FORECAST 2012 - OCTOBER 2012
wells. The cost to drill and complete these approximately 3,000-foot deep wells is a small fraction of the cost
to develop the deeper and longer Bakken wells. New Spearfish development activity is centered in Bottineau
County of North Dakota. Over the next 20 years, more than 40 wells could be drilled and completed in this
play. It is anticipated that there will be scant Tyler Formation production within Region 1.
4.5.2 Region 2 – Central Region
Region 2 development will be within the area encompassed by mature portions of the Bakken Formation,
although, the influence of structural elements and migration conduits appear to extend or enhance production
in areas both within and adjacent to the core.
Figure 21: Study Region 2
Source: KLJ
Counties within Region 2 (Figure 21) that already have, or are likely to have, substantial Bakken/Three Forks
development include the North Dakota counties of western Mercer, Dunn, Stark, McKenzie, Billings and
Golden Valley, and the Montana county of Richland. Additionally, geothermal anomalies, which may have
locally enhanced oil generation along the eastern margin of the Bakken Formation, could result in future
Bakken/Three Forks oil production in eastern Oliver County of North Dakota.
The Tyler Formation is an extensive formation underlying much of western North Dakota, eastern Montana
and extending well into South Dakota. The formation is broken into three major facies (rock formed in
different environments). One of these, the Central Basin Marine Facies, produced deposits with characteristics
similar to the Bakken shale members. Thus, in that portion of the Tyler Formation, there may be a similar
resource play as that found in the Bakken/Three Forks. Since the Tyler Formation is located above the Bakken
layer and is being drilled through by numerous Bakken/Three Forks wells, its potential (or lack thereof) will
eventually be proven.
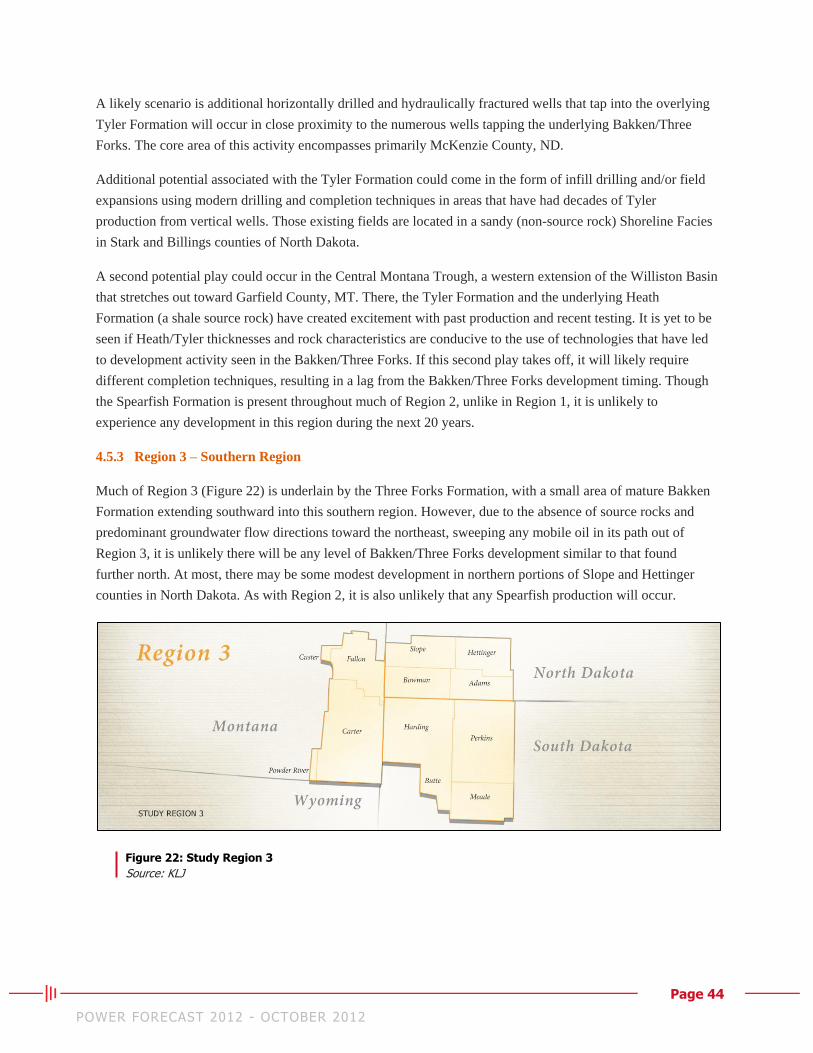
Page 44 POWER FORECAST 2012 - OCTOBER 2012
A likely scenario is additional horizontally drilled and hydraulically fractured wells that tap into the overlying
Tyler Formation will occur in close proximity to the numerous wells tapping the underlying Bakken/Three
Forks. The core area of this activity encompasses primarily McKenzie County, ND.
Additional potential associated with the Tyler Formation could come in the form of infill drilling and/or field
expansions using modern drilling and completion techniques in areas that have had decades of Tyler
production from vertical wells. Those existing fields are located in a sandy (non-source rock) Shoreline Facies
in Stark and Billings counties of North Dakota.
A second potential play could occur in the Central Montana Trough, a western extension of the Williston Basin
that stretches out toward Garfield County, MT. There, the Tyler Formation and the underlying Heath
Formation (a shale source rock) have created excitement with past production and recent testing. It is yet to be
seen if Heath/Tyler thicknesses and rock characteristics are conducive to the use of technologies that have led
to development activity seen in the Bakken/Three Forks. If this second play takes off, it will likely require
different completion techniques, resulting in a lag from the Bakken/Three Forks development timing. Though
the Spearfish Formation is present throughout much of Region 2, unlike in Region 1, it is unlikely to
experience any development in this region during the next 20 years.
4.5.3 Region 3 – Southern Region
Much of Region 3 (Figure 22) is underlain by the Three Forks Formation, with a small area of mature Bakken
Formation extending southward into this southern region. However, due to the absence of source rocks and
predominant groundwater flow directions toward the northeast, sweeping any mobile oil in its path out of
Region 3, it is unlikely there will be any level of Bakken/Three Forks development similar to that found
further north. At most, there may be some modest development in northern portions of Slope and Hettinger
counties in North Dakota. As with Region 2, it is also unlikely that any Spearfish production will occur.
Figure 22: Study Region 3
Source: KLJ

Page 45 POWER FORECAST 2012 - OCTOBER 2012
While there has been extensive development of the Ordovician Age Red River Formation throughout much of
Region 3, none of the formations of focus in this report—with the exception of the Tyler Formation—have
shown production within Region 3. Oil production from the Tyler Formation in Region 3 has been limited to a
small area in the northeastern part of Slope County, ND, however, the Tyler Coastal/Deltaic Plains Facies
produced deposits that may be suitable as both a source rock and potential resource play.
The primary area for a Tyler Formation resource play in Region 3 may be found in Slope and Hettinger
counties in North Dakota. If so, it would likely require much higher oil prices and/or completion of the
Bakken/Three Forks development to warrant exploration and development for oil in this area.
4.6 Drilling Rig Efficiency
Advancements in technology and management optimization will increase rig efficiency and/or reduce rig time
for each well drilled. This is based on the assumption that well geometry and reservoir properties remain the
same. Total rig time, from drilling to completion, includes rig mobilization, rig-up, drilling, completion,
demobilization, maintenance and nonproductive time due to downhole problems. Well stimulation, such as
fracing, is performed by a fracing rig and is not counted toward rig time.
This report assumes the average number of wells drilled in a single pad in the previous five years will increase
over the next 20 years as drilling multi-well pads increase. Operators have implemented a batch drilling
campaign to reduce moving and rig-up times in the Williston Basin. Despite this, no significant improvement
in moving rigs between wellheads in the same pad or to different pads is expected. The percentage reduction in
moving and rig-up times is expected to be less than 10 percent over the next 20 years.
The unconventional nature of the Bakken Formation creates a longer learning curve than a conventional
reservoir. The high uncertainty in the reservoir’s properties is also an obstacle to improving drilling times.
The lateral lengths of existing horizontal wells in North Dakota are expected to continue to increase to retain
an oil rate that economically justifies the initial costs. Some of the existing rigs in the Williston Basin will need
upgrading before drilling the longer lateral length wells.
Rig efficiencies in North Dakota from 1998 to 2011 are shown in Figure 23. The decline in yearly wells drilled
per rig from 2005 to 2011, in comparison with the data from 1998 to 2004, is the result of an increase in the
overall percentage of horizontal wells. The average rig efficiency during the 2005 to 2011 period is 8.8 wells
drilled each year per rig. An analysis of the factors and information gained from stakeholder interviews
resulted in a forecast of an increase from 10 wells per rig, per year in 2012, to 12 wells per rig per year at the
end of the study period in 2032.
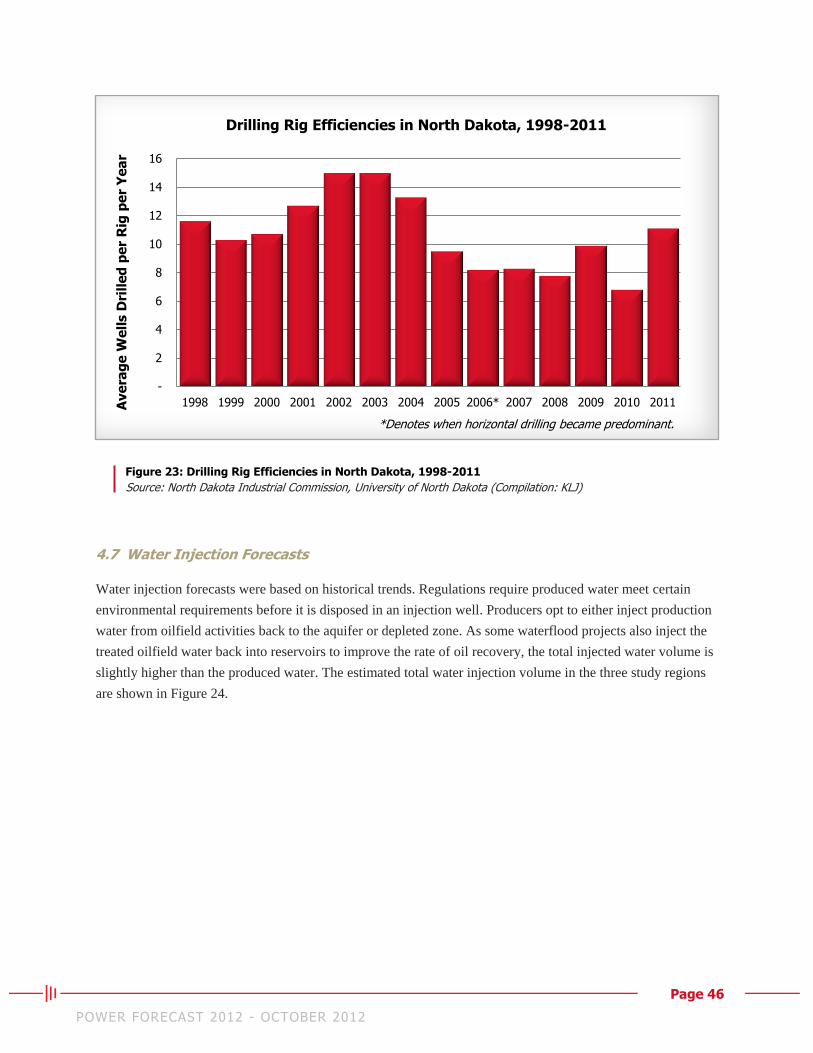
Page 46 POWER FORECAST 2012 - OCTOBER 2012
Figure 23: Drilling Rig Efficiencies in North Dakota, 1998-2011
Source: North Dakota Industrial Commission, University of North Dakota (Compilation: KLJ)
4.7 Water Injection Forecasts
Water injection forecasts were based on historical trends. Regulations require produced water meet certain
environmental requirements before it is disposed in an injection well. Producers opt to either inject production
water from oilfield activities back to the aquifer or depleted zone. As some waterflood projects also inject the
treated oilfield water back into reservoirs to improve the rate of oil recovery, the total injected water volume is
slightly higher than the produced water. The estimated total water injection volume in the three study regions
are shown in Figure 24.
-
2
4
6
8
10
12
14
16
1998 1999 2000 2001 2002 2003 2004 2005 2006* 2007 2008 2009 2010 2011Ave
rag
e W
ell
s D
rill
ed
pe
r R
ig p
er
Ye
ar
Drilling Rig Efficiencies in North Dakota, 1998-2011
*Denotes when horizontal drilling became predominant.
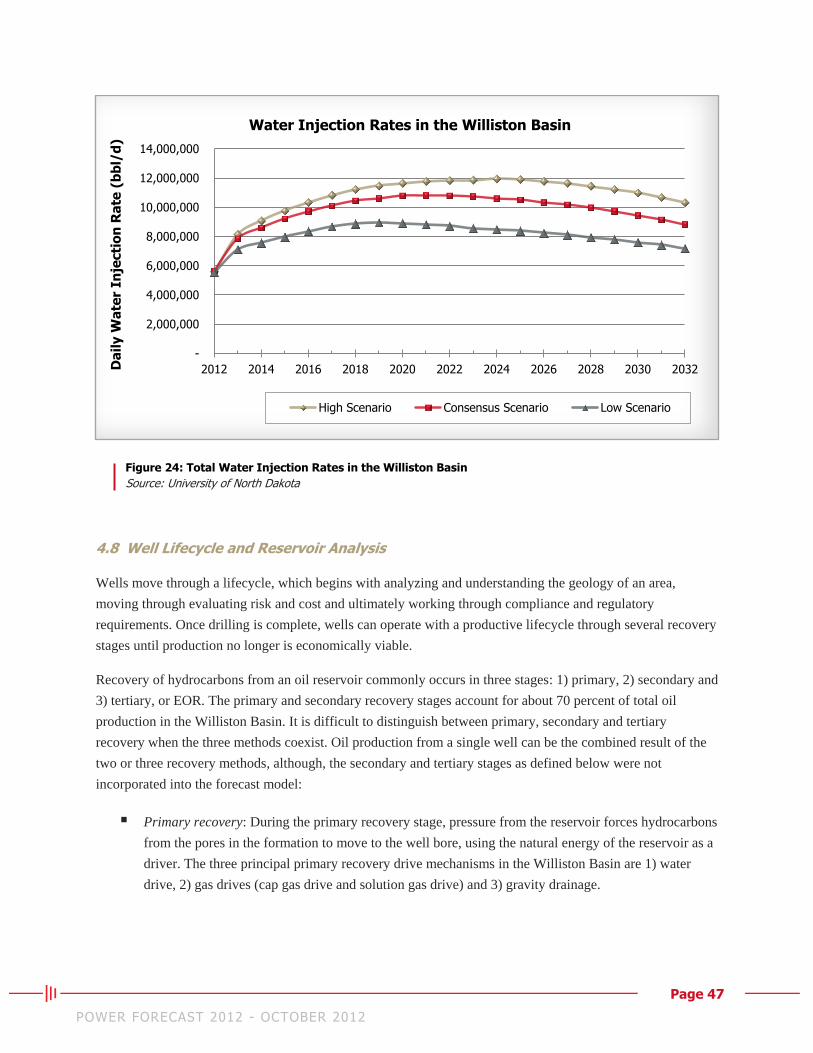
Page 47 POWER FORECAST 2012 - OCTOBER 2012
Figure 24: Total Water Injection Rates in the Williston Basin
Source: University of North Dakota
4.8 Well Lifecycle and Reservoir Analysis
Wells move through a lifecycle, which begins with analyzing and understanding the geology of an area,
moving through evaluating risk and cost and ultimately working through compliance and regulatory
requirements. Once drilling is complete, wells can operate with a productive lifecycle through several recovery
stages until production no longer is economically viable.
Recovery of hydrocarbons from an oil reservoir commonly occurs in three stages: 1) primary, 2) secondary and
3) tertiary, or EOR. The primary and secondary recovery stages account for about 70 percent of total oil
production in the Williston Basin. It is difficult to distinguish between primary, secondary and tertiary
recovery when the three methods coexist. Oil production from a single well can be the combined result of the
two or three recovery methods, although, the secondary and tertiary stages as defined below were not
incorporated into the forecast model:
Primary recovery: During the primary recovery stage, pressure from the reservoir forces hydrocarbons
from the pores in the formation to move to the well bore, using the natural energy of the reservoir as a
driver. The three principal primary recovery drive mechanisms in the Williston Basin are 1) water
drive, 2) gas drives (cap gas drive and solution gas drive) and 3) gravity drainage.
-
2,000,000
4,000,000
6,000,000
8,000,000
10,000,000
12,000,000
14,000,000
2012 2014 2016 2018 2020 2022 2024 2026 2028 2030 2032Da
ily W
ate
r In
jecti
on
Ra
te (
bb
l/d
) Water Injection Rates in the Williston Basin
High Scenario Consensus Scenario Low Scenario
Page 48 POWER FORECAST 2012 - OCTOBER 2012
Secondary recovery: This is the stage of hydrocarbon production when an external fluid, such as water
or gas is injected into reservoirs that have fluid communication with production wells. Water and gas
injections act to maintain reservoir pressure and displace hydrocarbons toward the wellbore. The most
common secondary recovery techniques are gas injection and water flooding, where gas is injected
into the gas cap and water is injected into the production zone to sweep oil from the reservoir.
Secondary recovery stage reaches its limit when injected fluid (water or gas) is produced in
considerable amounts from the production well and production is no longer economical. The
successive use of primary recovery and secondary recovery in an oil reservoir produces about 15 to 40
percent of the original oil in place (OOIP). The waterflooding and high-pressure air injection recovery
methods currently being implemented in the Williston Basin are included as part of the current load
modeling. As secondary recovery techniques come online, they will be included in future forecast
modeling.
Tertiary recovery: Tertiary recovery, or EOR, covers gas injection, chemical injection, microbial
injection and thermal recovery. In the Williston Basin, CO2 EOR projects have been successful in
recovering substantial volumes of oil. The tertiary recovery methods that account for approximately
30 percent of current oil production in the Williston Basin are included as part of the 2012 load
modeling. As tertiary recovery techniques come online, they will be included in future forecast
modeling.
Economically, a well’s life ends when revenue from production cannot cover cost. A well’s life can also end
due to mechanical problems, low reservoir potential, wellbore collapse, excessive water production or simply
lease expiration. After reviewing geological and petroleum engineering data in the Williston Basin and
identifying the reservoir model by integrating geological and engineering interpretations, it was determined
that well lifecycles will vary within the study region. Wells in North Dakota and Montana have an approximate
25-year lifecycle, 10 years longer than South Dakota wells, which have an approximate 15-year lifecycle.
A well lifecycle alone is not enough to define the total production of a well. The annual production rate
accounts for the remainder. Production rate is controlled by reservoir pressure, reservoir size, drive
mechanism, rock and fluid properties, heterogeneity of reservoir, well spacing, well geometry, recovery
method and reservoir energy measurement. Oil and gas production rates decline as a function of time. Loss of
reservoir pressure or changing relative volume of produced fluids is usually the cause.
Fitting a line through performance history and assuming this same line trends similarly into the future forms
the basis for the decline curve analysis concept. Historical production and injection data was analyzed to
identify effects and construct three typical well production profiles through their expected lifecycles for the
study region with a non-linear regression method. Figure 25 shows the production profiles of typical wells in
North Dakota, Montana and South Dakota. All three drop in production and follow a curve decline, indicating
the typical reservoir performance of shale oil.
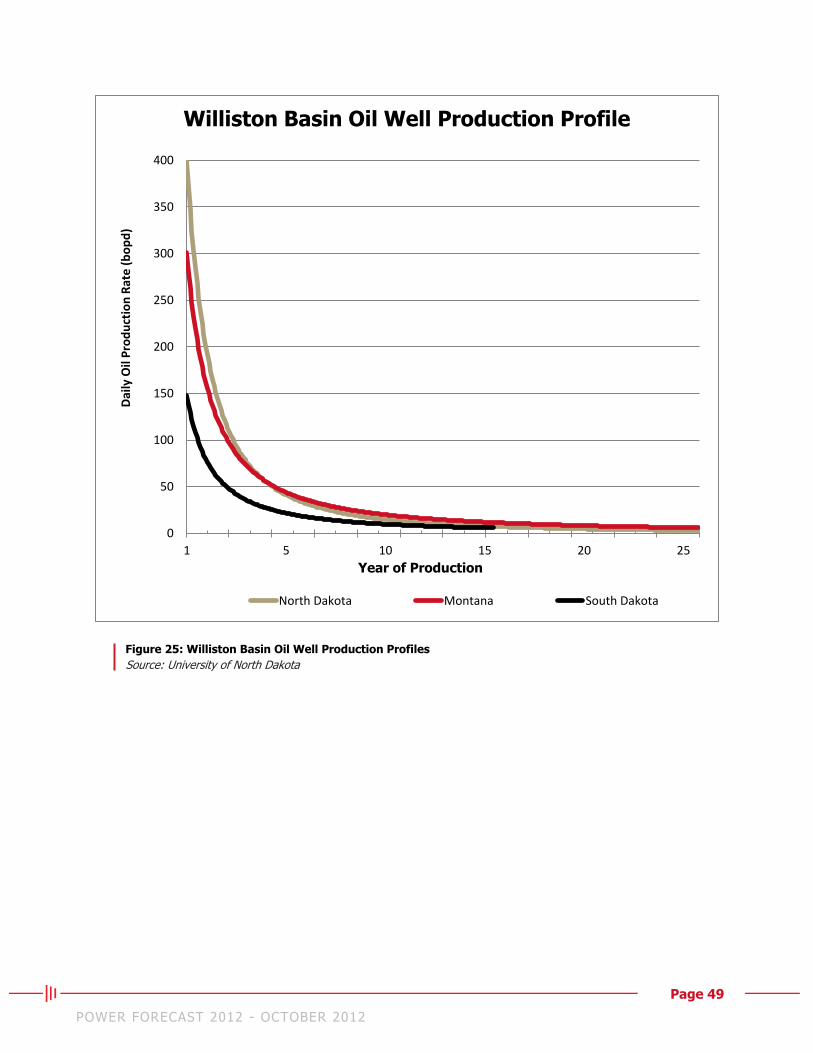
Page 49 POWER FORECAST 2012 - OCTOBER 2012
Figure 25: Williston Basin Oil Well Production Profiles
Source: University of North Dakota
0
50
100
150
200
250
300
350
400
1 5 10 15 20 25
Dai
ly O
il P
rod
uct
ion
Rat
e (
bo
pd
) Williston Basin Oil Well Production Profile
North Dakota Montana South Dakota
Year of Production
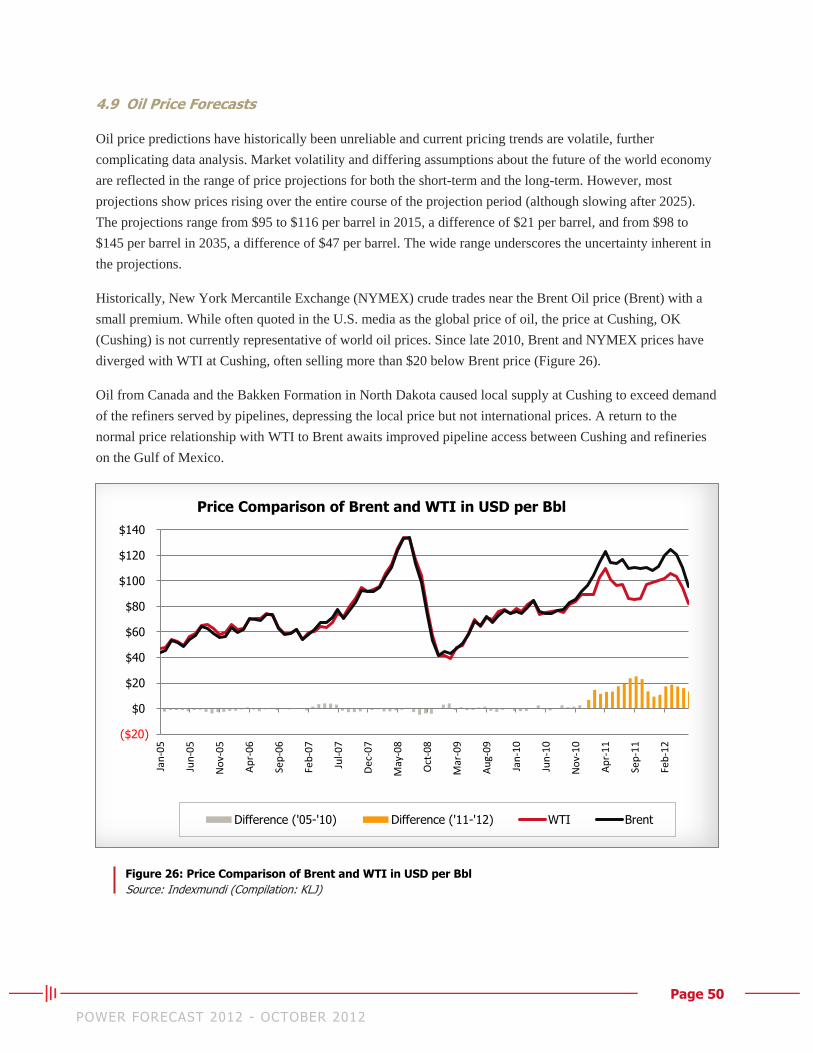
Page 50 POWER FORECAST 2012 - OCTOBER 2012
4.9 Oil Price Forecasts
Oil price predictions have historically been unreliable and current pricing trends are volatile, further
complicating data analysis. Market volatility and differing assumptions about the future of the world economy
are reflected in the range of price projections for both the short-term and the long-term. However, most
projections show prices rising over the entire course of the projection period (although slowing after 2025).
The projections range from $95 to $116 per barrel in 2015, a difference of $21 per barrel, and from $98 to
$145 per barrel in 2035, a difference of $47 per barrel. The wide range underscores the uncertainty inherent in
the projections.
Historically, New York Mercantile Exchange (NYMEX) crude trades near the Brent Oil price (Brent) with a
small premium. While often quoted in the U.S. media as the global price of oil, the price at Cushing, OK
(Cushing) is not currently representative of world oil prices. Since late 2010, Brent and NYMEX prices have
diverged with WTI at Cushing, often selling more than $20 below Brent price (Figure 26).
Oil from Canada and the Bakken Formation in North Dakota caused local supply at Cushing to exceed demand
of the refiners served by pipelines, depressing the local price but not international prices. A return to the
normal price relationship with WTI to Brent awaits improved pipeline access between Cushing and refineries
on the Gulf of Mexico.
Figure 26: Price Comparison of Brent and WTI in USD per Bbl
Source: Indexmundi (Compilation: KLJ)
($20)
$0
$20
$40
$60
$80
$100
$120
$140
Jan
-05
Jun
-05
No
v-0
5
Ap
r-0
6
Sep
-06
Feb
-07
Jul-
07
Dec
-07
May
-08
Oct
-08
Mar
-09
Au
g-0
9
Jan
-10
Jun
-10
No
v-1
0
Ap
r-1
1
Sep
-11
Feb
-12
Price Comparison of Brent and WTI in USD per Bbl
Difference ('05-'10) Difference ('11-'12) WTI Brent
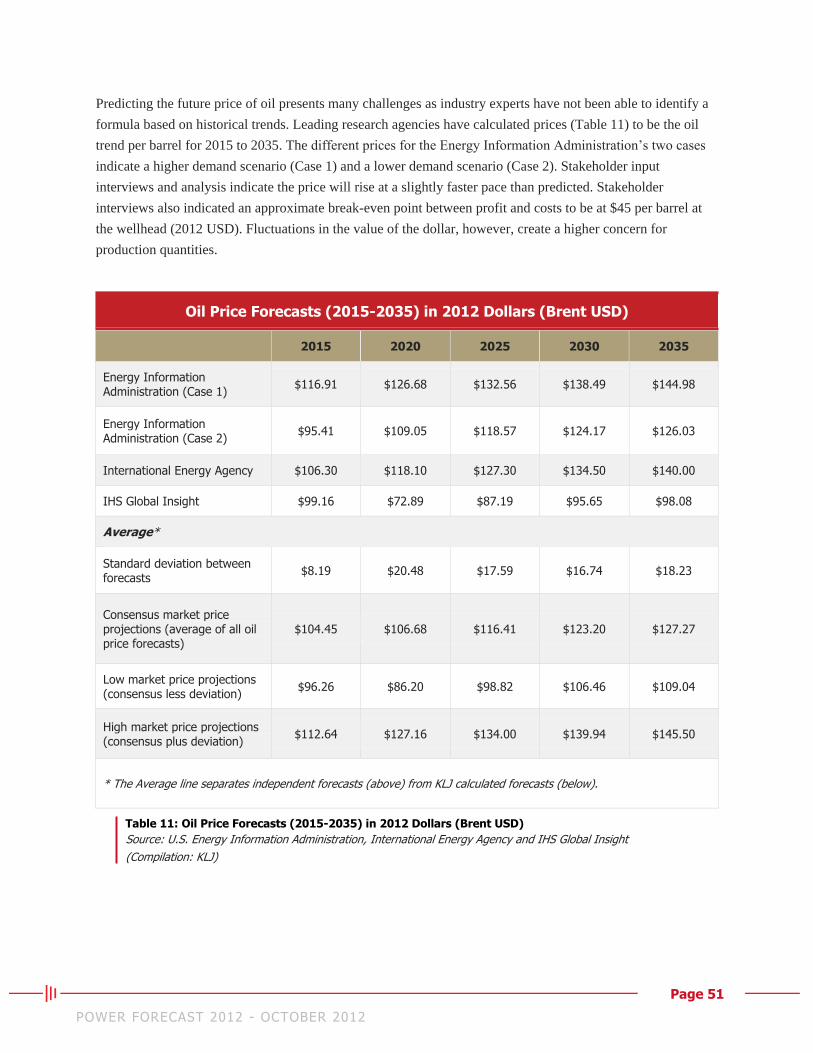
Page 51 POWER FORECAST 2012 - OCTOBER 2012
Predicting the future price of oil presents many challenges as industry experts have not been able to identify a
formula based on historical trends. Leading research agencies have calculated prices (Table 11) to be the oil
trend per barrel for 2015 to 2035. The different prices for the Energy Information Administration’s two cases
indicate a higher demand scenario (Case 1) and a lower demand scenario (Case 2). Stakeholder input
interviews and analysis indicate the price will rise at a slightly faster pace than predicted. Stakeholder
interviews also indicated an approximate break-even point between profit and costs to be at $45 per barrel at
the wellhead (2012 USD). Fluctuations in the value of the dollar, however, create a higher concern for
production quantities.
Oil Price Forecasts (2015-2035) in 2012 Dollars (Brent USD)
2015 2020 2025 2030 2035
Energy Information Administration (Case 1)
$116.91 $126.68 $132.56 $138.49 $144.98
Energy Information Administration (Case 2)
$95.41 $109.05 $118.57 $124.17 $126.03
International Energy Agency $106.30 $118.10 $127.30 $134.50 $140.00
IHS Global Insight $99.16 $72.89 $87.19 $95.65 $98.08
Average*
Standard deviation between forecasts
$8.19 $20.48 $17.59 $16.74 $18.23
Consensus market price projections (average of all oil price forecasts)
$104.45 $106.68 $116.41 $123.20 $127.27
Low market price projections (consensus less deviation)
$96.26 $86.20 $98.82 $106.46 $109.04
High market price projections (consensus plus deviation)
$112.64 $127.16 $134.00 $139.94 $145.50
* The Average line separates independent forecasts (above) from KLJ calculated forecasts (below).
Table 11: Oil Price Forecasts (2015-2035) in 2012 Dollars (Brent USD)
Source: U.S. Energy Information Administration, International Energy Agency and IHS Global Insight
(Compilation: KLJ)
Page 52 POWER FORECAST 2012 - OCTOBER 2012
Global oil supply capacity is growing at unprecedented levels and U.S. oil output is a primary factor for this
change. The development of more than 20 tight shale oil formations will result in a dramatic increase in overall
oil supply. A recent Harvard study suggest that as much as 17 trillion barrels of oil remains in the ground
globally from conventional and unconventional sources.
While transportation is lacking to move these resources, the low cost of extraction allows profitability at lower
price points.
4.9.1 Current Limitations for Bakken Crude
Since 2009, production from the Bakken Formation has increased drastically, inciting the Bloomberg Report to
include Bakken crude in its crude oil spot pricing report. In the trending history of oil prices, WTI had closely
mirrored Brent, however, due to global supply issues in 2010, Brent pulled ahead of WTI.
Historically, Bakken crude has sold at a discount when compared against WTI crude. The discount can
fluctuate from $11 to $22 (or roughly a 10 to 25 percent discount). The majority of this discount can be
attributed to pipeline capacity issues, but other factors, such as buyer preference and contractual obligations,
can also directly impact the price for Bakken crude oil.
Some contributing factors to the price variance between Bakken crude, WTI and Brent include:
Pipeline inefficiencies: Current lack of pipeline infrastructure in the Williston Basin increases costs for
transportation to refineries, as most of the crude oil has to be transported by rail or truck
Sweet crude stockpile: Refinery capacity issues, combined with increased production, have created an
overabundance of sweet crude reserve supply
Refinery preference: U.S. refineries are configured to process heavy crude rather than domestic sweet
crude, therefore they receive lower margins when processing sweet crude
Additional shale formations: Producer production efforts are migrating to other shale formations such
as the Eagle Ford in Texas and the Niobrara in Colorado
U.S. trade agreements: The U.S. cannot export crude with 55 or higher American Petroleum density to
other countries
Page 53 POWER FORECAST 2012 - OCTOBER 2012
4.10 Oil Price Forecasts and Impacts to Electric Load
To assist the Partners in providing adequate electric supply without overbuilding infrastructure, low, consensus
and high market scenarios on oil prices were developed.
4.10.1 Low Market Scenario
Assumption: Bakken crude margins decrease to a break-even point and price per barrel remains substantially
lower than current levels.
Producers will maintain drilling to hold leases in productive fields
Producers will continue to follow established drilling plans drilling in-fill wells
Drilling rate remains the same
Cost to drill decreases due to competitive services market
Drilling rig count remains below 175 (less than 2,000 wells per year) as long as oil prices remain at a
theoretical low
Wildcat (drilling in new areas/fields) rigs decrease substantially
Drilling rigs continue to focus on proven profitable areas
Drilling rigs in less profitable areas will relocate or be idled
Only newer more productive rigs will be utilized
Producers will stop pumping low production wells (wells producing less than 25 bopd)
Producers will pump just enough to meet contractual obligations
Producers will rotate between wells to maintain a monthly level of production
Exploration crews and related infrastructure will decrease
Seismic and related staffing decreases
Wells will use less overall energy as they produce just enough to remain active
Peaking demand from an individual well will remain the same and energy usage will be reduced
as pumps cycle, ultimately reducing the load factor of the well
Housing constraints are mitigated in the near-term
Secondary job growth and base employment growth approach normal levels mid-way through the
planning period of 2012 to 2032
Longevity of temporary workforce presence is reduced
Page 54 POWER FORECAST 2012 - OCTOBER 2012
4.10.2 Consensus Market Scenario
Assumption: Bakken crude profit margins maintain the equivalent of 2012 levels.
Drilling will remain at 2012 levels for the next several years, rig counts will remain near 200
About 2,000 wells will be completed annually for the next several years
Production activity will remain at 2012 rates
Wildcat or speculative drilling will remain at current levels
Drilling activity will focus on proven fields in North Dakota and eastern Montana
Housing constraints remain for several years
Constraints reduce the rate of secondary job growth
Constraints hold back growth of base employment in the short-term
Substantial temporary workforce remains in the industry throughout the next decade
New facilities (such as frac-water treatment and proppant manufacturing) are developed
4.10.3 High Market Scenario
Assumption: Bakken crude margins increase as prices per barrel increase significantly and remain
substantially elevated above 2012 price equivalents.
Lease purchases lead the following indicators:
Rig counts approach 220 in the near-term
o At least 2,400 wells drilled each year
Drilling plans are more aggressive
Wildcatting increases
Drilling in the Three Forks Formation increases
Expansion into Montana and South Dakota
Number of drilling/fracing/seismic exploration crews increases
Number of crew camps increases
Pipeline and support infrastructure increases
Newer technologies (such as EOR, drilling and fracing) are developed, tested and applied at a faster
rate
New facilities (such as frac-water treatment and proppant manufacturing) are developed
Page 55 POWER FORECAST 2012 - OCTOBER 2012
5. Pipelines, Refining and Gas Processing
Rapid increases in crude oil, natural gas and NGL have strained the existing pipeline infrastructure in the
Williston Basin. Insufficient pipeline capacity has restricted refinery, processing and market accessibility. It
has even forced flaring of natural gas and discounted pricing of regionally produced crude oil.
To accommodate projected increases in production levels, the region will require significant additional
pipeline infrastructure over the next several years, and possible expansions and additions of processing and
refining facilities. Limited existing pipeline capacity has led to challenges in the ability to move oil and gas
within the Williston Basin and the ability to export oil and gas out of the Williston Basin.
5.1 Crude Oil Pipelines
The ability to move oil within the basin is crucial as oil from the well sites needs to be moved to a centralized
hub or interconnecting transmission pipeline for transfer to market. Although thousands of miles of gathering
pipeline exist within the region, even more are needed and will be developed as production increases,
incremental export pipeline capacity is provided or the need to decrease truck transport continues.
Equally important to transporting oil within the study area is the ability to export oil out of the region to
market. Few pipelines currently provide export capacity from the Williston Basin, which has forced oil
developers to utilize expensive alternatives, such as rail transportation. However, current pipeline projects
should result in pipeline export capacity out of the Williston Basin reaching 538,000 bopd by the end of 2012.
To meet projected crude oil transportation needs, the study area’s existing pipeline will need to be expanded
and new pipeline will need to be built. Existing crude oil pipelines are as follows:
Enbridge: The Enbridge North Dakota System consists of 330 miles of crude oil gathering and 620
miles of interstate transportation pipeline. The system gathers crude oil from 22 oilfields in North
Dakota and Montana and delivers about 210,000 bopd to Clearbrook, MN, and 25,000 bopd to the
Steelman terminal in Saskatchewan, Canada. Enbridge provides the largest pipeline export capacity
out of the region and is proposing additional expansions to its North Dakota system.
Butte Pipeline: The 16-inch, 323-mile crude oil pipeline begins near Baker, MT, and terminates at
Guernsey, WY. The system gathers crude oil from the Cedar Creek Anticline area near Baker, MT,
and, through various nearby interconnects, transports additional crude from the Williston Basin,
eastern Montana and Canada to Guernsey. Current export capacity from the Williston Basin on the
Butte Pipeline system is 160,000 bopd. Proposed expansion projects, including the Butte Loop, could
potentially provide an additional 110,000 bopd capacity by the end of 2014.
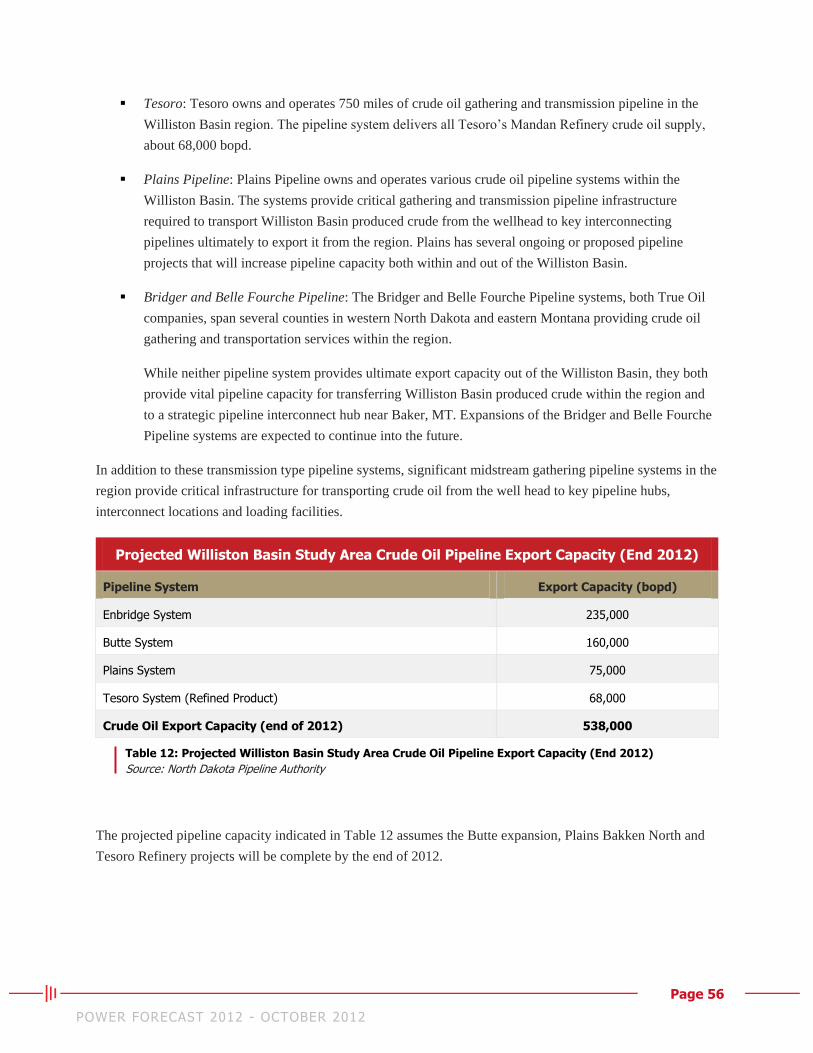
Page 56 POWER FORECAST 2012 - OCTOBER 2012
Tesoro: Tesoro owns and operates 750 miles of crude oil gathering and transmission pipeline in the
Williston Basin region. The pipeline system delivers all Tesoro’s Mandan Refinery crude oil supply,
about 68,000 bopd.
Plains Pipeline: Plains Pipeline owns and operates various crude oil pipeline systems within the
Williston Basin. The systems provide critical gathering and transmission pipeline infrastructure
required to transport Williston Basin produced crude from the wellhead to key interconnecting
pipelines ultimately to export it from the region. Plains has several ongoing or proposed pipeline
projects that will increase pipeline capacity both within and out of the Williston Basin.
Bridger and Belle Fourche Pipeline: The Bridger and Belle Fourche Pipeline systems, both True Oil
companies, span several counties in western North Dakota and eastern Montana providing crude oil
gathering and transportation services within the region.
While neither pipeline system provides ultimate export capacity out of the Williston Basin, they both
provide vital pipeline capacity for transferring Williston Basin produced crude within the region and
to a strategic pipeline interconnect hub near Baker, MT. Expansions of the Bridger and Belle Fourche
Pipeline systems are expected to continue into the future.
In addition to these transmission type pipeline systems, significant midstream gathering pipeline systems in the
region provide critical infrastructure for transporting crude oil from the well head to key pipeline hubs,
interconnect locations and loading facilities.
Projected Williston Basin Study Area Crude Oil Pipeline Export Capacity (End 2012)
Pipeline System Export Capacity (bopd)
Enbridge System 235,000
Butte System 160,000
Plains System 75,000
Tesoro System (Refined Product) 68,000
Crude Oil Export Capacity (end of 2012) 538,000
Table 12: Projected Williston Basin Study Area Crude Oil Pipeline Export Capacity (End 2012)
Source: North Dakota Pipeline Authority
The projected pipeline capacity indicated in Table 12 assumes the Butte expansion, Plains Bakken North and
Tesoro Refinery projects will be complete by the end of 2012.
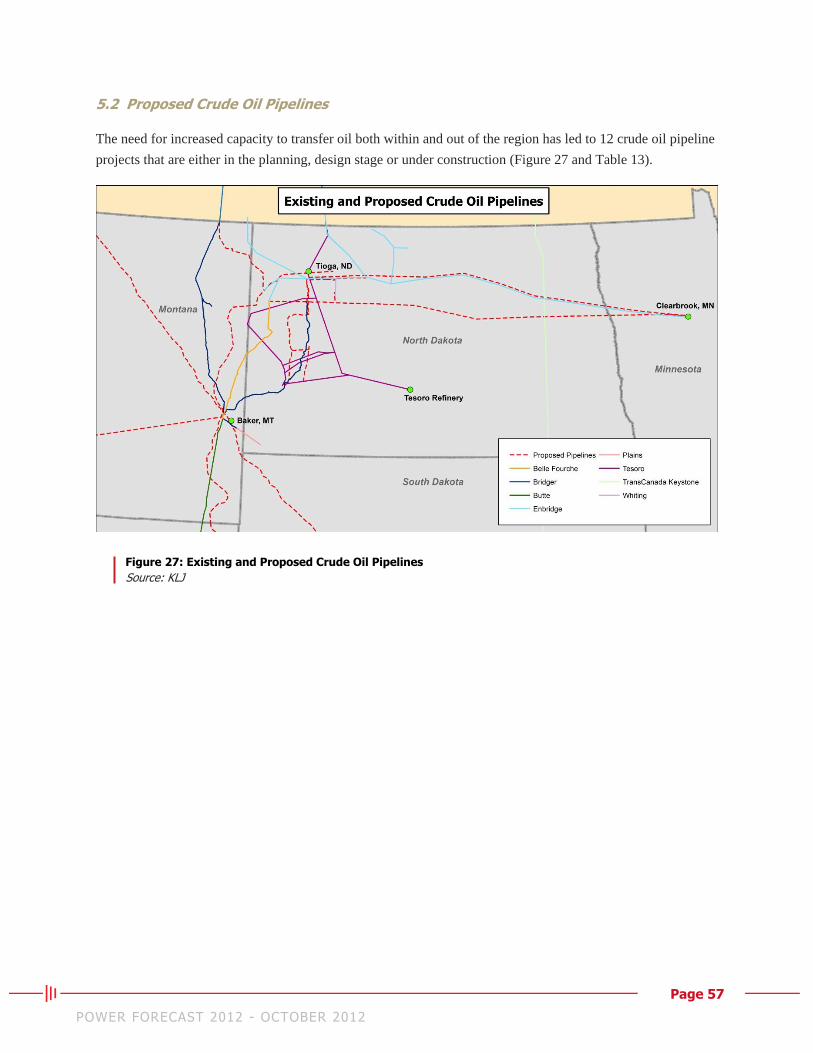
Page 57 POWER FORECAST 2012 - OCTOBER 2012
5.2 Proposed Crude Oil Pipelines
The need for increased capacity to transfer oil both within and out of the region has led to 12 crude oil pipeline
projects that are either in the planning, design stage or under construction (Figure 27 and Table 13).
Figure 27: Existing and Proposed Crude Oil Pipelines
Source: KLJ
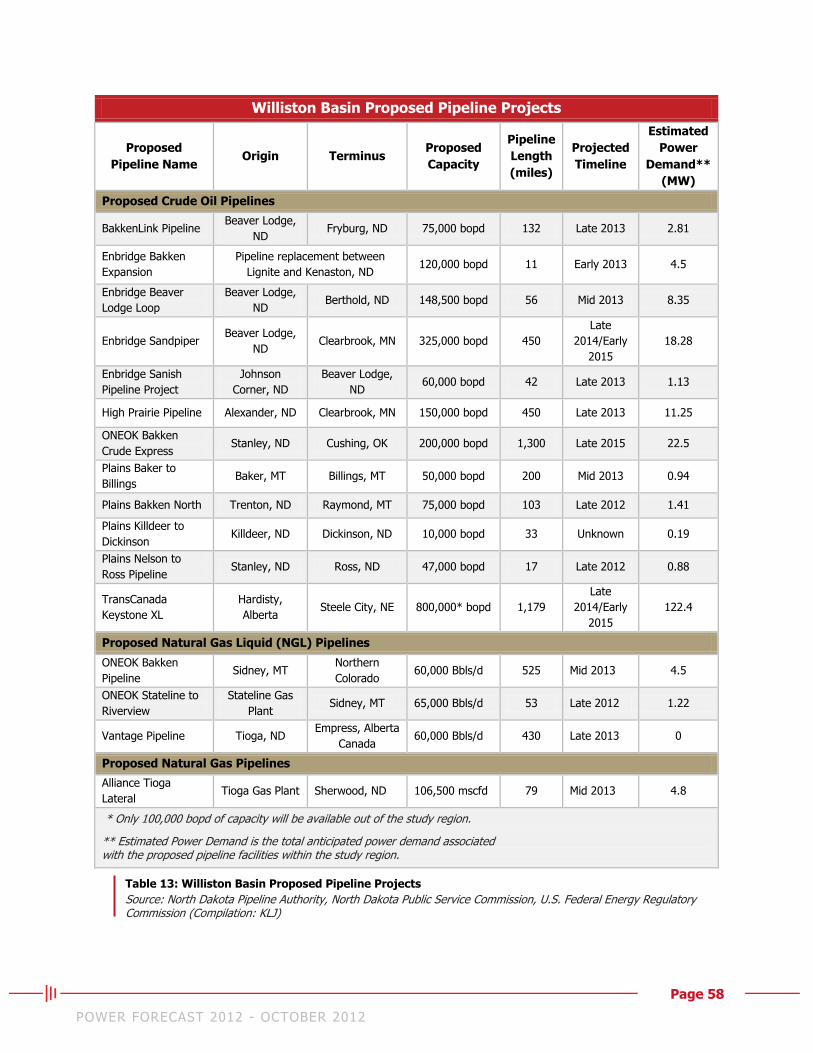
Page 58 POWER FORECAST 2012 - OCTOBER 2012
Williston Basin Proposed Pipeline Projects
Proposed
Pipeline Name Origin Terminus
Proposed
Capacity
Pipeline
Length
(miles)
Projected
Timeline
Estimated
Power
Demand**
(MW)
Proposed Crude Oil Pipelines
BakkenLink Pipeline Beaver Lodge,
ND Fryburg, ND 75,000 bopd 132 Late 2013 2.81
Enbridge Bakken
Expansion
Pipeline replacement between
Lignite and Kenaston, ND 120,000 bopd 11 Early 2013 4.5
Enbridge Beaver
Lodge Loop
Beaver Lodge,
ND Berthold, ND 148,500 bopd 56 Mid 2013 8.35
Enbridge Sandpiper Beaver Lodge,
ND Clearbrook, MN 325,000 bopd 450
Late
2014/Early
2015
18.28
Enbridge Sanish
Pipeline Project
Johnson
Corner, ND
Beaver Lodge,
ND 60,000 bopd 42 Late 2013 1.13
High Prairie Pipeline Alexander, ND Clearbrook, MN 150,000 bopd 450 Late 2013 11.25
ONEOK Bakken
Crude Express Stanley, ND Cushing, OK 200,000 bopd 1,300 Late 2015 22.5
Plains Baker to
Billings Baker, MT Billings, MT 50,000 bopd 200 Mid 2013 0.94
Plains Bakken North Trenton, ND Raymond, MT 75,000 bopd 103 Late 2012 1.41
Plains Killdeer to
Dickinson Killdeer, ND Dickinson, ND 10,000 bopd 33 Unknown 0.19
Plains Nelson to
Ross Pipeline Stanley, ND Ross, ND 47,000 bopd 17 Late 2012 0.88
TransCanada
Keystone XL
Hardisty,
Alberta Steele City, NE 800,000* bopd 1,179
Late
2014/Early
2015
122.4
Proposed Natural Gas Liquid (NGL) Pipelines
ONEOK Bakken
Pipeline Sidney, MT
Northern
Colorado 60,000 Bbls/d 525 Mid 2013 4.5
ONEOK Stateline to
Riverview
Stateline Gas
Plant Sidney, MT 65,000 Bbls/d 53 Late 2012 1.22
Vantage Pipeline Tioga, ND Empress, Alberta
Canada 60,000 Bbls/d 430 Late 2013 0
Proposed Natural Gas Pipelines
Alliance Tioga
Lateral Tioga Gas Plant Sherwood, ND 106,500 mscfd 79 Mid 2013 4.8
* Only 100,000 bopd of capacity will be available out of the study region.
** Estimated Power Demand is the total anticipated power demand associated with the proposed pipeline facilities within the study region.
Table 13: Williston Basin Proposed Pipeline Projects
Source: North Dakota Pipeline Authority, North Dakota Public Service Commission, U.S. Federal Energy Regulatory Commission (Compilation: KLJ)
Page 59 POWER FORECAST 2012 - OCTOBER 2012
5.3 Natural Gas Pipelines
Wells that extract crude oil in the Williston Basin also produce a significant amount of natural gas. The natural
gas produced is liquids rich, requiring processing before it is considered a dry, saleable natural gas. Processing
natural gas separates hydrocarbon liquids (y-grade mixture) from the natural gas stream and is required to
reduce the natural gas stream’s heating value and remove excess liquids. This allows it to meet the
transmission pipeline’s gas quality tariff. Further processing of the y-grade mixture, referred to as
fractionization, results in the separation of hydrocarbon liquids into constituents including ethane, butane,
propane and natural gasoline. These valuable byproducts are marketed as commodities.
Gathering or midstream pipeline systems move raw gas from the wellhead to the processing plant.
Transmission pipeline systems then transport the processed gas to market. As cited by the North Dakota
Department of Mineral Resources, 29 percent of total natural gas production was flared in 2011 due to the
region’s insufficient gathering pipeline capacity and processing infrastructure.
While some pipeline capacity to transport natural gas out of the Williston Basin exists, the region’s
infrastructure, particularly the gas gathering infrastructure, is constricted. The anticipated increase in gas
production within the region will require significant future development of both gas gathering and processing
infrastructure. Additional infrastructure will facilitate market access and decrease flaring levels.
The existing natural gas pipeline export options from the Williston Basin are as follows:
Northern Border Pipeline: This 1,407-mile interstate natural gas pipeline has a capacity of about 2.4
billion standard cubic feet per day (Bscf/d). It extends from the Montana-Saskatchewan border near
Port of Morgan, MT, and travels directly through the Williston Basin to a terminus near North
Hayden, IN. The majority of Northern Border’s supply gas is sourced from the Western Canadian
Sedimentary Basin resulting in the Williston Basin facing direct competition for Northern Border’s
pipeline capacity.
Alliance Pipeline: The system transports liquid-rich natural gas from northeastern British Columbia
and northwestern Alberta, Canada to a terminus near Chicago IL. The 36-inch, 886-mile pipeline has a
capacity of 4.6 Bscf/d. Aux Sable’s Prairie Rose Pipeline transfers liquid-rich Williston Basin gas to
the Alliance Pipeline through an interconnect near Bantry, ND. The Prairie Rose line has an estimated
capacity of 110 MMscf/d. Alliance is the lone regional pipeline to provide take-away capacity for
liquid-rich gas. Several regional pipeline projects proposing new interconnects with Alliance are being
considered. Alliance has additional capacity available to transport natural gas out of the Williston
Basin.
WBI Energy: Although WBI Energy (WBI) is not considered a typical long-haul pipeline solely
dedicated to the export of natural gas or directly connected to a traditional market hub, WBI owns and
operates more than 3,700 miles of natural gas transmission and gathering pipeline facilities in North
Dakota, South Dakota, Montana and Wyoming. The system is located in the heart of the Williston
Basin and provides natural gas transmission and storage services. WBI has several interconnects to the
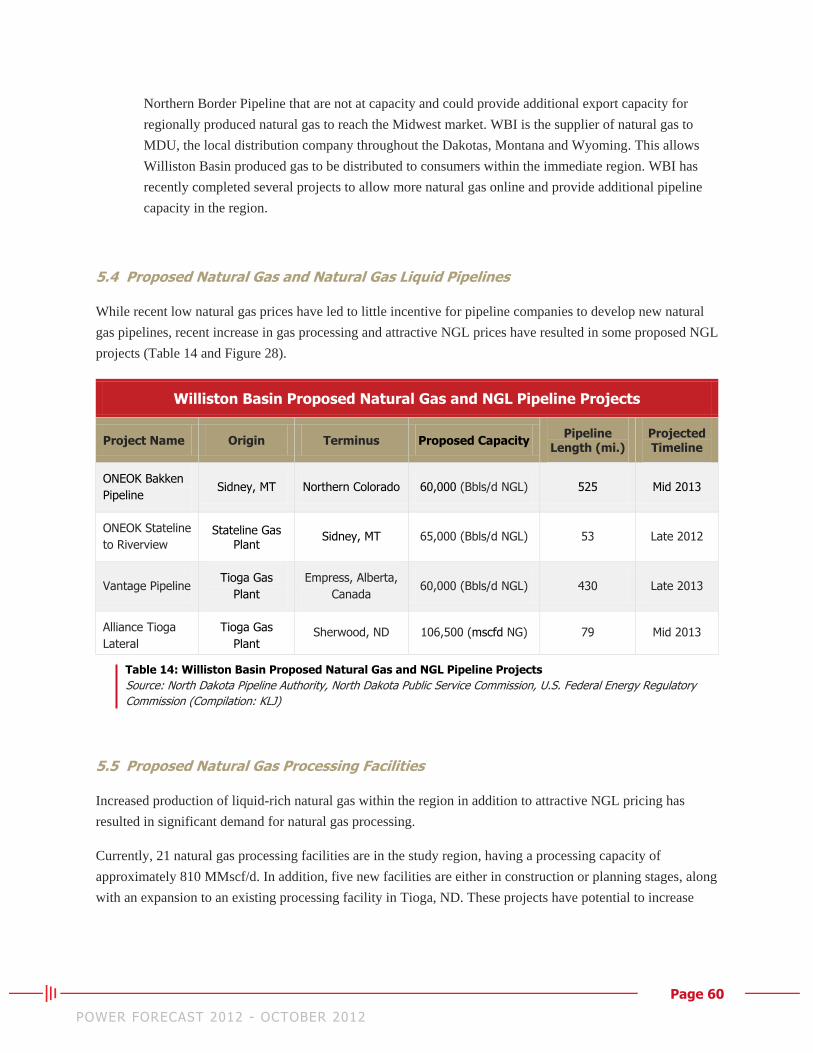
Page 60 POWER FORECAST 2012 - OCTOBER 2012
Northern Border Pipeline that are not at capacity and could provide additional export capacity for
regionally produced natural gas to reach the Midwest market. WBI is the supplier of natural gas to
MDU, the local distribution company throughout the Dakotas, Montana and Wyoming. This allows
Williston Basin produced gas to be distributed to consumers within the immediate region. WBI has
recently completed several projects to allow more natural gas online and provide additional pipeline
capacity in the region.
5.4 Proposed Natural Gas and Natural Gas Liquid Pipelines
While recent low natural gas prices have led to little incentive for pipeline companies to develop new natural
gas pipelines, recent increase in gas processing and attractive NGL prices have resulted in some proposed NGL
projects (Table 14 and Figure 28).
Williston Basin Proposed Natural Gas and NGL Pipeline Projects
Project Name Origin Terminus Proposed Capacity Pipeline
Length (mi.) Projected Timeline
ONEOK Bakken
Pipeline Sidney, MT Northern Colorado 60,000 (Bbls/d NGL) 525 Mid 2013
ONEOK Stateline
to Riverview Stateline Gas
Plant Sidney, MT 65,000 (Bbls/d NGL) 53 Late 2012
Vantage Pipeline Tioga Gas
Plant
Empress, Alberta,
Canada 60,000 (Bbls/d NGL) 430 Late 2013
Alliance Tioga
Lateral
Tioga Gas
Plant Sherwood, ND 106,500 (mscfd NG) 79 Mid 2013
Table 14: Williston Basin Proposed Natural Gas and NGL Pipeline Projects
Source: North Dakota Pipeline Authority, North Dakota Public Service Commission, U.S. Federal Energy Regulatory
Commission (Compilation: KLJ)
5.5 Proposed Natural Gas Processing Facilities
Increased production of liquid-rich natural gas within the region in addition to attractive NGL pricing has
resulted in significant demand for natural gas processing.
Currently, 21 natural gas processing facilities are in the study region, having a processing capacity of
approximately 810 MMscf/d. In addition, five new facilities are either in construction or planning stages, along
with an expansion to an existing processing facility in Tioga, ND. These projects have potential to increase
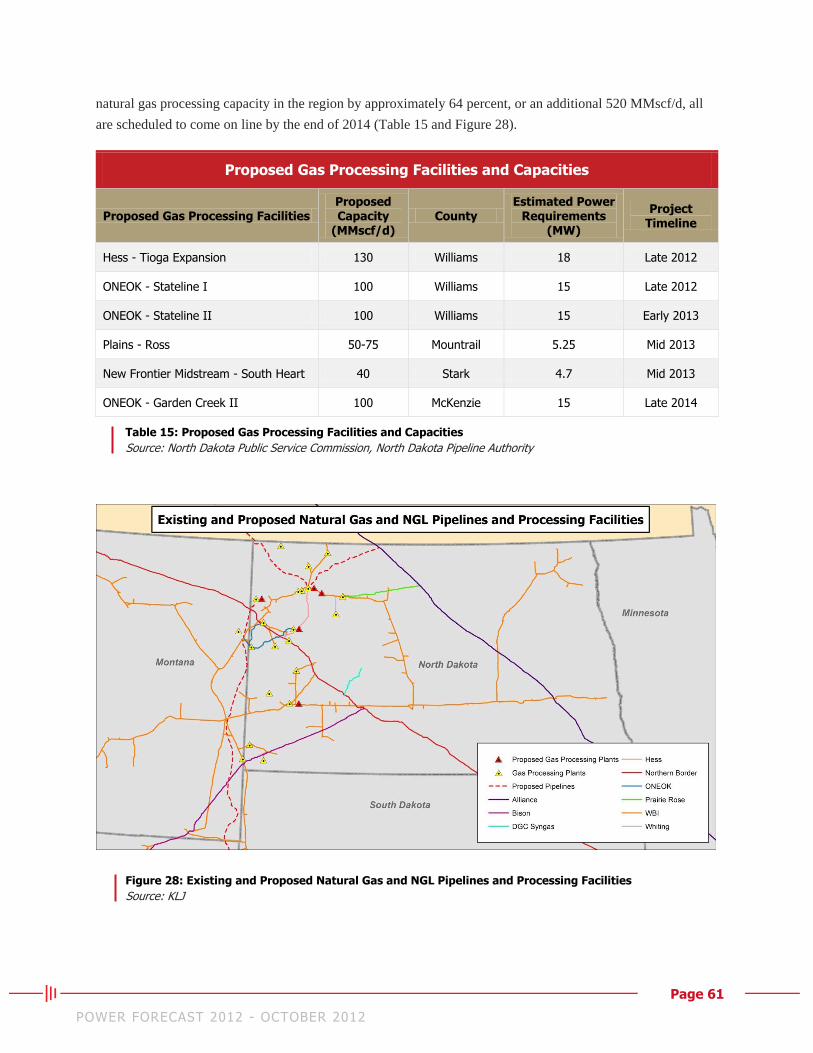
Page 61 POWER FORECAST 2012 - OCTOBER 2012
natural gas processing capacity in the region by approximately 64 percent, or an additional 520 MMscf/d, all
are scheduled to come on line by the end of 2014 (Table 15 and Figure 28).
Proposed Gas Processing Facilities and Capacities
Proposed Gas Processing Facilities Proposed Capacity
(MMscf/d) County
Estimated Power Requirements
(MW)
Project Timeline
Hess - Tioga Expansion 130 Williams 18 Late 2012
ONEOK - Stateline I 100 Williams 15 Late 2012
ONEOK - Stateline II 100 Williams 15 Early 2013
Plains - Ross 50-75 Mountrail 5.25 Mid 2013
New Frontier Midstream - South Heart 40 Stark 4.7 Mid 2013
ONEOK - Garden Creek II 100 McKenzie 15 Late 2014
Table 15: Proposed Gas Processing Facilities and Capacities
Source: North Dakota Public Service Commission, North Dakota Pipeline Authority
Figure 28: Existing and Proposed Natural Gas and NGL Pipelines and Processing Facilities
Source: KLJ
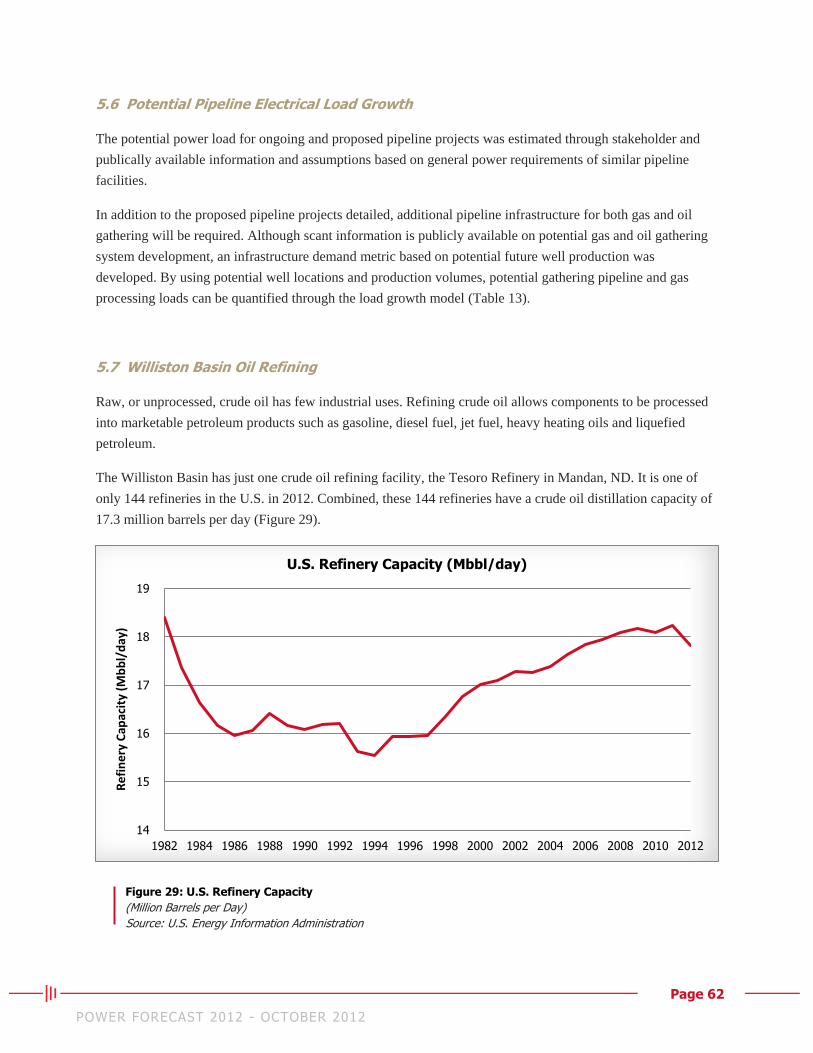
Page 62 POWER FORECAST 2012 - OCTOBER 2012
5.6 Potential Pipeline Electrical Load Growth
The potential power load for ongoing and proposed pipeline projects was estimated through stakeholder and
publically available information and assumptions based on general power requirements of similar pipeline
facilities.
In addition to the proposed pipeline projects detailed, additional pipeline infrastructure for both gas and oil
gathering will be required. Although scant information is publicly available on potential gas and oil gathering
system development, an infrastructure demand metric based on potential future well production was
developed. By using potential well locations and production volumes, potential gathering pipeline and gas
processing loads can be quantified through the load growth model (Table 13).
5.7 Williston Basin Oil Refining
Raw, or unprocessed, crude oil has few industrial uses. Refining crude oil allows components to be processed
into marketable petroleum products such as gasoline, diesel fuel, jet fuel, heavy heating oils and liquefied
petroleum.
The Williston Basin has just one crude oil refining facility, the Tesoro Refinery in Mandan, ND. It is one of
only 144 refineries in the U.S. in 2012. Combined, these 144 refineries have a crude oil distillation capacity of
17.3 million barrels per day (Figure 29).
Figure 29: U.S. Refinery Capacity
(Million Barrels per Day)
Source: U.S. Energy Information Administration
14
15
16
17
18
19
1982 1984 1986 1988 1990 1992 1994 1996 1998 2000 2002 2004 2006 2008 2010 2012
Re
fin
ery
Cap
acit
y (M
bb
l/d
ay)
U.S. Refinery Capacity (Mbbl/day)
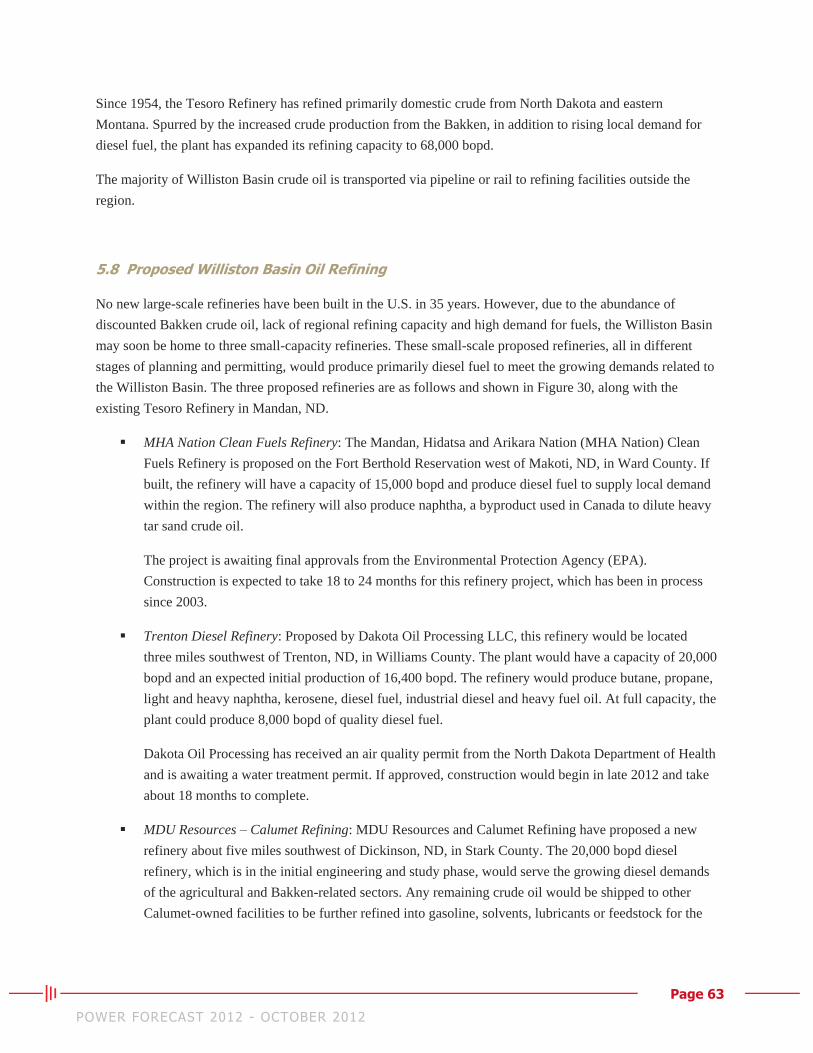
Page 63 POWER FORECAST 2012 - OCTOBER 2012
Since 1954, the Tesoro Refinery has refined primarily domestic crude from North Dakota and eastern
Montana. Spurred by the increased crude production from the Bakken, in addition to rising local demand for
diesel fuel, the plant has expanded its refining capacity to 68,000 bopd.
The majority of Williston Basin crude oil is transported via pipeline or rail to refining facilities outside the
region.
5.8 Proposed Williston Basin Oil Refining
No new large-scale refineries have been built in the U.S. in 35 years. However, due to the abundance of
discounted Bakken crude oil, lack of regional refining capacity and high demand for fuels, the Williston Basin
may soon be home to three small-capacity refineries. These small-scale proposed refineries, all in different
stages of planning and permitting, would produce primarily diesel fuel to meet the growing demands related to
the Williston Basin. The three proposed refineries are as follows and shown in Figure 30, along with the
existing Tesoro Refinery in Mandan, ND.
MHA Nation Clean Fuels Refinery: The Mandan, Hidatsa and Arikara Nation (MHA Nation) Clean
Fuels Refinery is proposed on the Fort Berthold Reservation west of Makoti, ND, in Ward County. If
built, the refinery will have a capacity of 15,000 bopd and produce diesel fuel to supply local demand
within the region. The refinery will also produce naphtha, a byproduct used in Canada to dilute heavy
tar sand crude oil.
The project is awaiting final approvals from the Environmental Protection Agency (EPA).
Construction is expected to take 18 to 24 months for this refinery project, which has been in process
since 2003.
Trenton Diesel Refinery: Proposed by Dakota Oil Processing LLC, this refinery would be located
three miles southwest of Trenton, ND, in Williams County. The plant would have a capacity of 20,000
bopd and an expected initial production of 16,400 bopd. The refinery would produce butane, propane,
light and heavy naphtha, kerosene, diesel fuel, industrial diesel and heavy fuel oil. At full capacity, the
plant could produce 8,000 bopd of quality diesel fuel.
Dakota Oil Processing has received an air quality permit from the North Dakota Department of Health
and is awaiting a water treatment permit. If approved, construction would begin in late 2012 and take
about 18 months to complete.
MDU Resources – Calumet Refining: MDU Resources and Calumet Refining have proposed a new
refinery about five miles southwest of Dickinson, ND, in Stark County. The 20,000 bopd diesel
refinery, which is in the initial engineering and study phase, would serve the growing diesel demands
of the agricultural and Bakken-related sectors. Any remaining crude oil would be shipped to other
Calumet-owned facilities to be further refined into gasoline, solvents, lubricants or feedstock for the
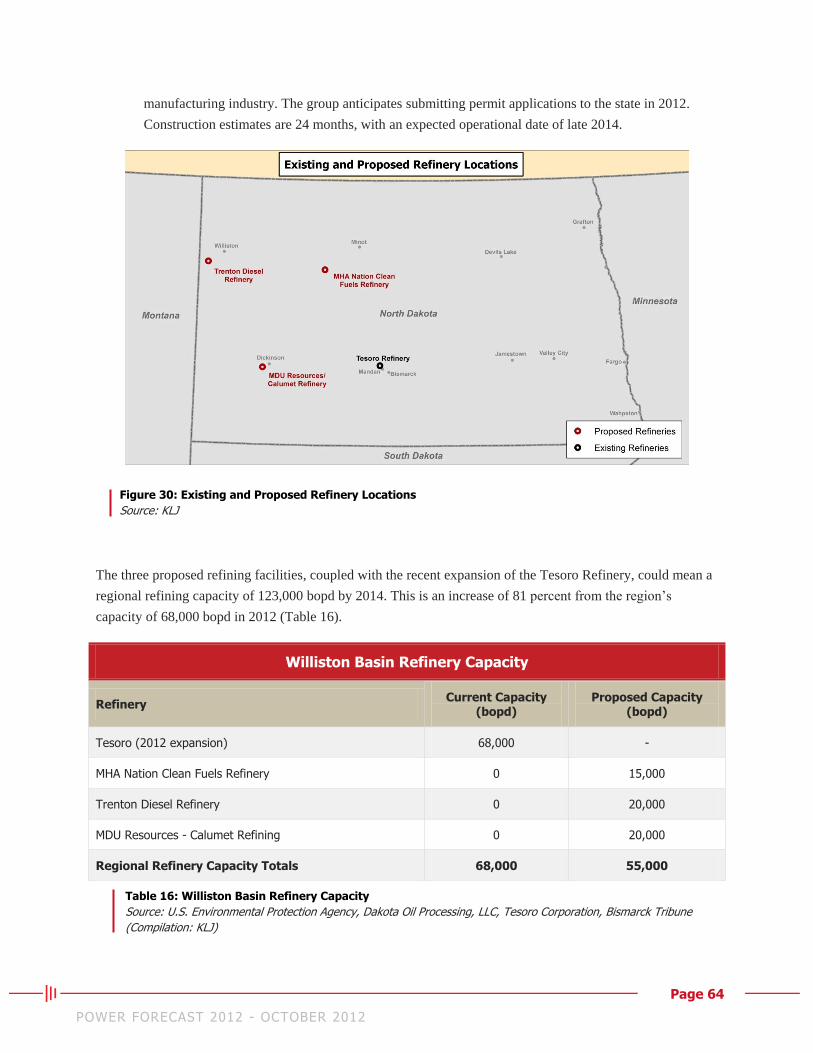
Page 64 POWER FORECAST 2012 - OCTOBER 2012
manufacturing industry. The group anticipates submitting permit applications to the state in 2012.
Construction estimates are 24 months, with an expected operational date of late 2014.
Figure 30: Existing and Proposed Refinery Locations
Source: KLJ
The three proposed refining facilities, coupled with the recent expansion of the Tesoro Refinery, could mean a
regional refining capacity of 123,000 bopd by 2014. This is an increase of 81 percent from the region’s
capacity of 68,000 bopd in 2012 (Table 16).
Williston Basin Refinery Capacity
Refinery Current Capacity
(bopd) Proposed Capacity
(bopd)
Tesoro (2012 expansion) 68,000 -
MHA Nation Clean Fuels Refinery 0 15,000
Trenton Diesel Refinery 0 20,000
MDU Resources - Calumet Refining 0 20,000
Regional Refinery Capacity Totals 68,000 55,000
Table 16: Williston Basin Refinery Capacity
Source: U.S. Environmental Protection Agency, Dakota Oil Processing, LLC, Tesoro Corporation, Bismarck Tribune
(Compilation: KLJ)
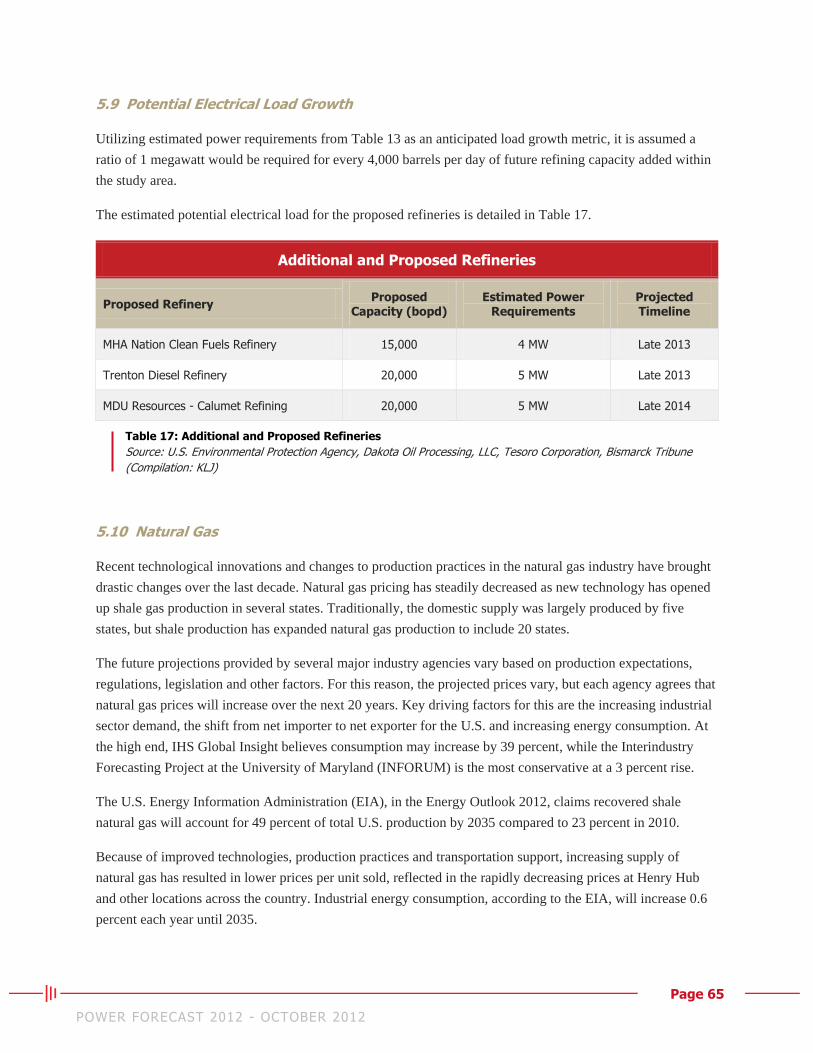
Page 65 POWER FORECAST 2012 - OCTOBER 2012
5.9 Potential Electrical Load Growth
Utilizing estimated power requirements from Table 13 as an anticipated load growth metric, it is assumed a
ratio of 1 megawatt would be required for every 4,000 barrels per day of future refining capacity added within
the study area.
The estimated potential electrical load for the proposed refineries is detailed in Table 17.
Additional and Proposed Refineries
Proposed Refinery Proposed
Capacity (bopd) Estimated Power
Requirements Projected Timeline
MHA Nation Clean Fuels Refinery 15,000 4 MW Late 2013
Trenton Diesel Refinery 20,000 5 MW Late 2013
MDU Resources - Calumet Refining 20,000 5 MW Late 2014
Table 17: Additional and Proposed Refineries
Source: U.S. Environmental Protection Agency, Dakota Oil Processing, LLC, Tesoro Corporation, Bismarck Tribune
(Compilation: KLJ)
5.10 Natural Gas
Recent technological innovations and changes to production practices in the natural gas industry have brought
drastic changes over the last decade. Natural gas pricing has steadily decreased as new technology has opened
up shale gas production in several states. Traditionally, the domestic supply was largely produced by five
states, but shale production has expanded natural gas production to include 20 states.
The future projections provided by several major industry agencies vary based on production expectations,
regulations, legislation and other factors. For this reason, the projected prices vary, but each agency agrees that
natural gas prices will increase over the next 20 years. Key driving factors for this are the increasing industrial
sector demand, the shift from net importer to net exporter for the U.S. and increasing energy consumption. At
the high end, IHS Global Insight believes consumption may increase by 39 percent, while the Interindustry
Forecasting Project at the University of Maryland (INFORUM) is the most conservative at a 3 percent rise.
The U.S. Energy Information Administration (EIA), in the Energy Outlook 2012, claims recovered shale
natural gas will account for 49 percent of total U.S. production by 2035 compared to 23 percent in 2010.
Because of improved technologies, production practices and transportation support, increasing supply of
natural gas has resulted in lower prices per unit sold, reflected in the rapidly decreasing prices at Henry Hub
and other locations across the country. Industrial energy consumption, according to the EIA, will increase 0.6
percent each year until 2035.

Page 66 POWER FORECAST 2012 - OCTOBER 2012
In 2010, the U.S. imported 11 percent of its natural gas supply; by 2035, many forecasts predict the U.S. will
be a net exporter. Improved pipeline support and the rapidly developing shale production are seen as the
primary drivers for this shift. It is also a primary reason why many agencies believe the price will steadily
increase as we move toward 2035.
Historically, natural gas has been traded per million Btu (MMBtu) or per thousand cubic feet. The NYMEX
also predominately trades in MMBtu. The pricing in Figure 31 and Table 18 is based on an average of the
daily closing prices from Henry Hub in Louisiana. While almost no projections believe that the prices will
recover to 2005 levels, many believe $7 MMBtu is realistic for 2035.
While transportation limitations often lead to short-range sales of natural gas and the Federal Energy
Regulatory Commission (FERC) limits the usage of pipelines in regards to natural gas sales, many refer to the
Henry Hub spot prices as one of the more reliable national price indicators for natural gas.
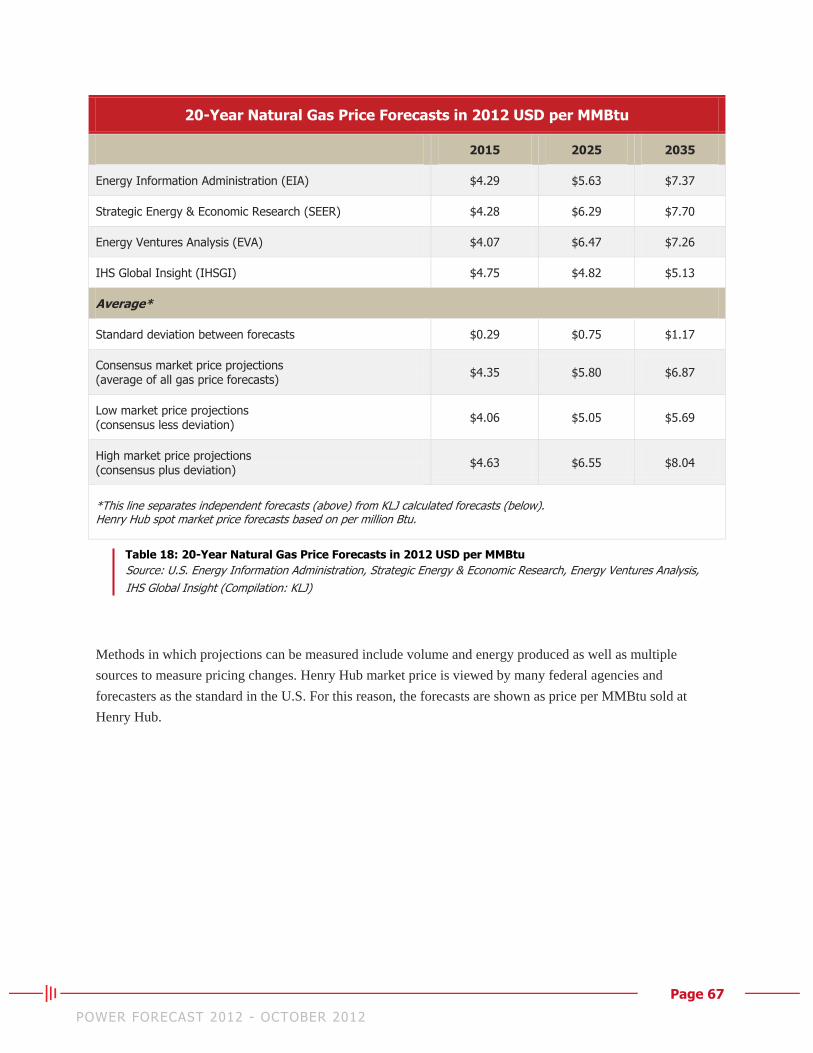
Page 67 POWER FORECAST 2012 - OCTOBER 2012
20-Year Natural Gas Price Forecasts in 2012 USD per MMBtu
2015 2025 2035
Energy Information Administration (EIA) $4.29 $5.63 $7.37
Strategic Energy & Economic Research (SEER) $4.28 $6.29 $7.70
Energy Ventures Analysis (EVA) $4.07 $6.47 $7.26
IHS Global Insight (IHSGI) $4.75 $4.82 $5.13
Average*
Standard deviation between forecasts $0.29 $0.75 $1.17
Consensus market price projections (average of all gas price forecasts)
$4.35 $5.80 $6.87
Low market price projections (consensus less deviation)
$4.06 $5.05 $5.69
High market price projections (consensus plus deviation)
$4.63 $6.55 $8.04
*This line separates independent forecasts (above) from KLJ calculated forecasts (below). Henry Hub spot market price forecasts based on per million Btu.
Table 18: 20-Year Natural Gas Price Forecasts in 2012 USD per MMBtu
Source: U.S. Energy Information Administration, Strategic Energy & Economic Research, Energy Ventures Analysis,
IHS Global Insight (Compilation: KLJ)
Methods in which projections can be measured include volume and energy produced as well as multiple
sources to measure pricing changes. Henry Hub market price is viewed by many federal agencies and
forecasters as the standard in the U.S. For this reason, the forecasts are shown as price per MMBtu sold at
Henry Hub.
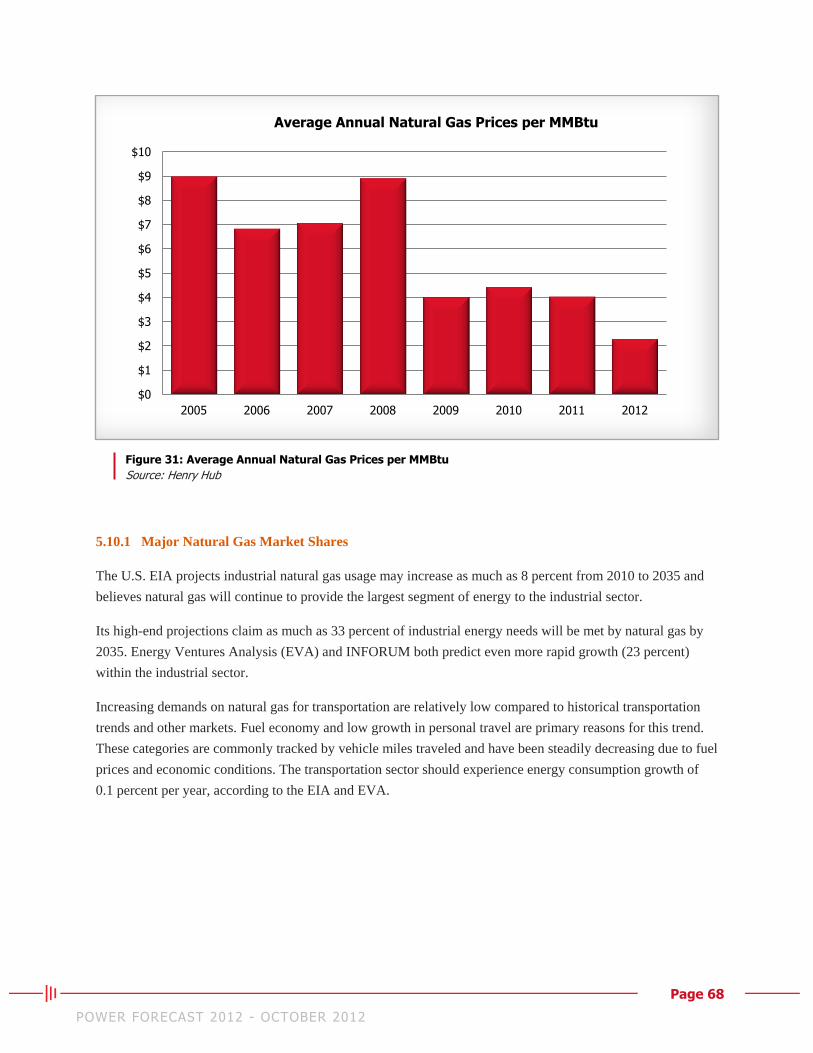
Page 68 POWER FORECAST 2012 - OCTOBER 2012
Figure 31: Average Annual Natural Gas Prices per MMBtu
Source: Henry Hub
5.10.1 Major Natural Gas Market Shares
The U.S. EIA projects industrial natural gas usage may increase as much as 8 percent from 2010 to 2035 and
believes natural gas will continue to provide the largest segment of energy to the industrial sector.
Its high-end projections claim as much as 33 percent of industrial energy needs will be met by natural gas by
2035. Energy Ventures Analysis (EVA) and INFORUM both predict even more rapid growth (23 percent)
within the industrial sector.
Increasing demands on natural gas for transportation are relatively low compared to historical transportation
trends and other markets. Fuel economy and low growth in personal travel are primary reasons for this trend.
These categories are commonly tracked by vehicle miles traveled and have been steadily decreasing due to fuel
prices and economic conditions. The transportation sector should experience energy consumption growth of
0.1 percent per year, according to the EIA and EVA.
$0
$1
$2
$3
$4
$5
$6
$7
$8
$9
$10
2005 2006 2007 2008 2009 2010 2011 2012
Average Annual Natural Gas Prices per MMBtu
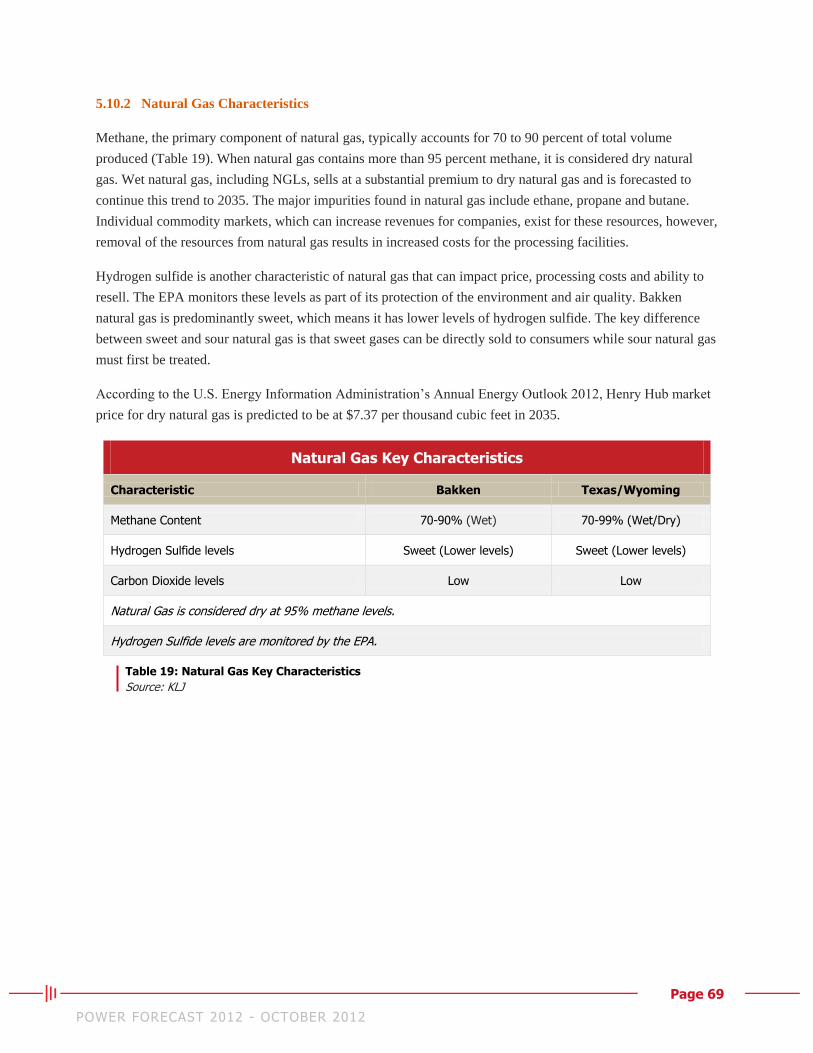
Page 69 POWER FORECAST 2012 - OCTOBER 2012
5.10.2 Natural Gas Characteristics
Methane, the primary component of natural gas, typically accounts for 70 to 90 percent of total volume
produced (Table 19). When natural gas contains more than 95 percent methane, it is considered dry natural
gas. Wet natural gas, including NGLs, sells at a substantial premium to dry natural gas and is forecasted to
continue this trend to 2035. The major impurities found in natural gas include ethane, propane and butane.
Individual commodity markets, which can increase revenues for companies, exist for these resources, however,
removal of the resources from natural gas results in increased costs for the processing facilities.
Hydrogen sulfide is another characteristic of natural gas that can impact price, processing costs and ability to
resell. The EPA monitors these levels as part of its protection of the environment and air quality. Bakken
natural gas is predominantly sweet, which means it has lower levels of hydrogen sulfide. The key difference
between sweet and sour natural gas is that sweet gases can be directly sold to consumers while sour natural gas
must first be treated.
According to the U.S. Energy Information Administration’s Annual Energy Outlook 2012, Henry Hub market
price for dry natural gas is predicted to be at $7.37 per thousand cubic feet in 2035.
Natural Gas Key Characteristics
Characteristic Bakken Texas/Wyoming
Methane Content 70-90% (Wet) 70-99% (Wet/Dry)
Hydrogen Sulfide levels Sweet (Lower levels) Sweet (Lower levels)
Carbon Dioxide levels Low Low
Natural Gas is considered dry at 95% methane levels.
Hydrogen Sulfide levels are monitored by the EPA.
Table 19: Natural Gas Key Characteristics
Source: KLJ

Page 70 POWER FORECAST 2012 - OCTOBER 2012
6. Population Estimate Modeling
Population is a key component in planning for future infrastructure needs. Population is typically forecasted
using standard cohort demographic models. Due to rapidly changing conditions in the Williston Basin, existing
demographic tools are inadequate and little to no data exists to adjust key demographic metrics, such as birth
rates and in-migration rates. Further, existing models do not take into consideration the unique characteristics
of the workforce in the Williston Basin and study region. Accordingly, an alternate method of estimating
population based on projected employment was developed. Projected employment growth in the Williston
Basin will be used to project housing demand. Application and comparison of persons-per-household
occupancy rates to estimates of housing demand for various types of housing units will estimate population
potential for the Williston Basin.
Rapid expansion of oil and gas related development is the fundamental catalyst behind the socio-economic
transformation in the Williston Basin. Prior to the recent expansion in the petroleum-sector, unemployment in
the region was very low and rapid expansion has created significant employment opportunities as the region
currently has more jobs than available individuals. Accordingly, projected employment is an appropriate
alternate metric to estimate population growth and provides the most reasonable approach to estimating future
population.
A model was developed to estimate changes in direct and secondary employment associated with the
petroleum-sector in the Williston Basin. However, oil and gas employment represents only one economic
sector, therefore, the approach was comprehensive and included changes in other industries and secondary jobs
tied to the petroleum-sector in the region as well.
6.1 Temporary Workforce and Permanent Workforce
Workforce characteristics vary according to the type of oilfield development activity. For this reason,
petroleum-sector employment was divided into two categories: temporary workforce and permanent
workforce. The workforce for certain activities such as drilling and fracing, infrastructure construction and
gathering systems construction consist largely of temporary workers. Temporary workers are often residents of
other states and work in a location until the job is complete and then move on to the next job site. Temporary
workforce may also be shift-workers with alternating patterns of working and non-working periods. Even
though workers may be onsite for an extended period, they are viewed as a temporary workforce relative to the
life cycle of oilfield development and are not considered established residents of the state in which they work.
The permanent workforce is comprised of individuals who work in the Williston Basin and are established
permanent residents of the state in which they work, in the case of this report, North Dakota, South Dakota or
Montana. Oilfield service employment is an example of the type of industry activity that consists of a largely
permanent workforce. The delineation between permanent and temporary workforces is significant as each
group of workers has different demands for goods and services, housing and infrastructure.
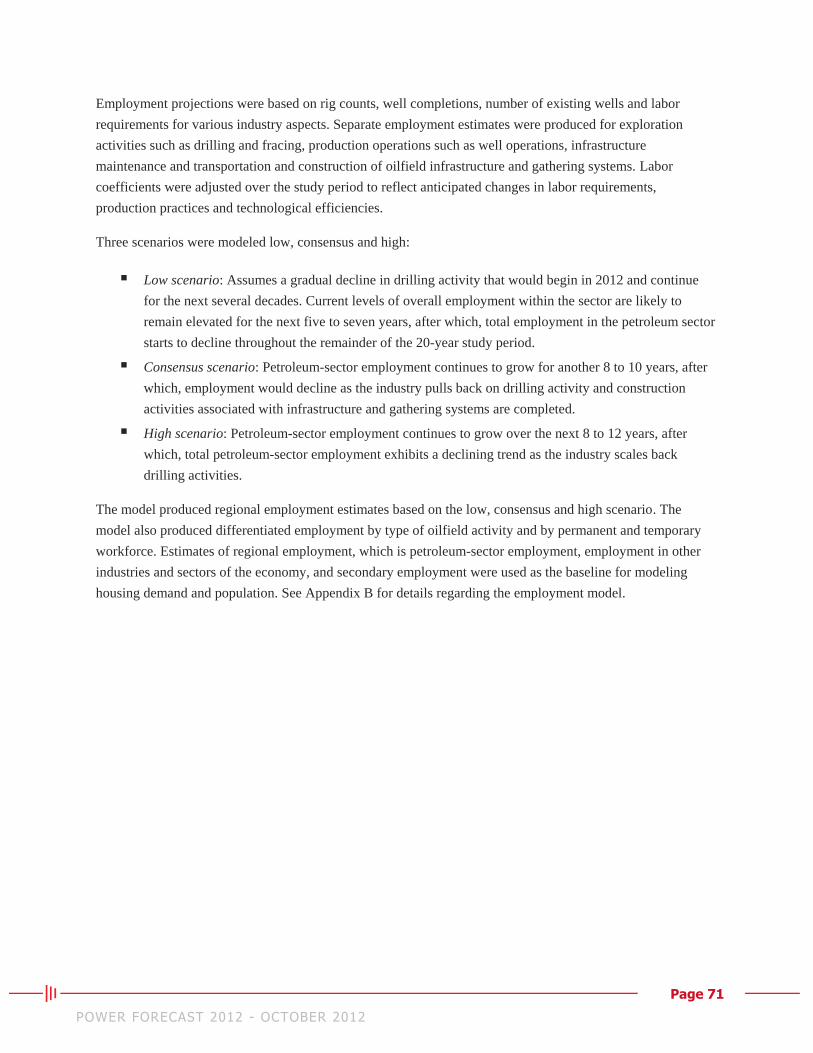
Page 71 POWER FORECAST 2012 - OCTOBER 2012
Employment projections were based on rig counts, well completions, number of existing wells and labor
requirements for various industry aspects. Separate employment estimates were produced for exploration
activities such as drilling and fracing, production operations such as well operations, infrastructure
maintenance and transportation and construction of oilfield infrastructure and gathering systems. Labor
coefficients were adjusted over the study period to reflect anticipated changes in labor requirements,
production practices and technological efficiencies.
Three scenarios were modeled low, consensus and high:
Low scenario: Assumes a gradual decline in drilling activity that would begin in 2012 and continue
for the next several decades. Current levels of overall employment within the sector are likely to
remain elevated for the next five to seven years, after which, total employment in the petroleum sector
starts to decline throughout the remainder of the 20-year study period.
Consensus scenario: Petroleum-sector employment continues to grow for another 8 to 10 years, after
which, employment would decline as the industry pulls back on drilling activity and construction
activities associated with infrastructure and gathering systems are completed.
High scenario: Petroleum-sector employment continues to grow over the next 8 to 12 years, after
which, total petroleum-sector employment exhibits a declining trend as the industry scales back
drilling activities.
The model produced regional employment estimates based on the low, consensus and high scenario. The
model also produced differentiated employment by type of oilfield activity and by permanent and temporary
workforce. Estimates of regional employment, which is petroleum-sector employment, employment in other
industries and sectors of the economy, and secondary employment were used as the baseline for modeling
housing demand and population. See Appendix B for details regarding the employment model.
Page 72 POWER FORECAST 2012 - OCTOBER 2012
7. Housing Demand Modeling
Due to the expansion rate of energy development in the Williston Basin and the resulting growth in
employment, the demand for housing has outstripped supply. Any excess supply of housing has long been
absorbed removing elasticity in housing supply. An inelastic market for housing exists when housing supply
fails to keep pace with housing demand and any new demand results in a proportionate increase in supply.
An examination of the direct ratio of employment-to-housing showed how growth in employment, combined
with the existing shortage of housing, suggested an increase in one job would be expected to result in demand
for one housing unit. Because demand for housing far outstrips the supply of housing, the employment-to-
housing model assumed a 1:1 correlation between employment and housing in the near-term. That assumption
was relaxed over time as housing supply is expected to grow and more closely equal demand. A housing
demand model was used to estimate future housing demand based on regional employment projections.
The employment-to-housing model linked changes in the total workforce, temporary and permanent, to
projected demand for housing. Permanent and temporary housing demand was modeled to increase in the near-
term and then decline slightly or remain steady over time as contractions in the petroleum-sector workforce
occur. Employment projections indicate substantial levels of temporary housing will be required for nearly a
decade. Long-term permanent housing demand is projected to increase substantially in all scenarios and in all
regions (Figure 32, Figure 33 and Figure 34). While much of the growth in permanent housing demand is due
to changes in workforce within the petroleum industry, demand for housing will also be a function of
expectations of growth in other sectors. While secondary effects are modeled throughout the planning period,
in later stages, it is expected there will be additional growth in secondary employment and other commercial
sectors.
In the near-term, the workforce is mobile and will respond to the availability of housing; however, in the long-
term, the workforce will desire housing to be in reasonable proximity to the oilfields. Accordingly, regional
demand for housing based on projected growth in employment was allocated among Williston Basin counties
according to the historic distributions and recent trends in distribution of housing units. Recent building trends
also reveal a disproportionate shift to multi-family units in North Dakota. The housing mix (single family,
multi-family) per county was adjusted to reflect the shift. The distribution of housing units among cities and
counties may change in the future as many communities near oilfield development have yet to formalize long-
term housing plans. Until additional data is available, housing demand was allocated among study counties
based on historic distributions and emerging trends with adjustments in the mix of housing units as appropriate
data was available.
The cost and lack of housing is constraining growth in other sectors of the economy as well. Expectations for
normal economic response to creating secondary employment will not be realized until housing becomes
available at a price that enables additional (service and commercial industries) workers to locate to the region.
In addition to constraining secondary job creation, the housing shortage is also inhibiting the existing
industries ability to add workforce. Housing shortages and the lack of public goods and services are a result of
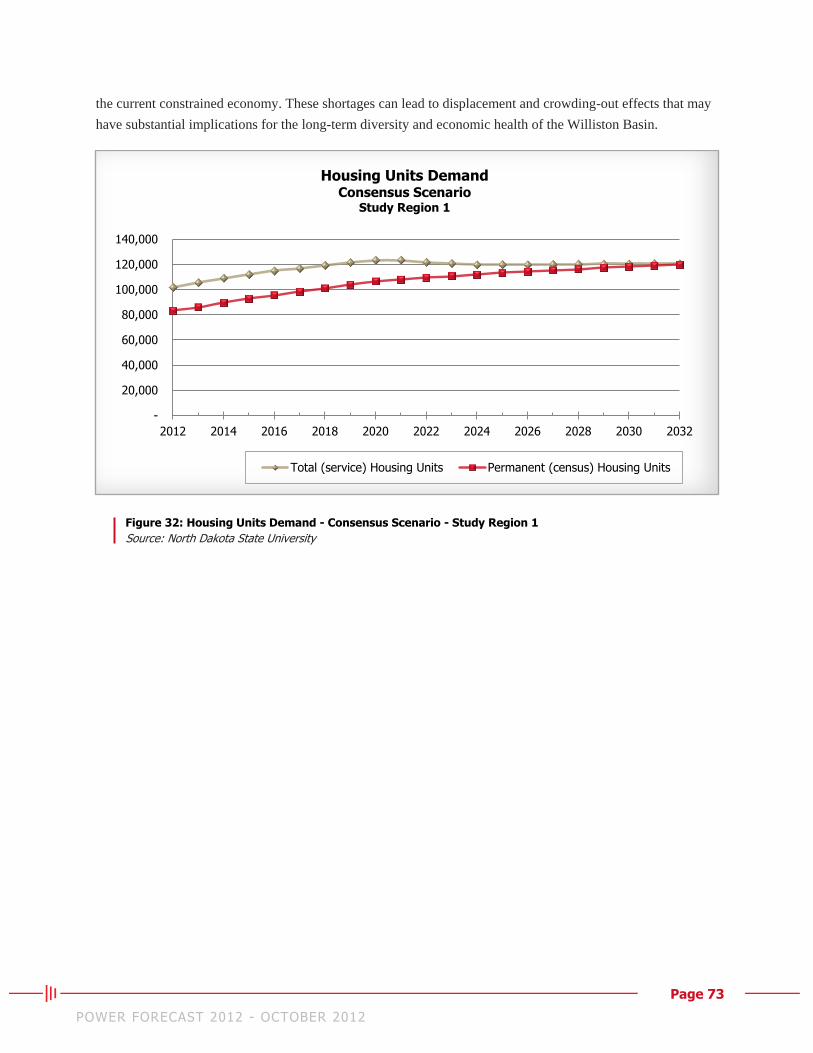
Page 73 POWER FORECAST 2012 - OCTOBER 2012
the current constrained economy. These shortages can lead to displacement and crowding-out effects that may
have substantial implications for the long-term diversity and economic health of the Williston Basin.
Figure 32: Housing Units Demand - Consensus Scenario - Study Region 1
Source: North Dakota State University
-
20,000
40,000
60,000
80,000
100,000
120,000
140,000
2012 2014 2016 2018 2020 2022 2024 2026 2028 2030 2032
Housing Units Demand Consensus Scenario
Study Region 1
Total (service) Housing Units Permanent (census) Housing Units
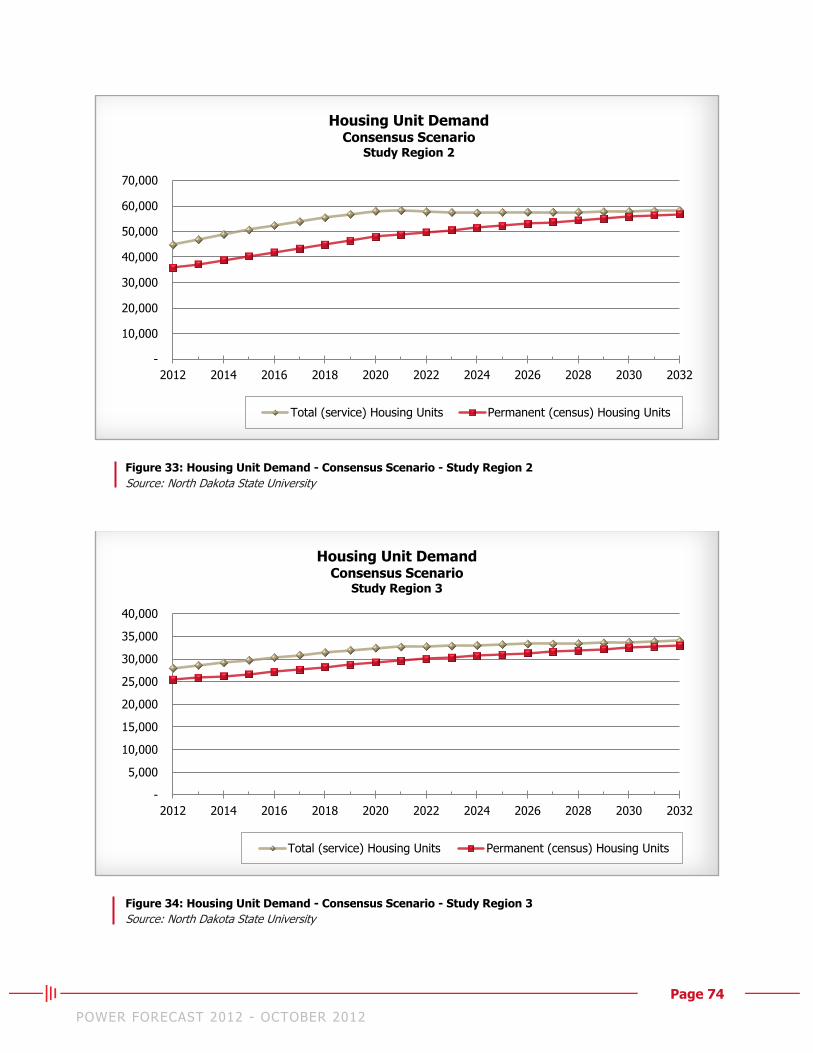
Page 74 POWER FORECAST 2012 - OCTOBER 2012
Figure 33: Housing Unit Demand - Consensus Scenario - Study Region 2
Source: North Dakota State University
Figure 34: Housing Unit Demand - Consensus Scenario - Study Region 3
Source: North Dakota State University
-
10,000
20,000
30,000
40,000
50,000
60,000
70,000
2012 2014 2016 2018 2020 2022 2024 2026 2028 2030 2032
Housing Unit Demand Consensus Scenario
Study Region 2
Total (service) Housing Units Permanent (census) Housing Units
-
5,000
10,000
15,000
20,000
25,000
30,000
35,000
40,000
2012 2014 2016 2018 2020 2022 2024 2026 2028 2030 2032
Housing Unit Demand Consensus Scenario
Study Region 3
Total (service) Housing Units Permanent (census) Housing Units
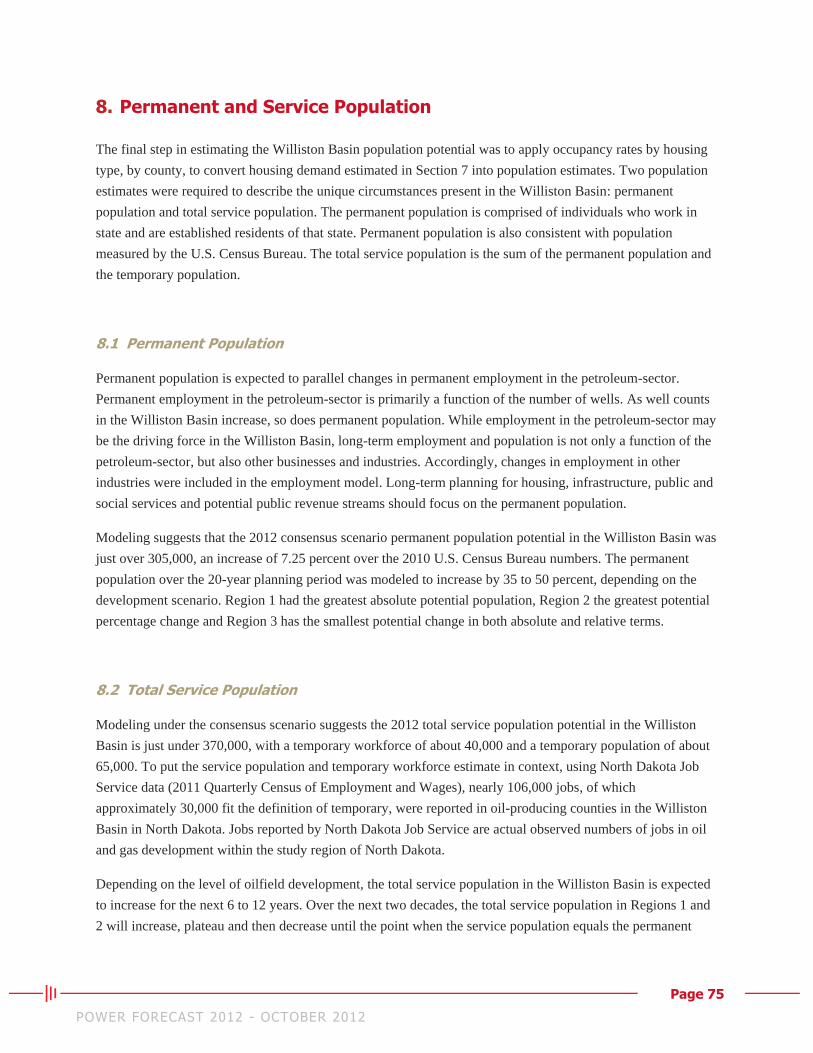
Page 75 POWER FORECAST 2012 - OCTOBER 2012
8. Permanent and Service Population
The final step in estimating the Williston Basin population potential was to apply occupancy rates by housing
type, by county, to convert housing demand estimated in Section 7 into population estimates. Two population
estimates were required to describe the unique circumstances present in the Williston Basin: permanent
population and total service population. The permanent population is comprised of individuals who work in
state and are established residents of that state. Permanent population is also consistent with population
measured by the U.S. Census Bureau. The total service population is the sum of the permanent population and
the temporary population.
8.1 Permanent Population
Permanent population is expected to parallel changes in permanent employment in the petroleum-sector.
Permanent employment in the petroleum-sector is primarily a function of the number of wells. As well counts
in the Williston Basin increase, so does permanent population. While employment in the petroleum-sector may
be the driving force in the Williston Basin, long-term employment and population is not only a function of the
petroleum-sector, but also other businesses and industries. Accordingly, changes in employment in other
industries were included in the employment model. Long-term planning for housing, infrastructure, public and
social services and potential public revenue streams should focus on the permanent population.
Modeling suggests that the 2012 consensus scenario permanent population potential in the Williston Basin was
just over 305,000, an increase of 7.25 percent over the 2010 U.S. Census Bureau numbers. The permanent
population over the 20-year planning period was modeled to increase by 35 to 50 percent, depending on the
development scenario. Region 1 had the greatest absolute potential population, Region 2 the greatest potential
percentage change and Region 3 has the smallest potential change in both absolute and relative terms.
8.2 Total Service Population
Modeling under the consensus scenario suggests the 2012 total service population potential in the Williston
Basin is just under 370,000, with a temporary workforce of about 40,000 and a temporary population of about
65,000. To put the service population and temporary workforce estimate in context, using North Dakota Job
Service data (2011 Quarterly Census of Employment and Wages), nearly 106,000 jobs, of which
approximately 30,000 fit the definition of temporary, were reported in oil-producing counties in the Williston
Basin in North Dakota. Jobs reported by North Dakota Job Service are actual observed numbers of jobs in oil
and gas development within the study region of North Dakota.
Depending on the level of oilfield development, the total service population in the Williston Basin is expected
to increase for the next 6 to 12 years. Over the next two decades, the total service population in Regions 1 and
2 will increase, plateau and then decrease until the point when the service population equals the permanent
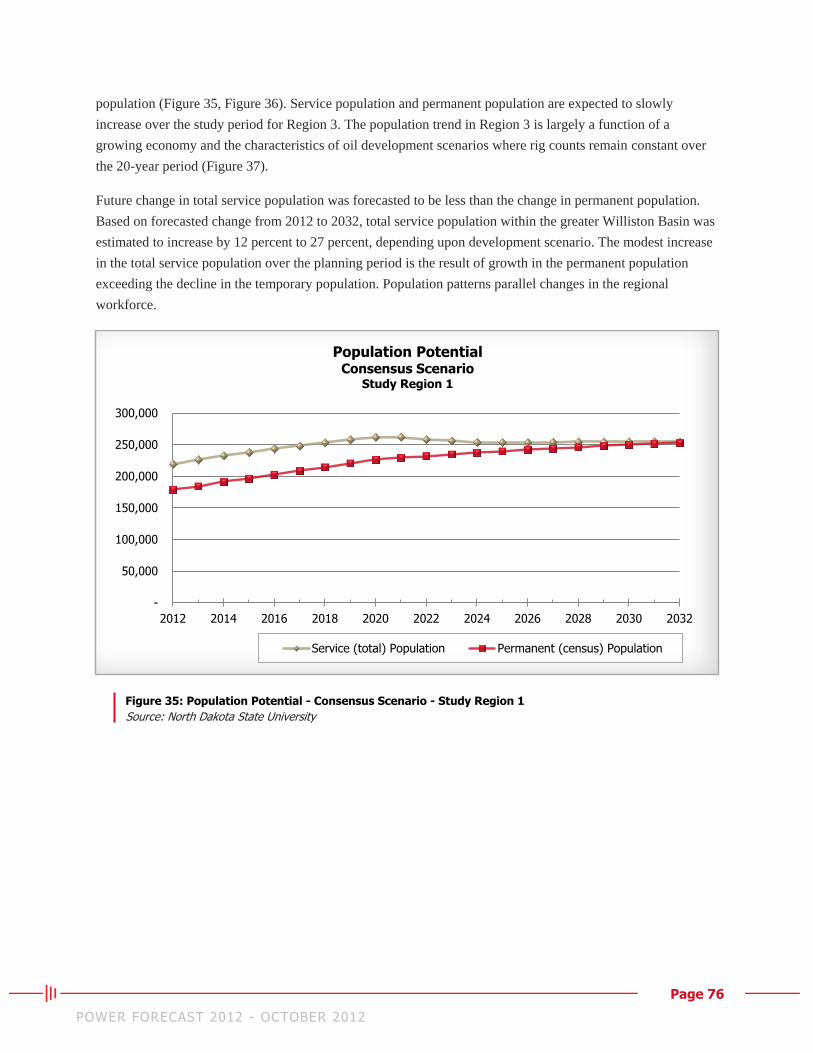
Page 76 POWER FORECAST 2012 - OCTOBER 2012
population (Figure 35, Figure 36). Service population and permanent population are expected to slowly
increase over the study period for Region 3. The population trend in Region 3 is largely a function of a
growing economy and the characteristics of oil development scenarios where rig counts remain constant over
the 20-year period (Figure 37).
Future change in total service population was forecasted to be less than the change in permanent population.
Based on forecasted change from 2012 to 2032, total service population within the greater Williston Basin was
estimated to increase by 12 percent to 27 percent, depending upon development scenario. The modest increase
in the total service population over the planning period is the result of growth in the permanent population
exceeding the decline in the temporary population. Population patterns parallel changes in the regional
workforce.
Figure 35: Population Potential - Consensus Scenario - Study Region 1
Source: North Dakota State University
-
50,000
100,000
150,000
200,000
250,000
300,000
2012 2014 2016 2018 2020 2022 2024 2026 2028 2030 2032
Population Potential Consensus Scenario
Study Region 1
Service (total) Population Permanent (census) Population
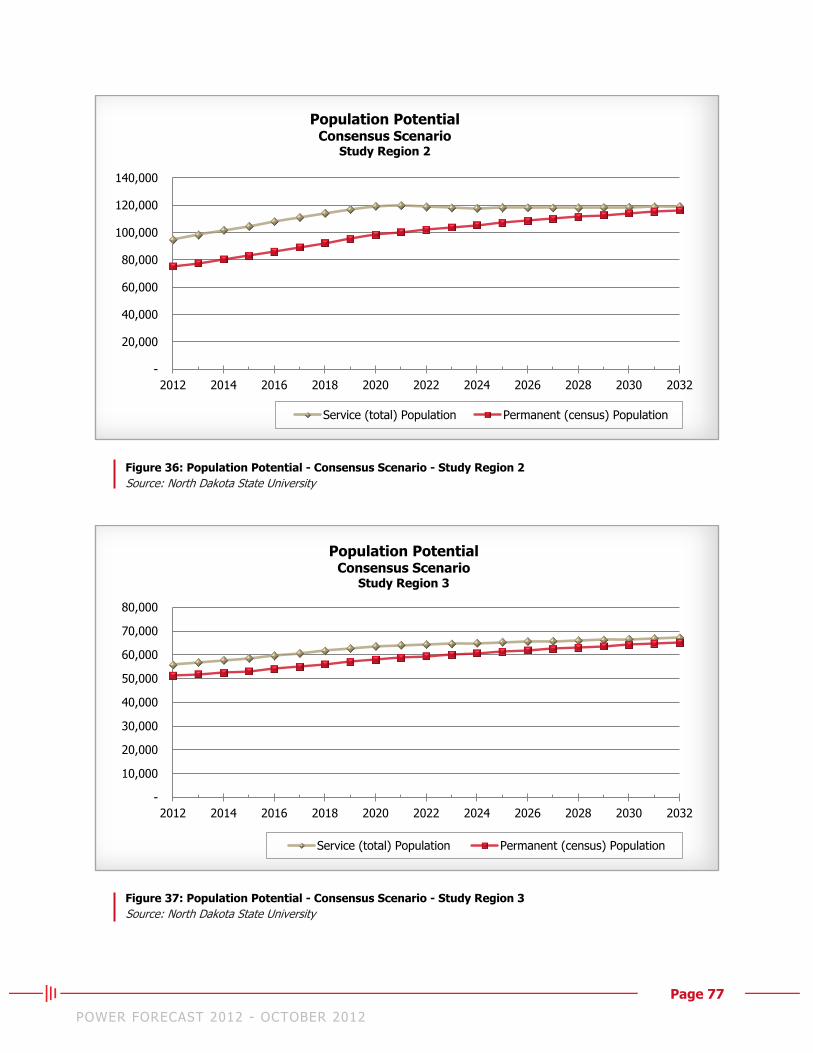
Page 77 POWER FORECAST 2012 - OCTOBER 2012
Figure 36: Population Potential - Consensus Scenario - Study Region 2
Source: North Dakota State University
Figure 37: Population Potential - Consensus Scenario - Study Region 3
Source: North Dakota State University
-
20,000
40,000
60,000
80,000
100,000
120,000
140,000
2012 2014 2016 2018 2020 2022 2024 2026 2028 2030 2032
Population Potential Consensus Scenario
Study Region 2
Service (total) Population Permanent (census) Population
-
10,000
20,000
30,000
40,000
50,000
60,000
70,000
80,000
2012 2014 2016 2018 2020 2022 2024 2026 2028 2030 2032
Population Potential Consensus Scenario
Study Region 3
Service (total) Population Permanent (census) Population
Page 78 POWER FORECAST 2012 - OCTOBER 2012
8.3 Population Estimate Assumptions
As described in Section 6, a large portion of the workforce is considered temporary, at least relative to the
oilfield life cycle. Most workforce associated with drilling and fracing, gathering systems infrastructure and
construction are temporary workers; therefore, a portion of the regional population is also considered
temporary. The total service population includes permanent residents and individuals not counted by the U.S.
Census Bureau, who claim residency in other states, work for short durations in the region, do not have
permanent addresses in the region or are otherwise associated with short-term employment or temporary
residency in the region (reference Section 6 and Appendix B for details of permanent and temporary
workforce).
Population estimates were made by applying person-per-household occupancy rates to housing demand
estimates for various types of housing units (single family, multi-family, etc.). Occupancy rates for each type
of housing unit by county were based on U.S. Census Bureau data from the 2010 American Community
Survey (ACA). The severe housing shortage and the assumption that the housing shortage has forced higher
occupancy rates than historical values. Actual occupancy rates were likely underestimated; however, this is the
only available data. Occupancy rates for each type of housing unit, by county were applied to housing demand
estimates to estimate population potential at the county level. Population estimates represent regional
population potential and were based on several key assumptions:
Communities are willing and able to supply housing at levels that meet the projected demand. Some
communities may be more or less inclined or able to supply housing, but on a regional level, the
model assumes that housing supply will meet housing demand. While the future supply of housing is
unknown, forecasted values represent population potential if housing demand is met.
The temporary population has similar characteristics as permanent population. Current and future
temporary workforce characteristics are unknown. However, it was assumed occupancy rates for
temporary workers were similar to occupancy rates for permanent workers.
Historic occupancy rates remain valid.
Sensitivity analysis revealed the employment-to-housing-to-population model was responsive to both a change
in housing units and occupancy rates. Small changes in either component resulted in large swings in
population. As a further understanding of workforce characteristics and communities’ ability to address future
housing needs is developed, population projection refinements will take place.
Further, the Williston Basin lacks a good baseline population estimate. Because the U.S. Census Bureau only
reports what is termed in this assessment as the permanent population, the 2010 Census Bureau figures for the
Williston Basin undoubtedly underestimated the service population. Incorporating the temporary population
into an estimate of total service population is critical for communities, businesses and government planning
activities. Even though a portion of the service population are residents of other states, while in the Williston
Basin they still use and require goods and services, both public and private.
Page 79 POWER FORECAST 2012 - OCTOBER 2012
9. Legislative Factors
Federal, state and local enacted and pending policies with potential impacts to electric load requirements were
identified for the study region. A team of private-industry and government officials assessed potential future
impacts on oil development in the Williston Basin. Fracing is the one potential issue that could have a
substantial impact on future development in the Williston Basin. Legislation and/or regulatory initiatives need
to be monitored closely over the next few months. Based on present discussions at the federal and state level,
fracing issues are not expected to have any measureable impacts over the next two to four years. The Public
Policy and Legislation matrix located in Appendix E identifies current issues under discussion and in various
forms of legislative or regulatory process. The initiatives are not considered to have sufficient interest to be
formally adopted in the near future.
Oil prices will have a greater impact than pending legislative or regulatory initiatives on production, therefore
electrical load demand. However, industry experts are concerned that if meaningful changes are made to
current public policies relating to taxation, environmental requirements or fracing processes associated with oil
exploration, extraction or production development costs could be negatively impacted. These potential changes
could have an impact on electrical load requirements going forward. The team’s conclusion was to monitor
initiatives at the federal and state level; however, all indications currently lean toward limited negative or
positive impacts for the next three to five years.

Page 80 POWER FORECAST 2012 - OCTOBER 2012
This page intentionally left blank
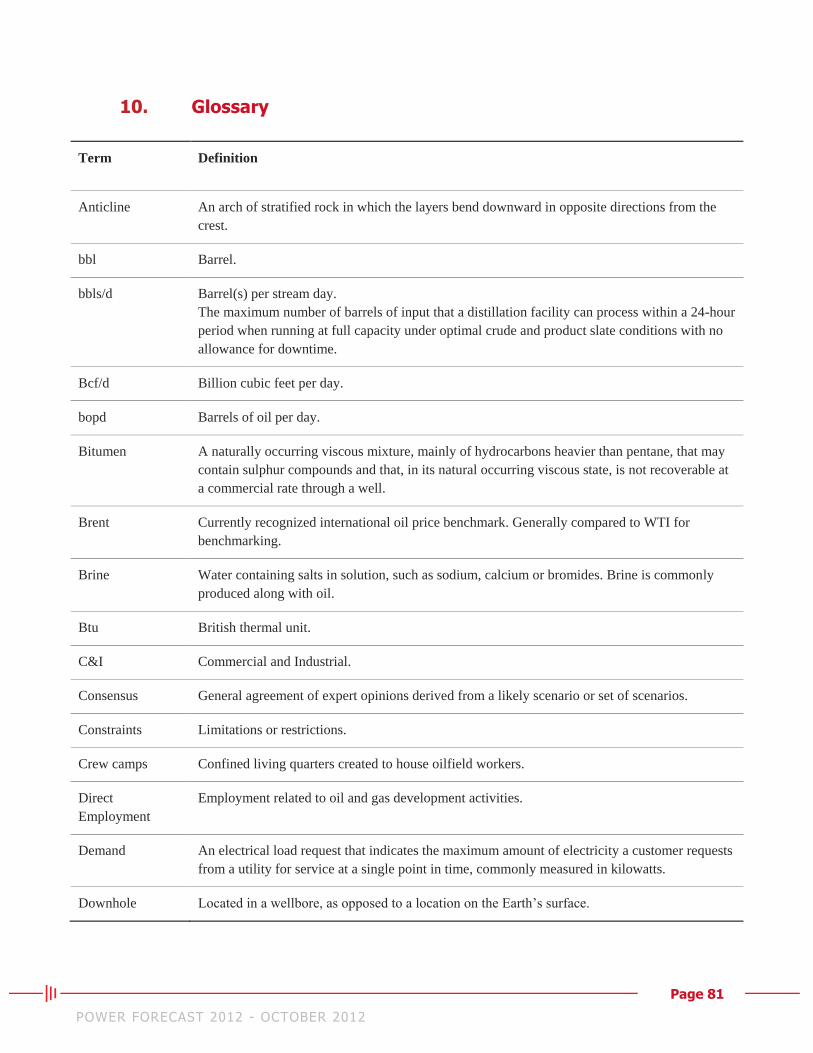
Page 81 POWER FORECAST 2012 - OCTOBER 2012
10. Glossary
Term Definition
Anticline An arch of stratified rock in which the layers bend downward in opposite directions from the
crest.
bbl Barrel.
bbls/d Barrel(s) per stream day.
The maximum number of barrels of input that a distillation facility can process within a 24-hour
period when running at full capacity under optimal crude and product slate conditions with no
allowance for downtime.
Bcf/d Billion cubic feet per day.
bopd Barrels of oil per day.
Bitumen A naturally occurring viscous mixture, mainly of hydrocarbons heavier than pentane, that may
contain sulphur compounds and that, in its natural occurring viscous state, is not recoverable at
a commercial rate through a well.
Brent Currently recognized international oil price benchmark. Generally compared to WTI for
benchmarking.
Brine Water containing salts in solution, such as sodium, calcium or bromides. Brine is commonly
produced along with oil.
Btu British thermal unit.
C&I Commercial and Industrial.
Consensus General agreement of expert opinions derived from a likely scenario or set of scenarios.
Constraints Limitations or restrictions.
Crew camps Confined living quarters created to house oilfield workers.
Direct
Employment
Employment related to oil and gas development activities.
Demand An electrical load request that indicates the maximum amount of electricity a customer requests
from a utility for service at a single point in time, commonly measured in kilowatts.
Downhole Located in a wellbore, as opposed to a location on the Earth’s surface.
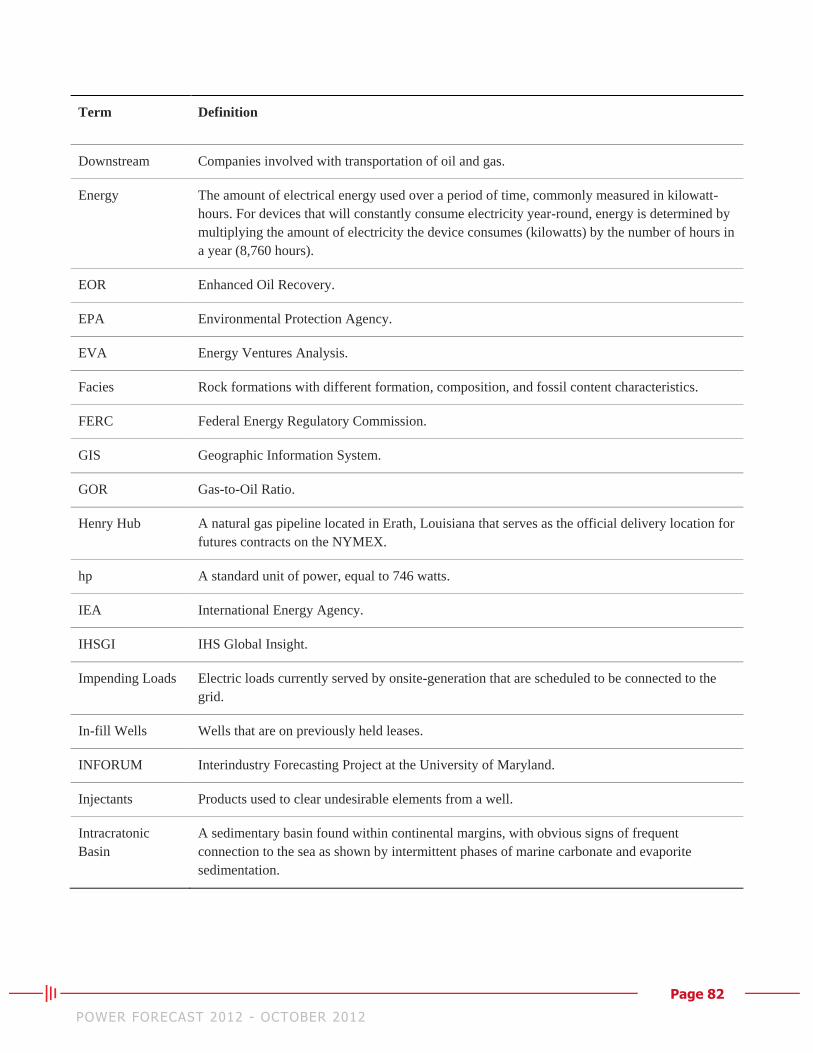
Page 82 POWER FORECAST 2012 - OCTOBER 2012
Term Definition
Downstream Companies involved with transportation of oil and gas.
Energy The amount of electrical energy used over a period of time, commonly measured in kilowatt-
hours. For devices that will constantly consume electricity year-round, energy is determined by
multiplying the amount of electricity the device consumes (kilowatts) by the number of hours in
a year (8,760 hours).
EOR Enhanced Oil Recovery.
EPA Environmental Protection Agency.
EVA Energy Ventures Analysis.
Facies Rock formations with different formation, composition, and fossil content characteristics.
FERC Federal Energy Regulatory Commission.
GIS Geographic Information System.
GOR Gas-to-Oil Ratio.
Henry Hub A natural gas pipeline located in Erath, Louisiana that serves as the official delivery location for
futures contracts on the NYMEX.
hp A standard unit of power, equal to 746 watts.
IEA International Energy Agency.
IHSGI IHS Global Insight.
Impending Loads Electric loads currently served by onsite-generation that are scheduled to be connected to the
grid.
In-fill Wells Wells that are on previously held leases.
INFORUM Interindustry Forecasting Project at the University of Maryland.
Injectants Products used to clear undesirable elements from a well.
Intracratonic
Basin
A sedimentary basin found within continental margins, with obvious signs of frequent
connection to the sea as shown by intermittent phases of marine carbonate and evaporite
sedimentation.
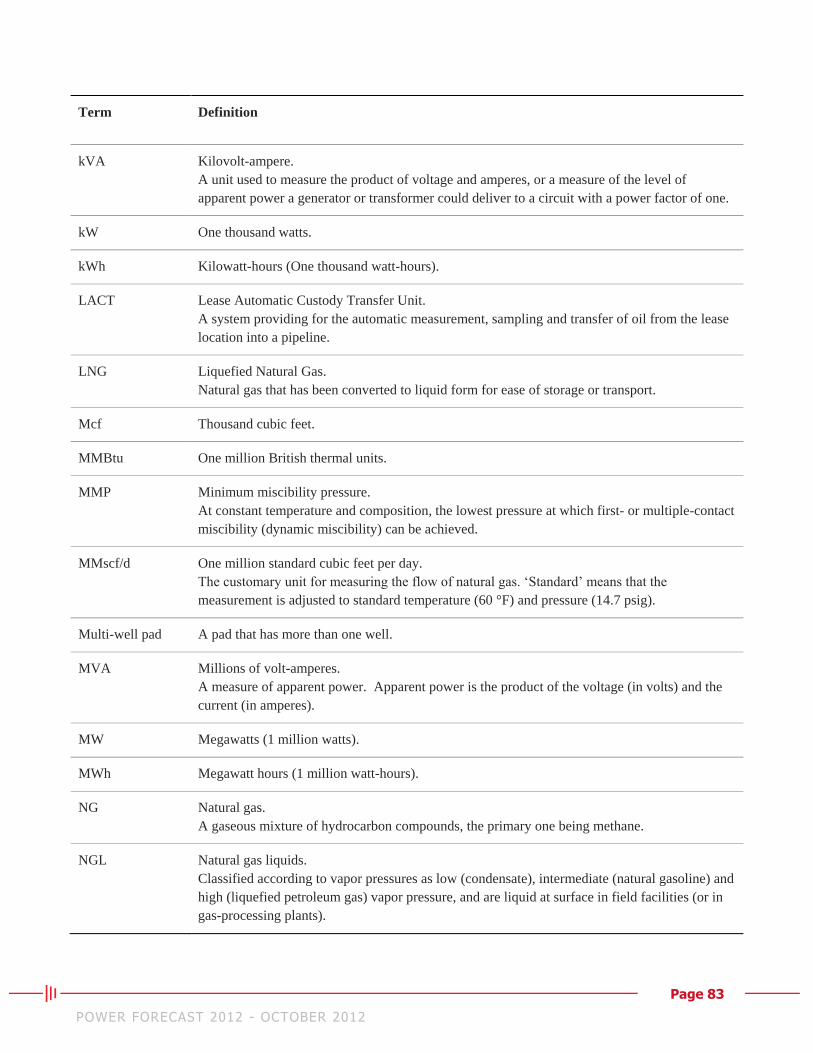
Page 83 POWER FORECAST 2012 - OCTOBER 2012
Term Definition
kVA Kilovolt-ampere.
A unit used to measure the product of voltage and amperes, or a measure of the level of
apparent power a generator or transformer could deliver to a circuit with a power factor of one.
kW One thousand watts.
kWh Kilowatt-hours (One thousand watt-hours).
LACT Lease Automatic Custody Transfer Unit.
A system providing for the automatic measurement, sampling and transfer of oil from the lease
location into a pipeline.
LNG Liquefied Natural Gas.
Natural gas that has been converted to liquid form for ease of storage or transport.
Mcf Thousand cubic feet.
MMBtu One million British thermal units.
MMP Minimum miscibility pressure.
At constant temperature and composition, the lowest pressure at which first- or multiple-contact
miscibility (dynamic miscibility) can be achieved.
MMscf/d One million standard cubic feet per day.
The customary unit for measuring the flow of natural gas. ‘Standard’ means that the
measurement is adjusted to standard temperature (60 °F) and pressure (14.7 psig).
Multi-well pad A pad that has more than one well.
MVA Millions of volt-amperes.
A measure of apparent power. Apparent power is the product of the voltage (in volts) and the
current (in amperes).
MW Megawatts (1 million watts).
MWh Megawatt hours (1 million watt-hours).
NG Natural gas.
A gaseous mixture of hydrocarbon compounds, the primary one being methane.
NGL Natural gas liquids.
Classified according to vapor pressures as low (condensate), intermediate (natural gasoline) and
high (liquefied petroleum gas) vapor pressure, and are liquid at surface in field facilities (or in
gas-processing plants).
Page 84 POWER FORECAST 2012 - OCTOBER 2012
Term Definition
NYMEX New York Mercantile Exchange.
OECD Organization for Economic Cooperative Development.
An international organization helping governments tackle the economic, social and governance
challenges of a globalized economy.
OOIP Original Oil in Place.
Estimated amount of total oil that is located in a formation. Not all oil in place is recoverable.
OPEC Organization of the Petroleum Exporting Countries.
An intergovernmental organization whose stated objective is to “coordinate and unify the
petroleum policies of member countries.” Created at the Baghdad Conference on September 10-
14, 1960.
Pad Drilling Multiple Well Pads.
Peak demand Defined in kilowatts: the amount of electrical generation capacity available at any time to
satisfy maximum load.
Permanent
Workforce
Permanent workforce is comprised of individuals who have established a permanent residence
in the state in which they work.
Primary
Infrastructure
Equipment and/or facilities directly related to developing oil and gas resources.
Proppant Particles mixed with fracturing fluid to hold fractures open after a hydraulic fracturing
treatment.
Resource Play An unconventional area that does not require any type of belowground structure to hold and
trap oil.
Rural Areas in the study region with lower populations per geographic square mile – typically higher
electrical load requirements per customer due to agriculture-based needs.
Secondary
Employment
Employment generated indirectly from oil and gas development.
Secondary
Infrastructure
Equipment and/or facilities that result from oil and gas resource development.
SWD Saltwater Disposal.
Page 85 POWER FORECAST 2012 - OCTOBER 2012
Term Definition
Temporary
Workforce
Workers who are often residents of another state and work in a location until the job is
complete and then move on to the next job site. Temporary workforce may also be shift-
workers with alternating patterns of working and non-working periods.
Tertiary recovery Traditionally, the third stage of hydrocarbon production, comprising recovery methods that
follow water flooding or pressure maintenance. The principal tertiary recovery techniques used
are thermal methods, gas injection and chemical flooding.
Transmission
Constraints
Inadequately sized transmission lines serving an area that has significant impending loads.
Trap Play Traditional or conventional oilfield in which a structural feature, such as an anticline, prevents
oil from continuing to move to the surface.
Upstream Companies involved with oilfield exploration and production.
Urban Areas in the study region which are densely populated cities and towns – typically lower
electrical load requirements per customer due to shared municipal services.
USD U.S. Dollar.
U.S. EIA United States Energy Information Administration.
VRU Vapor recovery unit.
WAG Water alternating gas.
Watt A measure of energy conversion or transfer, defined as one joule per second.
WTI West Texas Intermediate, also known as Texas light sweet, is a grade of crude oil used as a
benchmark in oil pricing.

Page 86 POWER FORECAST 2012 - OCTOBER 2012
This page intentionally left blank
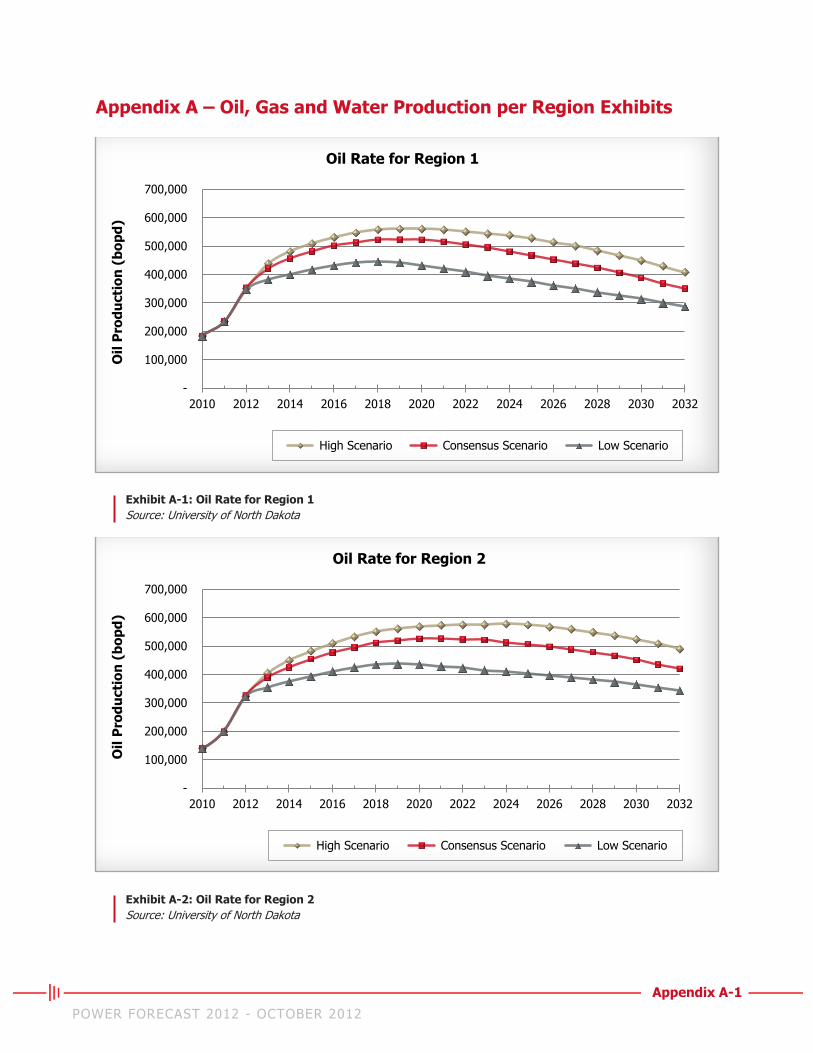
Appendix A-1
POWER FORECAST 2012 - OCTOBER 2012
Appendix A – Oil, Gas and Water Production per Region Exhibits
Exhibit A-1: Oil Rate for Region 1
Source: University of North Dakota
Exhibit A-2: Oil Rate for Region 2
Source: University of North Dakota
-
100,000
200,000
300,000
400,000
500,000
600,000
700,000
2010 2012 2014 2016 2018 2020 2022 2024 2026 2028 2030 2032
Oil
Pro
du
cti
on
(b
op
d)
Oil Rate for Region 1
High Scenario Consensus Scenario Low Scenario
-
100,000
200,000
300,000
400,000
500,000
600,000
700,000
2010 2012 2014 2016 2018 2020 2022 2024 2026 2028 2030 2032
Oil
Pro
du
cti
on
(b
op
d)
Oil Rate for Region 2
High Scenario Consensus Scenario Low Scenario
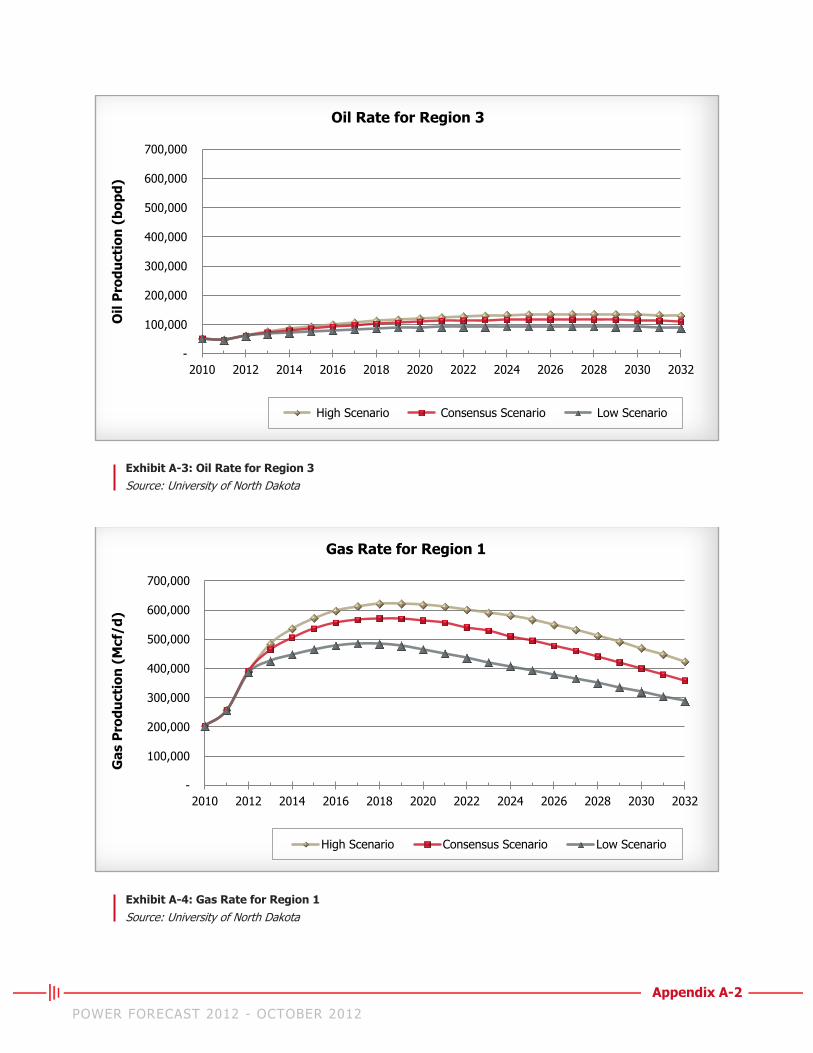
Appendix A-2
POWER FORECAST 2012 - OCTOBER 2012
Exhibit A-3: Oil Rate for Region 3
Source: University of North Dakota
Exhibit A-4: Gas Rate for Region 1
Source: University of North Dakota
-
100,000
200,000
300,000
400,000
500,000
600,000
700,000
2010 2012 2014 2016 2018 2020 2022 2024 2026 2028 2030 2032
Oil
Pro
du
cti
on
(b
op
d)
Oil Rate for Region 3
High Scenario Consensus Scenario Low Scenario
-
100,000
200,000
300,000
400,000
500,000
600,000
700,000
2010 2012 2014 2016 2018 2020 2022 2024 2026 2028 2030 2032
Ga
s P
rod
ucti
on
(M
cf/
d)
Gas Rate for Region 1
High Scenario Consensus Scenario Low Scenario
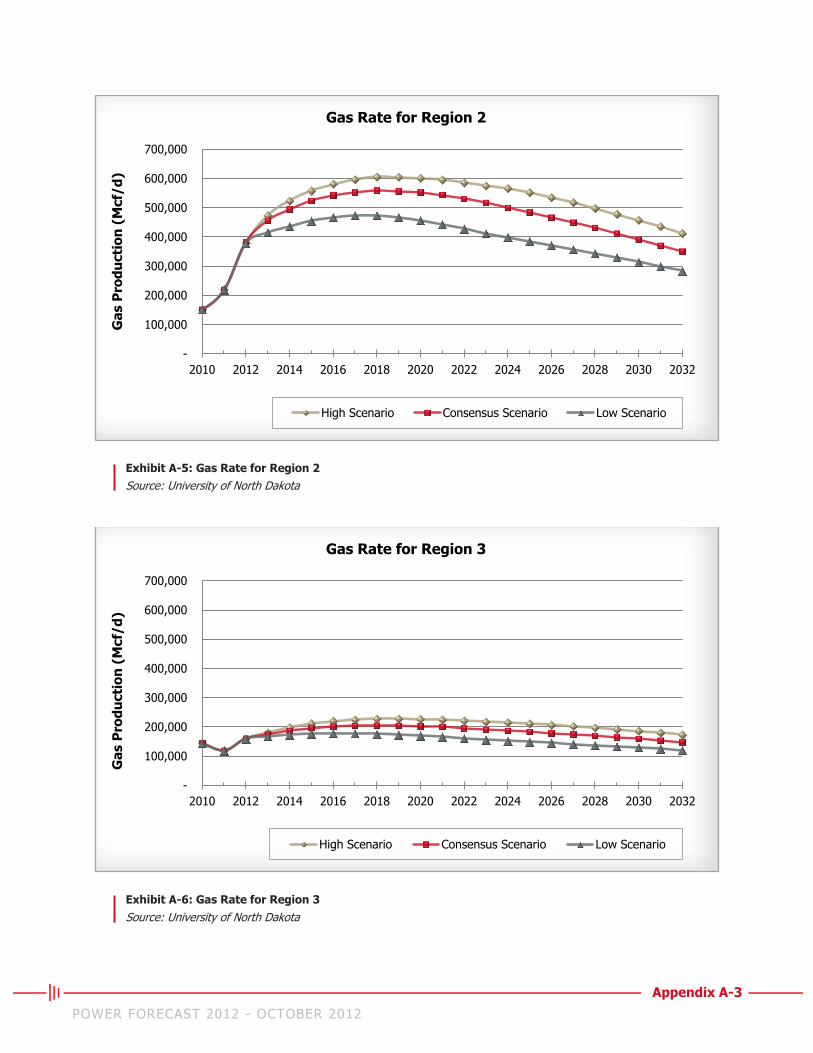
Appendix A-3
POWER FORECAST 2012 - OCTOBER 2012
Exhibit A-5: Gas Rate for Region 2
Source: University of North Dakota
Exhibit A-6: Gas Rate for Region 3
Source: University of North Dakota
-
100,000
200,000
300,000
400,000
500,000
600,000
700,000
2010 2012 2014 2016 2018 2020 2022 2024 2026 2028 2030 2032
Ga
s P
rod
ucti
on
(M
cf/
d)
Gas Rate for Region 2
High Scenario Consensus Scenario Low Scenario
-
100,000
200,000
300,000
400,000
500,000
600,000
700,000
2010 2012 2014 2016 2018 2020 2022 2024 2026 2028 2030 2032
Ga
s P
rod
ucti
on
(M
cf/
d)
Gas Rate for Region 3
High Scenario Consensus Scenario Low Scenario
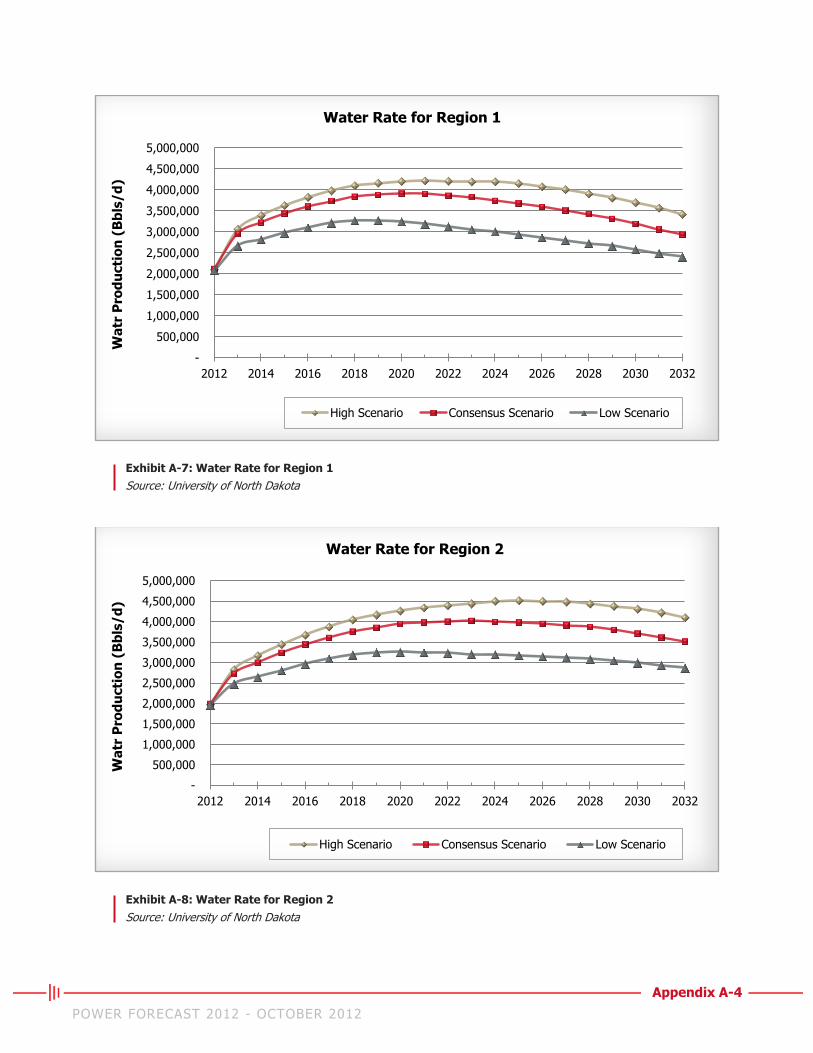
Appendix A-4
POWER FORECAST 2012 - OCTOBER 2012
Exhibit A-7: Water Rate for Region 1
Source: University of North Dakota
Exhibit A-8: Water Rate for Region 2
Source: University of North Dakota
-
500,000
1,000,000
1,500,000
2,000,000
2,500,000
3,000,000
3,500,000
4,000,000
4,500,000
5,000,000
2012 2014 2016 2018 2020 2022 2024 2026 2028 2030 2032
Wa
tr P
rod
ucti
on
(B
bls
/d
)
Water Rate for Region 1
High Scenario Consensus Scenario Low Scenario
-
500,000
1,000,000
1,500,000
2,000,000
2,500,000
3,000,000
3,500,000
4,000,000
4,500,000
5,000,000
2012 2014 2016 2018 2020 2022 2024 2026 2028 2030 2032
Wa
tr P
rod
ucti
on
(B
bls
/d
)
Water Rate for Region 2
High Scenario Consensus Scenario Low Scenario
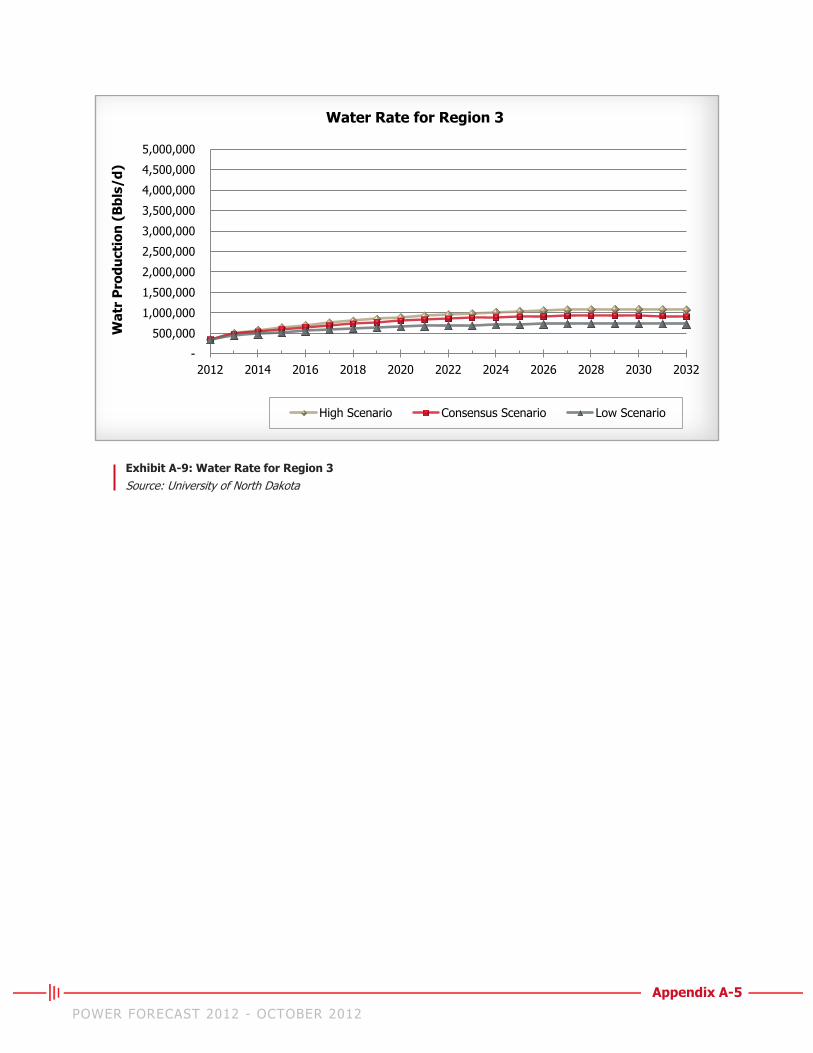
Appendix A-5
POWER FORECAST 2012 - OCTOBER 2012
Exhibit A-9: Water Rate for Region 3
Source: University of North Dakota
-
500,000
1,000,000
1,500,000
2,000,000
2,500,000
3,000,000
3,500,000
4,000,000
4,500,000
5,000,000
2012 2014 2016 2018 2020 2022 2024 2026 2028 2030 2032
Wa
tr P
rod
ucti
on
(B
bls
/d
) Water Rate for Region 3
High Scenario Consensus Scenario Low Scenario

Appendix A-6
POWER FORECAST 2012 - OCTOBER 2012
This page intentionally left blank
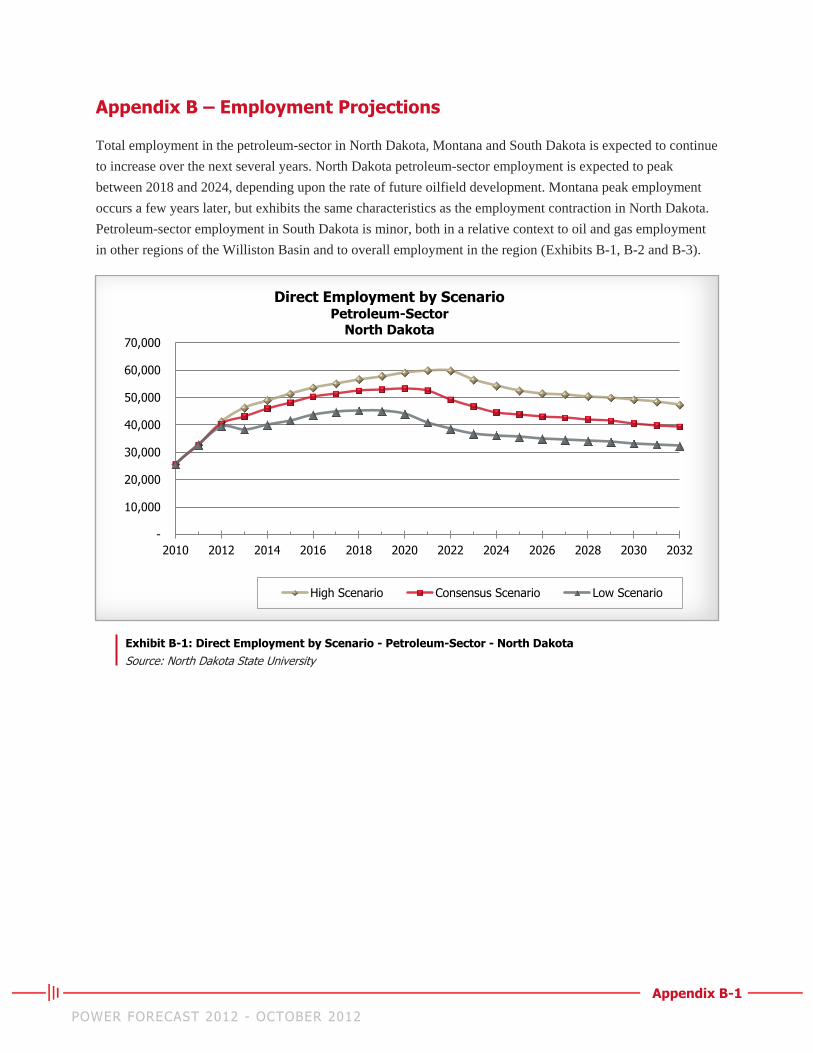
Appendix B-1
POWER FORECAST 2012 - OCTOBER 2012
Appendix B – Employment Projections
Total employment in the petroleum-sector in North Dakota, Montana and South Dakota is expected to continue
to increase over the next several years. North Dakota petroleum-sector employment is expected to peak
between 2018 and 2024, depending upon the rate of future oilfield development. Montana peak employment
occurs a few years later, but exhibits the same characteristics as the employment contraction in North Dakota.
Petroleum-sector employment in South Dakota is minor, both in a relative context to oil and gas employment
in other regions of the Williston Basin and to overall employment in the region (Exhibits B-1, B-2 and B-3).
Exhibit B-1: Direct Employment by Scenario - Petroleum-Sector - North Dakota
Source: North Dakota State University
-
10,000
20,000
30,000
40,000
50,000
60,000
70,000
2010 2012 2014 2016 2018 2020 2022 2024 2026 2028 2030 2032
Direct Employment by Scenario Petroleum-Sector
North Dakota
High Scenario Consensus Scenario Low Scenario
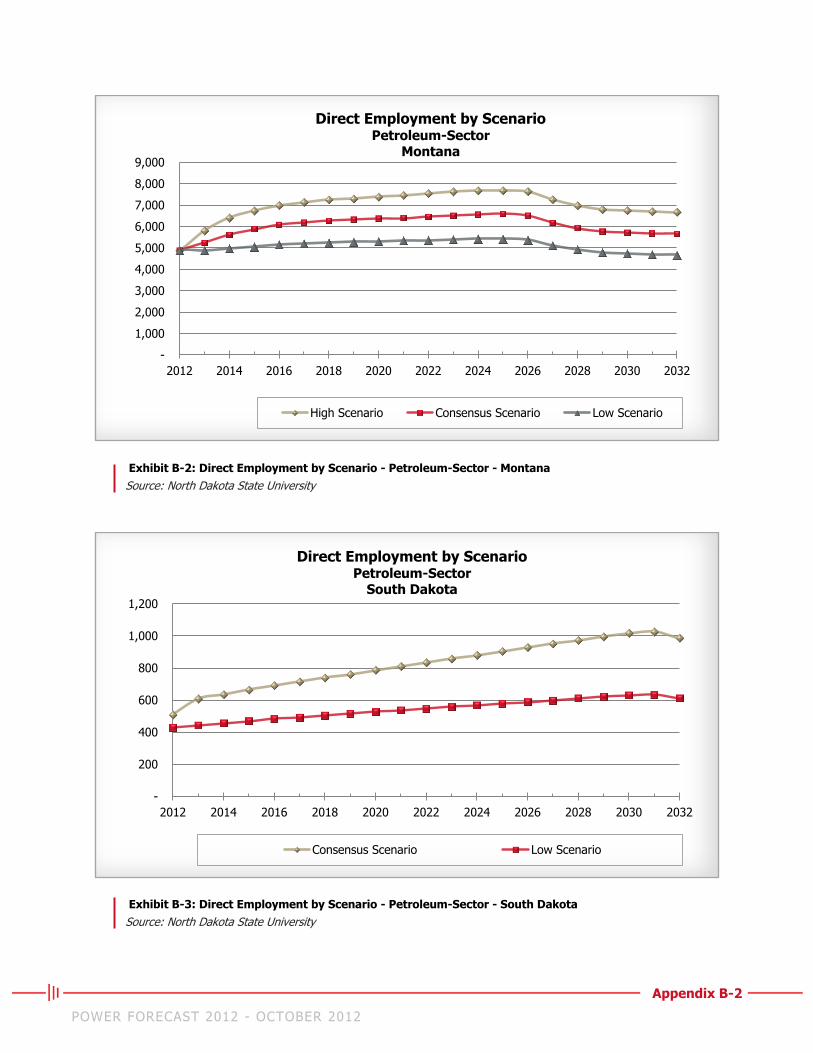
Appendix B-2
POWER FORECAST 2012 - OCTOBER 2012
Exhibit B-2: Direct Employment by Scenario - Petroleum-Sector - Montana
Source: North Dakota State University
Exhibit B-3: Direct Employment by Scenario - Petroleum-Sector - South Dakota
Source: North Dakota State University
-
1,000
2,000
3,000
4,000
5,000
6,000
7,000
8,000
9,000
2012 2014 2016 2018 2020 2022 2024 2026 2028 2030 2032
Direct Employment by Scenario Petroleum-Sector
Montana
High Scenario Consensus Scenario Low Scenario
-
200
400
600
800
1,000
1,200
2012 2014 2016 2018 2020 2022 2024 2026 2028 2030 2032
Direct Employment by Scenario Petroleum-Sector
South Dakota
Consensus Scenario Low Scenario
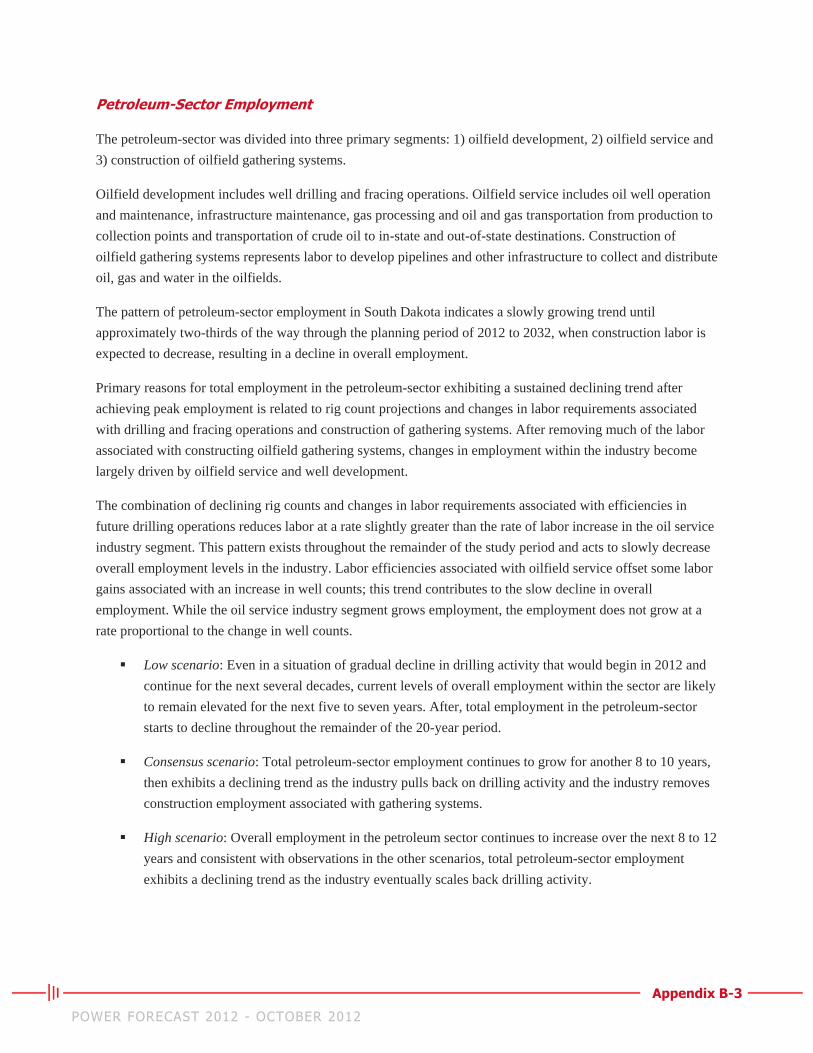
Appendix B-3
POWER FORECAST 2012 - OCTOBER 2012
Petroleum-Sector Employment
The petroleum-sector was divided into three primary segments: 1) oilfield development, 2) oilfield service and
3) construction of oilfield gathering systems.
Oilfield development includes well drilling and fracing operations. Oilfield service includes oil well operation
and maintenance, infrastructure maintenance, gas processing and oil and gas transportation from production to
collection points and transportation of crude oil to in-state and out-of-state destinations. Construction of
oilfield gathering systems represents labor to develop pipelines and other infrastructure to collect and distribute
oil, gas and water in the oilfields.
The pattern of petroleum-sector employment in South Dakota indicates a slowly growing trend until
approximately two-thirds of the way through the planning period of 2012 to 2032, when construction labor is
expected to decrease, resulting in a decline in overall employment.
Primary reasons for total employment in the petroleum-sector exhibiting a sustained declining trend after
achieving peak employment is related to rig count projections and changes in labor requirements associated
with drilling and fracing operations and construction of gathering systems. After removing much of the labor
associated with constructing oilfield gathering systems, changes in employment within the industry become
largely driven by oilfield service and well development.
The combination of declining rig counts and changes in labor requirements associated with efficiencies in
future drilling operations reduces labor at a rate slightly greater than the rate of labor increase in the oil service
industry segment. This pattern exists throughout the remainder of the study period and acts to slowly decrease
overall employment levels in the industry. Labor efficiencies associated with oilfield service offset some labor
gains associated with an increase in well counts; this trend contributes to the slow decline in overall
employment. While the oil service industry segment grows employment, the employment does not grow at a
rate proportional to the change in well counts.
Low scenario: Even in a situation of gradual decline in drilling activity that would begin in 2012 and
continue for the next several decades, current levels of overall employment within the sector are likely
to remain elevated for the next five to seven years. After, total employment in the petroleum-sector
starts to decline throughout the remainder of the 20-year period.
Consensus scenario: Total petroleum-sector employment continues to grow for another 8 to 10 years,
then exhibits a declining trend as the industry pulls back on drilling activity and the industry removes
construction employment associated with gathering systems.
High scenario: Overall employment in the petroleum sector continues to increase over the next 8 to 12
years and consistent with observations in the other scenarios, total petroleum-sector employment
exhibits a declining trend as the industry eventually scales back drilling activity.
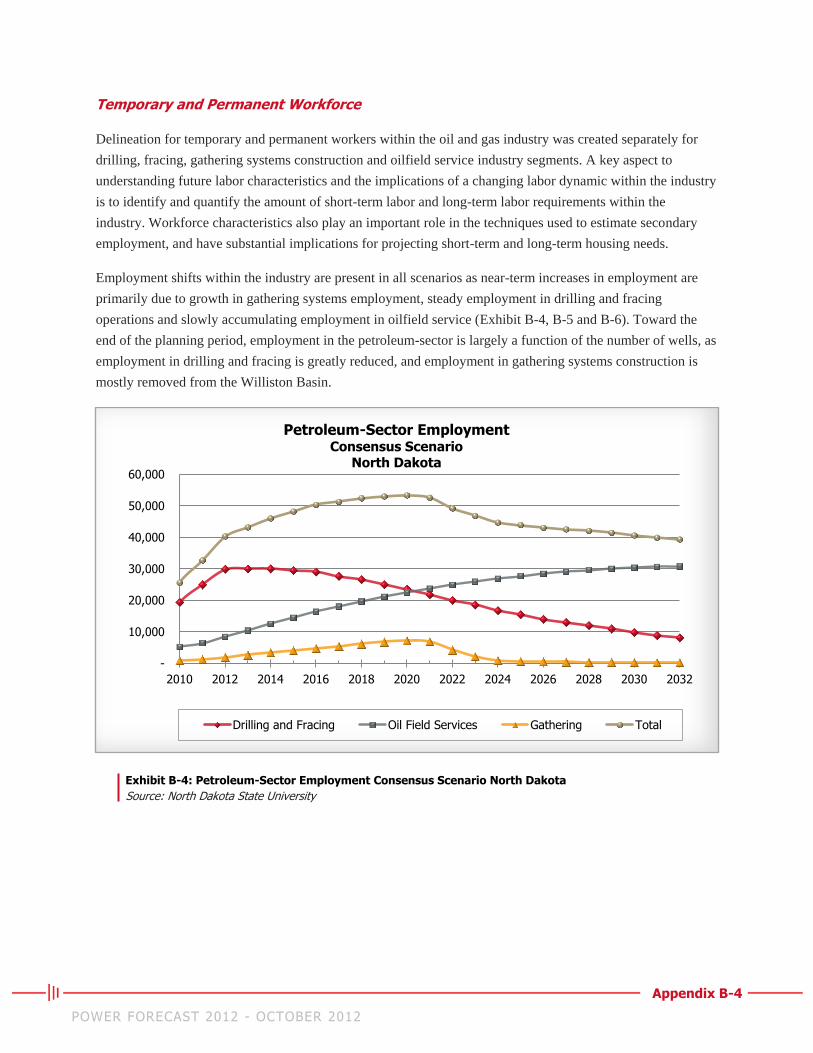
Appendix B-4
POWER FORECAST 2012 - OCTOBER 2012
Temporary and Permanent Workforce
Delineation for temporary and permanent workers within the oil and gas industry was created separately for
drilling, fracing, gathering systems construction and oilfield service industry segments. A key aspect to
understanding future labor characteristics and the implications of a changing labor dynamic within the industry
is to identify and quantify the amount of short-term labor and long-term labor requirements within the
industry. Workforce characteristics also play an important role in the techniques used to estimate secondary
employment, and have substantial implications for projecting short-term and long-term housing needs.
Employment shifts within the industry are present in all scenarios as near-term increases in employment are
primarily due to growth in gathering systems employment, steady employment in drilling and fracing
operations and slowly accumulating employment in oilfield service (Exhibit B-4, B-5 and B-6). Toward the
end of the planning period, employment in the petroleum-sector is largely a function of the number of wells, as
employment in drilling and fracing is greatly reduced, and employment in gathering systems construction is
mostly removed from the Williston Basin.
Exhibit B-4: Petroleum-Sector Employment Consensus Scenario North Dakota
Source: North Dakota State University
-
10,000
20,000
30,000
40,000
50,000
60,000
2010 2012 2014 2016 2018 2020 2022 2024 2026 2028 2030 2032
Petroleum-Sector Employment Consensus Scenario
North Dakota
Drilling and Fracing Oil Field Services Gathering Total
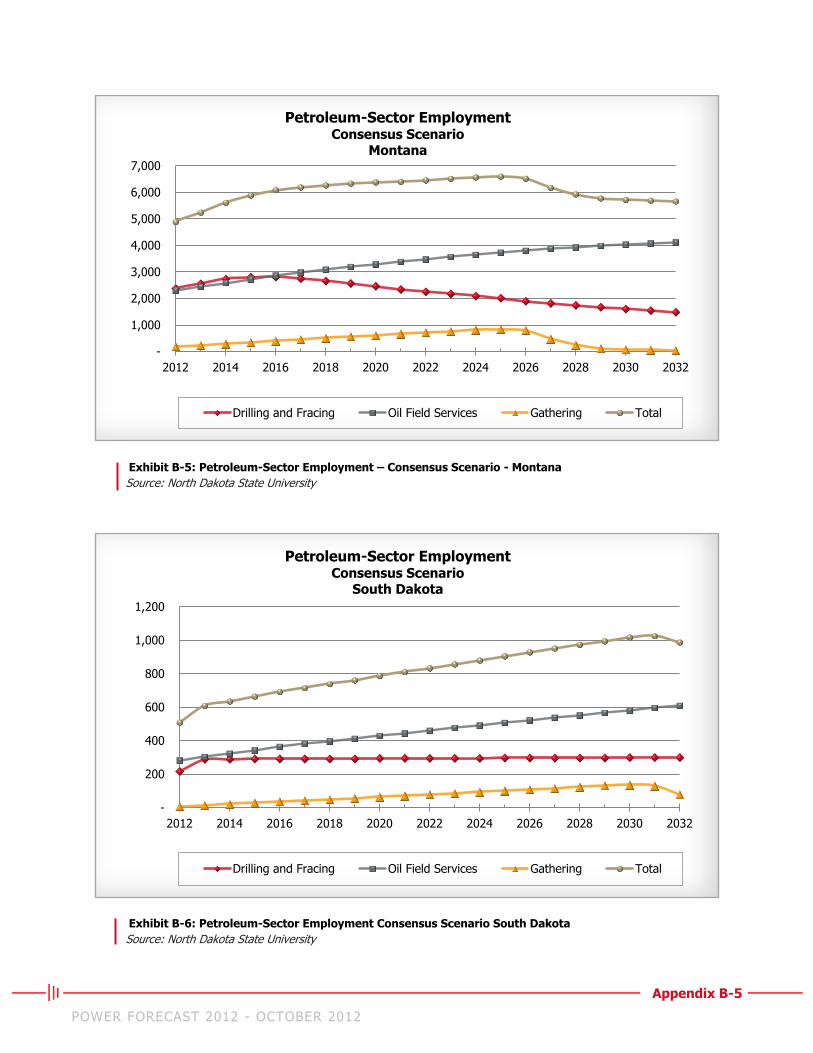
Appendix B-5
POWER FORECAST 2012 - OCTOBER 2012
Exhibit B-5: Petroleum-Sector Employment – Consensus Scenario - Montana
Source: North Dakota State University
Exhibit B-6: Petroleum-Sector Employment Consensus Scenario South Dakota
Source: North Dakota State University
-
1,000
2,000
3,000
4,000
5,000
6,000
7,000
2012 2014 2016 2018 2020 2022 2024 2026 2028 2030 2032
Petroleum-Sector Employment Consensus Scenario
Montana
Drilling and Fracing Oil Field Services Gathering Total
-
200
400
600
800
1,000
1,200
2012 2014 2016 2018 2020 2022 2024 2026 2028 2030 2032
Petroleum-Sector Employment Consensus Scenario
South Dakota
Drilling and Fracing Oil Field Services Gathering Total
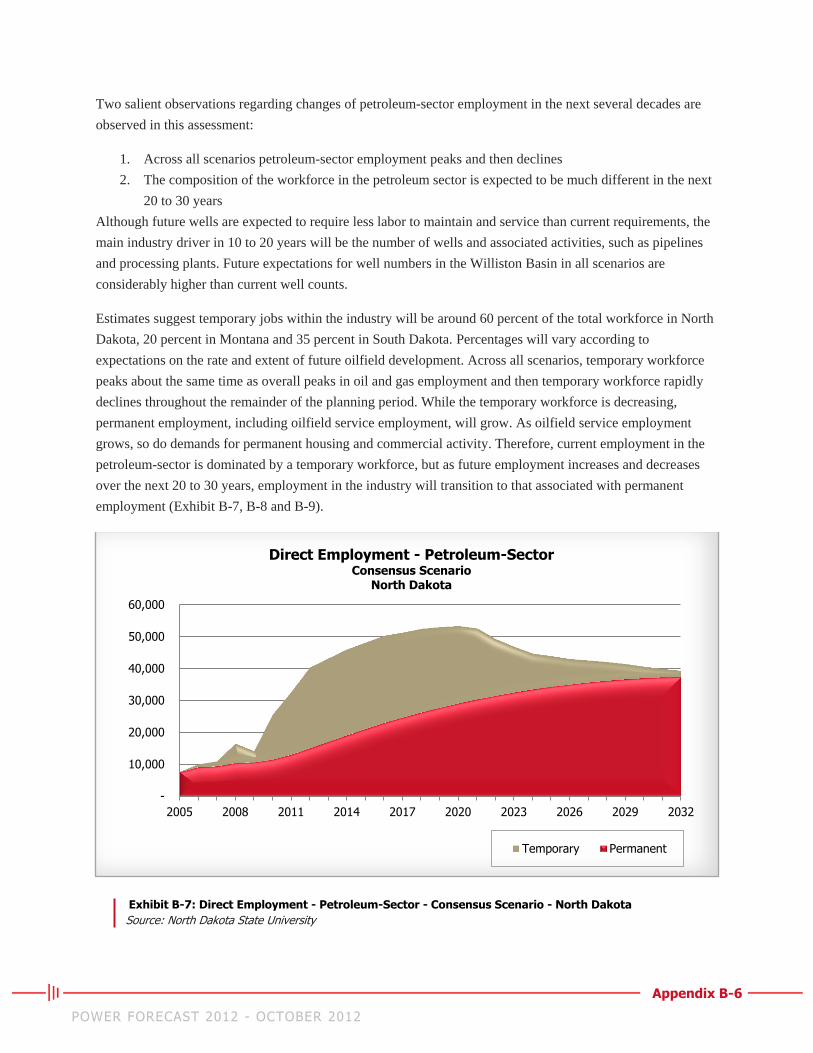
Appendix B-6
POWER FORECAST 2012 - OCTOBER 2012
Two salient observations regarding changes of petroleum-sector employment in the next several decades are
observed in this assessment:
1. Across all scenarios petroleum-sector employment peaks and then declines
2. The composition of the workforce in the petroleum sector is expected to be much different in the next
20 to 30 years
Although future wells are expected to require less labor to maintain and service than current requirements, the
main industry driver in 10 to 20 years will be the number of wells and associated activities, such as pipelines
and processing plants. Future expectations for well numbers in the Williston Basin in all scenarios are
considerably higher than current well counts.
Estimates suggest temporary jobs within the industry will be around 60 percent of the total workforce in North
Dakota, 20 percent in Montana and 35 percent in South Dakota. Percentages will vary according to
expectations on the rate and extent of future oilfield development. Across all scenarios, temporary workforce
peaks about the same time as overall peaks in oil and gas employment and then temporary workforce rapidly
declines throughout the remainder of the planning period. While the temporary workforce is decreasing,
permanent employment, including oilfield service employment, will grow. As oilfield service employment
grows, so do demands for permanent housing and commercial activity. Therefore, current employment in the
petroleum-sector is dominated by a temporary workforce, but as future employment increases and decreases
over the next 20 to 30 years, employment in the industry will transition to that associated with permanent
employment (Exhibit B-7, B-8 and B-9).
Exhibit B-7: Direct Employment - Petroleum-Sector - Consensus Scenario - North Dakota
Source: North Dakota State University
-
10,000
20,000
30,000
40,000
50,000
60,000
2005 2008 2011 2014 2017 2020 2023 2026 2029 2032
Direct Employment - Petroleum-Sector Consensus Scenario
North Dakota
Temporary Permanent
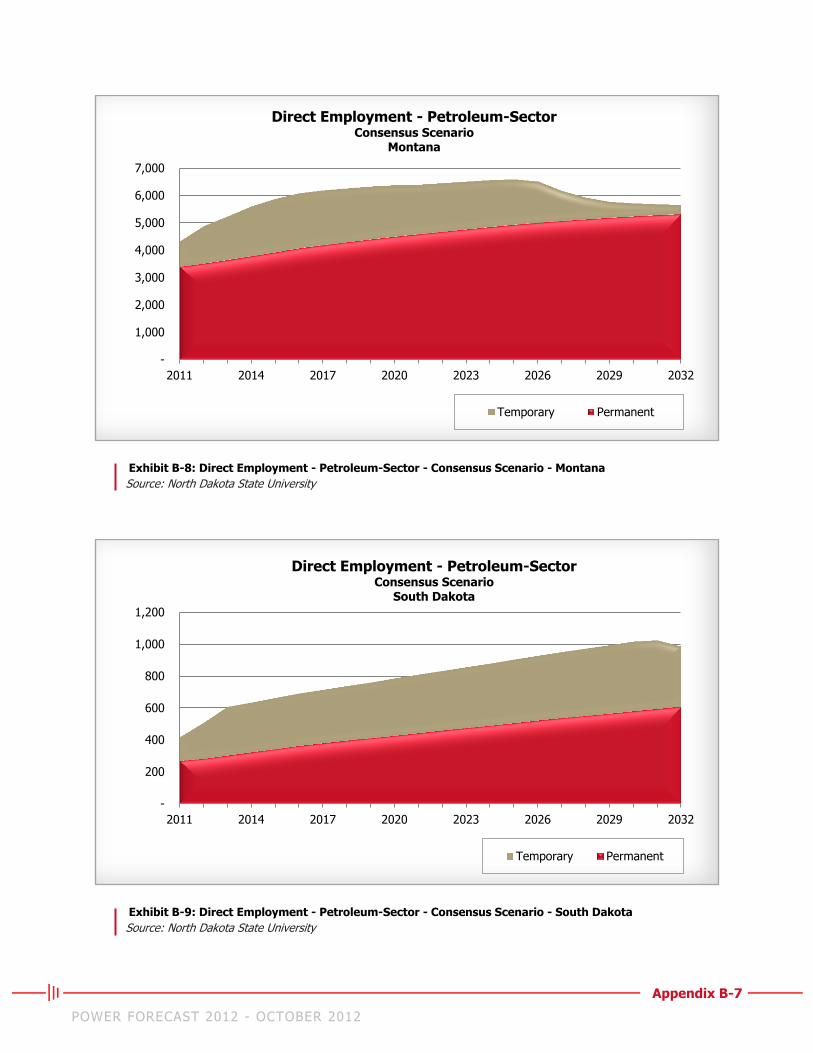
Appendix B-7
POWER FORECAST 2012 - OCTOBER 2012
Exhibit B-8: Direct Employment - Petroleum-Sector - Consensus Scenario - Montana
Source: North Dakota State University
Exhibit B-9: Direct Employment - Petroleum-Sector - Consensus Scenario - South Dakota
Source: North Dakota State University
-
1,000
2,000
3,000
4,000
5,000
6,000
7,000
2011 2014 2017 2020 2023 2026 2029 2032
Direct Employment - Petroleum-Sector Consensus Scenario
Montana
Temporary Permanent
-
200
400
600
800
1,000
1,200
2011 2014 2017 2020 2023 2026 2029 2032
Direct Employment - Petroleum-Sector Consensus Scenario
South Dakota
Temporary Permanent
Appendix B-8
POWER FORECAST 2012 - OCTOBER 2012
Regional Employment
Total future employment in the Williston Basin includes both permanent and temporary employment, and is a
function of change in base employment and change in direct and secondary employment associated with the
petroleum-sector. Employment constraints (such as housing, wages and labor force availability) are included in
estimates of base employment, petroleum-sector direct employment and secondary employment.
Total employment in the Williston Basin, among the three states in this study, continues to increase in the
near-term (Exhibit B-10, B-11 and B-12) due largely to expansion of petroleum-sector employment. Total
regional employment is expected to decline at the point corresponding to peak petroleum-sector employment.
This is largely due to anticipated rapid reductions in construction employment upon completion of oilfield-
gathering systems. However, several factors are expected to contribute to a stabilization and subsequent
modest growth of overall regional employment in later stages of the planning period.
The sharp and pronounced employment contraction in the petroleum-sector is largely expected to be associated
with temporary construction employment. Removal of a large portion of temporary workforce reduces
constraints on housing. Simultaneously, permanent workforce continues to grow, enhancing demand for long-
term delivery of services and commercial activity.
Over the same period, reductions in housing constraints are expected as communities and trade centers have
sufficient time to coordinate construction of long-term housing allowing the economy in the Williston Basin to
begin addressing labor needs for service and commercial operations. Further, with a growing labor force and
reductions in housing constraints, constraints on growth in base employment (all other industries) are expected
to moderate slightly. These dynamic elements of regional employment combine for a long-term employment
stabilization in the Williston Basin after an expected contraction in petroleum-sector employment. The
following charts utilize a planning region where possible, such as State Planning Region 1, 2 and 8, as utilized
by the North Dakota Department of Commerce (Exhibit B-10). These North Dakota planning regions are
separate from the PF 12 study regions; however, they help determine population and housing impact.
Despite overall employment in the Williston Basin stabilizing after the contraction in petroleum-sector
employment, the consequences and effects of the petroleum-sector employment change are not equally shared
in all regions of the study area.
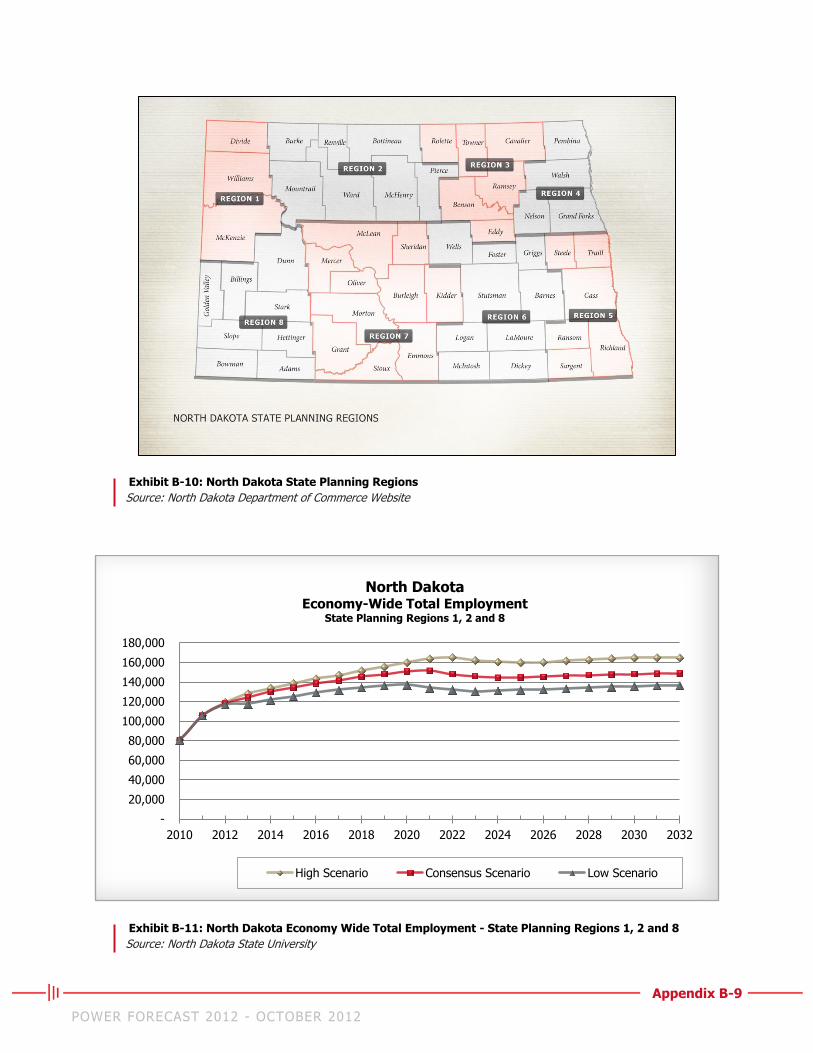
Appendix B-9
POWER FORECAST 2012 - OCTOBER 2012
Exhibit B-10: North Dakota State Planning Regions
Source: North Dakota Department of Commerce Website
Exhibit B-11: North Dakota Economy Wide Total Employment - State Planning Regions 1, 2 and 8
Source: North Dakota State University
-
20,000
40,000
60,000
80,000
100,000
120,000
140,000
160,000
180,000
2010 2012 2014 2016 2018 2020 2022 2024 2026 2028 2030 2032
North Dakota Economy-Wide Total Employment
State Planning Regions 1, 2 and 8
High Scenario Consensus Scenario Low Scenario
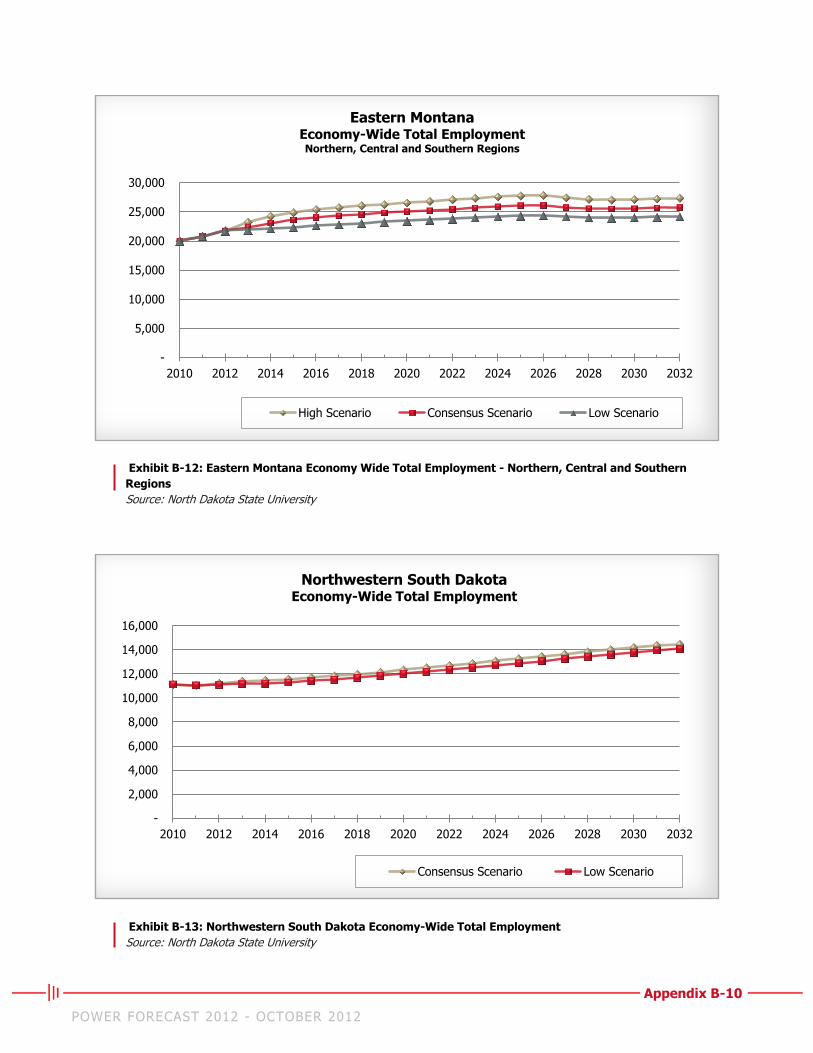
Appendix B-10
POWER FORECAST 2012 - OCTOBER 2012
Exhibit B-12: Eastern Montana Economy Wide Total Employment - Northern, Central and Southern
Regions
Source: North Dakota State University
Exhibit B-13: Northwestern South Dakota Economy-Wide Total Employment
Source: North Dakota State University
-
5,000
10,000
15,000
20,000
25,000
30,000
2010 2012 2014 2016 2018 2020 2022 2024 2026 2028 2030 2032
Eastern Montana Economy-Wide Total Employment Northern, Central and Southern Regions
High Scenario Consensus Scenario Low Scenario
-
2,000
4,000
6,000
8,000
10,000
12,000
14,000
16,000
2010 2012 2014 2016 2018 2020 2022 2024 2026 2028 2030 2032
Northwestern South Dakota Economy-Wide Total Employment
Consensus Scenario Low Scenario
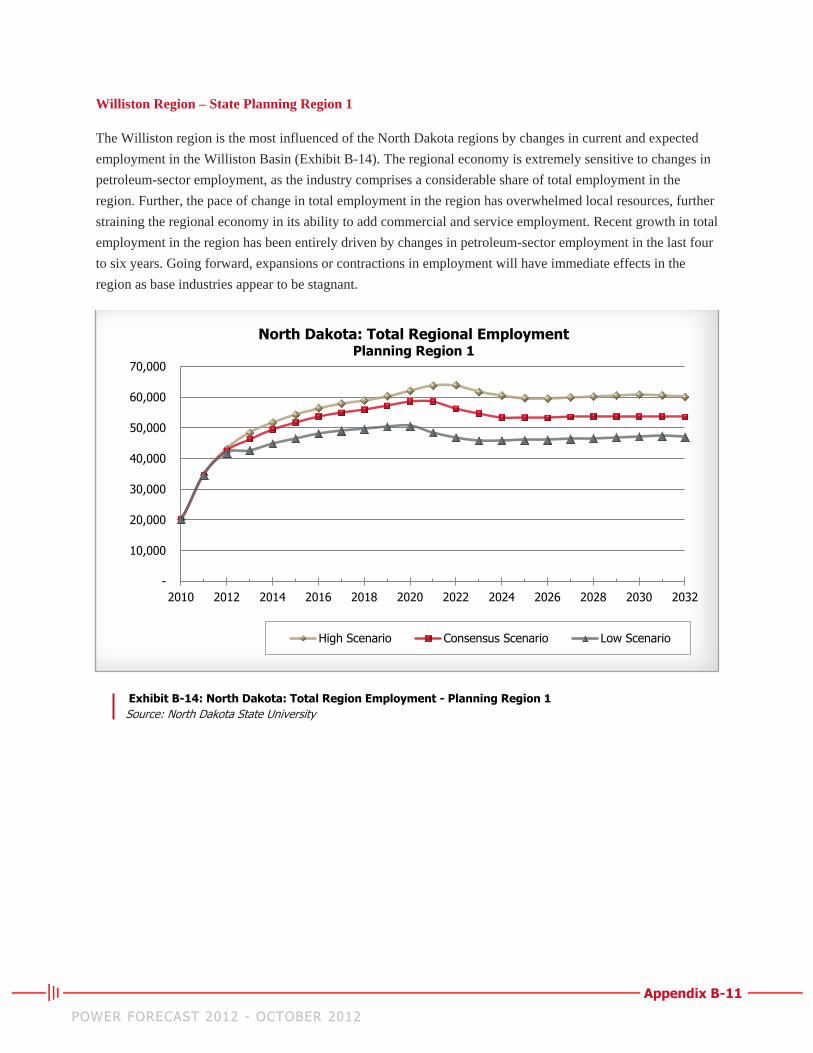
Appendix B-11
POWER FORECAST 2012 - OCTOBER 2012
Williston Region – State Planning Region 1
The Williston region is the most influenced of the North Dakota regions by changes in current and expected
employment in the Williston Basin (Exhibit B-14). The regional economy is extremely sensitive to changes in
petroleum-sector employment, as the industry comprises a considerable share of total employment in the
region. Further, the pace of change in total employment in the region has overwhelmed local resources, further
straining the regional economy in its ability to add commercial and service employment. Recent growth in total
employment in the region has been entirely driven by changes in petroleum-sector employment in the last four
to six years. Going forward, expansions or contractions in employment will have immediate effects in the
region as base industries appear to be stagnant.
Exhibit B-14: North Dakota: Total Region Employment - Planning Region 1
Source: North Dakota State University
-
10,000
20,000
30,000
40,000
50,000
60,000
70,000
2010 2012 2014 2016 2018 2020 2022 2024 2026 2028 2030 2032
North Dakota: Total Regional Employment Planning Region 1
High Scenario Consensus Scenario Low Scenario
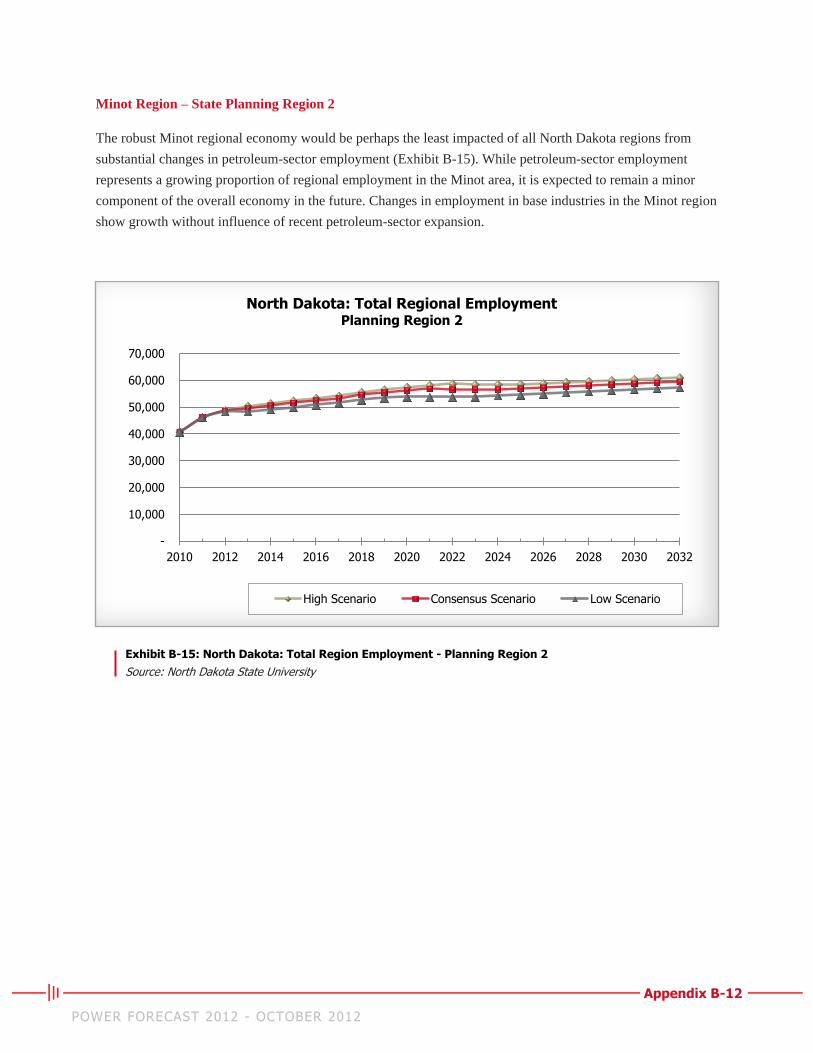
Appendix B-12
POWER FORECAST 2012 - OCTOBER 2012
Minot Region – State Planning Region 2
The robust Minot regional economy would be perhaps the least impacted of all North Dakota regions from
substantial changes in petroleum-sector employment (Exhibit B-15). While petroleum-sector employment
represents a growing proportion of regional employment in the Minot area, it is expected to remain a minor
component of the overall economy in the future. Changes in employment in base industries in the Minot region
show growth without influence of recent petroleum-sector expansion.
Exhibit B-15: North Dakota: Total Region Employment - Planning Region 2
Source: North Dakota State University
-
10,000
20,000
30,000
40,000
50,000
60,000
70,000
2010 2012 2014 2016 2018 2020 2022 2024 2026 2028 2030 2032
North Dakota: Total Regional Employment Planning Region 2
High Scenario Consensus Scenario Low Scenario
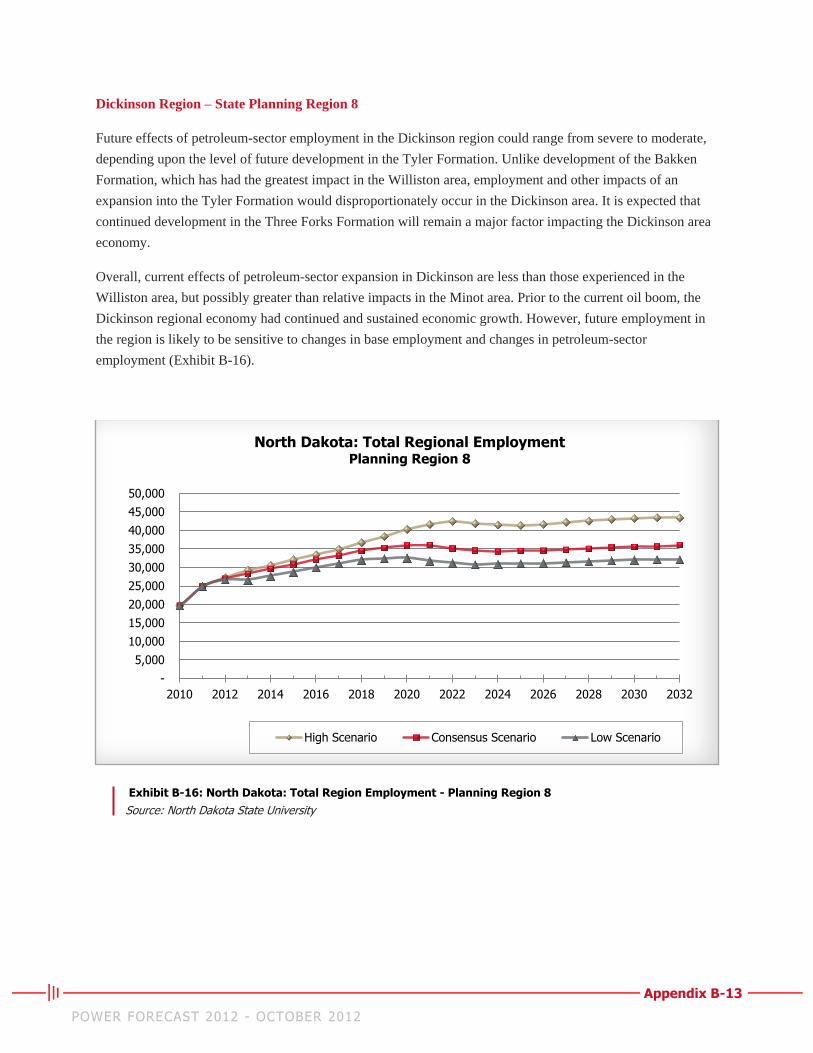
Appendix B-13
POWER FORECAST 2012 - OCTOBER 2012
Dickinson Region – State Planning Region 8
Future effects of petroleum-sector employment in the Dickinson region could range from severe to moderate,
depending upon the level of future development in the Tyler Formation. Unlike development of the Bakken
Formation, which has had the greatest impact in the Williston area, employment and other impacts of an
expansion into the Tyler Formation would disproportionately occur in the Dickinson area. It is expected that
continued development in the Three Forks Formation will remain a major factor impacting the Dickinson area
economy.
Overall, current effects of petroleum-sector expansion in Dickinson are less than those experienced in the
Williston area, but possibly greater than relative impacts in the Minot area. Prior to the current oil boom, the
Dickinson regional economy had continued and sustained economic growth. However, future employment in
the region is likely to be sensitive to changes in base employment and changes in petroleum-sector
employment (Exhibit B-16).
Exhibit B-16: North Dakota: Total Region Employment - Planning Region 8
Source: North Dakota State University
-
5,000
10,000
15,000
20,000
25,000
30,000
35,000
40,000
45,000
50,000
2010 2012 2014 2016 2018 2020 2022 2024 2026 2028 2030 2032
North Dakota: Total Regional Employment Planning Region 8
High Scenario Consensus Scenario Low Scenario
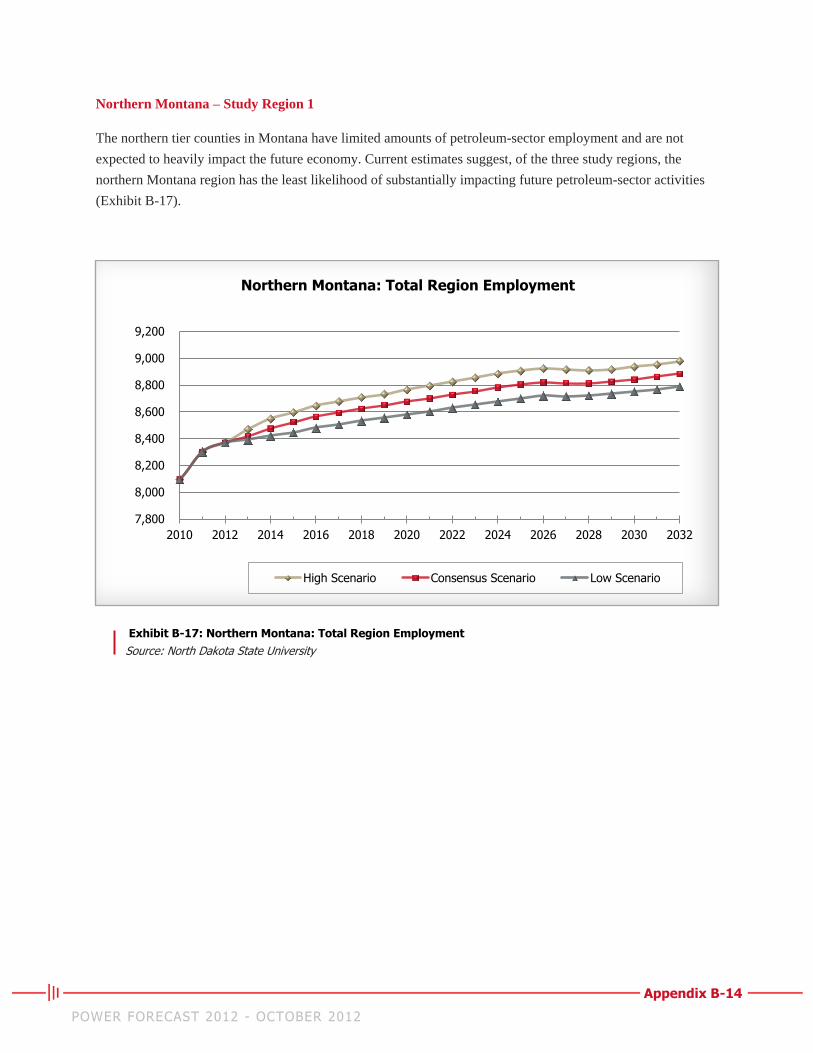
Appendix B-14
POWER FORECAST 2012 - OCTOBER 2012
Northern Montana – Study Region 1
The northern tier counties in Montana have limited amounts of petroleum-sector employment and are not
expected to heavily impact the future economy. Current estimates suggest, of the three study regions, the
northern Montana region has the least likelihood of substantially impacting future petroleum-sector activities
(Exhibit B-17).
Exhibit B-17: Northern Montana: Total Region Employment
Source: North Dakota State University
7,800
8,000
8,200
8,400
8,600
8,800
9,000
9,200
2010 2012 2014 2016 2018 2020 2022 2024 2026 2028 2030 2032
Northern Montana: Total Region Employment
High Scenario Consensus Scenario Low Scenario
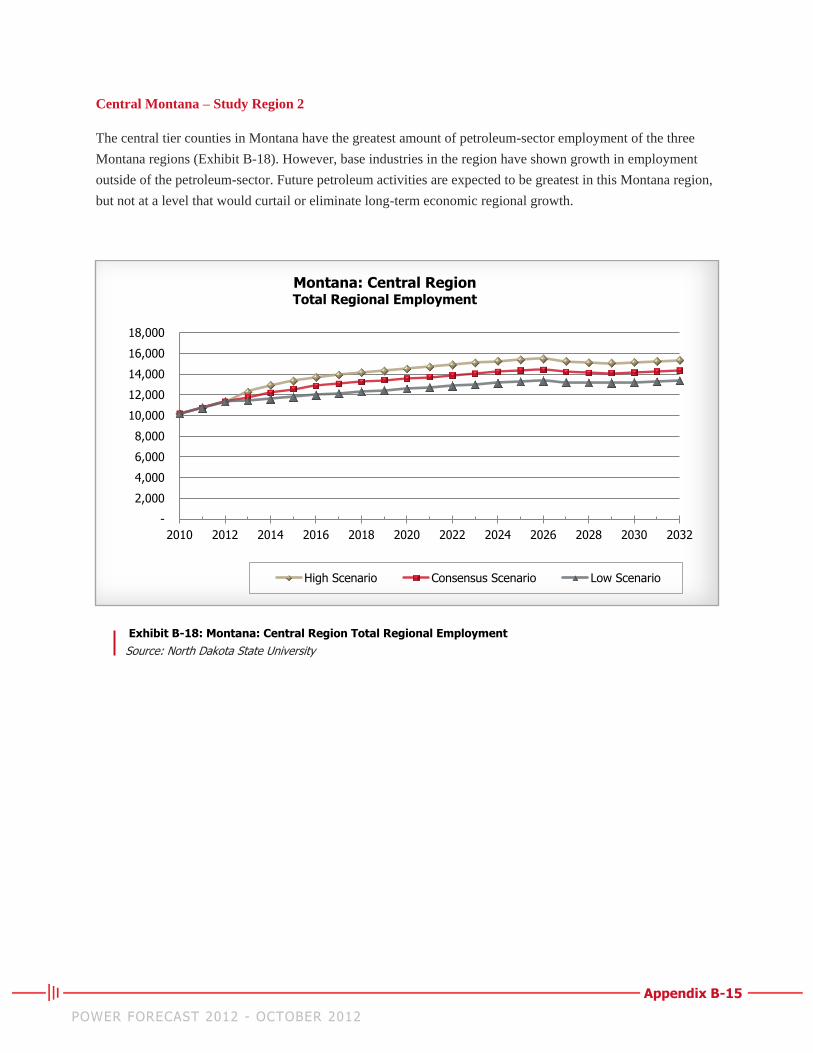
Appendix B-15
POWER FORECAST 2012 - OCTOBER 2012
Central Montana – Study Region 2
The central tier counties in Montana have the greatest amount of petroleum-sector employment of the three
Montana regions (Exhibit B-18). However, base industries in the region have shown growth in employment
outside of the petroleum-sector. Future petroleum activities are expected to be greatest in this Montana region,
but not at a level that would curtail or eliminate long-term economic regional growth.
Exhibit B-18: Montana: Central Region Total Regional Employment
Source: North Dakota State University
-
2,000
4,000
6,000
8,000
10,000
12,000
14,000
16,000
18,000
2010 2012 2014 2016 2018 2020 2022 2024 2026 2028 2030 2032
Montana: Central Region Total Regional Employment
High Scenario Consensus Scenario Low Scenario
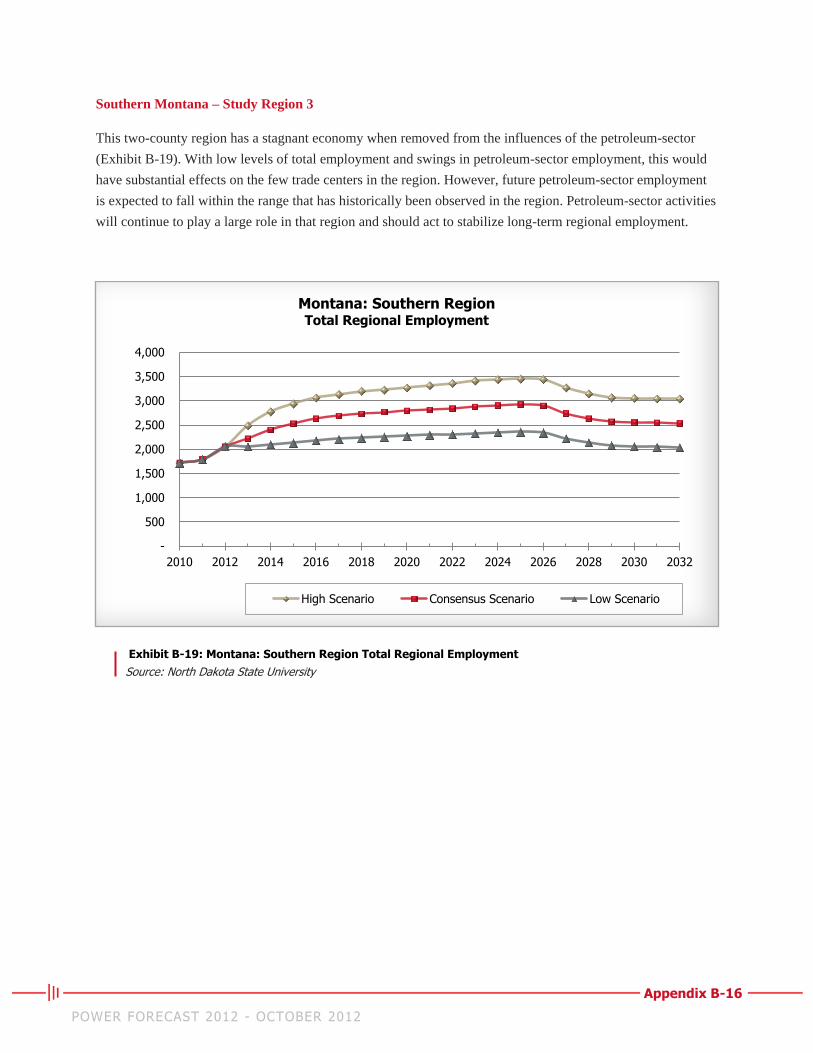
Appendix B-16
POWER FORECAST 2012 - OCTOBER 2012
Southern Montana – Study Region 3
This two-county region has a stagnant economy when removed from the influences of the petroleum-sector
(Exhibit B-19). With low levels of total employment and swings in petroleum-sector employment, this would
have substantial effects on the few trade centers in the region. However, future petroleum-sector employment
is expected to fall within the range that has historically been observed in the region. Petroleum-sector activities
will continue to play a large role in that region and should act to stabilize long-term regional employment.
Exhibit B-19: Montana: Southern Region Total Regional Employment Source: North Dakota State University
-
500
1,000
1,500
2,000
2,500
3,000
3,500
4,000
2010 2012 2014 2016 2018 2020 2022 2024 2026 2028 2030 2032
Montana: Southern Region Total Regional Employment
High Scenario Consensus Scenario Low Scenario
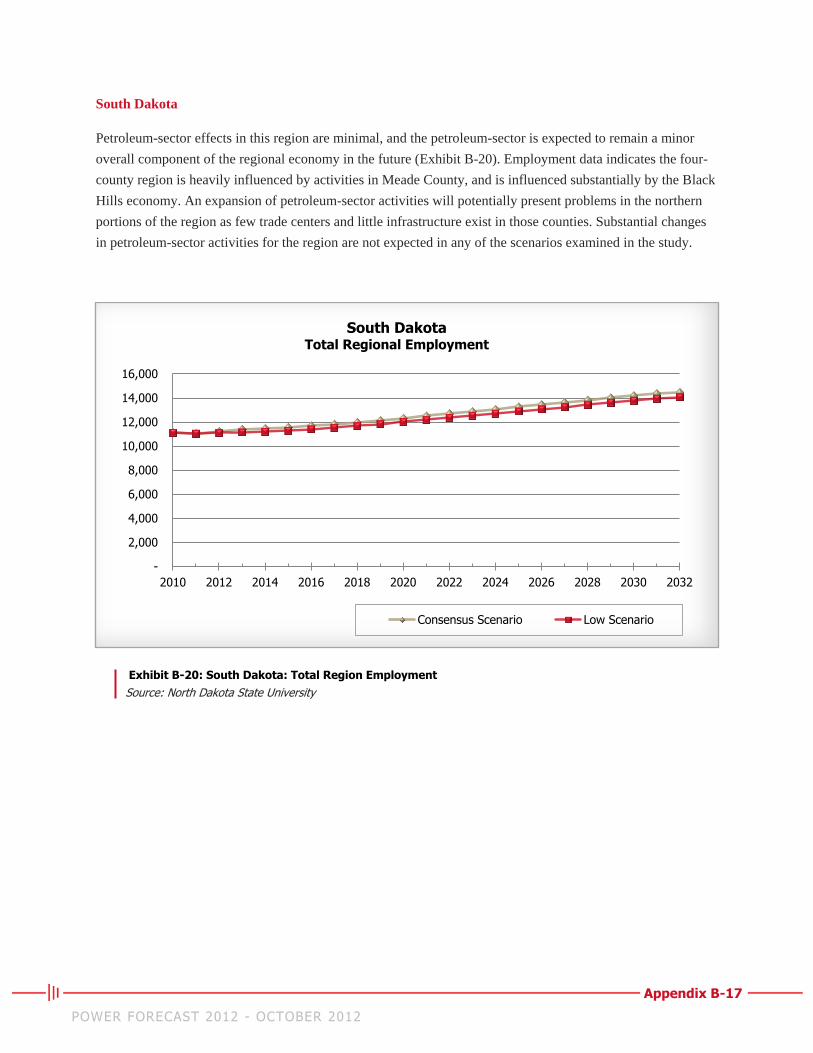
Appendix B-17
POWER FORECAST 2012 - OCTOBER 2012
South Dakota
Petroleum-sector effects in this region are minimal, and the petroleum-sector is expected to remain a minor
overall component of the regional economy in the future (Exhibit B-20). Employment data indicates the four-
county region is heavily influenced by activities in Meade County, and is influenced substantially by the Black
Hills economy. An expansion of petroleum-sector activities will potentially present problems in the northern
portions of the region as few trade centers and little infrastructure exist in those counties. Substantial changes
in petroleum-sector activities for the region are not expected in any of the scenarios examined in the study.
Exhibit B-20: South Dakota: Total Region Employment
Source: North Dakota State University
-
2,000
4,000
6,000
8,000
10,000
12,000
14,000
16,000
2010 2012 2014 2016 2018 2020 2022 2024 2026 2028 2030 2032
South Dakota Total Regional Employment
Consensus Scenario Low Scenario
Appendix B-18
POWER FORECAST 2012 - OCTOBER 2012
Additional Employment Observations
Additional observations regarding employment include:
Looking beyond current development, long-term employment will remain high and be tied closely to
labor needs associated with servicing the Williston Basin.
Illustrations in this assessment display employment in the petroleum-sector 20 years from now
remains at elevated levels compared to employment prior to development of the Bakken/Three Forks
formations. Depending upon the number of wells the industry creates in the Williston Basin,
employment 20 to 30 years from now is either above, equal to or only slightly below current levels.
Regardless of the exact path forward in the Williston Basin, elevated levels of employment in the
industry will remain for several decades.
Influences of current and future petroleum-sector employment differ within regional economies in the
Williston Basin. Considerable regional variation exists within this study area with respect to the
overall economic health and relative influence of petroleum-sector employment. Due to the relative
differences in the effects of petroleum-sector employment in the Williston Basin, expected changes in
base industries and secondary job creation also vary within the region.
Build-out scenarios for oil and gas development largely set the level of employment in the various
study regions. While subtle differences exist in the assumptions on secondary job growth and
constrictions on changes in base employment, those factors were determined to not be sufficiently
different among the scenarios to alter trends in regional employment. Total employment over time was
shown to be largely similar across all scenarios. The result is due to shifts in employment within the
petroleum industry creating a peak and subsequent decline, with the shape also linked to the
fundamental economic factors affecting various regional economies. These include constraints on
secondary job creation and expectations for change in employment in other industries.
Appendix C-1
POWER FORECAST 2012 - OCTOBER 2012
Appendix C - Reference Summaries
Maugeri June 2012 Harvard Report
Oil: The Next Revolution, a discussion paper authored by Leonardo Maugeri for the Belfer Center for Science
and International Affairs, Harvard Kennedy School, was released June 2012. Maugeri reports on a variety of
topics, including historical context, with forecasts to 2020 using several assumptions and concepts to present
ideas.
U.S. oil output is one of the largest factors driving increased global oil supply capacity as recent
advancements, namely horizontal drilling and hydraulic fracturing, have reduced the cost to recover oil from
shale and tight oilfields. These technologies could revolutionize unconventional oil recovery across the world.
Nationally, more than 20 massive shale and tight oil formations exist that are virtually untouched. The
formations are in various stages of development, but production could reach 6.6 million barrels per day by
2020. Given nearly 65 percent of all drilling rigs are located in North America and new production capacity of
these shale formations, total U.S. production could exceed Saudi Arabia production by 2020. The majority of
this production is profitable at $50-65 per barrel (WTI pricing).
U.S. capacity faces several obstacles as oil capacity increases; these obstacles could reduce production by up to
50 percent. Transportation constraints have created three disconnected markets within the U.S. as the east and
west markets lack adequate connections with the mid-continent/gulf market. With growing demand on the
Cushing, OK facility and its pipeline infrastructure, many suppliers are being forced to use rail and trucks to
move product. Three major pipeline projects are scheduled for completion in 2015, but even more capacity is
needed to meet growing demand. Due to historic import trends, refineries along the Gulf Coast have heavily
invested in processing heavier sour crude oil. The majority of shale oil production is light and sweet, which
requires a major investment to properly refine these products. Environmental concerns include methane
leakage into water, wastewater and chemical usage concerns and potential earthquakes.
The Bakken tight oil formation is a key to continued growth in oil capacity. It has 500 billion barrels of oil in
place, with as much as 206 billion recoverable barrels. The addition of the Three Forks Formation could
double these estimates and even these numbers could be underestimated. Initially, the costs involved with the
Bakken play will be higher as the support infrastructure is still being developed. Another vital shale formation,
the Eagle Ford Shale, has more drilling rigs than the Bakken and is located in the Western Texas Basin. Both
formations are profitable at $50-65 per barrel (WTI pricing).
Globally, oil is not in short supply and continued investments will result in improved oil production by 2020.
Average recovery rates will improve as shale production techniques begin to impact other regions. Currently,
recovery rates range from 20 percent (among less developed nations) to 45 percent (within the U.S., Canada,
Norway and the United Kingdom) but the probable recovery rate from the Bakken Formation is 50 percent.
The world consumed 32 billion barrels of oil in 2011 and estimated remaining oil resources could be as high as
17 trillion barrels.

Appendix C-2
POWER FORECAST 2012 - OCTOBER 2012
Market instability will make the oil market highly volatile until 2015. Several countries, including Iran, Iraq,
China, Canada and the U.S., are keys to the future of the global oil market. As the tight and shale oil
formations develop, the Western Hemisphere will become the center of oil exploration and production.
Raymond James Article (July 12, 2012)
In an article dated July 12, 2012, Raymond James and Associates (RJA) altered their 2013 forecasts. Their
2013 projections for WTI decreased from $83 to $65 and from $95 to $80 for Brent Crude Oil. The $15 Brent
premium is a result of transportation constraints. RJA also corrected their 10-year WTI forecast from $90 to
$80/bbl; Brent 10-year forecasts remain at $95/bbl. Global oil prices have begun reflecting these changes as
prices have corrected to $20/bbl. The correction is the result of the European debt crisis, Iranian relations and
recent negative economic data from the U.S. and China.
The adjusted forecast projections are the result of several changing factors within the market. The movement
of rigs to higher production areas was more rapid than RJA projected and new rig additions have doubled
estimates. For example, the Eagle Ford Formation rig count increased 227 percent from 4Q10 to 4Q11.
Reported oil supply has also been six percent above projections as Eagle Ford, Williston and Permian Other
production out-produced estimates. Combined, these three formations produced 115 Mbopd more than RJA
projections. Due to the increased production, coupled with transportation constraints, a lag in supply hitting the
market will result in a severe over-supply in the near future. RJA expects prices to stabilize at $65/bbl in 2013.
U.S. production projections include a 13 percent decline in onshore rig growth in 2013. Drilling will also slow
in 2013 as WTI prices fall another $20/bbl over the next 18 months. RJA also believes rig counts will decrease
by at least 10 percent, up to 700 rigs, as the WTI excess supply saturates the market. It should be noted that
producers are often reluctant to drop rig counts, so rig count decreases could be lower than expected.
Natural Gas Liquids (NGL) account for 25 percent of total U.S. oil-related production and 20 percent of
projected growth. RJA estimates for NGL include $0.64/gal in 2Q13 before rebounding in 2014 to $0.80/gal
and $0.88/gal in 2015. With the shift to preference for heavier liquids, 75 percent of NGL value is tied to
heavier liquids. NGL to crude oil pricing ratios have been deteriorating, which is expected to continue for
several years.
Bentek Energy Report for NDPA (July 2012)
Bentek Energy released The Williston Basin: Greasing the Gears for Growth in North Dakota for the North
Dakota Pipeline Authority in July 2012. The report provides an overview of the natural gas and oil markets
within the Williston Basin and provides regional context supporting their report. Markets, production,
transportation, competition, pipelines and short-term forecasts are covered within the report.
The natural gas market has seen dramatic changes in recent years as exploration and production have driven
rapid growth. New technologies, such as pad drilling and hydraulic fracturing, and improved efficiencies have
resulted in a 35 percent increase in production from 2005 to 2012. This sharp production increase has resulted
in the creation of several new pipelines, weaker gas prices and a shift toward oil and liquid rich wells over dry
natural gas production. Prices at Henry Hub have fallen 70 percent from 2008 to 2012 as supply has outpaced

Appendix C-3
POWER FORECAST 2012 - OCTOBER 2012
demand. With decreasing prices and a larger pipeline network linking regions, the price spread nationally is
decreasing – allowing supply basins to compete in new markets. While many producers are shifting toward
NGL/crude oil wells, production has not declined. Dry production has decreased, some are seeing negative
rates of returns, but the increase in NGL production will result in 22 percent expected growth by 2017.
The demand for natural gas has increased 12 percent from 2005 to 2011 with 16 percent forecasted growth by
2017. Residential and commercial demands, at 52 percent in 2011, are the largest demand sector. This is
expected to continue even as demand per customer decreases due to efficiency gains. In 2011, the industrial
sector accounted for 35 percent of demand and is expected to grow 1.2 percent per year long-term. Power
demands over time will continue to increase as natural gas supplants coal. Projected power growth is 0.8
percent overall while natural gas power growth will be 2.4 percent. Domestic supply will largely meet these
demands as Canadian imports have declined 40 percent since 2007 and this trend is expected to continue due
to transportation costs.
The oil market experienced gains for the last five years; largely driven by the shale and tight formations that
are being developed regionally. As a result of these gains, massive infrastructure development is occurring to
ensure product can be brought to market. However, the spread between WTI and Brent pricing is expected to
suffer a volatile period and could reach $20 by 2017.
The Williston Basin contains the Bakken and Three Forks Formations and is expected to account for 18
percent of total U.S. production by 2017. Since 2005, oil production has increased more than 400 percent with
gas production climbing 250 percent. The formations produce roughly 87 percent oil, 7 percent NGL and 6
percent natural gas with nearly 90 percent of total production occurring in North Dakota. Growth is expected
to continue even if prices fall to $50/bbl (WTI) by 2025. Estimates indicate that as much as four billion barrels
of oil are recoverable along with 1.85 Tcf of natural gas and 148 MMbbl NGL. The Bakken Formation is
among the most attractive rate of returns across the country. The formation has exceptional production to offset
the higher costs of setup, is insensitive to NGL price changes and has significant oil and higher BTU gas
capacity.
Infrastructure within the region is largely viewed as inadequate as both major oil pipelines in the region are
near capacity and natural gas has three main pipelines that cannot keep pace with demand. In addition to these
five pipelines, North Dakota has 15 rail loading stations that transport oil and heavy usage of trucks to
transport product. Regionally, the Tesoro Mandan refinery is being fully utilized at 58 Mb/d. Several major
developments are in various stages of planning that will help reduce strain on the current structure. Four
refinery expansions, six major oil pipelines, three natural gas and NGL pipelines, four gas processing plants
and nine rail expansions are all in development but capacity is still expected to be a constraint on production.
Oil from these formations will continue to sell at an $11-20 discount to WTI due to transportation costs and
distances. Williston Basin natural gas traditionally correlated closely to the Rockies pricing, but as pipeline
flow has changed, Alberta pricing now has a stronger correlation. Within the region, Empress gas is the closest
market price and as Canadian pricing improves the Bakken market will see improvements. Williston Basin
natural gas has no daily spot price points on the Intercontinental Exchange or Platts Gas Daily.

Appendix C-4
POWER FORECAST 2012 - OCTOBER 2012
This page intentionally left blank
Appendix D-1
POWER FORECAST 2012 - OCTOBER 2012
Appendix D - References
Energy Ventures Analysis (EVA) (2012). Natural Gas Supply and Price Forecast. Retrieved June 7, 2012
from http://evainc.com/products/natural-gas-supply-and-price-forecast.
Adkins, M.J. (June 18, 2012). Energy Stat of the Week: This Hurts Us More Than It Hurts You Slashing Oil
Price Estimate Yet Again. Retrieved June 21, 2012, from
http://www.raymondjames.com/SalingSimmsAssociates/EnergyStatoftheWeekbyMarshallAdkins.aspx.
Bangsund, D.A. and Leistritz, F.L. (2010). Petroleum Industry’s Contribution to North Dakota in 2009,
Agribusiness & Applied Economics Report 99252, North Dakota State University, Department of
Agribusiness and Applied Economics.
Bangsund, D.A. and Hodur, N.M. (2012). Modeling Direct and Secondary Employment in the Petroleum
Sector in North Dakota, North Dakota State University, Fargo: Agribusiness and Applied Economics Report
No. 694.
Bangsund, D.A. (n.d.). Modeling Employment, Housing, and Population in Western North Dakota: The Case
of Dickinson, North Dakota State University, Fargo: Agribusiness and Applied Economics Report No. 694.
CME Group. New York Mercantile Exchange. n.d. (June 28, 2012). Retrieved July 7 2012, from
http://www.cmegroup.com/company/nymex.html.
Energy Information Administration (EIA). (2012). Annual Energy Outlook 2012 with projections to 2035,
United Stated Department of Energy.
BENTEK Energy, LLC (2012). The Williston Basin: Greasing the Gears for Growth in North Dakota.
Folger, P. Tiemann, M. and Bearden, D.M. (2012). The EPA Draft Report of Groundwater Contamination
Near Pavillion, Wyoming: Main Findings and Stakeholder Responses. Draft Report. The Environmental
Protection Agency.
Folger, P., Tiemann, M. and Bearden, D.M. (2012) The EPA Draft Report of Groundwater Contamination
Near Pavillion, Wyoming: Main Findings and Stakeholder Reponses.
INFORUM (July 15, 2012). Interindustry Forecasting Project at the University of Maryland. Retrieved July
15, 2012, from http://www.inforum.umd.edu/. Updated Feb. 2012.
Job Service North Dakota (2012). North Dakota Census of Employment and Wages. Retrieved July 19, 2012,
from http://www.ndworkforceintelligence.com/gsipub/index.asp?docid=525
Maugeri, L. (2012) Oil: The Next Revolution: The unprecedented upsurge of oil production capacity and what
it means for the world, Discussion Paper 2012-10, Harvard Kennedy School; Belfer Center for Science and
International Affairs.
Appendix D-2
POWER FORECAST 2012 - OCTOBER 2012
Merchant, D.H. (2010) Life Beyond 80 - A Look at Conventional WAG Recovery Beyond 80 Percent HCPV
Injection in CO2 Tertiary Floods.
National Energy Technology Laboratory (2009). Electricity Use of Enhanced Oil Recovery with Carbon
Dioxide (CO2-EOR).
State of Nebraska. (July 10, 2012). Henry Hub Natural Gas Spot Prices 2012. Retrieved July 19, 2012, from
http://www.neo.ne.gov/statshtml/124.htm.
Oil and Gas Division (Unpublished 2012). Employment Coefficients and Requirements for Petroleum Sector
Activities in North Dakota. Unpublished. North Dakota Industrial Commission. Bismarck, ND.
Price, L. (Unpublished 1999). Origins and Characteristics of the Basin-Centered Continuous-Reservoir
Unconventional Oil-Resource Base of the Bakken Source System, Williston Basin. Research Paper. Denver,
CO.
Strategic Energy and Economic Research, Inc. (SEER). (July 15, 2012). Retrieved July 15, 2012, from
http://www.energyseer.com/.
U.S. Census Bureau, U.S. Department of Commerce. Decennial Census 2012a. March (2012) Retrieved June
15, 2012, from, http://www.census.gov/main/www/cen2000.html.
U.S. Census Bureau. (2010) Decennial Census. Retrieved June 15, 2012 from,
http://2010.census.gov/2010census/.
U.S. Census Bureau. (2012). 2006-2010 American Community Service. Retrieved June 15, 2012 from,
http://www.census.gov/acs/www/.
U.S. Census Bureau. (2012). Population Estimates Program. Retrieved June 15, 2012 from,
http://www.census.gov/popest/estimates.html .
U.S. Census Bureau, U.S. Department of Commerce. Federal, State, and Local Governments Main. (2012).
Retrieved June 15, 2012 from, http://www.census.gov/govs/
U.S. Energy Information Administration. (July 2, 2012). Independent Statistics and Analysis. Retrieved July
15, 2012 from, http://www.eia.gov/.
Vivek, C. Natgas.info The independent natural gas information site (July 10, 2012) Retrieved July 15, 2012,
from, http://www.natgas.info/.
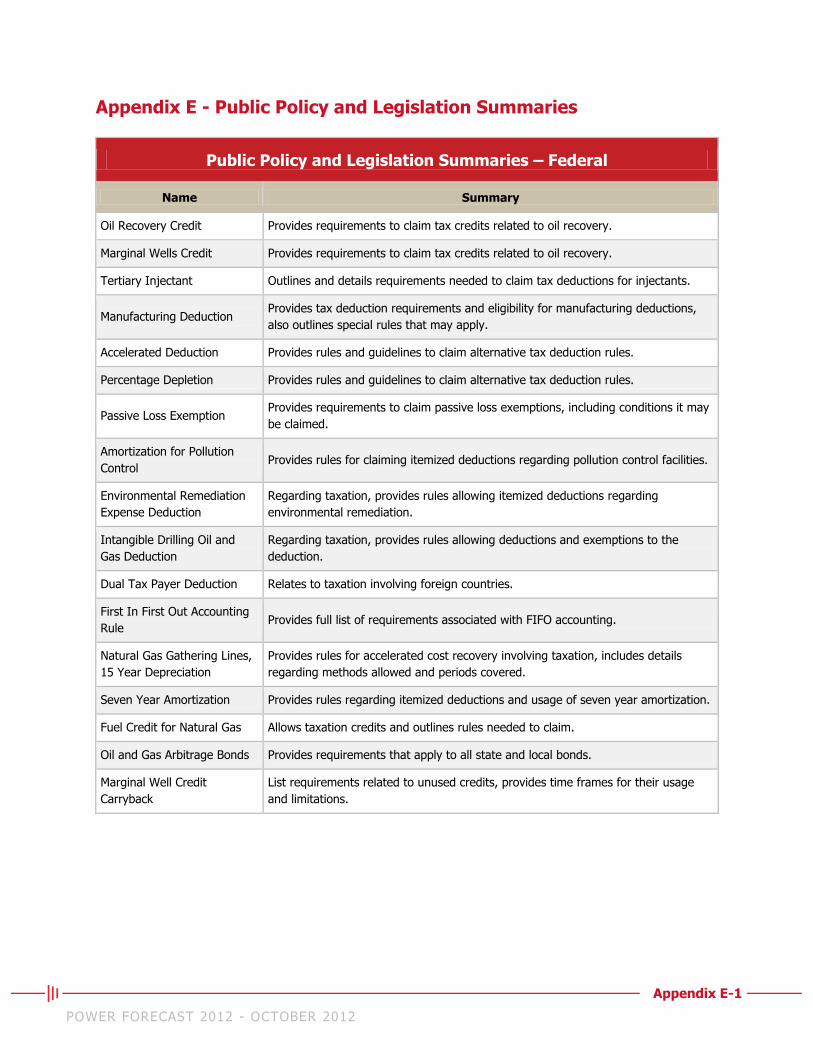
Appendix E-1
POWER FORECAST 2012 - OCTOBER 2012
Appendix E - Public Policy and Legislation Summaries
Public Policy and Legislation Summaries – Federal
Name Summary
Oil Recovery Credit Provides requirements to claim tax credits related to oil recovery.
Marginal Wells Credit Provides requirements to claim tax credits related to oil recovery.
Tertiary Injectant Outlines and details requirements needed to claim tax deductions for injectants.
Manufacturing Deduction Provides tax deduction requirements and eligibility for manufacturing deductions,
also outlines special rules that may apply.
Accelerated Deduction Provides rules and guidelines to claim alternative tax deduction rules.
Percentage Depletion Provides rules and guidelines to claim alternative tax deduction rules.
Passive Loss Exemption Provides requirements to claim passive loss exemptions, including conditions it may
be claimed.
Amortization for Pollution
Control Provides rules for claiming itemized deductions regarding pollution control facilities.
Environmental Remediation
Expense Deduction
Regarding taxation, provides rules allowing itemized deductions regarding
environmental remediation.
Intangible Drilling Oil and
Gas Deduction
Regarding taxation, provides rules allowing deductions and exemptions to the
deduction.
Dual Tax Payer Deduction Relates to taxation involving foreign countries.
First In First Out Accounting
Rule Provides full list of requirements associated with FIFO accounting.
Natural Gas Gathering Lines,
15 Year Depreciation
Provides rules for accelerated cost recovery involving taxation, includes details
regarding methods allowed and periods covered.
Seven Year Amortization Provides rules regarding itemized deductions and usage of seven year amortization.
Fuel Credit for Natural Gas Allows taxation credits and outlines rules needed to claim.
Oil and Gas Arbitrage Bonds Provides requirements that apply to all state and local bonds.
Marginal Well Credit
Carryback
List requirements related to unused credits, provides time frames for their usage
and limitations.
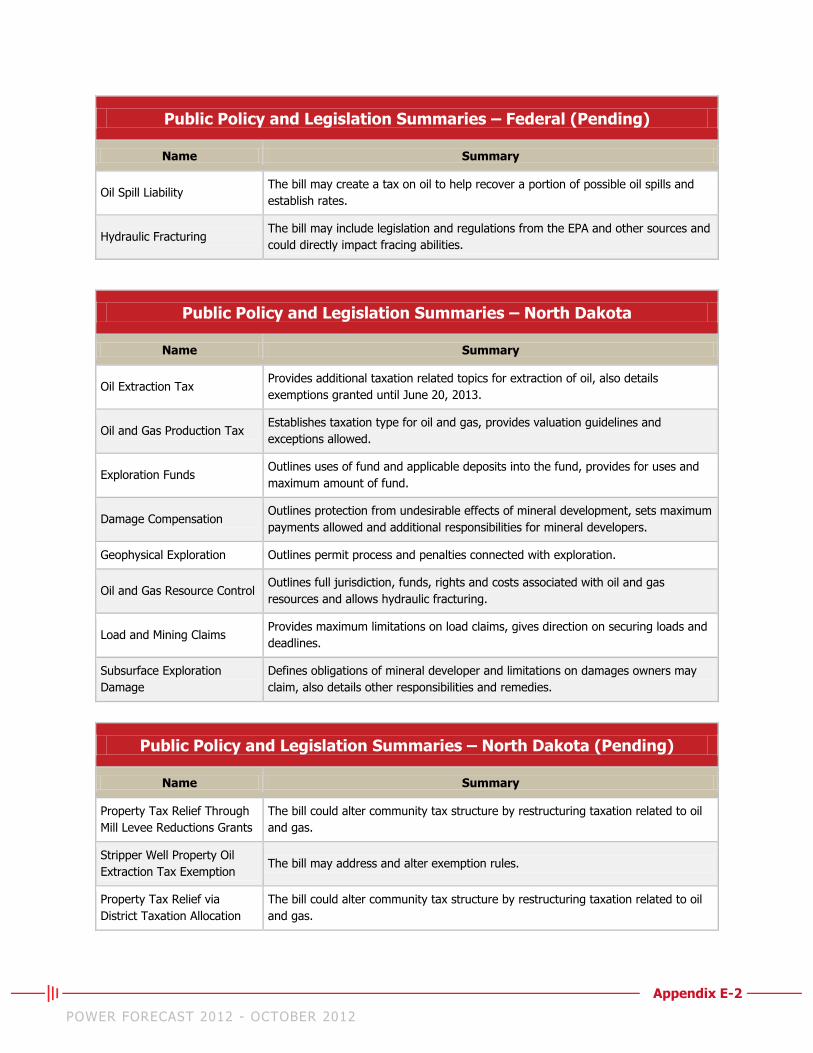
Appendix E-2
POWER FORECAST 2012 - OCTOBER 2012
Public Policy and Legislation Summaries – Federal (Pending)
Name Summary
Oil Spill Liability The bill may create a tax on oil to help recover a portion of possible oil spills and
establish rates.
Hydraulic Fracturing The bill may include legislation and regulations from the EPA and other sources and
could directly impact fracing abilities.
Public Policy and Legislation Summaries – North Dakota
Name Summary
Oil Extraction Tax Provides additional taxation related topics for extraction of oil, also details
exemptions granted until June 20, 2013.
Oil and Gas Production Tax Establishes taxation type for oil and gas, provides valuation guidelines and
exceptions allowed.
Exploration Funds Outlines uses of fund and applicable deposits into the fund, provides for uses and
maximum amount of fund.
Damage Compensation Outlines protection from undesirable effects of mineral development, sets maximum
payments allowed and additional responsibilities for mineral developers.
Geophysical Exploration Outlines permit process and penalties connected with exploration.
Oil and Gas Resource Control Outlines full jurisdiction, funds, rights and costs associated with oil and gas
resources and allows hydraulic fracturing.
Load and Mining Claims Provides maximum limitations on load claims, gives direction on securing loads and
deadlines.
Subsurface Exploration
Damage
Defines obligations of mineral developer and limitations on damages owners may
claim, also details other responsibilities and remedies.
Public Policy and Legislation Summaries – North Dakota (Pending)
Name Summary
Property Tax Relief Through
Mill Levee Reductions Grants
The bill could alter community tax structure by restructuring taxation related to oil
and gas.
Stripper Well Property Oil
Extraction Tax Exemption The bill may address and alter exemption rules.
Property Tax Relief via
District Taxation Allocation
The bill could alter community tax structure by restructuring taxation related to oil
and gas.
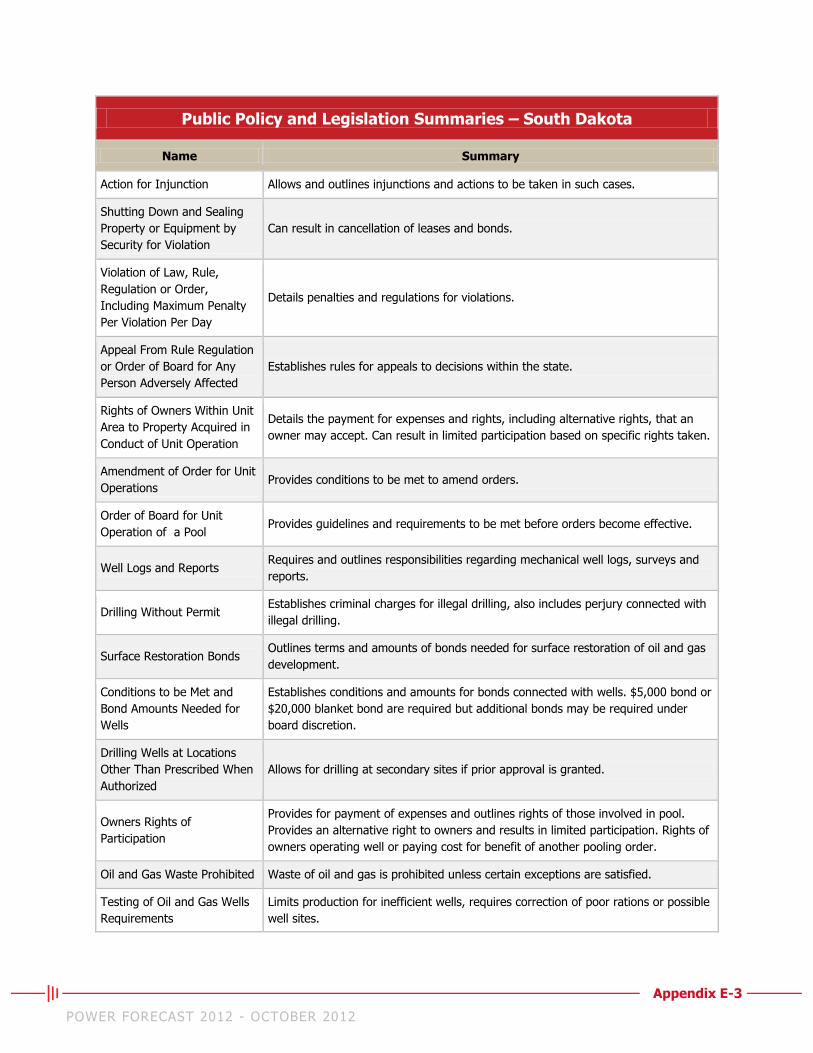
Appendix E-3
POWER FORECAST 2012 - OCTOBER 2012
Public Policy and Legislation Summaries – South Dakota
Name Summary
Action for Injunction Allows and outlines injunctions and actions to be taken in such cases.
Shutting Down and Sealing
Property or Equipment by
Security for Violation
Can result in cancellation of leases and bonds.
Violation of Law, Rule,
Regulation or Order,
Including Maximum Penalty
Per Violation Per Day
Details penalties and regulations for violations.
Appeal From Rule Regulation
or Order of Board for Any
Person Adversely Affected
Establishes rules for appeals to decisions within the state.
Rights of Owners Within Unit
Area to Property Acquired in
Conduct of Unit Operation
Details the payment for expenses and rights, including alternative rights, that an
owner may accept. Can result in limited participation based on specific rights taken.
Amendment of Order for Unit
Operations Provides conditions to be met to amend orders.
Order of Board for Unit
Operation of a Pool Provides guidelines and requirements to be met before orders become effective.
Well Logs and Reports Requires and outlines responsibilities regarding mechanical well logs, surveys and
reports.
Drilling Without Permit Establishes criminal charges for illegal drilling, also includes perjury connected with
illegal drilling.
Surface Restoration Bonds Outlines terms and amounts of bonds needed for surface restoration of oil and gas
development.
Conditions to be Met and
Bond Amounts Needed for
Wells
Establishes conditions and amounts for bonds connected with wells. $5,000 bond or
$20,000 blanket bond are required but additional bonds may be required under
board discretion.
Drilling Wells at Locations
Other Than Prescribed When
Authorized
Allows for drilling at secondary sites if prior approval is granted.
Owners Rights of
Participation
Provides for payment of expenses and outlines rights of those involved in pool.
Provides an alternative right to owners and results in limited participation. Rights of
owners operating well or paying cost for benefit of another pooling order.
Oil and Gas Waste Prohibited Waste of oil and gas is prohibited unless certain exceptions are satisfied.
Testing of Oil and Gas Wells
Requirements
Limits production for inefficient wells, requires correction of poor rations or possible
well sites.
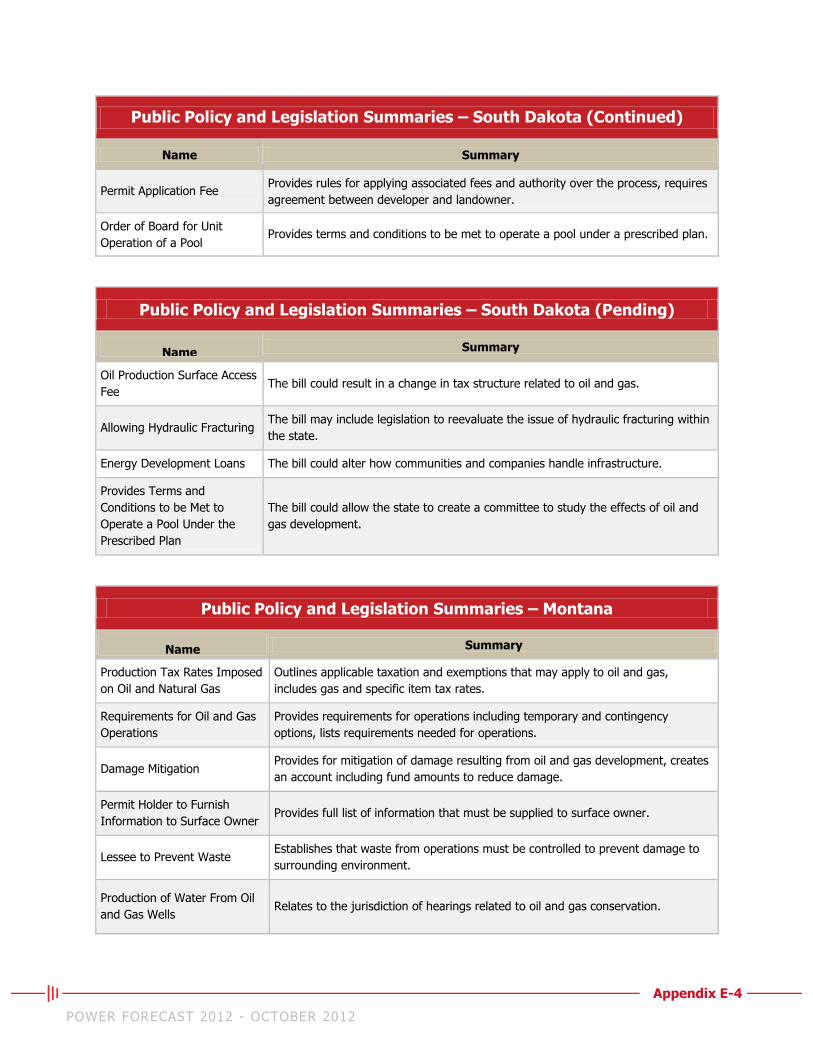
Appendix E-4
POWER FORECAST 2012 - OCTOBER 2012
Public Policy and Legislation Summaries – South Dakota (Continued)
Name Summary
Permit Application Fee Provides rules for applying associated fees and authority over the process, requires
agreement between developer and landowner.
Order of Board for Unit
Operation of a Pool Provides terms and conditions to be met to operate a pool under a prescribed plan.
Public Policy and Legislation Summaries – South Dakota (Pending)
Name Summary
Oil Production Surface Access
Fee The bill could result in a change in tax structure related to oil and gas.
Allowing Hydraulic Fracturing The bill may include legislation to reevaluate the issue of hydraulic fracturing within
the state.
Energy Development Loans The bill could alter how communities and companies handle infrastructure.
Provides Terms and
Conditions to be Met to
Operate a Pool Under the
Prescribed Plan
The bill could allow the state to create a committee to study the effects of oil and
gas development.
Public Policy and Legislation Summaries – Montana
Name Summary
Production Tax Rates Imposed
on Oil and Natural Gas
Outlines applicable taxation and exemptions that may apply to oil and gas,
includes gas and specific item tax rates.
Requirements for Oil and Gas
Operations
Provides requirements for operations including temporary and contingency
options, lists requirements needed for operations.
Damage Mitigation Provides for mitigation of damage resulting from oil and gas development, creates
an account including fund amounts to reduce damage.
Permit Holder to Furnish
Information to Surface Owner Provides full list of information that must be supplied to surface owner.
Lessee to Prevent Waste Establishes that waste from operations must be controlled to prevent damage to
surrounding environment.
Production of Water From Oil
and Gas Wells Relates to the jurisdiction of hearings related to oil and gas conservation.
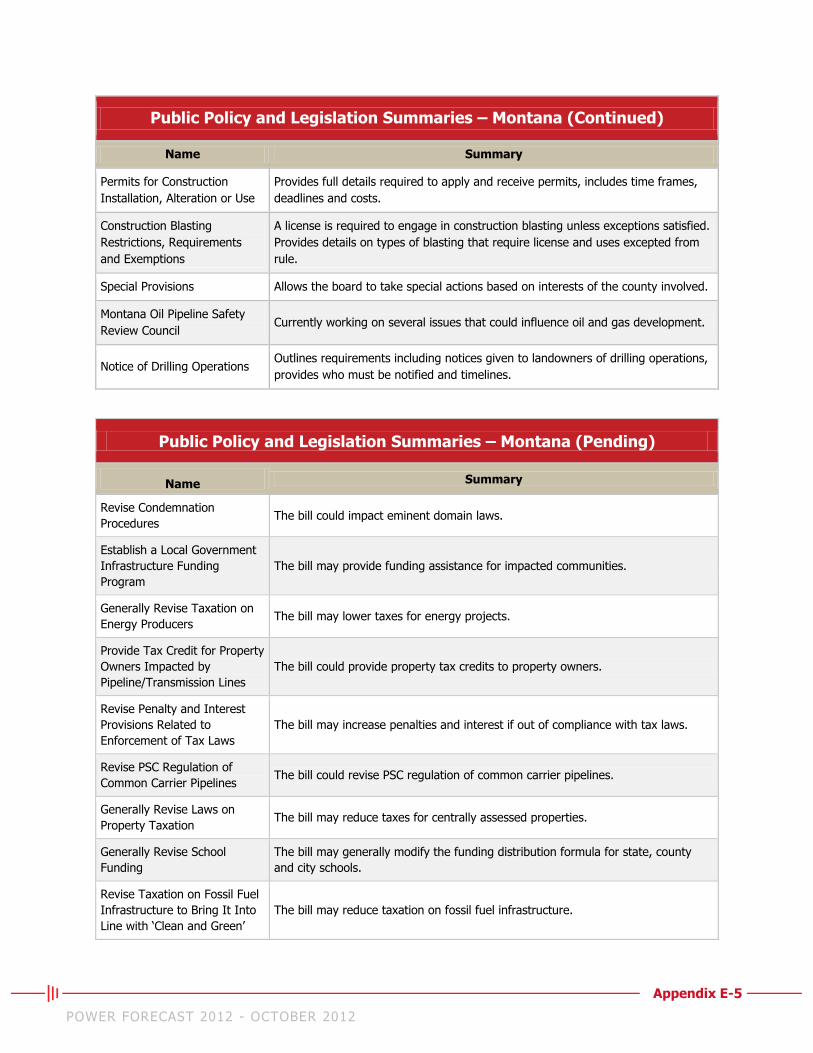
Appendix E-5
POWER FORECAST 2012 - OCTOBER 2012
Public Policy and Legislation Summaries – Montana (Continued)
Name Summary
Permits for Construction
Installation, Alteration or Use
Provides full details required to apply and receive permits, includes time frames,
deadlines and costs.
Construction Blasting
Restrictions, Requirements
and Exemptions
A license is required to engage in construction blasting unless exceptions satisfied.
Provides details on types of blasting that require license and uses excepted from
rule.
Special Provisions Allows the board to take special actions based on interests of the county involved.
Montana Oil Pipeline Safety
Review Council Currently working on several issues that could influence oil and gas development.
Notice of Drilling Operations Outlines requirements including notices given to landowners of drilling operations,
provides who must be notified and timelines.
Public Policy and Legislation Summaries – Montana (Pending)
Name Summary
Revise Condemnation
Procedures The bill could impact eminent domain laws.
Establish a Local Government
Infrastructure Funding
Program
The bill may provide funding assistance for impacted communities.
Generally Revise Taxation on
Energy Producers The bill may lower taxes for energy projects.
Provide Tax Credit for Property
Owners Impacted by
Pipeline/Transmission Lines
The bill could provide property tax credits to property owners.
Revise Penalty and Interest
Provisions Related to
Enforcement of Tax Laws
The bill may increase penalties and interest if out of compliance with tax laws.
Revise PSC Regulation of
Common Carrier Pipelines The bill could revise PSC regulation of common carrier pipelines.
Generally Revise Laws on
Property Taxation The bill may reduce taxes for centrally assessed properties.
Generally Revise School
Funding
The bill may generally modify the funding distribution formula for state, county
and city schools.
Revise Taxation on Fossil Fuel
Infrastructure to Bring It Into
Line with ‘Clean and Green’
The bill may reduce taxation on fossil fuel infrastructure.
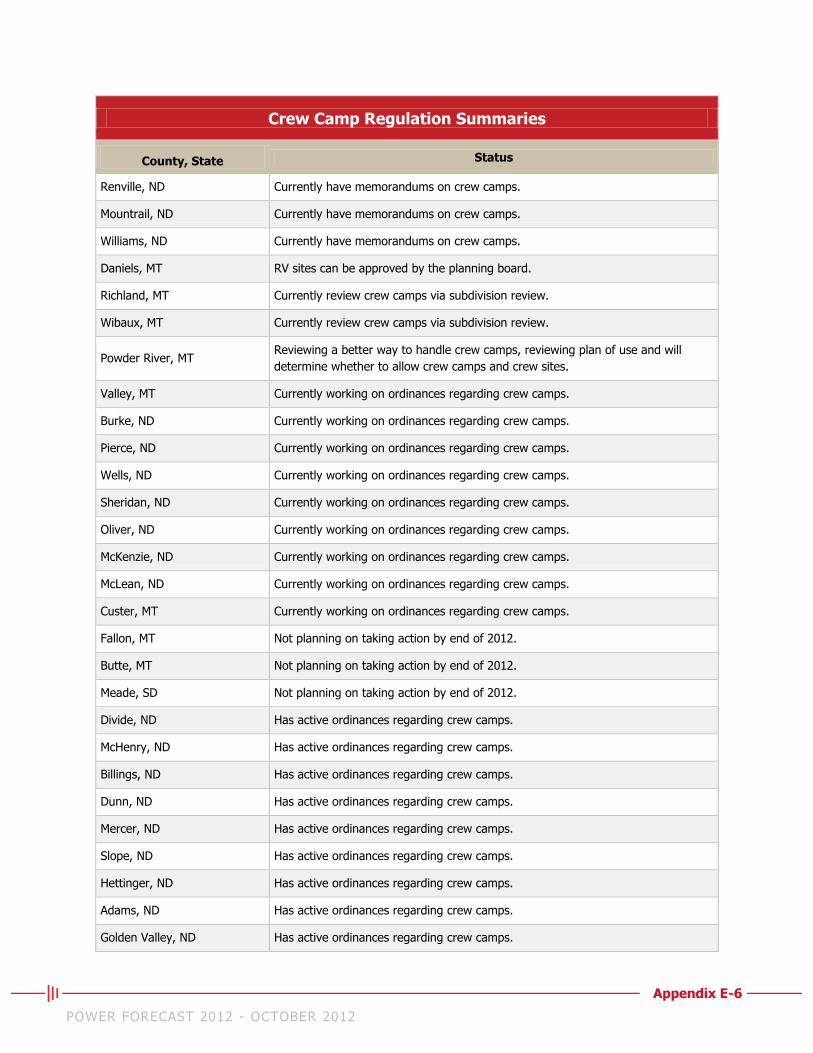
Appendix E-6
POWER FORECAST 2012 - OCTOBER 2012
Crew Camp Regulation Summaries
County, State Status
Renville, ND Currently have memorandums on crew camps.
Mountrail, ND Currently have memorandums on crew camps.
Williams, ND Currently have memorandums on crew camps.
Daniels, MT RV sites can be approved by the planning board.
Richland, MT Currently review crew camps via subdivision review.
Wibaux, MT Currently review crew camps via subdivision review.
Powder River, MT Reviewing a better way to handle crew camps, reviewing plan of use and will
determine whether to allow crew camps and crew sites.
Valley, MT Currently working on ordinances regarding crew camps.
Burke, ND Currently working on ordinances regarding crew camps.
Pierce, ND Currently working on ordinances regarding crew camps.
Wells, ND Currently working on ordinances regarding crew camps.
Sheridan, ND Currently working on ordinances regarding crew camps.
Oliver, ND Currently working on ordinances regarding crew camps.
McKenzie, ND Currently working on ordinances regarding crew camps.
McLean, ND Currently working on ordinances regarding crew camps.
Custer, MT Currently working on ordinances regarding crew camps.
Fallon, MT Not planning on taking action by end of 2012.
Butte, MT Not planning on taking action by end of 2012.
Meade, SD Not planning on taking action by end of 2012.
Divide, ND Has active ordinances regarding crew camps.
McHenry, ND Has active ordinances regarding crew camps.
Billings, ND Has active ordinances regarding crew camps.
Dunn, ND Has active ordinances regarding crew camps.
Mercer, ND Has active ordinances regarding crew camps.
Slope, ND Has active ordinances regarding crew camps.
Hettinger, ND Has active ordinances regarding crew camps.
Adams, ND Has active ordinances regarding crew camps.
Golden Valley, ND Has active ordinances regarding crew camps.
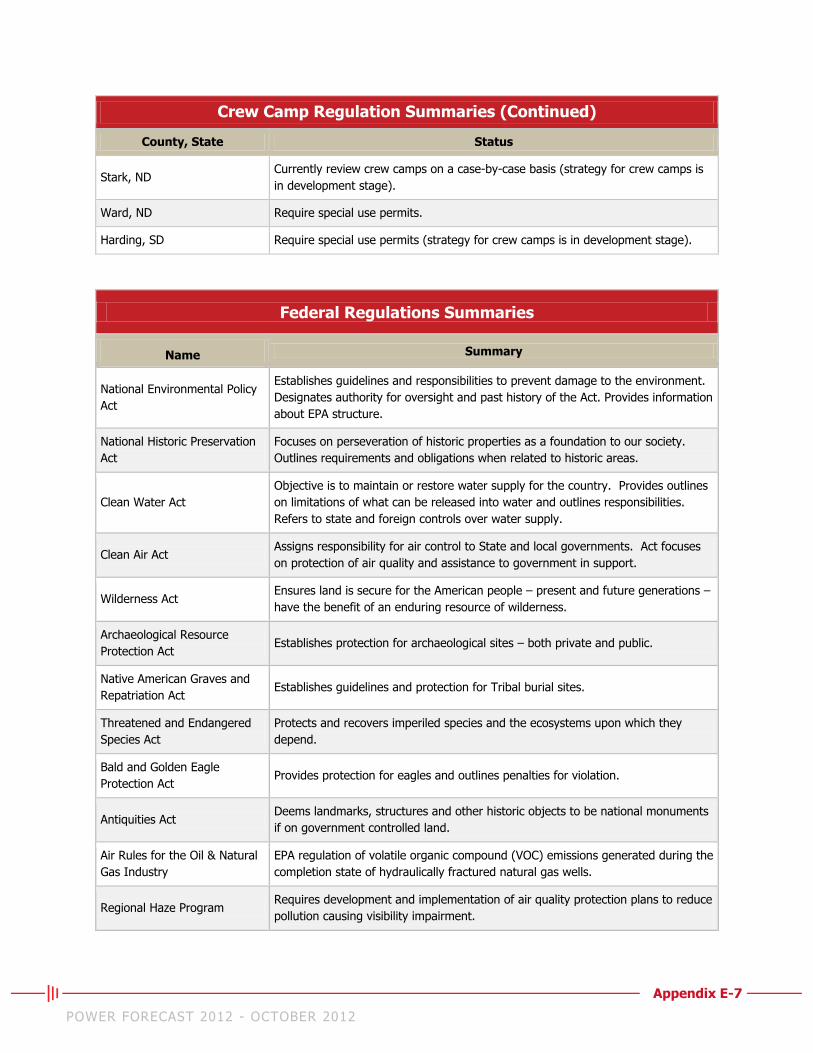
Appendix E-7
POWER FORECAST 2012 - OCTOBER 2012
Crew Camp Regulation Summaries (Continued)
County, State Status
Stark, ND Currently review crew camps on a case-by-case basis (strategy for crew camps is
in development stage).
Ward, ND Require special use permits.
Harding, SD Require special use permits (strategy for crew camps is in development stage).
Federal Regulations Summaries
Name Summary
National Environmental Policy
Act
Establishes guidelines and responsibilities to prevent damage to the environment.
Designates authority for oversight and past history of the Act. Provides information
about EPA structure.
National Historic Preservation
Act
Focuses on perseveration of historic properties as a foundation to our society.
Outlines requirements and obligations when related to historic areas.
Clean Water Act
Objective is to maintain or restore water supply for the country. Provides outlines
on limitations of what can be released into water and outlines responsibilities.
Refers to state and foreign controls over water supply.
Clean Air Act Assigns responsibility for air control to State and local governments. Act focuses
on protection of air quality and assistance to government in support.
Wilderness Act Ensures land is secure for the American people – present and future generations –
have the benefit of an enduring resource of wilderness.
Archaeological Resource
Protection Act Establishes protection for archaeological sites – both private and public.
Native American Graves and
Repatriation Act Establishes guidelines and protection for Tribal burial sites.
Threatened and Endangered
Species Act
Protects and recovers imperiled species and the ecosystems upon which they
depend.
Bald and Golden Eagle
Protection Act Provides protection for eagles and outlines penalties for violation.
Antiquities Act Deems landmarks, structures and other historic objects to be national monuments
if on government controlled land.
Air Rules for the Oil & Natural
Gas Industry
EPA regulation of volatile organic compound (VOC) emissions generated during the
completion state of hydraulically fractured natural gas wells.
Regional Haze Program Requires development and implementation of air quality protection plans to reduce
pollution causing visibility impairment.
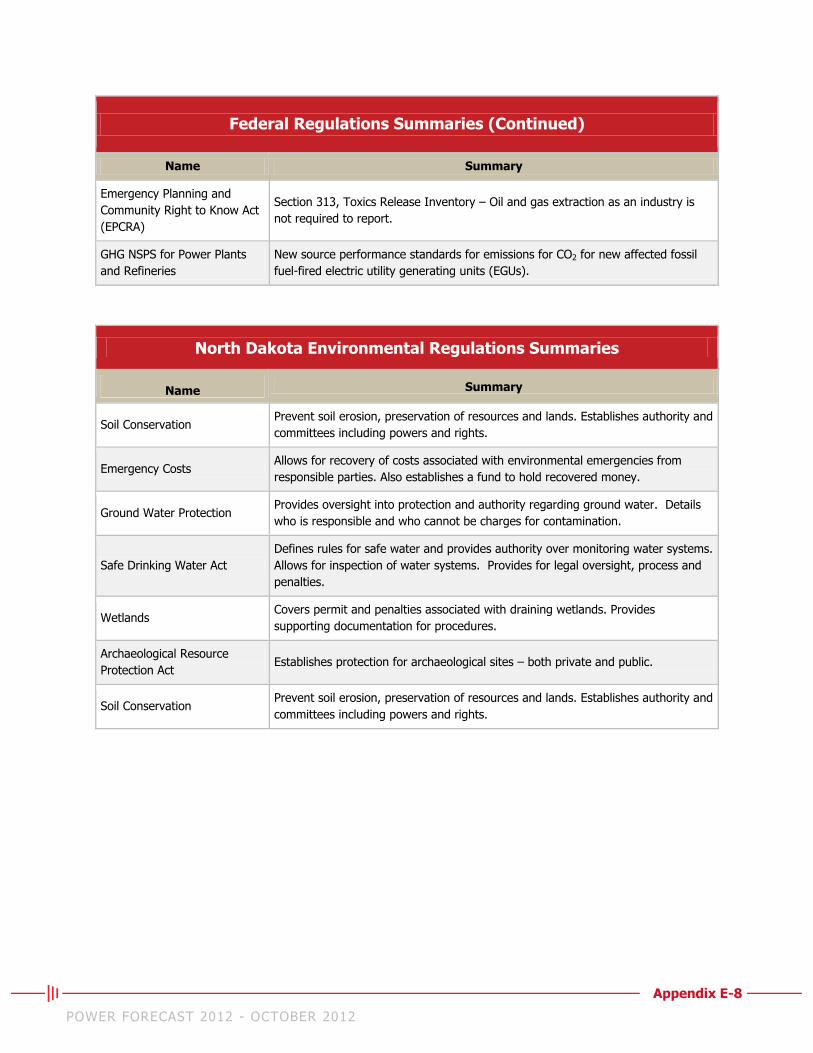
Appendix E-8
POWER FORECAST 2012 - OCTOBER 2012
Federal Regulations Summaries (Continued)
Name Summary
Emergency Planning and
Community Right to Know Act
(EPCRA)
Section 313, Toxics Release Inventory – Oil and gas extraction as an industry is
not required to report.
GHG NSPS for Power Plants
and Refineries
New source performance standards for emissions for CO2 for new affected fossil
fuel-fired electric utility generating units (EGUs).
North Dakota Environmental Regulations Summaries
Name Summary
Soil Conservation Prevent soil erosion, preservation of resources and lands. Establishes authority and
committees including powers and rights.
Emergency Costs Allows for recovery of costs associated with environmental emergencies from
responsible parties. Also establishes a fund to hold recovered money.
Ground Water Protection Provides oversight into protection and authority regarding ground water. Details
who is responsible and who cannot be charges for contamination.
Safe Drinking Water Act
Defines rules for safe water and provides authority over monitoring water systems.
Allows for inspection of water systems. Provides for legal oversight, process and
penalties.
Wetlands Covers permit and penalties associated with draining wetlands. Provides
supporting documentation for procedures.
Archaeological Resource
Protection Act Establishes protection for archaeological sites – both private and public.
Soil Conservation Prevent soil erosion, preservation of resources and lands. Establishes authority and
committees including powers and rights.
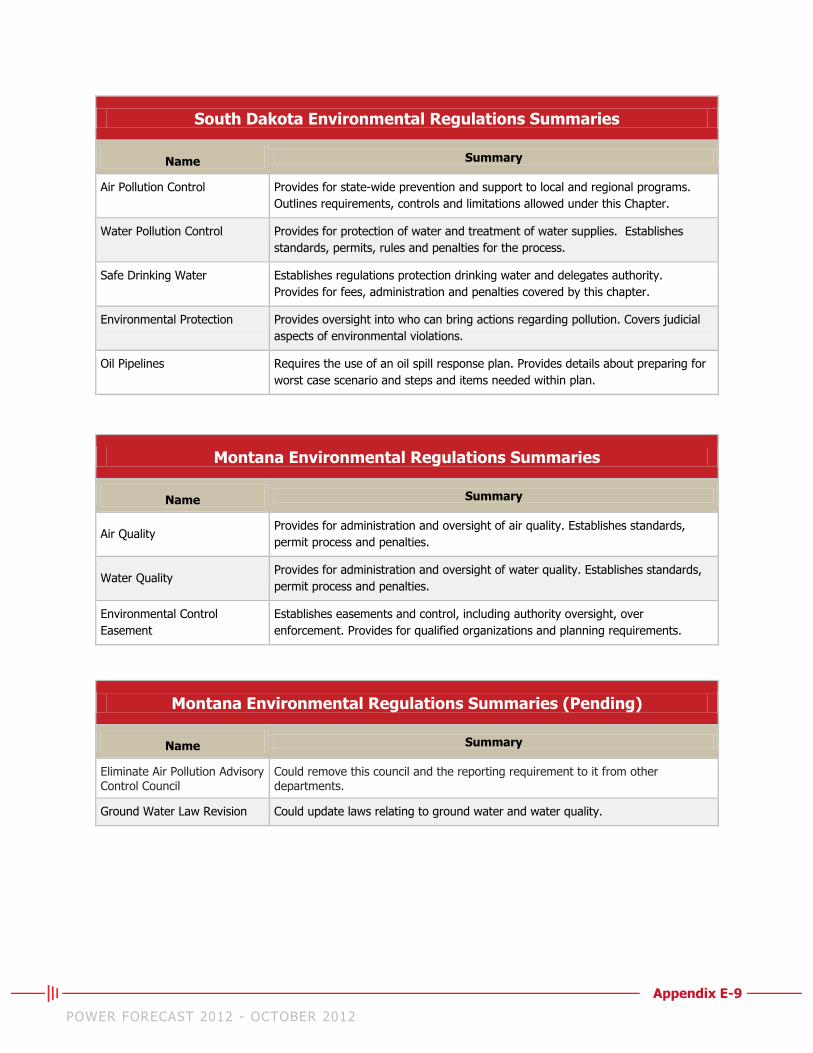
Appendix E-9
POWER FORECAST 2012 - OCTOBER 2012
South Dakota Environmental Regulations Summaries
Name Summary
Air Pollution Control Provides for state-wide prevention and support to local and regional programs.
Outlines requirements, controls and limitations allowed under this Chapter.
Water Pollution Control Provides for protection of water and treatment of water supplies. Establishes
standards, permits, rules and penalties for the process.
Safe Drinking Water Establishes regulations protection drinking water and delegates authority.
Provides for fees, administration and penalties covered by this chapter.
Environmental Protection Provides oversight into who can bring actions regarding pollution. Covers judicial
aspects of environmental violations.
Oil Pipelines Requires the use of an oil spill response plan. Provides details about preparing for
worst case scenario and steps and items needed within plan.
Montana Environmental Regulations Summaries
Name Summary
Air Quality Provides for administration and oversight of air quality. Establishes standards,
permit process and penalties.
Water Quality Provides for administration and oversight of water quality. Establishes standards,
permit process and penalties.
Environmental Control
Easement
Establishes easements and control, including authority oversight, over
enforcement. Provides for qualified organizations and planning requirements.
Montana Environmental Regulations Summaries (Pending)
Name Summary
Eliminate Air Pollution Advisory Control Council
Could remove this council and the reporting requirement to it from other departments.
Ground Water Law Revision Could update laws relating to ground water and water quality.