Embed Size (px)
Citation preview
The Bankers Investment Trust PLC
Registered as an investment company in England and Wales
Registration number: 00026351
Registered office: 201 Bishopsgate, London EC2M 3AE
ISIN code: GB0000767003
SEDOL number: 0076700
London Stock Exchange (TIDM) Code: BNKR
Global Intermediary Identification Number (GIIN): L5YVFP.99999.SL.826
Legal Entity Identifier (LEI): 213800B9YWXL3X1VMZ69
Telephone: 0800 832 832
Email: [email protected]
www.bankersinvestmenttrust.com
JHI9201/2018
The B
ankers
Inve
stm
ent T
rust P
LC
– A
nnual R
eport fo
r the ye
ar e
nded 3
1 Octo
ber 2
018
JH
I920
1/20
18
THE BANKERSINVESTMENTTRUST PLCAnnual Report 2018
This report is printed on cocoon silk 60% recycled, a recycled paper containing 60% recycled waste
and 40% virgin fibre and manufactured at a mill certified with ISO 14001 environmental management
standard. The pulp used in this product is bleached using an Elemental Chlorine Free process (ECF).
The FSC® logo identifies products which contain wood from well managed forests certified in
accordance with the rules of the Forest Stewardship Council®.
Typeset by 2112 Communications, London. Printed by Leycol, London
ShareholderCommunication
Awards
2018WINNER
ShareholderCommunication
Awards
2017WINNER
Strategic Report
Performance Highlights 2-3
Business Model 4
Structure and Principal Activity 4
Investment Objectives 4
Investment Policy 4
Position at the year end 4
Management 4
Management Fee 4
Investing 4
Chairman’s Statement 5-6
Fund Manager’s Review 7
Statistical Record 8
Rates of Exchange 8
Distribution of Assets and Liabilities 8
Largest Investments 9
Changes in Investments 9
Fund Manager Reports 10-23
United Kingdom 10
Europe (ex UK) 12
North America 14
Japan 16
Pacific (ex Japan, China) 18
China 20
Emerging Markets 22
Portfolio Structure 24-25
FTSE Stock Market Indices Total Return 24
Geographical Total Return Analysis 24
Geographical Analysis 25
Sector Analysis 25
Corporate Information 26-30
Directors 26
Registered Office 27
Service Providers 27
Independent Auditor 27
Financial Calendar 27
Information Sources 27
Follow Janus Henderson Investment Trusts on
Twitter, YouTube and Facebook 27
Investing 27
Nominee Share Code 27
Status 28
Principal Risks and Uncertainties 28
Viability Statement 29
Borrowings 29
Performance Measurement and Key
Performance Indicators 29
Future Developments 29
Corporate Responsibility 29
Modern Slavery Act 30
Board Diversity 30
Glossary 31
Alternative Performance Measures 32
Corporate Report
Report of the Directors 34-35
Statement of Directors’ Responsibilities 36
Directors’ Remuneration Report 37-38
Corporate Governance Statement 39-43
Report of the Audit Committee 44-45
Independent Auditor’s Report to the Members
of The Bankers Investment Trust PLC 46-50
Financial Statements
Statement of Comprehensive Income 51
Statement of Changes in Equity 52
Statement of Financial Position 53
Cash Flow Statement 54
Notes to the Financial Statements 55-72
General Shareholder Information 73-74
Securities Financing Transactions 75-76
Contents
The Bankers Investment Trust PLC Annual Report 2018
The image on the front cover is based on the HSBC Bank Building in Hong Kong.
A brief historyThe Company was incorporated in 1888.
Since seven of the nine original directors
were bankers by profession, the name The
Bankers’ Investment Trust, Limited was
considered appropriate. The Company has
paid dividends on the equity capital every year
since incorporation except in the years 1892
and 1893.
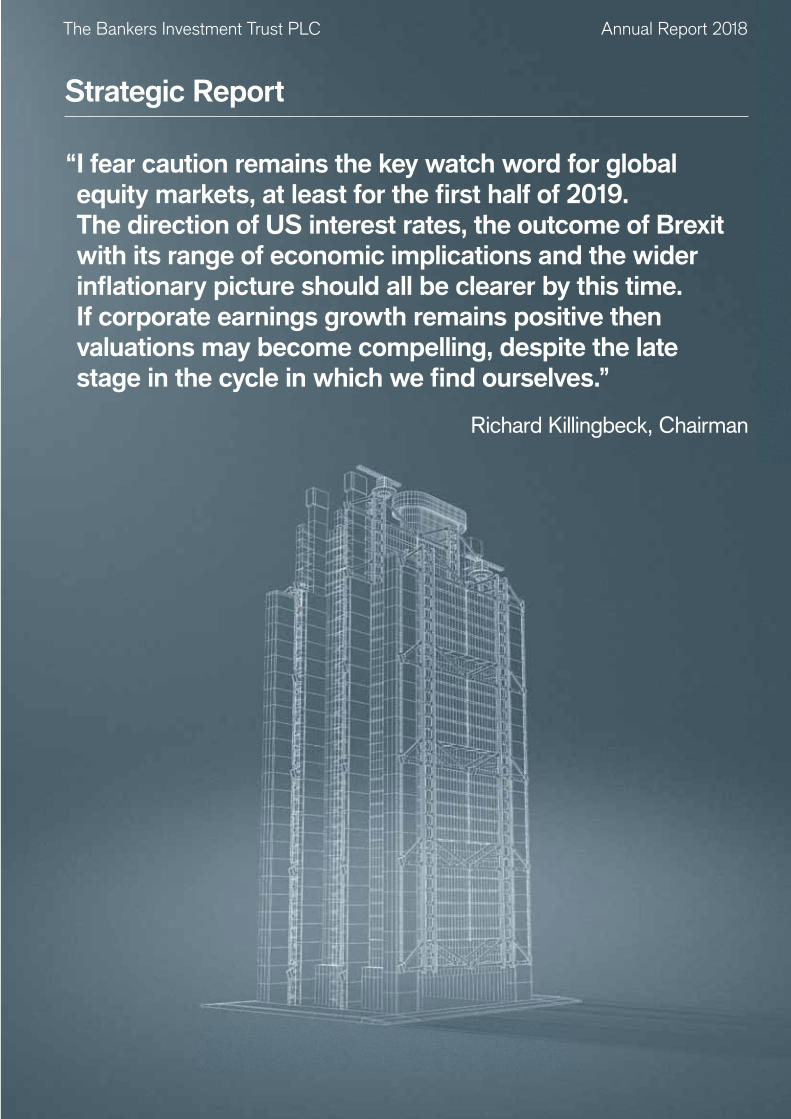
Strategic Report
“ I fear caution remains the key watch word for global
equity markets, at least for the first half of 2019.
The direction of US interest rates, the outcome of Brexit
with its range of economic implications and the wider
inflationary picture should all be clearer by this time.
If corporate earnings growth remains positive then
valuations may become compelling, despite the late
stage in the cycle in which we find ourselves.”
Richard Killingbeck, Chairman
The Bankers Investment Trust PLC Annual Report 2018
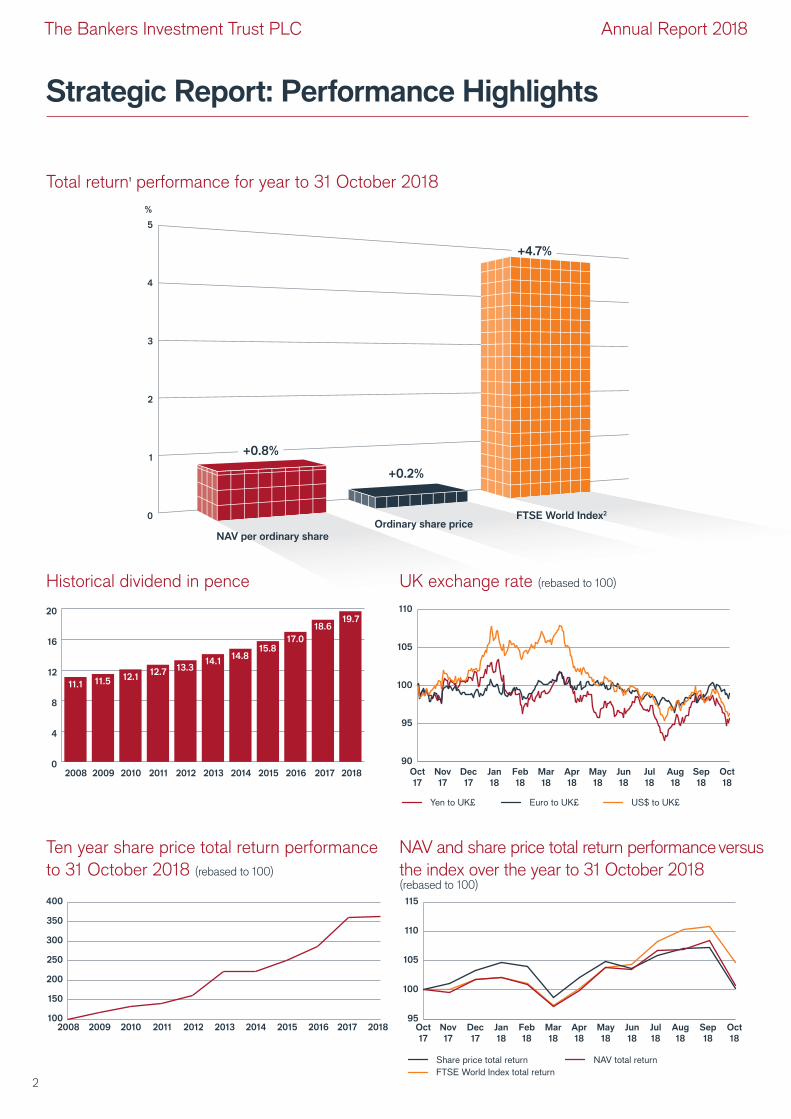
Strategic Report: Performance Highlights
Total return1 performance for year to 31 October 2018
FTSE World Index total return
Share price total return NAV total return
95
100
105
110
115
May
18
Apr
18
Mar
18
Feb
18
Jan
18
Dec
17
Nov
17
Oct
17
Sep
18
Oct
18
Aug
18
Jul
18
Jun
18
100
150
200
250
300
350
400
2008 2009 2010 2011 2012 2013 2016 2018201720152014
0
4
8
12
16
20
2008 2009 2010 2011 2012 2013 2014 2016 2017 20182015
17.0
18.619.7
11.1 11.512.1
12.713.3
14.114.8
15.8
NAV and share price total return performance versus
the index over the year to 31 October 2018(rebased to 100)
Ten year share price total return performance
to 31 October 2018 (rebased to 100)
US$ to UK£Euro to UK£ Yen to UK£
90
95
100
105
110
May
18
Apr
18
Mar
18
Feb
18
Jan
18
Dec
17
Nov
17
Oct
17
Sep
18
Oct
18
Aug
18
Jul
18
Jun
18
NAV per ordinary share
+0.2%
5
4
%
3
2
1
0Ordinary share price
FTSE World Index2
UK exchange rate (rebased to 100)Historical dividend in pence
+0.8%
+4.7%
2
The Bankers Investment Trust PLC Annual Report 2018
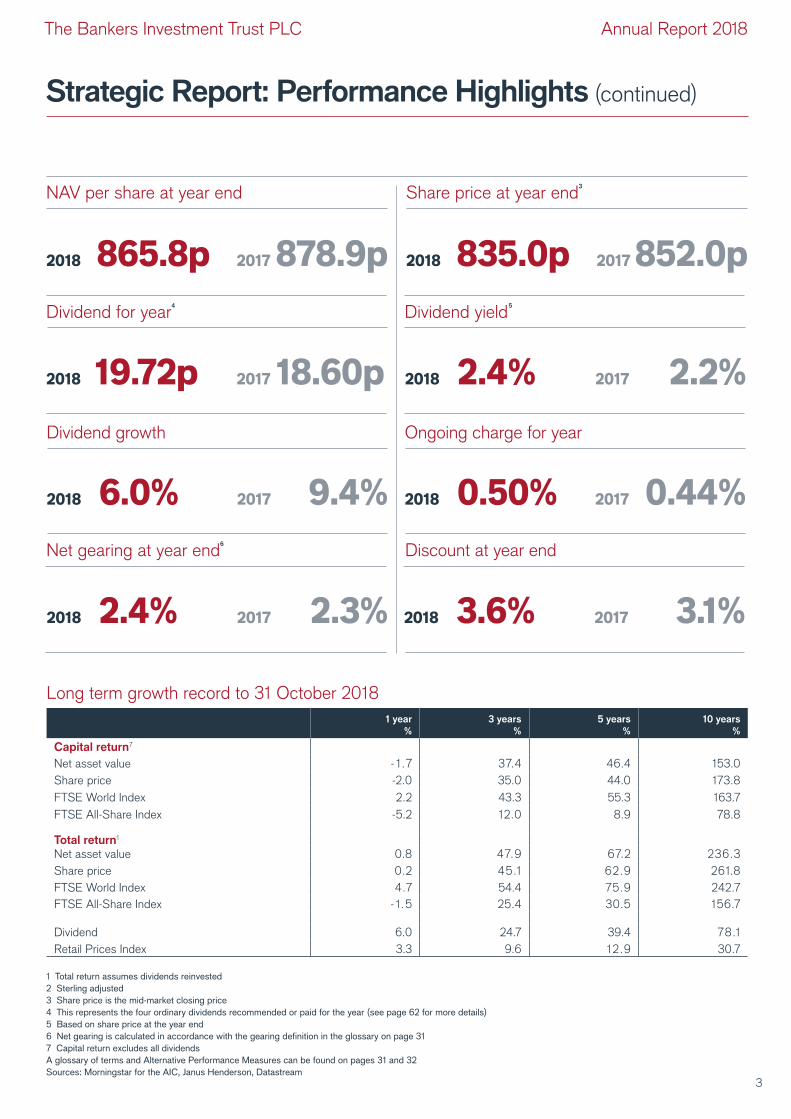
Strategic Report: Performance Highlights (continued)
1 Total return assumes dividends reinvested
2 Sterling adjusted
3 Share price is the mid-market closing price
4 This represents the four ordinary dividends recommended or paid for the year (see page 62 for more details)
5 Based on share price at the year end
6 Net gearing is calculated in accordance with the gearing definition in the glossary on page 31
7 Capital return excludes all dividends
A glossary of terms and Alternative Performance Measures can be found on pages 31 and 32
Sources: Morningstar for the AIC, Janus Henderson, Datastream
Dividend yield5
Dividend for year4
2018 2.4% 2017 2.2%2018 19.72p
2017 18.60p
2018 3.6% 2017 3.1%
Dividend growth
2018 6.0% 2017 9.4% 2018 0.50% 2017 0.44%
Ongoing charge for year
Discount at year end
Share price at year end3
2018 835.0p 2017 852.0p
Net gearing at year end6
2018 2.4% 2017 2.3%
NAV per share at year end
2018 865.8p 2017 878.9p
Long term growth record to 31 October 2018
1 year
%
3 years
%
5 years
%
10 years
%
Capital return7
Net asset value - 1.7 37.4 46.4 153.0
Share price -2.0 35.0 44.0 173.8
FTSE World Index 2.2 43.3 55.3 163.7
FTSE All-Share Index -5.2 12.0 8.9 78.8
Total return1
Net asset value 0.8 47.9 67.2 236.3
Share price 0.2 45.1 62.9 261.8
FTSE World Index 4.7 54.4 75.9 242.7
FTSE All-Share Index - 1.5 25.4 30.5 156.7
Dividend 6.0 24.7 39.4 78.1
Retail Prices Index 3.3 9.6 12.9 30.7
3
The Bankers Investment Trust PLC Annual Report 2018
Structure and Principal ActivityThe Company is an investment trust with a premium listing on the
London Stock Exchange and a listing on the New Zealand Stock
Exchange and its principal activity is portfolio investment. Investment
trusts, like unit trusts and OEICs, are pooled investment vehicles
which allow shareholders exposure to a diversified range of assets
through a single investment, thus spreading, although not eliminating,
investment risk. The Company invests in large, publicly-listed
companies throughout the world that offer attractive capital and
income growth opportunities. The Company employs Janus
Henderson (the ‘Manager’) to manage actively the Company’s
assets in accordance with the Company’s investment policy.
Investment ObjectivesThe Company aims over the long term to achieve capital growth in
excess of the FTSE World Index and annual dividend growth greater
than inflation, as defined by the UK Retail Prices Index (‘RPI’), by
investing in companies listed throughout the world.
Investment PolicyThe following investment ranges apply:
Equities: 80% to 100%
Debt securities and cash investments: 0% to 20%
Investments trusts, collective funds and derivatives: 0% to 15%
To achieve an appropriate spread of investment risk the portfolio is
broadly diversified by geography, sector and company. The Manager
has the flexibility to invest in any geographic region and any sector
with no set limits on individual country or sector exposures and,
therefore, the make-up and weighting of the portfolio may differ
materially from the FTSE World Index.
The Manager primarily employs a bottom-up, value-based investment
process to identify suitable opportunities and pays particular regard
to cash generation and dividends. The Board regularly monitors the
Company’s investments and the Manager’s investment activity.
The Company can, but normally does not, invest up to 15% of its
gross assets in any other investment companies (including listed
investment trusts).
DerivativesThe Company may use financial instruments known as derivatives
for the purpose of efficient portfolio management while maintaining
a level of risk consistent with the risk profile of the Company.
GearingThe Company can borrow to make additional investments with the
aim of achieving a return that is greater than the cost of the
borrowing. The Company can borrow up to 20% of net assets at
the time of draw down.
Position at the year end At 31 October 2018, the portfolio contained 186 (2017: 195)
individual investments excluding those held at nil value, with the
largest single investment accounting for 1.97% (2017: 1.81%) of total
investments and the top 25 holdings totalling 33.83% (2017:
30.20%) of total investments. There was one holding of an
investment company in the portfolio (2017: nil). There were no
derivatives held in the portfolio (2017: nil). Net gearing was 2.4%
(2017: 2.3%).
ManagementThe Company qualifies as an Alternative Investment Fund (‘AIF’)
in accordance with the Alternative Investment Fund Manager
Directive (‘AIFMD’).
The Company has appointed Henderson Investment Funds Limited
(‘HIFL’) to act as its Alternative Investment Fund Manager (‘AIFM’)
in accordance with an agreement which was effective from 22 July
2014 and is terminable on six months’ notice. HIFL delegates
investment management services to Henderson Global Investors
Limited, which acts as Manager. Both entities are authorised and
regulated by the Financial Conduct Authority (‘FCA’). References
to Janus Henderson and the Manager within this report refer to the
services provided by both entities.
The fund management team is led by Alex Crooke, who has been
in place since 2003. He is assisted by David Smith, Tim Stevenson
(see page 7), Ian Warmerdam, Junichi Inoue, Michael Kerley, Charlie
Awdry and Nicholas Cowley.
Janus Henderson and its subsidiaries provide accounting, company
secretarial and general administrative services. Some of the
administration and accounting services are carried out, on behalf of
Janus Henderson, by BNP Paribas Securities Services. Wendy King
FCIS acts as Company Secretary on behalf of the Corporate
Secretary, Henderson Secretarial Services Limited.
Management FeeFrom 1 July 2016 the management fee is equal to the aggregate of
0.45% per annum of the first £750 million and 0.40% per annum on
the excess over £750 million of the value of the net assets on the
last day of the quarter immediately preceding the quarter in respect
of which the calculation is made. For the calendar year 2017, the
management fee calculated for the four quarters of 2017 was subject
to a cap of £843,685 per quarter.
InvestingThe Bankers Investment Trust PLC sets out to be an attractive and
straightforward long-term investment vehicle for private investors.
As well as investing directly, shares can be purchased through various
dealing platforms and held in share plans, ISAs or pensions. Links
to some of these dealing platforms can be found on our website,
www.bankersinvestmenttrust.com.
Strategic Report: Business Model
4
The Bankers Investment Trust PLC Annual Report 2018
Strategic Report: Chairman’s Statement
• Net asset value total return increase of 0.8%
• Dividend increase of 6% to 19.72p per share
• Forecast increase in 2019 dividend of 6%
PerformanceThe past year has been disappointing from a net asset value (‘NAV’)
total return basis, with an increase of just 0.8% leading to a flat share
price total return over this period. The caution that I expressed in the
outlook paragraph of the Strategic Report last year was for the early
part of the year misplaced. Yet by our year-end the effects of rising
US interest rates, stretched valuations of growth stocks, trade wars
and UK politics had all played their part in turning global market
sentiment negative.
Volatility has been in evidence across global markets since early
summer as the momentum behind the tightening US interest rate
cycle has begun to influence market sentiment and, in particular,
highly-rated growth stocks such as those in the technology sector.
In addition, the growing number of macro concerns (trade wars, UK
politics, emerging market debt levels) have risen to prominence as
the year progressed. Against this backdrop, companies issuing profit
warnings have been harshly treated by the markets thus
compounding the rising nervousness amongst investors.
During the year the asset allocation structure of the portfolio has
continued the trend of the past three years, namely a reduction in
the UK equity element of the portfolio, a gradual increase in the
US and a maintaining of our allocation to Japanese and Continental
European equities. Towards the end of the period we allocated
some more monies to our China exposure, following a near 20%
decline in the market, thus maintaining an overall stable allocation
to the Asian region.
With the exception of North America and Japan, all global markets
experienced negative returns during the year. On a positive note our
regional managers performed well with four (Europe, North America,
Asia Pacific and China) significantly outperforming their local
benchmarks whilst the UK, Japan and Emerging Market portfolios
underperformed their local benchmarks. From a sectorial
perspective, our overweight position in consumer stocks, in
particular in the UK, has negatively impacted performance, whilst
our technology exposure in the US has driven our outperformance
in this market. Towards our year-end some profits were realised
from these elements of the portfolio.
Revenue and DividendsBankers has delivered a further solid increase in the revenue
account, reflecting positive currency movements, robust dividend
growth and further special dividends. This performance has enabled
the Board to recommend a final quarterly dividend of 5p per share.
If approved by shareholders, this will result in a total dividend
payment for the year of 19.72p, (2017: 18.60p), an increase of 6.0%.
Delivering on my forecast for the year. Our revenue earnings per
share over the same period rose to 20.78p (2017: 20.49p), an
increase of 1.4%.
The outlook for the year ahead from a revenue account perspective
remains positive. The recommended final 2018 dividend payment, if
approved, will still accommodate a healthy transfer to our revenue
reserve which, at the year-end, represented 1.2 times the cost of
the 2018 annual dividend. This reserve gives the Board confidence
in its discussions regarding likely future dividend growth. The main
concern when forecasting growth for the current year remains the
level of sterling. Sterling’s weakness has helped our revenue account
significantly during the past three years. A sudden increase in the
value of sterling, albeit not our expectation, will lead to pressure on
the revenue account. However such is our level of revenue reserves
that I am pleased to be able to report, on behalf of the Board, a
forecast of dividend growth of approximately 6% for 2019.
Board ChangesAs has previously been announced, I shall be retiring from the Board
at the forthcoming Annual General Meeting (‘AGM’). Sue Inglis will
succeed as Chairman from the conclusion of the AGM. Sue joined
the Board in November 2012 and became Senior Independent
Director in February 2015. Sue is highly experienced and
knowledgeable within the investment trust sector and has for
many years advised other companies in her role as a lawyer and
subsequently a corporate financier. Sue has a number of other
non-executive roles in the sector having stepped down as Managing
Director – Corporate Finance at Cantor Fitzgerald Europe last
summer. I know that Sue will continue the ethos that has served
shareholders in Bankers so well over the longer term. Julian
Chillingworth will succeed Sue as Senior Independent Director
at the same time.
I am also pleased to report that Richard Huntingford joined the
Board on 26 September 2018, subject to shareholder approval at the
AGM. Richard has been involved in the media and marketing sectors
for more than 30 years and has held a number of executive and
non-executive roles in listed and private businesses. Further details
of his experience can be found on page 26. I look forward to
introducing Richard to shareholders at the AGM.
The Chairman of the Company, Richard Killingbeck, reports on
the year to 31 October 2018
5
The Bankers Investment Trust PLC Annual Report 2018
Strategic Report: Chairman’s Statement (continued)
Annual General Meeting This year’s AGM will again be held at Trinity House, London,
EC3N 4DH on 27 February 2019 at 12 noon. Full details of the
business to be conducted at the meeting are set out in the Notice
of Meeting which has been sent to shareholders with this report.
Directions and a map showing the location of the AGM can also be
found in the Notice of Meeting. At the AGM, Alex Crooke and his
investment team will present their investment views and how these
are reflected in the portfolio. Following the formal business of the
meeting, light refreshments will be served. The Board looks forward
to seeing many of you at the AGM.
OutlookIn my view it is too early to become contrarian in regard to market
sentiment but it is tempting to begin to look at markets more
positively. The global economy, led by North America, remains
solid, and inflationary pressures, whilst higher than a year ago,
are stabilising. The recent oil price decline has yet to feed through
into inflation numbers and, whilst wage inflation remains a concern,
overall inflation could fall in 2019. If such a scenario were to be in
evidence then the current momentum in interest rate rises in the
US could ease giving markets a welcome boost. Valuations in certain
sectors will continue to be a limiting factor, equally investors will need
a resolution of the current trade tariff dispute to commit substantial
new money to the market. The recent low levels of volatility in
markets are a phenomenon that are now likely to be confined to
history and a product of quantitative easing used to stabilise markets
through the financial crises. Therefore, going forward investors will
need to readjust to more historically normal high levels of volatility.
The uncertainty in the UK will remain and will be dominated by
Brexit issues well beyond the end of March 2019. Consumer and
business sentiment remain as critical indicators in the year ahead for
the country and for confidence to return to the UK from international
investors in particular. The UK market therefore will likely have
another dull year. Yet the valuation argument is becoming more
compelling especially for some companies in more traditional
defensive sectors with strong balance sheets and well covered
dividends. Currency markets may surprise in 2019 and, as
highlighted earlier, a stronger sterling would impact our revenue
account and also have a negative translational impact on the NAV
from the international holdings.
Thus I fear caution remains the key watch word for global equity
markets, at least for the first half of 2019. The direction of US interest
rates, the outcome of Brexit with its range of economic implications
and the wider inflationary picture should all be clearer by this time.
If corporate earnings growth remains positive then valuations may
become compelling, despite the late stage in the cycle in which
we find ourselves.
R W Killingbeck
Chairman
15 January 2019
6
The Bankers Investment Trust PLC Annual Report 2018
Strategic Report: Fund Manager’s Review
has outperformed other global markets for seven years during the
last decade and therefore an element of caution is warranted in
terms of increasing exposure. Our stock selection has offset the
underweight, with the North American team producing a very
impressive performance by focusing on long-term secular trends
such as paperless payment, disruption and health care. The
European and Pacific portfolios also delivered strong relative returns,
with a focus on quality companies with dominant market positions in
their industries. It was not a year to bet against market trends
reversing, momentum remained strong for market leaders and value
and income stocks underperformed.
The UK remained mired in Brexit uncertainty which has made
the UK stock market almost un-investable in many international
investors’ eyes. Sterling steadily declined against the US dollar,
although it has held its own against the Euro. The UK economy
has seen little impact from Brexit, benefitting from the lower
exchange rate. However the strains have latterly become apparent
with reduced inward investment flows and tighter labour markets
as immigration falls. The portfolio’s exposure to the UK was
reduced further this year, ending at 25.2%. The majority of the
underperformance against the benchmark can be explained by the
UK exposure and the underperformance of the UK stocks we held.
A narrow number of the largest stocks performed well in the UK but
the mid-cap stocks, which are more domestically exposed, did not
perform for us.
OutlookAs I look forward I suspect that the future will not turn out as bad
as many predict. The world does not appear on the verge of a sharp
recession but clearly growth is slowing and share prices have begun
to price this in. There is an incentive on all sides to get trade
discussions concluded and I expect a better picture to emerge as
the year develops. By the summer many of the uncertainties will
have resolved themselves in one form or another and we should
have a clearer outlook. Valuations have fallen significantly in recent
months and we have an opportunity to invest cash at very favourable
dividend yields. An element of caution still seems sensible and we
are looking to purchase only quality companies with strong balance
sheets, rather than recovery situations that require a higher level of
economic growth. It looks like a year of two halves lies ahead of us.
Alex Crooke
15 January 2019
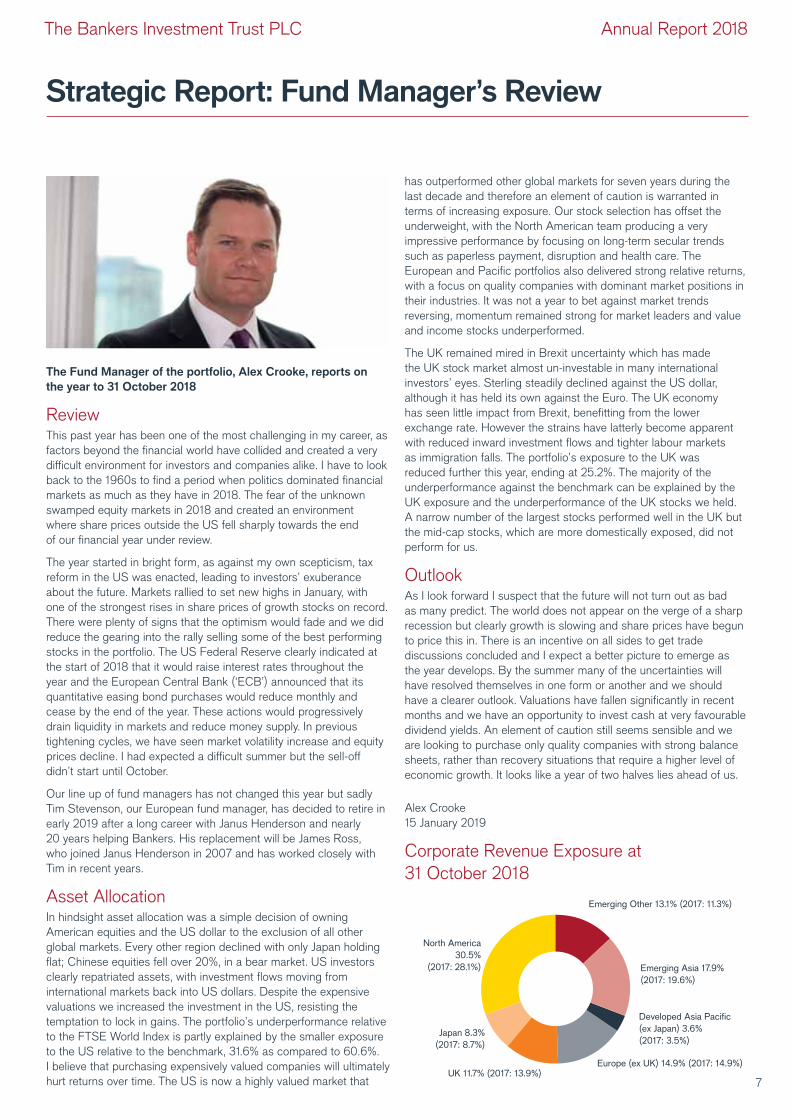
Corporate Revenue Exposure at
31 October 2018
The Fund Manager of the portfolio, Alex Crooke, reports on
the year to 31 October 2018
ReviewThis past year has been one of the most challenging in my career, as
factors beyond the financial world have collided and created a very
difficult environment for investors and companies alike. I have to look
back to the 1960s to find a period when politics dominated financial
markets as much as they have in 2018. The fear of the unknown
swamped equity markets in 2018 and created an environment
where share prices outside the US fell sharply towards the end
of our financial year under review.
The year started in bright form, as against my own scepticism, tax
reform in the US was enacted, leading to investors’ exuberance
about the future. Markets rallied to set new highs in January, with
one of the strongest rises in share prices of growth stocks on record.
There were plenty of signs that the optimism would fade and we did
reduce the gearing into the rally selling some of the best performing
stocks in the portfolio. The US Federal Reserve clearly indicated at
the start of 2018 that it would raise interest rates throughout the
year and the European Central Bank (‘ECB’) announced that its
quantitative easing bond purchases would reduce monthly and
cease by the end of the year. These actions would progressively
drain liquidity in markets and reduce money supply. In previous
tightening cycles, we have seen market volatility increase and equity
prices decline. I had expected a difficult summer but the sell-off
didn’t start until October.
Our line up of fund managers has not changed this year but sadly
Tim Stevenson, our European fund manager, has decided to retire in
early 2019 after a long career with Janus Henderson and nearly
20 years helping Bankers. His replacement will be James Ross,
who joined Janus Henderson in 2007 and has worked closely with
Tim in recent years.
Asset AllocationIn hindsight asset allocation was a simple decision of owning
American equities and the US dollar to the exclusion of all other
global markets. Every other region declined with only Japan holding
flat; Chinese equities fell over 20%, in a bear market. US investors
clearly repatriated assets, with investment flows moving from
international markets back into US dollars. Despite the expensive
valuations we increased the investment in the US, resisting the
temptation to lock in gains. The portfolio’s underperformance relative
to the FTSE World Index is partly explained by the smaller exposure
to the US relative to the benchmark, 31.6% as compared to 60.6%.
I believe that purchasing expensively valued companies will ultimately
hurt returns over time. The US is now a highly valued market that UK 11.7% (2017: 13.9%)
Europe (ex UK) 14.9% (2017: 14.9%)
Developed Asia Pacific
(ex Japan) 3.6%
(2017: 3.5%)
Emerging Asia 17.9%
(2017: 19.6%)
Emerging Other 13.1% (2017: 11.3%)
North America
30.5%
(2017: 28.1%)
Japan 8.3%
(2017: 8.7%)
7
The Bankers Investment Trust PLC Annual Report 2018
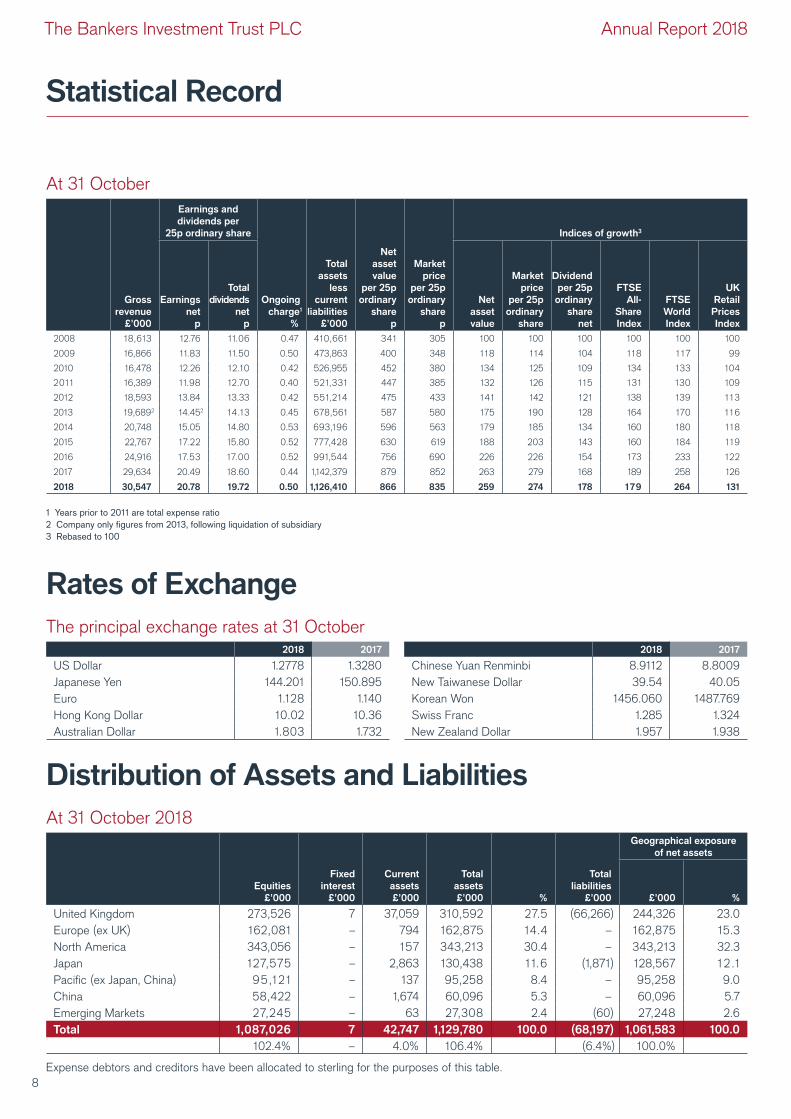
Statistical Record
At 31 October
Earnings and
dividends per
25p ordinary share
Ongoing
charge1
%
Indices of growth3
Gross
revenue
£’000
Earnings
net
p
Total
dividends
net
p
Total
assets
less
current
liabilities
£’000
Net
asset
value
per 25p
ordinary
share
p
Market
price
per 25p
ordinary
share
p
Net
asset
value
Market
price
per 25p
ordinary
share
Dividend
per 25p
ordinary
share
net
FTSE
All-
Share
Index
FTSE
World
Index
UK
Retail
Prices
Index
2008 18,613 12.76 11.06 0.47 410,661 341 305 100 100 100 100 100 100
2009 16,866 11.83 11.50 0.50 473,863 400 348 118 114 104 118 1 17 99
2010 16,478 12.26 12.10 0.42 526,955 452 380 134 125 109 134 133 104
2011 16,389 11.98 12.70 0.40 521,331 447 385 132 126 115 131 130 109
2012 18,593 13.84 13.33 0.42 551,214 475 433 141 142 121 138 139 113
2013 19,6892 14.452 14.13 0.45 678,561 587 580 175 190 128 164 170 116
2014 20,748 15.05 14.80 0.53 693,196 596 563 179 185 134 160 180 118
2015 22,767 17.22 15.80 0.52 777,428 630 619 188 203 143 160 184 119
2016 24,916 17.53 17.00 0.52 991,544 756 690 226 226 154 173 233 122
2017 29,634 20.49 18.60 0.44 1,142,379 879 852 263 279 168 189 258 126
2018 30,547 20.78 19.72 0.50 1,126,410 866 835 259 274 178 179 264 131
1 Years prior to 2011 are total expense ratio
2 Company only figures from 2013, following liquidation of subsidiary
3 Rebased to 100
Rates of Exchange
Distribution of Assets and Liabilities
The principal exchange rates at 31 October2018 2017
US Dollar 1.2778 1.3280
Japanese Yen 144.201 150.895
Euro 1.128 1.140
Hong Kong Dollar 10.02 10.36
Australian Dollar 1.803 1.732
2018 2017
Chinese Yuan Renminbi 8.9112 8.8009
New Taiwanese Dollar 39.54 40.05
Korean Won 1456.060 1487.769
Swiss Franc 1.285 1.324
New Zealand Dollar 1.957 1.938
At 31 October 2018
Equities
£’000
Fixed
interest
£’000
Current
assets
£’000
Total
assets
£’000 %
Total
liabilities
£’000
Geographical exposure
of net assets
£’000 %
United Kingdom 273,526 7 37,059 310,592 27.5 (66,266) 244,326 23.0
Europe (ex UK) 162,081 – 794 162,875 14.4 – 162,875 15.3
North America 343,056 – 157 343,213 30.4 – 343,213 32.3
Japan 127,575 – 2,863 130,438 11.6 (1,871) 128,567 12 .1
Pacific (ex Japan, China) 95,121 – 137 95,258 8.4 – 95,258 9.0
China 58,422 – 1,674 60,096 5.3 – 60,096 5.7
Emerging Markets 27,245 – 63 27,308 2.4 (60) 27,248 2.6
Total 1,087,026 7 42,747 1,129,780 100.0 (68,197) 1,061,583 100.0
102.4% – 4.0% 106.4% (6.4%) 100.0%
Expense debtors and creditors have been allocated to sterling for the purposes of this table.
8
The Bankers Investment Trust PLC Annual Report 2018
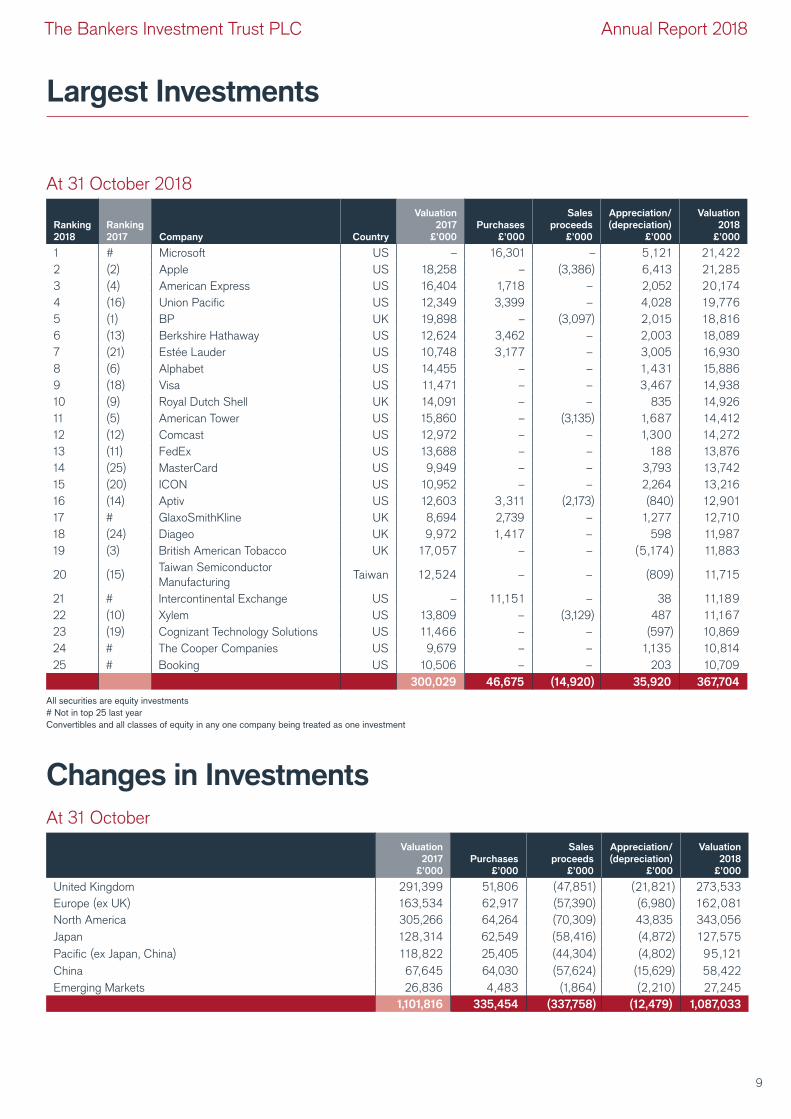
Largest Investments
Changes in Investments
At 31 October
Valuation
2017
£’000
Purchases
£’000
Sales
proceeds
£’000
Appreciation/
(depreciation)
£’000
Valuation
2018
£’000
United Kingdom 291,399 51,806 (47,851) (21,821) 273,533
Europe (ex UK) 163,534 62,917 (57,390) (6,980) 162,081
North America 305,266 64,264 (70,309) 43,835 343,056
Japan 128,314 62,549 (58,416) (4,872) 127,575
Pacific (ex Japan, China) 118,822 25,405 (44,304) (4,802) 95,121
China 67,645 64,030 (57,624) (15,629) 58,422
Emerging Markets 26,836 4,483 (1,864) (2,210) 27,245
1,101,816 335,454 (337,758) (12,479) 1,087,033
At 31 October 2018
Ranking
2018
Ranking
2017 Company Country
Valuation
2017
£’000
Purchases
£’000
Sales
proceeds
£’000
Appreciation/
(depreciation)
£’000
Valuation
2018
£’000
1 # Microsoft US – 16,301 – 5,121 21,422
2 (2) Apple US 18,258 – (3,386) 6,413 21,285
3 (4) American Express US 16,404 1,718 – 2,052 20,174
4 (16) Union Pacific US 12,349 3,399 – 4,028 19,776
5 (1) BP UK 19,898 – (3,097) 2,015 18,816
6 (13) Berkshire Hathaway US 12,624 3,462 – 2,003 18,089
7 (21) Estée Lauder US 10,748 3,177 – 3,005 16,930
8 (6) Alphabet US 14,455 – – 1,431 15,886
9 (18) Visa US 11,471 – – 3,467 14,938
10 (9) Royal Dutch Shell UK 14,091 – – 835 14,926
11 (5) American Tower US 15,860 – (3,135) 1,687 14,412
12 (12) Comcast US 12,972 – – 1,300 14,272
13 (11) FedEx US 13,688 – – 188 13,876
14 (25) MasterCard US 9,949 – – 3,793 13,742
15 (20) ICON US 10,952 – – 2,264 13,216
16 (14) Aptiv US 12,603 3,311 (2,173) (840) 12,901
17 # GlaxoSmithKline UK 8,694 2,739 – 1,277 12,710
18 (24) Diageo UK 9,972 1,417 – 598 11,987
19 (3) British American Tobacco UK 17,057 – – (5,174) 11,883
20 (15)Taiwan Semiconductor
ManufacturingTaiwan 12,524 – – (809) 11,715
21 # Intercontinental Exchange US – 1 1,151 – 38 11,189
22 (10) Xylem US 13,809 – (3,129) 487 11,167
23 (19) Cognizant Technology Solutions US 11,466 – – (597) 10,869
24 # The Cooper Companies US 9,679 – – 1,135 10,814
25 # Booking US 10,506 – – 203 10,709
300,029 46,675 (14,920) 35,920 367,704
All securities are equity investments
# Not in top 25 last year
Convertibles and all classes of equity in any one company being treated as one investment
9
The Bankers Investment Trust PLC Annual Report 2018
Strategic Report: United Kingdom
ActivityAfter the takeover approaches for GKN and Jardine Lloyd Thompson
we recycled the proceeds into companies with more defensive
characteristics. We initiated new holdings in distribution group Bunzl
and regulated utility National Grid and added to our position in
RELX, the media company. Bunzl is the market leader in supplying
low value but essential non-food consumables to defensive end
markets such as food service and health care. National Grid’s
valuation is attractive given the stable returns from its UK business
and improving profitability in its US division. Elsewhere we bought
holdings in Hilton Food and Ibstock. Hilton Food processes, packs
and distributes meat products for food retailers globally. The
company is well invested, produces high returns and has good
visibility over future growth given recent new contract wins. Ibstock
is the UK’s leading brick manufacturer in a consolidated industry
with demand for bricks underpinned by the Government’s Help
to Buy scheme.
OutlookEquity markets are starting to exhibit late cycle characteristics and,
with global growth slowing from its recent peak, volatility has
increased. While we don’t believe the end of the cycle is imminent,
especially as valuations in the UK are now below their long term
average, it seems prudent to position the portfolio slightly more
defensively going forward. The outlook for UK domestic companies
will be driven by Brexit and what deal with the EU, if any, the
Government can agree on. Valuations for domestic companies are
historically very low hence the portfolio maintains some exposure
here but the bias is towards companies with robust business models
and balance sheets. Although the outlook for equity markets in
general has become increasingly unclear, the focus on good quality
companies should position the portfolio well in more uncertain times.
Total return (£) (year to 31 October 2018) %
Bankers -3.4
FTSE All-Share Index -1.5
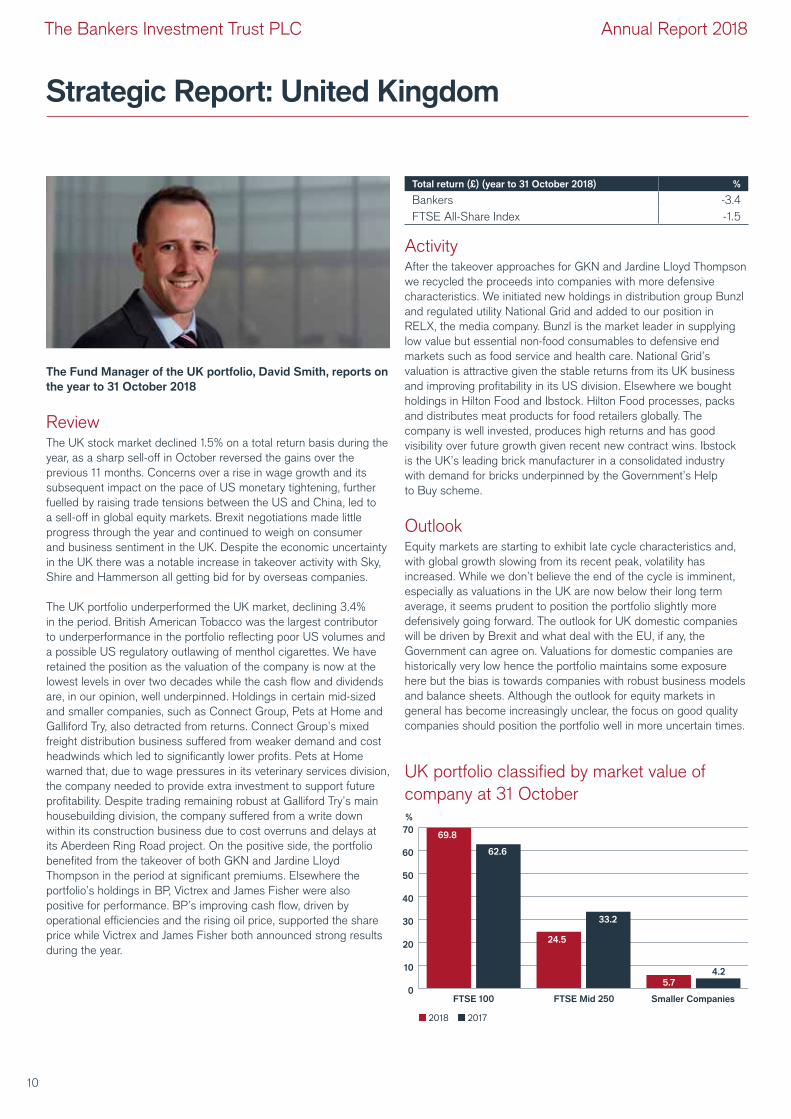
The Fund Manager of the UK portfolio, David Smith, reports on
the year to 31 October 2018
ReviewThe UK stock market declined 1.5% on a total return basis during the
year, as a sharp sell-off in October reversed the gains over the
previous 11 months. Concerns over a rise in wage growth and its
subsequent impact on the pace of US monetary tightening, further
fuelled by raising trade tensions between the US and China, led to
a sell-off in global equity markets. Brexit negotiations made little
progress through the year and continued to weigh on consumer
and business sentiment in the UK. Despite the economic uncertainty
in the UK there was a notable increase in takeover activity with Sky,
Shire and Hammerson all getting bid for by overseas companies.
The UK portfolio underperformed the UK market, declining 3.4%
in the period. British American Tobacco was the largest contributor
to underperformance in the portfolio reflecting poor US volumes and
a possible US regulatory outlawing of menthol cigarettes. We have
retained the position as the valuation of the company is now at the
lowest levels in over two decades while the cash flow and dividends
are, in our opinion, well underpinned. Holdings in certain mid-sized
and smaller companies, such as Connect Group, Pets at Home and
Galliford Try, also detracted from returns. Connect Group’s mixed
freight distribution business suffered from weaker demand and cost
headwinds which led to significantly lower profits. Pets at Home
warned that, due to wage pressures in its veterinary services division,
the company needed to provide extra investment to support future
profitability. Despite trading remaining robust at Galliford Try’s main
housebuilding division, the company suffered from a write down
within its construction business due to cost overruns and delays at
its Aberdeen Ring Road project. On the positive side, the portfolio
benefited from the takeover of both GKN and Jardine Lloyd
Thompson in the period at significant premiums. Elsewhere the
portfolio’s holdings in BP, Victrex and James Fisher were also
positive for performance. BP’s improving cash flow, driven by
operational efficiencies and the rising oil price, supported the share
price while Victrex and James Fisher both announced strong results
during the year.
UK portfolio classified by market value of
company at 31 October
0
10
20
30
40
50
60
70
24.5
5.7
69.8
33.2
4.2
62.6
%
2018 2017
FTSE 100 FTSE Mid 250 Smaller Companies
10
The Bankers Investment Trust PLC Annual Report 2018
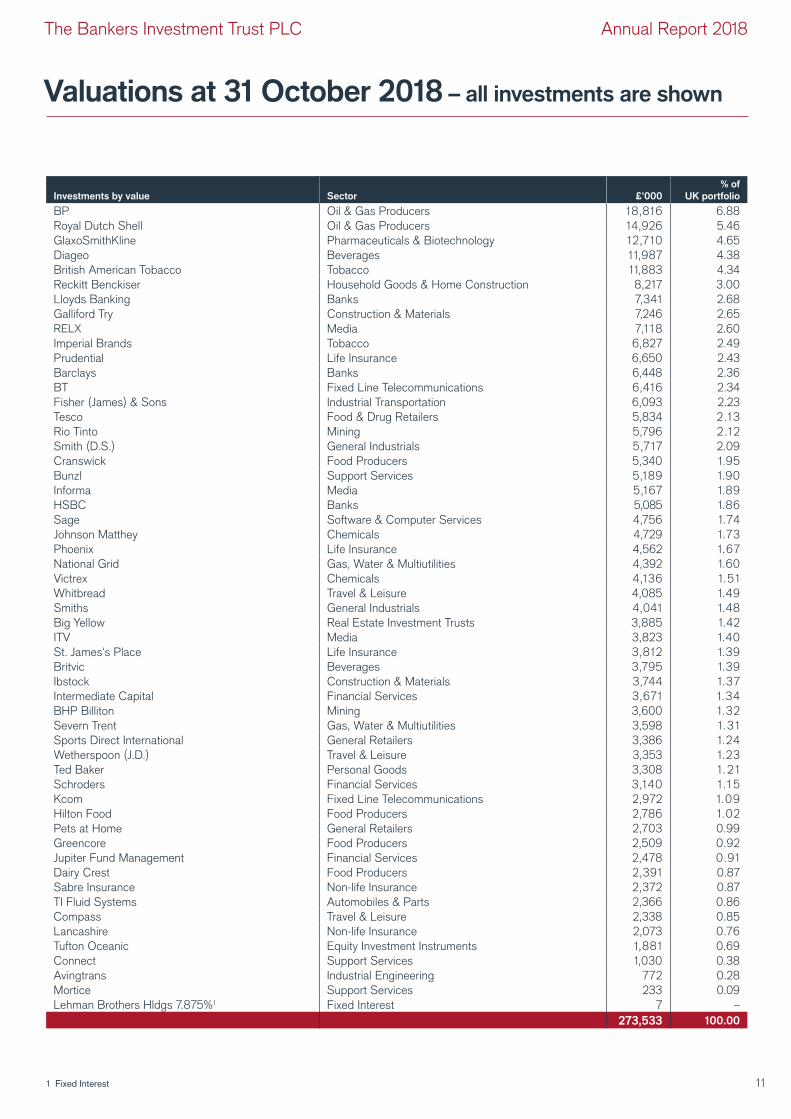
Valuations at 31 October 2018 – all investments are shown
Investments by value Sector £’000
% of
UK portfolio
BP Oil & Gas Producers 18,816 6.88
Royal Dutch Shell Oil & Gas Producers 14,926 5.46
GlaxoSmithKline Pharmaceuticals & Biotechnology 12,710 4.65
Diageo Beverages 11,987 4.38
British American Tobacco Tobacco 11,883 4.34
Reckitt Benckiser Household Goods & Home Construction 8,217 3.00
Lloyds Banking Banks 7,341 2.68
Galliford Try Construction & Materials 7,246 2.65
RELX Media 7,118 2.60
Imperial Brands Tobacco 6,827 2.49
Prudential Life Insurance 6,650 2.43
Barclays Banks 6,448 2.36
BT Fixed Line Telecommunications 6,416 2.34
Fisher (James) & Sons Industrial Transportation 6,093 2.23
Tesco Food & Drug Retailers 5,834 2.13
Rio Tinto Mining 5,796 2.12
Smith (D.S.) General Industrials 5,717 2.09
Cranswick Food Producers 5,340 1.95
Bunzl Support Services 5,189 1.90
Informa Media 5,167 1.89
HSBC Banks 5,085 1.86
Sage Software & Computer Services 4,756 1.74
Johnson Matthey Chemicals 4,729 1.73
Phoenix Life Insurance 4,562 1.67
National Grid Gas, Water & Multiutilities 4,392 1.60
Victrex Chemicals 4,136 1.51
Whitbread Travel & Leisure 4,085 1.49
Smiths General Industrials 4,041 1.48
Big Yellow Real Estate Investment Trusts 3,885 1.42
ITV Media 3,823 1.40
St. James's Place Life Insurance 3,812 1.39
Britvic Beverages 3,795 1.39
Ibstock Construction & Materials 3,744 1.37
Intermediate Capital Financial Services 3,671 1.34
BHP Billiton Mining 3,600 1.32
Severn Trent Gas, Water & Multiutilities 3,598 1.31
Sports Direct International General Retailers 3,386 1.24
Wetherspoon (J.D.) Travel & Leisure 3,353 1.23
Ted Baker Personal Goods 3,308 1. 2 1
Schroders Financial Services 3,140 1.1 5
Kcom Fixed Line Telecommunications 2,972 1.09
Hilton Food Food Producers 2,786 1.02
Pets at Home General Retailers 2,703 0.99
Greencore Food Producers 2,509 0.92
Jupiter Fund Management Financial Services 2,478 0.91
Dairy Crest Food Producers 2,391 0.87
Sabre Insurance Non-life Insurance 2,372 0.87
TI Fluid Systems Automobiles & Parts 2,366 0.86
Compass Travel & Leisure 2,338 0.85
Lancashire Non-life Insurance 2,073 0.76
Tufton Oceanic Equity Investment Instruments 1,881 0.69
Connect Support Services 1,030 0.38
Avingtrans Industrial Engineering 772 0.28
Mortice Support Services 233 0.09
Lehman Brothers Hldgs 7.875%1 Fixed Interest 7 –
273,533 100.00
1 Fixed Interest 11
The Bankers Investment Trust PLC Annual Report 2018

Strategic Report: Europe (ex UK)
that it remains simply too big to truly change. We have also reduced
positions in a few very successful holdings such as Amadeus (travel
IT systems) and Fresenius (health care).
On the purchase side we have added a position in ASML (lithography
equipment required by all semiconductor manufacturers), Roche
(pharmaceuticals) and Assa Abloy (specialist lock manufacturer).
We have also participated in two new offerings, SIG Combibloc
in specialist packaging and Knorr-Bremse a specialist brake
manufacturer. Our intention has been to try to make sure that
we have exposure to companies which should prosper regardless
of the economic environment.
OutlookWe are bombarded on a daily basis with news and opinions from
market commentators, and less frequently we have occasion to
catch-up with the management of the companies we invest in.
These are the people in the “real world”, managing and adapting to
the economic and political forces in the world. This then requires us
to take a more patient view and to make changes where we feel a
company may struggle to adapt. Given the intensity of news since
the election of a US President, who may be considered to have a
somewhat aggressive approach, and the broken promises made
during the Brexit debate, patience is needed more than ever. We
believe we are invested in financially strong companies which have
strong market positions. On the whole we participate in their success
by way of growth and dividends. Patience has been rewarded in the
past and we believe will be again in the future.
Total return (£) (year to 31 October 2018) %
Bankers -1.4
FTSE All-World Developed Europe (ex UK) Index -5.2
The Fund Manager of the European portfolio, Tim Stevenson,
reports on the year to 31 October 2018
ReviewEuropean markets have struggled to make progress in the 12 months
to the end of October 2018. The “Panglossian” feel to markets to
which I referred last year proved prescient, with firstly politics and
then economics deteriorating. It may be scant consolation to
shareholders, but the European portfolio has declined in value by
much less than the relevant index, declining 1.4% compared with a
fall of 5.2% for the index. This will be my last year looking after the
Bankers’ European portfolio as I will retire in 2019, and I would like
to thank the Board for their support and encouragement (and
patience!) and my colleagues on the European team at Janus
Henderson who have helped so much.
Politics has become unsettling, with the EU challenging Italy over
its budget plan and, in Germany, the long standing Chancellor
Angela Merkel has made it clear that this is her last term as
Chancellor, leaving the market open to fret about what a “post
Merkel” era may look like.
It has also become obvious that protectionist rhetoric from the US,
tighter vehicle emission standards across Europe and the uncertainty
surrounding Brexit are all contributing to a reluctance to invest by
companies. While many European government finances are in much
better shape, there is still a lot of work ahead for France and of
course Italy. For this reason we have avoided Italian holdings in the
latter part of the year under review. While the US Federal Reserve
has been able to start increasing interest rates, the ECB continues
to take a very cautious approach to reducing the level of quantitative
easing, with the prospect of interest rate rises unlikely for some time.
ActivityWe have made a few changes to the European portfolio during the
year, while remaining consistent with our preference for quality
names over more cyclical recovery stories. We have sold out of
Continental (car tyres and components), Infineon (semiconductors),
Sodexo (catering and services) and Siemens, the latter on concerns
European portfolio classified by market value
of company at 31 October
0
10
20
30
40
50
60
70
28.926.8
3.8
67.3 67.6
%
Over £20bn £5bn-£20bn Under £5bn
2018 2017
5.6
12
The Bankers Investment Trust PLC Annual Report 2018
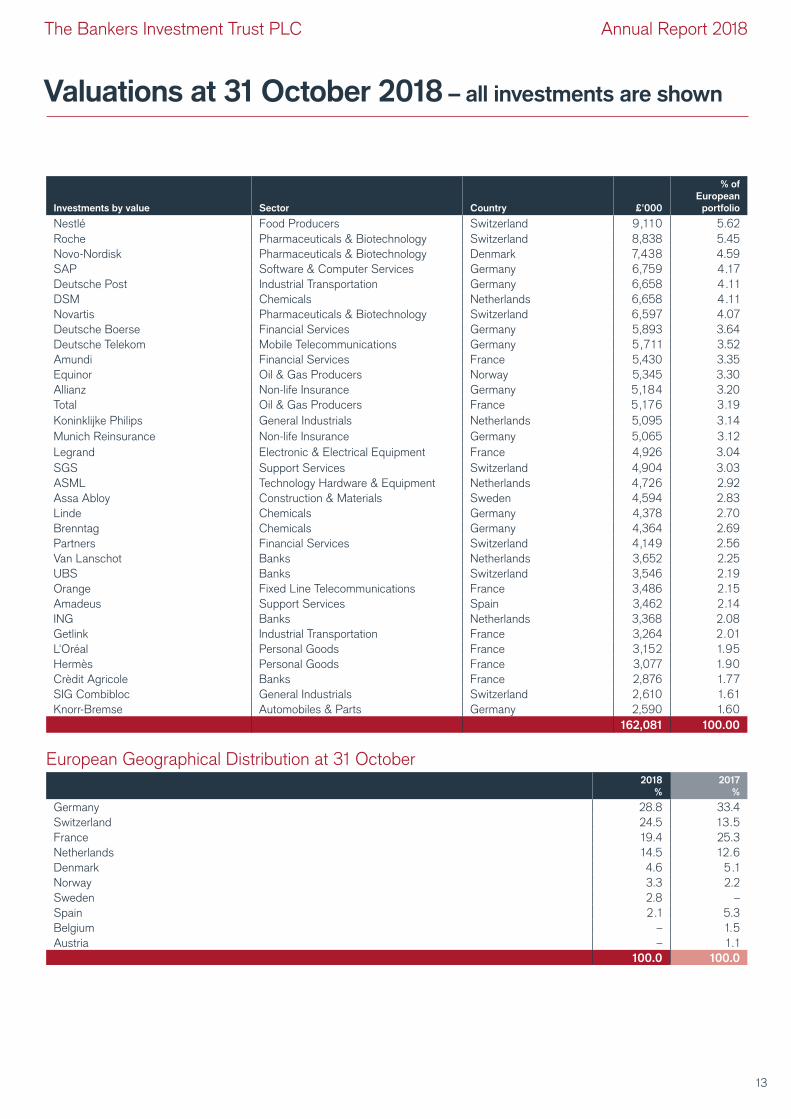
Valuations at 31 October 2018 – all investments are shown
Investments by value Sector Country £’000
% of
European
portfolio
Nestlé Food Producers Switzerland 9,110 5.62
Roche Pharmaceuticals & Biotechnology Switzerland 8,838 5.45
Novo-Nordisk Pharmaceuticals & Biotechnology Denmark 7,438 4.59
SAP Software & Computer Services Germany 6,759 4.17
Deutsche Post Industrial Transportation Germany 6,658 4 .11
DSM Chemicals Netherlands 6,658 4 .11
Novartis Pharmaceuticals & Biotechnology Switzerland 6,597 4.07
Deutsche Boerse Financial Services Germany 5,893 3.64
Deutsche Telekom Mobile Telecommunications Germany 5,711 3.52
Amundi Financial Services France 5,430 3.35
Equinor Oil & Gas Producers Norway 5,345 3.30
Allianz Non-life Insurance Germany 5,184 3.20
Total Oil & Gas Producers France 5,176 3.19
Koninklijke Philips General Industrials Netherlands 5,095 3.14
Munich Reinsurance Non-life Insurance Germany 5,065 3.12
Legrand Electronic & Electrical Equipment France 4,926 3.04
SGS Support Services Switzerland 4,904 3.03
ASML Technology Hardware & Equipment Netherlands 4,726 2.92
Assa Abloy Construction & Materials Sweden 4,594 2.83
Linde Chemicals Germany 4,378 2.70
Brenntag Chemicals Germany 4,364 2.69
Partners Financial Services Switzerland 4,149 2.56
Van Lanschot Banks Netherlands 3,652 2.25
UBS Banks Switzerland 3,546 2.19
Orange Fixed Line Telecommunications France 3,486 2.15
Amadeus Support Services Spain 3,462 2.14
ING Banks Netherlands 3,368 2.08
Getlink Industrial Transportation France 3,264 2.01
L'Oréal Personal Goods France 3,152 1.95
Hermès Personal Goods France 3,077 1.90
Crèdit Agricole Banks France 2,876 1.77
SIG Combibloc General Industrials Switzerland 2,610 1.61
Knorr-Bremse Automobiles & Parts Germany 2,590 1.60
162,081 100.00
European Geographical Distribution at 31 October2018
%
2017
%
Germany 28.8 33.4
Switzerland 24.5 13.5
France 19.4 25.3
Netherlands 14.5 12.6
Denmark 4.6 5.1
Norway 3.3 2.2
Sweden 2.8 –
Spain 2.1 5.3
Belgium – 1.5
Austria – 1.1
100.0 100.0
13
The Bankers Investment Trust PLC Annual Report 2018
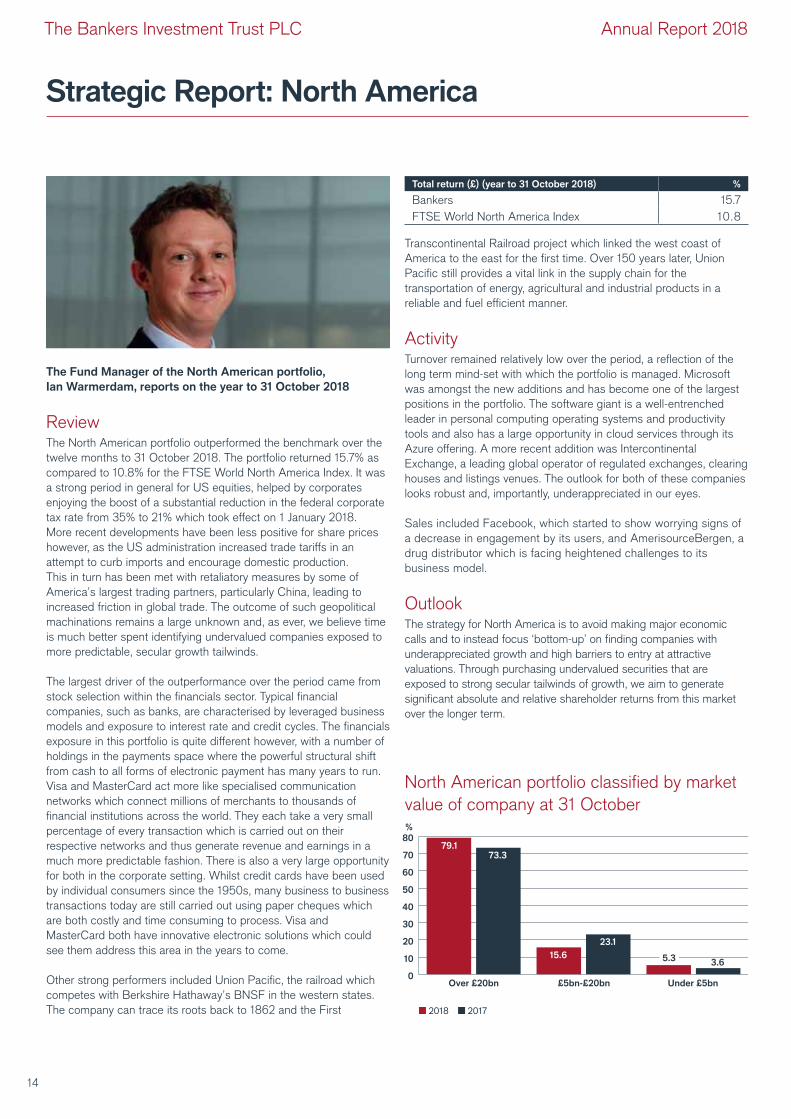
Strategic Report: North America
Transcontinental Railroad project which linked the west coast of
America to the east for the first time. Over 150 years later, Union
Pacific still provides a vital link in the supply chain for the
transportation of energy, agricultural and industrial products in a
reliable and fuel efficient manner.
Activity Turnover remained relatively low over the period, a reflection of the
long term mind-set with which the portfolio is managed. Microsoft
was amongst the new additions and has become one of the largest
positions in the portfolio. The software giant is a well-entrenched
leader in personal computing operating systems and productivity
tools and also has a large opportunity in cloud services through its
Azure offering. A more recent addition was Intercontinental
Exchange, a leading global operator of regulated exchanges, clearing
houses and listings venues. The outlook for both of these companies
looks robust and, importantly, underappreciated in our eyes.
Sales included Facebook, which started to show worrying signs of
a decrease in engagement by its users, and AmerisourceBergen, a
drug distributor which is facing heightened challenges to its
business model.
OutlookThe strategy for North America is to avoid making major economic
calls and to instead focus ‘bottom-up’ on finding companies with
underappreciated growth and high barriers to entry at attractive
valuations. Through purchasing undervalued securities that are
exposed to strong secular tailwinds of growth, we aim to generate
significant absolute and relative shareholder returns from this market
over the longer term.
Total return (£) (year to 31 October 2018) %
Bankers 15.7
FTSE World North America Index 10.8
The Fund Manager of the North American portfolio,
Ian Warmerdam, reports on the year to 31 October 2018
ReviewThe North American portfolio outperformed the benchmark over the
twelve months to 31 October 2018. The portfolio returned 15.7% as
compared to 10.8% for the FTSE World North America Index. It was
a strong period in general for US equities, helped by corporates
enjoying the boost of a substantial reduction in the federal corporate
tax rate from 35% to 21% which took effect on 1 January 2018.
More recent developments have been less positive for share prices
however, as the US administration increased trade tariffs in an
attempt to curb imports and encourage domestic production.
This in turn has been met with retaliatory measures by some of
America’s largest trading partners, particularly China, leading to
increased friction in global trade. The outcome of such geopolitical
machinations remains a large unknown and, as ever, we believe time
is much better spent identifying undervalued companies exposed to
more predictable, secular growth tailwinds.
The largest driver of the outperformance over the period came from
stock selection within the financials sector. Typical financial
companies, such as banks, are characterised by leveraged business
models and exposure to interest rate and credit cycles. The financials
exposure in this portfolio is quite different however, with a number of
holdings in the payments space where the powerful structural shift
from cash to all forms of electronic payment has many years to run.
Visa and MasterCard act more like specialised communication
networks which connect millions of merchants to thousands of
financial institutions across the world. They each take a very small
percentage of every transaction which is carried out on their
respective networks and thus generate revenue and earnings in a
much more predictable fashion. There is also a very large opportunity
for both in the corporate setting. Whilst credit cards have been used
by individual consumers since the 1950s, many business to business
transactions today are still carried out using paper cheques which
are both costly and time consuming to process. Visa and
MasterCard both have innovative electronic solutions which could
see them address this area in the years to come.
Other strong performers included Union Pacific, the railroad which
competes with Berkshire Hathaway’s BNSF in the western states.
The company can trace its roots back to 1862 and the First
North American portfolio classified by market
value of company at 31 October
0
10
20
30
40
50
60
70
80
15.6
23.1
79.173.3
%
Over £20bn £5bn-£20bn Under £5bn
2018 2017
3.65.3
14
The Bankers Investment Trust PLC Annual Report 2018
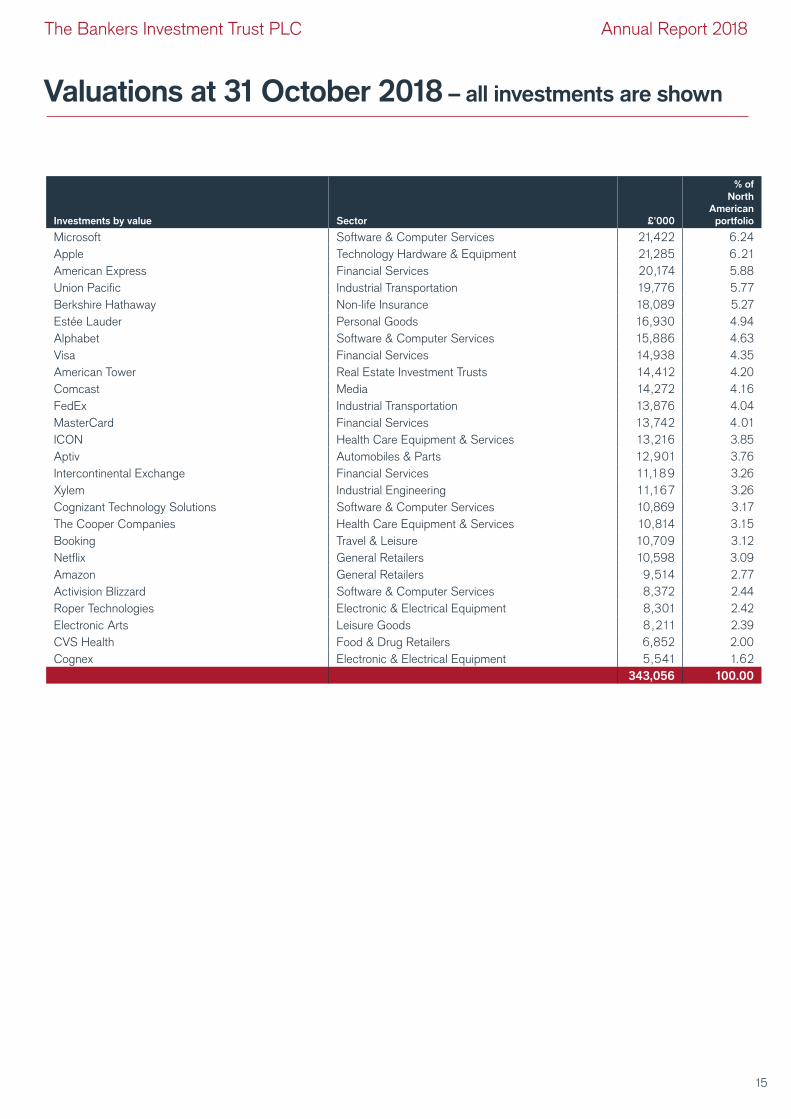
Valuations at 31 October 2018 – all investments are shown
Investments by value Sector £’000
% of
North
American
portfolio
Microsoft Software & Computer Services 21,422 6.24
Apple Technology Hardware & Equipment 21,285 6.21
American Express Financial Services 20,174 5.88
Union Pacific Industrial Transportation 19,776 5.77
Berkshire Hathaway Non-life Insurance 18,089 5.27
Estée Lauder Personal Goods 16,930 4.94
Alphabet Software & Computer Services 15,886 4.63
Visa Financial Services 14,938 4.35
American Tower Real Estate Investment Trusts 14,412 4.20
Comcast Media 14,272 4.16
FedEx Industrial Transportation 13,876 4.04
MasterCard Financial Services 13,742 4.01
ICON Health Care Equipment & Services 13,216 3.85
Aptiv Automobiles & Parts 12,901 3.76
Intercontinental Exchange Financial Services 1 1,189 3.26
Xylem Industrial Engineering 1 1,167 3.26
Cognizant Technology Solutions Software & Computer Services 10,869 3.17
The Cooper Companies Health Care Equipment & Services 10,814 3.15
Booking Travel & Leisure 10,709 3.12
Netflix General Retailers 10,598 3.09
Amazon General Retailers 9,514 2.77
Activision Blizzard Software & Computer Services 8,372 2.44
Roper Technologies Electronic & Electrical Equipment 8,301 2.42
Electronic Arts Leisure Goods 8,211 2.39
CVS Health Food & Drug Retailers 6,852 2.00
Cognex Electronic & Electrical Equipment 5,541 1.62
343,056 100.00
15
The Bankers Investment Trust PLC Annual Report 2018
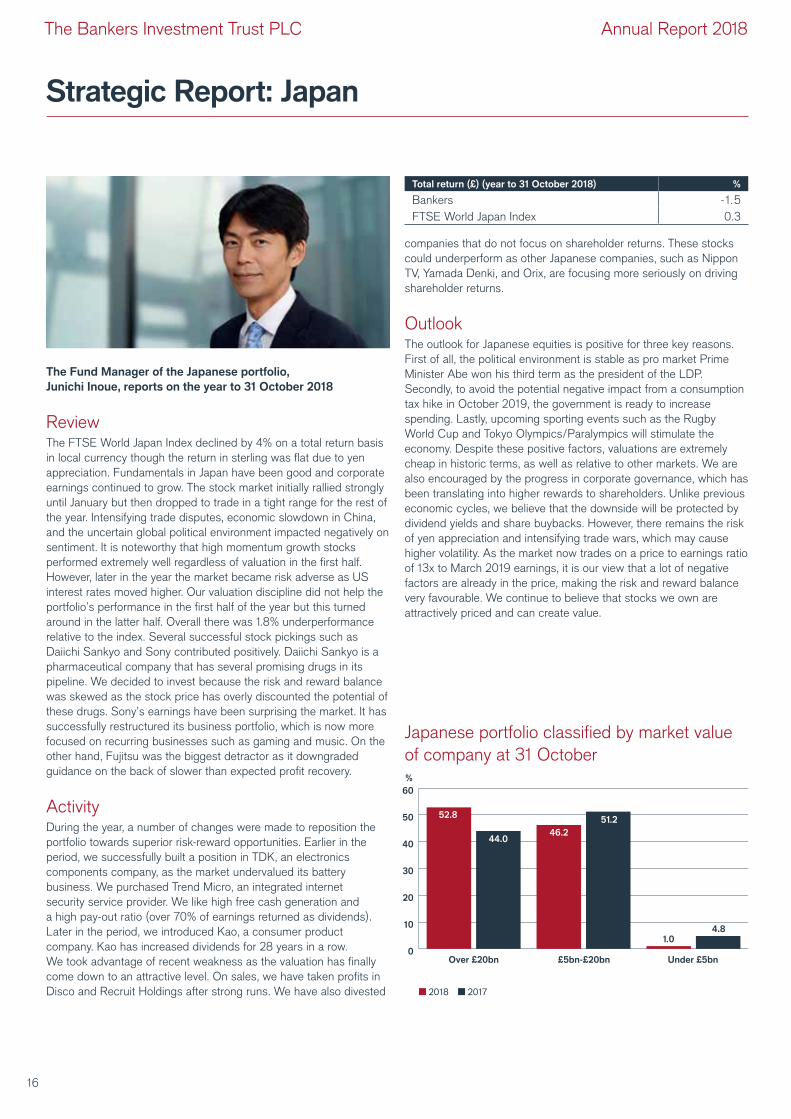
Strategic Report: Japan
companies that do not focus on shareholder returns. These stocks
could underperform as other Japanese companies, such as Nippon
TV, Yamada Denki, and Orix, are focusing more seriously on driving
shareholder returns.
Outlook The outlook for Japanese equities is positive for three key reasons.
First of all, the political environment is stable as pro market Prime
Minister Abe won his third term as the president of the LDP.
Secondly, to avoid the potential negative impact from a consumption
tax hike in October 2019, the government is ready to increase
spending. Lastly, upcoming sporting events such as the Rugby
World Cup and Tokyo Olympics/Paralympics will stimulate the
economy. Despite these positive factors, valuations are extremely
cheap in historic terms, as well as relative to other markets. We are
also encouraged by the progress in corporate governance, which has
been translating into higher rewards to shareholders. Unlike previous
economic cycles, we believe that the downside will be protected by
dividend yields and share buybacks. However, there remains the risk
of yen appreciation and intensifying trade wars, which may cause
higher volatility. As the market now trades on a price to earnings ratio
of 13x to March 2019 earnings, it is our view that a lot of negative
factors are already in the price, making the risk and reward balance
very favourable. We continue to believe that stocks we own are
attractively priced and can create value.
Total return (£) (year to 31 October 2018) %
Bankers -1.5
FTSE World Japan Index 0.3
The Fund Manager of the Japanese portfolio,
Junichi Inoue, reports on the year to 31 October 2018
ReviewThe FTSE World Japan Index declined by 4% on a total return basis
in local currency though the return in sterling was flat due to yen
appreciation. Fundamentals in Japan have been good and corporate
earnings continued to grow. The stock market initially rallied strongly
until January but then dropped to trade in a tight range for the rest of
the year. Intensifying trade disputes, economic slowdown in China,
and the uncertain global political environment impacted negatively on
sentiment. It is noteworthy that high momentum growth stocks
performed extremely well regardless of valuation in the first half.
However, later in the year the market became risk adverse as US
interest rates moved higher. Our valuation discipline did not help the
portfolio’s performance in the first half of the year but this turned
around in the latter half. Overall there was 1.8% underperformance
relative to the index. Several successful stock pickings such as
Daiichi Sankyo and Sony contributed positively. Daiichi Sankyo is a
pharmaceutical company that has several promising drugs in its
pipeline. We decided to invest because the risk and reward balance
was skewed as the stock price has overly discounted the potential of
these drugs. Sony’s earnings have been surprising the market. It has
successfully restructured its business portfolio, which is now more
focused on recurring businesses such as gaming and music. On the
other hand, Fujitsu was the biggest detractor as it downgraded
guidance on the back of slower than expected profit recovery.
Activity During the year, a number of changes were made to reposition the
portfolio towards superior risk-reward opportunities. Earlier in the
period, we successfully built a position in TDK, an electronics
components company, as the market undervalued its battery
business. We purchased Trend Micro, an integrated internet
security service provider. We like high free cash generation and
a high pay-out ratio (over 70% of earnings returned as dividends).
Later in the period, we introduced Kao, a consumer product
company. Kao has increased dividends for 28 years in a row.
We took advantage of recent weakness as the valuation has finally
come down to an attractive level. On sales, we have taken profits in
Disco and Recruit Holdings after strong runs. We have also divested
Japanese portfolio classified by market value
of company at 31 October
0
10
20
30
40
50
60
46.2
1.0
51.2
44.0
4.8
52.8
%
Over £20bn £5bn-£20bn Under £5bn
2018 2017
16
The Bankers Investment Trust PLC Annual Report 2018
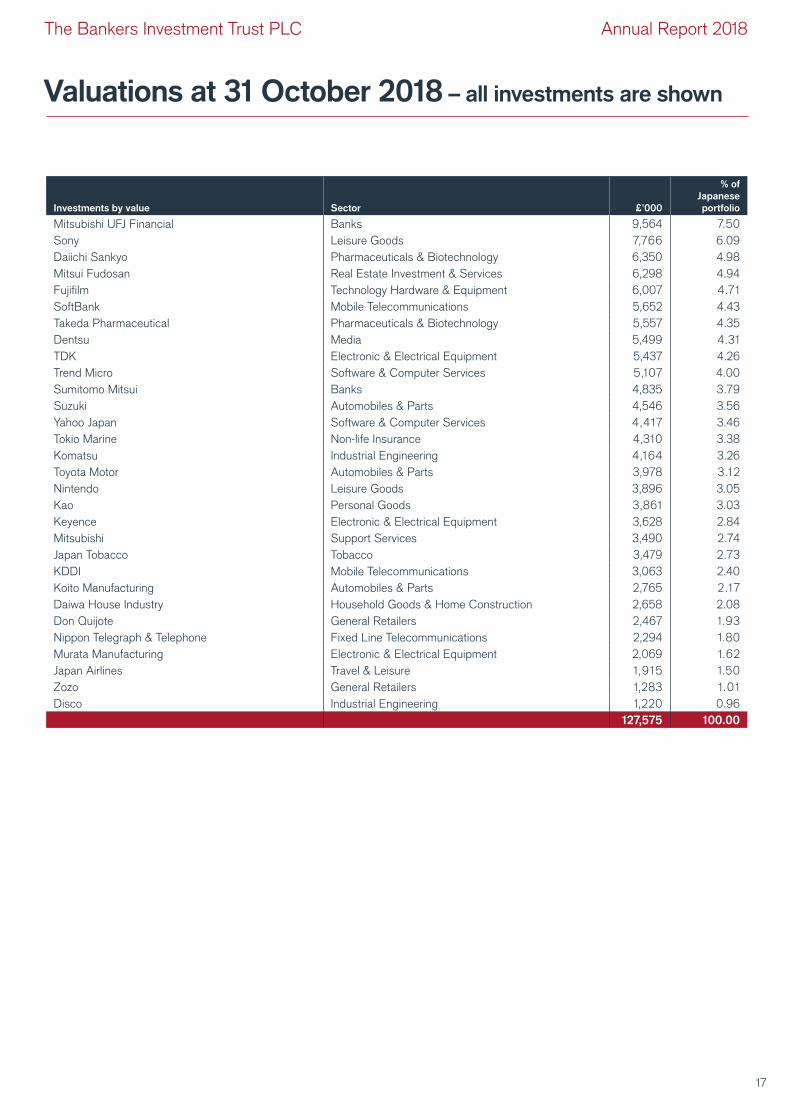
Valuations at 31 October 2018 – all investments are shown
Investments by value Sector £’000
% of
Japanese
portfolio
Mitsubishi UFJ Financial Banks 9,564 7.50
Sony Leisure Goods 7,766 6.09
Daiichi Sankyo Pharmaceuticals & Biotechnology 6,350 4.98
Mitsui Fudosan Real Estate Investment & Services 6,298 4.94
Fujifilm Technology Hardware & Equipment 6,007 4.71
SoftBank Mobile Telecommunications 5,652 4.43
Takeda Pharmaceutical Pharmaceuticals & Biotechnology 5,557 4.35
Dentsu Media 5,499 4.31
TDK Electronic & Electrical Equipment 5,437 4.26
Trend Micro Software & Computer Services 5,107 4.00
Sumitomo Mitsui Banks 4,835 3.79
Suzuki Automobiles & Parts 4,546 3.56
Yahoo Japan Software & Computer Services 4,417 3.46
Tokio Marine Non-life Insurance 4,310 3.38
Komatsu Industrial Engineering 4,164 3.26
Toyota Motor Automobiles & Parts 3,978 3.12
Nintendo Leisure Goods 3,896 3.05
Kao Personal Goods 3,861 3.03
Keyence Electronic & Electrical Equipment 3,628 2.84
Mitsubishi Support Services 3,490 2.74
Japan Tobacco Tobacco 3,479 2.73
KDDI Mobile Telecommunications 3,063 2.40
Koito Manufacturing Automobiles & Parts 2,765 2.17
Daiwa House Industry Household Goods & Home Construction 2,658 2.08
Don Quijote General Retailers 2,467 1.93
Nippon Telegraph & Telephone Fixed Line Telecommunications 2,294 1.80
Murata Manufacturing Electronic & Electrical Equipment 2,069 1.62
Japan Airlines Travel & Leisure 1,915 1.50
Zozo General Retailers 1,283 1.01
Disco Industrial Engineering 1,220 0.96
127,575 100.00
17
The Bankers Investment Trust PLC Annual Report 2018
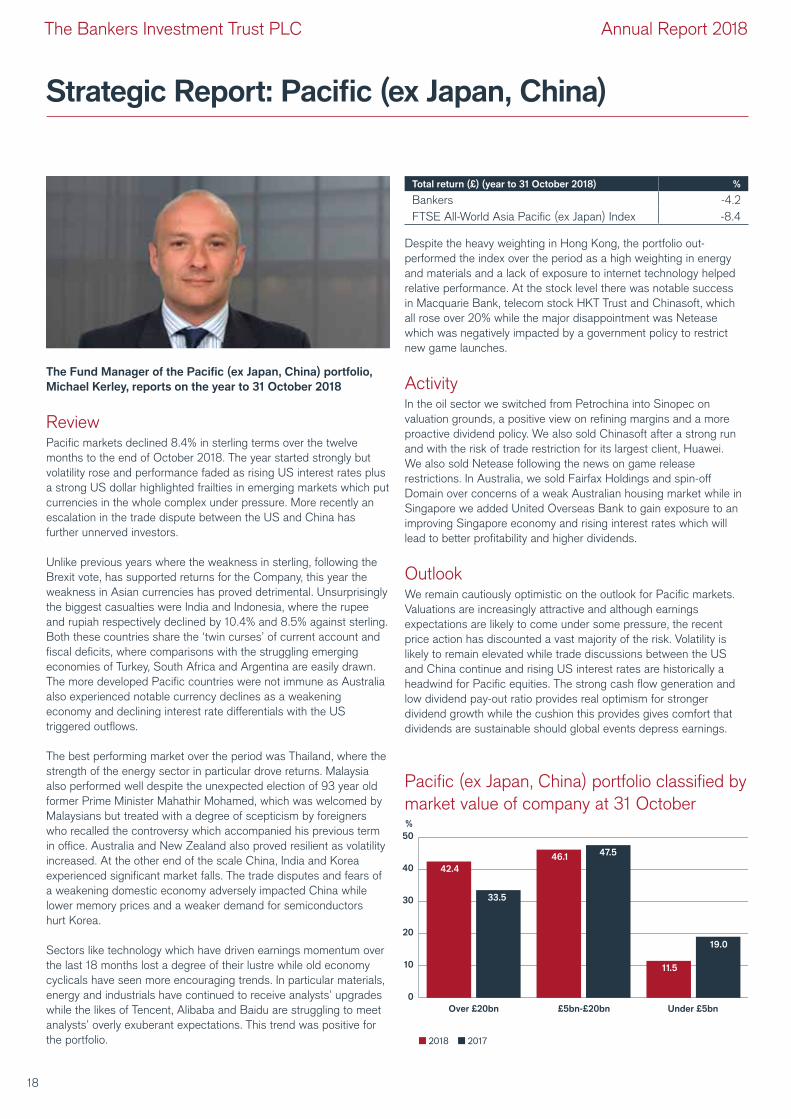
Strategic Report: Pacific (ex Japan, China)
Despite the heavy weighting in Hong Kong, the portfolio out-
performed the index over the period as a high weighting in energy
and materials and a lack of exposure to internet technology helped
relative performance. At the stock level there was notable success
in Macquarie Bank, telecom stock HKT Trust and Chinasoft, which
all rose over 20% while the major disappointment was Netease
which was negatively impacted by a government policy to restrict
new game launches.
ActivityIn the oil sector we switched from Petrochina into Sinopec on
valuation grounds, a positive view on refining margins and a more
proactive dividend policy. We also sold Chinasoft after a strong run
and with the risk of trade restriction for its largest client, Huawei.
We also sold Netease following the news on game release
restrictions. In Australia, we sold Fairfax Holdings and spin-off
Domain over concerns of a weak Australian housing market while in
Singapore we added United Overseas Bank to gain exposure to an
improving Singapore economy and rising interest rates which will
lead to better profitability and higher dividends.
OutlookWe remain cautiously optimistic on the outlook for Pacific markets.
Valuations are increasingly attractive and although earnings
expectations are likely to come under some pressure, the recent
price action has discounted a vast majority of the risk. Volatility is
likely to remain elevated while trade discussions between the US
and China continue and rising US interest rates are historically a
headwind for Pacific equities. The strong cash flow generation and
low dividend pay-out ratio provides real optimism for stronger
dividend growth while the cushion this provides gives comfort that
dividends are sustainable should global events depress earnings.
Total return (£) (year to 31 October 2018) %
Bankers -4.2
FTSE All-World Asia Pacific (ex Japan) Index -8.4
The Fund Manager of the Pacific (ex Japan, China) portfolio,
Michael Kerley, reports on the year to 31 October 2018
ReviewPacific markets declined 8.4% in sterling terms over the twelve
months to the end of October 2018. The year started strongly but
volatility rose and performance faded as rising US interest rates plus
a strong US dollar highlighted frailties in emerging markets which put
currencies in the whole complex under pressure. More recently an
escalation in the trade dispute between the US and China has
further unnerved investors.
Unlike previous years where the weakness in sterling, following the
Brexit vote, has supported returns for the Company, this year the
weakness in Asian currencies has proved detrimental. Unsurprisingly
the biggest casualties were India and Indonesia, where the rupee
and rupiah respectively declined by 10.4% and 8.5% against sterling.
Both these countries share the ‘twin curses’ of current account and
fiscal deficits, where comparisons with the struggling emerging
economies of Turkey, South Africa and Argentina are easily drawn.
The more developed Pacific countries were not immune as Australia
also experienced notable currency declines as a weakening
economy and declining interest rate differentials with the US
triggered outflows.
The best performing market over the period was Thailand, where the
strength of the energy sector in particular drove returns. Malaysia
also performed well despite the unexpected election of 93 year old
former Prime Minister Mahathir Mohamed, which was welcomed by
Malaysians but treated with a degree of scepticism by foreigners
who recalled the controversy which accompanied his previous term
in office. Australia and New Zealand also proved resilient as volatility
increased. At the other end of the scale China, India and Korea
experienced significant market falls. The trade disputes and fears of
a weakening domestic economy adversely impacted China while
lower memory prices and a weaker demand for semiconductors
hurt Korea.
Sectors like technology which have driven earnings momentum over
the last 18 months lost a degree of their lustre while old economy
cyclicals have seen more encouraging trends. In particular materials,
energy and industrials have continued to receive analysts’ upgrades
while the likes of Tencent, Alibaba and Baidu are struggling to meet
analysts’ overly exuberant expectations. This trend was positive for
the portfolio.
Pacific (ex Japan, China) portfolio classified by
market value of company at 31 October
0
10
20
30
40
50
46.1
19.0
11.5
42.4
47.5
33.5
%
Over £20bn £5bn-£20bn Under £5bn
2018 2017
18
The Bankers Investment Trust PLC Annual Report 2018
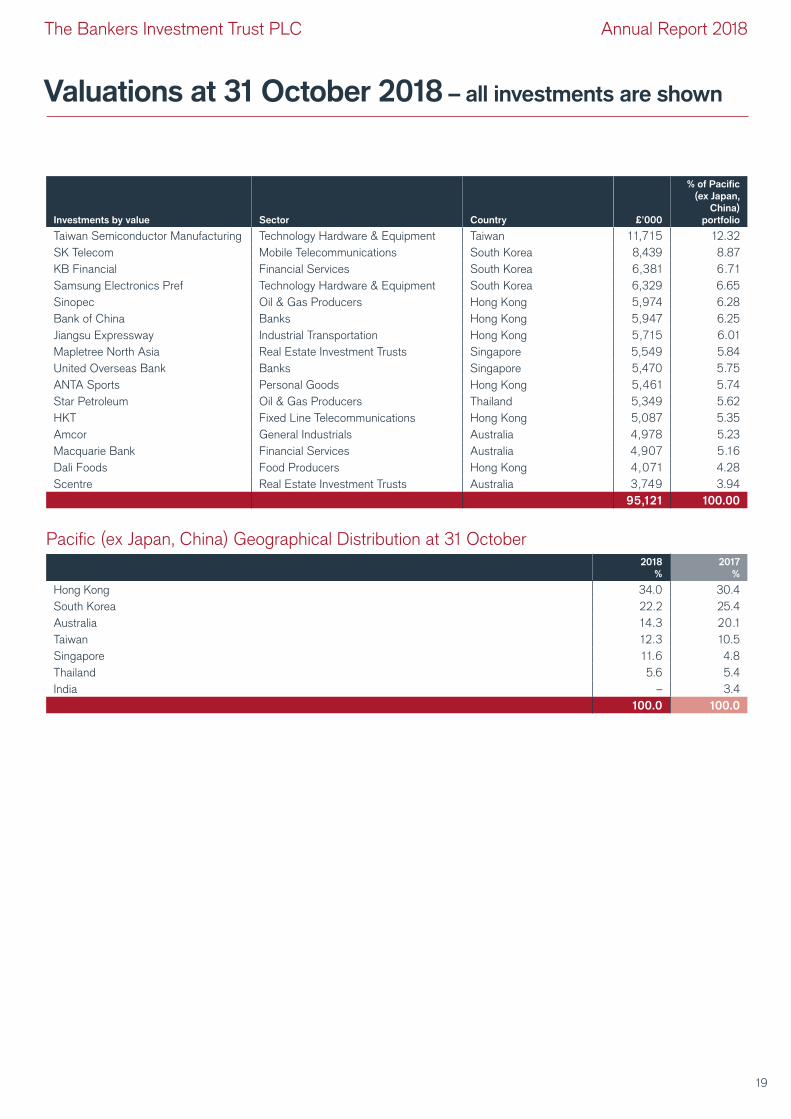
Valuations at 31 October 2018 – all investments are shown
Investments by value Sector Country £’000
% of Pacific
(ex Japan,
China)
portfolio
Taiwan Semiconductor Manufacturing Technology Hardware & Equipment Taiwan 11,715 12.32
SK Telecom Mobile Telecommunications South Korea 8,439 8.87
KB Financial Financial Services South Korea 6,381 6.71
Samsung Electronics Pref Technology Hardware & Equipment South Korea 6,329 6.65
Sinopec Oil & Gas Producers Hong Kong 5,974 6.28
Bank of China Banks Hong Kong 5,947 6.25
Jiangsu Expressway Industrial Transportation Hong Kong 5,715 6.01
Mapletree North Asia Real Estate Investment Trusts Singapore 5,549 5.84
United Overseas Bank Banks Singapore 5,470 5.75
ANTA Sports Personal Goods Hong Kong 5,461 5.74
Star Petroleum Oil & Gas Producers Thailand 5,349 5.62
HKT Fixed Line Telecommunications Hong Kong 5,087 5.35
Amcor General Industrials Australia 4,978 5.23
Macquarie Bank Financial Services Australia 4,907 5.16
Dali Foods Food Producers Hong Kong 4,071 4.28
Scentre Real Estate Investment Trusts Australia 3,749 3.94
95,121 100.00
Pacific (ex Japan, China) Geographical Distribution at 31 October2018
%
2017
%
Hong Kong 34.0 30.4
South Korea 22.2 25.4
Australia 14.3 20.1
Taiwan 12.3 10.5
Singapore 11.6 4.8
Thailand 5.6 5.4
India – 3.4
100.0 100.0
19
The Bankers Investment Trust PLC Annual Report 2018
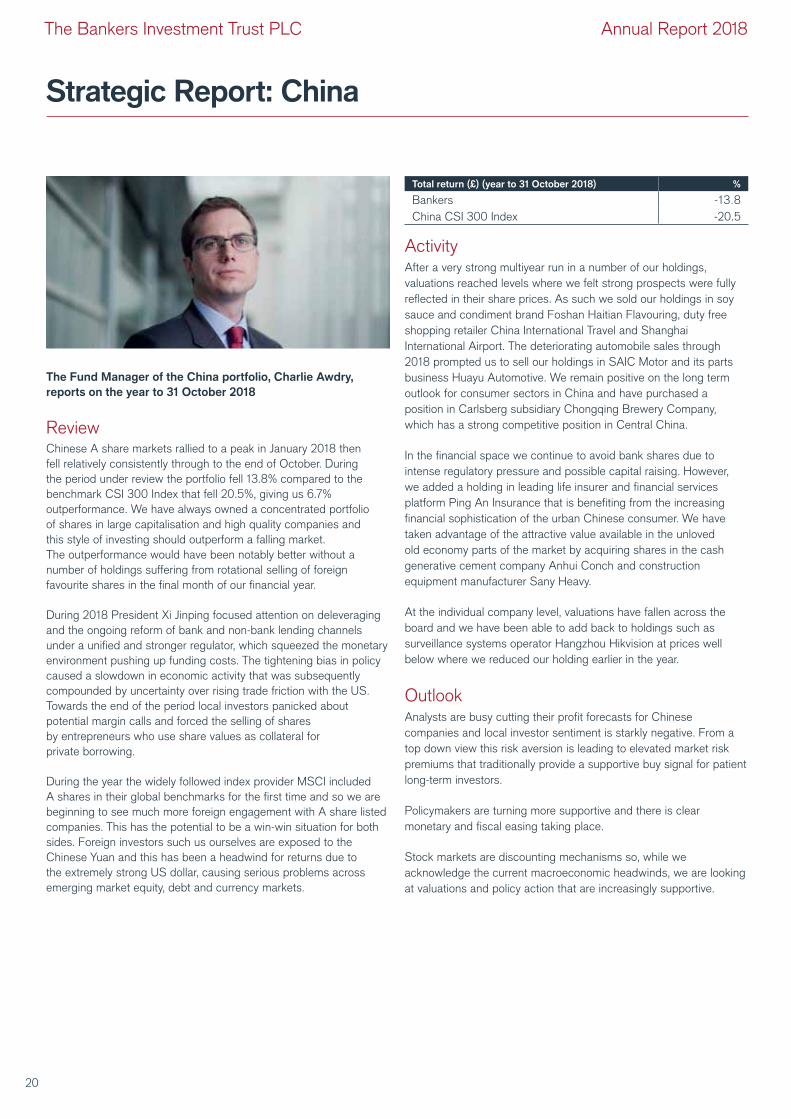
Strategic Report: China
ActivityAfter a very strong multiyear run in a number of our holdings,
valuations reached levels where we felt strong prospects were fully
reflected in their share prices. As such we sold our holdings in soy
sauce and condiment brand Foshan Haitian Flavouring, duty free
shopping retailer China International Travel and Shanghai
International Airport. The deteriorating automobile sales through
2018 prompted us to sell our holdings in SAIC Motor and its parts
business Huayu Automotive. We remain positive on the long term
outlook for consumer sectors in China and have purchased a
position in Carlsberg subsidiary Chongqing Brewery Company,
which has a strong competitive position in Central China.
In the financial space we continue to avoid bank shares due to
intense regulatory pressure and possible capital raising. However,
we added a holding in leading life insurer and financial services
platform Ping An Insurance that is benefiting from the increasing
financial sophistication of the urban Chinese consumer. We have
taken advantage of the attractive value available in the unloved
old economy parts of the market by acquiring shares in the cash
generative cement company Anhui Conch and construction
equipment manufacturer Sany Heavy.
At the individual company level, valuations have fallen across the
board and we have been able to add back to holdings such as
surveillance systems operator Hangzhou Hikvision at prices well
below where we reduced our holding earlier in the year.
OutlookAnalysts are busy cutting their profit forecasts for Chinese
companies and local investor sentiment is starkly negative. From a
top down view this risk aversion is leading to elevated market risk
premiums that traditionally provide a supportive buy signal for patient
long-term investors.
Policymakers are turning more supportive and there is clear
monetary and fiscal easing taking place.
Stock markets are discounting mechanisms so, while we
acknowledge the current macroeconomic headwinds, we are looking
at valuations and policy action that are increasingly supportive.
Total return (£) (year to 31 October 2018) %
Bankers -13.8
China CSI 300 Index -20.5
The Fund Manager of the China portfolio, Charlie Awdry,
reports on the year to 31 October 2018
ReviewChinese A share markets rallied to a peak in January 2018 then
fell relatively consistently through to the end of October. During
the period under review the portfolio fell 13.8% compared to the
benchmark CSI 300 Index that fell 20.5%, giving us 6.7%
outperformance. We have always owned a concentrated portfolio
of shares in large capitalisation and high quality companies and
this style of investing should outperform a falling market.
The outperformance would have been notably better without a
number of holdings suffering from rotational selling of foreign
favourite shares in the final month of our financial year.
During 2018 President Xi Jinping focused attention on deleveraging
and the ongoing reform of bank and non-bank lending channels
under a unified and stronger regulator, which squeezed the monetary
environment pushing up funding costs. The tightening bias in policy
caused a slowdown in economic activity that was subsequently
compounded by uncertainty over rising trade friction with the US.
Towards the end of the period local investors panicked about
potential margin calls and forced the selling of shares
by entrepreneurs who use share values as collateral for
private borrowing.
During the year the widely followed index provider MSCI included
A shares in their global benchmarks for the first time and so we are
beginning to see much more foreign engagement with A share listed
companies. This has the potential to be a win-win situation for both
sides. Foreign investors such us ourselves are exposed to the
Chinese Yuan and this has been a headwind for returns due to
the extremely strong US dollar, causing serious problems across
emerging market equity, debt and currency markets.
20
The Bankers Investment Trust PLC Annual Report 2018
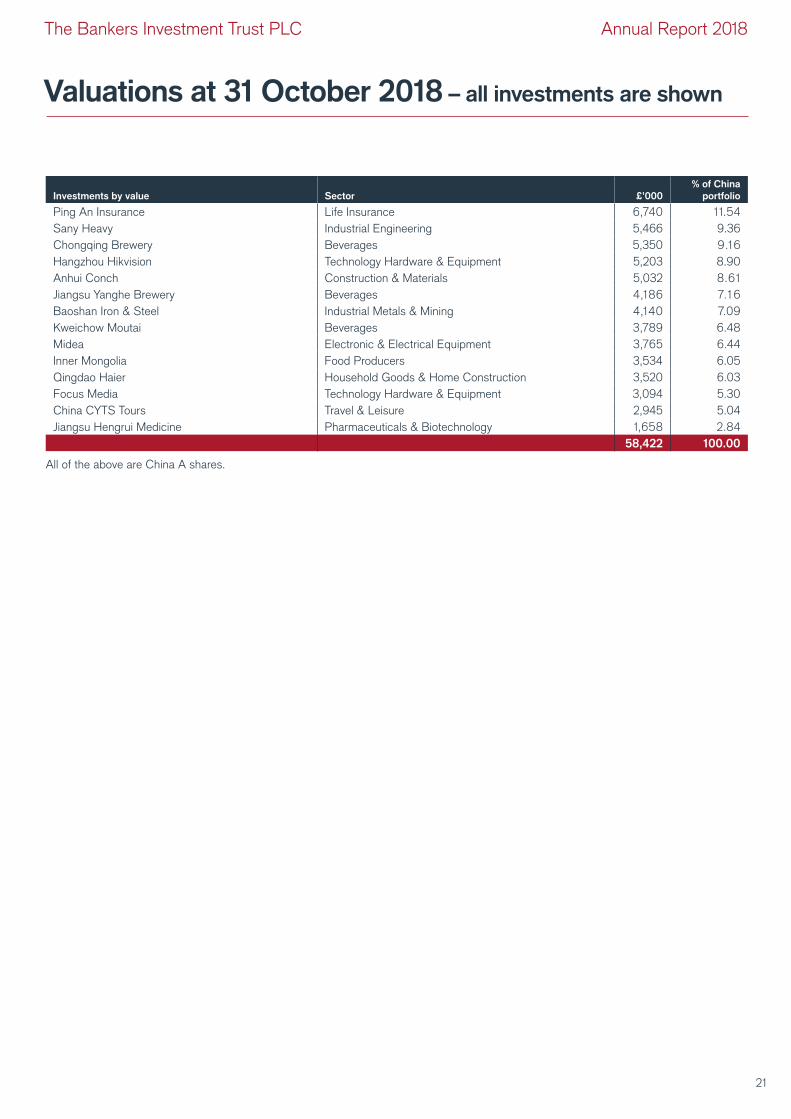
Investments by value Sector £’000
% of China
portfolio
Ping An Insurance Life Insurance 6,740 11.54
Sany Heavy Industrial Engineering 5,466 9.36
Chongqing Brewery Beverages 5,350 9.16
Hangzhou Hikvision Technology Hardware & Equipment 5,203 8.90
Anhui Conch Construction & Materials 5,032 8.61
Jiangsu Yanghe Brewery Beverages 4,186 7.16
Baoshan Iron & Steel Industrial Metals & Mining 4,140 7.09
Kweichow Moutai Beverages 3,789 6.48
Midea Electronic & Electrical Equipment 3,765 6.44
Inner Mongolia Food Producers 3,534 6.05
Qingdao Haier Household Goods & Home Construction 3,520 6.03
Focus Media Technology Hardware & Equipment 3,094 5.30
China CYTS Tours Travel & Leisure 2,945 5.04
Jiangsu Hengrui Medicine Pharmaceuticals & Biotechnology 1,658 2.84
58,422 100.00
All of the above are China A shares.
Valuations at 31 October 2018 – all investments are shown
21
The Bankers Investment Trust PLC Annual Report 2018
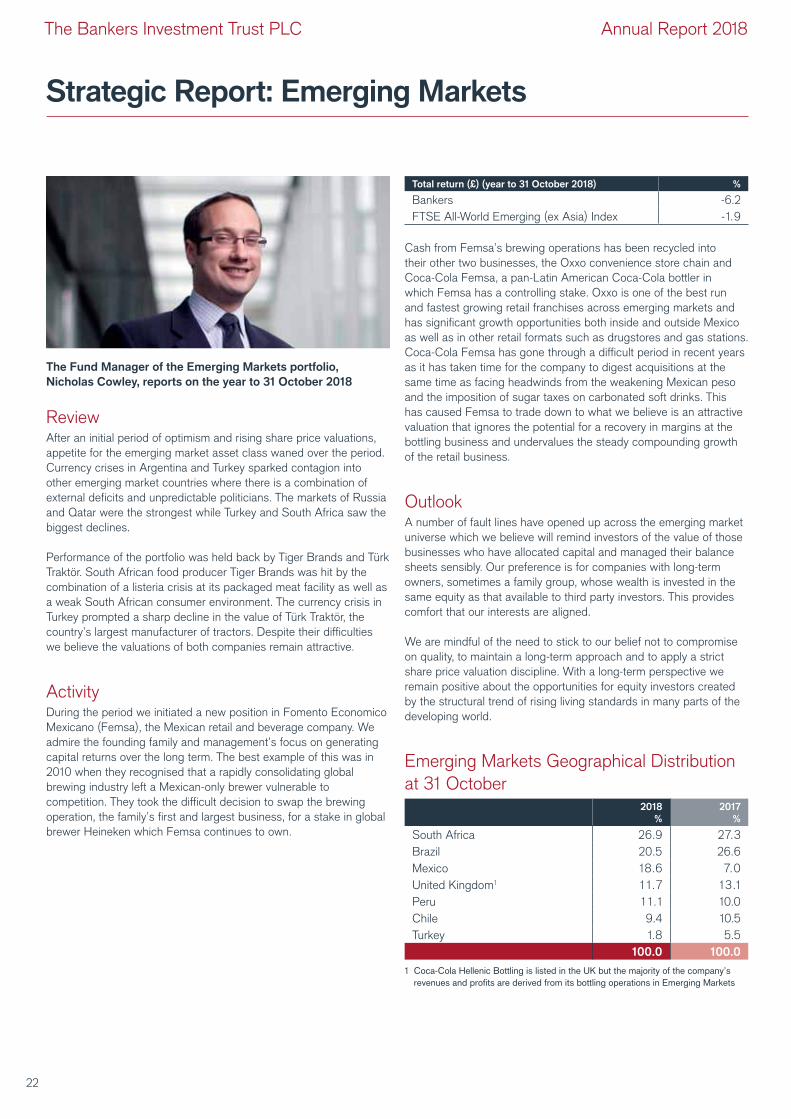
Strategic Report: Emerging Markets
Cash from Femsa’s brewing operations has been recycled into
their other two businesses, the Oxxo convenience store chain and
Coca-Cola Femsa, a pan-Latin American Coca-Cola bottler in
which Femsa has a controlling stake. Oxxo is one of the best run
and fastest growing retail franchises across emerging markets and
has significant growth opportunities both inside and outside Mexico
as well as in other retail formats such as drugstores and gas stations.
Coca-Cola Femsa has gone through a difficult period in recent years
as it has taken time for the company to digest acquisitions at the
same time as facing headwinds from the weakening Mexican peso
and the imposition of sugar taxes on carbonated soft drinks. This
has caused Femsa to trade down to what we believe is an attractive
valuation that ignores the potential for a recovery in margins at the
bottling business and undervalues the steady compounding growth
of the retail business.
OutlookA number of fault lines have opened up across the emerging market
universe which we believe will remind investors of the value of those
businesses who have allocated capital and managed their balance
sheets sensibly. Our preference is for companies with long-term
owners, sometimes a family group, whose wealth is invested in the
same equity as that available to third party investors. This provides
comfort that our interests are aligned.
We are mindful of the need to stick to our belief not to compromise
on quality, to maintain a long-term approach and to apply a strict
share price valuation discipline. With a long-term perspective we
remain positive about the opportunities for equity investors created
by the structural trend of rising living standards in many parts of the
developing world.
Total return (£) (year to 31 October 2018) %
Bankers -6.2
FTSE All-World Emerging (ex Asia) Index -1.9
The Fund Manager of the Emerging Markets portfolio,
Nicholas Cowley, reports on the year to 31 October 2018
ReviewAfter an initial period of optimism and rising share price valuations,
appetite for the emerging market asset class waned over the period.
Currency crises in Argentina and Turkey sparked contagion into
other emerging market countries where there is a combination of
external deficits and unpredictable politicians. The markets of Russia
and Qatar were the strongest while Turkey and South Africa saw the
biggest declines.
Performance of the portfolio was held back by Tiger Brands and Türk
Traktör. South African food producer Tiger Brands was hit by the
combination of a listeria crisis at its packaged meat facility as well as
a weak South African consumer environment. The currency crisis in
Turkey prompted a sharp decline in the value of Türk Traktör, the
country’s largest manufacturer of tractors. Despite their difficulties
we believe the valuations of both companies remain attractive.
ActivityDuring the period we initiated a new position in Fomento Economico
Mexicano (Femsa), the Mexican retail and beverage company. We
admire the founding family and management’s focus on generating
capital returns over the long term. The best example of this was in
2010 when they recognised that a rapidly consolidating global
brewing industry left a Mexican-only brewer vulnerable to
competition. They took the difficult decision to swap the brewing
operation, the family’s first and largest business, for a stake in global
brewer Heineken which Femsa continues to own.
Emerging Markets Geographical Distribution
at 31 October2018
%
2017
%
South Africa 26.9 27.3
Brazil 20.5 26.6
Mexico 18.6 7.0
United Kingdom1 1 1.7 13.1
Peru 1 1.1 10.0
Chile 9.4 10.5
Turkey 1.8 5.5
100.0 100.0
1 Coca-Cola Hellenic Bottling is listed in the UK but the majority of the company’s
revenues and profits are derived from its bottling operations in Emerging Markets
22
The Bankers Investment Trust PLC Annual Report 2018
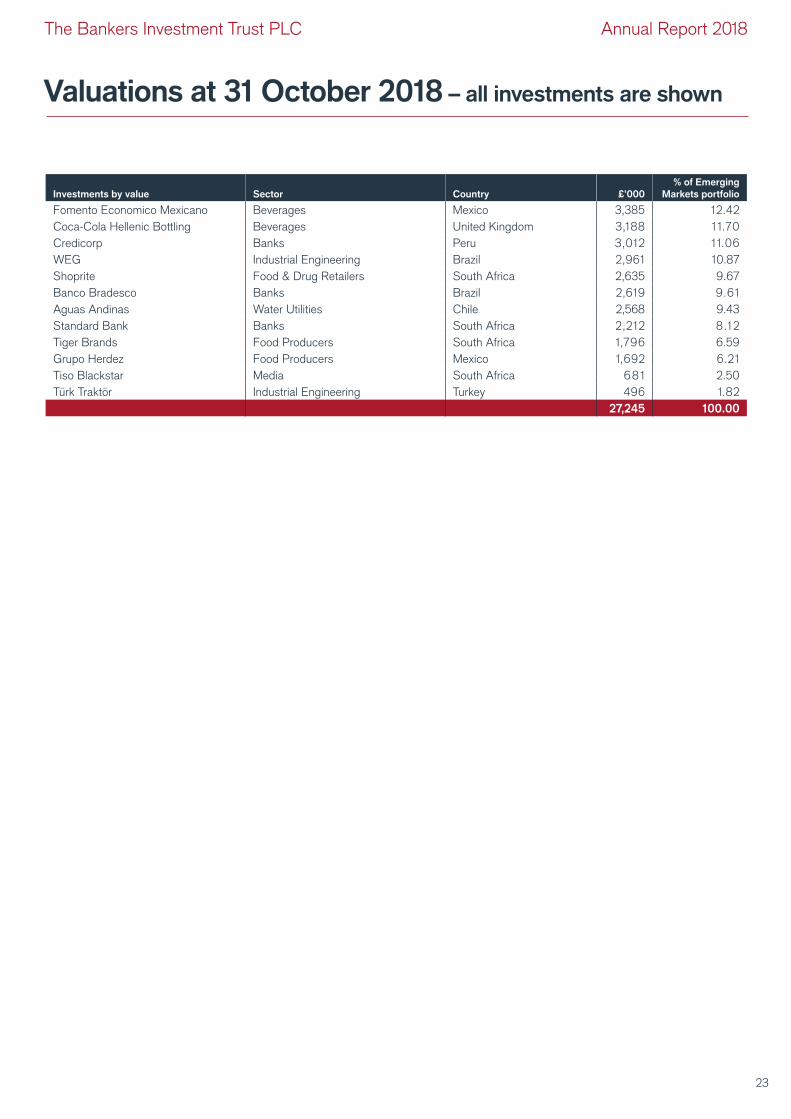
Investments by value Sector Country £’000
% of Emerging
Markets portfolio
Fomento Economico Mexicano Beverages Mexico 3,385 12.42
Coca-Cola Hellenic Bottling Beverages United Kingdom 3,188 11.70
Credicorp Banks Peru 3,012 11.06
WEG Industrial Engineering Brazil 2,961 10.87
Shoprite Food & Drug Retailers South Africa 2,635 9.67
Banco Bradesco Banks Brazil 2,619 9.61
Aguas Andinas Water Utilities Chile 2,568 9.43
Standard Bank Banks South Africa 2,212 8.12
Tiger Brands Food Producers South Africa 1,796 6.59
Grupo Herdez Food Producers Mexico 1,692 6.21
Tiso Blackstar Media South Africa 681 2.50
Türk Traktör Industrial Engineering Turkey 496 1.82
27,245 100.00
Valuations at 31 October 2018 – all investments are shown
23
The Bankers Investment Trust PLC Annual Report 2018
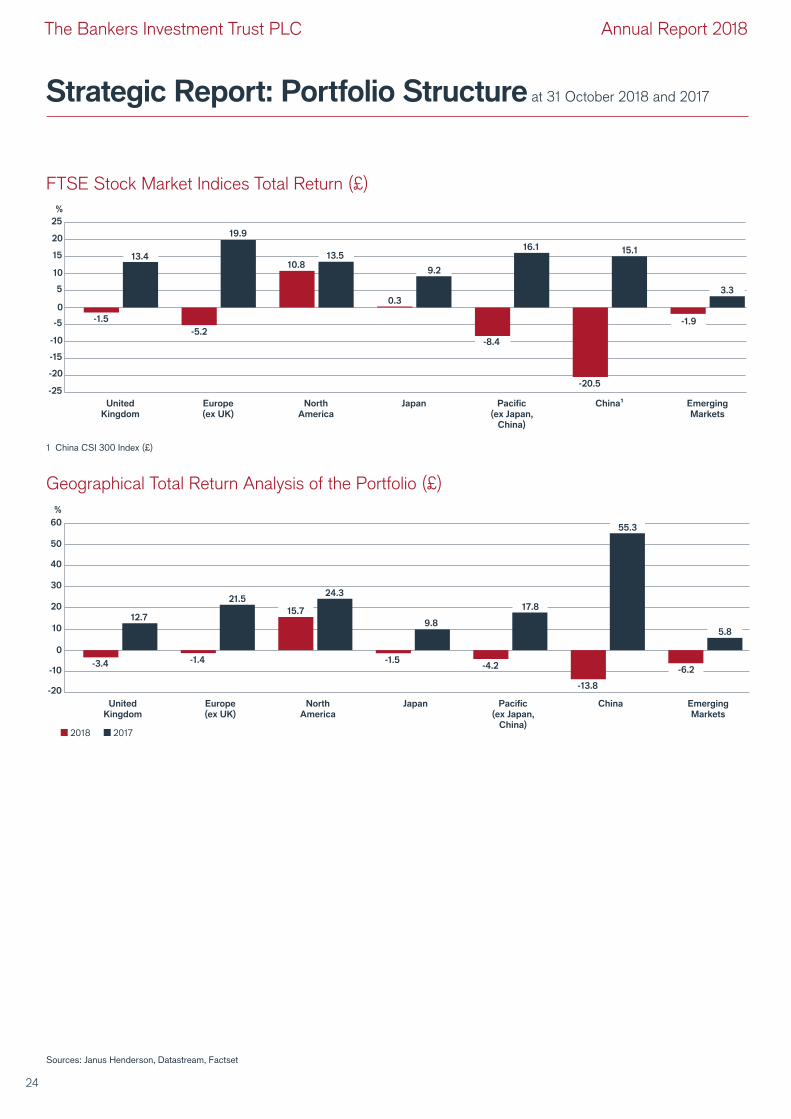
Strategic Report: Portfolio Structure at 31 October 2018 and 2017
Sources: Janus Henderson, Datastream, Factset
FTSE Stock Market Indices Total Return (£)
-25
-20
-15
-10
-5
0
5
10
15
20
25
%
United
Kingdom
Europe
(ex UK)
North
America
Japan China¹Pacific
(ex Japan,
China)
Emerging
Markets
13.4
19.9
13.5
9.2
16.1 15.1
3.3
-1.5
-5.2
10.8
0.3
-8.4
-20.5
-1.9
1 China CSI 300 Index (£)
Geographical Total Return Analysis of the Portfolio (£)
-20
-10
0
10
20
30
40
50
60
%
United
Kingdom
Europe
(ex UK)
North
America
Japan ChinaPacific
(ex Japan,
China)
Emerging
Markets
-6.2
-13.8
-4.2-1.5
15.7
-1.4-3.4
5.8
55.3
17.8
9.8
24.321.5
12.7
2018 2017
24
The Bankers Investment Trust PLC Annual Report 2018
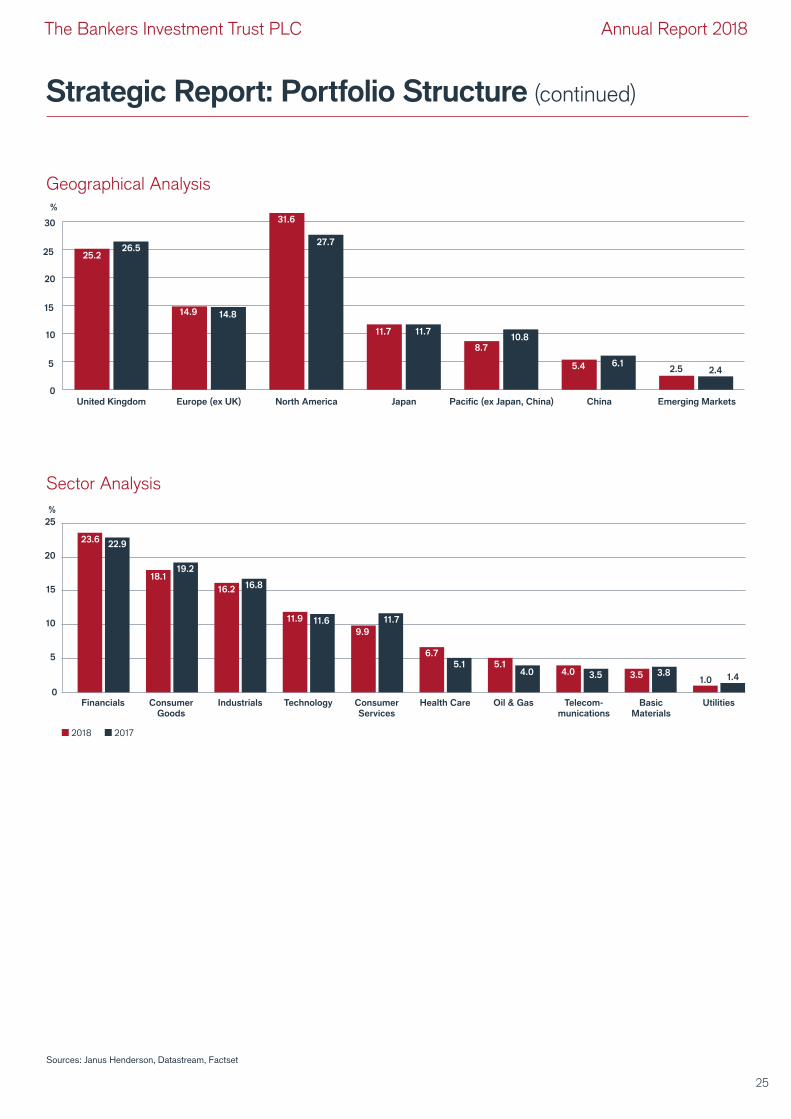
Strategic Report: Portfolio Structure (continued)
Geographical Analysis
Sector Analysis
0
5
10
15
20
25
30
United Kingdom Europe (ex UK) North America Japan Pacific (ex Japan, China) Emerging MarketsChina
%
26.527.7
11.7
6.12.4
14.8
10.8
2.5
25.2
8.7
14.9
31.6
11.7
5.4
0
5
10
15
20
25
%
22.9
19.2
16.8
11.6
4.05.1
3.5 3.81.4
11.7
23.6
18.1
16.2
11.9
5.1
6.7
4.0 3.51.0
9.9
Financials IndustrialsConsumer
Goods
Technology Consumer
Services
Oil & GasHealth Care Telecom-
munications
Basic
Materials
Utilities
2018 2017
Sources: Janus Henderson, Datastream, Factset
25
The Bankers Investment Trust PLC Annual Report 2018
Strategic Report: Corporate Information
DirectorsThe Directors appointed to the Board at the date of this report are:
Richard KillingbeckPosition: Chairman of the Board and of the Nominations,
Management Engagement and Insider Committees
Date of appointment: 19 December 2003
(Chairman 25 September 2013)
Richard was Chief Executive Officer of W.H. Ireland Group plc and
prior to that he was Managing Director of Credit Suisse (UK) Private
Bank. He has been involved in the financial services industry for
30 years, initially as a fund manager and latterly in a number of senior
management roles, at Singer & Friedlander Investment Management
and Close Brothers. During his career he has been based primarily in
London but has also spent part of this time in New York.
Susan (Sue) InglisPosition: Senior Independent Director (‘SID’)
Date of appointment: 1 November 2012 (SID since February 2015)
Sue has a wealth of experience from more than 30 years advising
investment companies and financial institutions. Before embarking
on a non-executive career her executive roles included Managing
Director – Corporate Finance in the Investment Companies teams at
Cantor Fitzgerald Europe (2012-2018) and Canaccord Genuity
(2009-2012). Sue is a qualified lawyer, and was a partner, and head
of the funds and financial services group, at Shepherd & Wedderburn,
a leading Scottish law firm. In 1999 she was a founding partner of
Intelli Corporate Finance, an advisory boutique firm focusing on the
asset management and investment company sectors which was
acquired by Canaccord Genuity in 2009. She is currently a non-
executive director of Baillie Gifford US Growth Trust PLC, BMO
Managed Portfolio Trust PLC and The European Investment Trust plc.
Julian ChillingworthPosition: Director
Date of appointment: 25 February 2015
Julian is currently Chief Investment Officer for Rathbone Brothers plc.
He was formerly Head of Gross Funds which incorporated Pension
Funds and Charities at Investec and was Head of Equities at
Hambros.
Isobel Sharp, CBEPosition: Director
Date of appointment: 1 November 2017 (Audit Committee Chairman
21 February 2018)
Isobel is currently a non-executive director, and Audit Committee Chair,
at IMI plc and Winton Group Ltd and was formerly on the board, and
Remco Chair, at the UK Green Investment Bank plc. She is also a
member of the Edinburgh University’s Business School International
Advisory Board and, as an Honorary Professor there, lectures on
corporate governance and auditing matters. Isobel has extensive
accounting, auditing and corporate governance experience. Most
recently she was with Deloitte LLP as the firm’s Senior Technical
Partner until 2012. She has served as President of The Institute of
Chartered Accountants of Scotland and on the UK Accounting
Standards Board and the Financial Reporting Review Panel, and
was awarded the CBE in 2009.
Richard HuntingfordPosition: Director
Date of appointment: 26 September 2018
Richard has been involved in the media and marketing sector for more
than 30 years and has held a number of executive and non-executive
roles in listed and private businesses. These include: CEO of Chrysalis
plc, founder of Heart FM; Chairman of Virgin Radio; Chairman of
Wireless Group plc (formerly UTV Media plc) and Creston plc; and
non-executive director of Virgin Mobile plc. He is currently Chairman of
Future plc and Crown Place VCT plc and non-executive director of
JPMorgan Mid Cap Investment Trust plc.
All Directors are independent of Janus Henderson and are members of the Audit Committee (except the Chairman), Management
Engagement Committee and Insider Committee. The Chairman, Susan Inglis, Julian Chillingworth and Isobel Sharp are members of the
Nominations Committee.
26
The Bankers Investment Trust PLC Annual Report 2018
Strategic Report: Corporate Information (continued)
Registered Office201 Bishopsgate
London EC2M 3AE
Service Providers
Alternative Investment Fund ManagerHenderson Investment Funds Limited
201 Bishopsgate
London EC2M 3AE
Corporate SecretaryHenderson Secretarial Services Limited
201 Bishopsgate
London EC2M 3AE
Telephone: 020 7818 1818
Depositary and CustodianBNP Paribas Securities Services
10 Harewood Avenue
London NW1 6AA
Stockbrokers
UKJP Morgan Cazenove
25 Bank Street
Canary Wharf, London E14 5JP
New ZealandFirst NZ Capital Securities
Level 20
ANZ Centre
23-29 Albert Street
PO Box 5333
Auckland, New Zealand
Registrar
UKEquiniti Limited
Aspect House
Spencer Road
Lancing, West Sussex BN99 6DA
Telephone: 0371 384 2471 (or +44 121 415 7049 if calling from
overseas). Lines are open 8.30 am to 5.30 pm, UK time Monday to
Friday excluding public holidays in England and Wales.
New ZealandComputershare Investor Services Limited
Private Bag 92119
Victoria Street West
Auckland 1142, New Zealand
Telephone: (New Zealand) (64) 09 488 8777
Independent AuditorErnst & Young LLP
25 Churchill Place
London E14 5EY
Financial CalendarAnnual results announced January 2019
Ex dividend date 24 January 2019
Dividend record date 25 January 2019
Annual General Meeting1 27 February 2019
Final dividend payable on 28 February 2019
1st interim dividend payable on 30 May 2019
Half year results announced July 2019
2nd interim dividend payable on 30 August 2019
3rd interim dividend payable on 29 November 2019
1 At Trinity House, London EC3N 4DH at 12 noon
Information SourcesFor more information about The Bankers Investment Trust PLC, visit
the website at www.bankersinvestmenttrust.com.
HGiHGi is a content platform provided by Janus Henderson that offers
online personalisation where you can ‘follow’ investment experts,
topics and the trusts that are of interest to you. By creating your HGi
profile you will be updated regularly on the topics that interest you
most, bringing you closer to Janus Henderson’s investment expertise.
Scan the QR code or use this short URL
to register for HGi: http://HGi.co/rb
Follow Janus Henderson Investment Trusts
on Twitter, YouTube and FacebookFor alternative access to Janus Henderson’s insight you can now
follow on Twitter, YouTube and Facebook
InvestingShares can be purchased in the market via a stockbroker or
through share dealing platforms. They can also be held through
share plans, ISAs or pensions and links to various providers are
included on the website. Individuals holding shares through
Halifax Share Dealing Limited can write to them at Lovell Park Road,
Leeds LS1 1NS or contact them via telephone: 03457 22 55 25,
email: [email protected] or visit their website:
www.halifax.co.uk/sharedealing.
Potential investors are reminded that the value of investments and the
income from them may go down as well as up and investors may not
receive back the full amount invested. Tax benefits may vary as a result of
statutory changes and their value will depend on individual circumstances.
Nominee Share CodeWhere notification has been provided in advance, the Company will
arrange for copies of shareholder communications to be provided to the
operators of nominee accounts. Nominee investors may attend general
meetings and speak at them when invited to do so by the Chairman.
27
The Bankers Investment Trust PLC Annual Report 2018
Strategic Report: Corporate Information (continued)
StatusThe Company is registered as a public limited company and is an investment company as defined under Section 833 of the Companies
Act 2006 (the ‘Companies Act’). It has been approved as an investment trust under Sections 1158/1159 of the Corporation Tax Act 2010
(‘Section 1158’), as amended, and is a member of the Association of Investment Companies (‘AIC’).
The Directors are of the opinion that the Company continues to conduct its affairs as an Approved Investment Trust under the Investment
Trust (Approved Company) (Tax) Regulations 2011. The Company maintains a premium main market listing on the London Stock Exchange
and is subject to the Listing, Prospectus and Disclosure Guidance and Transparency Rules published by the UK Listing Authority. The
Company is governed by its Articles of Association, amendments to which must be approved by shareholders by way of a special resolution.
Principal Risks and UncertaintiesThe Board, with the assistance of Janus Henderson, has carried out a robust assessment of the principal risks facing the Company, including
those that would threaten its business model, future performance, solvency or liquidity. In carrying out this assessment, the Board has
considered the market uncertainty arising from the UK’s negotiations to leave the European Union. The Board has drawn up a matrix of risks
facing the Company and has put in place a schedule of investment limits and restrictions, appropriate to the Company’s investment objectives
and policy, in order to mitigate these risks as far as practicable. The principal risks which have been identified, and the steps taken by the Board
to mitigate these as far as practicable, and whether the Board considers the impact of such risks has changed over the past year, are as follows:
Risk Controls and mitigation
Investment Activity and Performance Risks
An inappropriate investment strategy (for example, in terms of asset allocation or the level of gearing) may result in underperformance against the Company’s various indices and the companies in its peer group.
The Board monitors investment performance at each Board meeting and regularly reviews the extent of the Company’s borrowings.
Portfolio and Market Risks
Although the Company invests almost entirely in securities that are listed on recognised markets, share prices may move rapidly. The companies in which investments are made may operate unsuccessfully, or fail entirely. Macro matters (such as trade wars, the conclusion of the UK’s negotiations to leave the European Union and the global economic outlook) are expected to lead to continued volatility in the markets. This is likely to impact share prices of investments in the portfolio, to the extent not already factored into current prices. A fall in the market value of the Company’s portfolio would have an adverse effect on shareholders’ funds.
The Fund Manager seeks to maintain a diversified portfolio to mitigate against this risk. The Board regularly reviews the portfolio, investment activity and performance.
Tax, Legal and Regulatory Risks
A breach of Section 1158 could lead to a loss of investment trust status, resulting in capital gains realised within the portfolio being subject to corporation tax. A breach of the UK Listing Authority’s Rules could result in suspension of the Company’s shares, while a breach of the Companies Act could lead to criminal proceedings. All breaches could result in financial or reputational damage. The Company must also ensure compliance with the Listing Rules of the New Zealand Stock Exchange.
Janus Henderson has been contracted to provide investment, company secretarial, administration and accounting services through qualified professionals. The Board receives internal control reports produced by Janus Henderson on a quarterly basis, which confirm tax, legal and regulatory compliance both in the UK and New Zealand.
Financial Risks
By its nature as an investment trust, the Company’s business activities are exposed to market risk (including market price risk, currency risk and interest rate risk), liquidity risk and credit and counterparty risk.
The Company has a diversified portfolio which comprises mainly investments in large and medium-sized companies and mitigates the Company’s exposure to liquidity risk. The Company minimises the risk of a counterparty failing to deliver securities or cash by dealing through organisations that have undergone rigorous due diligence by Janus Henderson. Further information on the mitigation of financial risks is included in note 16.
Operational and Cyber Risks
Disruption to, or failure of, Janus Henderson’s accounting, dealing or payment systems or the Depositary’s records could prevent the accurate reporting and monitoring of the Company’s financial position. The Company is also exposed to the operational and cyber risks that one or more of its service providers may not provide the required level of service.
The Board monitors the services provided by Janus Henderson, the Depositary and its other suppliers and receives reports on the key elements in place to provide effective internal control.
The Board considers these risks to have remained unchanged throughout the year under review.
28
The Bankers Investment Trust PLC Annual Report 2018
Strategic Report: Corporate Information (continued)
Viability Statement The Directors have assessed the viability of the Company over a
three year period, taking account of the Company’s current position
and the potential impact of the principal risks and uncertainties
documented in this Strategic Report.
The Directors conducted the assessment based on a period of three
years because they consider this to be an appropriate period over
which they do not expect there to be any significant change in the
current principal risks and adequacy of the mitigating controls in place.
Also the Directors do not envisage any change in strategy or
objectives or any events that would prevent the Company from
continuing to operate over that period as the Company’s assets are
liquid, its commitments are limited and the Company intends to
continue to operate as an investment trust.
The assessment considered the impact of the likelihood of the
principal risks and uncertainties facing the Company, in particular
Investment Activity and Performance, Portfolio and Market and
Financial risks, materialising in severe but plausible scenarios,
and the effectiveness of any mitigating controls in place.
The Directors also took into account the liquidity of the portfolio, the
gearing and the income stream from the portfolio in considering the
viability of the Company over the next three years and its ability to
meet liabilities as they fall due. This included consideration of the
duration of the Company’s long-term borrowings, how a breach of the
gearing covenants could impact on the Company’s net asset value
and share price and how the forecast income stream, expenditure
and levels of reserves could impact on the Company’s ability to pay
dividends to shareholders over that period in line with its current
dividend policy. Whilst detailed forecasts are only made over a shorter
time frame, the nature of the Company’s business as an investment
trust means that such forecasts are equally valid to be considered over
the longer three year period as a means of assessing whether the
Company can continue in operation.
Based on their assessment, the Directors have a reasonable
expectation that the Company will be able to continue in operation
and meet its liabilities as they fall due over the next three year
period.
BorrowingsThe Company has a £20 million loan facility with The Royal Bank of
Scotland plc which expires in 2019. The Board is considering
continuing this level of short-term borrowing.
The Company has an 8% £15 million 2023 debenture and
£50 million of private placement fixed rate 2035 loan notes at an
annualised coupon rate of 3.68%.
Actual gearing at 31 October 2018 was 2.4% (2017: 2.3%) of
net asset value.
Performance Measurement and Key
Performance Indicators (‘KPIs’)In order to measure the success of the Company in meeting its
objectives and to evaluate the performance of the Manager the
Directors take into account the following KPIs:
Performance measured against various indicesThe Board reviews and compares, at each meeting, the
performance of the portfolio as well as the net asset value and
share price for the Company and various indices.
Performance against the Company’s peer groupIn addition to comparison against the various indices, the Board
considers the performance of its AIC global sector peer group at
each Board meeting and its open-ended equivalent, the IMA Global
Sector, on a regular basis.
Discount/premium to net asset value (‘NAV’)The Company publishes a NAV per share figure on a daily basis
through the official newswire of the London Stock Exchange.
This figure is calculated in accordance with the AIC’s formula.
At each Board meeting, the Board monitors the level of the
Company’s discount/premium to NAV and reviews the average
discount/premium for the Company’s relevant AIC sector.
The Board considers the use of share buy-backs and share issues
to enhance shareholder value. During the financial year the
Company did not buy-back any shares (2017: no shares bought
back) and did not issue any shares (2017: no shares issued).
Future DevelopmentsWhile the future performance of the Company is mainly dependent
on the performance of global financial markets which are subject to
various external factors, the Board’s intention is that the Company
will continue to pursue its stated investment objectives and policy
explained on page 4. The Chairman’s Statement, the Fund
Manager’s Review and Fund Manager Reports provide commentary
on the outlook for the Company.
Corporate Responsibility
Responsible investmentJanus Henderson is responsible for reporting on its work on
corporate governance and corporate responsibility issues in the
companies in which it invests on its clients’ behalf, across all funds
as part of its management duties. In May 2005 Henderson Global
Investors became a founding signatory to the United Nations
Principles for Responsible Investment. The Principles, developed
under the auspices of the UN Secretary-General, are a voluntary and
aspirational framework for incorporating environmental, social and
corporate governance (‘ESG’) issues into mainstream investment
decision-making and ownership practices.
29
The Bankers Investment Trust PLC Annual Report 2018
Strategic Report: Corporate Information (continued)
The way companies respond to ESG issues can affect their
business performance, both directly and indirectly. ESG factors are
considered by Janus Henderson investment teams but investments
are not necessarily ruled out on ESG grounds only.
Janus Henderson’s responsible investment policy and further
details of responsible investment activities can be found on the
website www.janushenderson.com.
Employees, social, community, human rights and
environmental mattersThe Company’s core activities are undertaken by Janus
Henderson, which has implemented environmental management
practices, including systems to limit the use of non-renewable
resources and to minimise the impact of operations on the
environment, and is focused on reducing greenhouse gas
emissions and minimising waste, where possible. The Company
has therefore not reported on these, or social, community or
human rights issues. Janus Henderson’s corporate responsibility
statement is included on its website.
The Company’s Annual Report is printed on paper produced using
50% recycled post consumer waste and 50% wood fibre from fully
sustainable forests with certification by the Forest Stewardship
Council; the printing company used is certified as CarbonNeutral®.
Voting policy and the UK stewardship codeThe Manager has a responsible investment policy in place which
sets out its approach to corporate governance and corporate
responsibility for all the companies in which it invests on behalf of
its clients and its policy on proxy voting. The policy also sets out
how Janus Henderson implements the Stewardship Code. The
Company has reviewed the policy and has delegated responsibility
for voting to the Manager. The Board receives regular reports on
the voting undertaken by the Manager on behalf of the Company.
The Board and the Manager believe that voting at general
meetings is an important aspect of corporate stewardship and
a means of signalling shareholder views on board policy, practices
and performance. Voting recommendations are guided by
the best interests of the investee companies’ shareholders.
Depending on the nature of the resolution the fund manager
will give specific instructions on voting non-routine and unusual
or controversial resolutions. Decisions not to support resolutions
and the rationale therefore are given to the investee company
prior to voting.
Practical difficulties may prevent voting in some markets. In
particular, various factors, including restrictions on dealing and
costs, may inhibit voting in some international markets and must
be taken into account.
Modern Slavery Act 2015As an investment company the Company does not provide goods
or services in the normal course of business, and does not have
customers. Accordingly, the Directors consider that the Company is
not required to make any slavery or human trafficking statement
under the Modern Slavery Act 2015.
Board DiversityIt is the Company’s aim to have an appropriate level of diversity in
the boardroom. The Nominations Committee considers diversity
generally when making appointments to the Board, taking into
account relevant skills, experience, knowledge and gender.
Our prime responsibility, however, is the strength of the Board and
our overriding aim in making any new appointments must always
be to select the best candidate. Currently, the Board comprises five
Directors, three male and two female. The Company has no
employees and, therefore, there is nothing further to report in
respect of gender representation within the Company.
By order of the Board
Richard Killingbeck
Chairman
15 January 2019
30
The Bankers Investment Trust PLC Annual Report 2018
Alternative Investment Fund Managers
Directive (‘AIFMD’)Agreed by the European Parliament and the Council of the European
Union and adopted into UK legislation, the AIFMD classifies certain
investment vehicles, including investment companies, as Alternative
Investment Funds (‘AIFs’) and requires them to appoint an
Alternative Investment Fund Manager (‘AIFM’) and Depositary to
manage and oversee the operations of the investment vehicle. The
Board of the Company retains responsibility for strategy, operations
and compliance and the Directors retain a fiduciary duty to
shareholders.
Association of Investment Companies (‘AIC’)The Company is a member of the AIC which is the trade body for
investment companies and represents the industry in relation to
various matters which impact the regulation of such entities.
CustodianThe Custodian is responsible for ensuring the safe custody of the
Company’s assets and that all transactions in the underlying
holdings are transacted in an accurate and timely manner.
DepositaryFrom 22 July 2014 AIFs were required to appoint a Depositary which
has responsibility for overseeing the operations of the Company,
including safekeeping, cash monitoring and verification of ownership
and valuation of the underlying holdings. The Depositary is strictly
liable for the loss of any investments or other assets in its custody
unless it has notified that it has discharged its liability in certain
markets. The Depositary has confirmed that it has not discharged
liability in relation to any of the Company’s assets.
DerivativeA contract between two or more parties in relation to an underlying
security. The value of a derivative will fluctuate in accordance with
the value of the security and is a form of gearing as the fluctuations
in value are usually greater than the fluctuations in the underlying
security’s value. Examples of derivatives are put and call options,
swap contracts, futures and contracts for difference.
Dividend DatesWhen declared or recommended, each dividend will have three key
dates applied to it. The payment date is the date on which
shareholders will receive their dividend either by BACS transfer or by
receipt of a dividend cheque. The record date applied to the dividend
is used as a cut-off for the Company’s registrars to know which
shareholders should be paid a dividend. Only shareholders on the
register of members at the close of business on the record date will
receive the dividend. The ex-dividend date is the business day before
the record date and is the date upon which the Company’s net asset
value per share and share price will be disclosed ex-dividend.
Dividend YieldThe annual dividend (see note 10) expressed as a percentage of the
share price at the year end (see page 3).
GearingGearing means borrowing money to buy assets with the expectation
that the return on investments bought will exceed the interest cost
of the borrowings. The gearing percentage reflects the amount of
borrowings (e.g. bank loans, overdrafts and debt securities) the
Company has used to invest in the market and is calculated by taking
the difference between non-current asset investments (see note 11) and
equity shareholders’ funds (see Statement of Financial Position)
dividing by equity shareholders’ funds and multiplying by 100. The
Company can use synthetic gearing through derivatives. None were
used in the year under review.
Investment TrustsInvestment trusts are public limited companies, listed on the London
Stock Exchange, which provide shareholders with a professionally
managed portfolio of investments. Investment trusts are exempt from
tax on the capital gains arising on their investments subject to
meeting certain criteria. Income, net of expenses and tax, is
substantially distributed to shareholders. Investment trusts are also
known as investment companies although the tax legislation retains
the reference to investment trusts.
LiquidityIn the context of the liquidity of shares in the stock market, this refers
to the availability of buyers in the market for the share in question.
Where the market in a particular share is described as liquid that
share will be in demand and holders wishing to sell their shares
should find ready buyers. Conversely, where the market in a share is
illiquid the difficulty of finding a buyer will tend to depress the price
that might be negotiated for a sale.
Market Capitalisation (‘Market Cap’) The market value of a company calculated by multiplying the
mid-market price per share by the number of shares in issue.
Treasury SharesShares repurchased by the Company but not cancelled.
Strategic Report: Glossary
31
The Bankers Investment Trust PLC Annual Report 2018
Dividend GrowthThe amount by which the Company’s annual dividend has increased
compared to the previous year, expressed as a percentage of the
previous year’s annual dividend.
Net Asset Value (‘NAV’) per Ordinary ShareThe value of the Company’s assets (i.e. investments (see note 11)
and cash held (see Statement of Financial Position)) less any liabilities
(i.e. bank borrowings and debt securities (see notes 14 and 15)) for
which the Company is responsible divided by the number of shares
in issue (see note 18). The aggregate NAV is also referred to as
shareholders’ funds in the Statement of Financial Position. The NAV
per share is published daily and the year end NAV can be found on
page 3.
Ongoing ChargeThe ongoing charge reflects those expenses of a type which are
likely to recur in the foreseeable future, whether charged to capital
or revenue, and which relate to the operation of the Company as
a collective fund, excluding the costs of acquisition or disposal of
investments, finance costs and gains or losses arising on investments.
The ongoing charge is based on actual costs incurred in the year (see
notes 5 and 6 and page 34) as being the best estimate of future
costs, in accordance with methodology prescribed by the AIC and is
the annualised ongoing charge divided by the average net asset value
in the period.
Premium/DiscountThe amount by which the market price per share (see page 3)
of an investment company is either higher (premium) or lower
(discount) than the NAV per share, expressed as a percentage
of the NAV per share.
Revenue Return Per ShareThe revenue return per share is the revenue return for the year
(see Statement of Comprehensive Income) divided by the
weighted average number of ordinary shares (see note 9) in
issue during the year.
Total Return PerformanceThis is the return on the share price (see page 3) or NAV per share
(see NAV per Ordinary Share) taking into account both the rise and
fall of the share price or NAV respectively and the dividends and
interest paid to shareholders during a given period. Any dividends
received by a shareholder are assumed to have been reinvested in
either additional shares (for share price total return) or the
Company’s assets (for NAV per share total return). Dividends paid
and payable are set out in note 10.
See page 29 for details of the Company’s key performance indicators (‘KPI’s’) and how the Directors assess some of these
Alternative Performance Measures.
References to ‘notes’ refers to the Notes to Financial Statements contained in the Company’s 2018 Annual Report.
Alternative Performance Measures
32
The Bankers Investment Trust PLC Annual Report 2018
The Bankers Investment Trust PLC Annual Report 2018
Corporate Report
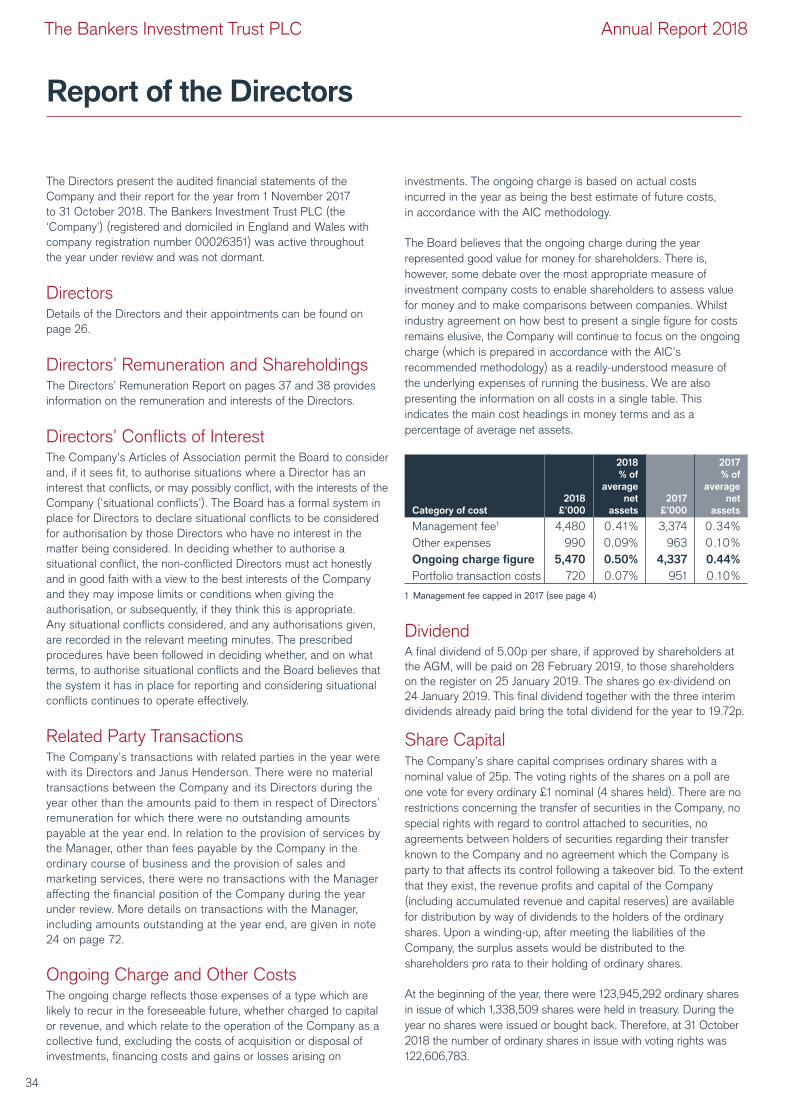
Report of the Directors
The Directors present the audited financial statements of the
Company and their report for the year from 1 November 2017
to 31 October 2018. The Bankers Investment Trust PLC (the
‘Company’) (registered and domiciled in England and Wales with
company registration number 00026351) was active throughout
the year under review and was not dormant.
DirectorsDetails of the Directors and their appointments can be found on
page 26.
Directors’ Remuneration and ShareholdingsThe Directors’ Remuneration Report on pages 37 and 38 provides
information on the remuneration and interests of the Directors.
Directors’ Conflicts of InterestThe Company’s Articles of Association permit the Board to consider
and, if it sees fit, to authorise situations where a Director has an
interest that conflicts, or may possibly conflict, with the interests of the
Company (‘situational conflicts’). The Board has a formal system in
place for Directors to declare situational conflicts to be considered
for authorisation by those Directors who have no interest in the
matter being considered. In deciding whether to authorise a
situational conflict, the non-conflicted Directors must act honestly
and in good faith with a view to the best interests of the Company
and they may impose limits or conditions when giving the
authorisation, or subsequently, if they think this is appropriate.
Any situational conflicts considered, and any authorisations given,
are recorded in the relevant meeting minutes. The prescribed
procedures have been followed in deciding whether, and on what
terms, to authorise situational conflicts and the Board believes that
the system it has in place for reporting and considering situational
conflicts continues to operate effectively.
Related Party TransactionsThe Company’s transactions with related parties in the year were
with its Directors and Janus Henderson. There were no material
transactions between the Company and its Directors during the
year other than the amounts paid to them in respect of Directors’
remuneration for which there were no outstanding amounts
payable at the year end. In relation to the provision of services by
the Manager, other than fees payable by the Company in the
ordinary course of business and the provision of sales and
marketing services, there were no transactions with the Manager
affecting the financial position of the Company during the year
under review. More details on transactions with the Manager,
including amounts outstanding at the year end, are given in note
24 on page 72.
Ongoing Charge and Other CostsThe ongoing charge reflects those expenses of a type which are
likely to recur in the foreseeable future, whether charged to capital
or revenue, and which relate to the operation of the Company as a
collective fund, excluding the costs of acquisition or disposal of
investments, financing costs and gains or losses arising on
investments. The ongoing charge is based on actual costs
incurred in the year as being the best estimate of future costs,
in accordance with the AIC methodology.
The Board believes that the ongoing charge during the year
represented good value for money for shareholders. There is,
however, some debate over the most appropriate measure of
investment company costs to enable shareholders to assess value
for money and to make comparisons between companies. Whilst
industry agreement on how best to present a single figure for costs
remains elusive, the Company will continue to focus on the ongoing
charge (which is prepared in accordance with the AIC’s
recommended methodology) as a readily-understood measure of
the underlying expenses of running the business. We are also
presenting the information on all costs in a single table. This
indicates the main cost headings in money terms and as a
percentage of average net assets.
Category of cost
2018
£’000
2018
% of
average
net
assets
2017
£’000
2017
% of
average
net
assets
Management fee1 4,480 0.41% 3,374 0.34%
Other expenses 990 0.09% 963 0.10%
Ongoing charge figure 5,470 0.50% 4,337 0.44%
Portfolio transaction costs 720 0.07% 951 0.10%
1 Management fee capped in 2017 (see page 4)
DividendA final dividend of 5.00p per share, if approved by shareholders at
the AGM, will be paid on 28 February 2019, to those shareholders
on the register on 25 January 2019. The shares go ex-dividend on
24 January 2019. This final dividend together with the three interim
dividends already paid bring the total dividend for the year to 19.72p.
Share CapitalThe Company’s share capital comprises ordinary shares with a
nominal value of 25p. The voting rights of the shares on a poll are
one vote for every ordinary £1 nominal (4 shares held). There are no
restrictions concerning the transfer of securities in the Company, no
special rights with regard to control attached to securities, no
agreements between holders of securities regarding their transfer
known to the Company and no agreement which the Company is
party to that affects its control following a takeover bid. To the extent
that they exist, the revenue profits and capital of the Company
(including accumulated revenue and capital reserves) are available
for distribution by way of dividends to the holders of the ordinary
shares. Upon a winding-up, after meeting the liabilities of the
Company, the surplus assets would be distributed to the
shareholders pro rata to their holding of ordinary shares.
At the beginning of the year, there were 123,945,292 ordinary shares
in issue of which 1,338,509 shares were held in treasury. During the
year no shares were issued or bought back. Therefore, at 31 October
2018 the number of ordinary shares in issue with voting rights was
122,606,783.
34
The Bankers Investment Trust PLC Annual Report 2018
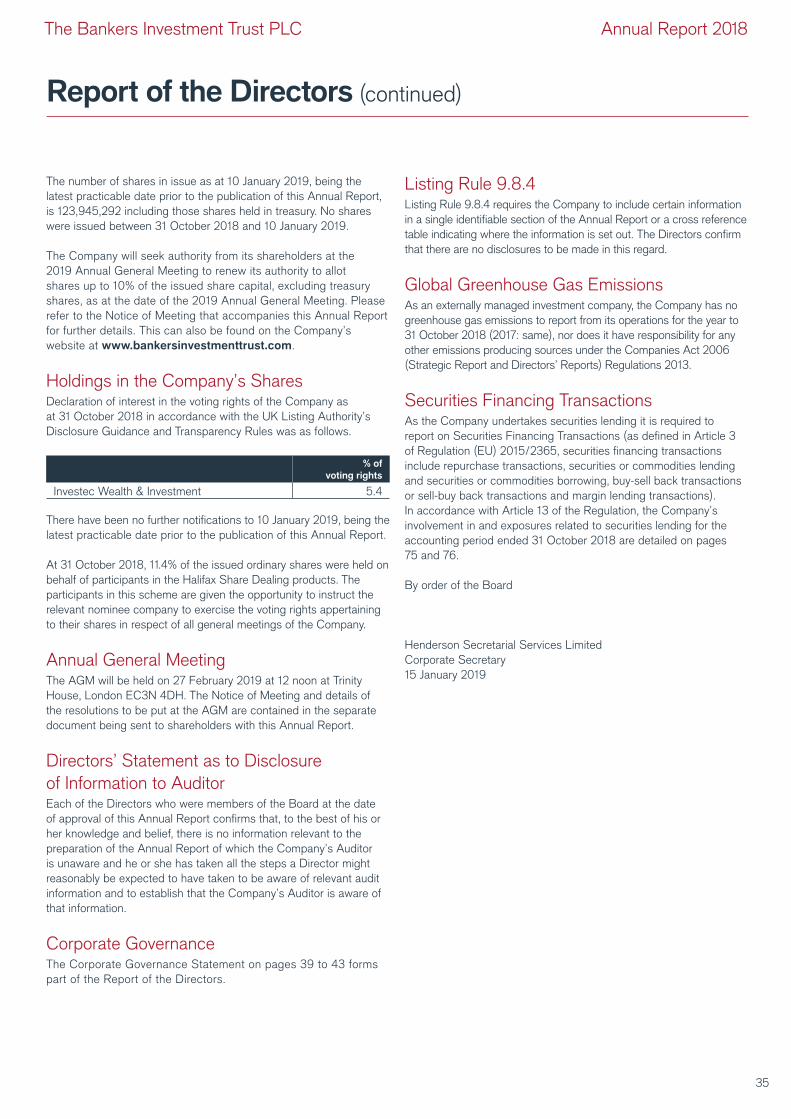
Report of the Directors (continued)
The number of shares in issue as at 10 January 2019, being the
latest practicable date prior to the publication of this Annual Report,
is 123,945,292 including those shares held in treasury. No shares
were issued between 31 October 2018 and 10 January 2019.
The Company will seek authority from its shareholders at the
2019 Annual General Meeting to renew its authority to allot
shares up to 10% of the issued share capital, excluding treasury
shares, as at the date of the 2019 Annual General Meeting. Please
refer to the Notice of Meeting that accompanies this Annual Report
for further details. This can also be found on the Company’s
website at www.bankersinvestmenttrust.com.
Holdings in the Company’s SharesDeclaration of interest in the voting rights of the Company as
at 31 October 2018 in accordance with the UK Listing Authority’s
Disclosure Guidance and Transparency Rules was as follows.
% of
voting rights
Investec Wealth & Investment 5.4
There have been no further notifications to 10 January 2019, being the
latest practicable date prior to the publication of this Annual Report.
At 31 October 2018, 11.4% of the issued ordinary shares were held on
behalf of participants in the Halifax Share Dealing products. The
participants in this scheme are given the opportunity to instruct the
relevant nominee company to exercise the voting rights appertaining
to their shares in respect of all general meetings of the Company.
Annual General MeetingThe AGM will be held on 27 February 2019 at 12 noon at Trinity
House, London EC3N 4DH. The Notice of Meeting and details of
the resolutions to be put at the AGM are contained in the separate
document being sent to shareholders with this Annual Report.
Directors’ Statement as to Disclosure
of Information to AuditorEach of the Directors who were members of the Board at the date
of approval of this Annual Report confirms that, to the best of his or
her knowledge and belief, there is no information relevant to the
preparation of the Annual Report of which the Company’s Auditor
is unaware and he or she has taken all the steps a Director might
reasonably be expected to have taken to be aware of relevant audit
information and to establish that the Company’s Auditor is aware of
that information.
Corporate GovernanceThe Corporate Governance Statement on pages 39 to 43 forms
part of the Report of the Directors.
Listing Rule 9.8.4Listing Rule 9.8.4 requires the Company to include certain information
in a single identifiable section of the Annual Report or a cross reference
table indicating where the information is set out. The Directors confirm
that there are no disclosures to be made in this regard.
Global Greenhouse Gas EmissionsAs an externally managed investment company, the Company has no
greenhouse gas emissions to report from its operations for the year to
31 October 2018 (2017: same), nor does it have responsibility for any
other emissions producing sources under the Companies Act 2006
(Strategic Report and Directors’ Reports) Regulations 2013.
Securities Financing TransactionsAs the Company undertakes securities lending it is required to
report on Securities Financing Transactions (as defined in Article 3
of Regulation (EU) 2015/2365, securities financing transactions
include repurchase transactions, securities or commodities lending
and securities or commodities borrowing, buy-sell back transactions
or sell-buy back transactions and margin lending transactions).
In accordance with Article 13 of the Regulation, the Company’s
involvement in and exposures related to securities lending for the
accounting period ended 31 October 2018 are detailed on pages
75 and 76.
By order of the Board
Henderson Secretarial Services Limited
Corporate Secretary
15 January 2019
35
The Bankers Investment Trust PLC Annual Report 2018
Statement of Directors’ Responsibilities
The Directors are responsible for preparing the Annual Report,
including the Directors’ Remuneration Report and the Financial
Statements, in accordance with applicable law and regulations.
Company law requires the Directors to prepare financial statements
for each financial year. Under that law the Directors have prepared
the financial statements in accordance with International Financial
Reporting Standards (‘IFRSs’) as adopted by the European Union.
Under company law the Directors must not approve the financial
statements unless they are satisfied that they give a true and fair
view of the state of affairs of the Company and of the profit or loss of
the Company for that period. In preparing these financial statements,
the Directors are required to:
• select suitable accounting policies and then apply them
consistently;
• make judgments and accounting estimates that are reasonable
and prudent;
• state whether applicable IFRSs as adopted by the European
Union have been followed, subject to any material departures
disclosed and explained in the financial statements; and
• prepare the financial statements on the going concern basis
unless it is inappropriate to presume that the Company will
continue in business.
The Directors are responsible for keeping adequate accounting
records that are sufficient to show and explain the Company’s
transactions and disclose with reasonable accuracy at any time the
financial position of the Company and enable it to ensure that the
financial statements and the Directors’ Remuneration Report comply
with the Companies Act 2006. They are also responsible for
safeguarding the assets of the Company and hence for taking
reasonable steps for the prevention and detection of fraud and other
irregularities.
Having taken advice from the Audit Committee, the Directors
consider that the Annual Report and financial statements, taken
as a whole, are fair, balanced and understandable and provide the
information necessary for shareholders to assess the Company’s
position and performance, business model and strategy.
Statement of Directors’ Responsibilities
under Disclosure Guidance and Transparency
Rule 4.1.12Each of the Directors, who are listed on page 26, confirms that, to
the best of his or her knowledge:
• the Company’s financial statements, which have been prepared in
accordance with IFRSs as adopted by the EU, give a true and fair
view of the assets, liabilities, financial position and profit of the
Company; and
• the Strategic Report in this Annual Report and financial
statements includes a fair review of the development and
performance of the business and the position of the Company,
together with a description of the principal risks and uncertainties
that it faces.
For and on behalf of the Board
Richard Killingbeck
Chairman
15 January 2019
36
The Bankers Investment Trust PLC Annual Report 2018
Directors’ Remuneration Report
IntroductionThis report is submitted in accordance with Schedule 8 of The Large
and Medium-sized Companies and Groups (Accounts and Reports)
Regulations 2008 as amended in August 2013 (the ‘Regulations’).
The report also meets the relevant requirements of the Companies
Act 2006 (the ‘Act’) and the Listing Rules of the UK Listing Authority
and describes how the Board has applied the principles relating to
Directors’ remuneration. As required by Section 439 of the Act, an
ordinary resolution to approve the report will be proposed at the
Annual General Meeting (‘AGM’) on 27 February 2019.
Shareholders last approved the Company’s remuneration policy
under Section 439A of the Act at the AGM in 2017. No changes to
the policy are proposed and therefore the current policy will continue
in force until the AGM in 2020.
The Company’s Auditor is required to report on certain information
contained within this report; where information set out below has
been audited it is indicated as such.
All Directors are non-executive and the Company has no Chief
Executive officer or employees. As such some of the reporting
requirements contained in the Regulations are not applicable and have
not been reported on, including the requirement for a future policy table
and an illustrative representation of the level of remuneration that could
be received by each individual Director. It is believed that all relevant
information is disclosed within this report in an appropriate format.
Remuneration PolicyThe Board as a whole considers the Directors’ remuneration.
The Board has not established a remuneration committee to
consider matters relating to the Directors’ remuneration. The Board
has not been provided with advice or services by any person in
respect of its consideration of the Directors’ remuneration (although
the Directors review annually the fees paid to the boards of directors
of other comparable investment companies).
The Company’s policy is that the fees payable to the Directors
should reflect the time spent by the Board on the Company’s affairs
and the responsibilities borne by the Directors and should be
sufficient to promote the long-term success of the Company.
The policy is for the Chairman of the Board, the Senior Independent
Director and the Chairman of the Audit Committee to be paid a
higher fee than the other Directors in recognition of their additional
responsibilities.
The policy is to review these rates annually although such review
will not necessarily result in any change to the rates.
None of the Directors has a contract of service or a contract for
services, there are no set notice periods and a Director may resign
by notice in writing to the Board at any time with no compensation.
The Company’s policy is for the Directors to be remunerated in the
form of fees, payable quarterly in arrears, to the Director personally
or to a third party specified by him or her. There are no long-term
incentive schemes provided by the Company and the fees are not
specifically related to the Directors’ performance, either individually
or collectively.
Annual StatementAs Chairman, Richard Killingbeck reports that Directors’ fees were
last increased on 1 November 2017, being the start of the
Company’s financial year. The increase was made after
consideration of the fees paid to other investment trusts in the
sector of an equivalent size and also in relation to the fees paid to
the directors of other Janus Henderson managed companies. The
increase was to ensure that the Directors are properly remunerated
for their services to the Company and so that the Company can
remain competitive when seeking new Directors. Directors’ fees
were reviewed during the year and no change was proposed.
There have been no other major decisions on Directors’
remuneration or any other changes to the remuneration paid to each
individual Director in the year under review.
Annual Report on Remuneration
Directors’ Interests in Shares (Audited)Ordinary shares of 25p
31 October
2018
1 November
2017
Beneficial interest:
Richard Killingbeck 30,000 30,000
Julian Chillingworth 1,620 1,620
Sue Inglis 5,000 5,000
Matthew Thorne1 n/a 30,250
David Wild1 n/a 12,803
Isobel Sharp 2,300 –
Richard Huntingford2 – n/a
1 Matthew Thorne and David Wild retired from the Board on 21 February 2018
2 Richard Huntingford was appointed to the Board on 26 September 2018
The interests of the Directors in the ordinary shares of the Company
at the beginning and end of the financial year are shown in the
preceding table. There have been no changes since the year end to
the date of this Annual Report.
No Director is required to hold shares of the Company by way of
qualification.
37
The Bankers Investment Trust PLC Annual Report 2018
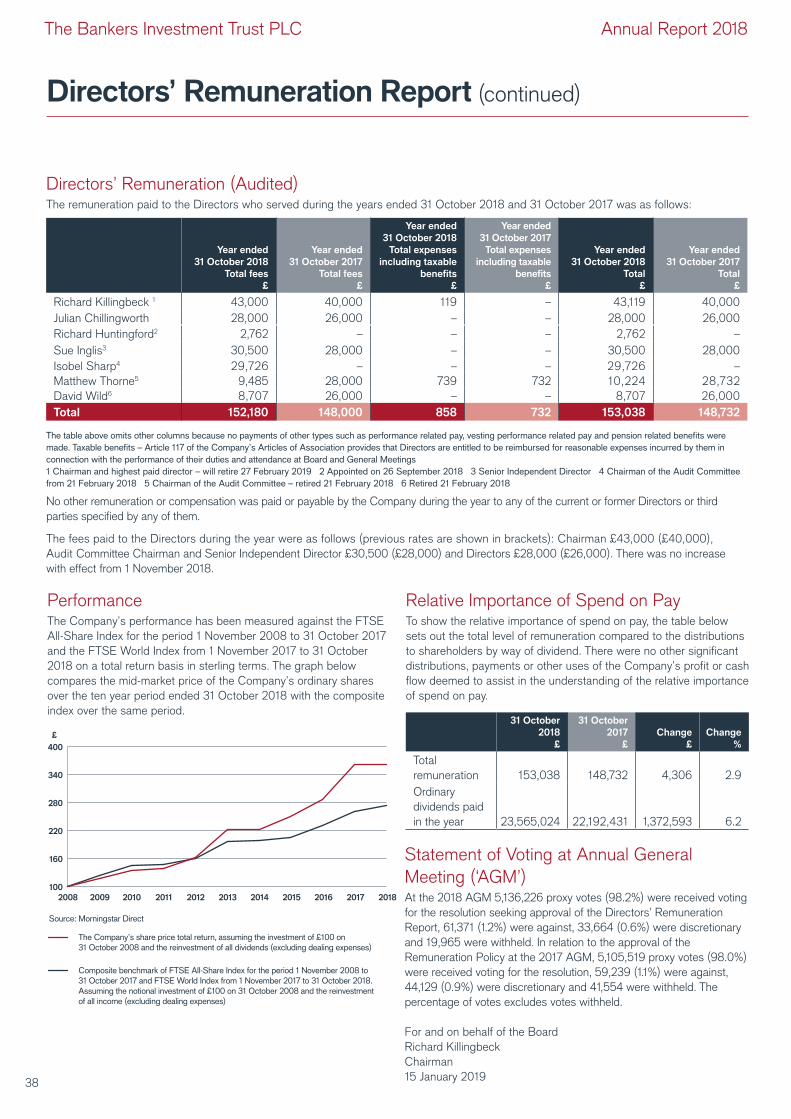
Directors’ Remuneration Report (continued)
Statement of Voting at Annual General
Meeting (‘AGM’) At the 2018 AGM 5,136,226 proxy votes (98.2%) were received voting
for the resolution seeking approval of the Directors’ Remuneration
Report, 61,371 (1.2%) were against, 33,664 (0.6%) were discretionary
and 19,965 were withheld. In relation to the approval of the
Remuneration Policy at the 2017 AGM, 5,105,519 proxy votes (98.0%)
were received voting for the resolution, 59,239 (1.1%) were against,
44,129 (0.9%) were discretionary and 41,554 were withheld. The
percentage of votes excludes votes withheld.
For and on behalf of the Board
Richard Killingbeck
Chairman
15 January 2019
Directors’ Remuneration (Audited) The remuneration paid to the Directors who served during the years ended 31 October 2018 and 31 October 2017 was as follows:
Year ended
31 October 2018
Total fees
£
Year ended
31 October 2017
Total fees
£
Year ended
31 October 2018
Total expenses
including taxable
benefits
£
Year ended
31 October 2017
Total expenses
including taxable
benefits
£
Year ended
31 October 2018
Total
£
Year ended
31 October 2017
Total
£
Richard Killingbeck 1 43,000 40,000 119 – 43,119 40,000
Julian Chillingworth 28,000 26,000 – – 28,000 26,000
Richard Huntingford2 2,762 – – – 2,762 –
Sue Inglis3 30,500 28,000 – – 30,500 28,000
Isobel Sharp4 29,726 – – – 29,726 –
Matthew Thorne5 9,485 28,000 739 732 10,224 28,732
David Wild6 8,707 26,000 – – 8,707 26,000
Total 152,180 148,000 858 732 153,038 148,732
The table above omits other columns because no payments of other types such as performance related pay, vesting performance related pay and pension related benefits were
made. Taxable benefits – Article 117 of the Company’s Articles of Association provides that Directors are entitled to be reimbursed for reasonable expenses incurred by them in
connection with the performance of their duties and attendance at Board and General Meetings
1 Chairman and highest paid director – will retire 27 February 2019 2 Appointed on 26 September 2018 3 Senior Independent Director 4 Chairman of the Audit Committee
from 21 February 2018 5 Chairman of the Audit Committee – retired 21 February 2018 6 Retired 21 February 2018
No other remuneration or compensation was paid or payable by the Company during the year to any of the current or former Directors or third
parties specified by any of them.
The fees paid to the Directors during the year were as follows (previous rates are shown in brackets): Chairman £43,000 (£40,000),
Audit Committee Chairman and Senior Independent Director £30,500 (£28,000) and Directors £28,000 (£26,000). There was no increase
with effect from 1 November 2018.
PerformanceThe Company’s performance has been measured against the FTSE
All-Share Index for the period 1 November 2008 to 31 October 2017
and the FTSE World Index from 1 November 2017 to 31 October
2018 on a total return basis in sterling terms. The graph below
compares the mid-market price of the Company’s ordinary shares
over the ten year period ended 31 October 2018 with the composite
index over the same period.
Relative Importance of Spend on PayTo show the relative importance of spend on pay, the table below
sets out the total level of remuneration compared to the distributions
to shareholders by way of dividend. There were no other significant
distributions, payments or other uses of the Company’s profit or cash
flow deemed to assist in the understanding of the relative importance
of spend on pay.
31 October
2018
£
31 October
2017
£
Change
£
Change
%
Total
remuneration 153,038 148,732 4,306 2.9
Ordinary
dividends paid
in the year 23,565,024 22,192,431 1,372,593 6.2
2018201720162015201420132012201120102008
£
2009
The Company’s share price total return, assuming the investment of £100 on
31 October 2008 and the reinvestment of all dividends (excluding dealing expenses)
Source: Morningstar Direct
Composite benchmark of FTSE All-Share Index for the period 1 November 2008 to
31 October 2017 and FTSE World Index from 1 November 2017 to 31 October 2018.
Assuming the notional investment of £100 on 31 October 2008 and the reinvestment
of all income (excluding dealing expenses)
100
160
220
280
340
400
38
The Bankers Investment Trust PLC Annual Report 2018
Corporate Governance Statement
Applicable Corporate Governance CodesThe Board is accountable to shareholders for the governance of
the Company’s affairs. As an investment company, the Company’s
day-to-day responsibilities are delegated to third parties, the
Company has no employees and the Directors are all non-
executive. Therefore not all the provisions of the UK Corporate
Governance Code (the ‘UK Code’) issued by the Financial
Reporting Council (‘FRC’) in April 2016 are directly applicable to
the Company. The Board has therefore considered the principles
and recommendations of the Code of Corporate Governance
published by the Association of Investment Companies in July
2016 (the ‘AIC Code’) by reference to the AIC Corporate
Governance Guide for Investment Companies (the ‘AIC Guide’).
The AIC Code, as explained by the AIC Guide, addresses all
the applicable principles set out in the UK Code as well as setting
out additional principles and recommendations on issues that are
of specific relevance to investment companies. The FRC has
confirmed that, by following the AIC Guide, boards of investment
companies should fully meet their obligations in relation to the
UK Code and paragraph 9.8.6 of the Listing Rules.
Copies of the AIC Code, the AIC Guide and the UK Code can be
found on the respective organisations’ websites: www.theaic.co.uk
and www.frc.org.uk.
The Board has noted the new UK Corporate Governance Code
published by the FRC in July 2018 (the ‘2018 Code’) which the
Company will report against for the year ending 31 October 2020.
It is not anticipated that this will result in any significant changes for
the Company.
New Zealand ListingIt should be noted that the UK Code of Corporate Governance may
differ materially from the New Zealand Stock Exchange’s corporate
governance rules and principles of the Corporate Best Practice Code.
Statement of ComplianceThe Directors believe that during the year under review they have
complied with the provisions of the AIC Code, insofar as they apply
to the Company’s business, and with the provisions of the UK Code,
except as noted below;
• the role of chief executive;
• executive directors’ remuneration; and
• the need for an internal audit function.
As the Company has no chief executive and it delegates to an
external investment manager (which has its own internal audit
function) its day-to-day operations and has no employees, the Board
does not consider these provisions to be relevant to the Company
and has not reported further in respect of these provisions.
The Board
Board compositionThe Articles of Association provide that the total number of Directors
shall not be less than three nor more than eight; the Board currently
consists of five non-executive Directors. The biographies of the Directors
holding office at the date of this Annual Report, which are set out
on page 26, demonstrate the breadth of investment, commercial and
professional experience relevant to their positions as Directors.
Responsibilities of the Board and its CommitteesDuring the year six scheduled Board meetings were held to deal
with the important aspects of the Company’s affairs. The Board
has a formal schedule of matters specifically reserved for its
decision/approval, which are categorised under various headings
including strategy, management, structure, capital, financial
reporting, internal controls, gearing, asset allocation, share price
premium/discount, contracts, investment policy, finance, risk,
investment restrictions, performance, corporate governance and
Board membership and appointments.
The Board is responsible for the approval of the annual and half year
results and other public documents and for ensuring that such
documents provide a fair, balanced and understandable assessment of
the Company’s position and prospects. The Directors confirm that they
are satisfied that the Annual Report for the year ended 31 October
2018, taken as a whole, is fair, balanced and understandable and
provides the information necessary for shareholders to assess the
Company’s position and performance, business model and strategy.
At each meeting the Board reviews the Company’s investment
performance and considers financial analyses and other reports
of an operational nature. The Board monitors compliance with the
Company’s investment objectives and policy and is responsible for
setting asset allocation, investment and gearing limits within which
the Manager has discretion to act. The Board has responsibility for
the approval of any investments in in-house funds managed or
advised by the Manager. It also has adopted a procedure for
Directors, in the furtherance of their duties, to take independent
professional advice at the expense of the Company. To enable them
to discharge their responsibilities, all Directors have full and timely
access to relevant information.
Internal ControlThe Board has overall responsibility for the Company’s system of
internal control and for reviewing its effectiveness.
The Board has established an ongoing process for identifying,
evaluating and managing the principal risks faced by the Company.
The process accords with the FRC’s guidance on Risk Management,
Internal Control and Related Business and Financial Reporting
published in September 2014. The system was in operation
throughout the year and up to the date of this report. The system is
designed to meet the specific risks faced by the Company and takes
account of the nature of the Company’s reliance on its service
providers and their internal controls. The system therefore manages
rather than eliminates the risk of failure to achieve the Company’s
business objectives and provides reasonable, but not absolute,
assurance against material misstatement or loss.
The key components of the internal control framework include:
• Clearly defined investment criteria, specifying levels of authority and
exposure limits. The Board reviews reports on investment
performance against and compliance with the criteria at each meeting.39
The Bankers Investment Trust PLC Annual Report 2018
Corporate Governance Statement (continued)
• Regular financial reporting which allows the Board to assess the
Company’s financial position. The management accounts and
forecasts are reviewed by the Board at each meeting.
• Contractual agreements with the Manager and all other third party
service providers. The Board reviews performance levels and
adherence to relevant provisions in the agreements on a regular
basis through reporting to the Board and conducts a formal
evaluation of the overall level of service provided at least annually.
• The review of controls at the Manager and other third party
service providers. The Board receives quarterly reporting from the
Manager and Depositary, and reviews annual assurance reports
on the effectiveness of the control environments at the Company’s
key service providers.
• Review of additional reporting provided by:
– the Manager’s Enterprise Risk team on the control environment in operation at the Manager and their view of the control environments in place at the third party service providers used by the Company; and
– the Manager’s Internal Audit team on areas of operation which are relevant to the Company.
The Board noted the service auditors’ qualification in respect of the
assurance reports of one of the Company’s third party service providers
which covered controls during the reporting period. The Board is aware
that the Audit Committee sought additional clarification in respect of the
exceptions which resulted in the qualification and is satisfied that the
matter has been considered in sufficient detail and did not constitute
a material weakness in internal controls.
The Board has reviewed the effectiveness of the Company’s system of
internal control for the year ended 31 October 2018. During the course
of its review the Board has not identified or been advised of any failings
or weaknesses that have been determined as significant.
Internal Audit FunctionSystems are in operation to safeguard the Company’s assets and
shareholders’ investments, to maintain proper accounting records
and to ensure that financial information used within the business, or
published, is reliable. The Company’s management functions are
delegated to third parties and the Board monitors the controls in
place with support from the Manager’s Internal Audit department.
As such the Board has determined that there is currently no need
for the Company to have its own internal audit function. The Board
will continue to review this on an annual basis
Directors
Terms of appointment and retirementThe Board may appoint Directors to the Board and any Director so
appointed must stand for appointment by the shareholders at the
Annual General Meeting (‘AGM’) following appointment, in accordance
with the Articles of Association. Richard Huntingford, who was
appointed to the Board on 26 September 2018, will stand for
appointment by shareholders at the 2019 AGM.
The Articles of Association require all Directors to retire at each
AGM, in accordance with the corporate governance policy adopted.
Richard Killingbeck will not be offering himself for re-appointment
and will retire from the conclusion of the AGM. All the remaining
Directors, being eligible, will offer themselves for re-appointment at
the AGM.
Sue Inglis will succeed Richard Killingbeck as Chairman from the
conclusion of the 2019 AGM. Julian Chillingworth will succeed Sue
Inglis as Senior Independent Director at the same time.
The contribution and performance of each Director (excluding
Richard Huntingford) was reviewed by the Nominations Committee
at its meeting in September 2018, which recommended to the Board
the continuing appointment of each of the Directors.
Under the Articles of Association, shareholders may remove a
Director before the end of his or her term by passing an ordinary
resolution at a meeting.
IndependenceAll Directors have a wide range of other interests and are not
dependent on the Company itself. At the Nominations Committee
meeting in September 2018, the Committee considered each of the
Directors’ other appointments and commitments, as well as their
tenure of service and any connections they may have with the
Manager. The Directors confirmed that all Directors remain wholly
independent of the Manager. There were no contracts in existence
during or at the end of the year and up to the date of this Annual
Report which a Director of the Company is or was materially
interested and which is or was significant in relation to the
Company’s business.
Induction and ongoing trainingWhen a new Director is appointed he or she receives an induction
seminar which is held by the Manager at the request of the
Chairman. Directors are also provided on a regular basis with key
information on the Company’s policies, regulatory and statutory
requirements and internal controls. Changes affecting Directors’
responsibilities are advised to the Board as they arise. Directors
also regularly participate in relevant training and industry seminars.
Directors’ individual training requirements are considered as part
of the annual evaluation process which is led by the Chairman
of the Board.
Directors’ insurance and indemnificationDirectors’ and officers’ liability insurance cover is in place in respect
of the Directors. Under the Company’s Articles of Association and,
subject to the provisions of UK legislation, a qualifying third party
provision indemnity may be provided to Directors in respect of costs
which they may incur relating to the defence of any proceedings
brought against them arising out of their positions as Directors in which
they are acquitted or judgment is given in their favour by the Court.
No indemnity was given during the year or up to the date of this report.
40
The Bankers Investment Trust PLC Annual Report 2018
Corporate Governance Statement (continued)
Committees of the BoardThe Board has three principal Committees, the Audit
Committee, the Nominations Committee and the Management
Engagement Committee. The terms of reference for these
Committees are available on the Company’s website
www.bankersinvestmenttrust.com or via the Corporate Secretary.
The Company has also established an Insider Committee to assist
in meeting the disclosure requirements of the Market Abuse Regulation.
Audit CommitteeThe Audit Committee is chaired by Isobel Sharp. The Report of the
Audit Committee can be found on pages 44 and 45.
Nominations CommitteeThe Nominations Committee is responsible for ensuring the Board
retains an appropriate balance of skills, experience and diversity,
has a formal, rigorous and transparent approach to the
appointment of Directors and maintains an effective framework
for succession planning.
Richard Killingbeck, Sue Inglis, Julian Chillingworth and Isobel Sharp
are the members of the Nominations Committee. The Chairman
of the Board acts as Chairman of the Committee, but did not chair
the Committee when his successor was being considered. After
consideration Sue Inglis was proposed and approved to succeed
Richard Killingbeck as Chairman, she did not participate in the
discussion regarding her proposed appointment, likewise Julian
Chillingworth did not participate in the discussion regarding his
proposed appointment as Senior Independent Director.
In discharging its duties over the course of the year, the Committee
considered:
• the composition of the Board and each of its committees, taking
account of the skills, experience and knowledge of each director
and whether the diversity of these continued to contribute to the
success of the Company. However, given the size of the Board, it
is not considered appropriate for the Company to have set targets
in this regard; candidates will be assessed in relation to the
relevant needs of the Company at the time of appointment. Once
a decision is made to recruit additional Directors to the Board, a
formal job description will be drawn up. The committee may use
external agencies as and when the requirement to recruit an
additional Board member becomes necessary;
• the appointment of Richard Huntingford was made using the
services of the independent external recruitment consultancy
NuRole;
• the outcomes of the Board performance evaluation with a view as
to whether adjustments should be made to the number of
Directors or knowledge and skills represented on the Board.
The results of the annual performance evaluation are detailed below;
• whether any training was required by the Directors;
• the tenure of each of the Directors, giving consideration as to
whether the Board retained a sufficient balance of length of
service without becoming ossified;
• the independence of the Directors taking account of the
guidelines established by the UK Code and AIC Code as well as
the Directors’ other commitments;
• the time commitment of the Directors and whether this had been
sufficient over the course of the year;
• succession planning for appointments to the Board taking
account of the provisions of the Company’s articles regarding the
retirement and rotation of Directors, the tenure of the current
Directors and recommendations of the 2018 Code; and
• the performance and contribution of the Directors standing for
re-appointment at the 2019 AGM.
Following completion of its reviews, the Committee was satisfied
that, having considered each Directors experience and the nature
of, and anticipated demands on his or her time by, his or her other
business commitments including other investment trusts, that each
Director is able to commit the time required to fulfil his or her
responsibilities as a Director of the Company. Taking account of the
performance of individual Directors, the Committee recommended
to the Board that it should support the re-appointment of those
Directors seeking re-appointment at the 2019 AGM. Other than as
described above no changes to the composition of the Board were
required at present.
Performance evaluation The Directors recognise the importance of the AIC Code’s
recommendation in respect of evaluating the performance of the
Board as a whole, the Committees and individual Directors. During
the year the Directors undertook a review of the Board structure
including an evaluation of the performance of the Board, the
Committees and of individual Directors including the Chairman.
The Company is obliged to engage an external facilitator for Board
evaluation every three years. An external review was first carried
out by Lintstock Limited in 2013 and has been undertaken each
year since. The evaluation for the year under review was also
undertaken by Lintstock Limited who are independent of the
Company. The evaluation concluded that the Board has a good
balance of skills and experience relevant to the Company’s
objectives and operations.
Management Engagement CommitteeThe Management Engagement Committee is responsible for formally
evaluating the overall performance of the Manager and other
third-party service providers engaged by the Company to consider
whether their continuing appointment is in the interest of
shareholders as a whole. The Committee is chaired by the Chairman
41
The Bankers Investment Trust PLC Annual Report 2018
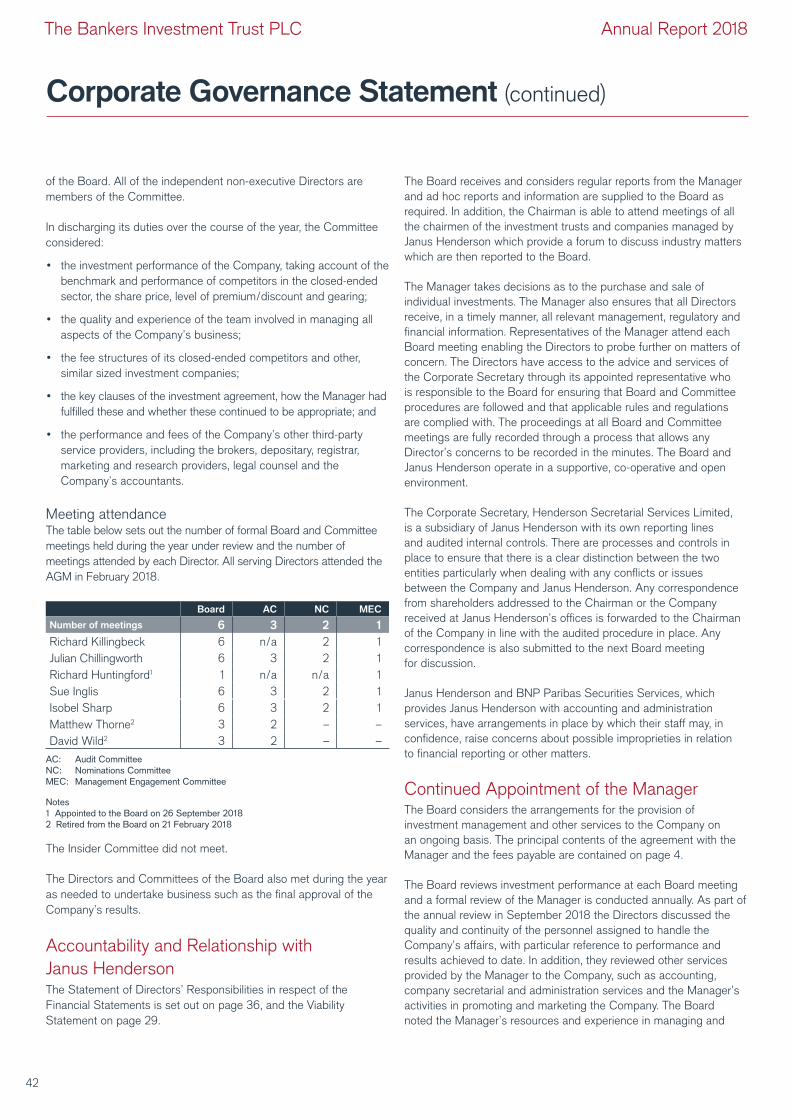
Corporate Governance Statement (continued)
of the Board. All of the independent non-executive Directors are
members of the Committee.
In discharging its duties over the course of the year, the Committee
considered:
• the investment performance of the Company, taking account of the
benchmark and performance of competitors in the closed-ended
sector, the share price, level of premium/discount and gearing;
• the quality and experience of the team involved in managing all
aspects of the Company’s business;
• the fee structures of its closed-ended competitors and other,
similar sized investment companies;
• the key clauses of the investment agreement, how the Manager had
fulfilled these and whether these continued to be appropriate; and
• the performance and fees of the Company’s other third-party
service providers, including the brokers, depositary, registrar,
marketing and research providers, legal counsel and the
Company’s accountants.
Meeting attendanceThe table below sets out the number of formal Board and Committee
meetings held during the year under review and the number of
meetings attended by each Director. All serving Directors attended the
AGM in February 2018.
Board AC NC MEC
Number of meetings 6 3 2 1
Richard Killingbeck 6 n/a 2 1
Julian Chillingworth 6 3 2 1
Richard Huntingford1 1 n/a n/a 1
Sue Inglis 6 3 2 1
Isobel Sharp 6 3 2 1
Matthew Thorne2 3 2 – –
David Wild2 3 2 – –
AC: Audit Committee NC: Nominations Committee MEC: Management Engagement Committee
Notes1 Appointed to the Board on 26 September 2018 2 Retired from the Board on 21 February 2018
The Insider Committee did not meet.
The Directors and Committees of the Board also met during the year
as needed to undertake business such as the final approval of the
Company’s results.
Accountability and Relationship with
Janus HendersonThe Statement of Directors’ Responsibilities in respect of the
Financial Statements is set out on page 36, and the Viability
Statement on page 29.
The Board receives and considers regular reports from the Manager
and ad hoc reports and information are supplied to the Board as
required. In addition, the Chairman is able to attend meetings of all
the chairmen of the investment trusts and companies managed by
Janus Henderson which provide a forum to discuss industry matters
which are then reported to the Board.
The Manager takes decisions as to the purchase and sale of
individual investments. The Manager also ensures that all Directors
receive, in a timely manner, all relevant management, regulatory and
financial information. Representatives of the Manager attend each
Board meeting enabling the Directors to probe further on matters of
concern. The Directors have access to the advice and services of
the Corporate Secretary through its appointed representative who
is responsible to the Board for ensuring that Board and Committee
procedures are followed and that applicable rules and regulations
are complied with. The proceedings at all Board and Committee
meetings are fully recorded through a process that allows any
Director’s concerns to be recorded in the minutes. The Board and
Janus Henderson operate in a supportive, co-operative and open
environment.
The Corporate Secretary, Henderson Secretarial Services Limited,
is a subsidiary of Janus Henderson with its own reporting lines
and audited internal controls. There are processes and controls in
place to ensure that there is a clear distinction between the two
entities particularly when dealing with any conflicts or issues
between the Company and Janus Henderson. Any correspondence
from shareholders addressed to the Chairman or the Company
received at Janus Henderson’s offices is forwarded to the Chairman
of the Company in line with the audited procedure in place. Any
correspondence is also submitted to the next Board meeting
for discussion.
Janus Henderson and BNP Paribas Securities Services, which
provides Janus Henderson with accounting and administration
services, have arrangements in place by which their staff may, in
confidence, raise concerns about possible improprieties in relation
to financial reporting or other matters.
Continued Appointment of the ManagerThe Board considers the arrangements for the provision of
investment management and other services to the Company on
an ongoing basis. The principal contents of the agreement with the
Manager and the fees payable are contained on page 4.
The Board reviews investment performance at each Board meeting
and a formal review of the Manager is conducted annually. As part of
the annual review in September 2018 the Directors discussed the
quality and continuity of the personnel assigned to handle the
Company’s affairs, with particular reference to performance and
results achieved to date. In addition, they reviewed other services
provided by the Manager to the Company, such as accounting,
company secretarial and administration services and the Manager’s
activities in promoting and marketing the Company. The Board
noted the Manager’s resources and experience in managing and
42
The Bankers Investment Trust PLC Annual Report 2018
Corporate Governance Statement (continued)
administering investment trust companies. As a result of their
annual review it is the opinion of the Directors that the continued
appointment of the Manager on the terms agreed is in the interests
of the Company’s shareholders as a whole.
Bribery Act The Company has no employees. The Board has reviewed the
implications of the Bribery Act 2010 and confirmed its zero tolerance
to bribery and corruption in its business activities. It has received
assurances from the Company’s main contractors and suppliers,
listed on page 27, that they will maintain adequate safeguards to
protect against any potentially illegal behaviour by their employees
and agents.
Criminal Finances Act 2017 The Board has also considered the changes made by the Criminal
Finances Act 2017, which came into effect in September 2017, and
which introduced a new corporate criminal offence of failing to take
reasonable steps to prevent the facilitation of tax evasion. The
Company has received assurances from the Company’s main
contractors and suppliers that they maintain a zero tolerance policy
towards the provision of illegal services, including the facilitation of
tax evasion.
Share CapitalPlease see the Report of the Directors on pages 34 and 35.
Relations with ShareholdersShareholder relations are given high priority by the Board. The prime
medium by which the Company communicates with its shareholders
is through the half year results and Annual Report which aim to
provide shareholders with a clear understanding of the Company’s
activities and their results. This information is supplemented by the
daily calculation and publication of the NAV per share at the London
and New Zealand Stock Exchanges.
Janus Henderson also provides a monthly fact sheet which is
available on the website, and information on the Company and Fund
Manager videos are on the website, via various social media
channels and through its HGi content platform, more details of which
are included on page 27 of this report.
The Board considers that shareholders should be encouraged to
attend and participate at the AGM. Shareholders have the
opportunity to address questions to the Chairman of the Board, the
Chairman of the Audit Committee and all other Directors at the
meeting and the Fund Manager will make a presentation to
shareholders. A summary of the proxy votes received on the
resolutions proposed is displayed at the meeting and each
substantial issue is dealt with in a separate resolution. It is the
intention of the Board that the Annual Report and Notice of AGM be
issued to shareholders so as to provide at least 20 working days’
notice of the meeting. These documents are also included on the
website. Shareholders wishing to lodge questions in advance of the
meeting, or raise issues or concerns at any time, are invited to do so
by writing to the Chairman at the registered office address given on
page 27 of this report.
General presentations to both shareholders and analysts follow
the publication of the annual results and also take place throughout
the year. Meetings between Janus Henderson, including our Fund
Manager, and shareholders are reported to the Board. The Chairman
is also available to meet with shareholders as appropriate.
By order of the Board
Henderson Secretarial Services Limited
Corporate Secretary
15 January 2019
43
The Bankers Investment Trust PLC Annual Report 2018
Report of the Audit Committee
In accordance with the September 2014 Competition and Markets
Authority Order, the Audit Committee presents its Report.
CompositionThe membership of the Audit Committee comprises all of the Directors
except the Chairman of the Board, and from 21 February 2018 was
chaired by Isobel Sharp who is a chartered accountant. The other two
Audit Committee members were joined during the period by Richard
Huntingford who is also a chartered accountant, have a combination
of financial, investment and other experience gained throughout their
careers and the Board is satisfied that at least one of the Committee’s
members has recent and relevant financial experience. All members of
the Audit Committee are independent and have competence relevant
to the sector in which the Company operates. The biographies of the
Audit Committee members are shown on page 26.
MeetingsThe Audit Committee met three times during the year under review.
The Company’s Auditor is invited to attend meetings as necessary.
Representatives of Janus Henderson and BNP Paribas Securities
Services (‘BNP’) may also be invited.
Role and ResponsibilitiesThe role of the Audit Committee is to assist the Board in applying the
financial reporting and internal control principles and to maintain an
appropriate relationship with the Auditor. The responsibilities are set
out in formal terms of reference which are regularly reviewed. In the
year under review the main duties undertaken were:
• consideration of the appropriateness of the Company’s
accounting policies;
• a review of the half year results and the Annual Report, including the
disclosures made therein in relation to internal controls and risk
management, viability statement, going concern and related parties
and consideration of whether the Annual Report is fair, balanced
and understandable and provides the information necessary for
shareholders to assess the Company’s position and performance,
business model and strategy in order to make recommendations to
the Board. In assessing whether the Annual Report is fair, balanced
and understandable, each Director reviewed the disclosures made,
applying their respective knowledge and expertise. The internal
controls over financial reporting were also considered together with
feedback from the Company’s Auditor, Fund Manager and the
Corporate Secretary;
• consideration of the Terms of Reference of the Audit Committee;
• consideration of the quality and effectiveness of the accounting
records and management information maintained on behalf of the
Company, relying on meetings with and reports from the Manager;
• consideration of the appropriate level of dividend to be paid by
the Company for recommendation to the Board;
• consideration of the internal controls in place at the Manager and
BNP as administrator and the Manager’s policies in relation to
cyber risk and business continuity, meeting with representatives of
the Manager’s internal audit and risk departments periodically;
• consideration of the key risks, risk management systems in place
and the Company’s risk map;
• consideration of the Company’s anti-bribery policy and review of
the Company’s gifts and hospitality register (the Audit Committee
was satisfied that the Company was in compliance);
• consideration of the Company’s anti-tax evasion policy and was
satisfied that the Company was in compliance;
• consideration of the nature and scope of the external audit and the
findings therefrom;
• annual consideration of whether there is a need for an internal
audit function, in order to make a recommendation to the Board
(as described on page 40);
• consideration of the appointment of the external Auditor, their
effectiveness and their performance and remuneration;
• consideration of the external Auditor’s independence and objectivity
and the provision of any non-audit services (as explained further on
page 45) and the reporting of the external Auditor;
• the Audit Committee Chairman met with the Auditor to discuss the
audit plan and audit results;
• consideration of the whistle blowing policy that the Manager has
put in place for its staff to raise concerns about possible
improprieties, including in relation to the Company, in confidence.
The policy includes the necessary arrangements for independent
investigation and follow up action; and
• consideration of the management fee and the calculation of the
management fee.
44
The Bankers Investment Trust PLC Annual Report 2018
Report of the Audit Committee (continued)
Annual Report for the Year Ended 31 October 2018In relation to the Annual Report for the year ended 31 October 2018 the following significant issues were considered by the Committee:
Significant issue How the issue was addressed
Valuation and
ownership of
the Company’s
investments
The Directors have appointed Janus Henderson to perform the valuation of the assets of the Company in accordance with its
responsibilities under the AIFMD rules. As required under the AIFMD rules, Janus Henderson has adopted a written
valuation policy, which may be modified from time to time. Actively traded investments are valued using stock exchange
prices provided by third party pricing vendors. The portfolio valuation is regularly reviewed by the Committee. Ownership of
listed investments is verified by reconciliation to the Custodian’s records. Investments that are unlisted or not actively
traded are valued using a variety of techniques to determine their fair value; all such valuations are reviewed and
approved by the Directors.
Recognition of
income
Income received has been accounted for in line with the Company’s accounting policies (as set out on page 56)
and was reviewed by the Committee at each meeting to confirm it is in compliance with IFRSs.
The Board reviews at least four times per annum Janus Henderson’s revenue forecasts in support of the Company’s
future dividends. For special dividends where Janus Henderson is required to allocate between revenue and capital,
the Committee reviews the rationale provided and approves the treatment.
Maintaining
internal controls
The Committee has received regular reports on internal controls from Janus Henderson and BNP and their
respective delegates and has had access to the relevant personnel of Janus Henderson who have a responsibility
for risk management and internal audit.
The Committee noted the service auditor’s qualifications in respect of the Janus Henderson assurance report which
covered controls during the reporting period. The Committee sought additional clarification in respect of the report
and is satisfied that none of the exceptions impacted the Company for the year ended 31 October 2018 and that
appropriate actions have been taken to address the issues identified.
The Committee has considered regularly the controls in place to ensure that the regulations for ensuring investment
trust status are observed at all times, receiving supporting documentation from Janus Henderson and BNP.
Audit TenderingAs a Public Interest Entity listed on the London Stock Exchange, the
Company is subject to the mandatory auditor rotation requirements
of the European Union. It will put the external audit out to tender at
least every ten years, and change auditor at least every 20 years.
The last tender process concluded in September 2016 resulting in
Ernst & Young LLP (‘EY’) being appointed as the Auditor. The next
tender will be required no later than 2026.
External Audit, Review and Auditor
Reappointment The Committee discusses the audit process with the Auditor
without representatives of the Manager present and considers the
effectiveness of the audit process after each audit. This is the third
year EY have audited the Company’s Annual Report at which
Matthew Price has been the audit partner.
During the audit, the Committee Chairman liaised with the partner,
Matthew Price, to receive progress updates and reviewed EY’s audit
results prior to the Committee meeting to consider the financial
statements. EY attended this meeting to present their report and
observe the Committee’s review of the financial statements and
internal controls reporting by the Manager.
Based on the Committee’s review of EY’s reporting, interactions with
the audit team throughout the process and our discussions with
representatives of the Manager, the Committee is satisfied with the
effectiveness of the audit provided by EY and that they are
independent of the Company. The Auditor is required to rotate
partners every five years and it is proposed that the current audit
partner will serve until the AGM in 2021.
Policy on Non-Audit ServicesThe provision of non-audit services by the Company’s Auditor is
considered and approved by the Committee on a case by case
basis. The policy set by the Committee, which is kept under review,
ensures that consideration is given to the following factors when
considering the provision of non-audit services by the Auditor:
• the level of non-audit fees paid to the audit firm in relation to the
statutory audit fee;
• whether the audit firm is the most suitable supplier of the relevant
non-audit services;
• the impact on the Auditor’s independence and objectivity and
what safeguards can be put in place to eliminate or reduce any
threat in this regard; and
• the cost-effectiveness of the services.
The Board has determined that the Auditor will not be considered for
the provision of services related to accounting and preparation of the
financial statements, internal audit and custody. Non-audit services
during the year related to additional testing of the Company’s
compliance with its debenture covenants for which the Auditor was
paid £1,500 (2017: £1,500). There were no other non-audit services.
Isobel Sharp
Audit Committee Chairman
15 January 201945
The Bankers Investment Trust PLC Annual Report 2018
Independent Auditor’s Report to the Members of The Bankers Investment Trust PLC
Opinion
We have audited the financial statements of The Bankers Investment Trust PLC for the year ended 31 October 2018 which comprise the
Statement of Comprehensive Income, Statement of Changes in Equity, Statement of Financial Position, the Cash Flow Statement and the
related notes 1 to 24, including a summary of significant accounting policies. The financial reporting framework that has been applied in their
preparation is applicable law and International Financial Reporting Standards (IFRSs) as adopted by the European Union.
In our opinion, the financial statements:
• give a true and fair view of the Company’s affairs as at 31 October 2018 and of its profit for the year then ended;
• have been properly prepared in accordance with IFRSs as adopted by the European Union; and
• have been prepared in accordance with the requirements of the Companies Act 2006.
Basis for opinion We conducted our audit in accordance with International Standards on Auditing (UK) (ISAs (UK)) and applicable law. Our responsibilities
under those standards are further described in the Auditor’s responsibilities for the audit of the financial statements section of our report
below. We are independent of the Company in accordance with the ethical requirements that are relevant to our audit of the financial
statements in the UK, including the FRC’s Ethical Standard as applied to public interest entities, and we have fulfilled our other ethical
responsibilities in accordance with these requirements.
We believe that the audit evidence we have obtained is sufficient and appropriate to provide a basis for our opinion.
Conclusions relating to principal risks, going concern and viability statementWe have nothing to report in respect of the following information in the annual report, in relation to which the ISAs (UK) require us to report to
you whether we have anything material to add or draw attention to:
• the disclosures in the annual report set out on page 28 that describe the principal risks and explain how they are being managed or mitigated;
• the directors’ confirmation set out on page 36 in the annual report that they have carried out a robust assessment of the principal risks facing
the entity, including those that would threaten its business model, future performance, solvency or liquidity;
• the directors’ statement set out on page 55 in the financial statements about whether they considered it appropriate to adopt the going
concern basis of accounting in preparing them, and their identification of any material uncertainties to the entity’s ability to continue to do so
over a period of at least twelve months from the date of approval of the financial statements;
• whether the directors’ statement in relation to going concern required under the Listing Rules in accordance with Listing Rule 9.8.6R(3) is
materially inconsistent with our knowledge obtained in the audit; or
• the directors’ explanation set out on page 29 in the annual report as to how they have assessed the prospects of the entity, over what period
they have done so and why they consider that period to be appropriate, and their statement as to whether they have a reasonable expectation
that the entity will be able to continue in operation and meet its liabilities as they fall due over the period of their assessment, including any
related disclosures drawing attention to any necessary qualifications or assumptions.
Overview of our audit approach
Key audit matters • Inaccurate recognition of investment income (including the risk of
management override of controls).
• Valuation and existence of the investment portfolio including the
current asset investment in the Deutsche Global Liquidity Series
Fund.
Materiality • Overall materiality of £10.62m (2017: £10.78m) which represents
1% of net assets.
Key audit matters
Key audit matters are those matters that, in our professional judgment, were of most significance in our audit of the financial statements of
the current period and include the most significant assessed risks of material misstatement (whether or not due to fraud) that we identified.
These matters included those which had the greatest effect on: the overall audit strategy; the allocation of resources in the audit; and
directing the efforts of the engagement team. These matters were addressed in the context of our audit of the financial statements as a
whole, and in our opinion thereon, and we do not provide a separate opinion on these matters.
46
The Bankers Investment Trust PLC Annual Report 2018
Independent Auditor’s Report to the Members of The Bankers Investment Trust PLC (continued)
Risk Our response to the risk
Key observations
communicated to the
Audit Committee
Inaccurate recognition of investment
income £30.32m (2017: £29.45m)
(As described on page 45 in the Report of
the Audit Committee and as per the
accounting policy set out on page 56).
As can be seen in note 3 in the notes to the
financial statements, the Company has
reported investment income of £30.32
million (2017: £29.45 million). This includes
special dividend income of £0.53m (2017:
£1.08m).
For special dividends the Company
assesses income received and then
determines whether amounts should be
credited to the revenue or capital columns of
the Statement of Comprehensive Income
based on the underlying substance of the
transaction.
We focus on the recognition of revenue and
its presentation in the financial statements
because the revenue return is a key area of
focus for shareholders.
We performed the following procedures:
We obtained an understanding of BNP Paribas Securities
Services’ (“the Administrator” or “BNP”) processes and
controls for the recognition of investment income by
performing walkthrough procedures and reviewing the
Administrator’s internal control reports.
We agreed a sample of 70 dividends received from the
underlying financial records to an independent pricing
source and to the bank.
We agreed all accrued dividends at the period end to post
year-end bank statements and to an independent source for
validation of existence.
We selected a sample of 25 investments from the Company’s
valuation report, checked to an independent source for any
dividends declared by those securities and agreed the
recognition of such dividends to the income report.
We identified no special dividends that were individually
above our testing threshold. We therefore performed a
review of a sample of one special dividend which
represents £0.12m of the £0.53m total. For this dividend
we assessed the appropriateness of the accounting
treatment by reference to publicly available information. All
special dividends were treated as revenue.
To address the risk of management override, we tested a
sample of manual journal entries posted to the income
account during the year, and around the year-end.
The results of our
procedures identified no
issues with the accuracy or
completeness of income
receipts.
There were no material
special dividends received
during the year.
Based on the work
performed, we have no
matters to report.
Valuation and existence of the
investment portfolio including the
current asset investment in the
Deutsche Global Liquidity Series Fund
(As described on page 45 in the Report of
The Audit Committee).
The investment portfolio at the year-end
comprised of quoted equities £1,087.03m
(2017: £1,101.37m) and a current asset
investment in the Deutsche Global Liquidity
Series Fund (£18.01m, 2017: £23.25m).
The investment portfolio at the year-end also
included unquoted investments of £7,000
(2017: £445,000). This investment is below
our reporting threshold.
The valuation of the assets held in the
investment portfolio is the key driver of the
Company’s net asset value and investment
return. Incorrect asset pricing or a failure to
maintain proper legal title of assets by the
Company could have a significant impact on
portfolio valuation and, therefore, the return
generated for shareholders.
We performed the following procedures:
We obtained an understanding of the Administrator’s
processes and controls for the valuation of investments by
performing walkthrough procedures and reviewing the
Administrator’s internal control report.
We agreed all of the quoted investment holding prices at
the year-end to a relevant independent source.
For the current asset investment in the Deutsche Global
Liquidity Series Fund we agreed the holding to the
depositary confirmation, as well as agreeing the valuation of
the investment to an independent pricing source.
The unquoted investment was found to be immaterial.
We checked all the foreign exchange rates applied to an
independent source for reasonableness.
We agreed the number of shares held for each security to a
confirmation of legal title received from the Company’s
custodian and depositary BNP Paribas Securities Services.
The results of our
procedures, of the listed
investment portfolio assets,
identified no material error
in the pricing or
reconciliation.
Based on the work
performed, we have no
matters to report.
47
The Bankers Investment Trust PLC Annual Report 2018
Independent Auditor’s Report to the Members of The Bankers Investment Trust PLC (continued)
An overview of the scope of our audit
Tailoring the scopeOur assessment of audit risk, our evaluation of materiality and our allocation of performance materiality determine our audit scope for the
Company. This enables us to form an opinion on the financial statements. We take into account size, risk profile, the organisation of the
Company and effectiveness of controls, including controls and changes in the business environment, when assessing the level of work to be
performed. We have performed a full scope audit of the Company.
Our application of materiality
We apply the concept of materiality in planning and performing the audit, in evaluating the effect of identified misstatements on the audit and
in forming our audit opinion.
MaterialityThe magnitude of an omission or misstatement that, individually or in the aggregate, could reasonably be expected to influence the economic
decisions of the users of the financial statements. Materiality provides a basis for determining the nature and extent of our audit procedures.
We determined materiality for the Company to be £10.62m (2017: £10.78m), which is 1% (2017: 1%) of net assets. We have derived our
materiality calculation based on a proportion of net assets as we consider it to be the most important financial metric on which shareholders
would judge the performance of the Company.
During the course of our audit, we reassessed initial materiality and found no reason to alter the basis of calculation used at the year-end.
Performance materialityThe application of materiality at the individual account or balance level. It is set at an amount to reduce to an appropriately low level the
probability that the aggregate of uncorrected and undetected misstatements exceeds materiality.
On the basis of our risk assessments, together with our assessment of the Company’s overall control environment, our judgment was that
performance materiality was 75% (2017: 75%) of our planning materiality, namely £7.97m (2017: £8.08m). We have set performance
materiality at this percentage due to our past experience of the audit that indicates a lower risk of misstatements, both corrected and
uncorrected.
Given the importance of the distinction between revenue and capital for the Company we have also applied a separate testing threshold of
£1.36m (2017: £1.38m) for the revenue column of the Statement of Comprehensive Income, being 5% of the return before taxation.
Reporting thresholdAn amount below which identified misstatements are considered as being clearly trivial.
We agreed with the Audit Committee that we would report to them all uncorrected audit differences in excess of £0.53m (2017: £0.54m),
which is set at 5% of planning materiality, as well as differences below that threshold that, in our view, warranted reporting on qualitative
grounds.
We evaluate any uncorrected misstatements against both the quantitative measures of materiality discussed above and in light of other
relevant qualitative considerations in forming our opinion.
Other information
The other information comprises the information included in the annual report set out on pages 1 to 45 and pages 73 to 76, other than the
financial statements and our auditor’s report thereon. The directors are responsible for the other information.
Our opinion on the financial statements does not cover the other information and, except to the extent otherwise explicitly stated in this
report, we do not express any form of assurance conclusion thereon.
In connection with our audit of the financial statements, our responsibility is to read the other information and, in doing so, consider whether
the other information is materially inconsistent with the financial statements or our knowledge obtained in the audit or otherwise appears to
be materially misstated. If we identify such material inconsistencies or apparent material misstatements, we are required to determine
whether there is a material misstatement in the financial statements or a material misstatement of the other information. If, based on the work
we have performed, we conclude that there is a material misstatement of the other information, we are required to report that fact.
We have nothing to report in this regard.
In this context, we also have nothing to report in regard to our responsibility to specifically address the following items in the other
information and to report as uncorrected material misstatements of the other information where we conclude that those items meet the
following conditions:
48
The Bankers Investment Trust PLC Annual Report 2018
Independent Auditor’s Report to the Members of The Bankers Investment Trust PLC (continued)
• Fair, balanced and understandable set out on page 36 – the statement given by the directors that they consider the annual report and
financial statements taken as a whole is fair, balanced and understandable and provides the information necessary for shareholders to
assess the Company’s performance, business model and strategy, is materially inconsistent with our knowledge obtained in the audit; or
• Audit committee reporting set out on pages 44 to 45 – the section describing the work of the Audit Committee does not appropriately
address matters communicated by us to the Audit Committee; or
• Directors’ statement of compliance with the UK Corporate Governance Code set out on pages 39 to 43 – the parts of the
Directors’ Statement required under the Listing Rules relating to the Company’s compliance with the UK Corporate Governance Code
containing provisions specified for review by the auditor in accordance with Listing Rule 9.8.10R(2) do not properly disclose a departure
from a relevant provision of the UK Corporate Governance Code.
Opinions on other matters prescribed by the Companies Act 2006
In our opinion the part of the Directors’ Remuneration Report to be audited has been properly prepared in accordance with the Companies
Act 2006.
In our opinion, based on the work undertaken in the course of the audit:
• the information given in the strategic report and the directors’ report for the financial year for which the financial statements are prepared
is consistent with the financial statements; and
• the strategic report and directors’ report have been prepared in accordance with applicable legal requirements.
Matters on which we are required to report by exception
In the light of the knowledge and understanding of the Company and its environment obtained in the course of the audit, we have not
identified material misstatements in the strategic report or directors’ report.
We have nothing to report in respect of the following matters in relation to which the Companies Act 2006 requires us to report to you if, in
our opinion:
• adequate accounting records have not been kept, or returns adequate for our audit have not been received from branches not visited by
us; or
• the financial statements and the part of the Directors’ Remuneration Report to be audited are not in agreement with the accounting
records and returns; or
• certain disclosures of directors’ remuneration specified by law are not made; or
• we have not received all the information and explanations we require for our audit.
Responsibilities of Directors
As explained more fully in the Directors’ Responsibilities Statement set out on page 36, the directors are responsible for the preparation of
the financial statements and for being satisfied that they give a true and fair view, and for such internal control as the Directors determine is
necessary to enable the preparation of financial statements that are free from material misstatement, whether due to fraud or error.
In preparing the financial statements, the Directors are responsible for assessing the Company’s ability to continue as a going concern,
disclosing, as applicable, matters related to going concern and using the going concern basis of accounting unless the Directors either intend
to liquidate the Company or to cease operations, or have no realistic alternative but to do so.
Auditor’s responsibilities for the audit of the financial statements
Our objectives are to obtain reasonable assurance about whether the financial statements as a whole are free from material misstatement,
whether due to fraud or error, and to issue an auditor’s report that includes our opinion. Reasonable assurance is a high level of assurance,
but is not a guarantee that an audit conducted in accordance with ISAs (UK) will always detect a material misstatement when it exists.
Misstatements can arise from fraud or error and are considered material if, individually or in the aggregate, they could reasonably be expected
to influence the economic decisions of users taken on the basis of these financial statements.
Explanation as to what extent the audit was considered capable of detecting irregularities, including fraud The objectives of our audit, in respect to fraud, are; to identify and assess the risks of material misstatement of the financial statements due
to fraud; to obtain sufficient appropriate audit evidence regarding the assessed risks of material misstatement due to fraud, through designing
and implementing appropriate responses; and to respond appropriately to fraud or suspected fraud identified during the audit. However, the
primary responsibility for the prevention and detection of fraud rests with both those charged with governance of the entity and management.
49
The Bankers Investment Trust PLC Annual Report 2018
Independent Auditor’s Report to the Members of The Bankers Investment Trust PLC (continued)
Our approach was as follows:
• We obtained an understanding of the legal and regulatory
frameworks that are applicable to the Company and determined
that the most significant are the Companies Act 2006, the Listing
Rules, the UK Corporate Governance Code and section 1158 of
the Corporation Tax Act 2010.
• We understood how The Bankers Investment Trust PLC is
complying with those frameworks through discussions with the
Audit Committee and Corporate Secretary and review of the
Company’s documented policies and procedures.
• We assessed the susceptibility of the Company’s financial
statements to material misstatement, including how fraud might
occur, by considering the key risks impacting the financial
statements. We identified a fraud risk with respect to
management override in relation to inappropriate revenue
journals. We noted no issues in agreeing a sample of revenue
journal entries back to the audited income report or through to
the corresponding announcements prepared by the Company.
• Based on this understanding we designed our audit procedures
to identify non-compliance with such laws and regulations. Our
procedures involved review of the reporting to the Directors with
respect to the application of the documented policies and
procedures and review of the financial statements to ensure
compliance with the reporting requirements of the Company.
• We have reviewed that the Company’s control environment and
determined that it is adequate for the size and operating model of
such a listed investment Company.
A further description of our responsibilities for the audit of the
financial statements is located on the Financial Reporting Council’s
website at https://www.frc.org.uk/auditorsresponsibilities.
This description forms part of our auditor’s report.
Other matters we are required to address
• We were appointed by the Company on 17 November 2016 to
audit the financial statements for the year ending 31 October 2016
and subsequent financial periods. We were re-appointed to audit
the financial statements on 25 July 2018.
The period of total uninterrupted engagement including previous
renewals and re-appointments is three years, covering the years
ending 31 October 2016 to 31 October 2018.
• The non-audit services prohibited by the FRC’s Ethical Standard
were not provided to the Company and we remain independent
of the Company in conducting the audit.
• The audit opinion is consistent with the additional report to the
Audit Committee
Use of our report
This report is made solely to the Company’s members, as a body, in
accordance with Chapter 3 of Part 16 of the Companies Act 2006.
Our audit work has been undertaken so that we might state to the
Company’s members those matters we are required to state to them
in an auditor’s report and for no other purpose. To the fullest extent
permitted by law, we do not accept or assume responsibility to
anyone other than the Company and the Company’s members as
a body, for our audit work, for this report, or for the opinions we
have formed.
Matthew Price (Senior statutory auditor)
for and on behalf of Ernst & Young LLP
Statutory Auditor
London
15 January 2019
50
The Bankers Investment Trust PLC Annual Report 2018
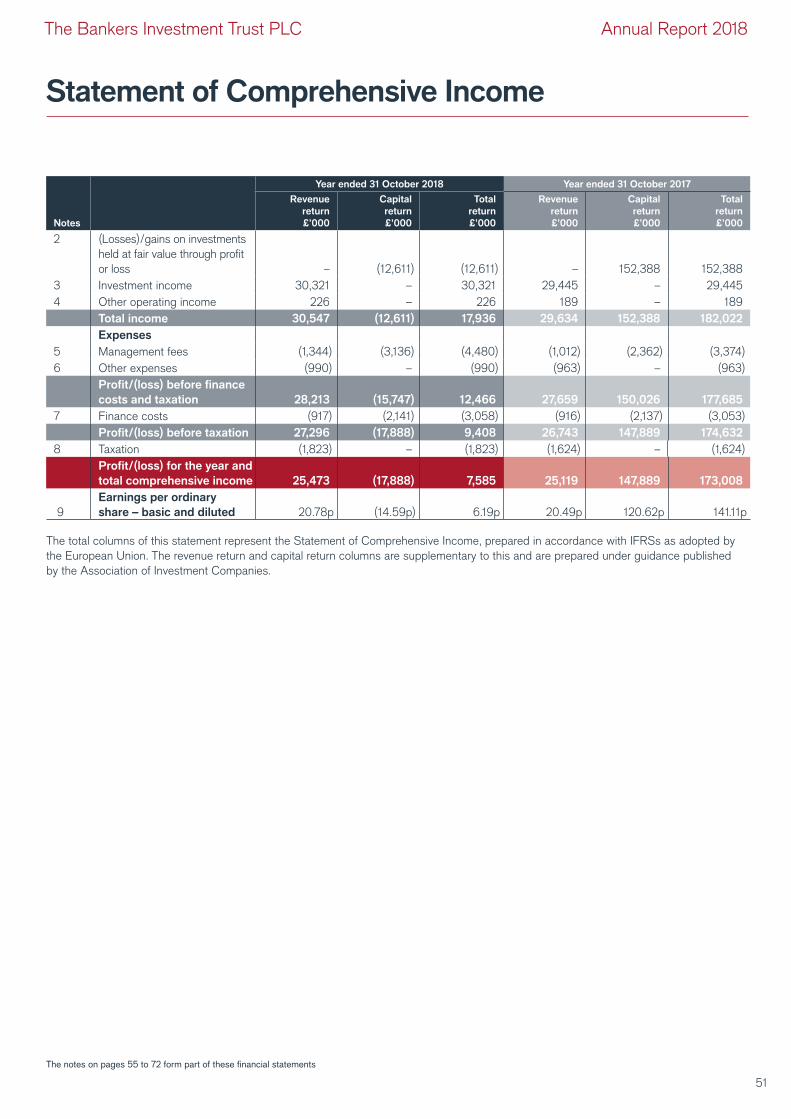
Statement of Comprehensive Income
The notes on pages 55 to 72 form part of these financial statements
Year ended 31 October 2018 Year ended 31 October 2017
Notes
Revenue
return
£’000
Capital
return
£’000
Total
return
£’000
Revenue
return
£’000
Capital
return
£’000
Total
return
£’000
2 (Losses)/gains on investments
held at fair value through profit
or loss – (12,611) (12,611) – 152,388 152,388
3 Investment income 30,321 – 30,321 29,445 – 29,445
4 Other operating income 226 – 226 189 – 189
Total income 30,547 (12,611) 17,936 29,634 152,388 182,022
Expenses
5 Management fees (1,344) (3,136) (4,480) (1,012) (2,362) (3,374)
6 Other expenses (990) – (990) (963) – (963)
Profit/(loss) before finance
costs and taxation 28,213 (15,747) 12,466 27,659 150,026 177,685
7 Finance costs (917) (2,141) (3,058) (916) (2,137) (3,053)
Profit/(loss) before taxation 27,296 (17,888) 9,408 26,743 147,889 174,632
8 Taxation (1,823) – (1,823) (1,624) – (1,624)
Profit/(loss) for the year and
total comprehensive income 25,473 (17,888) 7,585 25,119 147,889 173,008
9
Earnings per ordinary
share – basic and diluted 20.78p (14.59p) 6.19p 20.49p 120.62p 141.11p
The total columns of this statement represent the Statement of Comprehensive Income, prepared in accordance with IFRSs as adopted by
the European Union. The revenue return and capital return columns are supplementary to this and are prepared under guidance published
by the Association of Investment Companies.
51
The Bankers Investment Trust PLC Annual Report 2018
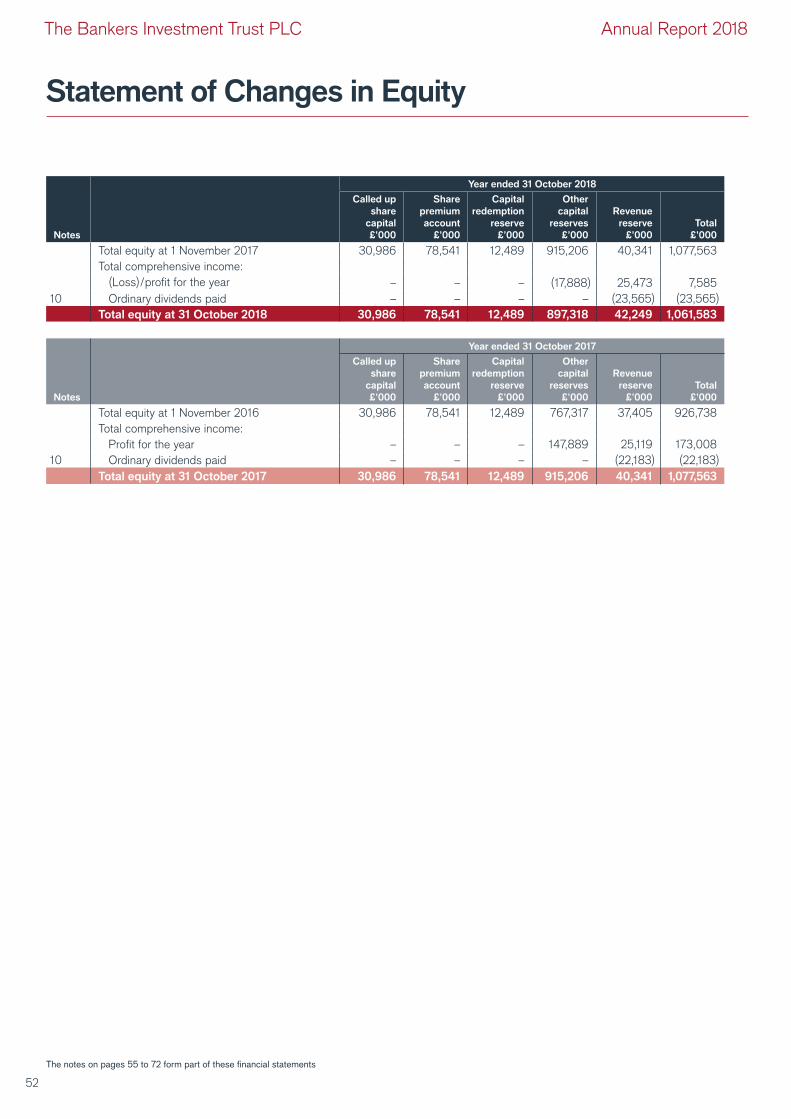
Statement of Changes in Equity
The notes on pages 55 to 72 form part of these financial statements
Year ended 31 October 2018
Notes
Called up
share
capital
£’000
Share
premium
account
£’000
Capital
redemption
reserve
£’000
Other
capital
reserves
£’000
Revenue
reserve
£’000
Total
£’000
Total equity at 1 November 2017 30,986 78,541 12,489 915,206 40,341 1,077,563
Total comprehensive income:
(Loss)/profit for the year – – – (17,888) 25,473 7,585
10 Ordinary dividends paid – – – – (23,565) (23,565)
Total equity at 31 October 2018 30,986 78,541 12,489 897,318 42,249 1,061,583
Year ended 31 October 2017
Notes
Called up
share
capital
£’000
Share
premium
account
£’000
Capital
redemption
reserve
£’000
Other
capital
reserves
£’000
Revenue
reserve
£’000
Total
£’000
Total equity at 1 November 2016 30,986 78,541 12,489 767,317 37,405 926,738
Total comprehensive income:
Profit for the year – – – 147,889 25,119 173,008
10 Ordinary dividends paid – – – – (22,183) (22,183)
Total equity at 31 October 2017 30,986 78,541 12,489 915,206 40,341 1,077,563
52
The Bankers Investment Trust PLC Annual Report 2018
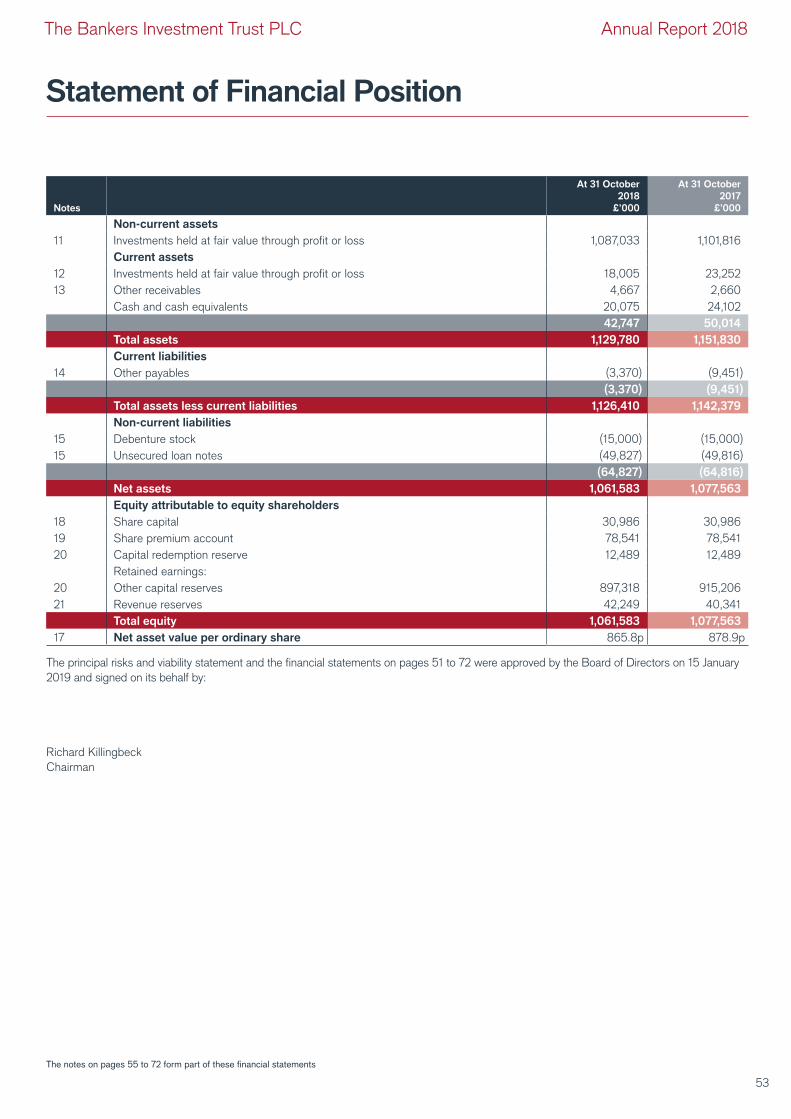
Statement of Financial Position
The notes on pages 55 to 72 form part of these financial statements
Notes
At 31 October
2018
£’000
At 31 October
2017
£’000
Non-current assets
11 Investments held at fair value through profit or loss 1,087,033 1,101,816
Current assets
12 Investments held at fair value through profit or loss 18,005 23,252
13 Other receivables 4,667 2,660
Cash and cash equivalents 20,075 24,102
42,747 50,014
Total assets 1,129,780 1,151,830
Current liabilities
14 Other payables (3,370) (9,451)
(3,370) (9,451)
Total assets less current liabilities 1,126,410 1,142,379
Non-current liabilities
15 Debenture stock (15,000) (15,000)
15 Unsecured loan notes (49,827) (49,816)
(64,827) (64,816)
Net assets 1,061,583 1,077,563
Equity attributable to equity shareholders
18 Share capital 30,986 30,986
19 Share premium account 78,541 78,541
20 Capital redemption reserve 12,489 12,489
Retained earnings:
20 Other capital reserves 897,318 915,206
21 Revenue reserves 42,249 40,341
Total equity 1,061,583 1,077,563
17 Net asset value per ordinary share 865.8p 878.9p
The principal risks and viability statement and the financial statements on pages 51 to 72 were approved by the Board of Directors on 15 January
2019 and signed on its behalf by:
Richard Killingbeck
Chairman
53
The Bankers Investment Trust PLC Annual Report 2018
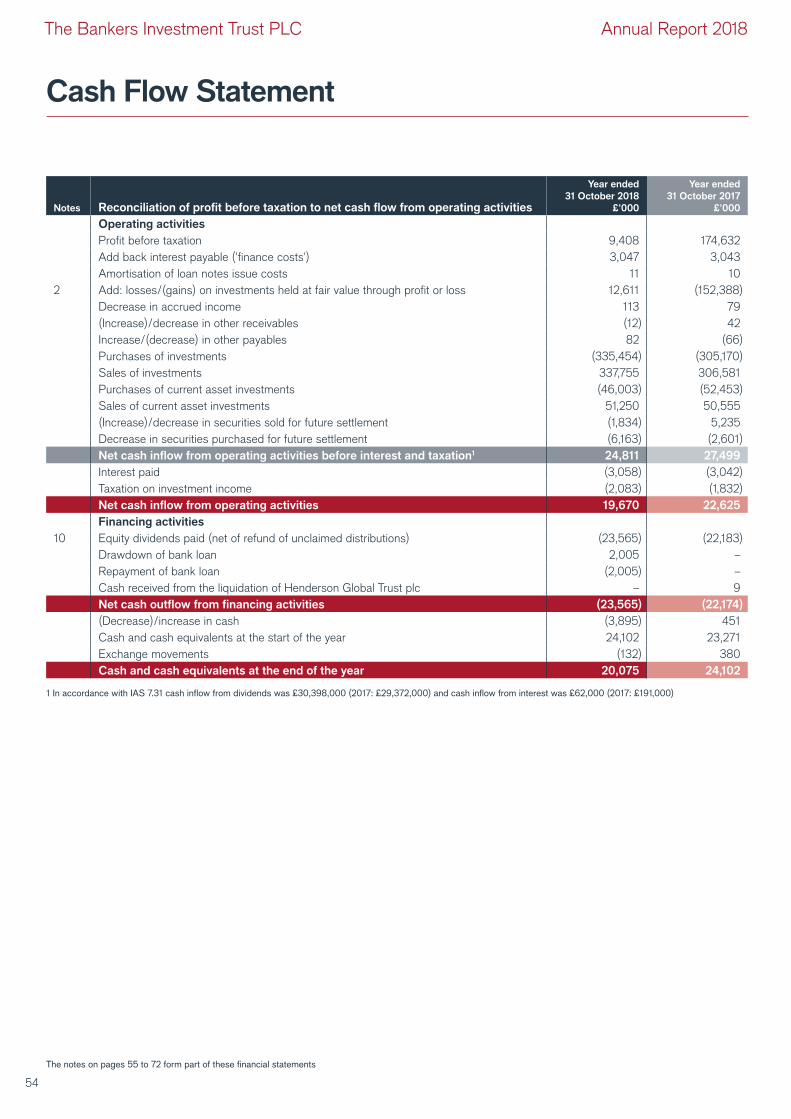
Cash Flow Statement
The notes on pages 55 to 72 form part of these financial statements
Notes Reconciliation of profit before taxation to net cash flow from operating activities
Year ended
31 October 2018
£’000
Year ended
31 October 2017
£’000
Operating activities
Profit before taxation 9,408 174,632
Add back interest payable ('finance costs') 3,047 3,043
Amortisation of loan notes issue costs 11 10
2 Add: losses/(gains) on investments held at fair value through profit or loss 12,611 (152,388)
Decrease in accrued income 113 79
(Increase)/decrease in other receivables (12) 42
Increase/(decrease) in other payables 82 (66)
Purchases of investments (335,454) (305,170)
Sales of investments 337,755 306,581
Purchases of current asset investments (46,003) (52,453)
Sales of current asset investments 51,250 50,555
(Increase)/decrease in securities sold for future settlement (1,834) 5,235
Decrease in securities purchased for future settlement (6,163) (2,601)
Net cash inflow from operating activities before interest and taxation1 24,811 27,499
Interest paid (3,058) (3,042)
Taxation on investment income (2,083) (1,832)
Net cash inflow from operating activities 19,670 22,625
Financing activities
10 Equity dividends paid (net of refund of unclaimed distributions) (23,565) (22,183)
Drawdown of bank loan 2,005 –
Repayment of bank loan (2,005) –
Cash received from the liquidation of Henderson Global Trust plc – 9
Net cash outflow from financing activities (23,565) (22,174)
(Decrease)/increase in cash (3,895) 451
Cash and cash equivalents at the start of the year 24,102 23,271
Exchange movements (132) 380
Cash and cash equivalents at the end of the year 20,075 24,102
1 In accordance with IAS 7.31 cash inflow from dividends was £30,398,000 (2017: £29,372,000) and cash inflow from interest was £62,000 (2017: £191,000)
54
The Bankers Investment Trust PLC Annual Report 2018
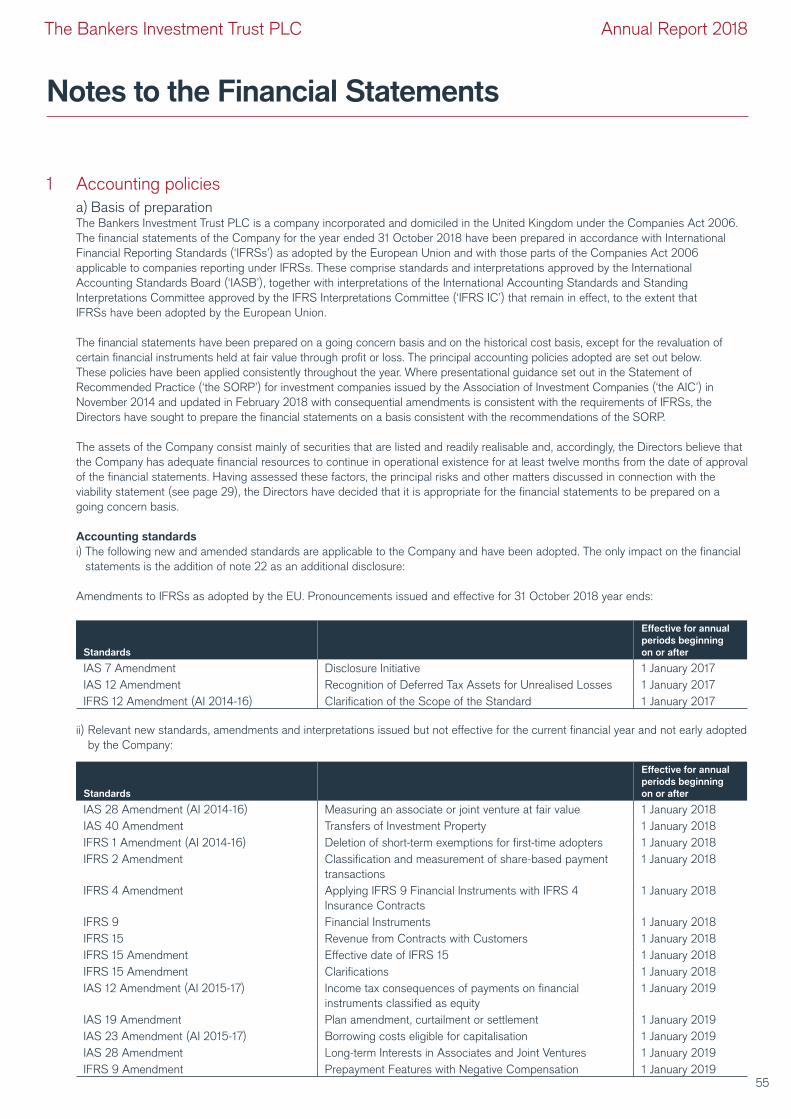
Notes to the Financial Statements
1 Accounting policies
a) Basis of preparation The Bankers Investment Trust PLC is a company incorporated and domiciled in the United Kingdom under the Companies Act 2006.
The financial statements of the Company for the year ended 31 October 2018 have been prepared in accordance with International
Financial Reporting Standards (‘IFRSs’) as adopted by the European Union and with those parts of the Companies Act 2006
applicable to companies reporting under IFRSs. These comprise standards and interpretations approved by the International
Accounting Standards Board (‘IASB’), together with interpretations of the International Accounting Standards and Standing
Interpretations Committee approved by the IFRS Interpretations Committee (‘IFRS IC’) that remain in effect, to the extent that
IFRSs have been adopted by the European Union.
The financial statements have been prepared on a going concern basis and on the historical cost basis, except for the revaluation of
certain financial instruments held at fair value through profit or loss. The principal accounting policies adopted are set out below.
These policies have been applied consistently throughout the year. Where presentational guidance set out in the Statement of
Recommended Practice (‘the SORP’) for investment companies issued by the Association of Investment Companies (‘the AIC’) in
November 2014 and updated in February 2018 with consequential amendments is consistent with the requirements of IFRSs, the
Directors have sought to prepare the financial statements on a basis consistent with the recommendations of the SORP.
The assets of the Company consist mainly of securities that are listed and readily realisable and, accordingly, the Directors believe that
the Company has adequate financial resources to continue in operational existence for at least twelve months from the date of approval
of the financial statements. Having assessed these factors, the principal risks and other matters discussed in connection with the
viability statement (see page 29), the Directors have decided that it is appropriate for the financial statements to be prepared on a
going concern basis.
Accounting standards
i) The following new and amended standards are applicable to the Company and have been adopted. The only impact on the financial
statements is the addition of note 22 as an additional disclosure:
Amendments to IFRSs as adopted by the EU. Pronouncements issued and effective for 31 October 2018 year ends:
Standards
Effective for annual
periods beginning
on or after
IAS 7 Amendment Disclosure Initiative 1 January 2017
IAS 12 Amendment Recognition of Deferred Tax Assets for Unrealised Losses 1 January 2017
IFRS 12 Amendment (AI 2014-16) Clarification of the Scope of the Standard 1 January 2017
ii) Relevant new standards, amendments and interpretations issued but not effective for the current financial year and not early adopted
by the Company:
Standards
Effective for annual
periods beginning
on or after
IAS 28 Amendment (AI 2014-16) Measuring an associate or joint venture at fair value 1 January 2018
IAS 40 Amendment Transfers of Investment Property 1 January 2018
IFRS 1 Amendment (AI 2014-16) Deletion of short-term exemptions for first-time adopters 1 January 2018
IFRS 2 Amendment Classification and measurement of share-based payment
transactions
1 January 2018
IFRS 4 Amendment Applying IFRS 9 Financial Instruments with IFRS 4
Insurance Contracts
1 January 2018
IFRS 9 Financial Instruments 1 January 2018
IFRS 15 Revenue from Contracts with Customers 1 January 2018
IFRS 15 Amendment Effective date of IFRS 15 1 January 2018
IFRS 15 Amendment Clarifications 1 January 2018
IAS 12 Amendment (AI 2015-17) Income tax consequences of payments on financial
instruments classified as equity
1 January 2019
IAS 19 Amendment Plan amendment, curtailment or settlement 1 January 2019
IAS 23 Amendment (AI 2015-17) Borrowing costs eligible for capitalisation 1 January 2019
IAS 28 Amendment Long-term Interests in Associates and Joint Ventures 1 January 2019
IFRS 9 Amendment Prepayment Features with Negative Compensation 1 January 201955
The Bankers Investment Trust PLC Annual Report 2018
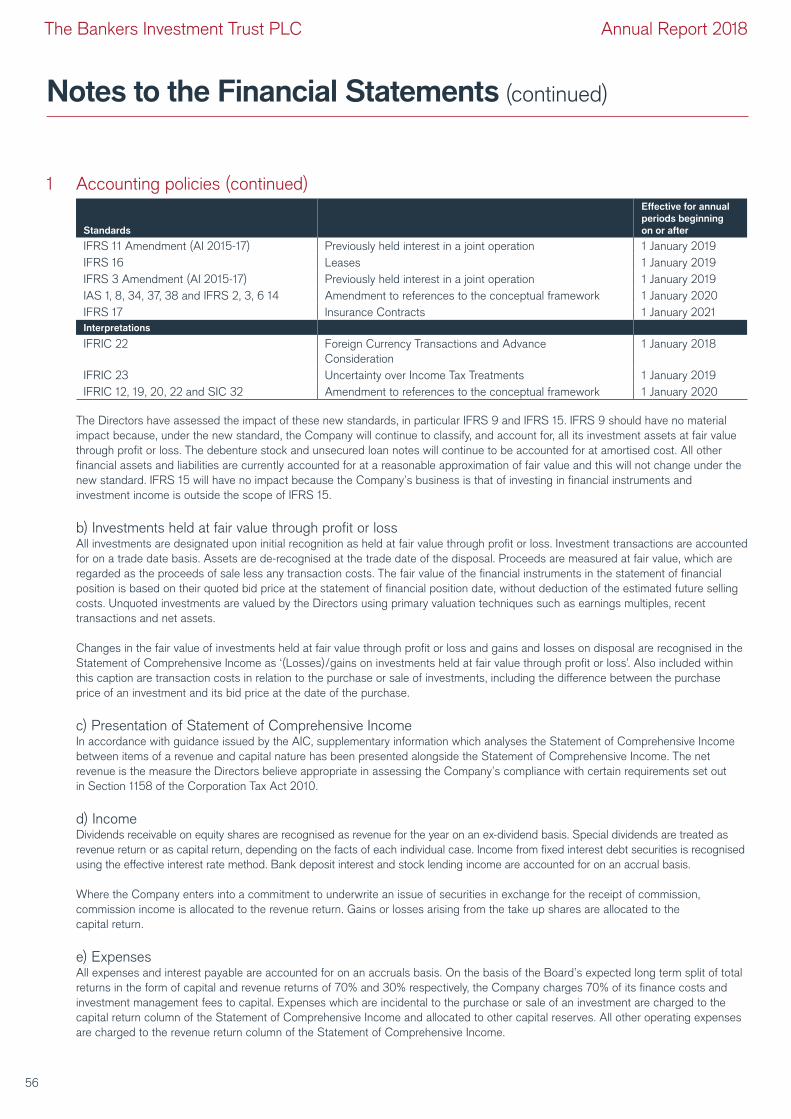
Notes to the Financial Statements (continued)
Standards
Effective for annual
periods beginning
on or after
IFRS 11 Amendment (AI 2015-17) Previously held interest in a joint operation 1 January 2019
IFRS 16 Leases 1 January 2019
IFRS 3 Amendment (AI 2015-17) Previously held interest in a joint operation 1 January 2019
IAS 1, 8, 34, 37, 38 and IFRS 2, 3, 6 14 Amendment to references to the conceptual framework 1 January 2020
IFRS 17 Insurance Contracts 1 January 2021
Interpretations
IFRIC 22 Foreign Currency Transactions and Advance
Consideration
1 January 2018
IFRIC 23 Uncertainty over Income Tax Treatments 1 January 2019
IFRIC 12, 19, 20, 22 and SIC 32 Amendment to references to the conceptual framework 1 January 2020
The Directors have assessed the impact of these new standards, in particular IFRS 9 and IFRS 15. IFRS 9 should have no material
impact because, under the new standard, the Company will continue to classify, and account for, all its investment assets at fair value
through profit or loss. The debenture stock and unsecured loan notes will continue to be accounted for at amortised cost. All other
financial assets and liabilities are currently accounted for at a reasonable approximation of fair value and this will not change under the
new standard. IFRS 15 will have no impact because the Company’s business is that of investing in financial instruments and
investment income is outside the scope of IFRS 15.
b) Investments held at fair value through profit or lossAll investments are designated upon initial recognition as held at fair value through profit or loss. Investment transactions are accounted
for on a trade date basis. Assets are de-recognised at the trade date of the disposal. Proceeds are measured at fair value, which are
regarded as the proceeds of sale less any transaction costs. The fair value of the financial instruments in the statement of financial
position is based on their quoted bid price at the statement of financial position date, without deduction of the estimated future selling
costs. Unquoted investments are valued by the Directors using primary valuation techniques such as earnings multiples, recent
transactions and net assets.
Changes in the fair value of investments held at fair value through profit or loss and gains and losses on disposal are recognised in the
Statement of Comprehensive Income as ‘(Losses)/gains on investments held at fair value through profit or loss’. Also included within
this caption are transaction costs in relation to the purchase or sale of investments, including the difference between the purchase
price of an investment and its bid price at the date of the purchase.
c) Presentation of Statement of Comprehensive IncomeIn accordance with guidance issued by the AIC, supplementary information which analyses the Statement of Comprehensive Income
between items of a revenue and capital nature has been presented alongside the Statement of Comprehensive Income. The net
revenue is the measure the Directors believe appropriate in assessing the Company’s compliance with certain requirements set out
in Section 1158 of the Corporation Tax Act 2010.
d) IncomeDividends receivable on equity shares are recognised as revenue for the year on an ex-dividend basis. Special dividends are treated as
revenue return or as capital return, depending on the facts of each individual case. Income from fixed interest debt securities is recognised
using the effective interest rate method. Bank deposit interest and stock lending income are accounted for on an accrual basis.
Where the Company enters into a commitment to underwrite an issue of securities in exchange for the receipt of commission,
commission income is allocated to the revenue return. Gains or losses arising from the take up shares are allocated to the
capital return.
e) ExpensesAll expenses and interest payable are accounted for on an accruals basis. On the basis of the Board’s expected long term split of total
returns in the form of capital and revenue returns of 70% and 30% respectively, the Company charges 70% of its finance costs and
investment management fees to capital. Expenses which are incidental to the purchase or sale of an investment are charged to the
capital return column of the Statement of Comprehensive Income and allocated to other capital reserves. All other operating expenses
are charged to the revenue return column of the Statement of Comprehensive Income.
1 Accounting policies (continued)
56
The Bankers Investment Trust PLC Annual Report 2018
Notes to the Financial Statements (continued)
f) TaxationThe tax expense represents the sum of the tax currently payable and deferred tax.
The tax currently payable is based on the taxable profit for the year. Taxable profit differs from net profit as reported in the Statement
of Comprehensive Income because it excludes items of income or expense that are taxable or deductible in other years and it further
excludes items that are never taxable or deductible. The liability for current tax is calculated using the applicable rate of corporation tax
for the accounting period.
In line with the recommendations of the SORP, the allocation method used to calculate tax relief on expenses presented against capital
returns in the supplementary information in the Statement of Comprehensive Income is the ‘marginal basis’. Under this basis, if taxable
income is capable of being offset entirely by expenses presented in the revenue return column of the Statement of Comprehensive
Income, then no tax relief is transferred to the capital return column.
Deferred tax is the tax expected to be payable or recoverable on differences between the carrying amounts of assets and liabilities in
the financial statements and the corresponding tax bases used in the computation of taxable profit, and is accounted for using the
Statement of Financial Position liability method. Deferred tax liabilities are recognised for all taxable temporary differences and deferred
tax assets are recognised to the extent that it is probable that taxable profits will be available against which deductible temporary
differences can be utilised. Investment trusts which have approval as such under Section 1158 of the Corporation Tax Act 2010 are
not liable for taxation on capital gains.
The carrying amount of deferred tax assets is reviewed at each Statement of Financial Position date.
Deferred tax is calculated at the tax rates that are expected to apply in the period when the liability is settled or the asset is realised.
Deferred tax is charged or credited in the Statement of Comprehensive Income, except when it relates to items charged or credited
directly to equity, in which case the deferred tax is also dealt with in equity.
g) Dividends payable to shareholdersDividends payable to shareholders are recognised in the financial statements when they are paid or, in the case of final dividends, when
they are approved by shareholders. Dividends paid are disclosed in the Statement of Changes in Equity.
h) Foreign currencyFor the purposes of the financial statements, the results and financial position is expressed in pounds sterling, which is the functional
currency of the Company and the presentational currency of the Company. Sterling is the functional currency because it is the currency
of the primary economic environment in which the Company operates.
Transactions recorded in overseas currencies during the year are translated into sterling at the appropriate daily exchange rates.
Monetary assets and liabilities and equity investments held at fair value through profit or loss that are denominated in overseas
currencies at the Statement of Financial Position date are translated into sterling at the exchange rates ruling at that date. Exchange
gains and losses on investments held at fair value through profit or loss are included within ‘(Losses)/gains on investments held at fair
value through profit or loss’.
i) Cash and cash equivalentsCash comprises cash in hand and on demand deposits. Cash equivalents are short-term, highly liquid investments that are readily
convertible to known amounts of cash and that are subject to an insignificant risk of changes in value.
j) BorrowingsInterest-bearing bank loans, overdrafts, debentures and loan notes are recorded initially at fair value, being the proceeds received, net
of direct issue costs. They are subsequently measured at amortised cost. Finance costs and direct issue costs are accounted for on
an accruals basis in the Statement of Comprehensive Income using the effective interest rate method and are added to the carrying
amount of the instrument to the extent that they are not settled in the period in which they arise.
k) Repurchase of ordinary sharesThe cost of repurchasing ordinary shares including related stamp duty and transaction costs are taken directly to equity and disclosed
in the Statement of Changes in Equity. Share repurchase transactions are accounted for on a trade date basis. The nominal value of
ordinary share capital repurchased and cancelled is transferred out of called-up share capital and into the capital redemption reserve.
1 Accounting policies (continued)
57
The Bankers Investment Trust PLC Annual Report 2018
Notes to the Financial Statements (continued)
l) Capital and other reserves
Capital reserve arising on investments sold
The following are accounted for in this reserve:
• gains and losses on the disposals of investments;
• expenses and finance costs allocated to capital net of tax relief;
• realised foreign exchange differences of a capital nature; and
• costs of repurchasing ordinary share capital.
Capital reserve arising on revaluation of investments held
The following are accounted for in this reserve:
• increases and decreases in the valuation of investments held at the year end; and
• unrealised foreign exchange differences of a capital nature.
Revenue reserve
The revenue reserve represents accumulated revenue profits retained by the Company that have not currently been distributed to
shareholders as a dividend.
Capital redemption reserve
The capital redemption reserve represents the nominal value of ordinary shares repurchased and cancelled.
Share capital
Share capital represents the nominal value of ordinary shares in issue.
Share premium
The share premium account represents the premium above nominal value received by the Company on issuing shares net of issue costs.
m) Distributable reservesThe Company’s capital reserve arising on investments sold and revenue reserve may be distributed by way of a dividend.
n) Key estimates and assumptionsEstimates and assumptions used in preparing the financial statements are reviewed on an ongoing basis and are based on historical
experience and various other factors that are believed to be reasonable under the circumstances. The results of these estimates and
assumptions form the basis of making judgments about carrying values of assets and liabilities that are not readily apparent from other
sources.
There are no estimates and assumptions that may cause material adjustment to the carrying value of assets and liabilities.
o) ReceivablesReceivables are amounts due from securities sold for future settlement, withholding tax recoverable, prepayments and accrued income
in the ordinary course of business. If collection is expected in one year or less (or in the normal operating cycle of the business if
longer), they are classified as current assets. If not, they are presented as non-current assets. Receivables are recognised initially at fair
value based on contractual settlement amounts and subsequently measured at amortised cost using the effective interest rate method.
p) PayablesTrade payables are obligations to pay for securities purchased for future settlement, accruals and deferred income that have been
acquired/incurred in the ordinary course of business. Accounts payable are classified as current liabilities if payment is due within
one year or less (or in the normal operating cycle of the business if longer). If not, they are presented as non-current liabilities. Trade
payables are recognised initially at fair value based on contractual settlement amounts and subsequently measured at amortised
cost using the effective interest rate method.
1 Accounting policies (continued)
58
The Bankers Investment Trust PLC Annual Report 2018
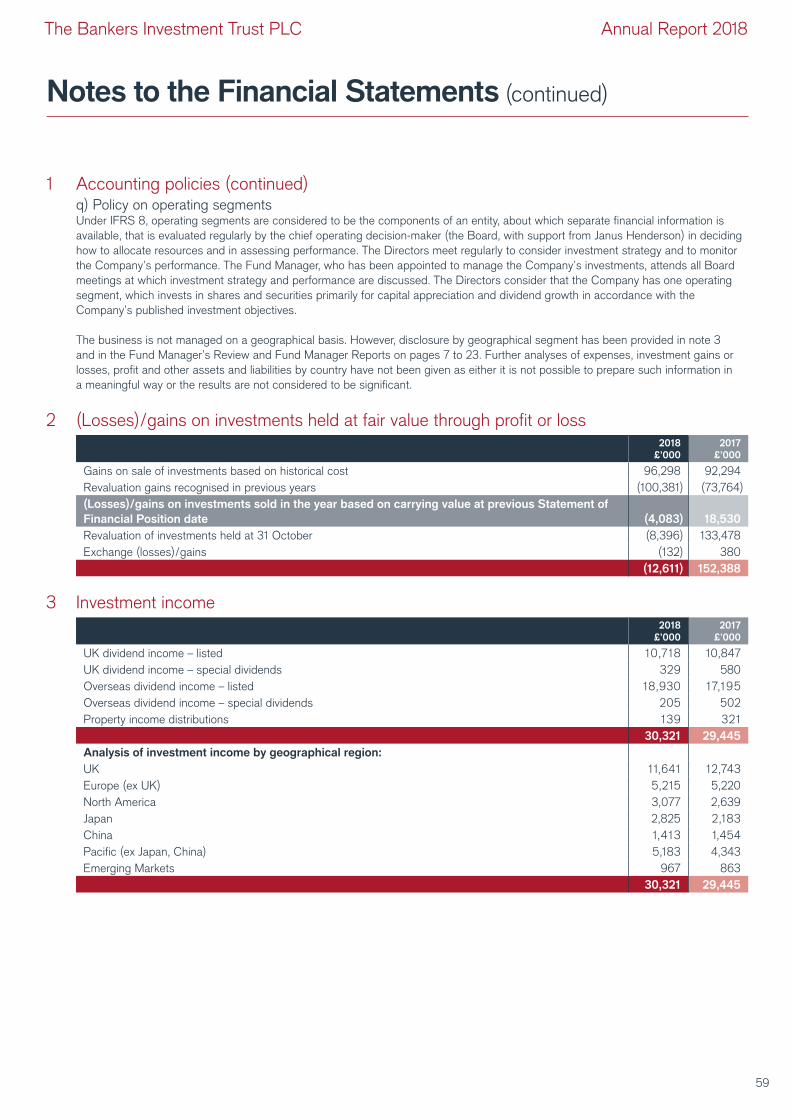
Notes to the Financial Statements (continued)
q) Policy on operating segmentsUnder IFRS 8, operating segments are considered to be the components of an entity, about which separate financial information is
available, that is evaluated regularly by the chief operating decision-maker (the Board, with support from Janus Henderson) in deciding
how to allocate resources and in assessing performance. The Directors meet regularly to consider investment strategy and to monitor
the Company’s performance. The Fund Manager, who has been appointed to manage the Company’s investments, attends all Board
meetings at which investment strategy and performance are discussed. The Directors consider that the Company has one operating
segment, which invests in shares and securities primarily for capital appreciation and dividend growth in accordance with the
Company’s published investment objectives.
The business is not managed on a geographical basis. However, disclosure by geographical segment has been provided in note 3
and in the Fund Manager’s Review and Fund Manager Reports on pages 7 to 23. Further analyses of expenses, investment gains or
losses, profit and other assets and liabilities by country have not been given as either it is not possible to prepare such information in
a meaningful way or the results are not considered to be significant.
2 (Losses)/gains on investments held at fair value through profit or loss2018
£’000
2017
£’000
Gains on sale of investments based on historical cost 96,298 92,294
Revaluation gains recognised in previous years (100,381) (73,764)
(Losses)/gains on investments sold in the year based on carrying value at previous Statement of
Financial Position date (4,083) 18,530
Revaluation of investments held at 31 October (8,396) 133,478
Exchange (losses)/gains (132) 380
(12,611) 152,388
3 Investment income2018
£’000
2017
£’000
UK dividend income – listed 10,718 10,847
UK dividend income – special dividends 329 580
Overseas dividend income – listed 18,930 17,195
Overseas dividend income – special dividends 205 502
Property income distributions 139 321
30,321 29,445
Analysis of investment income by geographical region:
UK 11,641 12,743
Europe (ex UK) 5,215 5,220
North America 3,077 2,639
Japan 2,825 2,183
China 1,413 1,454
Pacific (ex Japan, China) 5,183 4,343
Emerging Markets 967 863
30,321 29,445
1 Accounting policies (continued)
59
The Bankers Investment Trust PLC Annual Report 2018
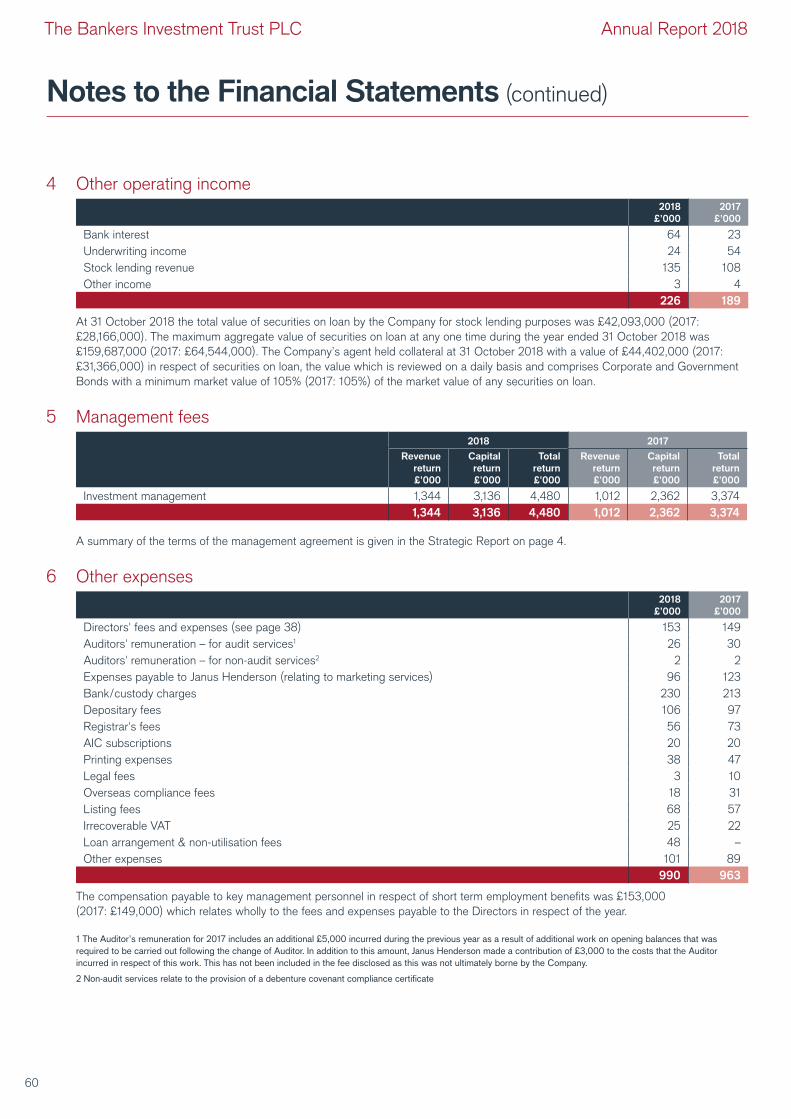
Notes to the Financial Statements (continued)
4 Other operating income2018
£’000
2017
£’000
Bank interest 64 23
Underwriting income 24 54
Stock lending revenue 135 108
Other income 3 4
226 189
At 31 October 2018 the total value of securities on loan by the Company for stock lending purposes was £42,093,000 (2017:
£28,166,000). The maximum aggregate value of securities on loan at any one time during the year ended 31 October 2018 was
£159,687,000 (2017: £64,544,000). The Company’s agent held collateral at 31 October 2018 with a value of £44,402,000 (2017:
£31,366,000) in respect of securities on loan, the value which is reviewed on a daily basis and comprises Corporate and Government
Bonds with a minimum market value of 105% (2017: 105%) of the market value of any securities on loan.
5 Management fees
2018 2017
Revenue
return
£’000
Capital
return
£’000
Total
return
£’000
Revenue
return
£’000
Capital
return
£’000
Total
return
£’000
Investment management 1,344 3,136 4,480 1,012 2,362 3,374
1,344 3,136 4,480 1,012 2,362 3,374
A summary of the terms of the management agreement is given in the Strategic Report on page 4.
6 Other expenses2018
£’000
2017
£’000
Directors' fees and expenses (see page 38) 153 149
Auditors' remuneration – for audit services1 26 30
Auditors' remuneration – for non-audit services2 2 2
Expenses payable to Janus Henderson (relating to marketing services) 96 123
Bank/custody charges 230 213
Depositary fees 106 97
Registrar's fees 56 73
AIC subscriptions 20 20
Printing expenses 38 47
Legal fees 3 10
Overseas compliance fees 18 31
Listing fees 68 57
Irrecoverable VAT 25 22
Loan arrangement & non-utilisation fees 48 –
Other expenses 101 89
990 963
The compensation payable to key management personnel in respect of short term employment benefits was £153,000
(2017: £149,000) which relates wholly to the fees and expenses payable to the Directors in respect of the year.
1 The Auditor’s remuneration for 2017 includes an additional £5,000 incurred during the previous year as a result of additional work on opening balances that was
required to be carried out following the change of Auditor. In addition to this amount, Janus Henderson made a contribution of £3,000 to the costs that the Auditor
incurred in respect of this work. This has not been included in the fee disclosed as this was not ultimately borne by the Company.
2 Non-audit services relate to the provision of a debenture covenant compliance certificate
60
The Bankers Investment Trust PLC Annual Report 2018
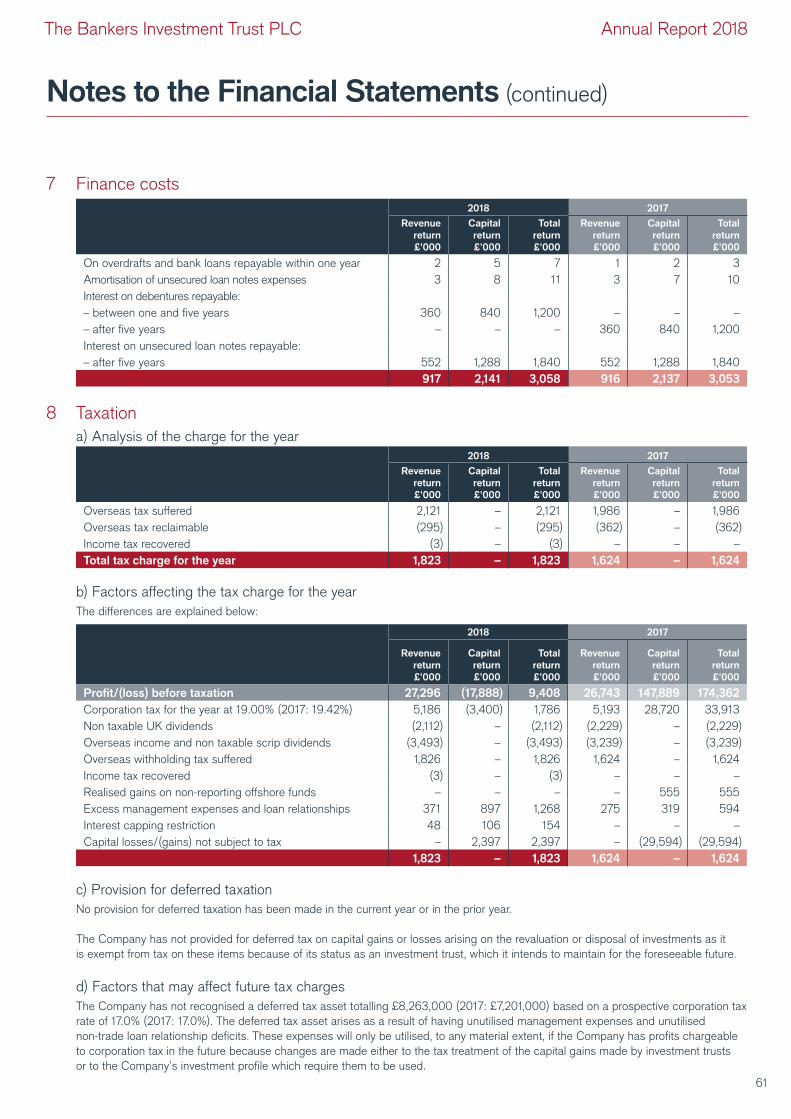
Notes to the Financial Statements (continued)
7 Finance costs
2018 2017
Revenue
return
£’000
Capital
return
£’000
Total
return
£’000
Revenue
return
£’000
Capital
return
£’000
Total
return
£’000
On overdrafts and bank loans repayable within one year 2 5 7 1 2 3
Amortisation of unsecured loan notes expenses 3 8 11 3 7 10
Interest on debentures repayable:
– between one and five years 360 840 1,200 – – –
– after five years – – – 360 840 1,200
Interest on unsecured loan notes repayable:
– after five years 552 1,288 1,840 552 1,288 1,840
917 2,141 3,058 916 2,137 3,053
8 Taxation
a) Analysis of the charge for the year
2018 2017
Revenue
return
£’000
Capital
return
£’000
Total
return
£’000
Revenue
return
£’000
Capital
return
£’000
Total
return
£’000
Overseas tax suffered 2,121 – 2,121 1,986 – 1,986
Overseas tax reclaimable (295) – (295) (362) – (362)
Income tax recovered (3) – (3) – – –
Total tax charge for the year 1,823 – 1,823 1,624 – 1,624
b) Factors affecting the tax charge for the year
The differences are explained below:
2018 2017
Revenue
return
£’000
Capital
return
£’000
Total
return
£’000
Revenue
return
£’000
Capital
return
£’000
Total
return
£’000
Profit/(loss) before taxation 27,296 (17,888) 9,408 26,743 147,889 174,362
Corporation tax for the year at 19.00% (2017: 19.42%) 5,186 (3,400) 1,786 5,193 28,720 33,913
Non taxable UK dividends (2,112) – (2,112) (2,229) – (2,229)
Overseas income and non taxable scrip dividends (3,493) – (3,493) (3,239) – (3,239)
Overseas withholding tax suffered 1,826 – 1,826 1,624 – 1,624
Income tax recovered (3) – (3) – – –
Realised gains on non-reporting offshore funds – – – – 555 555
Excess management expenses and loan relationships 371 897 1,268 275 319 594
Interest capping restriction 48 106 154 – – –
Capital losses/(gains) not subject to tax – 2,397 2,397 – (29,594) (29,594)
1,823 – 1,823 1,624 – 1,624
c) Provision for deferred taxation
No provision for deferred taxation has been made in the current year or in the prior year.
The Company has not provided for deferred tax on capital gains or losses arising on the revaluation or disposal of investments as it
is exempt from tax on these items because of its status as an investment trust, which it intends to maintain for the foreseeable future.
d) Factors that may affect future tax charges
The Company has not recognised a deferred tax asset totalling £8,263,000 (2017: £7,201,000) based on a prospective corporation tax
rate of 17.0% (2017: 17.0%). The deferred tax asset arises as a result of having unutilised management expenses and unutilised
non-trade loan relationship deficits. These expenses will only be utilised, to any material extent, if the Company has profits chargeable
to corporation tax in the future because changes are made either to the tax treatment of the capital gains made by investment trusts
or to the Company’s investment profile which require them to be used.
61
The Bankers Investment Trust PLC Annual Report 2018
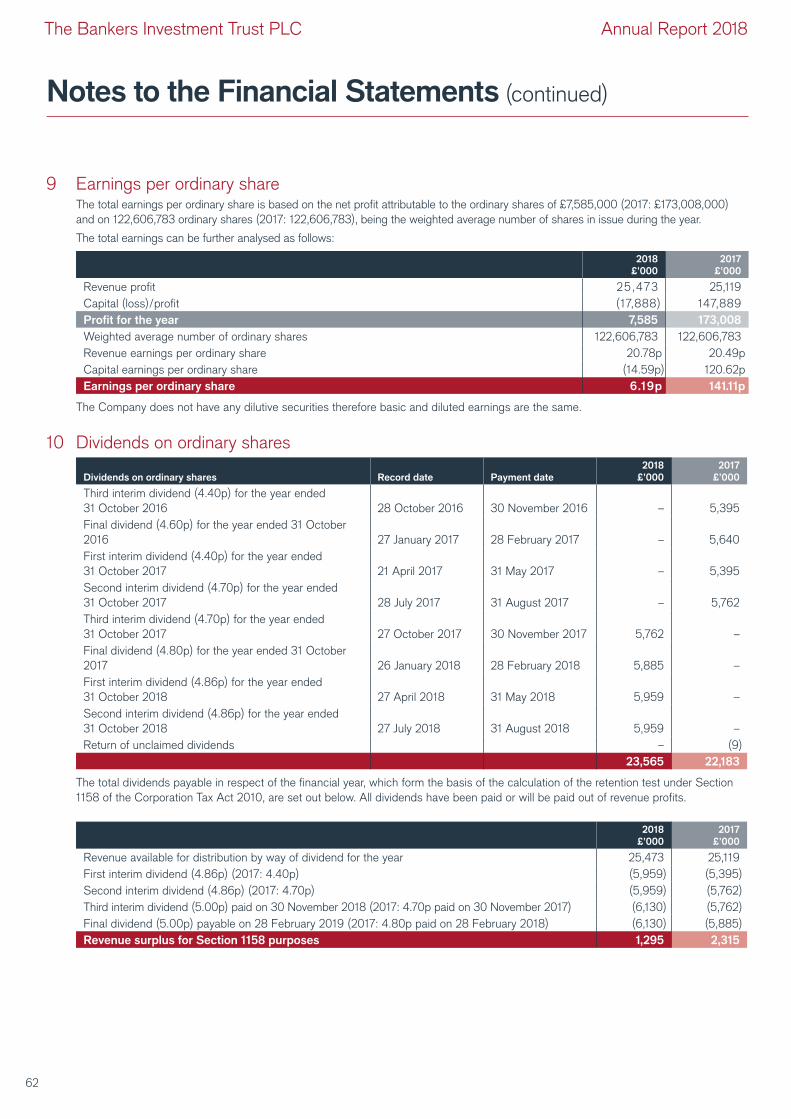
Notes to the Financial Statements (continued)
9 Earnings per ordinary share The total earnings per ordinary share is based on the net profit attributable to the ordinary shares of £7,585,000 (2017: £173,008,000)
and on 122,606,783 ordinary shares (2017: 122,606,783), being the weighted average number of shares in issue during the year.
The total earnings can be further analysed as follows:
2018
£’000
2017
£’000
Revenue profit 25,473 25,119
Capital (loss)/profit (17,888) 147,889
Profit for the year 7,585 173,008
Weighted average number of ordinary shares 122,606,783 122,606,783
Revenue earnings per ordinary share 20.78p 20.49p
Capital earnings per ordinary share (14.59p) 120.62p
Earnings per ordinary share 6.19p 141.11p
The Company does not have any dilutive securities therefore basic and diluted earnings are the same.
10 Dividends on ordinary shares
Dividends on ordinary shares Record date Payment date
2018
£’000
2017
£’000
Third interim dividend (4.40p) for the year ended
31 October 2016 28 October 2016 30 November 2016 – 5,395
Final dividend (4.60p) for the year ended 31 October
2016 27 January 2017 28 February 2017 – 5,640
First interim dividend (4.40p) for the year ended
31 October 2017 21 April 2017 31 May 2017 – 5,395
Second interim dividend (4.70p) for the year ended
31 October 2017 28 July 2017 31 August 2017 – 5,762
Third interim dividend (4.70p) for the year ended
31 October 2017 27 October 2017 30 November 2017 5,762 –
Final dividend (4.80p) for the year ended 31 October
2017 26 January 2018 28 February 2018 5,885 –
First interim dividend (4.86p) for the year ended
31 October 2018 27 April 2018 31 May 2018 5,959 –
Second interim dividend (4.86p) for the year ended
31 October 2018 27 July 2018 31 August 2018 5,959 –
Return of unclaimed dividends – (9)
23,565 22,183
The total dividends payable in respect of the financial year, which form the basis of the calculation of the retention test under Section
1158 of the Corporation Tax Act 2010, are set out below. All dividends have been paid or will be paid out of revenue profits.
2018
£’000
2017
£’000
Revenue available for distribution by way of dividend for the year 25,473 25,119
First interim dividend (4.86p) (2017: 4.40p) (5,959) (5,395)
Second interim dividend (4.86p) (2017: 4.70p) (5,959) (5,762)
Third interim dividend (5.00p) paid on 30 November 2018 (2017: 4.70p paid on 30 November 2017) (6,130) (5,762)
Final dividend (5.00p) payable on 28 February 2019 (2017: 4.80p paid on 28 February 2018) (6,130) (5,885)
Revenue surplus for Section 1158 purposes 1,295 2,315
62
The Bankers Investment Trust PLC Annual Report 2018
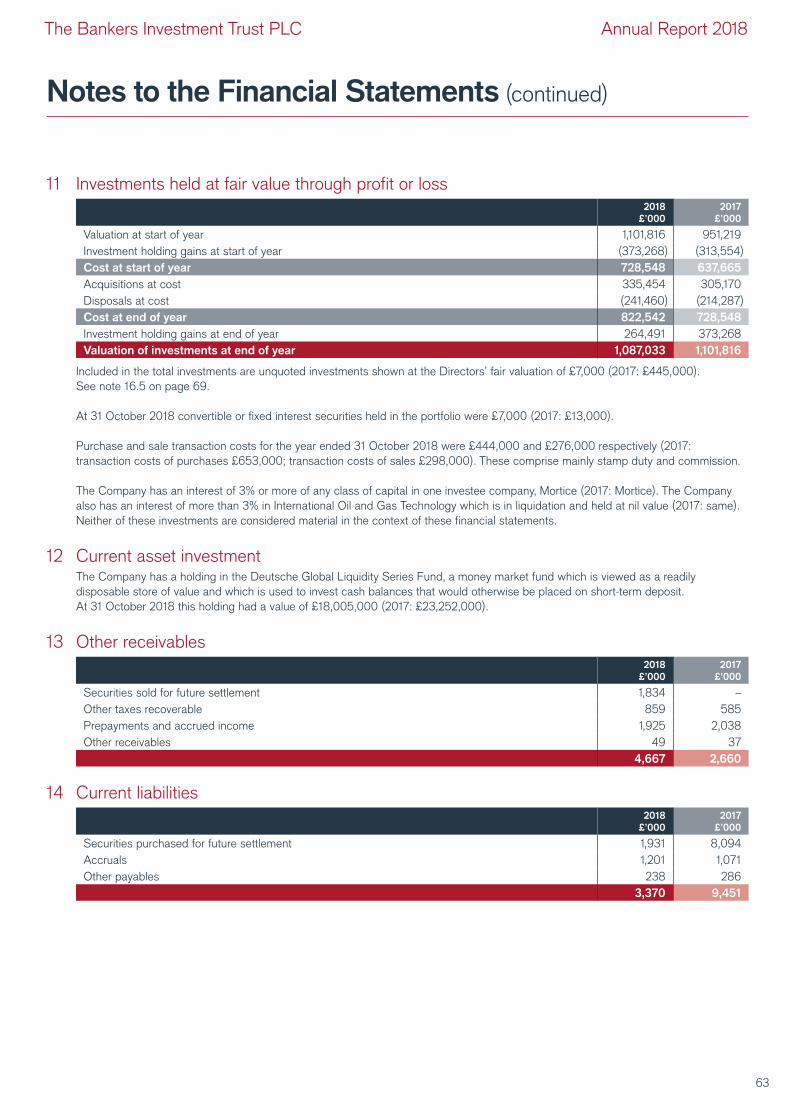
Notes to the Financial Statements (continued)
11 Investments held at fair value through profit or loss2018
£’000
2017
£’000
Valuation at start of year 1,101,816 951,219
Investment holding gains at start of year (373,268) (313,554)
Cost at start of year 728,548 637,665
Acquisitions at cost 335,454 305,170
Disposals at cost (241,460) (214,287)
Cost at end of year 822,542 728,548
Investment holding gains at end of year 264,491 373,268
Valuation of investments at end of year 1,087,033 1,101,816
Included in the total investments are unquoted investments shown at the Directors’ fair valuation of £7,000 (2017: £445,000).
See note 16.5 on page 69.
At 31 October 2018 convertible or fixed interest securities held in the portfolio were £7,000 (2017: £13,000).
Purchase and sale transaction costs for the year ended 31 October 2018 were £444,000 and £276,000 respectively (2017:
transaction costs of purchases £653,000; transaction costs of sales £298,000). These comprise mainly stamp duty and commission.
The Company has an interest of 3% or more of any class of capital in one investee company, Mortice (2017: Mortice). The Company
also has an interest of more than 3% in International Oil and Gas Technology which is in liquidation and held at nil value (2017: same).
Neither of these investments are considered material in the context of these financial statements.
12 Current asset investmentThe Company has a holding in the Deutsche Global Liquidity Series Fund, a money market fund which is viewed as a readily
disposable store of value and which is used to invest cash balances that would otherwise be placed on short-term deposit.
At 31 October 2018 this holding had a value of £18,005,000 (2017: £23,252,000).
13 Other receivables2018
£’000
2017
£’000
Securities sold for future settlement 1,834 –
Other taxes recoverable 859 585
Prepayments and accrued income 1,925 2,038
Other receivables 49 37
4,667 2,660
14 Current liabilities2018
£’000
2017
£’000
Securities purchased for future settlement 1,931 8,094
Accruals 1,201 1,071
Other payables 238 286
3,370 9,451
63
The Bankers Investment Trust PLC Annual Report 2018
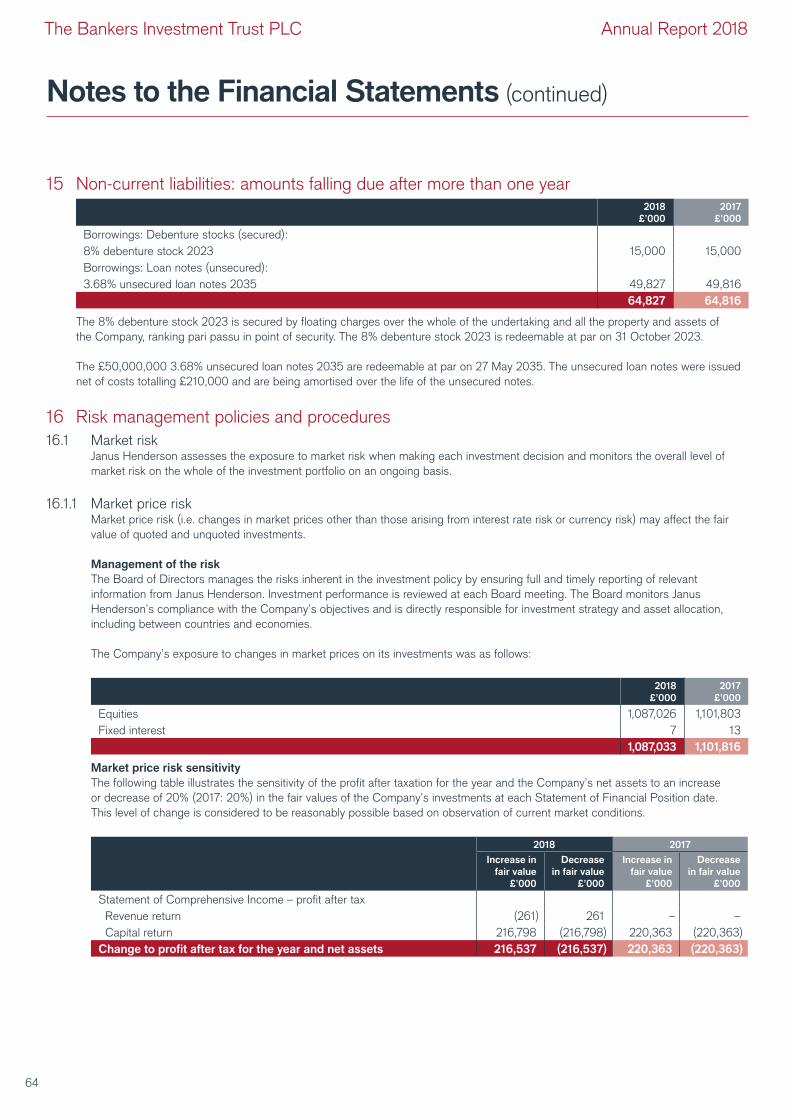
Notes to the Financial Statements (continued)
15 Non-current liabilities: amounts falling due after more than one year2018
£’000
2017
£’000
Borrowings: Debenture stocks (secured):
8% debenture stock 2023 15,000 15,000
Borrowings: Loan notes (unsecured):
3.68% unsecured loan notes 2035 49,827 49,816
64,827 64,816
The 8% debenture stock 2023 is secured by floating charges over the whole of the undertaking and all the property and assets of
the Company, ranking pari passu in point of security. The 8% debenture stock 2023 is redeemable at par on 31 October 2023.
The £50,000,000 3.68% unsecured loan notes 2035 are redeemable at par on 27 May 2035. The unsecured loan notes were issued
net of costs totalling £210,000 and are being amortised over the life of the unsecured notes.
16 Risk management policies and procedures
16.1 Market risk Janus Henderson assesses the exposure to market risk when making each investment decision and monitors the overall level of
market risk on the whole of the investment portfolio on an ongoing basis.
16.1.1 Market price risk Market price risk (i.e. changes in market prices other than those arising from interest rate risk or currency risk) may affect the fair
value of quoted and unquoted investments.
Management of the risk
The Board of Directors manages the risks inherent in the investment policy by ensuring full and timely reporting of relevant
information from Janus Henderson. Investment performance is reviewed at each Board meeting. The Board monitors Janus
Henderson’s compliance with the Company’s objectives and is directly responsible for investment strategy and asset allocation,
including between countries and economies.
The Company’s exposure to changes in market prices on its investments was as follows:
2018
£’000
2017
£’000
Equities 1,087,026 1,101,803
Fixed interest 7 13
1,087,033 1,101,816
Market price risk sensitivity
The following table illustrates the sensitivity of the profit after taxation for the year and the Company’s net assets to an increase
or decrease of 20% (2017: 20%) in the fair values of the Company’s investments at each Statement of Financial Position date.
This level of change is considered to be reasonably possible based on observation of current market conditions.
2018 2017
Increase in
fair value
£’000
Decrease
in fair value
£’000
Increase in
fair value
£’000
Decrease
in fair value
£’000
Statement of Comprehensive Income – profit after tax
Revenue return (261) 261 – –
Capital return 216,798 (216,798) 220,363 (220,363)
Change to profit after tax for the year and net assets 216,537 (216,537) 220,363 (220,363)
64
The Bankers Investment Trust PLC Annual Report 2018
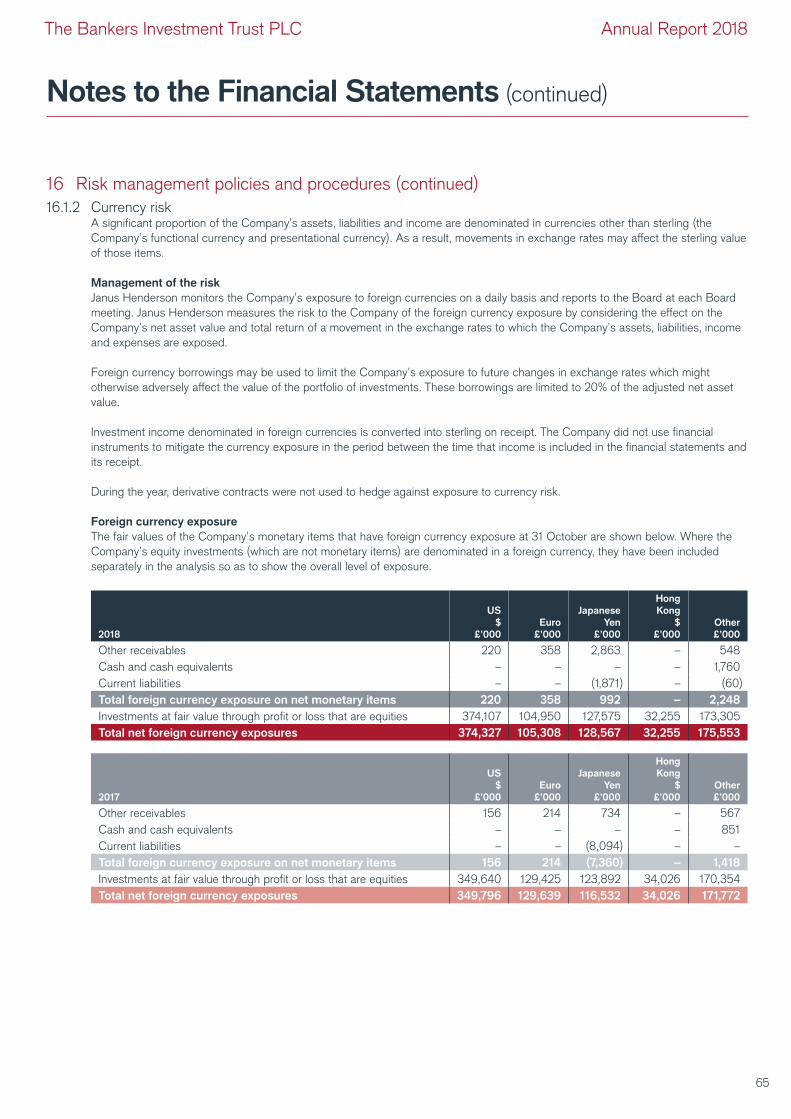
Notes to the Financial Statements (continued)
16 Risk management policies and procedures (continued)
16.1.2 Currency risk A significant proportion of the Company’s assets, liabilities and income are denominated in currencies other than sterling (the
Company’s functional currency and presentational currency). As a result, movements in exchange rates may affect the sterling value
of those items.
Management of the risk
Janus Henderson monitors the Company’s exposure to foreign currencies on a daily basis and reports to the Board at each Board
meeting. Janus Henderson measures the risk to the Company of the foreign currency exposure by considering the effect on the
Company’s net asset value and total return of a movement in the exchange rates to which the Company’s assets, liabilities, income
and expenses are exposed.
Foreign currency borrowings may be used to limit the Company’s exposure to future changes in exchange rates which might
otherwise adversely affect the value of the portfolio of investments. These borrowings are limited to 20% of the adjusted net asset
value.
Investment income denominated in foreign currencies is converted into sterling on receipt. The Company did not use financial
instruments to mitigate the currency exposure in the period between the time that income is included in the financial statements and
its receipt.
During the year, derivative contracts were not used to hedge against exposure to currency risk.
Foreign currency exposure
The fair values of the Company’s monetary items that have foreign currency exposure at 31 October are shown below. Where the
Company’s equity investments (which are not monetary items) are denominated in a foreign currency, they have been included
separately in the analysis so as to show the overall level of exposure.
2018
US
$
£’000
Euro
£’000
Japanese
Yen
£’000
Hong
Kong
$
£’000
Other
£’000
Other receivables 220 358 2,863 – 548
Cash and cash equivalents – – – – 1,760
Current liabilities – – (1,871) – (60)
Total foreign currency exposure on net monetary items 220 358 992 – 2,248
Investments at fair value through profit or loss that are equities 374,107 104,950 127,575 32,255 173,305
Total net foreign currency exposures 374,327 105,308 128,567 32,255 175,553
2017
US
$
£’000
Euro
£’000
Japanese
Yen
£’000
Hong
Kong
$
£’000
Other
£’000
Other receivables 156 214 734 – 567
Cash and cash equivalents – – – – 851
Current liabilities – – (8,094) – –
Total foreign currency exposure on net monetary items 156 214 (7,360) – 1,418
Investments at fair value through profit or loss that are equities 349,640 129,425 123,892 34,026 170,354
Total net foreign currency exposures 349,796 129,639 116,532 34,026 171,772
65
The Bankers Investment Trust PLC Annual Report 2018
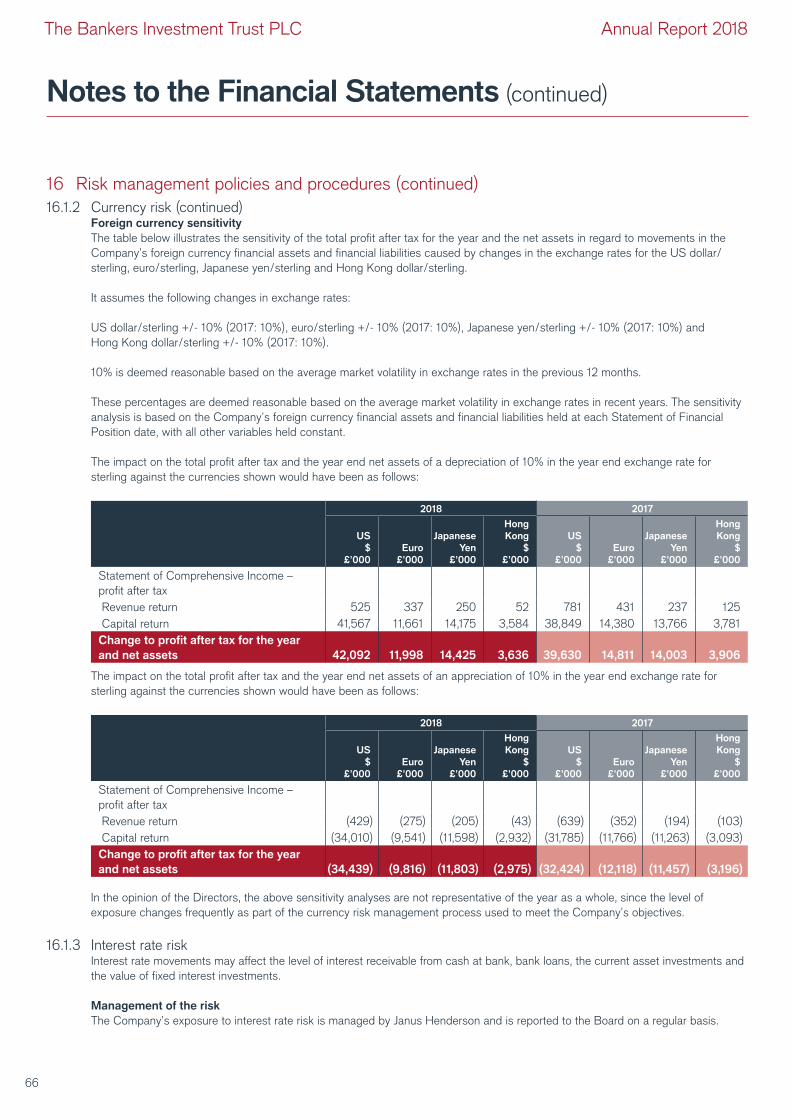
Notes to the Financial Statements (continued)
16 Risk management policies and procedures (continued)
16.1.2 Currency risk (continued) Foreign currency sensitivity
The table below illustrates the sensitivity of the total profit after tax for the year and the net assets in regard to movements in the
Company’s foreign currency financial assets and financial liabilities caused by changes in the exchange rates for the US dollar/
sterling, euro/sterling, Japanese yen/sterling and Hong Kong dollar/sterling.
It assumes the following changes in exchange rates:
US dollar/sterling +/- 10% (2017: 10%), euro/sterling +/- 10% (2017: 10%), Japanese yen/sterling +/- 10% (2017: 10%) and
Hong Kong dollar/sterling +/- 10% (2017: 10%).
10% is deemed reasonable based on the average market volatility in exchange rates in the previous 12 months.
These percentages are deemed reasonable based on the average market volatility in exchange rates in recent years. The sensitivity
analysis is based on the Company’s foreign currency financial assets and financial liabilities held at each Statement of Financial
Position date, with all other variables held constant.
The impact on the total profit after tax and the year end net assets of a depreciation of 10% in the year end exchange rate for
sterling against the currencies shown would have been as follows:
2018 2017
US
$
£’000
Euro
£’000
Japanese
Yen
£’000
Hong
Kong
$
£’000
US
$
£’000
Euro
£’000
Japanese
Yen
£’000
Hong
Kong
$
£’000
Statement of Comprehensive Income –
profit after tax
Revenue return 525 337 250 52 781 431 237 125
Capital return 41,567 11,661 14,175 3,584 38,849 14,380 13,766 3,781
Change to profit after tax for the year
and net assets 42,092 11,998 14,425 3,636 39,630 14,811 14,003 3,906
The impact on the total profit after tax and the year end net assets of an appreciation of 10% in the year end exchange rate for
sterling against the currencies shown would have been as follows:
2018 2017
US
$
£’000
Euro
£’000
Japanese
Yen
£’000
Hong
Kong
$
£’000
US
$
£’000
Euro
£’000
Japanese
Yen
£’000
Hong
Kong
$
£’000
Statement of Comprehensive Income –
profit after tax
Revenue return (429) (275) (205) (43) (639) (352) (194) (103)
Capital return (34,010) (9,541) (11,598) (2,932) (31,785) (11,766) (11,263) (3,093)
Change to profit after tax for the year
and net assets (34,439) (9,816) (11,803) (2,975) (32,424) (12,118) (11,457) (3,196)
In the opinion of the Directors, the above sensitivity analyses are not representative of the year as a whole, since the level of
exposure changes frequently as part of the currency risk management process used to meet the Company’s objectives.
16.1.3 Interest rate risk Interest rate movements may affect the level of interest receivable from cash at bank, bank loans, the current asset investments and
the value of fixed interest investments.
Management of the risk
The Company’s exposure to interest rate risk is managed by Janus Henderson and is reported to the Board on a regular basis.
66
The Bankers Investment Trust PLC Annual Report 2018
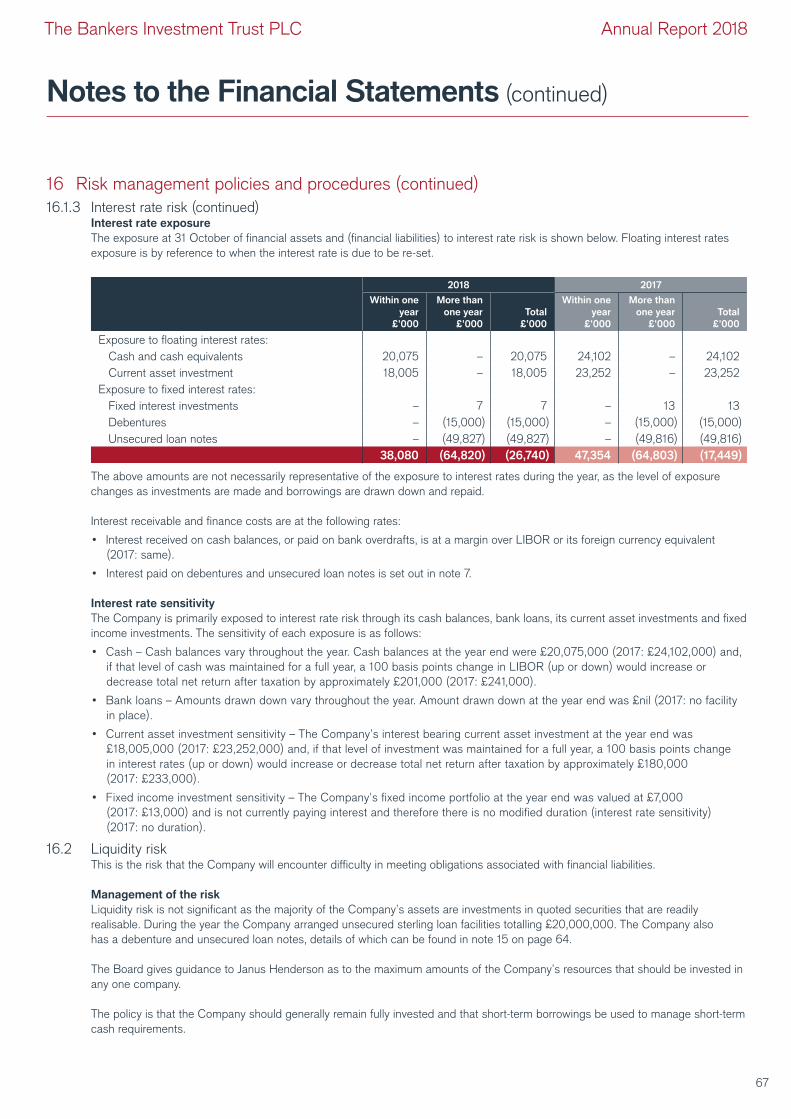
Notes to the Financial Statements (continued)
16 Risk management policies and procedures (continued)
16.1.3 Interest rate risk (continued) Interest rate exposure
The exposure at 31 October of financial assets and (financial liabilities) to interest rate risk is shown below. Floating interest rates
exposure is by reference to when the interest rate is due to be re-set.
2018 2017
Within one
year
£’000
More than
one year
£’000
Total
£’000
Within one
year
£’000
More than
one year
£’000
Total
£’000
Exposure to floating interest rates:
Cash and cash equivalents 20,075 – 20,075 24,102 – 24,102
Current asset investment 18,005 – 18,005 23,252 – 23,252
Exposure to fixed interest rates:
Fixed interest investments – 7 7 – 13 13
Debentures – (15,000) (15,000) – (15,000) (15,000)
Unsecured loan notes – (49,827) (49,827) – (49,816) (49,816)
38,080 (64,820) (26,740) 47,354 (64,803) (17,449)
The above amounts are not necessarily representative of the exposure to interest rates during the year, as the level of exposure
changes as investments are made and borrowings are drawn down and repaid.
Interest receivable and finance costs are at the following rates:
• Interest received on cash balances, or paid on bank overdrafts, is at a margin over LIBOR or its foreign currency equivalent
(2017: same).
• Interest paid on debentures and unsecured loan notes is set out in note 7.
Interest rate sensitivity
The Company is primarily exposed to interest rate risk through its cash balances, bank loans, its current asset investments and fixed
income investments. The sensitivity of each exposure is as follows:
• Cash – Cash balances vary throughout the year. Cash balances at the year end were £20,075,000 (2017: £24,102,000) and,
if that level of cash was maintained for a full year, a 100 basis points change in LIBOR (up or down) would increase or
decrease total net return after taxation by approximately £201,000 (2017: £241,000).
• Bank loans – Amounts drawn down vary throughout the year. Amount drawn down at the year end was £nil (2017: no facility
in place).
• Current asset investment sensitivity – The Company’s interest bearing current asset investment at the year end was
£18,005,000 (2017: £23,252,000) and, if that level of investment was maintained for a full year, a 100 basis points change
in interest rates (up or down) would increase or decrease total net return after taxation by approximately £180,000
(2017: £233,000).
• Fixed income investment sensitivity – The Company’s fixed income portfolio at the year end was valued at £7,000
(2017: £13,000) and is not currently paying interest and therefore there is no modified duration (interest rate sensitivity)
(2017: no duration).
16.2 Liquidity risk This is the risk that the Company will encounter difficulty in meeting obligations associated with financial liabilities.
Management of the risk
Liquidity risk is not significant as the majority of the Company’s assets are investments in quoted securities that are readily
realisable. During the year the Company arranged unsecured sterling loan facilities totalling £20,000,000. The Company also
has a debenture and unsecured loan notes, details of which can be found in note 15 on page 64.
The Board gives guidance to Janus Henderson as to the maximum amounts of the Company’s resources that should be invested in
any one company.
The policy is that the Company should generally remain fully invested and that short-term borrowings be used to manage short-term
cash requirements.
67
The Bankers Investment Trust PLC Annual Report 2018
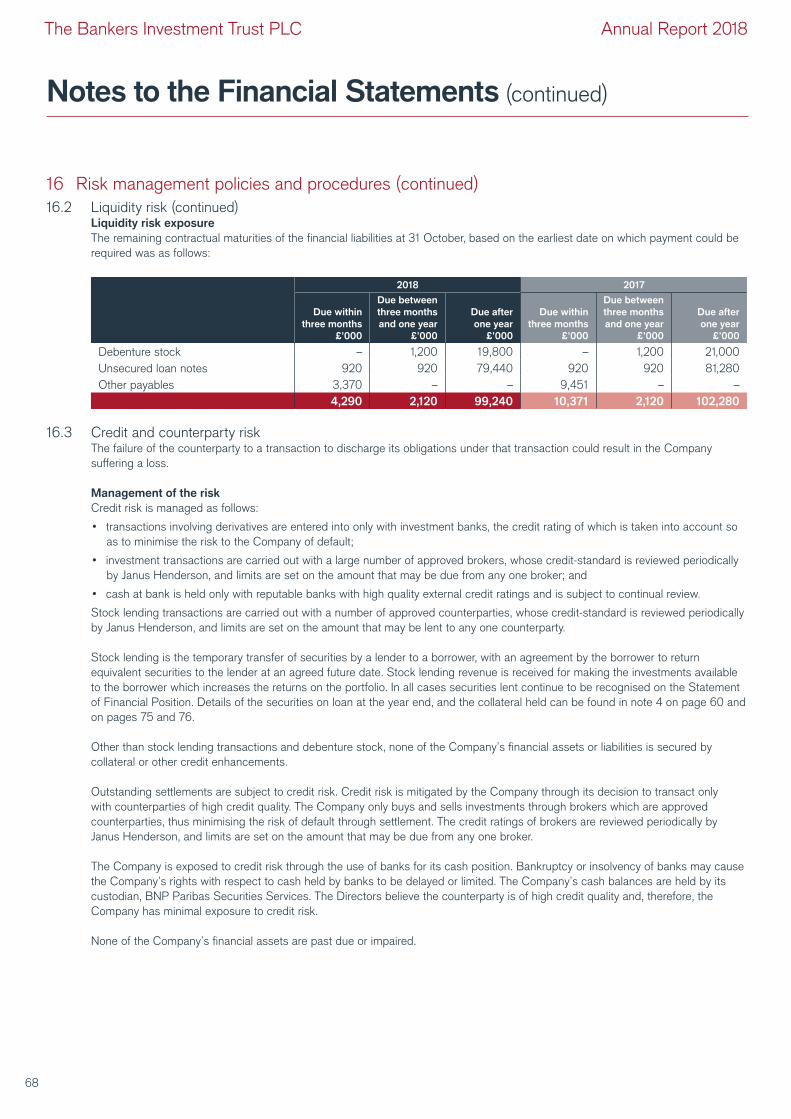
Notes to the Financial Statements (continued)
16 Risk management policies and procedures (continued)
16.2 Liquidity risk (continued) Liquidity risk exposure
The remaining contractual maturities of the financial liabilities at 31 October, based on the earliest date on which payment could be
required was as follows:
2018 2017
Due within
three months
£’000
Due between
three months
and one year
£’000
Due after
one year
£’000
Due within
three months
£’000
Due between
three months
and one year
£’000
Due after
one year
£’000
Debenture stock – 1,200 19,800 – 1,200 21,000
Unsecured loan notes 920 920 79,440 920 920 81,280
Other payables 3,370 – – 9,451 – –
4,290 2,120 99,240 10,371 2,120 102,280
16.3 Credit and counterparty risk The failure of the counterparty to a transaction to discharge its obligations under that transaction could result in the Company
suffering a loss.
Management of the risk
Credit risk is managed as follows:
• transactions involving derivatives are entered into only with investment banks, the credit rating of which is taken into account so
as to minimise the risk to the Company of default;
• investment transactions are carried out with a large number of approved brokers, whose credit-standard is reviewed periodically
by Janus Henderson, and limits are set on the amount that may be due from any one broker; and
• cash at bank is held only with reputable banks with high quality external credit ratings and is subject to continual review.
Stock lending transactions are carried out with a number of approved counterparties, whose credit-standard is reviewed periodically
by Janus Henderson, and limits are set on the amount that may be lent to any one counterparty.
Stock lending is the temporary transfer of securities by a lender to a borrower, with an agreement by the borrower to return
equivalent securities to the lender at an agreed future date. Stock lending revenue is received for making the investments available
to the borrower which increases the returns on the portfolio. In all cases securities lent continue to be recognised on the Statement
of Financial Position. Details of the securities on loan at the year end, and the collateral held can be found in note 4 on page 60 and
on pages 75 and 76.
Other than stock lending transactions and debenture stock, none of the Company’s financial assets or liabilities is secured by
collateral or other credit enhancements.
Outstanding settlements are subject to credit risk. Credit risk is mitigated by the Company through its decision to transact only
with counterparties of high credit quality. The Company only buys and sells investments through brokers which are approved
counterparties, thus minimising the risk of default through settlement. The credit ratings of brokers are reviewed periodically by
Janus Henderson, and limits are set on the amount that may be due from any one broker.
The Company is exposed to credit risk through the use of banks for its cash position. Bankruptcy or insolvency of banks may cause
the Company’s rights with respect to cash held by banks to be delayed or limited. The Company’s cash balances are held by its
custodian, BNP Paribas Securities Services. The Directors believe the counterparty is of high credit quality and, therefore, the
Company has minimal exposure to credit risk.
None of the Company’s financial assets are past due or impaired.
68
The Bankers Investment Trust PLC Annual Report 2018
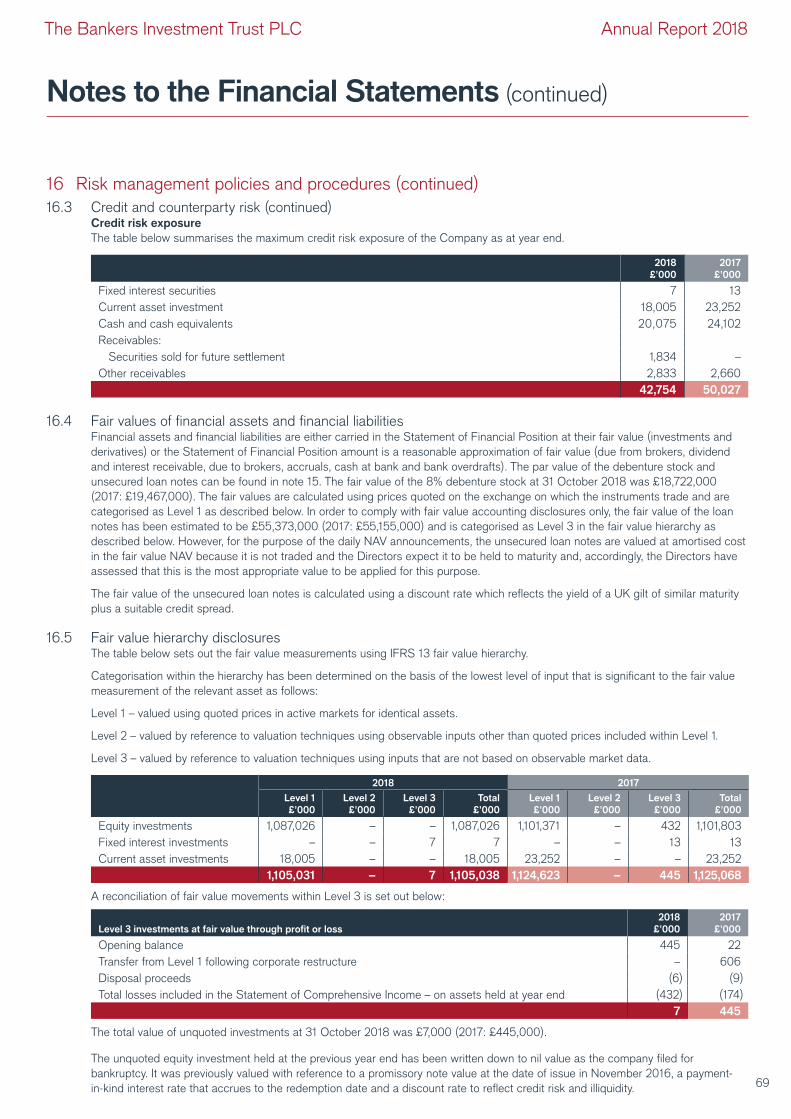
Notes to the Financial Statements (continued)
16 Risk management policies and procedures (continued)
16.3 Credit and counterparty risk (continued) Credit risk exposure
The table below summarises the maximum credit risk exposure of the Company as at year end.
2018
£’000
2017
£’000
Fixed interest securities 7 13
Current asset investment 18,005 23,252
Cash and cash equivalents 20,075 24,102
Receivables:
Securities sold for future settlement 1,834 –
Other receivables 2,833 2,660
42,754 50,027
16.4 Fair values of financial assets and financial liabilities Financial assets and financial liabilities are either carried in the Statement of Financial Position at their fair value (investments and
derivatives) or the Statement of Financial Position amount is a reasonable approximation of fair value (due from brokers, dividend
and interest receivable, due to brokers, accruals, cash at bank and bank overdrafts). The par value of the debenture stock and
unsecured loan notes can be found in note 15. The fair value of the 8% debenture stock at 31 October 2018 was £18,722,000
(2017: £19,467,000). The fair values are calculated using prices quoted on the exchange on which the instruments trade and are
categorised as Level 1 as described below. In order to comply with fair value accounting disclosures only, the fair value of the loan
notes has been estimated to be £55,373,000 (2017: £55,155,000) and is categorised as Level 3 in the fair value hierarchy as
described below. However, for the purpose of the daily NAV announcements, the unsecured loan notes are valued at amortised cost
in the fair value NAV because it is not traded and the Directors expect it to be held to maturity and, accordingly, the Directors have
assessed that this is the most appropriate value to be applied for this purpose.
The fair value of the unsecured loan notes is calculated using a discount rate which reflects the yield of a UK gilt of similar maturity
plus a suitable credit spread.
16.5 Fair value hierarchy disclosures The table below sets out the fair value measurements using IFRS 13 fair value hierarchy.
Categorisation within the hierarchy has been determined on the basis of the lowest level of input that is significant to the fair value
measurement of the relevant asset as follows:
Level 1 – valued using quoted prices in active markets for identical assets.
Level 2 – valued by reference to valuation techniques using observable inputs other than quoted prices included within Level 1.
Level 3 – valued by reference to valuation techniques using inputs that are not based on observable market data.
2018 2017
Level 1
£’000
Level 2
£’000
Level 3
£’000
Total
£’000
Level 1
£’000
Level 2
£’000
Level 3
£’000
Total
£’000
Equity investments 1,087,026 – – 1,087,026 1,101,371 – 432 1,101,803
Fixed interest investments – – 7 7 – – 13 13
Current asset investments 18,005 – – 18,005 23,252 – – 23,252
1,105,031 – 7 1,105,038 1,124,623 – 445 1,125,068
A reconciliation of fair value movements within Level 3 is set out below:
Level 3 investments at fair value through profit or loss
2018
£’000
2017
£’000
Opening balance 445 22
Transfer from Level 1 following corporate restructure – 606
Disposal proceeds (6) (9)
Total losses included in the Statement of Comprehensive Income – on assets held at year end (432) (174)
7 445
The total value of unquoted investments at 31 October 2018 was £7,000 (2017: £445,000).
The unquoted equity investment held at the previous year end has been written down to nil value as the company filed for
bankruptcy. It was previously valued with reference to a promissory note value at the date of issue in November 2016, a payment-
in-kind interest rate that accrues to the redemption date and a discount rate to reflect credit risk and illiquidity. 69
The Bankers Investment Trust PLC Annual Report 2018
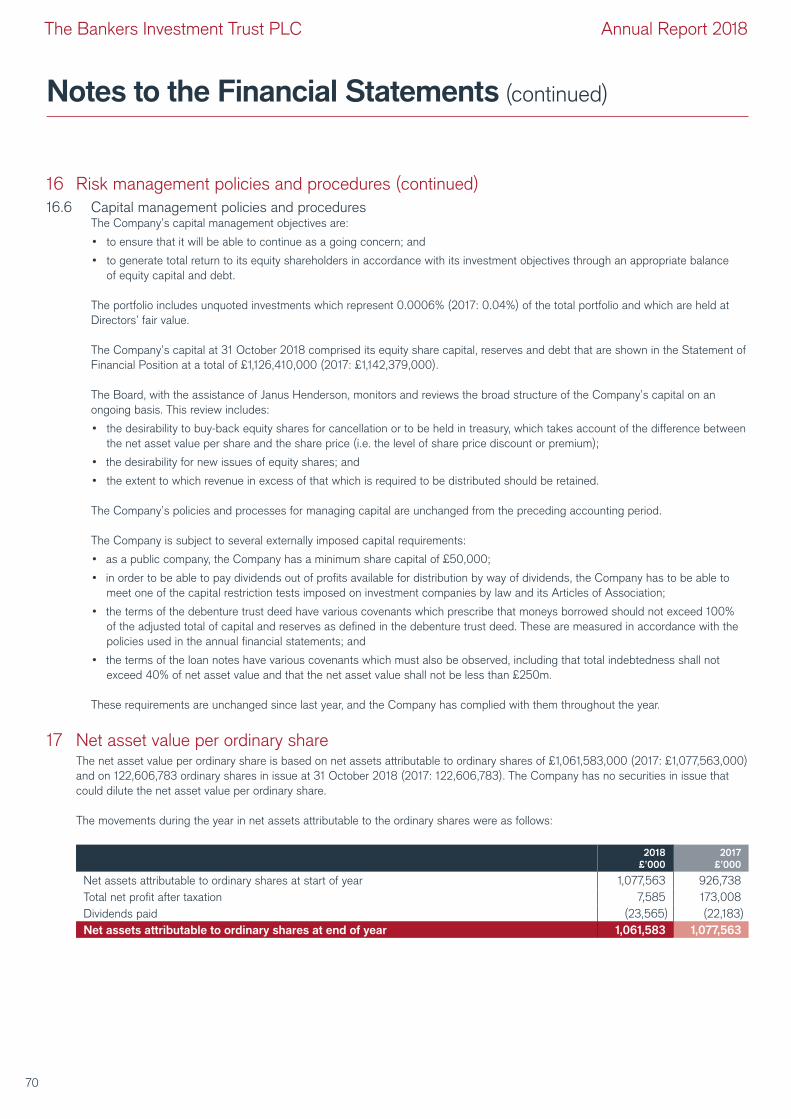
Notes to the Financial Statements (continued)
16 Risk management policies and procedures (continued)
16.6 Capital management policies and procedures The Company’s capital management objectives are:
• to ensure that it will be able to continue as a going concern; and
• to generate total return to its equity shareholders in accordance with its investment objectives through an appropriate balance
of equity capital and debt.
The portfolio includes unquoted investments which represent 0.0006% (2017: 0.04%) of the total portfolio and which are held at
Directors’ fair value.
The Company’s capital at 31 October 2018 comprised its equity share capital, reserves and debt that are shown in the Statement of
Financial Position at a total of £1,126,410,000 (2017: £1,142,379,000).
The Board, with the assistance of Janus Henderson, monitors and reviews the broad structure of the Company’s capital on an
ongoing basis. This review includes:
• the desirability to buy-back equity shares for cancellation or to be held in treasury, which takes account of the difference between
the net asset value per share and the share price (i.e. the level of share price discount or premium);
• the desirability for new issues of equity shares; and
• the extent to which revenue in excess of that which is required to be distributed should be retained.
The Company’s policies and processes for managing capital are unchanged from the preceding accounting period.
The Company is subject to several externally imposed capital requirements:
• as a public company, the Company has a minimum share capital of £50,000;
• in order to be able to pay dividends out of profits available for distribution by way of dividends, the Company has to be able to
meet one of the capital restriction tests imposed on investment companies by law and its Articles of Association;
• the terms of the debenture trust deed have various covenants which prescribe that moneys borrowed should not exceed 100%
of the adjusted total of capital and reserves as defined in the debenture trust deed. These are measured in accordance with the
policies used in the annual financial statements; and
• the terms of the loan notes have various covenants which must also be observed, including that total indebtedness shall not
exceed 40% of net asset value and that the net asset value shall not be less than £250m.
These requirements are unchanged since last year, and the Company has complied with them throughout the year.
17 Net asset value per ordinary shareThe net asset value per ordinary share is based on net assets attributable to ordinary shares of £1,061,583,000 (2017: £1,077,563,000)
and on 122,606,783 ordinary shares in issue at 31 October 2018 (2017: 122,606,783). The Company has no securities in issue that
could dilute the net asset value per ordinary share.
The movements during the year in net assets attributable to the ordinary shares were as follows:
2018
£’000
2017
£’000
Net assets attributable to ordinary shares at start of year 1,077,563 926,738
Total net profit after taxation 7,585 173,008
Dividends paid (23,565) (22,183)
Net assets attributable to ordinary shares at end of year 1,061,583 1,077,563
70
The Bankers Investment Trust PLC Annual Report 2018
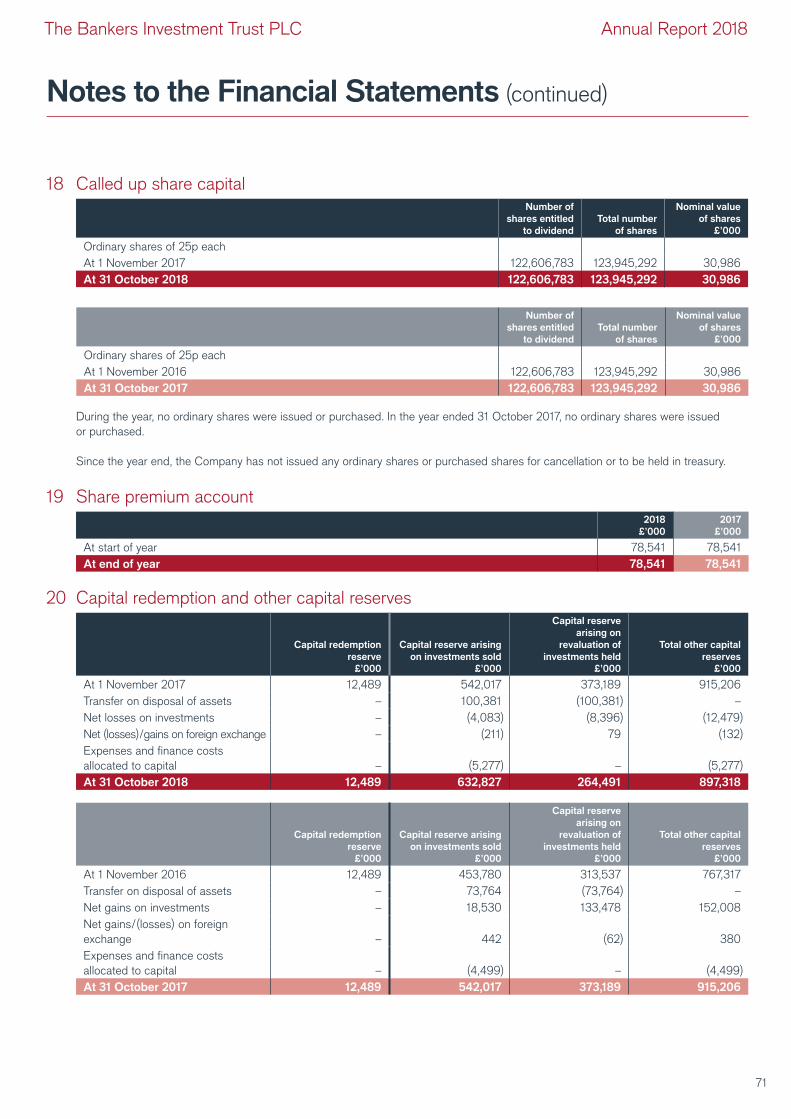
Notes to the Financial Statements (continued)
18 Called up share capitalNumber of
shares entitled
to dividend
Total number
of shares
Nominal value
of shares
£’000
Ordinary shares of 25p each
At 1 November 2017 122,606,783 123,945,292 30,986
At 31 October 2018 122,606,783 123,945,292 30,986
Number of
shares entitled
to dividend
Total number
of shares
Nominal value
of shares
£’000
Ordinary shares of 25p each
At 1 November 2016 122,606,783 123,945,292 30,986
At 31 October 2017 122,606,783 123,945,292 30,986
During the year, no ordinary shares were issued or purchased. In the year ended 31 October 2017, no ordinary shares were issued
or purchased.
Since the year end, the Company has not issued any ordinary shares or purchased shares for cancellation or to be held in treasury.
19 Share premium account2018
£’000
2017
£’000
At start of year 78,541 78,541
At end of year 78,541 78,541
20 Capital redemption and other capital reserves
Capital redemption
reserve
£’000
Capital reserve arising
on investments sold
£’000
Capital reserve
arising on
revaluation of
investments held
£’000
Total other capital
reserves
£’000
At 1 November 2017 12,489 542,017 373,189 915,206
Transfer on disposal of assets – 100,381 (100,381) –
Net losses on investments – (4,083) (8,396) (12,479)
Net (losses)/gains on foreign exchange – (211) 79 (132)
Expenses and finance costs
allocated to capital – (5,277) – (5,277)
At 31 October 2018 12,489 632,827 264,491 897,318
Capital redemption
reserve
£’000
Capital reserve arising
on investments sold
£’000
Capital reserve
arising on
revaluation of
investments held
£’000
Total other capital
reserves
£’000
At 1 November 2016 12,489 453,780 313,537 767,317
Transfer on disposal of assets – 73,764 (73,764) –
Net gains on investments – 18,530 133,478 152,008
Net gains/(losses) on foreign
exchange – 442 (62) 380
Expenses and finance costs
allocated to capital – (4,499) – (4,499)
At 31 October 2017 12,489 542,017 373,189 915,206
71
The Bankers Investment Trust PLC Annual Report 2018
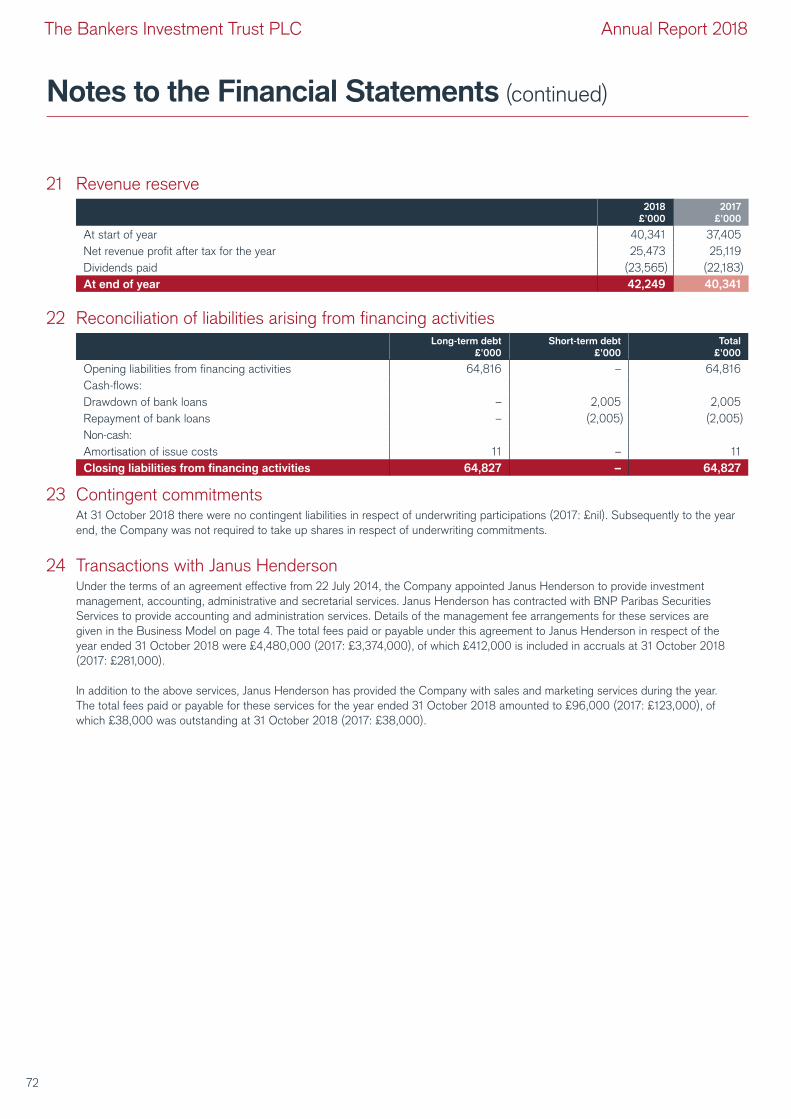
21 Revenue reserve2018
£’000
2017
£’000
At start of year 40,341 37,405
Net revenue profit after tax for the year 25,473 25,119
Dividends paid (23,565) (22,183)
At end of year 42,249 40,341
22 Reconciliation of liabilities arising from financing activitiesLong-term debt
£’000
Short-term debt
£’000
Total
£’000
Opening liabilities from financing activities 64,816 – 64,816
Cash-flows:
Drawdown of bank loans – 2,005 2,005
Repayment of bank loans – (2,005) (2,005)
Non-cash:
Amortisation of issue costs 11 – 11
Closing liabilities from financing activities 64,827 – 64,827
23 Contingent commitmentsAt 31 October 2018 there were no contingent liabilities in respect of underwriting participations (2017: £nil). Subsequently to the year
end, the Company was not required to take up shares in respect of underwriting commitments.
24 Transactions with Janus HendersonUnder the terms of an agreement effective from 22 July 2014, the Company appointed Janus Henderson to provide investment
management, accounting, administrative and secretarial services. Janus Henderson has contracted with BNP Paribas Securities
Services to provide accounting and administration services. Details of the management fee arrangements for these services are
given in the Business Model on page 4. The total fees paid or payable under this agreement to Janus Henderson in respect of the
year ended 31 October 2018 were £4,480,000 (2017: £3,374,000), of which £412,000 is included in accruals at 31 October 2018
(2017: £281,000).
In addition to the above services, Janus Henderson has provided the Company with sales and marketing services during the year.
The total fees paid or payable for these services for the year ended 31 October 2018 amounted to £96,000 (2017: £123,000), of
which £38,000 was outstanding at 31 October 2018 (2017: £38,000).
Notes to the Financial Statements (continued)
72
The Bankers Investment Trust PLC Annual Report 2018
General Shareholder Information
AIFMD DisclosuresIn accordance with the Alternative Investment Fund Managers
Directive (‘AIFMD’), information in relation to the Company’s leverage
and remuneration of Janus Henderson, as the Company’s Alternative
Investment Fund Manager (‘AIFM’) are required to be made available
to investors. These disclosures, including those on the AIFM’s
remuneration policy, are contained in a separate document called
‘AIFMD Disclosure’ which can be found on the Company’s website.
BACSDividends can be paid to shareholders by means of BACS (Bankers’
Automated Clearing Services); mandate forms for this purpose are
available from the UK Registrar, Equiniti Limited. Alternatively,
shareholders can write to the UK Registrar (the address is given on
page 27) to give their instructions; these must include the bank
account number, the bank account title and the sort code of the bank
to which payments are to be made.
Shareholders on the register in New Zealand can have their
dividends paid in New Zealand dollars by writing to the New Zealand
Registrar, Computershare Investor Services plc (the address is given
on page 27).
Common Reporting StandardTax legislation under the Organisation for Economic Co-operation
and Development Common Reporting Standard for Automatic
Exchange of Financial Account Information was introduced with
effect from 1 January 2016. The legislation requires the Company
to provide personal information to HMRC on certain investors who
purchase shares in investment trusts. This information is provided
annually to the local tax authority of the tax residencies of a number
of non-UK based certificated shareholders and corporate entities.
Equality Act 2010Copies of this report and other documents issued by the Company
are available from the Corporate Secretary. If needed, copies can be
made available in a variety of formats, including Braille or larger type
as appropriate.
You can contact the Registrar, which has installed textphones to
allow speech and hearing impaired people who have their own
textphone to contact them directly, without the need for an
intermediate operator by dialling 0371 384 2255. Specially trained
operators are available during normal business hours to answer
queries via this service.
Alternatively, if you prefer to go through a ‘typetalk’ operator
(provided by the Royal National Institute for Deaf People) dial 18001
followed by the number you wish to dial.
Foreign Account Tax Compliance Act (‘FATCA’)FATCA is a United States federal law enacted in 2010 whose intent
is to enforce the requirement for United States persons (including
those living outside the US) to file yearly reports on their non-US
financial accounts. As a result of HMRC’s change of interpretation
on the meaning of shares and securities ‘regularly traded on an
established securities market’, investment trusts now need to monitor
each year the trading volume and frequency of their shares and
securities to assess whether they have financial accounts. The
Company will therefore need to make an annual assessment, before
the FATCA return is due, to determine if the shares represent
financial accounts and, where they do, will need to identify and report
US reportable accounts to HMRC, as required.
General Data Protection Regulation (‘GDPR’)GDPR came into force on 25 May 2018. A privacy statement can
be found on the website www.janushenderson.com.
ISAThe Company intends to continue to manage its affairs in order to
qualify as an eligible investment for a stocks and shares ISA.
Non-Mainstream Pooled Investments
(‘NMPI’) statusThe Company currently conducts its affairs so that its ordinary
shares of 25p each can be recommended by IFAs to ordinary retail
investors in accordance with the Financial Conduct Authority’s
(‘FCA’) rules in relation to non-mainstream investment products and
intends to continue to do so for the foreseeable future. The shares
are excluded from the FCA’s restrictions which apply to non-
mainstream investment products because they are shares in an
investment trust.
Packaged Retail and Insurance-based
Investment Products Regulation (‘PRIIPs’)/
Key Information Document (‘KID’) Investors should be aware that the PRIIPs Regulation requires the
Manager, as the PRIIP manufacturer, to prepare a key information
document in respect of the Company. This KID must be made
available by the Manager to retail investors prior to them making
any investment decision and is available on the Company’s website.
The Company is not responsible for the information contained in
the KID and investors should note that the procedures for
calculating the risks, costs and potential returns are prescribed
by the law. The figures in the KID may not reflect the expected
returns for the Company and anticipated performance returns
cannot be guaranteed.
73
The Bankers Investment Trust PLC Annual Report 2018
General Shareholder Information (continued)
Performance Details/Share Price InformationDetails of the Company’s share price and NAV per share can be
found on www.bankersinvestmenttrust.com. The Company’s
NAV per share is published daily.
Shareholder DetailsShareholders who hold their shares in certificated form can check
their shareholding with the Registrar (contact details can be found
on page 27).
There is now a range of shareholder information online. You can
check your holding and find practical help on transferring shares
or updating your details at www.shareview.co.uk.
Share Price ListingsThe market price of the Company’s ordinary shares is published daily
in the Financial Times. The Financial Times also shows figures for
the estimated NAV per share and the discount.
The market price of the Company’s shares can be found in the
London Stock Exchange Daily Official List.
Financial Statements on the website The financial statements are published on the website, www.bankersinvestmenttrust.com which is a website maintained by the
Manager, Janus Henderson. Visitors to the website need to be aware that legislation in the United Kingdom governing the preparation
and dissemination of the financial statements may differ from legislation in other jurisdictions.
The maintenance and integrity of the website maintained by Janus Henderson or any of its subsidiaries is, so far as it relates to the
Company, the responsibility of Janus Henderson. The work carried out by the Auditor does not involve consideration of these matters
and, accordingly, the Auditor accepts no responsibility for any changes that have occurred to the Annual Report since it was initially
presented on the website.
Warning to Shareholders Many companies have become aware that their shareholders have received unsolicited phone calls or correspondence concerning investment matters. These are typically from overseas-based 'brokers' who target UK shareholders offering to sell them what often turn out to be worthless or high risk shares in US or UK investments. They can be very persistent and extremely persuasive. Shareholders are therefore advised to be very wary of any unsolicited advice, offers to buy shares at a discount or offers of free company reports.
Please note that it is very unlikely that either the Company or the Company’s UK Registrar, Equiniti Limited, or the New Zealand Registrar, Computershare Investor Services plc, would make unsolicited telephone calls to shareholders and that any such calls would relate only to official documentation already circulated to shareholders and never in respect of investment 'advice'.
If you are in any doubt about the veracity of an unsolicited phone call, please call either the Corporate Secretary or the Registrar at the numbers provided on page 27.
74
The Bankers Investment Trust PLC Annual Report 2018
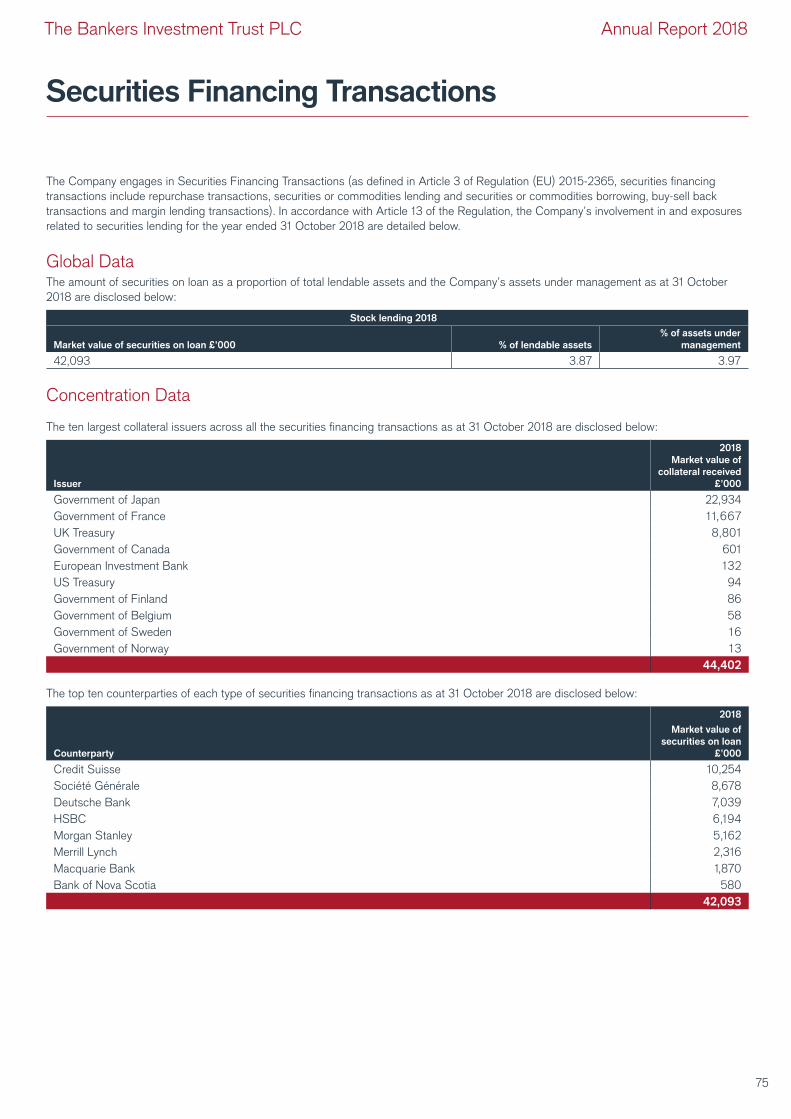
Securities Financing Transactions
The Company engages in Securities Financing Transactions (as defined in Article 3 of Regulation (EU) 2015-2365, securities financing
transactions include repurchase transactions, securities or commodities lending and securities or commodities borrowing, buy-sell back
transactions and margin lending transactions). In accordance with Article 13 of the Regulation, the Company’s involvement in and exposures
related to securities lending for the year ended 31 October 2018 are detailed below.
Global DataThe amount of securities on loan as a proportion of total lendable assets and the Company’s assets under management as at 31 October
2018 are disclosed below:
Stock lending 2018
Market value of securities on loan £’000 % of lendable assets
% of assets under
management
42,093 3.87 3.97
Concentration Data
The ten largest collateral issuers across all the securities financing transactions as at 31 October 2018 are disclosed below:
Issuer
2018
Market value of
collateral received
£’000
Government of Japan 22,934
Government of France 11,667
UK Treasury 8,801
Government of Canada 601
European Investment Bank 132
US Treasury 94
Government of Finland 86
Government of Belgium 58
Government of Sweden 16
Government of Norway 13
44,402
The top ten counterparties of each type of securities financing transactions as at 31 October 2018 are disclosed below:
2018
Counterparty
Market value of
securities on loan
£’000
Credit Suisse 10,254
Société Générale 8,678
Deutsche Bank 7,039
HSBC 6,194
Morgan Stanley 5,162
Merrill Lynch 2,316
Macquarie Bank 1,870
Bank of Nova Scotia 580
42,093
75
The Bankers Investment Trust PLC Annual Report 2018
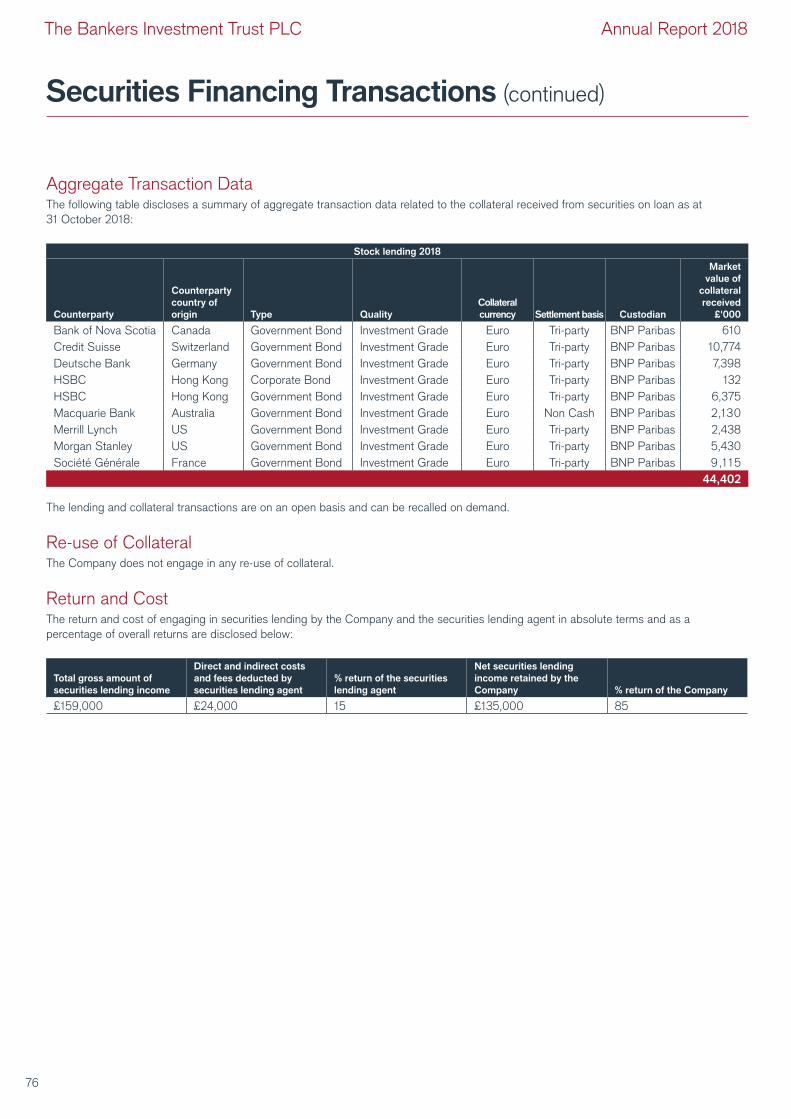
Securities Financing Transactions (continued)
Aggregate Transaction DataThe following table discloses a summary of aggregate transaction data related to the collateral received from securities on loan as at
31 October 2018:
Stock lending 2018
Counterparty
Counterparty
country of
origin Type Quality
Collateral
currency Settlement basis Custodian
Market
value of
collateral
received
£'000
Bank of Nova Scotia Canada Government Bond Investment Grade Euro Tri-party BNP Paribas 610
Credit Suisse Switzerland Government Bond Investment Grade Euro Tri-party BNP Paribas 10,774
Deutsche Bank Germany Government Bond Investment Grade Euro Tri-party BNP Paribas 7,398
HSBC Hong Kong Corporate Bond Investment Grade Euro Tri-party BNP Paribas 132
HSBC Hong Kong Government Bond Investment Grade Euro Tri-party BNP Paribas 6,375
Macquarie Bank Australia Government Bond Investment Grade Euro Non Cash BNP Paribas 2,130
Merrill Lynch US Government Bond Investment Grade Euro Tri-party BNP Paribas 2,438
Morgan Stanley US Government Bond Investment Grade Euro Tri-party BNP Paribas 5,430
Société Générale France Government Bond Investment Grade Euro Tri-party BNP Paribas 9,115
44,402
The lending and collateral transactions are on an open basis and can be recalled on demand.
Re-use of CollateralThe Company does not engage in any re-use of collateral.
Return and Cost The return and cost of engaging in securities lending by the Company and the securities lending agent in absolute terms and as a
percentage of overall returns are disclosed below:
Total gross amount of
securities lending income
Direct and indirect costs
and fees deducted by
securities lending agent
% return of the securities
lending agent
Net securities lending
income retained by the
Company % return of the Company
£159,000 £24,000 15 £135,000 85
76
The Bankers Investment Trust PLC Annual Report 2018

Strategic Report
Performance Highlights 2-3
Business Model 4
Structure and Principal Activity 4
Investment Objectives 4
Investment Policy 4
Position at the year end 4
Management 4
Management Fee 4
Investing 4
Chairman’s Statement 5-6
Fund Manager’s Review 7
Statistical Record 8
Rates of Exchange 8
Distribution of Assets and Liabilities 8
Largest Investments 9
Changes in Investments 9
Fund Manager Reports 10-23
United Kingdom 10
Europe (ex UK) 12
North America 14
Japan 16
Pacific (ex Japan, China) 18
China 20
Emerging Markets 22
Portfolio Structure 24-25
FTSE Stock Market Indices Total Return 24
Geographical Total Return Analysis 24
Geographical Analysis 25
Sector Analysis 25
Corporate Information 26-30
Directors 26
Registered Office 27
Service Providers 27
Independent Auditor 27
Financial Calendar 27
Information Sources 27
Follow Janus Henderson Investment Trusts on
Twitter, YouTube and Facebook 27
Investing 27
Nominee Share Code 27
Status 28
Principal Risks and Uncertainties 28
Viability Statement 29
Borrowings 29
Performance Measurement and Key
Performance Indicators 29
Future Developments 29
Corporate Responsibility 29
Modern Slavery Act 30
Board Diversity 30
Glossary 31
Alternative Performance Measures 32
Corporate Report
Report of the Directors 34-35
Statement of Directors’ Responsibilities 36
Directors’ Remuneration Report 37-38
Corporate Governance Statement 39-43
Report of the Audit Committee 44-45
Independent Auditor’s Report to the Members
of The Bankers Investment Trust PLC 46-50
Financial Statements
Statement of Comprehensive Income 51
Statement of Changes in Equity 52
Statement of Financial Position 53
Cash Flow Statement 54
Notes to the Financial Statements 55-72
General Shareholder Information 73-74
Securities Financing Transactions 75-76
Contents
The Bankers Investment Trust PLC Annual Report 2018
The image on the front cover is based on the HSBC Bank Building in Hong Kong.
A brief historyThe Company was incorporated in 1888.
Since seven of the nine original directors
were bankers by profession, the name The
Bankers’ Investment Trust, Limited was
considered appropriate. The Company has
paid dividends on the equity capital every year
since incorporation except in the years 1892
and 1893.

The Bankers Investment Trust PLC
Registered as an investment company in England and Wales
Registration number: 00026351
Registered office: 201 Bishopsgate, London EC2M 3AE
ISIN code: GB0000767003
SEDOL number: 0076700
London Stock Exchange (TIDM) Code: BNKR
Global Intermediary Identification Number (GIIN): L5YVFP.99999.SL.826
Legal Entity Identifier (LEI): 213800B9YWXL3X1VMZ69
Telephone: 0800 832 832
Email: [email protected]
www.bankersinvestmenttrust.com
JHI9201/2018
The B
ankers
Inve
stm
ent T
rust P
LC
– A
nnual R
eport fo
r the ye
ar e
nded 3
1 Octo
ber 2
018
JH
I920
1/20
18
THE BANKERSINVESTMENTTRUST PLCAnnual Report 2018
This report is printed on cocoon silk 60% recycled, a recycled paper containing 60% recycled waste
and 40% virgin fibre and manufactured at a mill certified with ISO 14001 environmental management
standard. The pulp used in this product is bleached using an Elemental Chlorine Free process (ECF).
The FSC® logo identifies products which contain wood from well managed forests certified in
accordance with the rules of the Forest Stewardship Council®.
Typeset by 2112 Communications, London. Printed by Leycol, London
ShareholderCommunication
Awards
2018WINNER
ShareholderCommunication
Awards
2017WINNER


![Modelagem Básica Entity –Exemplos: entity identifier is [ port (port_interface_list);] {entity_declarative_item} end [entity] [identifier]; Interface_list](https://img.pdfslide.us/doc/110x75/5515433a5503465e608b6163/modelagem-basica-entity-exemplos-entity-identifier-is-port-portinterfacelist-entitydeclarativeitem-end-entity-identifier-interfacelist.jpg)