Embed Size (px)
Citation preview
JOURNAL OF INTERNATIONAL AND AREA STUDIES
Volume 21, Number 1, 2014, pp.1-19
1
Legacy of Khmer Rouge on Skill Formation in Cambodia
Hyeok Jeong
This paper explores the effects of the demographic shocks related to the genocide of Khmer Rouge
regime and their implications on skill formation in Cambodia. We found that the mass and targeted
massacre created a deep hole in the middle-aged and the educated. After the end of the regime and the
subsequent transition periods, baby boom followed. This baby-boom generation youth had difficulty in
finding qualified teachers at schools and experienced mentors at workplaces and this led to the breaks
of the intergenerational link of human capital transfer in Cambodia. Unfortunately, the current
curriculum design of the TVET and general education in Cambodia is biased against the skill needs of
the Cambodian labor market. Fixing these problems is an urgent issue for the sustainable development
in Cambodia.
Keywords: skill shortage, skill mismatch, demography, TVET System, educational reform,
Cambodian labor market
1. INTRODUCTION
Cambodia once was a glorious nation in history having built one of the World Heritages.
In the process of modern state building, Cambodia went through a dark age, the so-called
Khmer Rouge regime. Around the period of the regime in the 1970s, the Cambodian
economy went through a deep and long recession. According to the Penn World Table
version 8 data which compiles real GDP with purchasing power parity (PPP) adjusted
population data for 167 countries, the average real income per person of Cambodia in 1970
was $1,299 in 2005 constant PPP-adjusted dollar value, which became halved down to $663
by the end of the Khmer Rouge regime. This corresponds to the negative income growth of -
6.5% per year. Unfortunately, the recession continued during the transition period in the
1980s. Even after Norodom Sihanouk was restored as the King of Cambodia in 1993,
political stability was not established and the growth performance was unstable in Cambodia.
It was only after 1997 that Cambodia gained its growth momentum. The average real income
of Cambodia grew from $878 in 1997 to $2,348 in 2011. That is, Cambodian real income
grew 7.3% each year on average. In the World Bank Report, Giumbert (2010) suggests that
Cambodia belongs to top 3% high-growth performing countries in the world in terms of
income growth for the 1998~2008 period.
The major engine of the rapid growth of Cambodia for the 1997~2011 period was the
expansion of investment mainly driven by the foreign direct investment from abroad.
Recently this kind of FDI-driven growth is also observed in other ASEAN economies. Thus,
whether this kind of growth would be sustained or not is an important question among the
policymakers not only in this region but also in the international community of development
cooperation. Many policy-reports argue that the skill shortage and skill mismatch are the
central problem for this sustainable development issue for these economies. Martinez-
Fernandez and Powell (2009) explore the general issues of employment and skills among
ASEAN countries. Chalamwong et al. (2012) discuss the skill mismatch issues for the
HYEOK JEONG 2
Southeast Asian countries such as Thailand, Cambodia, and Vietnam, and World Bank (2012)
focuses on Cambodia.
In fact, the skill shortage is a typical problem for most developing countries that go
through the structural transformation from agriculture to manufacturing and services. In this
sense, the recent attention to the ASEAN economies regarding the skill shortage and
mismatch is not new in its qualitative nature. Due to the faster inflows of the FDI toward this
region than to other regions, the ASEAN economies are facing these problems more severely
in terms of adjustment speed. The speed of introducing new technologies or industries by the
foreign investors used to be much faster than the speed of expanding the needed skills for
them because building the skills and the required human capital takes time. This “time-to-
build” issue is the fundamental cause of the skill shortage and skill mismatch problems for
any developing countries. Thus, the skill shortage and mismatch problems are typically an
adjustment problem for most developing countries. However, in Cambodia, skill shortage
and mismatch problems is much more than the labor market adjustment problem.
The genocide under the Khmer Rouge regime was not only one of the unparalleled ones
but also a targeted one, targeting the educated adults or the so-called intelligentsia, rather
than over the random population. This is not simply about reducing the labor force. This
created a vacuum in the middle-aged group in labor force and particularly the educated group.
As we will argue below, it severs the link of human capital transfer between generations.
Furthermore, the baby boom shock exacerbated the situation. Therefore, in case of Cambodia,
the skill shortage and mismatch problems can be a fundamental hurdle to the sustainable
development later as well as the labor market adjustment problem.
This paper analyzes the above issues of skill shortage and mismatch in the Cambodian
labor market and diagnose the current problems that contributes worsening the problems.
The paper is organized as follows. In Section 2, we explain the two demographic shocks that
are due to the Khmer Rouge regime, and discuss their implications on skill shortage and
human capital formation in Cambodia. In Section 3, we perform the labor demand forecast
analysis using the nationally representative household surveys in Cambodia. This analysis
will provide us with what kinds of skills Cambodia will need in near future. In Section 4, we
diagnose the current problems of skill mismatch in Cambodian education and vocational
training system. Section 5 provides concluding remarks.
2. DOUBLE DEMOGRAPHIC SHOCKS AND THEIR IMPLICATIONS ON SKILL
SHORTAG AND HUMAN CAPITAL FORMATION
2.1. Legacy of Khmer Rouge Regime on Cambodian Demographic Structure
One of the most striking features of Cambodian labor market is the stark dominance of
the youth group in the Cambodian labor force. According to the 2008 Population Census,
about 60% of the entire Cambodian population is younger than 25 years old. This skewed
age-group composition of population is due to the two demographic shocks of the baby
boom during the 1980s and the vanished middle-aged population in the latter half of 1970s.
Both demographic shocks in fact are related to the Khmer Rouge regime for the 1975-1979
periods. The massive genocide committed by the Khmer Rouge, often known as the Killing
Fields, killed about two million people, about a quarter of the total population at that
LEGACY OF KHMER ROUGE ON SKILL FORMATION IN CAMBODIA
3
time.1 The death toll itself is tremendous, but more important feature of this genocide is that
it was a targeted one. The targeted groups of this atrocity were sometimes the ethnic
minorities, but mostly the main targets were the educated adults, the so-called intelligentsia.
After the end of the Khmer Rouge regime and the related civil wars during the
Vietnamese occupation and transition periods, Cambodia experienced the typical post-war
baby boom. The annual increases of new births were about 401,000 in the 1980-1985 period
and 417,000 in the 1990-1995 period. Due to this baby boom period, the total population
increased from 6.5 million in 1980 to 14.1 million in 2010. Among them, the size of the
working age population (WAP), i.e., the age group of 15-year old or older, increased from 4
million in 1980 to 9.6 million in 2010. Furthermore, the size of the training age population
(TAP), i.e., the 6 to 24-year old age group, increased from 3 million in 1980 to 6.3 million in
2005, more than doubling.
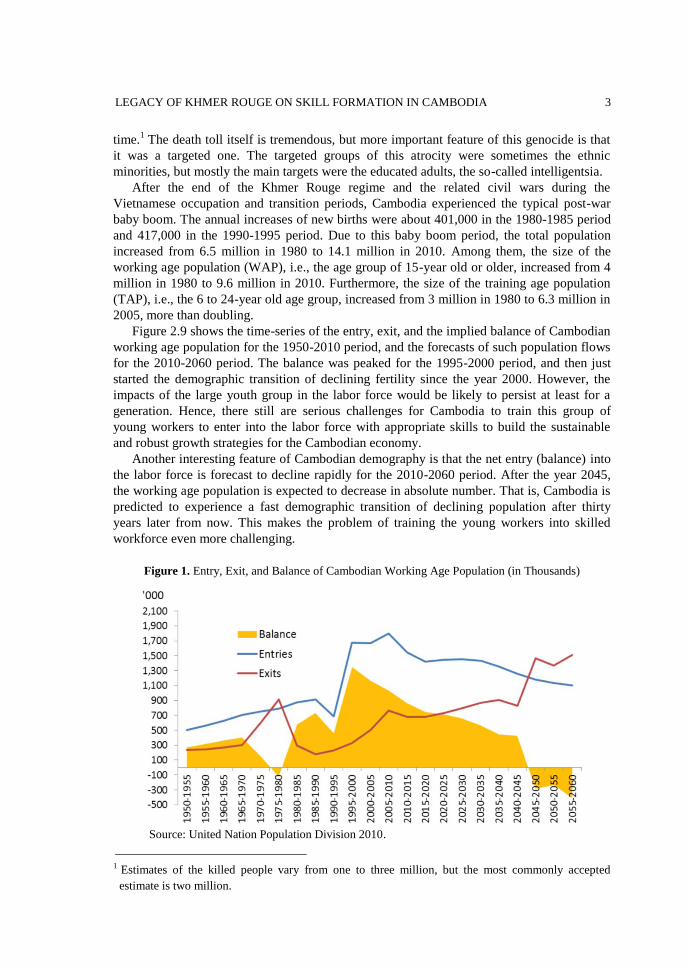
Figure 2.9 shows the time-series of the entry, exit, and the implied balance of Cambodian
working age population for the 1950-2010 period, and the forecasts of such population flows
for the 2010-2060 period. The balance was peaked for the 1995-2000 period, and then just
started the demographic transition of declining fertility since the year 2000. However, the
impacts of the large youth group in the labor force would be likely to persist at least for a
generation. Hence, there still are serious challenges for Cambodia to train this group of
young workers to enter into the labor force with appropriate skills to build the sustainable
and robust growth strategies for the Cambodian economy.
Another interesting feature of Cambodian demography is that the net entry (balance) into
the labor force is forecast to decline rapidly for the 2010-2060 period. After the year 2045,
the working age population is expected to decrease in absolute number. That is, Cambodia is
predicted to experience a fast demographic transition of declining population after thirty
years later from now. This makes the problem of training the young workers into skilled
workforce even more challenging.
Figure 1. Entry, Exit, and Balance of Cambodian Working Age Population (in Thousands)
Source: United Nation Population Division 2010.
1 Estimates of the killed people vary from one to three million, but the most commonly accepted
estimate is two million.
HYEOK JEONG 4
2.2. Implications of the Two Shocks on Skill Formation in Cambodia
The two demographic shocks discussed in the previous subsection have critical
implications on the skill formation for Cambodia. During the era of the Killing Fields, most
of the educated and skilled adults either were killed or escaped from Cambodia to the
neighboring countries. This yielded two unrecoverable outcomes in the Cambodian labor
market. First, it created a vacuum in the middle-aged group in the workforce. Second, it
reduced the group of the educated and professional workers and hence downgraded the level
of skill of the nation. In particular, the disappearance of teachers at all levels of schools
during this period has been the root cause of the lack of the qualified teachers in Cambodian
schools today. All these devastated outcomes resulted in massive destruction of human
capital during the era. This of course lowered the national level of human capital at that time.
However, the true problem is not about this transitory negative shock in human capital level
itself, but is rather about the severance of the link of the generational transfer of human
capital, which can have long-run effects on growth.
The missing middle-aged workers implies that there are little mentors for the young
workers at the workplaces who can teach their work experience and tacit knowledge
embodied in them which is an important component of human capital. In fact, Lucas (1993)
emphasized the importance of this kind of job-specific skills and on-the-job formation of
such skills in making miraculous growth in East Asia. From this perspective, Cambodia
seemed to miss an important channel of human capital accumulation, the effects of which
would persist over generations unless there would be active policy intervention to fix this
problem.
The disappearance of qualified teachers in all levels of schooling resulted in missing
another channel of human capital accumulation. In fact, this is a more fundamental channel
of human capital accumulation that has been lost since then in the following sense. Broadly
speaking, there are two kinds of human capital: (i) “general human capital” that can be
universally applied to any kinds of activities, (ii) “specific human capital” that are useful to
some particular set of activities. The first kind of human capital or skill is acquired at schools
with various degree of sophistication from elementary to college education. The second kind
of human capital or skill is acquired through the vocational training or learning by doing at
workplaces. Without being equipped with the first kind of human capital, the second set of
skills may contribute to production with low productivity. Hence, typical curriculum of
schooling system is designed so that general schooling precedes the vocational training and
education. For example, the technical and vocational education and training (TVET) system
starts after finishing some critical level of general education. The critical threshold is usually
middle school graduation. In Cambodia, this is also the case. The Cambodian TVET starts
after finishing the 9th grade, which corresponds to the graduation of middle school. Given
this curriculum design, if students do not or cannot finish formal schooling up to the 9the
grade, the vocational education and training system can have only weak effects. There are
some public institutions that provide some forms of vocational training for the uneducated
workforce, but the effective formation of useful skills through these public institutions is
limited. Thus, without solid establishment of the formal schooling and attainment, the
formation of the second set of skills is difficult to achieve.
In case of Cambodia, due to the lack of qualified teachers at schools from the genocide
during the Khmer Rouge regime, the speed of expansion of the educational attainment has
LEGACY OF KHMER ROUGE ON SKILL FORMATION IN CAMBODIA
5
been low since then, compared to the speed of industrialization. According to the Barro-Lee
(2013) dataset on educational attainment, the average years of schooling of the working-age
population is only 4.8 years, only 6.2% completed the secondary level schooling, and 1.5%
of them completed college or higher education in the year 2010. Another important aspect of
Cambodian education is that the drop-out rate is too high, particularly at the primary level
schooling. For example, in 2010, 59.6% of the working-age population was enrolled in the
primary level schools, but only 38% of the working-age population graduated from the
primary level schools. That is, about 40% of the elementary school enrollees dropped out
from the formal schooling system. Then, 12.5% of the working-age population enrolled in
the secondary level schools and 6.2% graduated. This is a serious problem because most of
the Cambodian youths are losing their opportunities to acquire the skills not only from
general schools but also from the vocational training system.
Furthermore, the baby boom followed by the Khmer Rouge regime and Vietnamese
occupation and transition periods, rapidly enlarged the youth group. This resulted in the
ballooning of the training-age population (TAP) as was explained in the previous subsection.
Thus, without having the qualified teachers at both schools and workplaces, this sudden
increase in youth group exacerbated the skill shortage problems. These consequences from
the two demographic shocks that is the legacy of the Khmer Rouge regime are the
fundamental and peculiar reasons behind the skill shortage of the current Cambodian labor
force.
From the above consideration, it is not surprising to find that the current employers in
Cambodia commonly complain that the “experience” and “work attitude” are the most
needed but hard-to-find character skills among their workers for all types of unskilled,
special, and professional workers.2 Specifically, The Cambodian Federation of Employers
and Business Associations (CAMFEBA) conducted a survey among the Cambodian
establishments, which provides a detailed study about the types of skills of shortage. Figures
2 to 4 list the ranking of various characteristics or attributes of skills that employers require
but are hard to find for each of the three types of workers, unskilled, specialized and
professional, respectively.
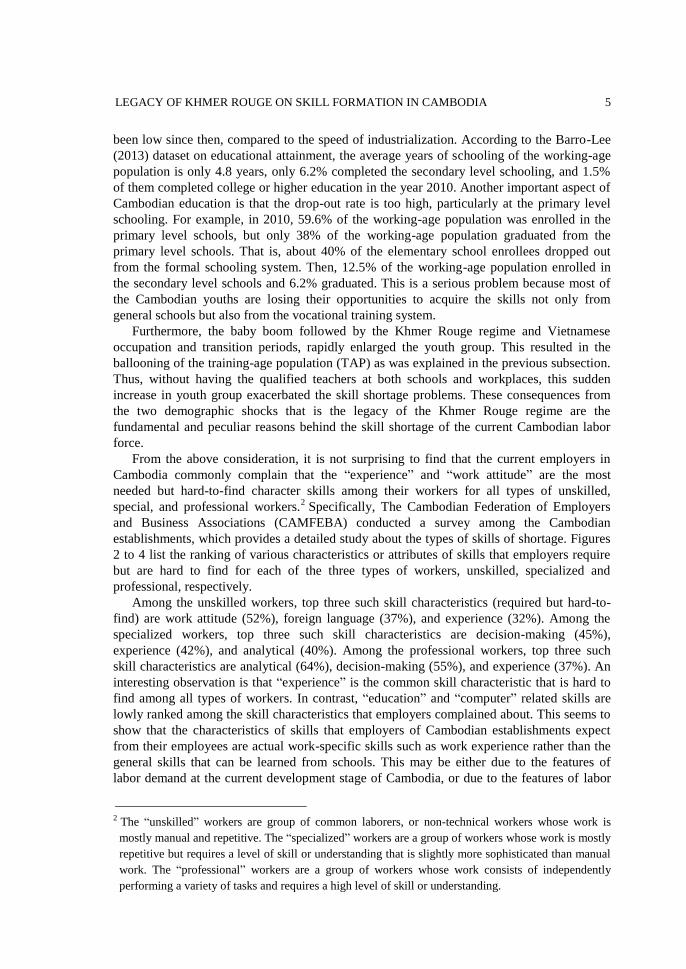
Among the unskilled workers, top three such skill characteristics (required but hard-to-
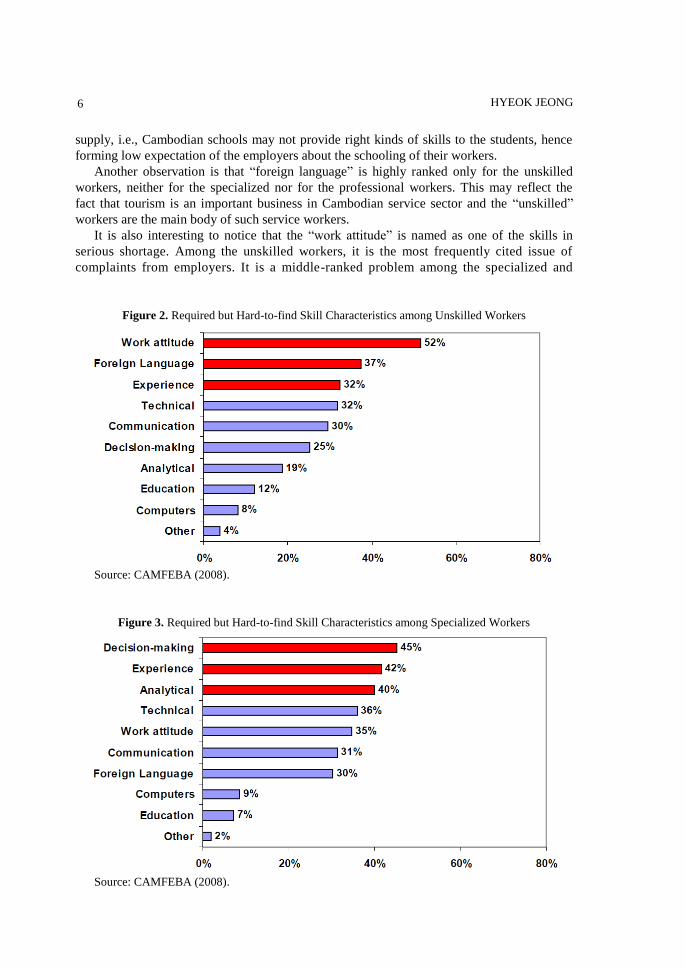
find) are work attitude (52%), foreign language (37%), and experience (32%). Among the
specialized workers, top three such skill characteristics are decision-making (45%),
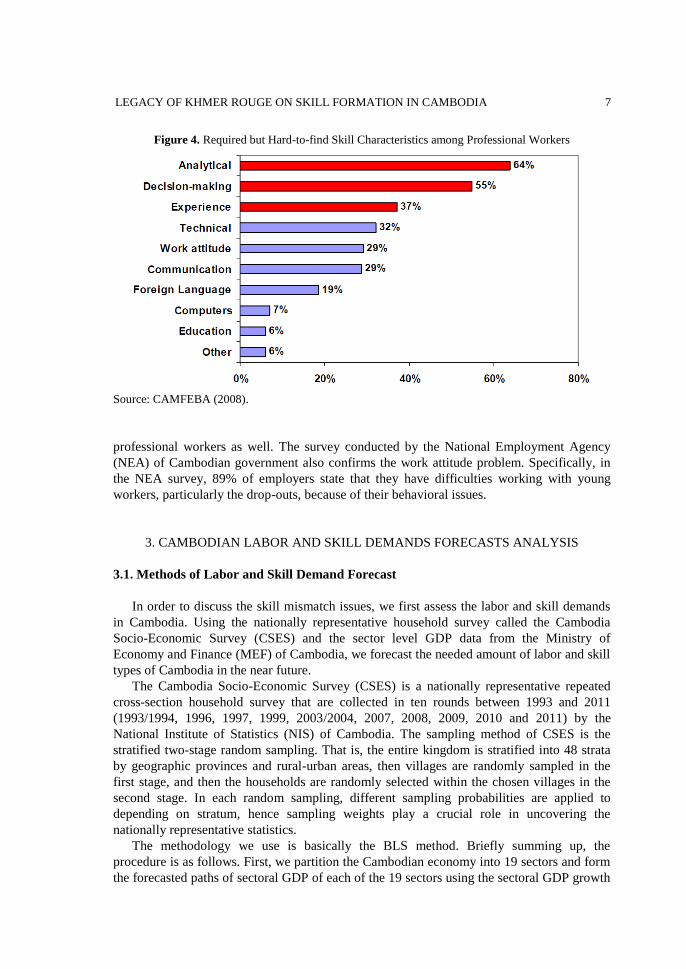
experience (42%), and analytical (40%). Among the professional workers, top three such
skill characteristics are analytical (64%), decision-making (55%), and experience (37%). An
interesting observation is that “experience” is the common skill characteristic that is hard to
find among all types of workers. In contrast, “education” and “computer” related skills are
lowly ranked among the skill characteristics that employers complained about. This seems to
show that the characteristics of skills that employers of Cambodian establishments expect
from their employees are actual work-specific skills such as work experience rather than the
general skills that can be learned from schools. This may be either due to the features of
labor demand at the current development stage of Cambodia, or due to the features of labor
2 The “unskilled” workers are group of common laborers, or non-technical workers whose work is
mostly manual and repetitive. The “specialized” workers are a group of workers whose work is mostly
repetitive but requires a level of skill or understanding that is slightly more sophisticated than manual
work. The “professional” workers are a group of workers whose work consists of independently
performing a variety of tasks and requires a high level of skill or understanding.
HYEOK JEONG 6
supply, i.e., Cambodian schools may not provide right kinds of skills to the students, hence
forming low expectation of the employers about the schooling of their workers.
Another observation is that “foreign language” is highly ranked only for the unskilled
workers, neither for the specialized nor for the professional workers. This may reflect the
fact that tourism is an important business in Cambodian service sector and the “unskilled”
workers are the main body of such service workers.
It is also interesting to notice that the “work attitude” is named as one of the skills in
serious shortage. Among the unskilled workers, it is the most frequently cited issue of
complaints from employers. It is a middle-ranked problem among the specialized and
Figure 2. Required but Hard-to-find Skill Characteristics among Unskilled Workers
Source: CAMFEBA (2008).
Figure 3. Required but Hard-to-find Skill Characteristics among Specialized Workers
Source: CAMFEBA (2008).
LEGACY OF KHMER ROUGE ON SKILL FORMATION IN CAMBODIA
7
Figure 4. Required but Hard-to-find Skill Characteristics among Professional Workers
Source: CAMFEBA (2008).
professional workers as well. The survey conducted by the National Employment Agency
(NEA) of Cambodian government also confirms the work attitude problem. Specifically, in
the NEA survey, 89% of employers state that they have difficulties working with young
workers, particularly the drop-outs, because of their behavioral issues.
3. CAMBODIAN LABOR AND SKILL DEMANDS FORECASTS ANALYSIS
3.1. Methods of Labor and Skill Demand Forecast
In order to discuss the skill mismatch issues, we first assess the labor and skill demands
in Cambodia. Using the nationally representative household survey called the Cambodia
Socio-Economic Survey (CSES) and the sector level GDP data from the Ministry of
Economy and Finance (MEF) of Cambodia, we forecast the needed amount of labor and skill
types of Cambodia in the near future.
The Cambodia Socio-Economic Survey (CSES) is a nationally representative repeated
cross-section household survey that are collected in ten rounds between 1993 and 2011
(1993/1994, 1996, 1997, 1999, 2003/2004, 2007, 2008, 2009, 2010 and 2011) by the
National Institute of Statistics (NIS) of Cambodia. The sampling method of CSES is the
stratified two-stage random sampling. That is, the entire kingdom is stratified into 48 strata
by geographic provinces and rural-urban areas, then villages are randomly sampled in the
first stage, and then the households are randomly selected within the chosen villages in the
second stage. In each random sampling, different sampling probabilities are applied to
depending on stratum, hence sampling weights play a crucial role in uncovering the
nationally representative statistics.
The methodology we use is basically the BLS method. Briefly summing up, the
procedure is as follows. First, we partition the Cambodian economy into 19 sectors and form
the forecasted paths of sectoral GDP of each of the 19 sectors using the sectoral GDP growth
HYEOK JEONG 8
rate data. Second, using the CSES data, we construct the employment coefficients data series
for each sector and forecast the within-sector employment coefficients. This will consist of
the labor demand forecasts by sector. Third, combining the forecasts of within-sector GDP
and within-sector employment coefficients, we construct the forecasts of the within-sector
employment. Fourth, again using the CSES data, we estimate the job-sector matrix, where
the jobs are classified into ten categories according to the skill types. Using this estimated
job-sector matrix, the employment demand forecasts that are obtained as above are converted
into the skill demands forecasts. Detailed estimation methods and econometric models are
described in Appendix.
The actual contents of the forecasts depend on how we partition the sectors and the jobs.
The sectors are categorized into the 19 sectors such that: (i) four agricultural sectors (crops,
livestock and poultry, fisheries, and forestry/logging); (ii) eight industrial sectors (mining,
food/beverages/tobacco, textile/garment/footwear, wood/paper/publishing/furniture, rubber/
plastic/chemical, other manufacturing, electricity/gas/water, construction), and (iii) seven
service sectors (trade, hotels/restaurants, transport/communication, finance, public
administration, real estate/business, other services). We will re-label some multi-subcategory
sectors for short for the purpose of convenience of displaying the results such that: “livestock”
for livestock and poultry, “forestry” for forestry and logging, “food processing” for food/
beverages/tobacco, “garment” for textile/garment/footwear, “wood” for wood/ paper/publishing/
furniture, “rubber” for rubber/plastic/chemical, “utilities” for electricity/ gas/water, “tourism”
for hotels/restaurants, “transport” for transport/communication, “real estate” for real estate/
business.
Regarding the job or skill groups, we divide the workforce into ten categories: managers
(legislators, senior officials and business managers), professionals, technicians, clerk, service
workers, farmers (skilled agricultural workers), craftsmen (and related trade workers),
mechanics (plant and machine operators and assemblers), unskilled (elementary occupations),
and armed forces.
3.2. Trends of Structural Transformation
Using the econometric methods that are described in Appendix, we forecast the
employment changes of the 19 sectors for the 2012-2015 periods. In terms of the
employment size, the demand for labor will increase in each sector as well for the overall
economy. However, there are relative differences in the speed of expansion. The annual
average growth rates of employment were 1.7%, 5%, and 10.7% for the agriculture, service,
and industry sectors, respectively. That is, industry sectors have been expanding the fastest.
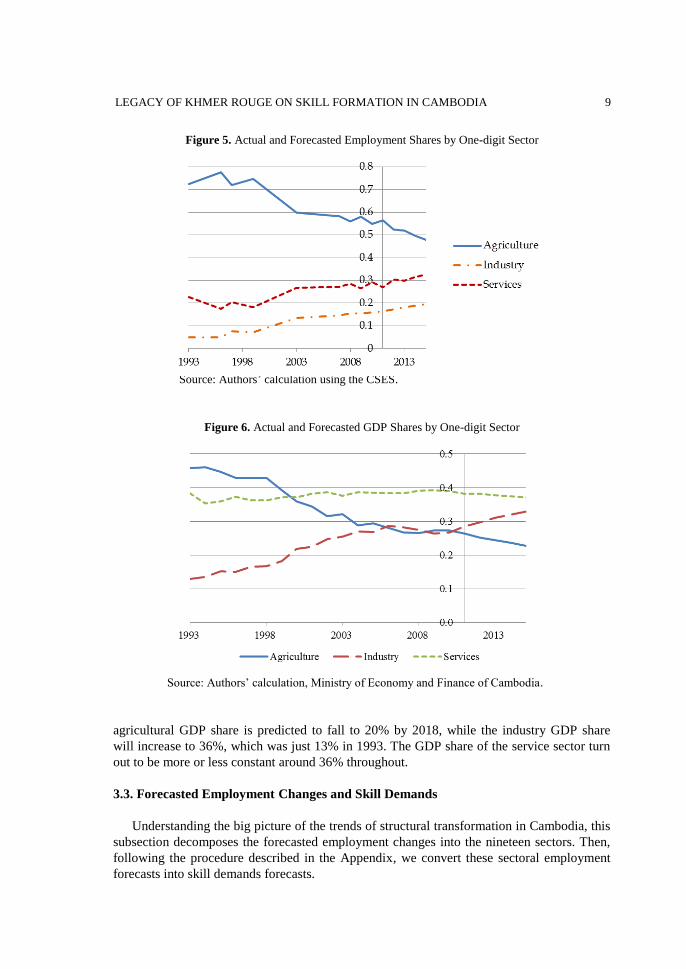
We find that these trends will continue in near future in Cambodia. Figure 5 shows the actual
and the forecasted employment share data of these broad-category sectors. We find that the
employment share of agricultural sectors will continue to decrease and those of industry and
service sectors will continue to increase. The agricultural employment share declined from
72% in 1993 to 56% in 2011, which will continue to fall to 48% by the year 2015. The
industry employment share was 5% in 1993, which is forecasted to rise to 20% by 2015. The
service sector employment share was 22% in 1993, which is forecasted to rise to 32% by
2015. Thus, it is predicted that Cambodian economy will continue its structural
transformation from agriculture to industry and service sectors. Due to the presence of the
relative income gap across the three broad sectors, the structural transformation in terms of
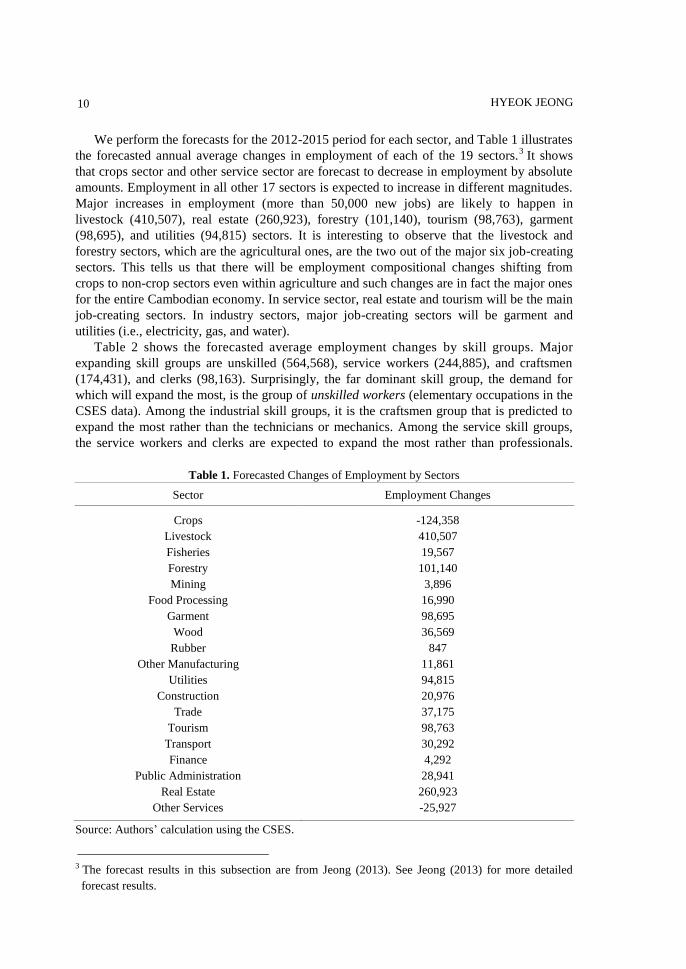
GDP share is reinforced compared to the employment shares, as shown in Figure 6. The
LEGACY OF KHMER ROUGE ON SKILL FORMATION IN CAMBODIA
9
Figure 5. Actual and Forecasted Employment Shares by One-digit Sector
Source: Authors’ calculation using the CSES.
Figure 6. Actual and Forecasted GDP Shares by One-digit Sector
Source: Authors’ calculation, Ministry of Economy and Finance of Cambodia.
agricultural GDP share is predicted to fall to 20% by 2018, while the industry GDP share
will increase to 36%, which was just 13% in 1993. The GDP share of the service sector turn
out to be more or less constant around 36% throughout.
3.3. Forecasted Employment Changes and Skill Demands
Understanding the big picture of the trends of structural transformation in Cambodia, this
subsection decomposes the forecasted employment changes into the nineteen sectors. Then,
following the procedure described in the Appendix, we convert these sectoral employment
forecasts into skill demands forecasts.
HYEOK JEONG 10
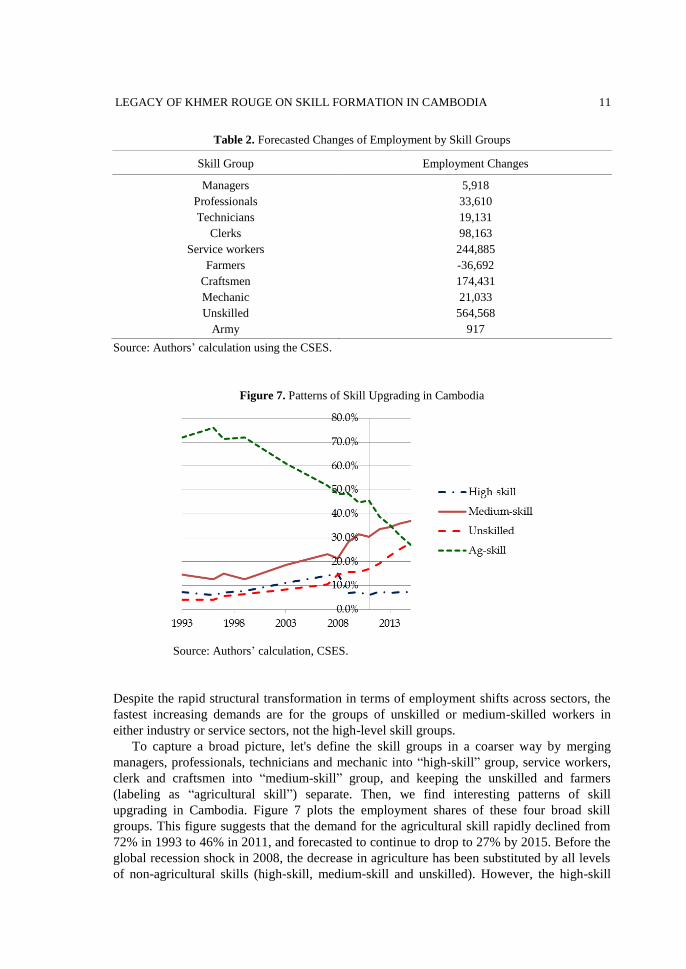
We perform the forecasts for the 2012-2015 period for each sector, and Table 1 illustrates
the forecasted annual average changes in employment of each of the 19 sectors.3 It shows
that crops sector and other service sector are forecast to decrease in employment by absolute
amounts. Employment in all other 17 sectors is expected to increase in different magnitudes.
Major increases in employment (more than 50,000 new jobs) are likely to happen in
livestock (410,507), real estate (260,923), forestry (101,140), tourism (98,763), garment
(98,695), and utilities (94,815) sectors. It is interesting to observe that the livestock and
forestry sectors, which are the agricultural ones, are the two out of the major six job-creating
sectors. This tells us that there will be employment compositional changes shifting from
crops to non-crop sectors even within agriculture and such changes are in fact the major ones
for the entire Cambodian economy. In service sector, real estate and tourism will be the main
job-creating sectors. In industry sectors, major job-creating sectors will be garment and
utilities (i.e., electricity, gas, and water).
Table 2 shows the forecasted average employment changes by skill groups. Major
expanding skill groups are unskilled (564,568), service workers (244,885), and craftsmen
(174,431), and clerks (98,163). Surprisingly, the far dominant skill group, the demand for
which will expand the most, is the group of unskilled workers (elementary occupations in the
CSES data). Among the industrial skill groups, it is the craftsmen group that is predicted to
expand the most rather than the technicians or mechanics. Among the service skill groups,
the service workers and clerks are expected to expand the most rather than professionals.
Table 1. Forecasted Changes of Employment by Sectors
Sector Employment Changes
Crops
Livestock
Fisheries
Forestry
Mining
Food Processing
Garment
Wood
Rubber
Other Manufacturing
Utilities
Construction
Trade
Tourism
Transport
Finance
Public Administration
Real Estate
Other Services
-124,358
410,507
19,567
101,140
3,896
16,990
98,695
36,569
847
11,861
94,815
20,976
37,175
98,763
30,292
4,292
28,941
260,923
-25,927
Source: Authors’ calculation using the CSES.
3 The forecast results in this subsection are from Jeong (2013). See Jeong (2013) for more detailed
forecast results.
LEGACY OF KHMER ROUGE ON SKILL FORMATION IN CAMBODIA
11
Table 2. Forecasted Changes of Employment by Skill Groups
Skill Group Employment Changes
Managers
Professionals
Technicians
Clerks
Service workers
Farmers
Craftsmen
Mechanic
Unskilled
Army
5,918
33,610
19,131
98,163
244,885
-36,692
174,431
21,033
564,568
917
Source: Authors’ calculation using the CSES.
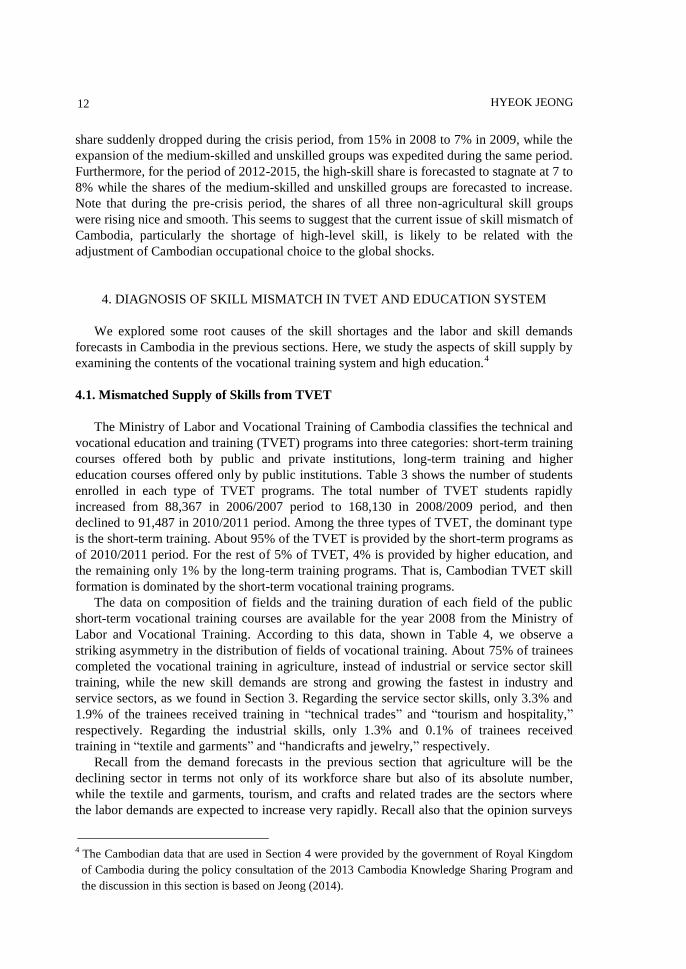
Figure 7. Patterns of Skill Upgrading in Cambodia
Source: Authors’ calculation, CSES.
Despite the rapid structural transformation in terms of employment shifts across sectors, the
fastest increasing demands are for the groups of unskilled or medium-skilled workers in
either industry or service sectors, not the high-level skill groups.
To capture a broad picture, let's define the skill groups in a coarser way by merging
managers, professionals, technicians and mechanic into “high-skill” group, service workers,
clerk and craftsmen into “medium-skill” group, and keeping the unskilled and farmers
(labeling as “agricultural skill”) separate. Then, we find interesting patterns of skill
upgrading in Cambodia. Figure 7 plots the employment shares of these four broad skill
groups. This figure suggests that the demand for the agricultural skill rapidly declined from
72% in 1993 to 46% in 2011, and forecasted to continue to drop to 27% by 2015. Before the
global recession shock in 2008, the decrease in agriculture has been substituted by all levels
of non-agricultural skills (high-skill, medium-skill and unskilled). However, the high-skill
HYEOK JEONG 12
share suddenly dropped during the crisis period, from 15% in 2008 to 7% in 2009, while the
expansion of the medium-skilled and unskilled groups was expedited during the same period.
Furthermore, for the period of 2012-2015, the high-skill share is forecasted to stagnate at 7 to
8% while the shares of the medium-skilled and unskilled groups are forecasted to increase.
Note that during the pre-crisis period, the shares of all three non-agricultural skill groups
were rising nice and smooth. This seems to suggest that the current issue of skill mismatch of
Cambodia, particularly the shortage of high-level skill, is likely to be related with the
adjustment of Cambodian occupational choice to the global shocks.
4. DIAGNOSIS OF SKILL MISMATCH IN TVET AND EDUCATION SYSTEM
We explored some root causes of the skill shortages and the labor and skill demands
forecasts in Cambodia in the previous sections. Here, we study the aspects of skill supply by
examining the contents of the vocational training system and high education.4
4.1. Mismatched Supply of Skills from TVET
The Ministry of Labor and Vocational Training of Cambodia classifies the technical and
vocational education and training (TVET) programs into three categories: short-term training
courses offered both by public and private institutions, long-term training and higher
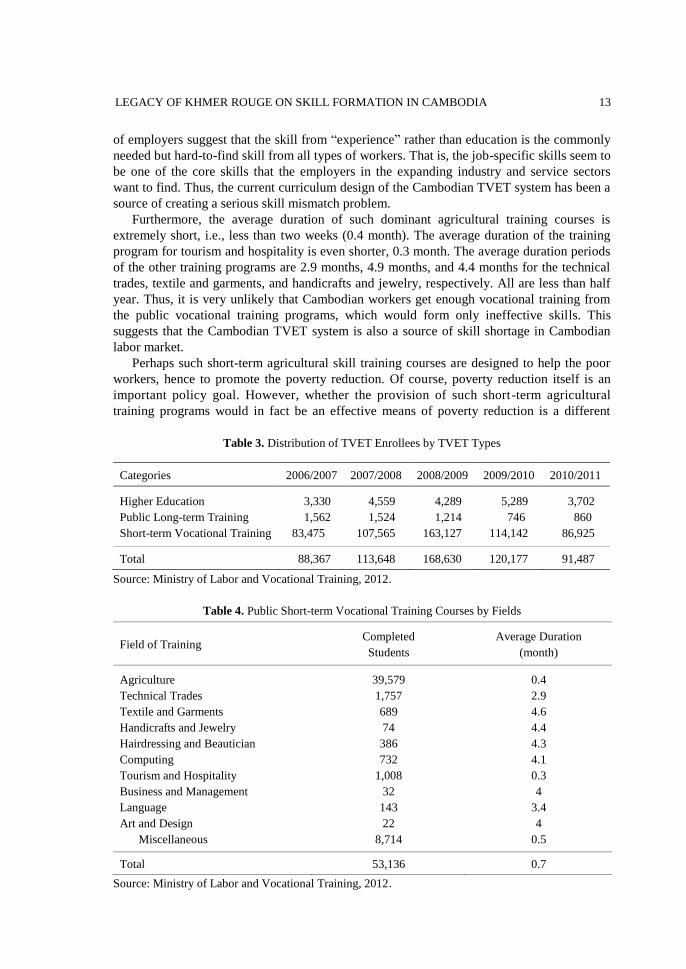
education courses offered only by public institutions. Table 3 shows the number of students
enrolled in each type of TVET programs. The total number of TVET students rapidly
increased from 88,367 in 2006/2007 period to 168,130 in 2008/2009 period, and then
declined to 91,487 in 2010/2011 period. Among the three types of TVET, the dominant type
is the short-term training. About 95% of the TVET is provided by the short-term programs as
of 2010/2011 period. For the rest of 5% of TVET, 4% is provided by higher education, and
the remaining only 1% by the long-term training programs. That is, Cambodian TVET skill
formation is dominated by the short-term vocational training programs.
The data on composition of fields and the training duration of each field of the public
short-term vocational training courses are available for the year 2008 from the Ministry of
Labor and Vocational Training. According to this data, shown in Table 4, we observe a
striking asymmetry in the distribution of fields of vocational training. About 75% of trainees
completed the vocational training in agriculture, instead of industrial or service sector skill
training, while the new skill demands are strong and growing the fastest in industry and
service sectors, as we found in Section 3. Regarding the service sector skills, only 3.3% and
1.9% of the trainees received training in “technical trades” and “tourism and hospitality,”
respectively. Regarding the industrial skills, only 1.3% and 0.1% of trainees received
training in “textile and garments” and “handicrafts and jewelry,” respectively.
Recall from the demand forecasts in the previous section that agriculture will be the
declining sector in terms not only of its workforce share but also of its absolute number,
while the textile and garments, tourism, and crafts and related trades are the sectors where
the labor demands are expected to increase very rapidly. Recall also that the opinion surveys
4 The Cambodian data that are used in Section 4 were provided by the government of Royal Kingdom
of Cambodia during the policy consultation of the 2013 Cambodia Knowledge Sharing Program and
the discussion in this section is based on Jeong (2014).
LEGACY OF KHMER ROUGE ON SKILL FORMATION IN CAMBODIA
13
of employers suggest that the skill from “experience” rather than education is the commonly
needed but hard-to-find skill from all types of workers. That is, the job-specific skills seem to
be one of the core skills that the employers in the expanding industry and service sectors
want to find. Thus, the current curriculum design of the Cambodian TVET system has been a
source of creating a serious skill mismatch problem.
Furthermore, the average duration of such dominant agricultural training courses is
extremely short, i.e., less than two weeks (0.4 month). The average duration of the training
program for tourism and hospitality is even shorter, 0.3 month. The average duration periods
of the other training programs are 2.9 months, 4.9 months, and 4.4 months for the technical
trades, textile and garments, and handicrafts and jewelry, respectively. All are less than half
year. Thus, it is very unlikely that Cambodian workers get enough vocational training from
the public vocational training programs, which would form only ineffective skills. This
suggests that the Cambodian TVET system is also a source of skill shortage in Cambodian
labor market.
Perhaps such short-term agricultural skill training courses are designed to help the poor
workers, hence to promote the poverty reduction. Of course, poverty reduction itself is an
important policy goal. However, whether the provision of such short-term agricultural
training programs would in fact be an effective means of poverty reduction is a different
Table 3. Distribution of TVET Enrollees by TVET Types
Source: Ministry of Labor and Vocational Training, 2012.
Table 4. Public Short-term Vocational Training Courses by Fields
Field of Training Completed
Students
Average Duration
(month)
Agriculture
Technical Trades
Textile and Garments
Handicrafts and Jewelry
Hairdressing and Beautician
Computing
Tourism and Hospitality
Business and Management
Language
Art and Design
Miscellaneous
39,579
1,757
689
74
386
732
1,008
32
143
22
8,714
0.4
2.9
4.6
4.4
4.3
4.1
0.3
4
3.4
4
0.5
Total 53,136 0.7
Source: Ministry of Labor and Vocational Training, 2012.
Categories 2006/2007 2007/2008 2008/2009 2009/2010 2010/2011
Higher Education
Public Long-term Training
Short-term Vocational Training
3,330
1,562
83,475
4,559
1,524
107,565
4,289
1,214
163,127
5,289
746
114,142
3,702
860
86,925
Total 88,367 113,648 168,630 120,177 91,487
HYEOK JEONG 14
issue. The trainees of such vocational training courses are likely to learn a kind of skills that
are not only irrelevant but also ineffective, if any. Then, such vocational training programs
will not help the individual workers to escape from poverty. Furthermore, they will slow
down the speed of industrialization of Cambodian economy hence the overall economic
growth, which can be an eventual channel of poverty reduction. Thus, making substantial
changes in the TVET curriculum and extending the TVET duration long enough are likely to
solve a major part of the skill shortage and mismatch problems of Cambodia.
4.2. Mismatched Supply of Skills from General Education
According to the CSES 2011, 60.2% of the population of 25 or older have no schooling
or have not completed primary education, and only 7.7% among them achieved the upper
secondary or higher level of education. Barro-Lee data (2013) suggests that the average years
of schooling in Cambodia is 4.8 in the year 2010. The gender gap for the educational
attainment seems substantial. The population share of no schooling or incomplete primary
schooling is 70.8% for women, while it is 47.8% for men. The population share of receiving
the diploma of upper secondary or higher level of schooling is 4.1%, while it is 11.7% for
men.
One of the main reasons of this low attainment of education is that the exit from the
general education system (either graduation or drop-out) happens too early among the
training-age population. According to the Ministry of Education, Youth, and Sport of
Cambodian government, the 84.2% of the exit happened at the primary or lower level of
education in 2006. This exit rate decreased to 73.7% in 2010, but it still is a very large
number. Despite the recent substantial increase in enrollment at the primary level of
education, this high rate of exit between the primary and lower secondary levels of education
is a serious problem for the skill formation in Cambodian workforce.
Among the above exits, significant portions are drop-outs. According to the Barro-Lee
(2013) data, the enrollment rate at the primary school among the working age population is
59.6%, but only 38.05% completed the primary school. That is, 21.6% of the WAP are
primary school drop-outs. Less than half of the primary school graduates (12.5% of the WAP)
enroll the secondary level schooling. Then, about half of the secondary enrollees (6.2% of
the WAP) again drop out from the secondary level schools. Among the secondary graduates,
only half (3.01% of the WAP) of them enter into colleges, and then the half of the college
students (1.49%) again drop out. As is described above, the drop-out is truly a serious
problem in Cambodia. The drop-out students become the unskilled youth in the Cambodian
labor market, about whom the 89% of the employers complain their work attitude, according
to the Skill Gap survey by the National Employment Agency (NEA) of the Cambodian
government.
The population share of university or graduate education among working age population
is still low by absolute standard, only 2.5% in the year 2011 according to the Cambodian
Socio-economic Survey (CSES). However, it has been expanding rapidly. The number of
post-secondary students increased from 94,708 in 2005/2006 period to 245,329 in 2011/2012
period, growing 17% each year on average. The expansion was faster among female than
among male. The annual average growth rate of post-secondary education was 21% for
female students while it was 15% for male students.
Among the post-secondary education groups, Bachelor degree group is the majority and
its share has been increasing from 80.2% in 2005/2006 period to 84.7% in 2011/2012 period.
LEGACY OF KHMER ROUGE ON SKILL FORMATION IN CAMBODIA
15
Table 4. Public Short-term Vocational Training Courses by Fields
Source: Ministry of Education, Youth and Sport, 2011.
The share of Master degree group has also been increasing from 2.7% in 2005/2006 period to
5.5% in 2011/2012 period. In contrast, the share of the Associate degree group, which
corresponds to a two-year junior college education, has been decreasing from 16.8% in
2005/2006 period to 9.4% in 2011/2012 period. The share of Ph.D. degree group was
fluctuating around 0.4% without showing any trends. Thus, the post-secondary education is
governed by Bachelor degree group, and its increasing trend (with the decreasing trend for
the Associate degree group) seems promising for the promotion of higher education in
Cambodia.
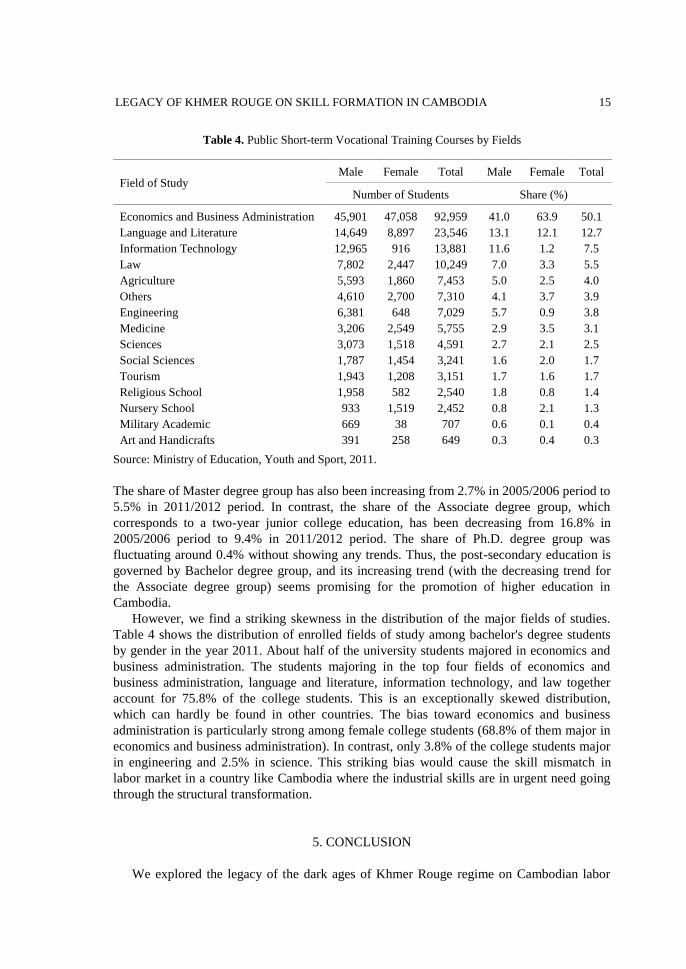
However, we find a striking skewness in the distribution of the major fields of studies.
Table 4 shows the distribution of enrolled fields of study among bachelor's degree students
by gender in the year 2011. About half of the university students majored in economics and
business administration. The students majoring in the top four fields of economics and
business administration, language and literature, information technology, and law together
account for 75.8% of the college students. This is an exceptionally skewed distribution,
which can hardly be found in other countries. The bias toward economics and business
administration is particularly strong among female college students (68.8% of them major in
economics and business administration). In contrast, only 3.8% of the college students major
in engineering and 2.5% in science. This striking bias would cause the skill mismatch in
labor market in a country like Cambodia where the industrial skills are in urgent need going
through the structural transformation.
5. CONCLUSION
We explored the legacy of the dark ages of Khmer Rouge regime on Cambodian labor
Field of Study Male Female Total Male Female Total
Number of Students Share (%)
Economics and Business Administration
Language and Literature
Information Technology
Law
Agriculture
Others
Engineering
Medicine
Sciences
Social Sciences
Tourism
Religious School
Nursery School
Military Academic
Art and Handicrafts
45,901
14,649
12,965
7,802
5,593
4,610
6,381
3,206
3,073
1,787
1,943
1,958
933
669
391
47,058
8,897
916
2,447
1,860
2,700
648
2,549
1,518
1,454
1,208
582
1,519
38
258
92,959
23,546
13,881
10,249
7,453
7,310
7,029
5,755
4,591
3,241
3,151
2,540
2,452
707
649
41.0
13.1
11.6
7.0
5.0
4.1
5.7
2.9
2.7
1.6
1.7
1.8
0.8
0.6
0.3
63.9
12.1
1.2
3.3
2.5
3.7
0.9
3.5
2.1
2.0
1.6
0.8
2.1
0.1
0.4
50.1
12.7
7.5
5.5
4.0
3.9
3.8
3.1
2.5
1.7
1.7
1.4
1.3
0.4
0.3
HYEOK JEONG 16
market and its long-term effects on skill formation for the current Cambodians and for the
generations to come. The mass and targeted massacre twisted the demographic structure of
Cambodia, making a deep hole in the middle-aged and educated workforce, hence the lack of
qualified teachers at schools and experienced mentor workers at workplaces. We discussed
how these demographic shocks affect the intergenerational link of human capital transfer and
create the root causes of skill shortages not only for the current but also for the future
generations. This kind of severance of intergenerational link can have huge effects on long-
run growth.
Unfortunately, current Cambodian TVET and general education system do not seem to be
aligned to fix the unbalanced needs for the industrial and service skills in its process of
industrialization. They in fact exacerbate the skill mismatch because of the biased
distribution of fields in their curriculum design. Majority of the short-term vocational
training programs are about providing agricultural skills in extremely short span of training.
About half of the college fields of study is concentrated in economics and business
administration.
Without successful transformation of the incoming young workers into a useful
workforce, Cambodia may face a problem of shortage of workforce itself, including both
skilled and unskilled, which can be another serious hurdle to Cambodian development
considering the recent emigration of low-skilled Cambodian workers to neighboring
countries seeking the higher wages. This can be achieved by bolstering the general education
system itself, for example by promoting the investment in educating teachers so that
Cambodian schools can provide the appropriate and quality education to their students,
particularly at the elementary and middle schools. This would increase the return to basic
schooling, which will reduce the drop-out problem and mitigate the emigration problem.
Therefore, establishing a solid system of human capital formation, encompassing both
general education system and TVET system is an urgent issue particularly for Cambodia.
Without fixing these problems quickly and in large scale, the recent FDI-driven rapid growth
in Cambodia would soon lose its momentum.
Article Received: 04-21-2014 Revised: 05-27-2014 Accepted: 06-04-2014
APPENDIX: LABOR MARKET FORECASTING METHODS
For the methodology of forecasting the labor and skill demands, we use the BLS methods
adopted in the U.S. Here we provide a brief introduction of the methods. See Jeong (2013)
for discussion that is more detailed.
The first step of the forecast is to form the forecasts of the growth rates by sector. For the
within-sector growth forecasts, the typical procedures are as follows.
Stage 1. Considering the importance of the changes in long-run supply capacity, first
form estimates for the equilibrium growth paths and potential growth rates at the aggregate
level, based on the forecasted changes in fundamental production factors and productivity.
Stage 2. Using the above aggregate estimates of forecasted paths, assign the aggregate
growth into sectors based on the time trend models at sector level and reflecting the
differences in relative speed of growth. This form the first basis forecasts of long-run
structure and growth of sectors.
Stage 3. Then, industry export groups combine the forecasts of the foreign and domestic
LEGACY OF KHMER ROUGE ON SKILL FORMATION IN CAMBODIA
17
mega trends and the data regarding the industrial and economic environmental changes of the
world economy to revise the first forecasts, and then reflecting the industrial goals and policy
visions, finalize the forecasts.
From these sectoral growth forecasts, future GDP paths of each sector are projected.
The second step of the labor demand forecast is to construct the employment coefficient
of each sector i in period t, which is defined as:
(1)
where denotes the total employment and the total GDP of sector i at period t. The
employment coefficient in logarithm at time t is estimated such that:
(2) ,
where t denotes the time trend itself and the information set available up to time t. The
contents of the information set as well as the specification of the estimation model
depend on the available data and also on the specific feature of each sector.
Combining the forecasted GDP and the employment coefficient from the equation (2), the
employment of sector i at date t+s is forecasted such that:
(3) .
The third step of the forecast is to estimate the sector-job matrix, which consists of the
joint distribution of sector and job at time t, where the job categories are related to the skill
types. Then, the odds ratio of the population fraction of the job j of sector i at time t in
logarithm is estimated such that:
(4) [
] ( ),
where t denotes the time trend itself and the information set available up to time t in
predicting the log odds ratio of the job j of sector i at time t. The contents of the information set
and the specification of the functional form may differ across the sector-job cells,
depending on data availability. From this estimation, the estimates of the sector-job matrix at
time t { }
is constructed, where I indicates the total number of sectors and J denotes the
total number of job categories.
From the above estimates, we can obtain the forecasts of [ ]
and the population
fraction [ ]
for a given job skill j, then the aggregate forecast of the employment of job
skill, i.e., the forecasted demand for job skill j for the period of t+s is calculated such that:
(5) ∑
Using the employment coefficient series of the 19 sectors that are calculated by combining
the sector level GDP from the MEF and the sector level employment from the CSES, we
perform the time-series estimation for the employment coefficient sector by sector, specifying
HYEOK JEONG 18
the time-series model in equation (2) in two ways such that:
(6) ,
(7) ,
where and denote the error terms of each model. We estimate two models instead of
single model and then use the average of the forecasts to raise the precision of the forecast. The
Model 1 is a simple quadratic time trend time-series model and the Model 2 is an
autoregressive model of order 1, i.e., AR(1) model, controlling for the linear time trend.
To translate the employment forecasts above into skill demand forecasts, we first divide the
workforce into ten skill groups: managers (legislators, senior officials and business managers),
professionals, technicians, clerk, service workers, farmers (skilled agricultural workers),
craftsmen (and related trade workers), mechanics (plant and machine operators and assemblers),
unskilled (elementary occupations), and armed forces.
In the second step of estimating the within-sector conditional distribution of skills, we
estimate the following two models for the log odds ratio and take the average population shares
of the two models (as we did for the employment coefficient forecasting):
(8) ( ) ,
(9) ( ) ,
where
is the conditional odds ratio of skill j within sector i, and denote the
error terms of each model for sector i. (We omit presenting the massive set of these estimation
results.) Then, the population share of the cell sector i and skill j is estimated by:
(10)
where is the implied estimate for the conditional population share of skill j within sector i
and is the estimate of the population share of sector i, obtained from the estimated
employment series.
Combining the estimates of the sector employment series { } and the population share
series { }, we can construct the demand for skill group j in period t, , as in equation (5):
∑
REFERENCES
Barro, Robert, and Jongwha Lee. 2013. Barro-Lee Educational Attainment Dataset.
http://www.barrolee.com/.
Cambodia Socio-Economic Survey(CSES) for various years (1993/1994, 1996, 1997, 1999,
2003/2004, 2007, 2008, 2009, 2010, 2011).
Cambodian TVET data for various years (2011 from Cambodian Ministry of Education,
Youth and Sport, 2012 from Cambodia Ministry of Labor and Vocational Training).
LEGACY OF KHMER ROUGE ON SKILL FORMATION IN CAMBODIA
19
CAMFEBA. 2008. Youth and Employment: Bridging the Gap. Project Paper for CAMFEBA.
Chalamwong, Yongyuth, Khanittha Hongprayoon, Wanwisa Suebnusorn, Nguyen Anh
Doung, Sophal Chan, and Heng Dyna. 2012. Skills for Employability: Southeast
Asia. Thailand Development Research Institute (TDRI).
Giumbert, Stephane. 2010. “Cambodia 1998-2008: An Episode of Rapid Growth.” World
Bank Policy Research Working Paper #5271.
Jeong, Hyeok. 2013. “Skill Need Assessment of Cambodia Labor Market.” In Policy Agenda
for Cambodia in Developing Industrial Skills, Industrial Complex, and Agro-
processing Industry, 2012 Cambodia Knowledge Sharing Program, Korea
Development Institute.
Jeong, Hyeok. 2014. “Cambodian Skill Shortage and Skill Mismatch Analysis with Policy
Recommendation.” 2013 Cambodia Knowledge Sharing Program, Korea
Development Institute.
Lucas, Robert E. Jr. 1993. “Making a Miracle.” Econometrica 61(2): 251-272.
Martinez-Fernandez, Cristina and Marcus Powell. 2009. Employment and Skills Strategies in
Southeast Asia Setting the Scene. OECD ESSA Report.
United Nations Population Division. 2010. Online data http://www.un.org/en/development/
desa/population/.
World Bank. 2012. “Matching Aspirations: Skills for Implementing Cambodia’s Growth
Strategy,” World Bank Policy Report 67349.
Hyeok Jeong, KDI School of Public Policy and Management, 85 Hoegiro, Dongdaemun-gu, Seoul,
130-868, Korea, Tel: +82-2-3299-1119, E-mail: [email protected]